Article

Positron Emission Tomography Can Support the Diagnosis of Dialysis-Related Amyloidosis

1
Néphrologie, Centre Hospitalier du Mans, 72037 Le Mans, France
2
Affidea IRMET, PET CENTER, Torino via Onorato Vigliani 89, 10135 Torino, Italy
3
Medecine Nucleaire, Centre Hospitalier du Mans, 72037 Le Mans, France
4
Radiology, Centre Hospitalier du Mans, 72037 Le Mans, France
5
MINT Université d’Angers, 49100 Angers, France
6
Dipartimento di Scienze Cliniche e Biologiche, Università di Torino, 10100 Torino, Italy
*
Author to whom correspondence should be addressed.
Submission received: 23 June 2019 / Revised: 31 August 2019 / Accepted: 10 September 2019 / Published: 19 September 2019
(This article belongs to the Section Nephrology & Urology)

Abstract

:
Background: The improvements in dialysis have not eliminated long-term problems, including dialysis-related amyloidosis (DRA), caused by Beta-2 microglobulin deposition. Several types of scintigraphy have been tested to detect DRA, none entered the clinical practice. Aim of the study was to assess the potential of PET-FDG scan in the diagnosis of DRA. Methods: Forty-six dialysis patients with at least one PET scan (72 scans) were selected out 162 patients treated in 2016–2018. Subjective global assessment (SGA), malnutrition inflammation score (A), Charlson Comorbidity Index (CCI), were assessed at time of scan; 218 age-matched cases with normal kidney function were selected as controls. PET scans were read in duplicate. Carpal tunnel syndrome was considered a proxy for DRA. A composite “amyloid score” score considered each dialysis year = 1 point; carpal tunnel-DRA = 5 points per site. Logistic regression, ROC curves and a prediction model were built. Results: The prevalence of positive PET was 43.5% in dialysis, 5% in controls (p < 0.0001). PET was positive in 14/15 (93.3%) scans in patients with carpal tunnel. PET sensitivity for detecting DRA was 95% (specificity 64%). Carpal tunnel was related to dialysis vintage and MIS. A positive PET scan was significantly associated with dialysis vintage, MIS and amyloid score. A prediction model to explain PET positivity combined clinical score and MIS, allowing for an AUC of 0.906 (CI: 0.813–0.962; p < 0.001). Conclusions: PET-FDG may identify DRA, and may be useful in detecting cases in which inflammation favours B2M deposition. This finding, needing large-scale confirmation, could open new perspectives in the study of DRA.

1. Background

The improvements in dialysis treatment over its almost six decades of use, and the widespread development of kidney transplantation have consistently reduced, but not eliminated, several long-term problems, including the rapid progression of diffuse vascular and cardiac diseases, premature ageing, nutritional problems and dialysis- related amyloidosis (DRA) [1,2,3,4,5,6,7,8]. DRA is the hallmark of the diseases related to incomplete long-term correction of the uremic syndrome: in this regard, it can be considered the prototype of the “survivors’ diseases” that affect patients that survive the acute challenges of uraemia long enough to develop diseases or conditions, not previously described [9,10,11,12,13,14,15,16].
The main element in the pathogenesis of DRA is linked by Beta-2 microglobulin deposition; Beta-2 microglobulinis a polypeptide of 11.8 kilo-Daltons, is physiologically present on the surface of most nucleated cells and in most biological fluids, including blood, urine and synovial fluid; it forms the Beta chain of the human leukocyte antigen class I molecule (HLA-1), and is characterized by a beta pleated structure. The normal production rate has been estimated as between 2 and 2.5 mg/Kg/day, and its removal is mainly by glomerular filtration and tubular breakdown. As a consequence, its level increases in chronic kidney disease (CKD), as it is the case of most “middle molecules” whose toxicity explains many of the signs and symptoms of advanced CKD [17,18,19,20,21,22,23].
While virtually all organs and tissues may be involved, the deposits have a preference for joints, muscles and bone, and amyloid-related arthropathy continues to afflict patients on long-term dialysis [8,9,10,11,12,13,14,15,16,17,18,19,20,21,22,23,24,25].
Beta-2 microglobulin, in native or modified, with partially proteolysis, oxidation or conjugation with advanced glycation end products (AGEs), is the key universal component of the deposits, but it is not the only one, and the relative contribution of other substances, including serum amyloid component P, apolipoprotein E or glycosaminoglycand, is likely to play a role in the different clinical manifestations of the disease. One particular characteristic of DRA is its link with inflammation. At the local level, Beta-2 microglobulin, and even more the modified forms, including AGE-Beta-2 microglobulin, are capable of directly enhancing bone reabsorption via the induction of several lymphokynes, including interleukin 1 and 6 (IL-1, IL-6) and tumor necrosis factor (TNF). Furthermore, Beta-2 microglobulin may by itself act as a growth factor [18,19,20,21]. A specific affinity for collagen has been reported, in vivo and in vitro; this may explain the fact that the first clinical manifestations usually involve collagen-rich tissues, like joints [20,21,22,23].
The link with systemic inflammation is likewise important: systemic inflammation enhances Beta-2 microglobulin production, and DRA has been reported as more frequent in patients with inflammatory diseases, or treated with non-biocompatible dialysis membrane or non-ultrapure water, and indeed, improvement in water quality, together with the advances in the dialysis techniques and supplies, is considered as of pivotal importance in reducing the incidence, or at least delaying the clinical onset of DRA [22,23,24,25,26,27,28,29,30,31,32,33,34,35].
Acknowledgement of the importance of DRA has allowed nephrologists to identify a potential marker of uremic toxicity, and Beta-2 microglobulin has consequently become the main marker of “middle molecule” accumulation [20,21,36,37,38,39,40,41].
There is little hope that we will be able to reverse DRA in the near future. Beta-2 microglobulin is always in a positive balance in dialysis patients, with all modalities and with any type of membrane, even if its levels are linked to dialysis efficiency and membrane permeability and water quality [42,43]. As previously noted by Canaud, a supporter of high-flux, pre-dilution haemodiafiltration, Beta-2 microglobulin is a uremic toxin with a double meaning: it is a marker of depuration as well as of chronic inflammation, which, when he was writing, was called “patient bioactivity” [28]. Circulating levels are poor markers of tissue deposition, thus making the establishment of “threshold levels” for adequate dialysis, of limited value.
Even if efficient dialysis and highly permeable membranes reduce the speed at which Beta-2 microglobulin accumulates, the disease has not disappeared, although less attention is paid to it in daily clinical practice [31,44,45,46].
While the histologic evidence of amyloid deposits in different organs and tissues is pathognomonic of the disease, biopsies are seldom performed and diagnosis relies on clinical data, supported by imaging. Its different presentations make diagnosis and grading difficult and the single element usually considered as a proxy of the clinical onset of DRA is carpal tunnel syndrome [20,21,47]. Its occurrence in patients on chronic dialysis is considered as linked to DRA, unless otherwise proven [20,21,47]. The description of amyloid staging recently proposed by nephrologists in Japan considered criteria other than carpal tunnel syndrome, including osteoarticular pain, trigger finger and destructive spondylarthropathy [48]. The limits for this classification reside in the lack of specificity of osteoarticular pain in the elderly population, as well as in the fact that radiological signs can be missed in the absence of specific attention or training.
It is in this context that attempts have been made to identify a “functional” test that would make early differential diagnosis possible and enable us to test the efficacy of different forms of treatment. Several types of scintigraphy have been tested, including bone scintigraphy, scintigraphy with marked P-amyloid component, gallium, thallium and Beta-2 microglobulin (see Supplementary Table S1) [49,50,51,52,53,54,55]. The best results were obtained using scintigraphy with Beta-2 microglobulin, which however never actually became part of the clinical practice [21,54].
Due to the link of DRA with local, inflammation, positron emission tomography with fluorodeoxyglucose (PET-FDG), which is able to detect sites of increased inflammatory activity, by detecting the metabolic activity of tissues, measured by glucose uptake, could be a potential tool for early detection of DRA. In spite of its theoretical interest, however, PET has been proposed so far in only two case reports, including a recent one by our group [55,56]. The present study was undertaken in this context to try to assess the potential of PET scan in the diagnosis of amyloid lesions in a large cohort of high-comorbidity dialysis patients, in which PET scan had been performed for different reasons (such as diagnosis and follow-up of neoplasia, search for occult infection, vasculitis).

2. Materials and Methods

2.1. Settings and Patients

The study was undertaken in the Centre Hospitalier du Mans (CHM), which is presently one of the three largest non-university hospitals in France. The pool of patients on chronic extracorporeal dialysis treatment ranges from 95 to 110, depending on the incidence of kidney transplantation, death and transfers. In keeping with the indications of the French Society of Nephrology (Société Francophone de Néphrologie, Dialyse et Transplantation, SFNDT), out-of-hospital dialysis is widely used and only cases posing particular clinical, attitudinal or psychological problems are managed in the hospital. Hence, the population studied is a large sample of the most difficult patients treated in the area. The most widely used technique is post-dilutional on-line haemodiafiltration (HDF), with acetate-free, citrate-based dialysate (calcium concentration 1.5–1.75 mmol/L; sodium 138–140 mEq/L; bicarbonate 32–38 mmol/L; temperature 36 °C–37 °C; potassium 2 mmol/L, corrected with potassium infusion in case of need). At the beginning of the study, prescriptions were mainly standardized to include the following: high-permeability membranes with a surface at least as wide as the patient’s body surface, reinfusion of at least 24 litres per session [57]. Conventional haemodialysis was performed with the same dialysate, employing low-, medium- and high-permeability dialysers. About two thirds of the patients were dialysed with an arteriovenous (AV) fistula, the rest with a permanent tunneled catheter. The dialysis policy was progressively shifted towards personalisation of treatment, with wide use of incremental dialysis, and the development of more frequent dialysis [58].
Dialysis efficiency was calculated using Daugirdas-II Kt/V. Comorbidity was assessed using the Charlson Comorbidity Index (CCI); Subjective Global Assessment (SGA) and Malnutrition Inflammation Score (MIS) were also employed in all cases [59,60,61,62,63]. Beta-2 microglobulin was assessed in the context of regular monitoring of dialysis sessions, with frequency varying between once yearly in 2016, at the start of observation, to 6 times per year in 2018.
Carpal tunnel syndrome was considered a proxy for dialysis-related amyloidosis, excluding cases in which diagnosis antedated dialysis start. In keeping with the indications of the Japanese school, formal histological demonstration of Beta-2 amyloid deposits was not required for definition; however, DRA was histologically confirmed in all cases for which morphologic analysis was available [47].
A composite continuous score was also employed. The following options were explored, and the last one was chosen to build it, given its simplicity and better yield.
-
each dialysis year = 1 point; each year of kidney transplantation = 0.2 point; each year of CKD stages 4-5 = 0.2 point; carpal tunnel or evidence of DRA = 5 points per site up to a maximum of 4 sites
-
each dialysis year = 1 point; each year of kidney transplantation = 0.2 point; carpal tunnel = 5 points per site
-
each dialysis year = 1 point; carpal tunnel or evidence of DRA = 5 points per site up to a maximum of 4 sites

2.2. Selection Criteria: Patients

Of the 162 patients on chronic dialysis who were followed in the period 2016-2018, those who had had one or more PET scans after the start of dialysis were selected: 46 patients had had at least one PET scan performed after the start of dialysis. Overall 72 PET scans were considered for the present study.
The following information was gathered for all patients: sex, age, kidney disease, PET indications, presence and type of cancer (previous and active), presence and type of systemic disease, carpal tunnel, subjective global assessment (SGA), malnutrition inflammation score (MIS), Charlson Comorbidity Index (CCI), kidney transplant, date of start of dialysis, time in dialysis (years), time on renal replacement therapy (RRT). All indexes were assessed at the time of each PET scan; Kt/V, serum albumin and Beta-2 microglobulin were also recorded (the data nearest to the PET scan was included).

2.3. Selection Criteria: Controls

From all the patients who had a PET scan in CHM’s nuclear medicine department between September 2018 and January 2019, we selected 218 controls in the same age range (34–89 years) as the dialysis cases, with normal kidney function, excluding patients with any type of amyloidosis and any known inflammatory process in their joints and bones, or with hip and/or shoulder metastases. Most of the patients selected were in follow-up for a neoplastic disease. Sex, age, PET indications and type of neoplasia were recorded in all cases.

2.4. PET Scan

Positron Emission Tomography was performed in the same setting in all cases. The procedure was described to patients and those who agreed to participate gave informed written consent. PET/CT studies were performed using the same Discovery ST scanner (General Electric Medical Systems, Waukesha, WI, USA). Patients were told to refrain from food intake for at least six hours before scanning; at the time of their tracer injection, all patients presented a blood glucose level under 220 mg/dL. Whole-body emission scans were acquired beginning 60 min after the intravenous injection of FDG (dose range: 2.5 MBq/kg). The acquisition protocol started with a scout view (a two-dimensional CT projection of the patient), which was used to define the body axial extension for which to acquire CT and PET data. Once the scan range was defined, CT was performed (voltage 130-150 kV, tube current 56–90 mAs) from the proximal femur to the base of the skull. This scan lasted approximately 1 min and was used for both anatomical localization and attenuation correction of the PET emission data. PET data on the whole-body distribution of the tracer was acquired in 3D mode from the pelvis to the head (2 min per field of view [FOV]; 8–9 FOV). Coronal, sagittal and transverse data sets were reconstructed. The image reconstruction was performed as a 3D reconstruction of FOV iterative algorithms (50 cm, image matrix size: 128 × 128). All viewing of co-registered images was performed with dedicated Keosys imaging reading software.
A Standardized Uptake Value (SUV) was calculated by defining a region of interest (ROI) around the metabolically active lesion in the PET images, i.e. we found the plane with the hottest voxels and then measured that plane’s maximum SUV using the formula SUV = activity (MBq/mL) × body weight (g)/injected dose (MBq). We performed the same procedure for two adjacent planes and considered the average of these measures for our analysis.
On the basis of the sites most commonly involved in DRA, we manually drew the ROIs on shoulders, hips and liver, calculating the SUV for each one. We considered a patient as “positive” if the SUV of at least one of their joints was superior to that of the liver. We then performed visual reading, focusing on the spherical periarticular pattern, to exclude false positives (for example, an acute inflammatory phase of an arthrosis). In cases of a prosthetic hip or shoulder, the prosthetic joint was not considered.
Each patient’s PET scans were read by at least one member of the team at the Centre Hospitalier du Mans (CHM), under the supervision of CB, and by at least one member of the team working at the IRMET Institute in Torino, Italy, blinded to the initial diagnosis and to patients’ clinical characteristics; discrepancies were solved through discussion. Figure 1a–c reports an example of a positive, a negative and a non-specific pattern.
Whole-body emission scans acquired beginning 60 min after the intravenous injection of FDG (2.5 MBq/kg). Images are combined with CT scan (voltage 130–150 kV, tube current 56–90 mAs) The image reconstruction was performed as a 3D reconstruction of FOV iterative algorithms (50 cm, image matrix size: 128 × 128). All viewing of co-registered images was performed with dedicated Keosys imaging reading software.

2.5. Statistical Analysis

Descriptive analysis was performed as appropriate (mean and standard deviation for parametric data and median, minimum-maximum for non-parametric data). Independent t-test, Chi-square test, Fisher’s exact test, Anova Test and Kruskal-Wallis were used where indicated for comparisons between groups. Significance was set at <0.05.
Positive and negative predictive values were calculated considering carpal tunnel as a reference (acknowledged proxy for clinically evident dialysis-related amyloidosis).
To make it possible to analyse the PET scan results (dichotomised: positive-negative) via a ROC curve, we initially built ROC curves between carpal tunnel syndrome (dichotomous) and the “clinical amyloid score” (continuous); in cases of high performance of the ROC curve, we planned to test clinical amyloid score (continuous) versus PET results (dichotomous).
A further logistic regression included cases and controls, the positivity of the PET scan as the outcome, and the presence of dialysis treatment, age and sex as explanatory covariates.
A series of multiple logistic regression analyses was performed in the dialysis cohort. For this analysis, each test was considered as a “case” (analysis per scan).
The selection of the explanatory covariates followed both the results of the descriptive analysis and clinical logic (those known or suspected to be associated in previous studies); a stepwise backward method was chosen.
The outcome in our first series was the presence of carpal tunnel, and in the second series the positivity of PET scan, using the following explanatory covariates: age, sex, presence of vasculitis or systemic disease, MIS index, duration of dialysis follow-up. Continuous variables were dichotomised either at the median or at a clinically sound term: age (median); dialysis vintage (carpal tunnel analysis: 10 years, since all positive cases were above the median; at the median in the analysis considering the positivity of PET scan as an outcome); the clinical score was dichotomised using the Youden index (resulting from the ROC curve analysis); the MIS index was dichotomised at 5 (considering that this is the usual limit between low and high inflammatory states). Kidney transplantation was not included as it correlated with dialysis vintage (young patients at start of dialysis are frequently transplanted).
To explain the PET positivity found, a prediction model was built by combining the clinical amyloid score and MIS score. The best model was built empirically by adding the MIS index multiplied by a factor of 2.7 to the clinical amyloid score; this choice took into account the different scales of the two indexes (maximum clinical score: 62, maximum MIS score: 19). Internal validation of the model was performed through the leave-one-out method [64]. The analysis was performed with SPSS software v.14.0 (IMB Corp., Chicago, IL, USA) and MedCalc v.18 (MedCalc Software, Ostend, Belgium).

2.6. Ethical Issues

All the patients enrolled were adults and agreed to allow use of their routine clinical and biochemical data for the sake of this study.
The present cross-sectional study did not involve additional blood tests or additional imaging techniques. It was approved by the ethics committee in Le Mans (“Avis favorable du groupe d’éthique du Centre Hospitalier du Mans”, date: 14/06/2018).

3. Results

3.1. Baseline Data

Table 1 reports the main demographic characteristics of dialysis patients and controls with normal kidney function.
The prevalence of PET scans showing the distinct “shoulder and hip” pattern is significantly different in patients and controls: 5% in controls versus 43.5% in dialysis patients (p < 0.0001).
In both cases and controls, a diffuse, often circular or semicircular articular involvement was observed; however in the positive controls, only one joint was involved in most cases (9/11) patients and only 2 patients demonstrated 2 affected joints, while dialysis patients tended to demonstrate diffuse bilateral involvement, albeit often of different intensity.
The dialysis population, described in Table 2, is elderly and at high comorbidity, the reasons why a complex imaging test such as PET scan is so often chosen.
In this cohort, seven patients presented a carpal tunnel. Morphological confirmation of the presence of Beta2 amyloidosis in patients with carpal tunnel was available in 5/7 cases (in one case the intervention was too old to be tracked in the electronic records and the morphologic description was not available, and in another one it was performed in a different setting; both presented evidence of destructive spondilartropathy, another acknowledged hallmark of DRA). In keeping with the close relationship between DRA and duration of renal replacement therapy, Table 3 shows that dialysis vintage was significantly higher in patients with carpal tunnel (13.2 versus 1.6 years); no difference was observed for Kt/V and Beta-2 microglobulin levels in proximity of the PET scan, while albumin levels were lower and prevalence of malnutrition at the SGA score was significantly higher in patients with carpal tunnel. Significantly, a kidney transplant was more frequent in these patients, probably as a reflection of their younger age at the start of renal replacement therapy. All patients with carpal tunnel had at least one positive PET scan, while positivity at PET scan was found in 14/15 tests (93.3%). Conversely, PET scan tested positive in about 30% of the patients without carpal tunnel syndrome (Table 3).
PET scans were usually concordant when retested. There were two exceptions. The first was a 72-year-old woman who had undergone carpal tunnel surgery two years previously, dialysis vintage 9 years (amyloid score at the first PET scan 19.09; MIS: 4) on dialysis for chronic pyelonephritis on a single kidney. She tested negative at the first scan and positive at the second one (dialysis vintage 10 years; amyloid score at the second PET scan 20.06; MIS: 9).
The second patient, a woman who was 53 years old at the time of her first PET scan, on dialysis for less than one year for antiphospholipid syndrome, tested positive at the first PET scan performed in the context of a search for an occult neoplasia (hypercalcemia, granulomatous disease of presumed tubercular origin; amyloid score at first scan: 0.44; MIS: 11). Three months later, she tested negative at the second scan, when, after having started anti-tubercular treatment, resolution of hypercalcemia had been achieved and her inflammatory and nutritional status had improved (amyloid score 0.73; MIS: 6).

3.2. Indications for PET Scans

The following were the main indications for performing PET scan: follow-up of a known neoplasia (14 patients and 27 PET scans); follow-up of known vasculitis (3 patients and 4 PET scans); other indications, such as fever of unknown origin in the context of vasculitis (27 patients and 36 PET scans).

3.3. Correlation between PET Scans and Clinical Features

Table 4 reports the main clinical data of the dialysis patients, sorted according to positive or negative PET scan. A close correlation was found between carpal tunnel and dialysis vintage (per patient: positive cases median: 7.2 years of dialysis vs. negative cases 1.2 years, p = 0.0153); the correlation with kidney transplantation is significant in the analysis per scan.
Interestingly, while serum albumin and SGA were not correlated with PET scan results, patients with a positive PET scan presented a significantly higher malnutrition inflammation score (per patient: MIS: 10 vs. 6, p = 0.0034), a composite score, integrating serum albumin with inflammation and cardiovascular comorbidity markers.

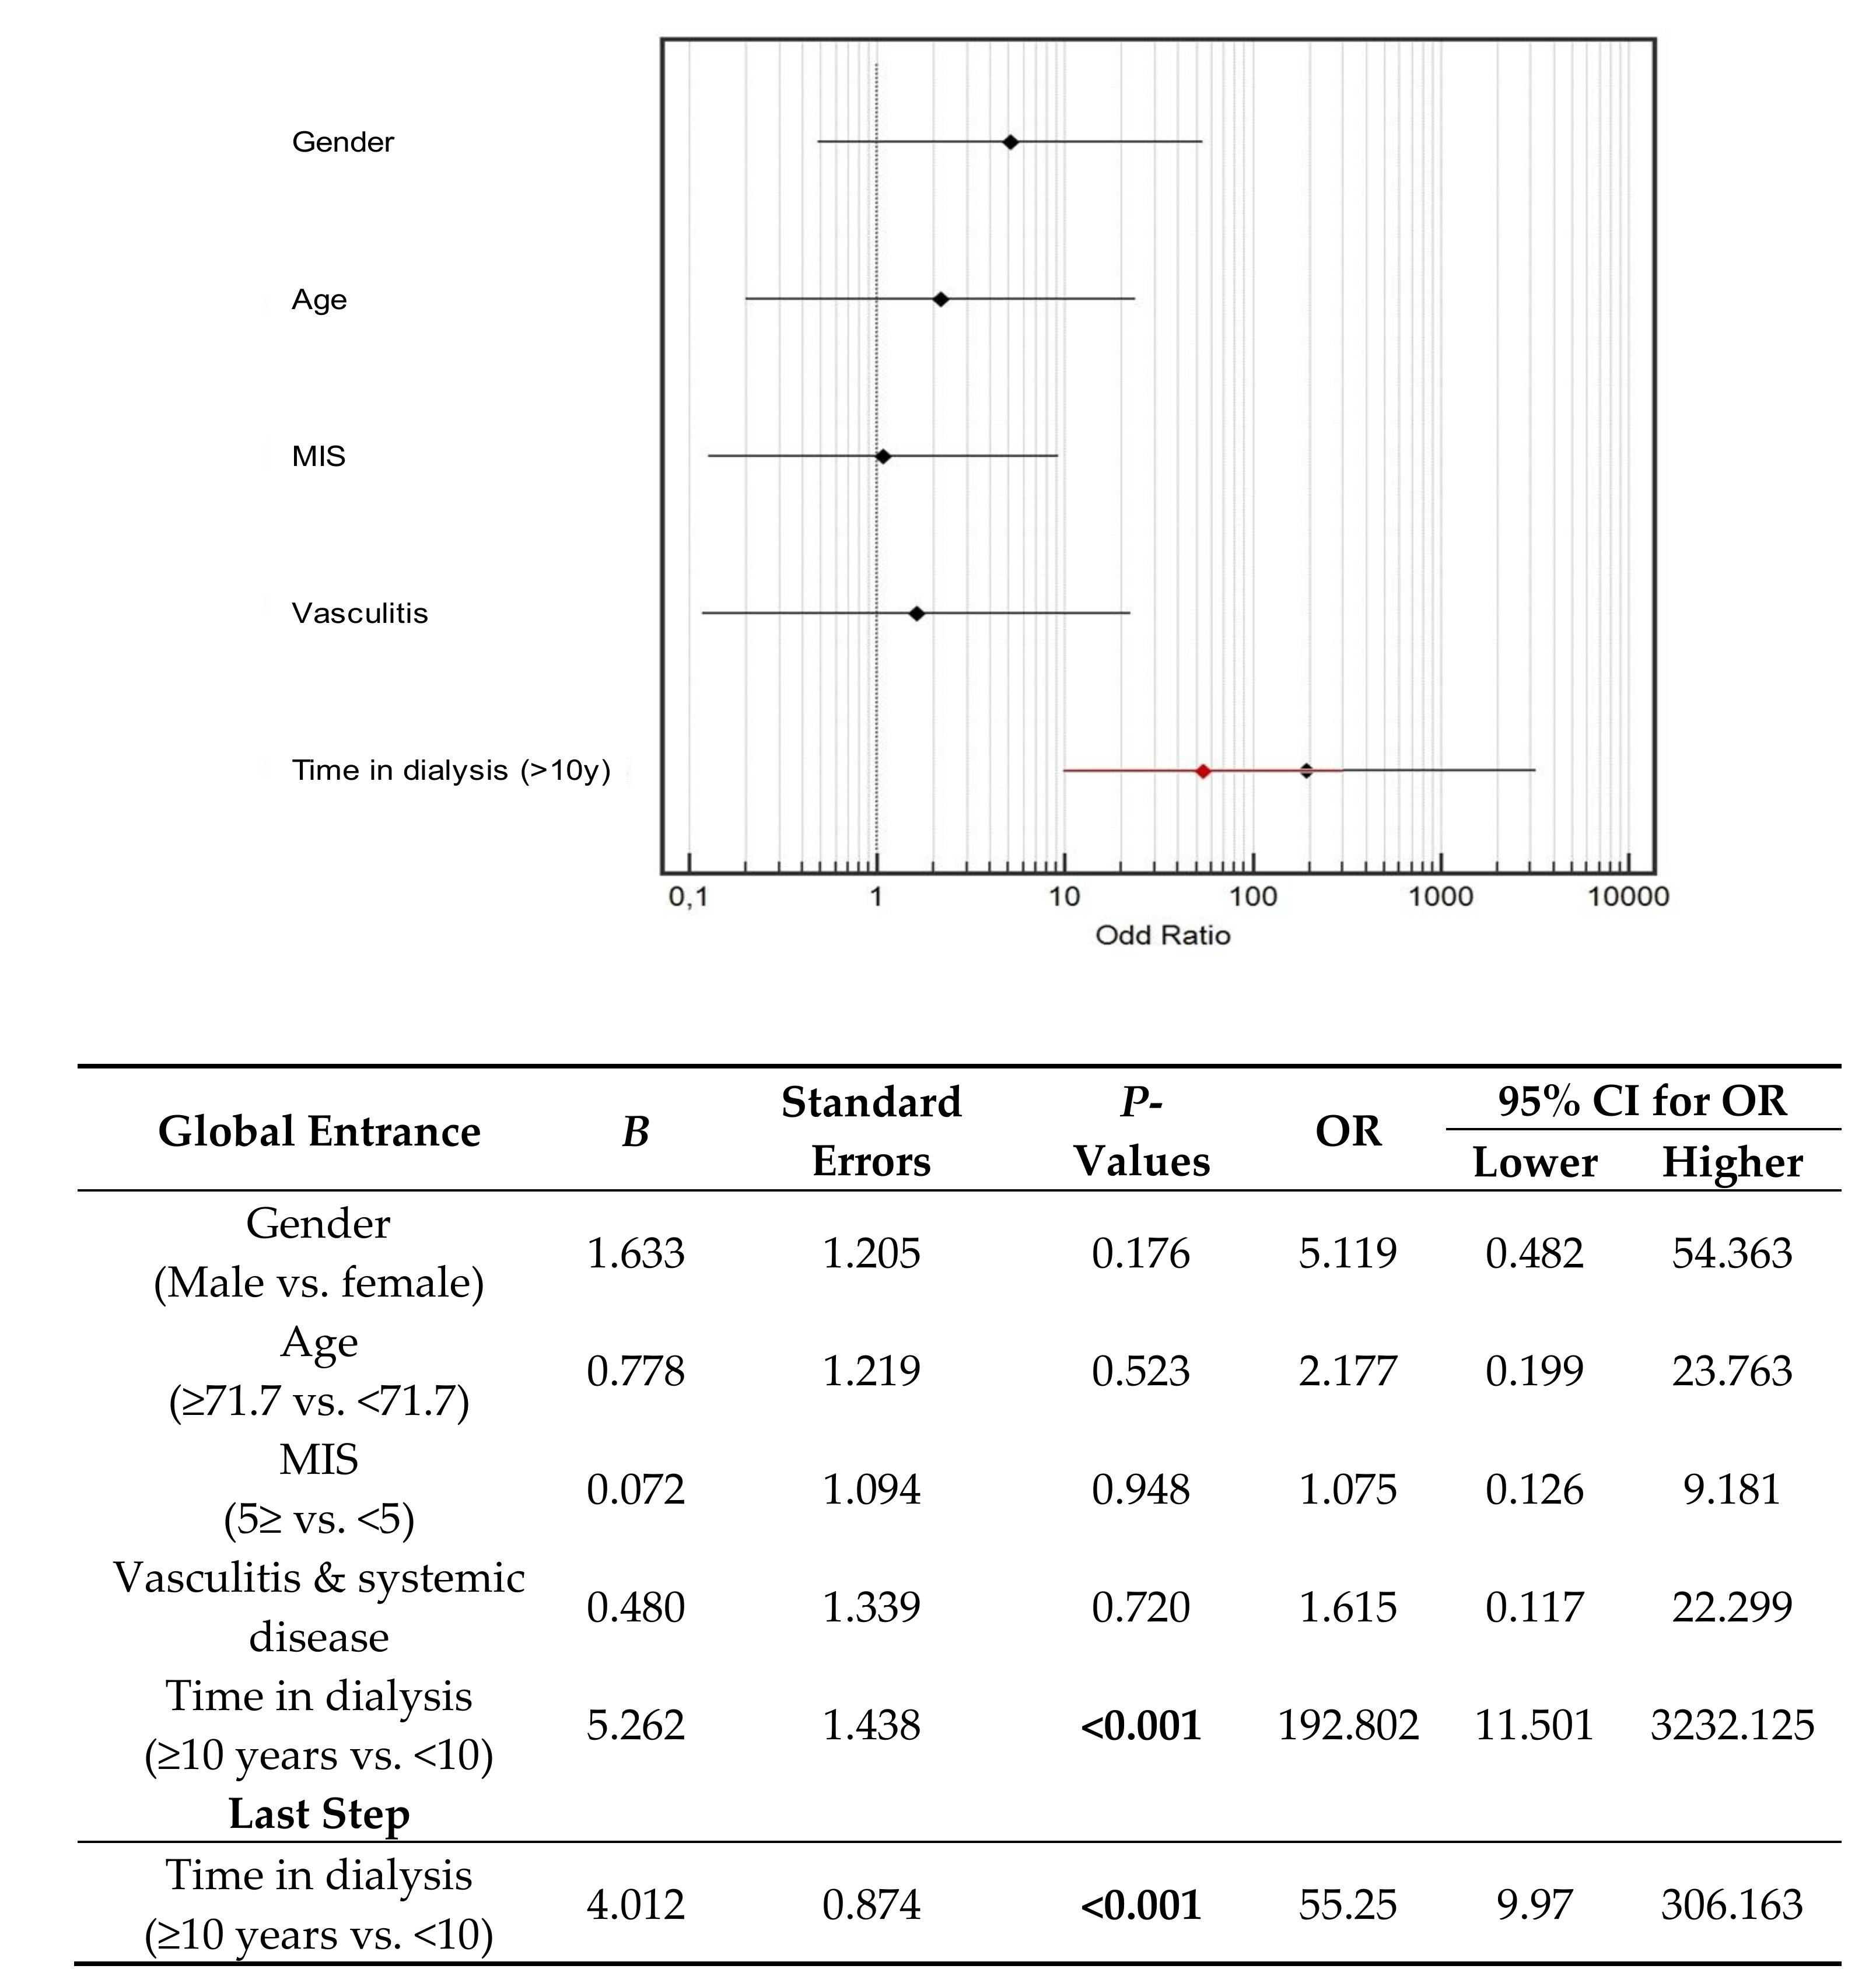
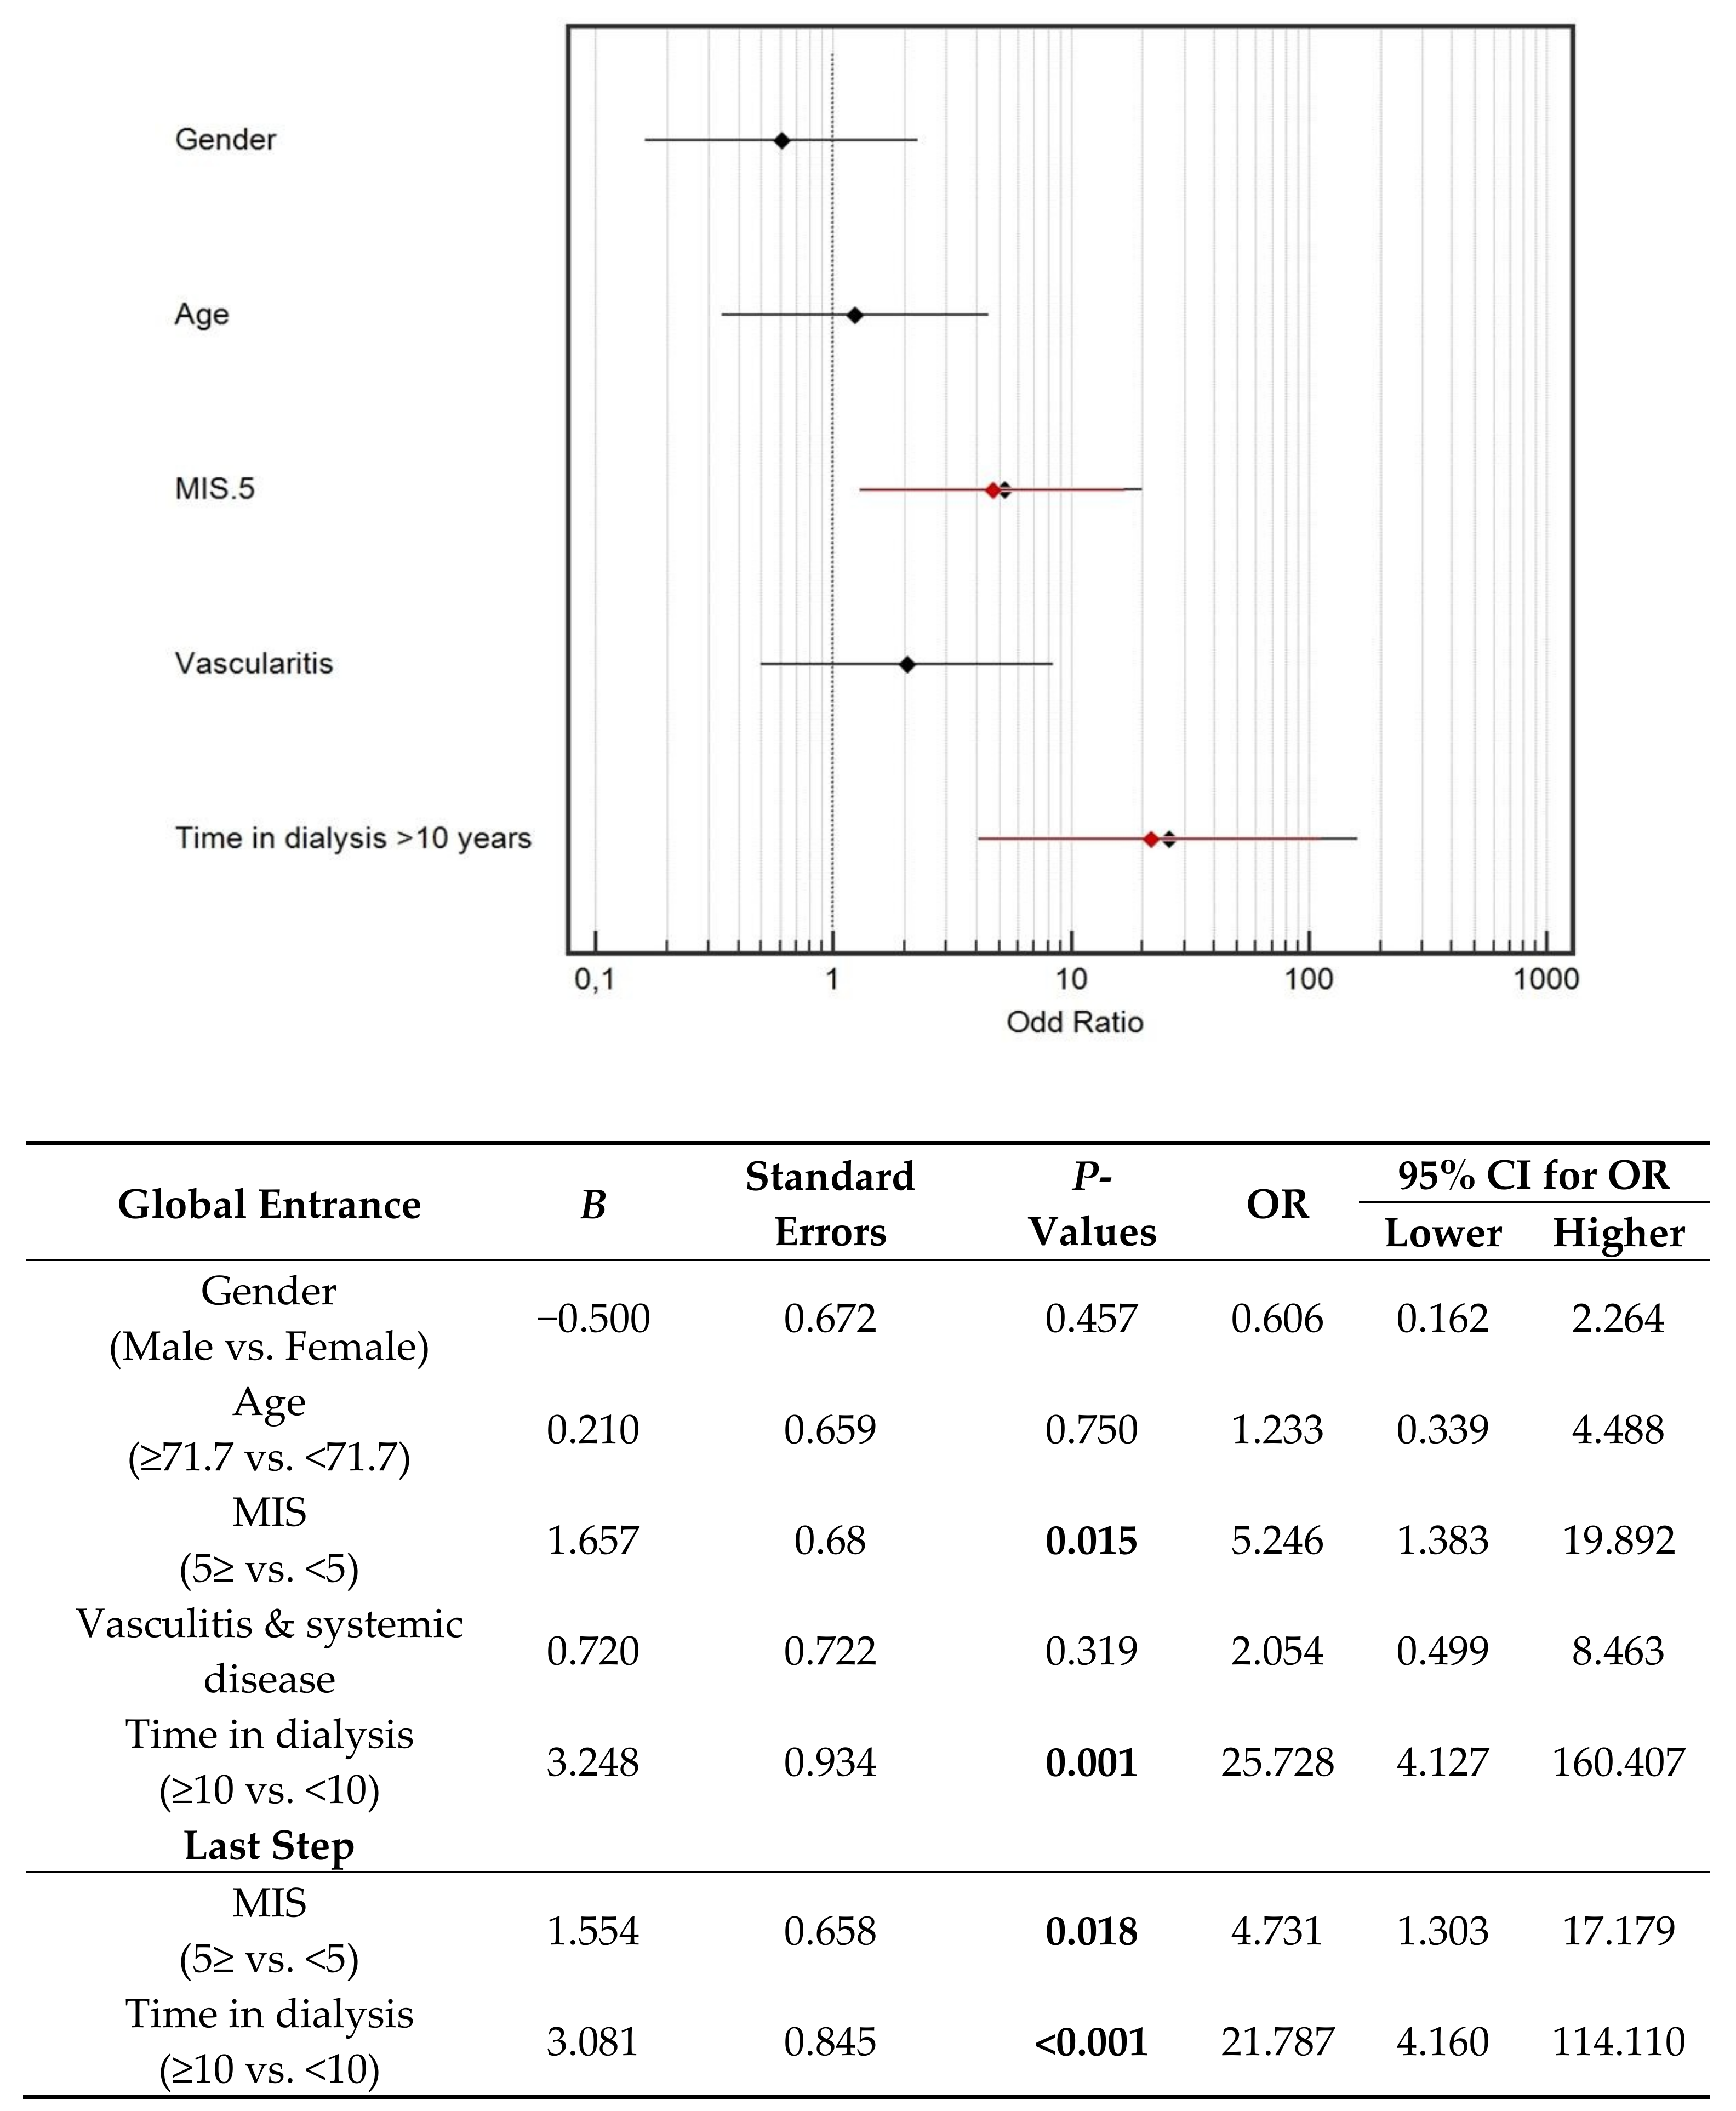
3.4. Multivariate Analysis

3.4.1. Outcomes: Carpal Tunnel and Positive PET Scan

In the dialysis population, the outcome “carpal tunnel” was significantly associated with long dialysis vintage, with an extremely high odds ratio. No association was found with sex, age, MIS, and vasculitis (Figure 2). The cut-point of dialysis vintage was empirically chosen at 10 years in this analysis, since all cases fell above the median time on dialysis (3.39 years).
Conversely, a positive PET scan was associated with both dialysis vintage and MIS index, dichotomized at 5, a level marking initial signs of malnutrition-inflammation-atherosclerosis (Figure 3).
The pattern of the results was confirmed in a further analysis which included the clinical amyloid score instead of dialysis vintage (included in the score); the best yield of the model was observed by dichotomization of the clinical score at the Youden index, identified in patients’ ROC curves (Figure 4).
No correlation was found between MIS and clinical amyloid score (Spearman correlation, p = 0.131).

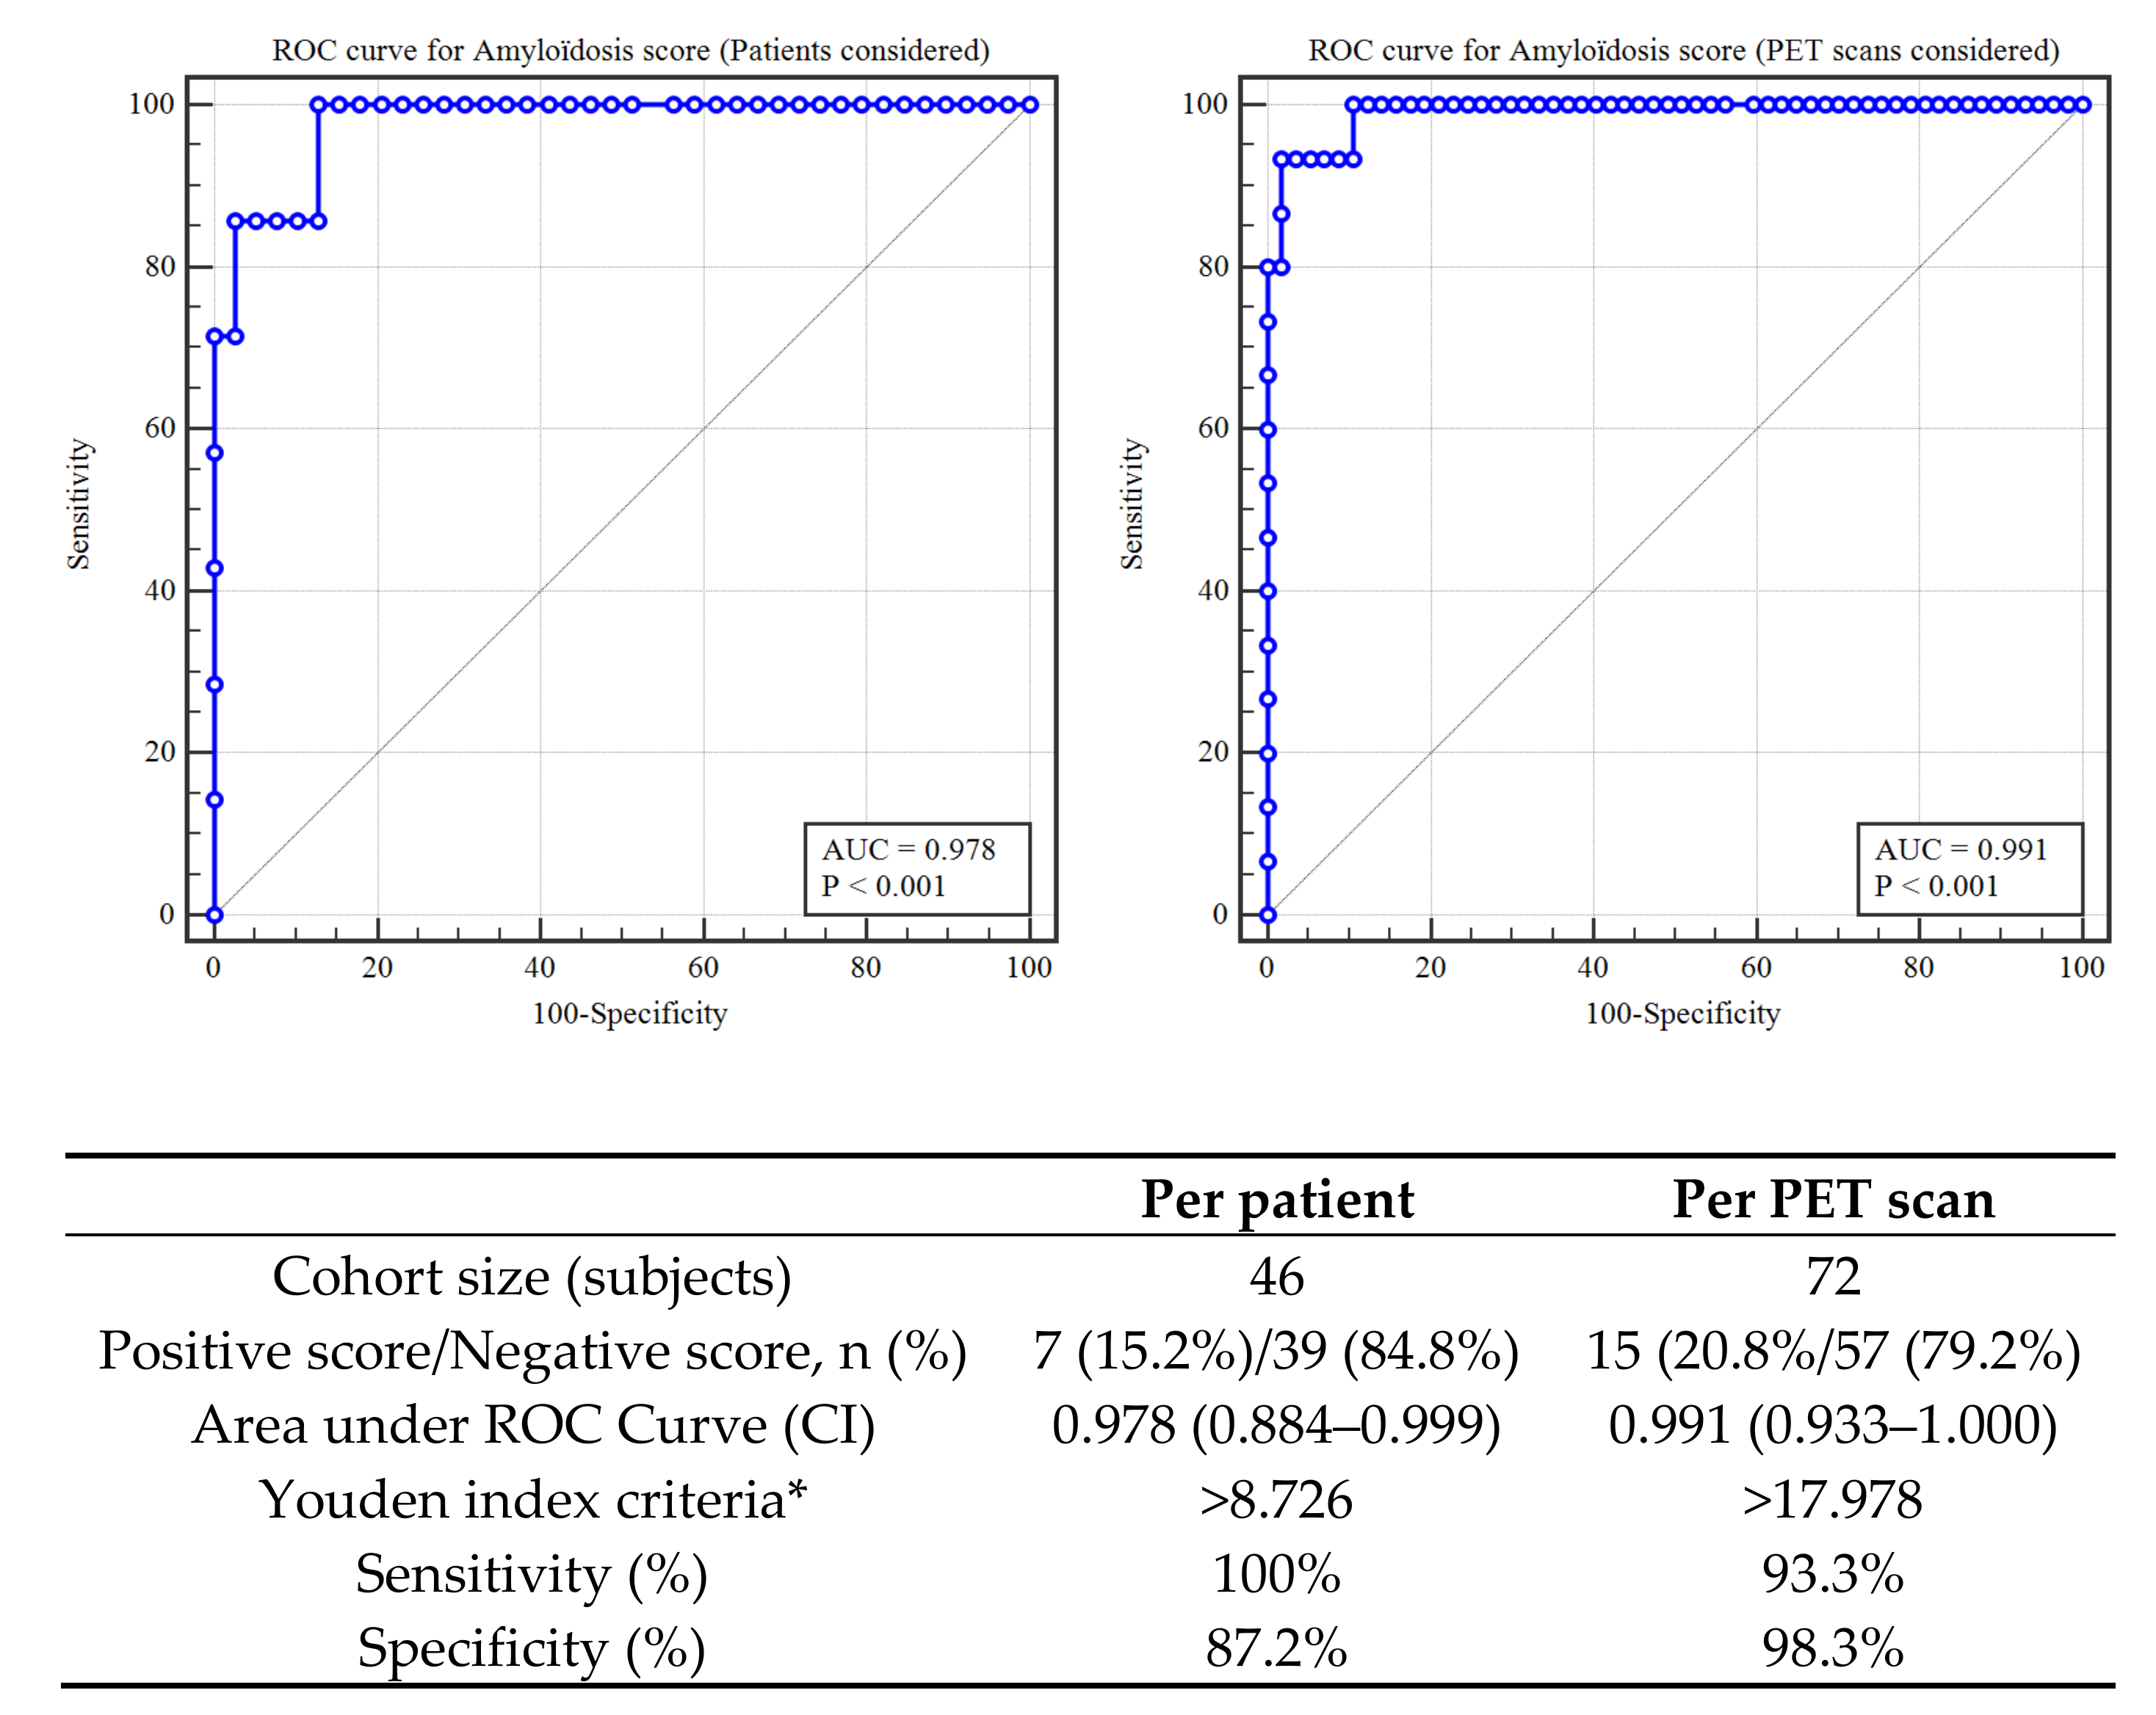
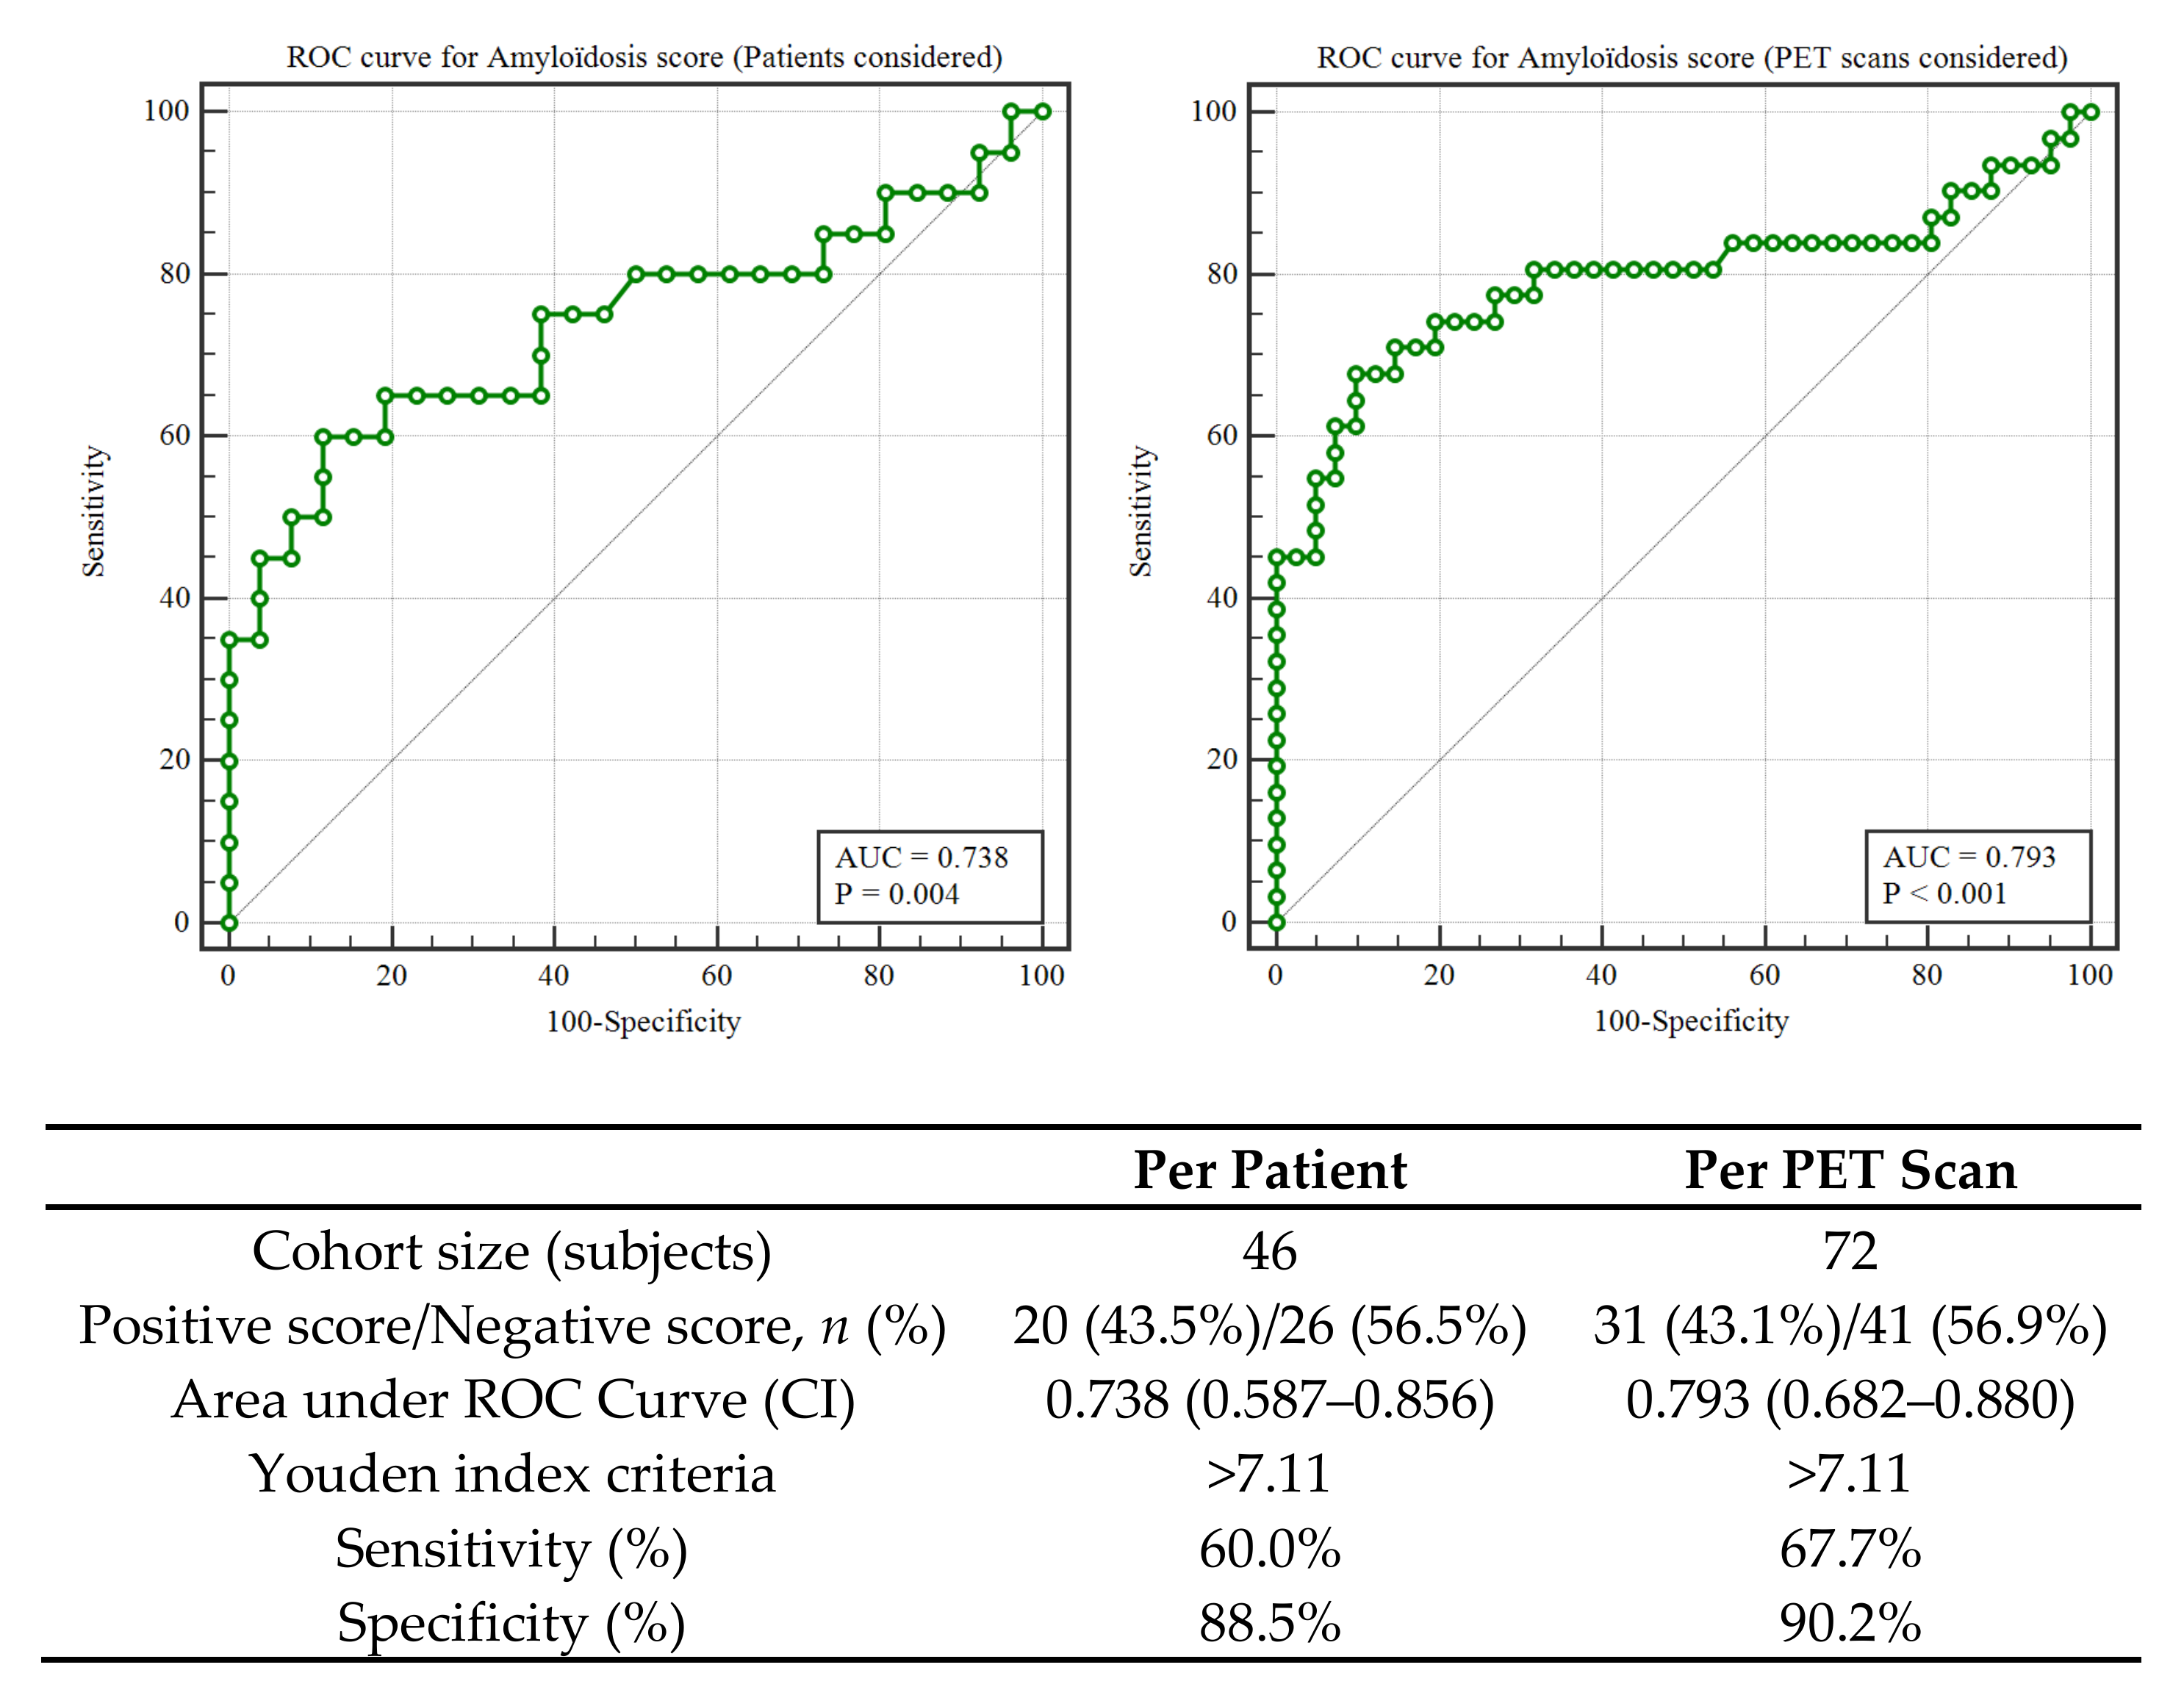
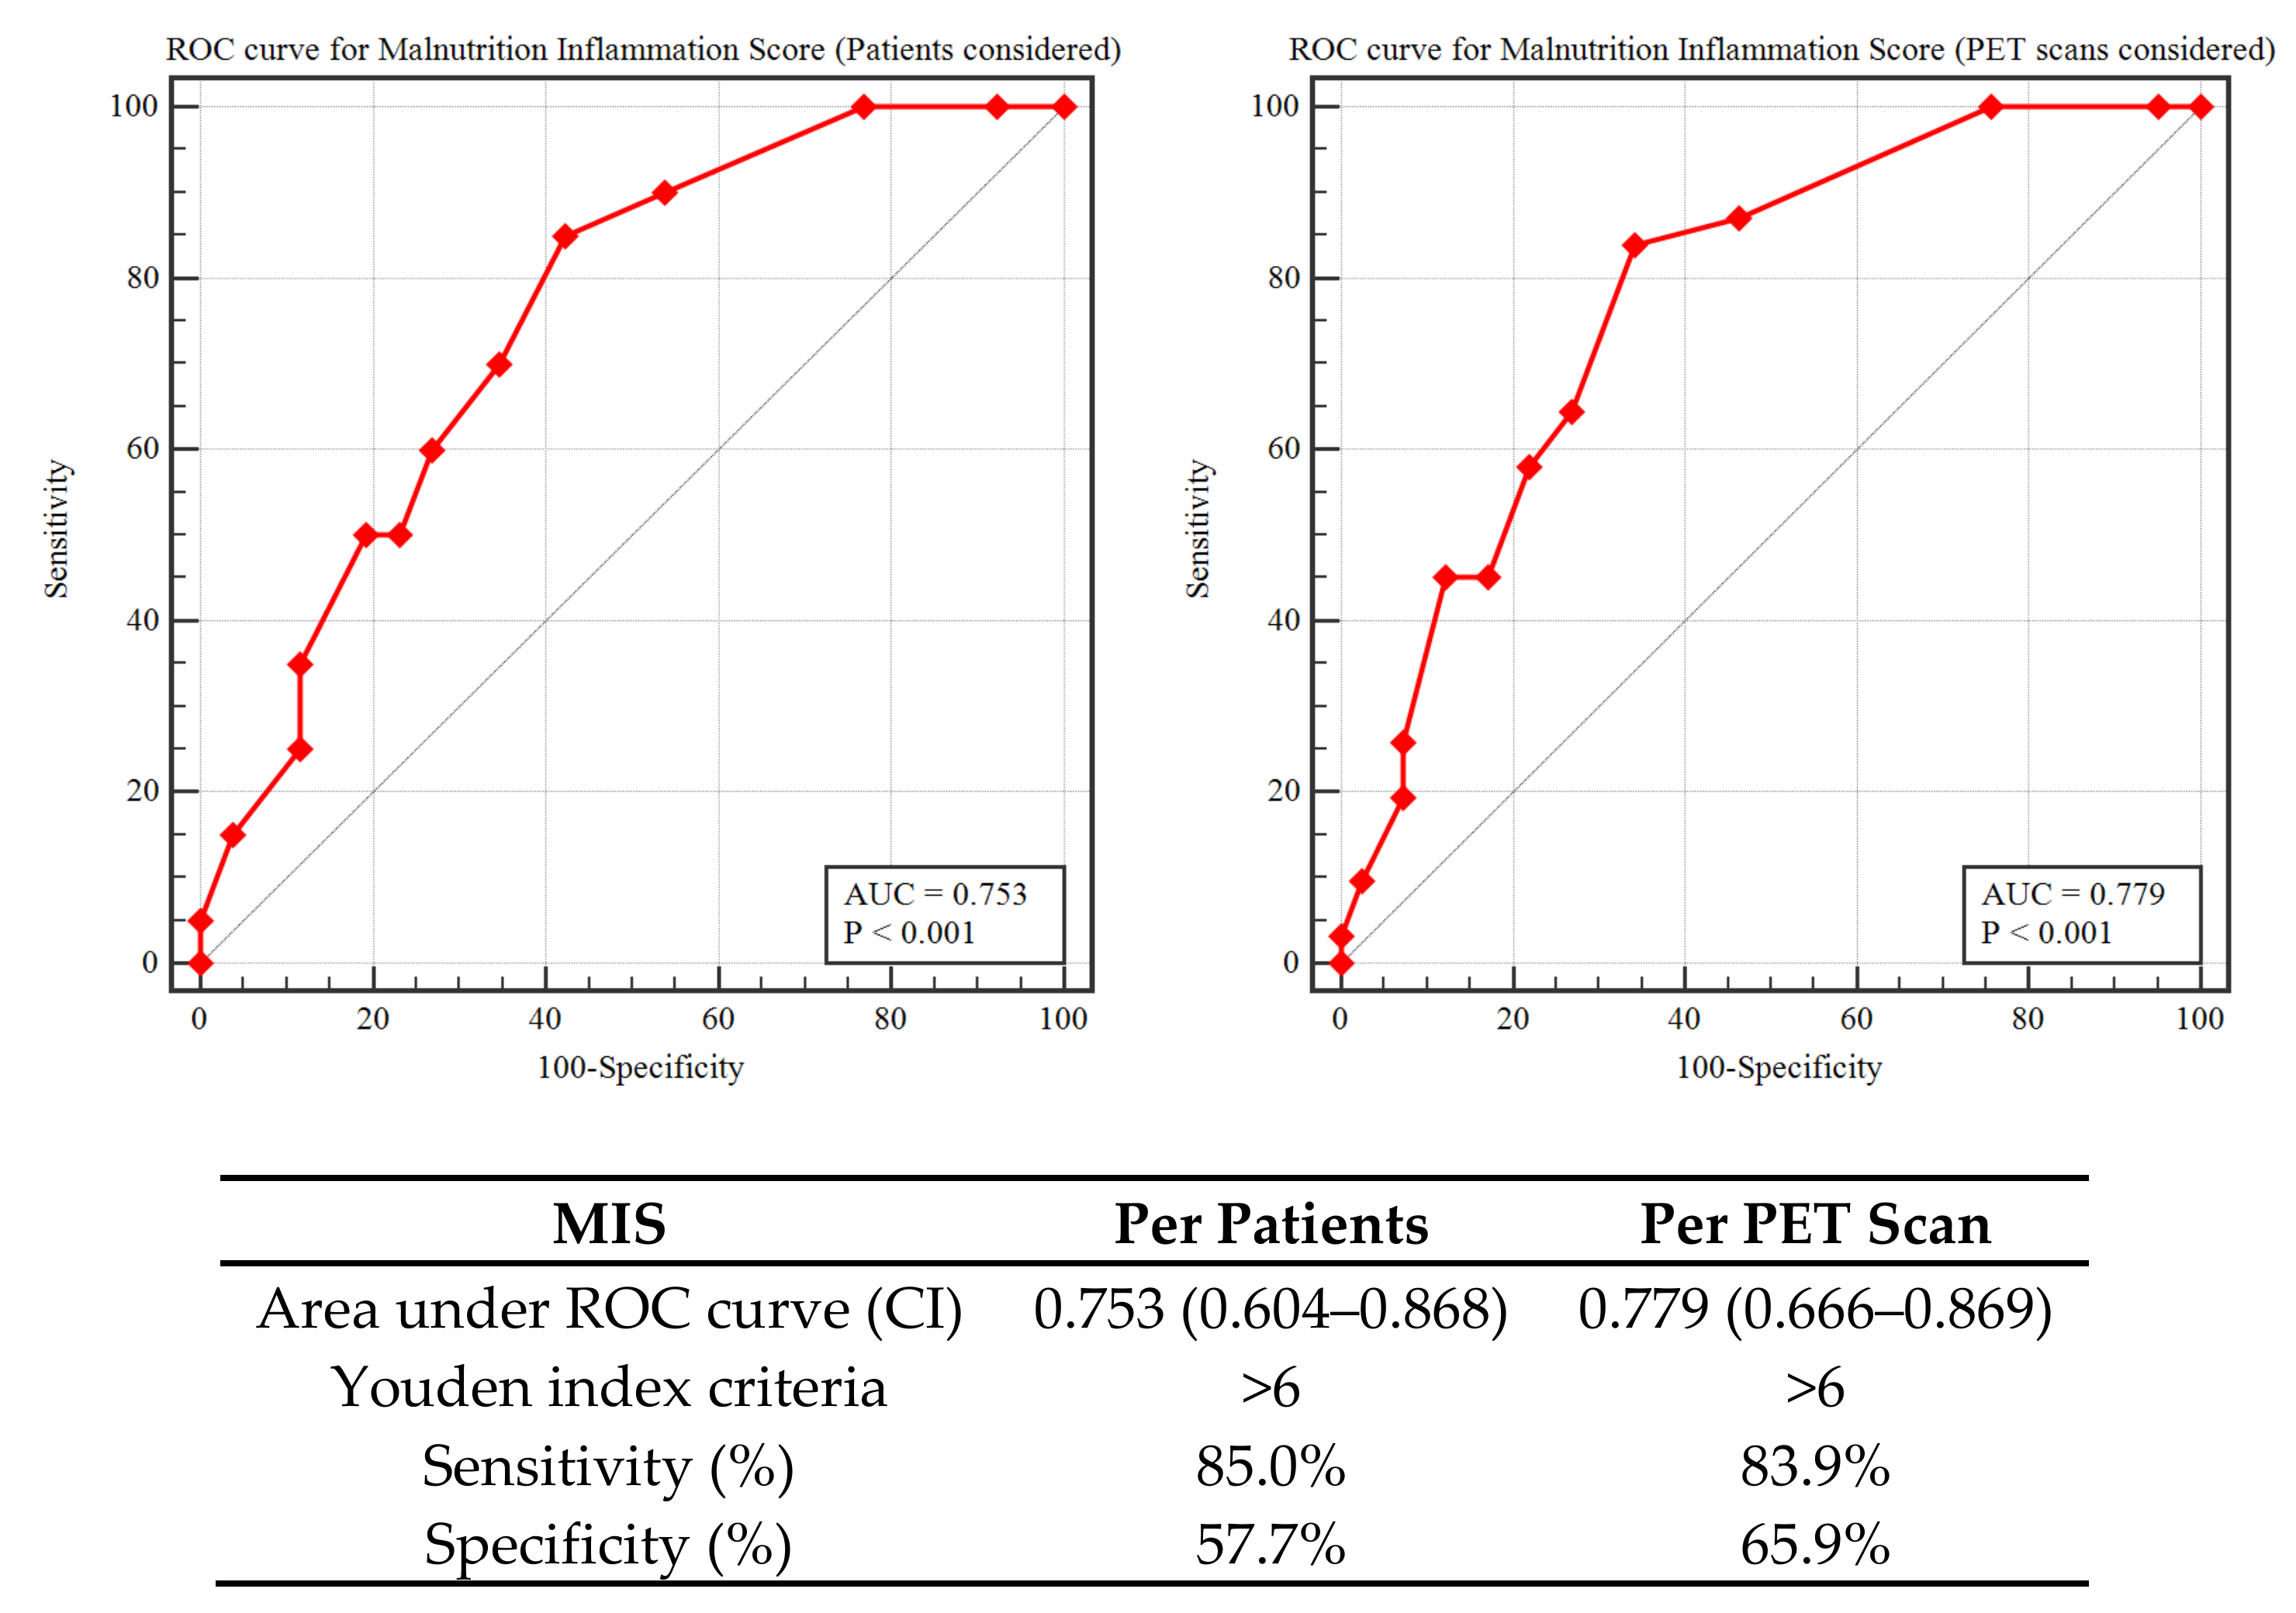
3.4.2. ROC Curves and Sensitivity Analysis.

Considering carpal tunnel syndrome as the proxy for clinical amyloidosis, the sensitivity of PET scan for detecting the disease was 100% per patient, and 95% per test, with a specificity of 61% in the analysis per patient and 64% in the analysis per test (Figure 5).
To refine the analysis with ROC curves, we tested the relationship between carpal tunnel and the continuous clinical amyloid score (Figure 6). The correspondence between the two indexes was close enough (area under the curve 97.8% per patient vs. 99.1% per test) to allow us to use the amyloid clinical score as a proxy for amyloidosis in further ROC analyses.
Figure 6 reports the ROC curve (per patient and PET scan) correlating PET scan and clinical amyloid score; the correlation is significant (p = 0.004 per patient and p < 0.001 per test); the area under the curve is 0.74 per patient and 0.79 per test, and the discriminant is at a clinical amyloid score of 7.11.
The ROC curve of the MIS score versus PET positivity was also calculated (Figure 7). The correlation was significant, with an AUC of 75.3% per patient and 77.9% per PET scan (p < 0.001 in both cases).

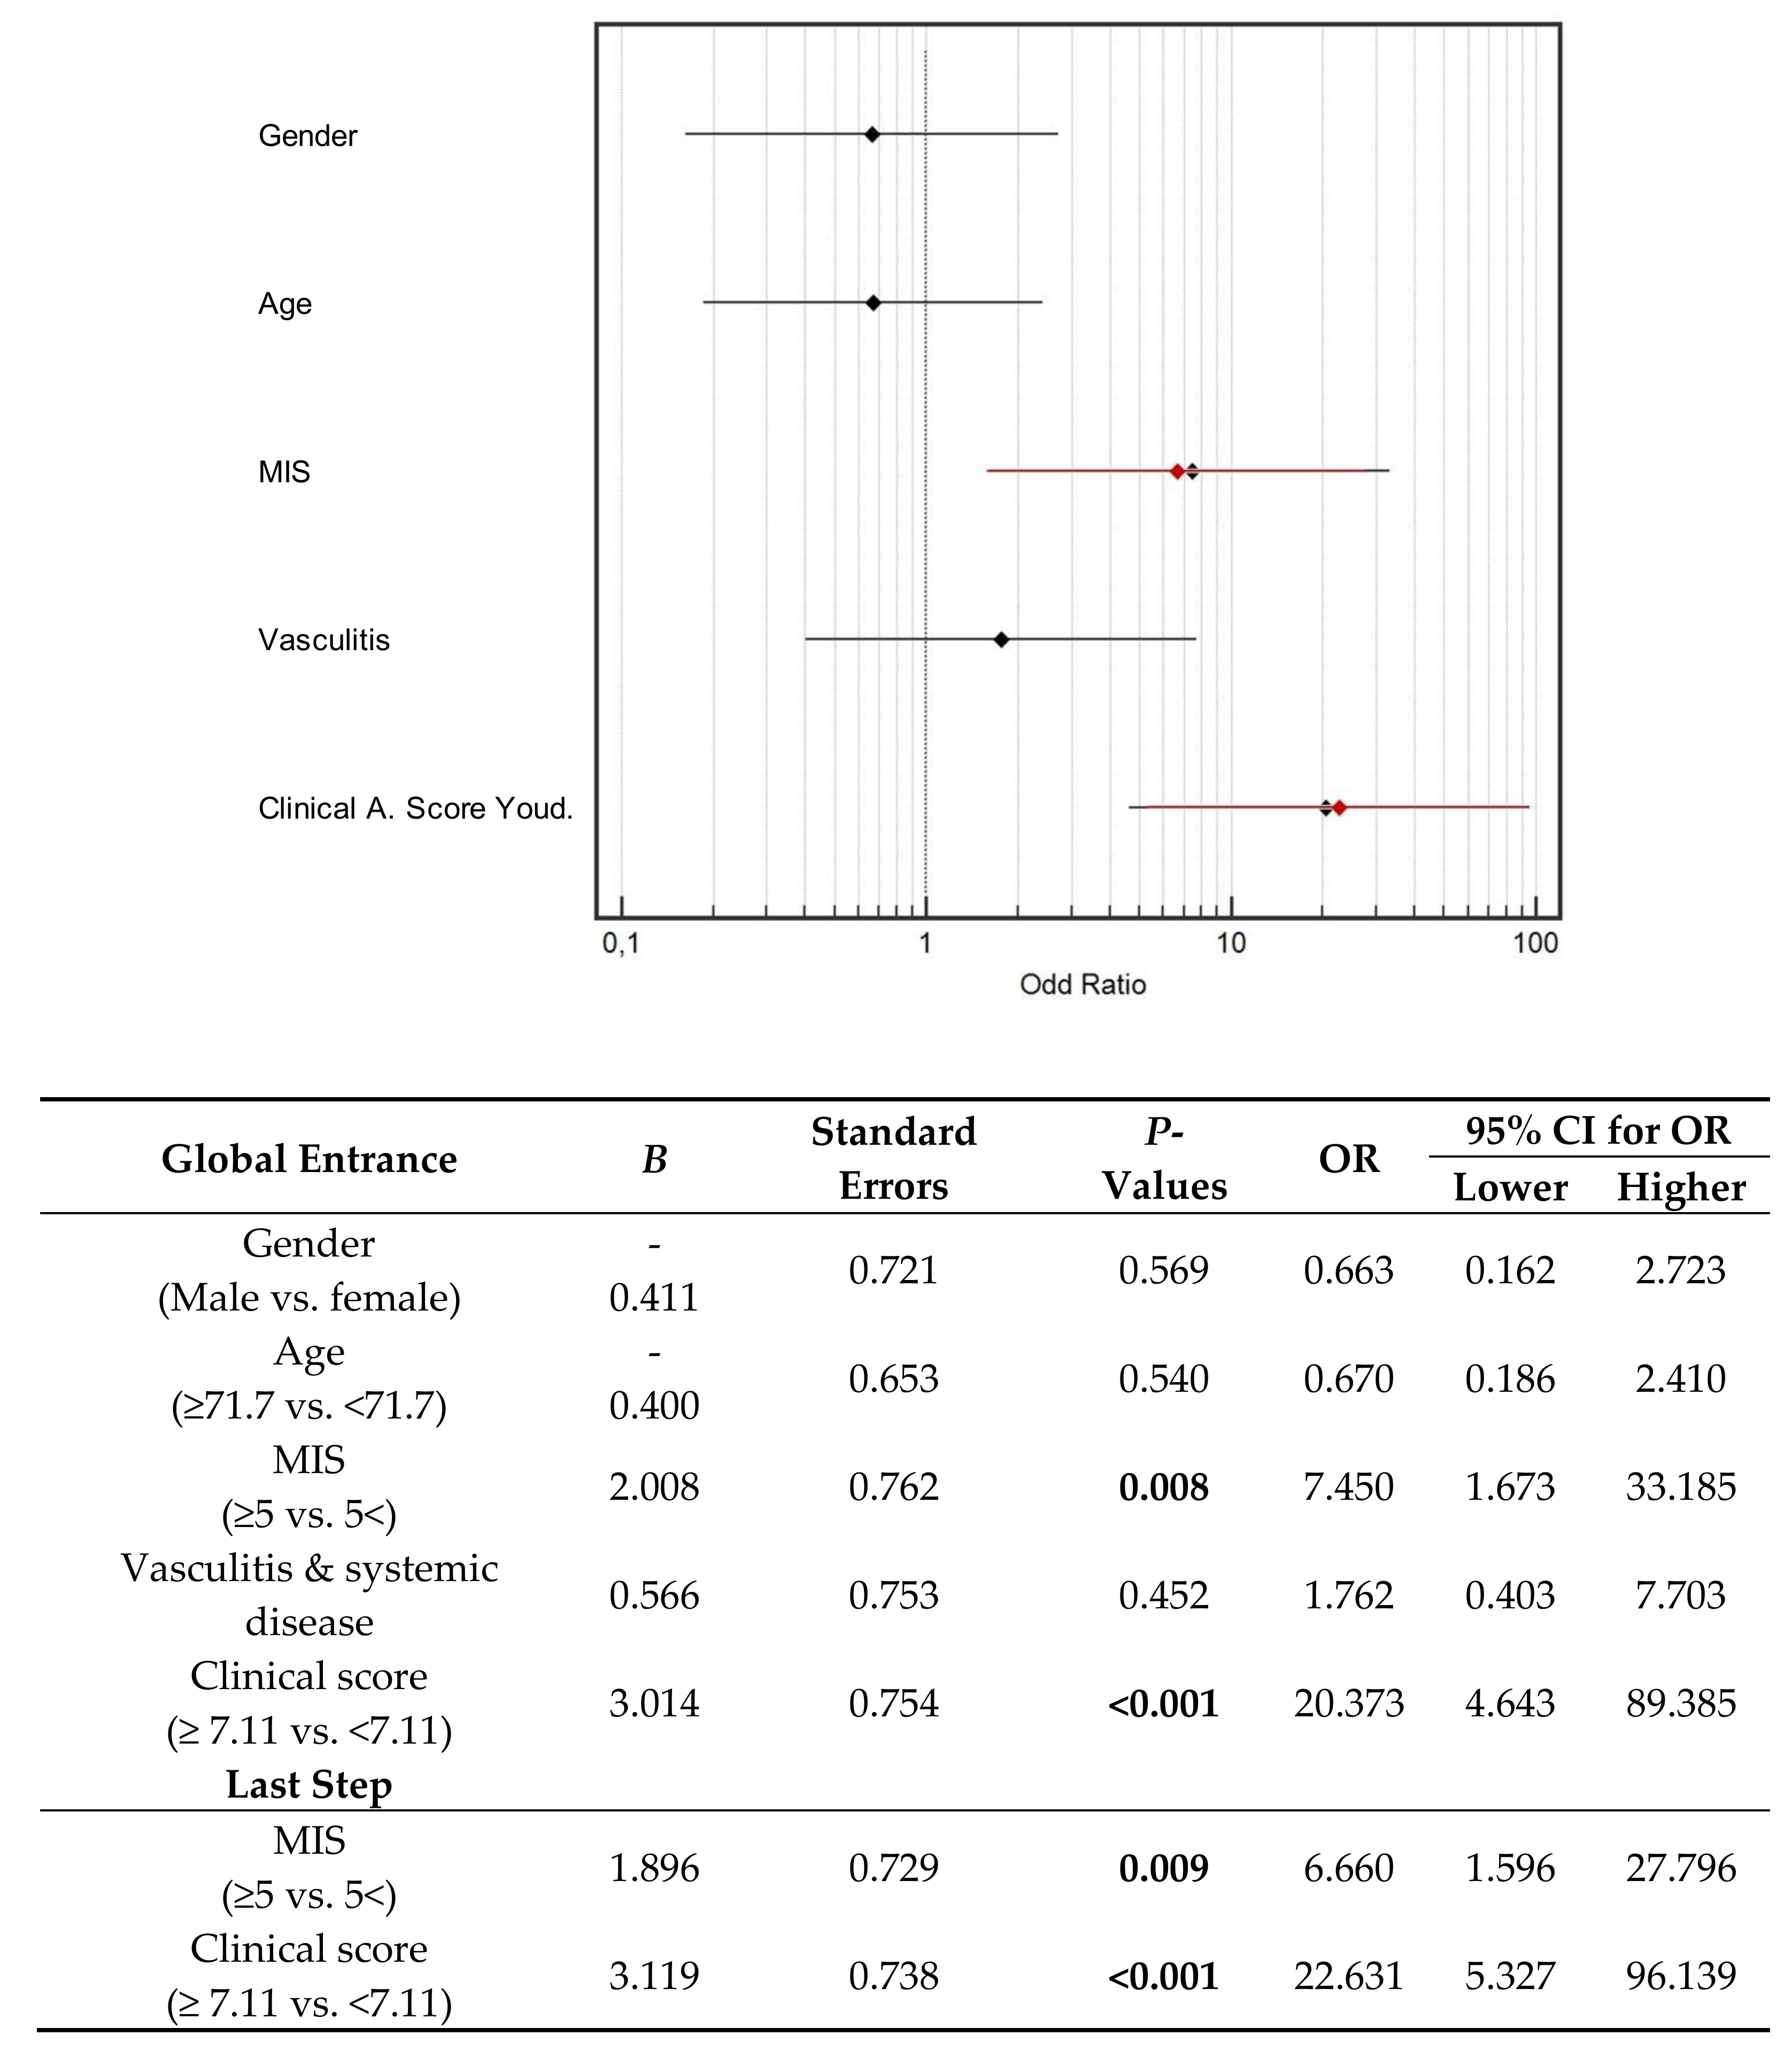
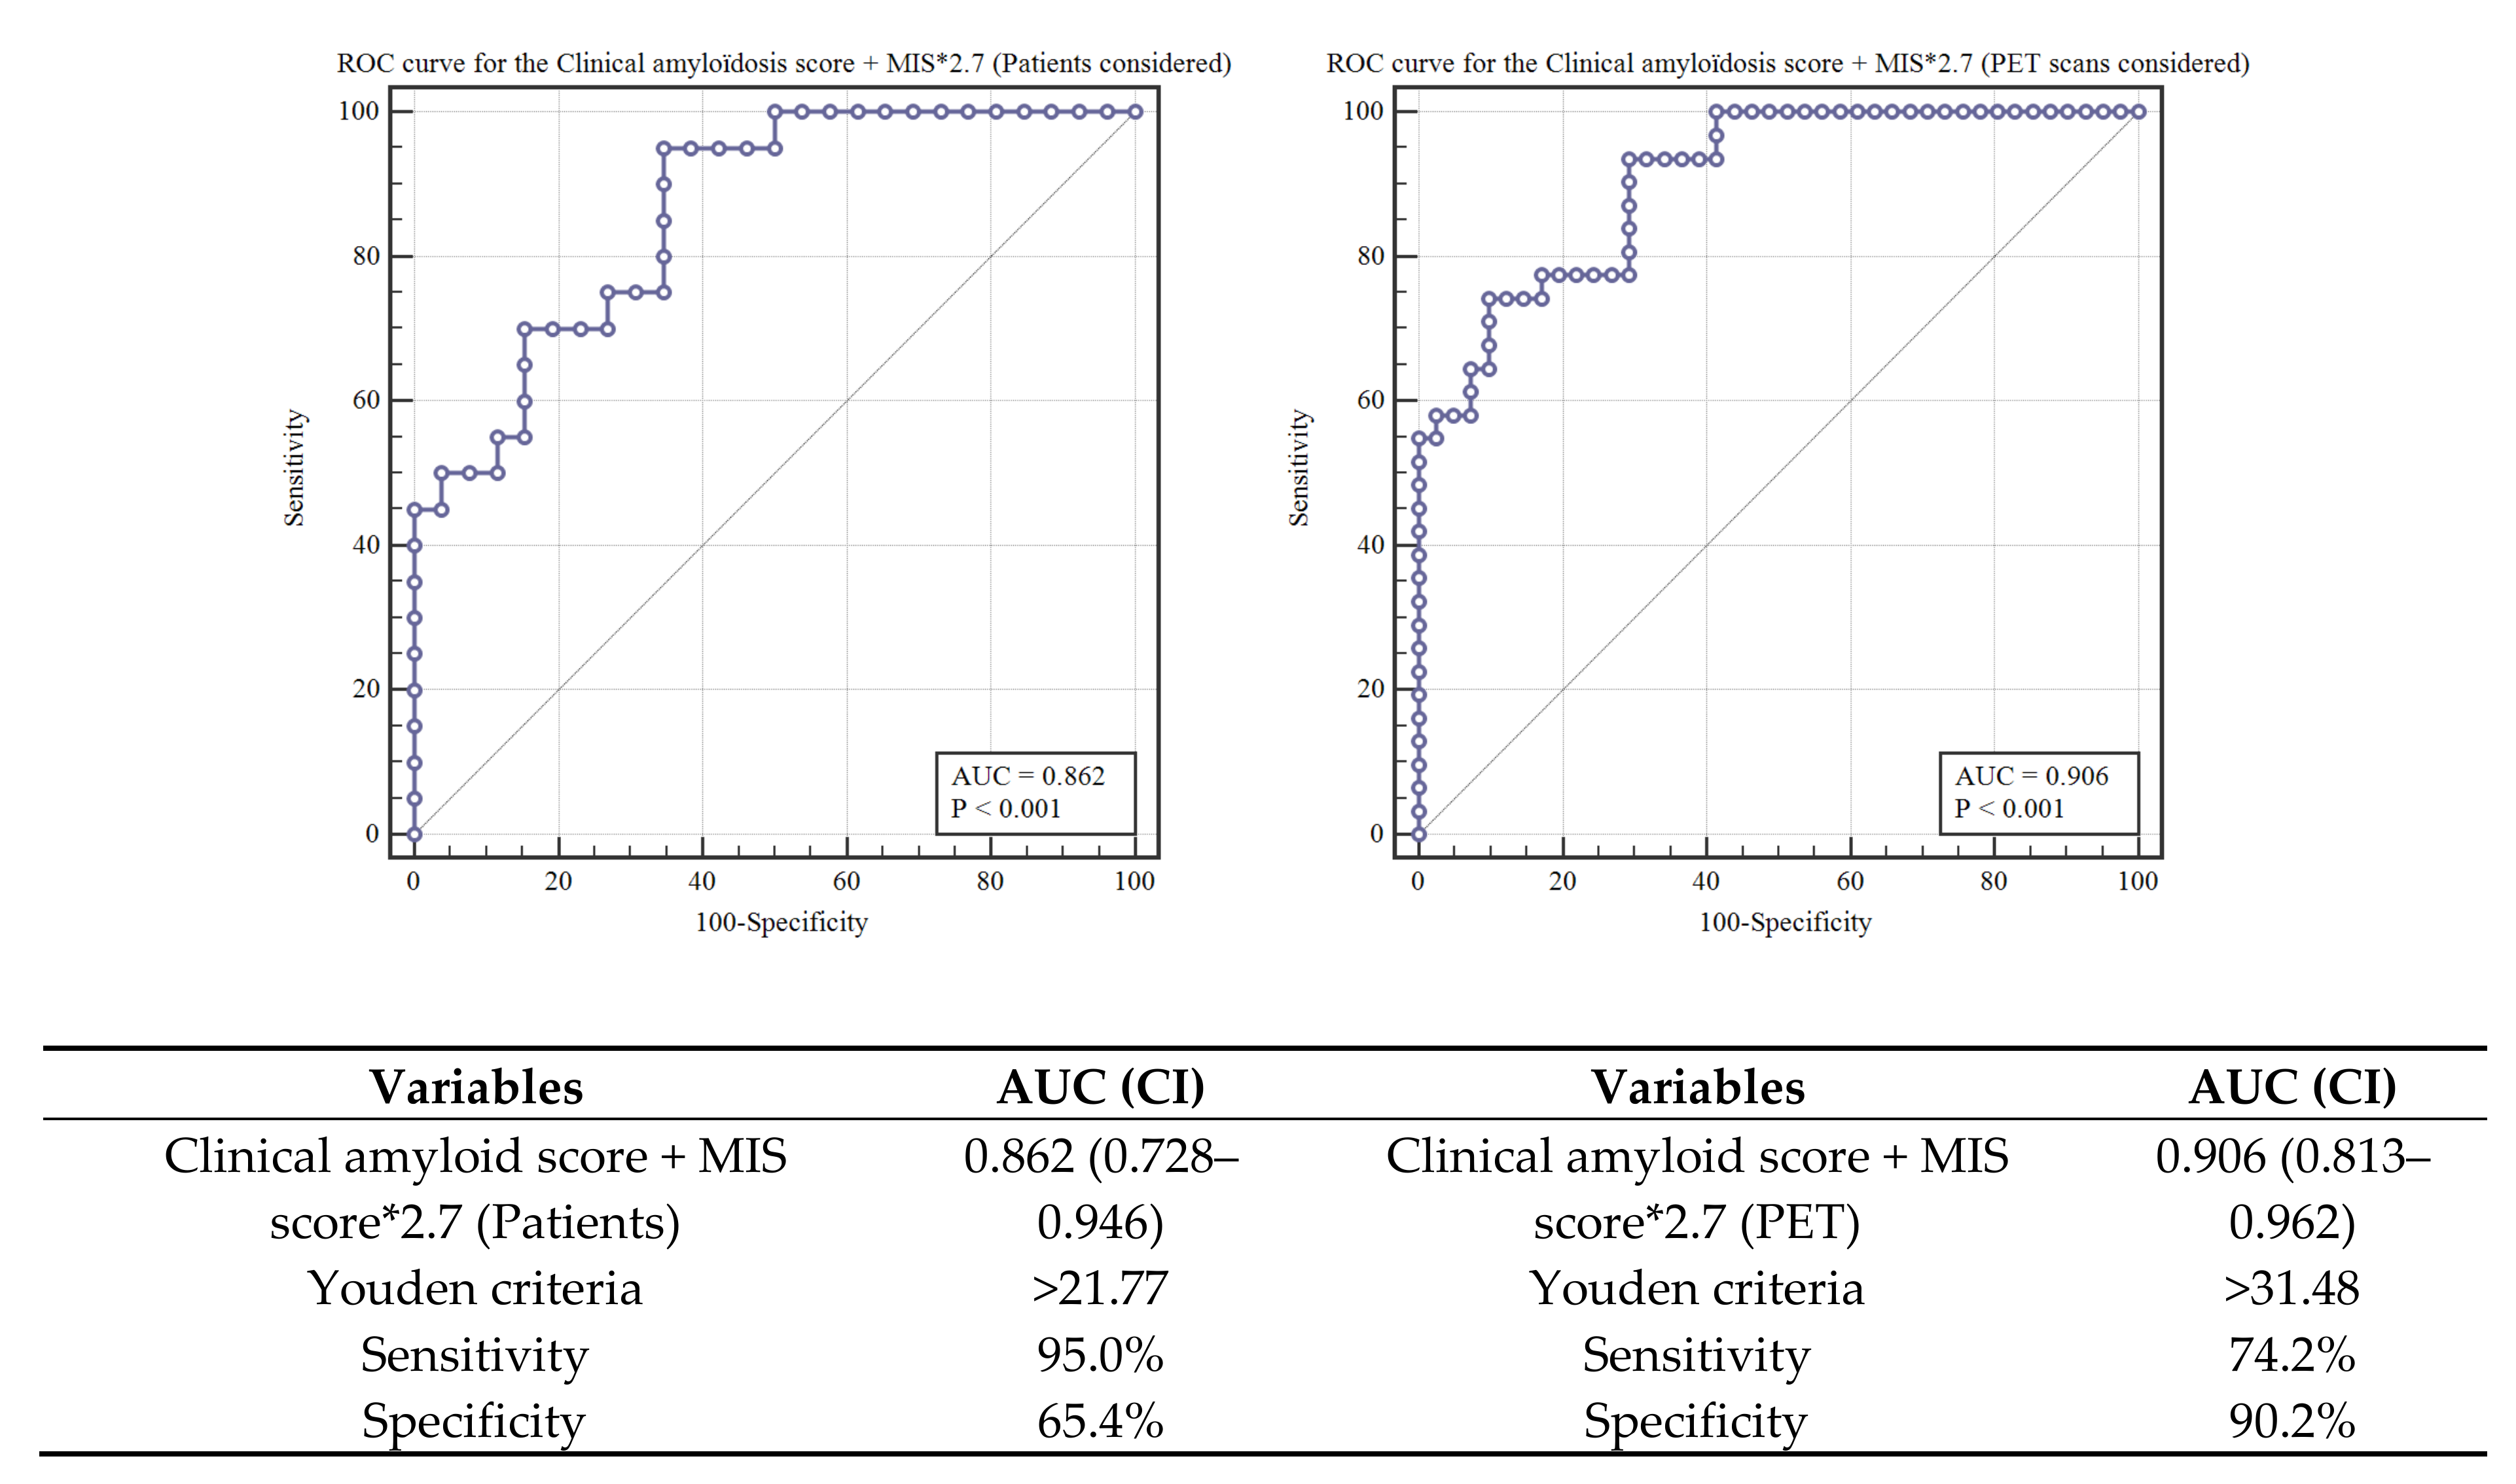
3.5. Prediction Model of “Dialysis-Related” PET Positivity.

Since MIS index and clinical amyloid score are not correlated, by combining them, we tried to build a prediction model that could explain the pattern of PET positivity found in dialysis patients. The best model is depicted in Figure 8: it combines clinical score and MIS score multiplied by a factor of 2.7. The sequential models tested are reported in the on-line only Supplementary Figure S1. The model chosen allows for an AUC of 0.906 (CI: 0.813–0.962; p < 0.001).
Internal validation was assessed by the leave-one-out method (Supplementary Figure S2), which shows a range of AUC from 0.902 to 0.916.

4. Discussion

Dialysis-related amyloidosis is still a complication encountered in patients on long-term dialysis. Even with the best new dialysers and dialysis schema, Beta-2 microglobulin accumulates, since its production, enhanced by inflammation, is higher than its clearance [21,28,34,35,36,42,43,44].
While gold standard diagnosis relies on histologic findings, these are not always available, and therefore, clinical indicators, namely carpal tunnel syndrome or destructive spondylarthropathy, are widely employed [19,20,21,47,48,65].
However, the presence of carpal tunnel or of destructive spondylarthropathy mark an advanced disease stage, and several studies have tried to use imaging data, which could theoretically detect disease in its early stages (21). Imaging data are either non- specific, or, as is the case of scintigraphy for Beta-2 microglobulin, not available in clinical practice (Supplementary Table S1). As a consequence, the natural history of amyloid deposits is not fully known, and the reasons for their phenotypic variability are incompletely understood.
The main result of this study was to identify PET scan, a widely available, standardised technique that is able to detect sites of active inflammation, as an imaging test whose positivity in typical settings of amyloid deposition is closely correlated with carpal tunnel, the proxy of DRA. Interestingly, the pattern of positivity can be superimposed on the one described in Beta-2 microglobulin scintigraphy, to date the most specific imaging test described in the literature [51,52,53,54] (Figure 1). A similar pattern is only rarely observed in PET scans performed in patients who are not on dialysis (Table 1); in addition, in the few cases with normal kidney function, that showed mild involvement of the target joints, the pattern of involvement of the joints was different. In fact, it was unilateral in most patients with normal kidney function, whereas in dialysis patients several joints are usually involved, albeit often with different intensity, a point that may help refine the differential diagnosis at imaging; the presence of a diffuse but often semi-circular pattern, found exclusively in dialysis patients in our series, may also represent a feature pointing to DRA (Table 1, Figure 1).
The relationship between positivity at PET scan and DRA is suggested by the close correlation between the presence of carpal tunnel and a positive scan (7/7 cases, 14/15 scans), and by the significant relationship between PET positivity and exposure to dialysis (Table 3 and Table 4, Figure 3).
After confirming the relationship between presence of carpal tunnel and positive PET scan, we tried to explain the positivity at PET scan found in cases without carpal tunnel. To do so, we considered PET scan positivity as the dependent variable, and tested a series of clinical items, correlated with amyloid deposition, as explanatory variables (Table 2, Table 3 and Table 4, Figure 3 and Figure 4).
The main finding is the relationship between PET positivity and malnutrition inflammation score (Figure 3 and Figure 4). The latter, unlike markers of inflammation or of nutrition, identifies patients who present a chronic picture combining morbidity, usually with cardiovascular involvement, and malnutrition [62,63,66]. These patients have been shown to run a higher risk of accelerated deposition of Beta-2 microglobulin amyloid fibrils in previous pivotal studies [27,28].
To further refine our analysis using ROC curves, we built a continuous “clinical amyloid score”, based upon exposure to dialysis and presence of clearly identified sites of amyloid deposition. The high area under the curve allowed us to replace the dichotomous positivity-negativity of carpal tunnel with this continuous score.
The relationship between PET scan result and amyloid score is significant with an area under the curve (AUC) over 70% (Figure 6). It should be noted that the Youden score is set at a clinical amyloid score of 7.1, suggesting that exposure to over 7 years of dialysis is associated with a significant increase in articular inflammation consistent with amyloid deposition (Figure 6).
While exposure to dialysis is the element most closely correlated to amyloid deposition, inflammation is second, and not surprisingly, positivity at PET scan is significantly associated with MIS ( Figure 4 and Figure 5); the AUC of the ROC curve is of the same entity as the previous one (over 0.75, Figure 7).
Since MIS and amyloid score are not significantly correlated, we hypothesized that dialysis vintage and malnutrition-inflammation had an additive effect in the development of dialysis-related amyloidosis and we combined the two, resulting in an AUC of over 0.85 (Figure 8).
Internal validation confirmed the correctness of the model for the population in our study (Supplementary Figure S2).
Our study has several limitations. First of all, it is a single-centre retrospective study. Secondly, the prediction score which serves to offer a comprehensive explanation of the positivity of PET scan underwent only internal validation.
Thirdly, histologic confirmation of the deposits of Beta-2 microglobulin was available only in patients who underwent carpal tunnel or other surgeries, while in other cases, no morphologic confirmation, which could have been relevant in the early cases, was available. This limit is shared by virtually all the large studies on DRA, and is difficult to overcome as it involves subjecting patients undergoing dialysis, a time-consuming and intrusive treatment, to another invasive procedure, such as synovial biopsy [66,67,68]. This could be avoided if effective treatments were available, including anti-coiling agents, such as doxycycline, occasionally reported have good results in alleviating pain in DRA, or specific absorption columns, available in Japan, but not in Europe, partly on account of their high costs [69,70,71,72,73].
From the imaging point of view, since the tests were done for other purposes than identifying Beta-2 microglobulin deposits, no attempt to identify the best protocol and timing for acquisition was found. It is hoped that knowing that this limit exists will encourage others to perform a targeted prospective study.
Furthermore, even joint involvement suggestive of a metastatic disease was not found in dialysis patients tested in the presence of active neoplasia, a paraneoplastic arthropathy couldn’t be formally excluded. The interpretation that systemic inflammation favors Beta-2-amyloid deposition, which we consider more likely, needs formal confirmation in further studies.

5. Conclusions

In conclusion, our study strongly suggests that PET scan makes it possible to identify patients with well-established amyloid deposits, as witnessed by the presence of carpal tunnel, and by association with a long dialysis vintage; these cases are associated with chronic inflammation at several large joints.
The study also indicates that PET scan is useful in detecting cases in which rapid deposition occurs, in the context of phases of intense inflammation. This finding, which needs formal histologic confirmation, could open new perspectives in the study of DRA and focus attention on inflammation, as a potential therapeutic target in retarding DRA.

Supplementary Materials

Author Contributions

Conceptualization, G.B.P. and V.A. and C.B.; methodology, G.B.P. and P.S. and A.C.; software, A.C.; validation, D.P. and E.P. and M.H.; formal analysis, A.C. and P.S.; investigation, G.S. and E.C. and V.C. and L.G. and L.N. and F.C.; data curation, P.S. and A.C.; writing—original draft preparation, G.B.P.; writing—review and editing, G.B.P. and G.S. and E.C. and V.C. and F.C.; supervision, C.B. and V.A.

Funding

No funding was received for this study; publication fees are supported by the Centre Hospitalier Le Mans.

Acknowledgments

The first three authors and the last three authors contributed equally to the paper; To Susan Finnel for her careful language correction.

Conflicts of Interest

The authors declare no conflict of interest.

References

  1. Owen, W.F.; Madore, F.; Brenner, B.M. An observational study of cardiovascular characteristics of long-term end-stage renal disease survivors. Am. J. Kidney Dis. 1996, 28, 931–936. [Google Scholar] [CrossRef]
  2. Bazzi, C.; Arrigo, G.; Luciani, L.; Casazza, F.; Saviotti, M.; Malaspina, D.; Bonucci, E.; Ballanti, P.; Amaducci, S.; Lattuada, P.; et al. Clinical features of 24 patients on regular hemodialysis treatment (RDT) for 16–23 years in a single unit. Clin. Nephrol. 1995, 44, 96–107. [Google Scholar] [PubMed]
  3. Harris, S.A.C.; Brown, A. Patients surviving more than 10 years on hemodialysis. The natural history of the complications of treatment. Nephrol. Dial. Tranplant. 1998, 13, 1226–1233. [Google Scholar] [CrossRef] [PubMed]
  4. Otsubo, S.; Otsubo, K.; Sugimoto, H.; Ueda, S.; Otsubo, Y.; Otsubo, O.; Yajima, A.; Yagi, S.; Kataoka, H.; Iwasaki, T.; et al. Characteristics of patients on hemodialysis therapy for more than 30 years. Ther. Apher. Dial. 2007, 11, 274–279. [Google Scholar] [CrossRef]
  5. Piccoli, G.B.; Mezza, E.; Anania, P.; Iadarola, A.M.; Vischi, M.; Torazza, M.C.; Fop, F.; Guarena, C.; Martina, G.; Messina, M.; et al. Patients on renal replacement therapy for 20 or more years: A clinical profile. Nephrol. Dial. Transplant. 2002, 17, 1440–1449. [Google Scholar] [CrossRef] [PubMed]
  6. Davison, A.M. Editorial: Complications arising in patients on long-term hemodialysis. Kidney Int. 1993, 43 (Suppl. 41), S40–S41. [Google Scholar]
  7. Levey, A.S.; Eknoyan, G. Cardiovascular disease in chronic renal disease. Nephrol. Dial. Transplant. 1999, 4, 828–833. [Google Scholar] [CrossRef]
  8. Warren, D.J.; Otieno, L.S. Carpal tunnel syndrome in patients on intermittent haemodialysis. Postgrad. Med. J. 1975, 51, 450–452. [Google Scholar] [CrossRef] [Green Version]
  9. Koch, K.M. Dialysis-related amyloidosis. Kidney Int. 1992, 41, 1416–1429. [Google Scholar] [CrossRef] [Green Version]
  10. Danesh, F.; Ho, L.T. Dialysis-related amyloidosis: History and clinical manifestations. Semin. Dial. 2001, 14, 80–85. [Google Scholar] [CrossRef]
  11. Bardin, T.; Zingraff, J.; Kuntz, D.; Drüeke, T. Dialysis-related amyloidosis. Nephrol. Dial. Transplant. 1986, 1, 151–154. [Google Scholar] [PubMed]
  12. Dember, L.M.; Jaber, B.L. Dialysis-related amyloidosis: Late finding or hidden epidemic? Semin. Dial. 2006, 19, 105–109. [Google Scholar] [CrossRef] [PubMed]
  13. Scarpioni, R.; Ricardi, M.; Albertazzi, V.; De Amicis, S.; Rastelli, F.; Zerbini, L. Dialysis-related amyloidosis: Challenges and solutions. Int. J. Nephrol. Renovasc. Dis. 2016, 9, 319–328. [Google Scholar] [CrossRef] [PubMed]
  14. Otsubo, S.; Kimata, N.; Okutsu, I.; Oshikawa, K.; Ueda, S.; Sugimoto, H.; Mitobe, M.; Uchida, K.; Otsubo, K.; Nitta, K.; et al. Characteristics of dialysis-related amyloidosis in patients on haemodialysis therapy for more than 30 years. Nephrol. Dial. Transplant. 2009, 24, 1593–1598. [Google Scholar] [CrossRef] [PubMed]
  15. Fenves, A.Z.; Emmett, M.; White, M.G.; Greenway, G.; Michaels, D.B. Carpal tunnel syndrome with cystic bone lesions secondary to amyloidosis in chronic hemodialysis patients. Am. J. Kidney Dis. 1986, 7, 130–134. [Google Scholar] [CrossRef]
  16. Nakazawa, R.; Hamaguchi, K.; Hosaka, E.; Shishido, H.; Yokoyama, T. Synovial amyloidosis of beta 2-microglobulin type in patients undergoing long-term hemodialysis. Nephron 1986, 44, 379–380. [Google Scholar] [CrossRef] [PubMed]
  17. Gejyo, F.; Homma, N.; Suzuki, Y.; Arakawa, M. Serum levels of beta 2-microglobulin as a new form of amyloid protein in patients undergoing long-term hemodialysis. N. Engl. J. Med. 1986, 314, 585–586. [Google Scholar]
  18. Zingraff, J.J.; Noel, L.H.; Bardin, T.; Atienza, C.; Zins, B.; Drueke, T.B.; Kuntz, D. Beta 2 microglobulin amyloidosis in chronic renal failure. N. Engl. J. Med. 1990, 323, 1070–1071. [Google Scholar]
  19. Drüeke, T.B. Beta2-microglobulin and amyloidosis. Nephrol. Dial. Transplant. 2000, 15 (Suppl. 1), 17–24. [Google Scholar] [CrossRef]
  20. Drüeke, T.B.; Massy, Z.A. Beta2-microglobulin. Semin. Dial. 2009, 22, 378–380. [Google Scholar] [CrossRef]
  21. Jadoul, M.; Drüeke, T.B. β2 microglobulin amyloidosis: An update 30 years later. Nephrol. Dial. Transplant. 2016, 31, 507–509. [Google Scholar] [CrossRef] [PubMed]
  22. Gorevic, P.D.; Casey, T.T.; Stone, W.J.; DiRaimondo, C.R.; Prelli, F.C.; Frangione, B. Beta-2 microglobulin is an amyloidogenic protein in man. J. Clin. Investig. 1985, 76, 2425–2429. [Google Scholar] [CrossRef] [PubMed]
  23. Shirahama, T.; Skinner, M.; Cohen, A.S.; Gejyo, F.; Arakawa, M.; Suzuki, M.; Hirasawa, Y. Histochemical and immunohistochemical characterization of amyloid associated with chronic hemodialysis as beta 2-microglobulin. Lab. Investig. 1985, 53, 705–709. [Google Scholar] [PubMed]
  24. Jimenez, R.E.; Price, D.A.; Pinkus, G.S.; Owen, W.F., Jr.; Lazarus, J.M.; Kay, J.; Turner, J.R. Development of gastrointestinal beta2-microglobulin amyloidosis correlates with time on dialysis. Am. J. Surg. Pathol. 1998, 22, 729–735. [Google Scholar] [CrossRef] [PubMed]
  25. Gal, R.; Korzets, A.; Schwartz, A.; Rath-Wolfson, L.; Gafter, U. Systemic distribution of beta 2-microglobulin-derived amyloidosis in patients who undergo long-term hemodialysis. Report of seven cases and review of the literature. Arch. Pathol. Lab. Med. 1994, 118, 718–721. [Google Scholar] [PubMed]
  26. Kuntz, D.; Naveau, B.; Bardin, T.; Drueke, T.; Treves, R.; Dryll, A. Destructive spondylarthropathy in hemodialyzed patients. A new syndrome. Arthritis Rheum. 1984, 27, 369–375. [Google Scholar] [CrossRef] [PubMed]
  27. Floege, J.; Schäffer, J.; Koch, K.M.; Shaldon, S. Dialysis related amyloidosis: A disease of chronic retention and inflammation? Kidney Int. Suppl. 1992, 38, S78–S85. [Google Scholar] [PubMed]
  28. Canaud, B.; Morena, M.; Cristol, J.P.; Krieter, D. Beta2-microglobulin, a uremic toxin with a double meaning. Kidney Int. 2006, 69, 1297–1299. [Google Scholar] [CrossRef]
  29. Bommer, J.; Jaber, B.L. Ultrapure dialysate: Facts and myths. Semin. Dial. 2006, 19, 115. [Google Scholar] [CrossRef]
  30. Di Iorio, B.; Di Micco, L.; Bruzzese, D.; Nardone, L.; Russo, L.; Formisano, P.; D’Esposito, V.; Russo, D. Ultrapure dialysis water obtained with additional ultrafilter may reduce inflammation in patients on hemodialysis. J. Nephrol. 2017, 30, 795–801. [Google Scholar] [CrossRef]
  31. Labriola, L.; Jadoul, M. Dialysis-related Amyloidosis: Is It Gone or Should It Be? Semin. Dial. 2017, 30, 193–196. [Google Scholar] [CrossRef] [PubMed]
  32. Argiles, A.; Mourad, G.; Berta, P.; Polito, C.; Canaud, B.; Robinet-Levy, M.; Mion, C. Dialysis-associated amyloidosis in a patient on long-term post-dilutional hemofiltration. Nephron 1987, 46, 96–97. [Google Scholar] [CrossRef] [PubMed]
  33. Kay, J. Beta 2-microglobulin amyloidosis in renal failure: Understanding this recently recognized condition. Cleve Clin. J. Med. 1999, 66, 145–147. [Google Scholar] [PubMed]
  34. Canaud, B.; Assounga, A.; Flavier, J.L.; Slingeneyer, A.; Aznar, R.; Robinet-Levy, M.; Mion, C. Beta-2 microglobulin serum levels in maintenance dialysis. What does it mean? ASAIO Trans. 1988, 34, 923–929. [Google Scholar] [PubMed]
  35. Hauglustaine, D.; Waer, M.; Michielsen, P.; Goebels, J.; Vandeputte, M. Haemodialysis membranes, serum beta 2-microglobulin, and dialysis amyloidosis. Lancet 1986, 24, 1211–1212. [Google Scholar] [CrossRef]
  36. Kaneko, S.; Yamagata, K. Hemodialysis-related amyloidosis: Is it still relevant? Semin. Dial. 2018, 31, 612–618. [Google Scholar] [CrossRef] [PubMed] [Green Version]
  37. Feldreich, T.; Nowak, C.; Fall, T.; Carlsson, A.C.; Carrero, J.J.; Ripsweden, J.; Qureshi, A.R.; Heimbürger, O.; Barany, P.; Stenvinkel, P.; et al. Circulating proteins as predictors of cardiovascular mortality in end-stage renal disease. J. Nephrol. 2019, 32, 111–119. [Google Scholar] [CrossRef] [PubMed]
  38. De Mauri, A.; Vidali, M.; Chiarinotti, D.; Bellomo, G.; Rolla, R. Lipoprotein-associated phospholipase A2 predicts cardiovascular events in dialyzed patients. J. Nephrol. 2019, 32, 283–288. [Google Scholar] [CrossRef] [PubMed]
  39. Massy, Z.A.; Liabeuf, S. Middle-Molecule Uremic Toxins and Outcomes in Chronic Kidney Disease. Contrib. Nephrol. 2017, 191, 8–17. [Google Scholar] [PubMed]
  40. Vanholder, R.; Van Laecke, S.; Glorieux, G. The middle-molecule hypothesis 30 years after: Lost and rediscovered in the universe of uremic toxicity? J. Nephrol. 2008, 21, 146–160. [Google Scholar] [PubMed]
  41. Vanholder, R.; Eloot, S.; Van Biesen, W. Do we need new indicators of dialysis adequacy based on middle-molecule removal? Nat. Clin. Pract. Nephrol. 2008, 4, 174–175. [Google Scholar] [CrossRef] [PubMed]
  42. Brunati, C.C.M.; Gervasi, F.; Cabibbe, M.; Ravera, F.; Menegotto, A.; Querques, M.; Colussi, G. Single Session and Weekly Beta 2-Microglobulin Removal with Different Dialytic Procedures: Comparison between High-Flux Standard Bicarbonate Hemodialysis, Post-Dilution Hemodiafiltration, Short Frequent Hemodialysis with NxStage Technology and Automated Peritoneal Dialysis. Blood Purif. 2019, 48, 86–96. [Google Scholar] [PubMed]
  43. Roumelioti, M.E.; Trietley, G.; Nolin, T.D.; Ng, Y.H.; Xu, Z.; Alaini, A.; Figueroa, R.; Unruh, M.L.; Argyropoulos, C.P. Beta-2 microglobulin clearance in high-flux dialysis and convective dialysis modalities: A meta-analysis of published studies. Nephrol. Dial. Transplant. 2018, 33, 1025–1039. [Google Scholar] [CrossRef] [PubMed]
  44. Hoshino, J.; Yamagata, K.; Nishi, S.; Nakai, S.; Masakane, I.; Iseki, K.; Tsubakihara, Y. Significance of the decreased risk of dialysis-related amyloidosis now proven by results from Japanese nationwide surveys in 1998 and 2010. Nephrol. Dial. Transplant. 2016, 31, 595–602. [Google Scholar] [CrossRef] [PubMed]
  45. Bataille, S.; Fernandez, C.; Zink, J.V.; Brunet, P.; Berland, Y.; Burtey, S. The Case|A hip fracture in a hemodialysis patient. Pathologic right-hip fracture from β2-microglobulin amyloidosis. Kidney Int. 2013, 83, 1211–1212. [Google Scholar] [CrossRef]
  46. Kazama, J.J.; Yamamoto, S.; Wakasugi, M.; Narita, I. A hip fracture in a dialysis patient with Aβ2M amyloidosis. Kidney Int. 2014, 85, 214–215. [Google Scholar] [CrossRef]
  47. Hoshino, J.; Yamagata, K.; Nishi, S.; Nakai, S.; Masakane, I.; Iseki, K.; Tsubakihara, Y. Carpal tunnel surgery as proxy for dialysis-related amyloidosis: Results from the Japanese society for dialysis therapy. Am. J. Nephrol. 2014, 39, 449–458. [Google Scholar] [CrossRef]
  48. Hoshino, J.; Kawada, M.; Imafuku, A.; Mise, K.; Sumida, K.; Hiramatsu, R.; Hasegawa, E.; Hayami, N.; Yamanouchi, M.; Suwabe, T.; et al. A clinical staging score to measure the severity of dialysis-related amyloidosis. Clin. Exp. Nephrol. 2016, 21, 300–306. [Google Scholar] [CrossRef]
  49. Ketteler, M.; Koch, K.M.; Floege, J. Imaging techniques in the diagnosis of dialysis-related amyloidosis. Semin. Dial. 2001, 14, 90–93. [Google Scholar] [CrossRef]
  50. Schaeffer, J.; Floege, J.; Koch, K.M. Diagnostic aspects of beta 2-microglobulin amyloidosis. Nephrol. Dial. Transplant. 1996, 11 (Suppl. 2), 144–146. [Google Scholar] [CrossRef]
  51. Floege, J.; Schäffer, J.; Koch, K.M. Scintigraphic methods to detect beta 2-microglobulin associated amyloidosis (Abeta2-microglobulin amyloidosis). Nephrol. Dial. Transplant. 2001, 16 (Suppl. 4), 12–16. [Google Scholar] [CrossRef] [PubMed]
  52. Tan, S.Y.; Baillod, R.; Brown, E.; Farrington, K.; Soper, C.; Percy, M.; Clutterbuck, E.; Madhoo, S.; Pepys, M.B.; Hawkins, P.N. Clinical, radiological and serum amyloid P component scintigraphic features of beta 2-microglobulin amyloidosis associated with continuous ambulatory peritoneal dialysis. Nephrol Dial. Transplant. 1999, 14, 1467. [Google Scholar] [CrossRef]
  53. Yen, T.C.; Tzen, K.Y.; Chen, K.S.; Tsai, C.J. The value of gallium-67 and thallium-201 whole-body and single-photon emission tomography images in dialysis-related beta 2-microglobulin amyloid. Eur. J. Nucl. Med. 2000, 27, 56–61. [Google Scholar] [CrossRef] [PubMed]
  54. Schäffer, J.; Burchert, W.; Floege, J.; Gielow, P.; Kionka, C.; Linke, R.P.; Weiss, E.H.; Shaldon, S.; Koch, K.M. Recombinant versus natural human 111In-beta 2-microglobulin for scintigraphic detection of A beta 2-amyloid in dialysis patients. Kidney Int. 2000, 58, 873–880. [Google Scholar] [CrossRef] [PubMed]
  55. Kiss, E.; Keusch, G.; Zanetti, M.; Jung, T.; Schwarz, A.; Schocke, M.; Jaschke, W.; Czermak, B.V. Dialysis-related amyloidosis revisited. Am. J. Roentgenol. 2005, 185, 1460–1467. [Google Scholar] [CrossRef] [PubMed]
  56. Kecler-Pietrzyk, A.; Kok, H.K.; Lyburn, I.D.; Torreggiani, W.C. Dialysis related amyloidarthropathy on FDG PET-CT. Ulster Med. J. 2014, 83, 117–118. [Google Scholar] [PubMed]
  57. Piccoli, G.B.; Hachemi, M.; Molfino, I.; Coindre, J.P.; Boursot, C. Doxycycline treatment in dialysis related amyloidosis: Discrepancy between antalgic effect and inflammation, studied with FDG-positron emission tomography: A case report. BMC Nephrol. 2017, 18, 28. [Google Scholar] [CrossRef]
  58. Piccoli, G.B.; Cabiddu, G.; Moio, M.R.; Fois, A.; Cao, R.; Molfino, I.; Kaniassi, A.; Lippi, F.; Froger, L.; Pani, A.; et al. Efficiency and nutritional parameters in an elderly high risk population on hemodialysis and hemodiafiltration in Italy and France: Different treatments with similar names? BMC Nephrol. 2018, 19, 171. [Google Scholar] [CrossRef]
  59. Piccoli, G.B.; Nielsen, L.; Gendrot, L.; Fois, A.; Cataldo, E.; Cabiddu, G. Prescribing Hemodialysis or Hemodiafiltration: When One Size Does Not Fit All the Proposal of a Personalized Approach Based on Comorbidity and Nutritional Status. J. Clin. Med. 2018, 7, 331. [Google Scholar] [CrossRef]
  60. Charlson, M.E.; Pompei, P.; Ales, K.L.; MacKenzie, C.R. A new method of classifying prognostic comorbidity in longitudinal studies: Development and validation. J. Chronic Dis. 1987, 40, 373–383. [Google Scholar] [CrossRef]
  61. Enia, G.; Sicuso, C.; Alati, G.; Zoccali, C. Subjective global assessment of nutrition in dialysis patients. Nephrol. Dial. Transplant. 1993, 8, 1094–1098. [Google Scholar] [PubMed]
  62. Kalantar-Zadeh, K.; Kopple, J.D.; Block, G.; Humphreys, M.H. A malnutrition-inflammation score is correlated with morbidity and mortality in maintenance hemodialysis patients. Am. J. Kidney Dis. 2001, 38, 1251–1263. [Google Scholar] [CrossRef] [PubMed]
  63. Spatola, L.; Finazzi, S.; Calvetta, A.; Reggiani, F.; Morenghi, E.; Santostasi, S.; Angelini, C.; Badalamenti, S.; Mugnai, G. Subjective Global Assessment-Dialysis Malnutrition Score and cardiovascular risk in hemodialysispatients: An observational cohort study. J. Nephrol. 2018, 31, 757–765. [Google Scholar] [CrossRef] [PubMed]
  64. Molinaro, A.M.; Simon, R.; Pfeiffer, R.M. Prediction error estimation: A comparison of resampling methods. Bioinforma. Oxf. Engl. 2005, 21, 3301–3307. [Google Scholar] [CrossRef] [PubMed]
  65. Nishi, S.; Hoshino, J.; Yamamoto, S.; Goto, S.; Fujii, H.; Ubara, Y.; Motomiya, Y.; Morita, H.; Takaichi, K.; Yamagata, K.; et al. Multicentre cross-sectional study for bone-articular lesions associated with dialysis related amyloidosis in Japan. Nephrology 2018, 23, 640–645. [Google Scholar] [CrossRef]
  66. Tagami, A.; Tomita, M.; Adachi, S.; Tsuda, K.; Yamada, S.; Chiba, K.; Okazaki, N.; Yonekura, A.; Tsujimoto, R.; Kajiyama, S.; et al. Epidemiological survey and risk factor analysis of dialysis-related amyloidosis including destructive spondyloarthropathy, dialysis amyloid arthropathy, and carpal tunnel syndrome. J. Bone Miner. Metab. 2019, 14. [Google Scholar] [CrossRef]
  67. Yamamoto, S.; Kazama, J.J.; Maruyama, H.; Nishi, S.; Narita, I.; Gejyo, F. Patients undergoing dialysis therapy for 30 years or more survive with serious osteoarticular disorders. Clin. Nephrol. 2008, 70, 496–502. [Google Scholar] [CrossRef]
  68. Sigaux, J.; Abdelkefi, I.; Bardin, T.; Laredo, J.D.; Ea, H.K.; UreñaTorres, P.; Cohen-Solal, M. Tendon thickening in dialysis-related joint arthritis is due to amyloid deposits at the surface of the tendon. Jt. Bone Spine 2019, 86, 233–238. [Google Scholar] [CrossRef]
  69. Kuragano, T.; Kida, A.; Yahiro, M.; Nakanishi, T. Clinical Benefit of an Adsorptive Technique for Elderly Long-Term Hemodialysis Patients. Contrib. Nephrol. 2019, 198, 94–102. [Google Scholar]
  70. Giorgetti, S.; Raimondi, S.; Pagano, K.; Relini, A.; Bucciantini, M.; Corazza, A.; Fogolari, F.; Codutti, L.; Salmona, M.; Mangione, P.; et al. Effect of tetracyclines on the dynamics of formation and destructuration of beta 2-microglobulin amyloid fibrils. J. Biol. Chem. 2011, 286, 2121–2131. [Google Scholar] [CrossRef]
  71. Hiyama, E.; Hyodo, T.; Kondo, M.; Otsuka, K.; Honma, T.; Taira, T.; Yoshida, K.; Uchida, T.; Endo, T.; Sakai, T.; et al. Performance of the newer type (Lixelle Type S-15) on direct hemoperfusion beta 2-microglobulin adsorption column for dialysis-related amyloidosis. Nephron 2002, 92, 501–502. [Google Scholar] [CrossRef] [PubMed]
  72. Abe, T.; Uchita, K.; Orita, H.; Kamimura, M.; Oda, M.; Hasegawa, H.; Kobata, H.; Fukunishi, M.; Shimazaki, M.; Abe, T.; et al. Effect of beta(2)-microglobulin adsorption column on dialysis-related amyloidosis. Kidney Int. 2003, 64, 1522–1528. [Google Scholar] [CrossRef] [PubMed]
  73. Kuragano, T.; Inoue, T.; Yoh, K.; Shin, J.; Fujita, Y.; Yoshiya, K.; Kim, J.I.; Sakai, R.; Sekita, K.; Goto, T.; et al. Effectiveness of β(2)-microglobulin adsorption column in treating dialysis-related amyloidosis: A multicenter study. Blood Purif. 2011, 32, 317–322. [Google Scholar] [CrossRef] [PubMed]
Figure 1. (a) clearly positive pattern (patient with long dialysis follow-up, elevated SUV at the shoulder level, with circumferential pattern); (b) negative pattern (control patient without FdG uptake); (c) non-specific pattern (scattered positivity, without circumferential pattern).
Jcm 08 01494 g001
Figure 2. Logistic regression analysis (per PET scan). Outcome: Presence of Carpal Tunnel (Dialysis vintage dichotomised at 10 years. Legend: Gender (Male vs. female); Age (dichotomised at the median ≥71.7 vs. <71.17); MIS (dichotomised at the median ≥5 vs. ≤5); Vasculitis & systemic disease; Dialysis vintage (≥10 years vs. ≤10 years); Backward regression method was used, black squares came from the first step and red squares came from the last step. Correlation matrix did not show a significant correlation between explicative variables. Bold values: statistically significant p values.
Jcm 08 01494 g002
Figure 3. Logistic regression analysis (per PET scan) Outcome: Positive PET scan (Dialysis vintage dichotomised at 10 years). Legend: Gender (Male vs. female); Age (dichotomised at the median ≥71.7 vs. <71.17); MIS (dichotomised at the median ≥5 vs. ≤5); Vasculitis & systemic disease; Dialysis vintage (≥10 years vs. ≤10 years); Backward regression method was used, black squares came from the first step and red squares came from the last step. Correlation matrix did not show a significant correlation between explicative variables. Bold values: statistically significant p values.
Jcm 08 01494 g003
Figure 4. Logistic regression analysis (per PET Scan). Outcome: Positive PET scan (Clinical score dichotomised at Youden score). Legend: Gender (Male vs. female); Age (dichotomised at the median ≥71.7 vs. <71.17); MIS (dichotomised at the median ≥5 vs. ≤5); Vasculitis & systemic disease; Clinical score dichotomised at Youden index (≥7.11 vs. <7.11); Backward regression method was used, black squares came from the first step and red squares came from the last step. Correlation matrix did not show a significant correlation between explicative variables. Bold values: statistically significant p values.
Jcm 08 01494 g004
Figure 5. ROC curve: Performance of clinical amyloid score in prediction of Carpal Tunnel Syndrome.
Jcm 08 01494 g005
Figure 6. ROC curve: Performance of clinical amyloid score in prediction of PET scan results.
Jcm 08 01494 g006
Figure 7. ROC Curve: Performance of MIS score in prediction of PET scan results.
Jcm 08 01494 g007
Figure 8. ROC curve: Performance of a composite score (clinical amyloid score + MIS score*2.7) in prediction of PET scan results.
Jcm 08 01494 g008
Table 1. Main demographic data of the study group (per patient).
Dialysis Patients
(n = 46)
Controls
(n = 218)
P
Age (years), median (min–max)71.7 (33.6–89.2)67.6 (34.8–89.3)0.0179
Sex (% females)54.3%48.6%0.4813
Serum creatinine (µmol/L), median (min-max)Dialysis68 (39–106)-
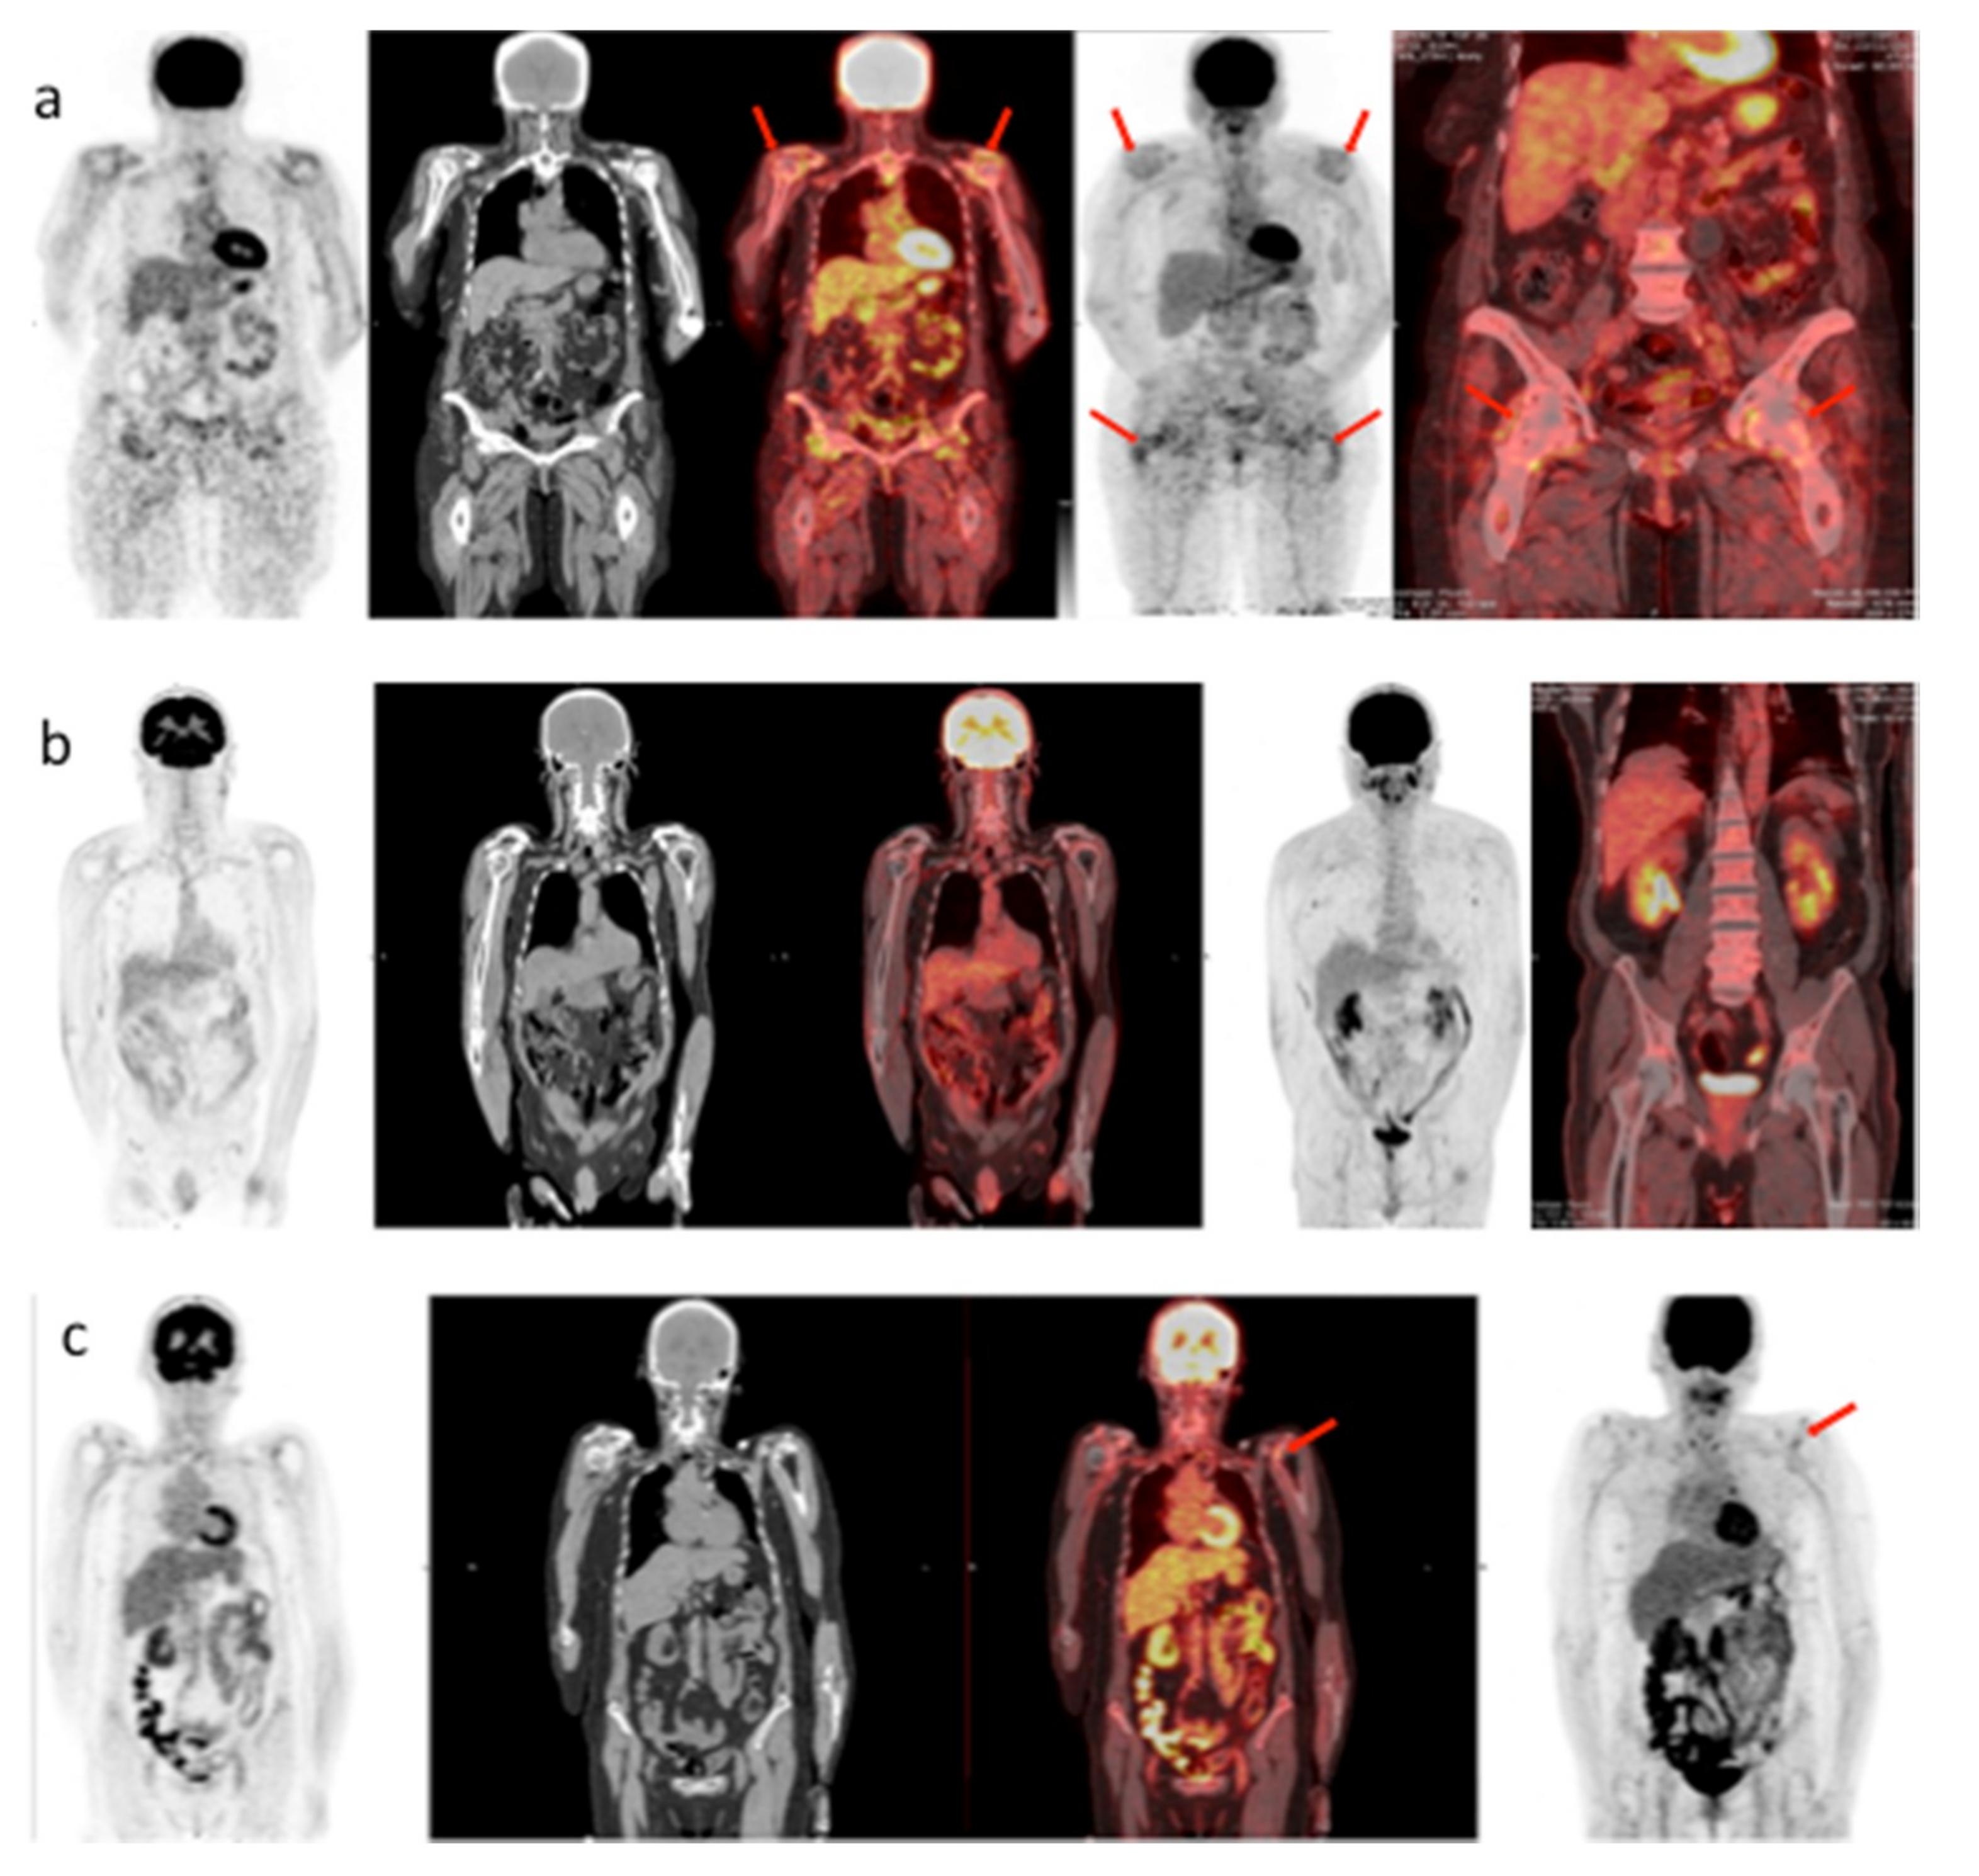
Positive “shoulder and hip pattern” at PET-FDG, n (%) **20 (43.5%)11 (5.0%)<0.0001
Legend: PET-FDG: Positron emission tomography with fluorodesoxyglucose; ** patients who tested positive at least once at PET scan were considered positive in the analysis of dialysis patients. Analysis per PET scan. Dialysis patients only: 31 (43.1%) positive PET scans and 41 (56.9%) negative PET scans. Controls: one PET scan per patient (p < 0.0001). Bold values: statistically significant p values.
Table 2. Main data for dialysis patients.
All Patients (n = 46)All PET Scans (n = 72)
Age (years), median (min–max)71.7 (33.6–89.2)71.1 (33.6–89.2)
Sex, (% female)54.3%54.2%
Cancer, n (%)21 (45.7%)39 (54.2%)
Vasculitis, n (%)12 (26.1%)18 (25.0%)
Dialysis vintage (years), median (min–max)3.7 (0.1–42.1)3.4 (0.1–42.1)
Kidney transplant, n (%)6 (13.0%)11 (15.3%)
Kt/V, mean (±SD)1.48 (±0.36)1.49 (±0.33)
Albumin (g/L), mean (±SD)32.7 (±4.3)32.9 (±4.32)
Beta-2 microglobulin, mean (±SD)27.5 (±9.1)27.0 (±8.3)
Charlson Comorbidity Index, median (min-max)9 (3–12)9 (3–12)
MIS, median (min–max)8 (3–19)7 (3–19)
SGAA, (%)63.0%66.7%
B, (%)30.4%26.4%
C, (%)6.6%6.9%
PET-FDG positive, n (%)20 (43.5%)31 (41.3%)
Carpal Tunnel positive, n (%)7 (15.2%)15 (20.8%)
Legend: PET-FDG: Positron emission tomography with fluorodesoxyglucose; SGA: Subjective global assessment: A: well nourished; B: moderate malnutrition; C: severe malnutrition.
Table 3. Dialysis patients: data sorted according to presence of carpal tunnel (C.T.).
Patients Considered PET Scans Considered
C.T. Positive (n = 7)C.T. Negative (n = 39)PC.T. Positive (n = 15)C.T. Negative (n = 57)P
Age (years), median (min-max)67.8 (57.6–82.6)72.0 (33.6–89.2)0.351067.6 (57.6–82.6)71.5 (33.6–89.2)0.0661
Sex, (% female)57.1%53.8%0.873360.0%52.6%0.6128
Cancer, n (%)3 (42.9%)18 (46.2%)0.87337 (46.7%)32 (56.1%)0.5153
Vasculitis, n (%)1 (14.3%)11 (28.2%)0.44502 (13.3%)16 (28.1%)0.2442
Dialysis vintage (years), median (min–max)13.2 (6.1–42.1)1.6 (0.1–21.2)0.000614.3 (6.1–42.1)2.3 (0.1–21.2)<0.0001
Kidney transplant, n (%)3 (42.9%)3 (7.7%)0.01198 (53.3%)3 (5.3%)<0.0001
Kt/V, mean (±SD)1.59 (±0.33)1.46 (±0.37)0.41101.60 (±0.27)1.46 (±0.34)0.1520
Albumin (g/L), mean (±SD)28.3 (±4.1)33.4 (±4.0)0.007031.5 (±5.2)33.2 (±4.1)0.1860
Beta-2 microglobulin, mean (±SD)26.6 (±10.5)27.6 (±9.0)0.799026.3 (±8.1)27.2 (±8.1)0.7260
Charlson, median (min–max)9 (3–12)9 (4–11)0.78059 (3–12)9 (4–11)0.2304
MIS, median (min-max)9 (5–19)7 (3–14)0.13199 (4–19)6 (3–14)0.1061
SGAA, (%)57.1%64.1%0.031666.7%66.7%0.0012
B, (%)14.3%33.3%6.7%31.6%
C, (%)28.6%2.6%26.7%1.8%
PET SCAN positive, n (%)7 (100%)13 (33.3%)0.001214 (93.3%)17 (29.8%)<0.0001
Legend: PET-FDG: Positron emission tomography with fluorodesoxyglucose; SGA: Subjective global assessment: A: well nourished; B: moderate malnutrition; C: severe malnutrition. C.T.: Carpal Tunnel; SD: Standard Deviation; MIS: Malnutrition Inflammation Score. Bold values: statistically significant p values.
Table 4. Dialysis patients: results according to the results of PET scans.
Patients Considered PET Scans Considered
Positive (n = 20)Negative (n = 26)PPositive (n = 31)Negative (n = 41)P
Age (years), median (min-max)70.1 (37.8–86.7)71.9 (33.6–89.2)0.610367.7 (37.8–86.7)71.9 (33.6–89.2)0.0695
Sex, (% female)70.0%42.3%0.064567.7%43.9%0.0459
Cancer, n (%)10 (50.0%)11 (42.3%)0.607618 (58.1%)21 (51.2%)0.5665
Vasculitis, n (%)6 (30.0%)6 (23.1%)0.60018 (25.8%)10 (24.4%)0.8915
Dialysis vintage (years), median (min–max)7.2 (0.1–42.1)1.2 (0.1–13.0)0.015311.0 (0.1–42.1)1.6 (0.1–13.0)<0.0001
Kidney transplant, n (%)4 (20.0%)2 (7.7%)0.38319 (29.0%)2 (4.9%)0.0071
Kt/V, mean (±SD)1.57 (±0.40)1.41 (±0.32)0.14801.59 (±0.35)1.41 (±0.29)0.0270
Albumin (g/L), mean (±SD)31.6 (±4.5)33.5 (±4.1)0.145032.6 (±4.6)33.1 (±4.2)0.6520
Beta 2 microglobulin, mean (±SD)27.9 (±9.7)27.2 (±8.8)0.801027.6 (±9.3)26.6 (±7.6)0.6210
Charlson Comorbidity Index, median (min–max)9 (3–12)9 (4–11)0.36349 (3–12)9 (4–11)0.0692
MIS, median (min–max)10 (5–19)6 (3–14)0.00349 (5–19)5 (3–14)<0.0001
SGAA, (%)60%65.4%0.701061.3%70.7%0.2202
B, (%)30%30.8%25.8%26.8%
C, (%)10%3.8%12.9%2.4%
Carpal Tunnel positive, n (%) *7 (35.0%)0 (0.0%)0.001214 (45.2%)1 (2.4%)<0.0001
Legend: PET-FDG: Positron emission tomography with fluorodesoxyglucose; SGA: Subjective global assessment: A: well nourished; B: moderate malnutrition; C: severe malnutrition; C.T.: Carpal Tunnel; SD: Standard Deviation; MIS: Malnutrition Inflammation Score. Bold values: statistically significant p values.

