Short-term Forecasts of the COVID-19 Epidemic in Guangdong and Zhejiang, China: February 13–23, 2020

 ,
, 
Abstract
:1. Introduction
2. Methods
2.1. Data
2.2. Models
2.3. Short-Term Forecasts
3. Results
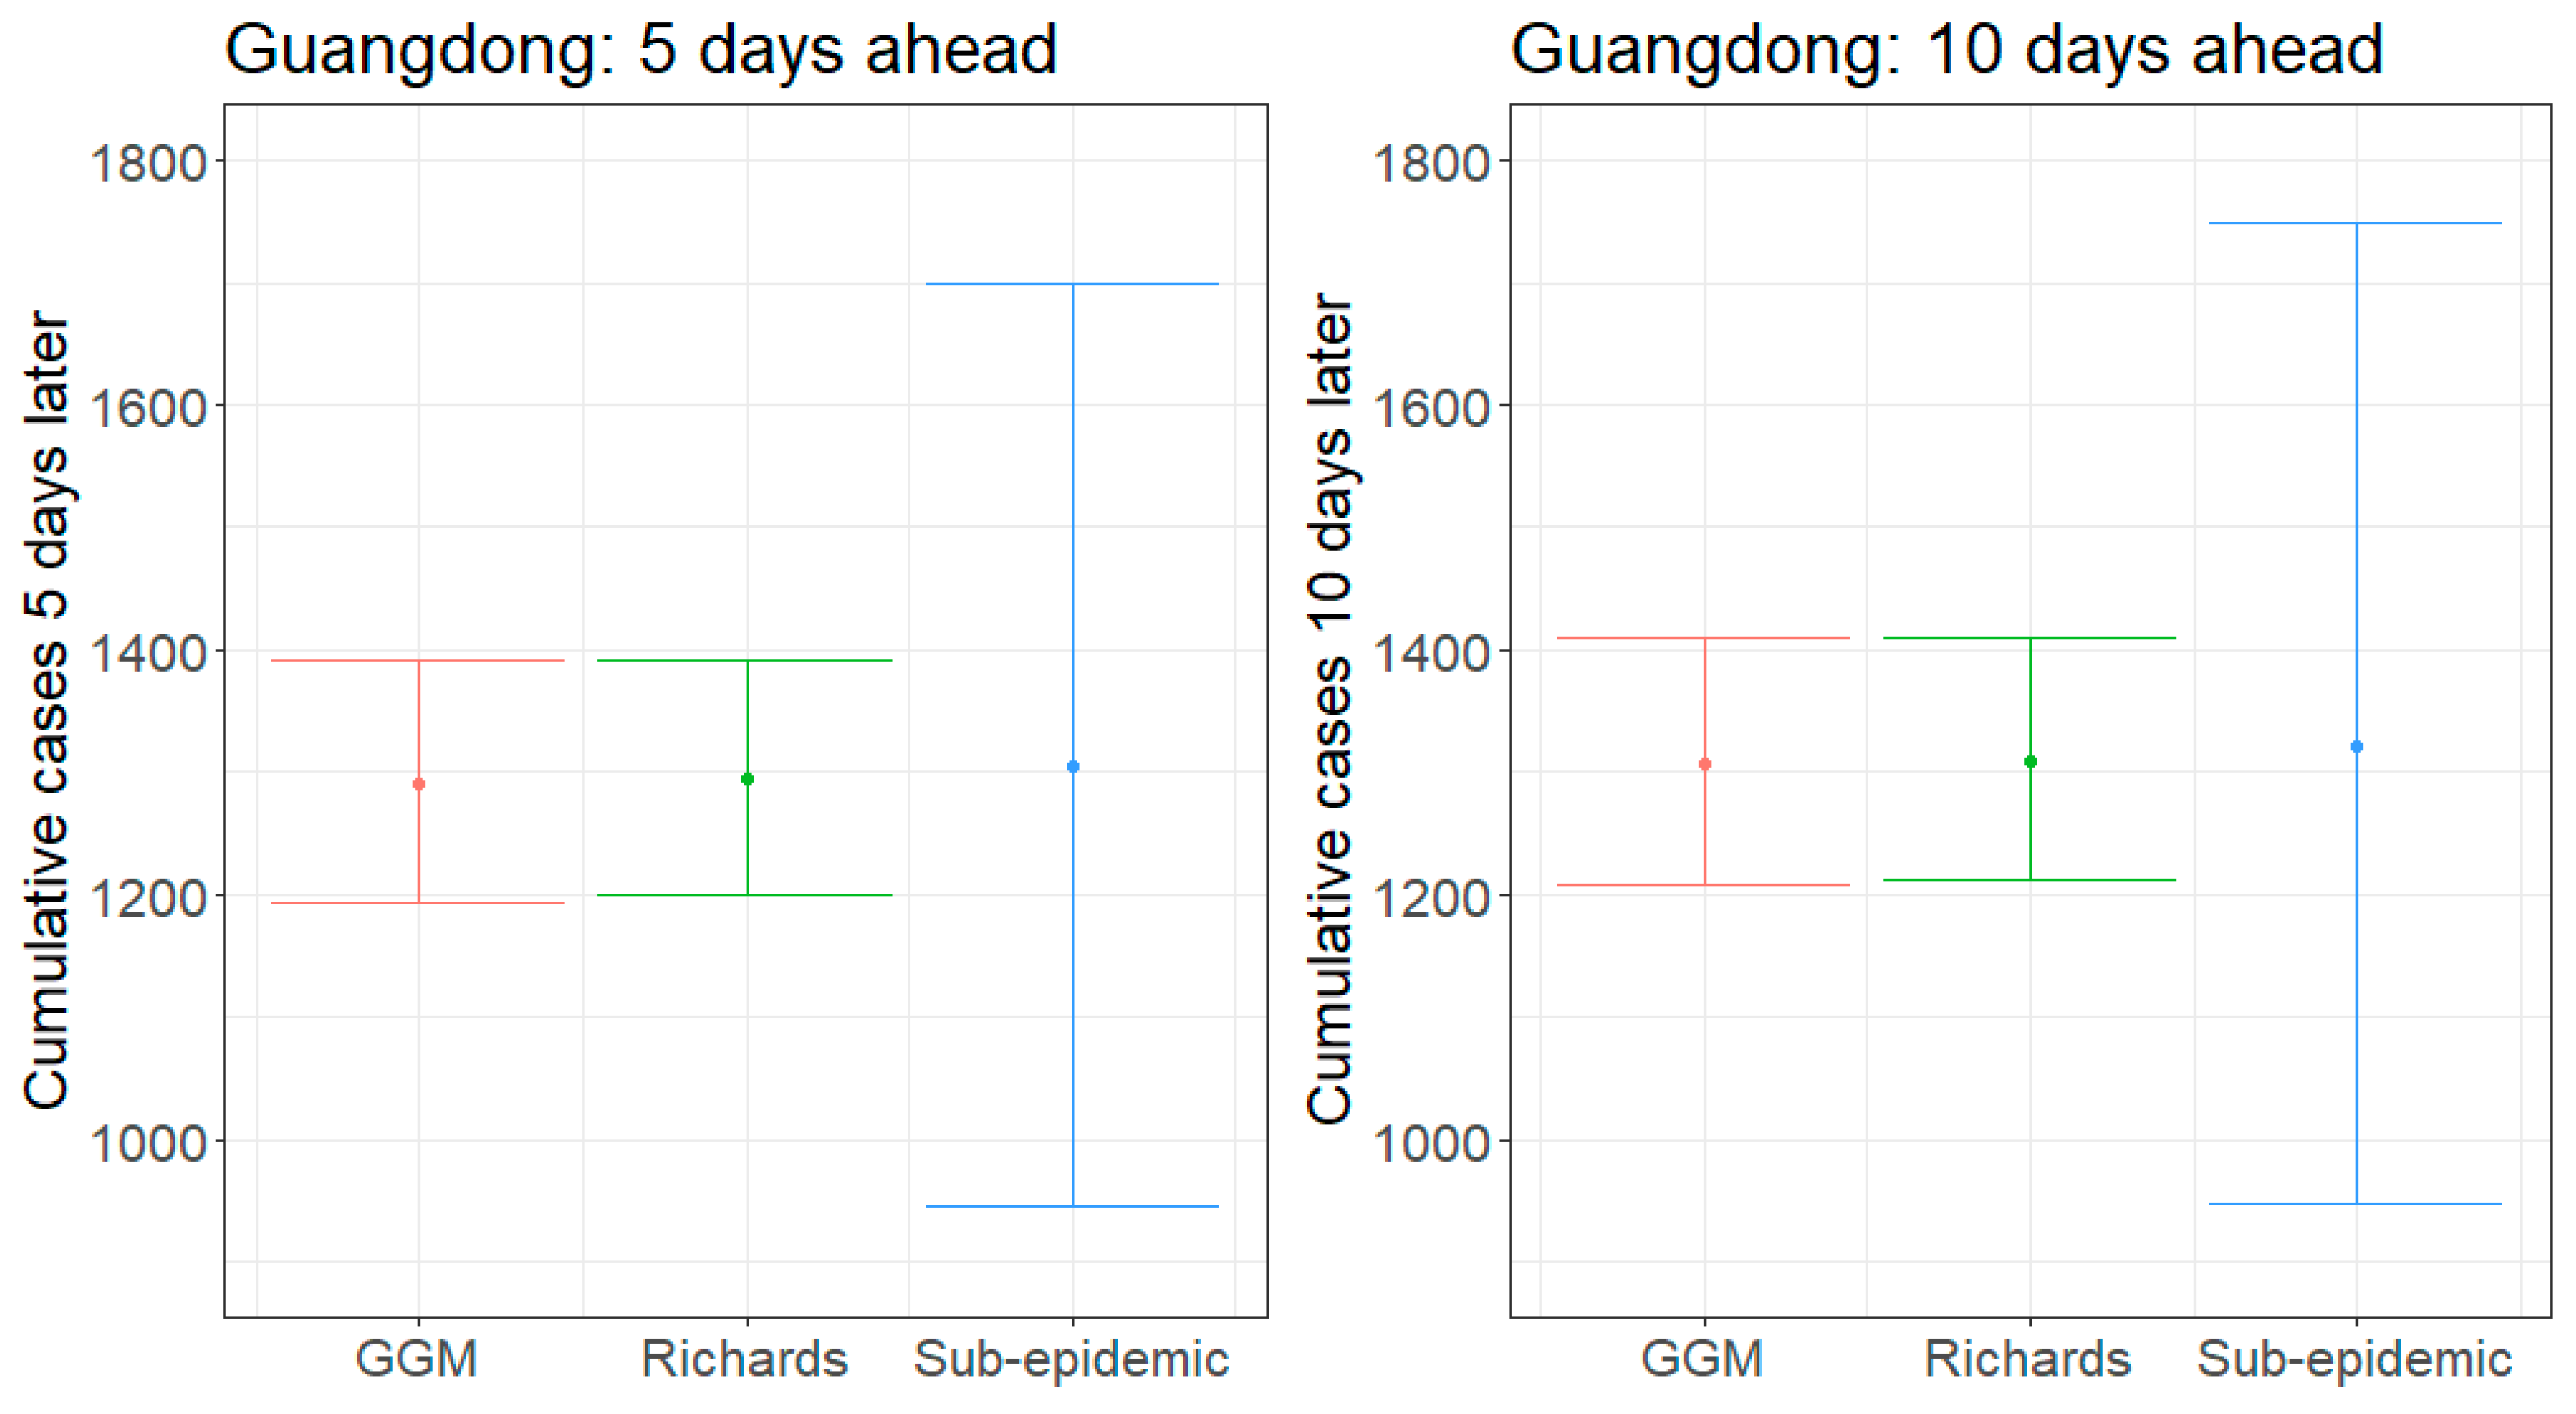
3.1. Guangdong
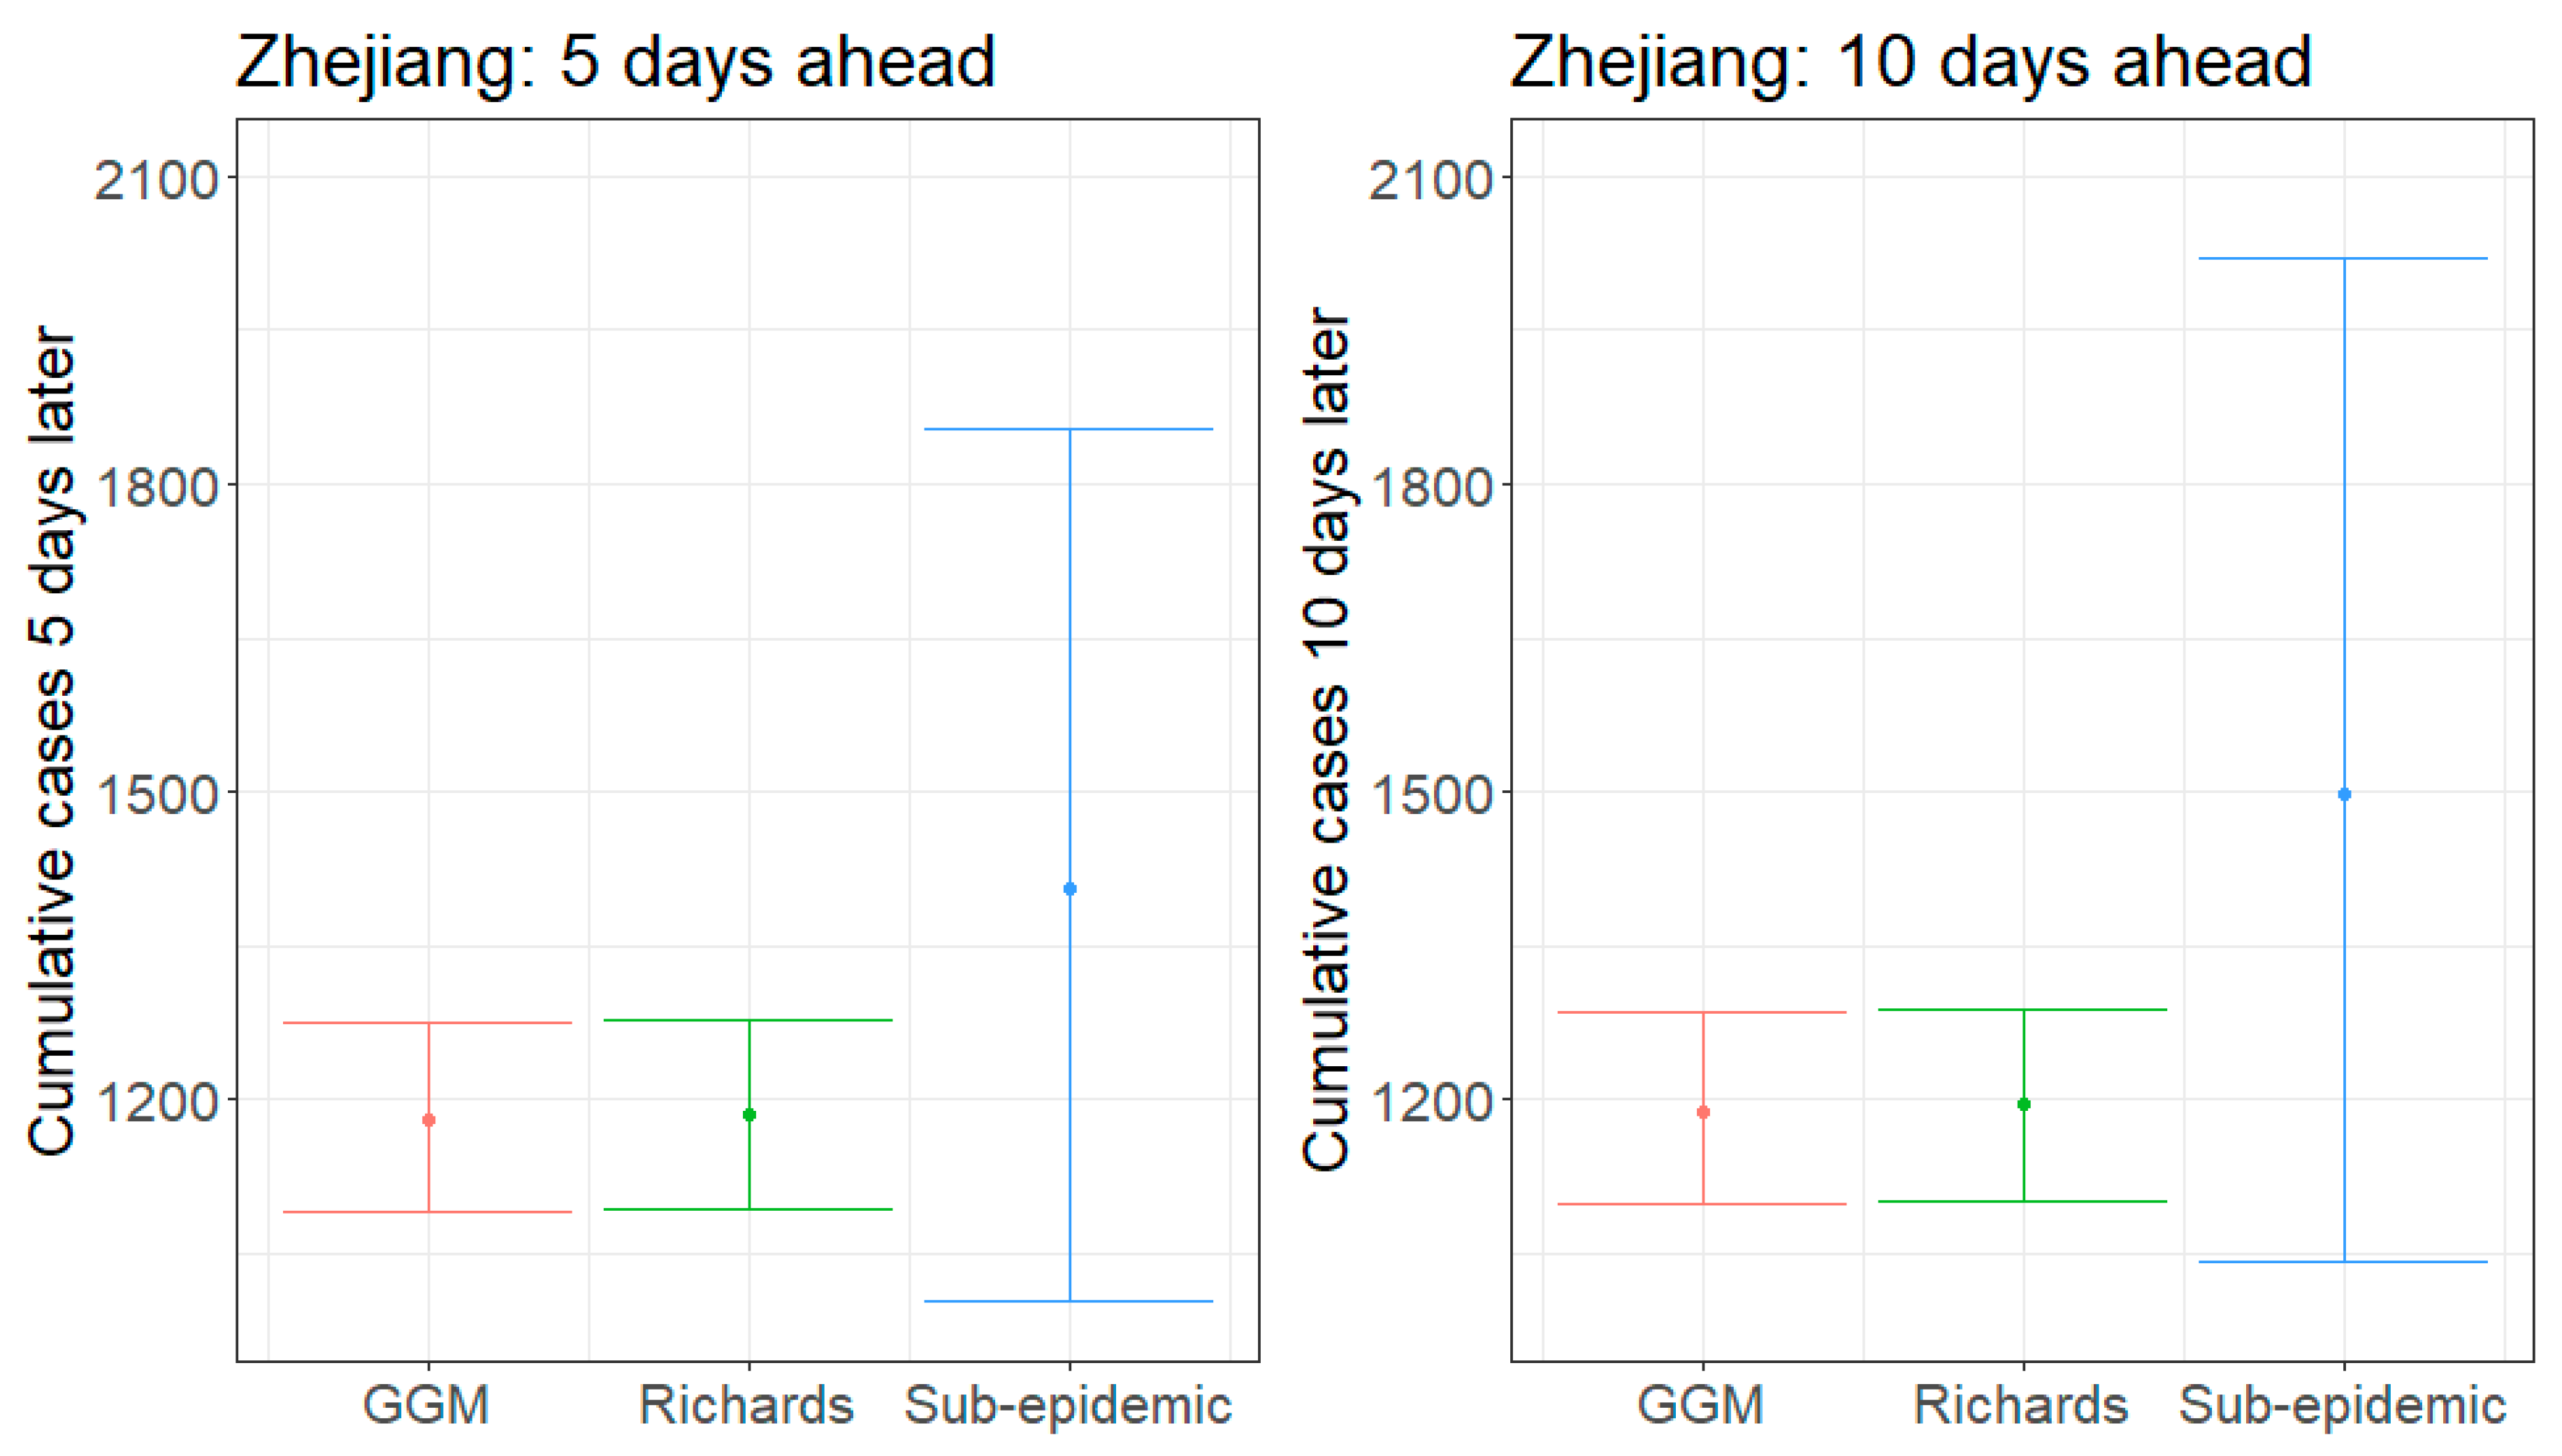
3.2. Zhejiang
4. Discussion
Supplementary Materials
Author Contributions
Funding
Acknowledgments
Conflicts of Interest
Appendix A
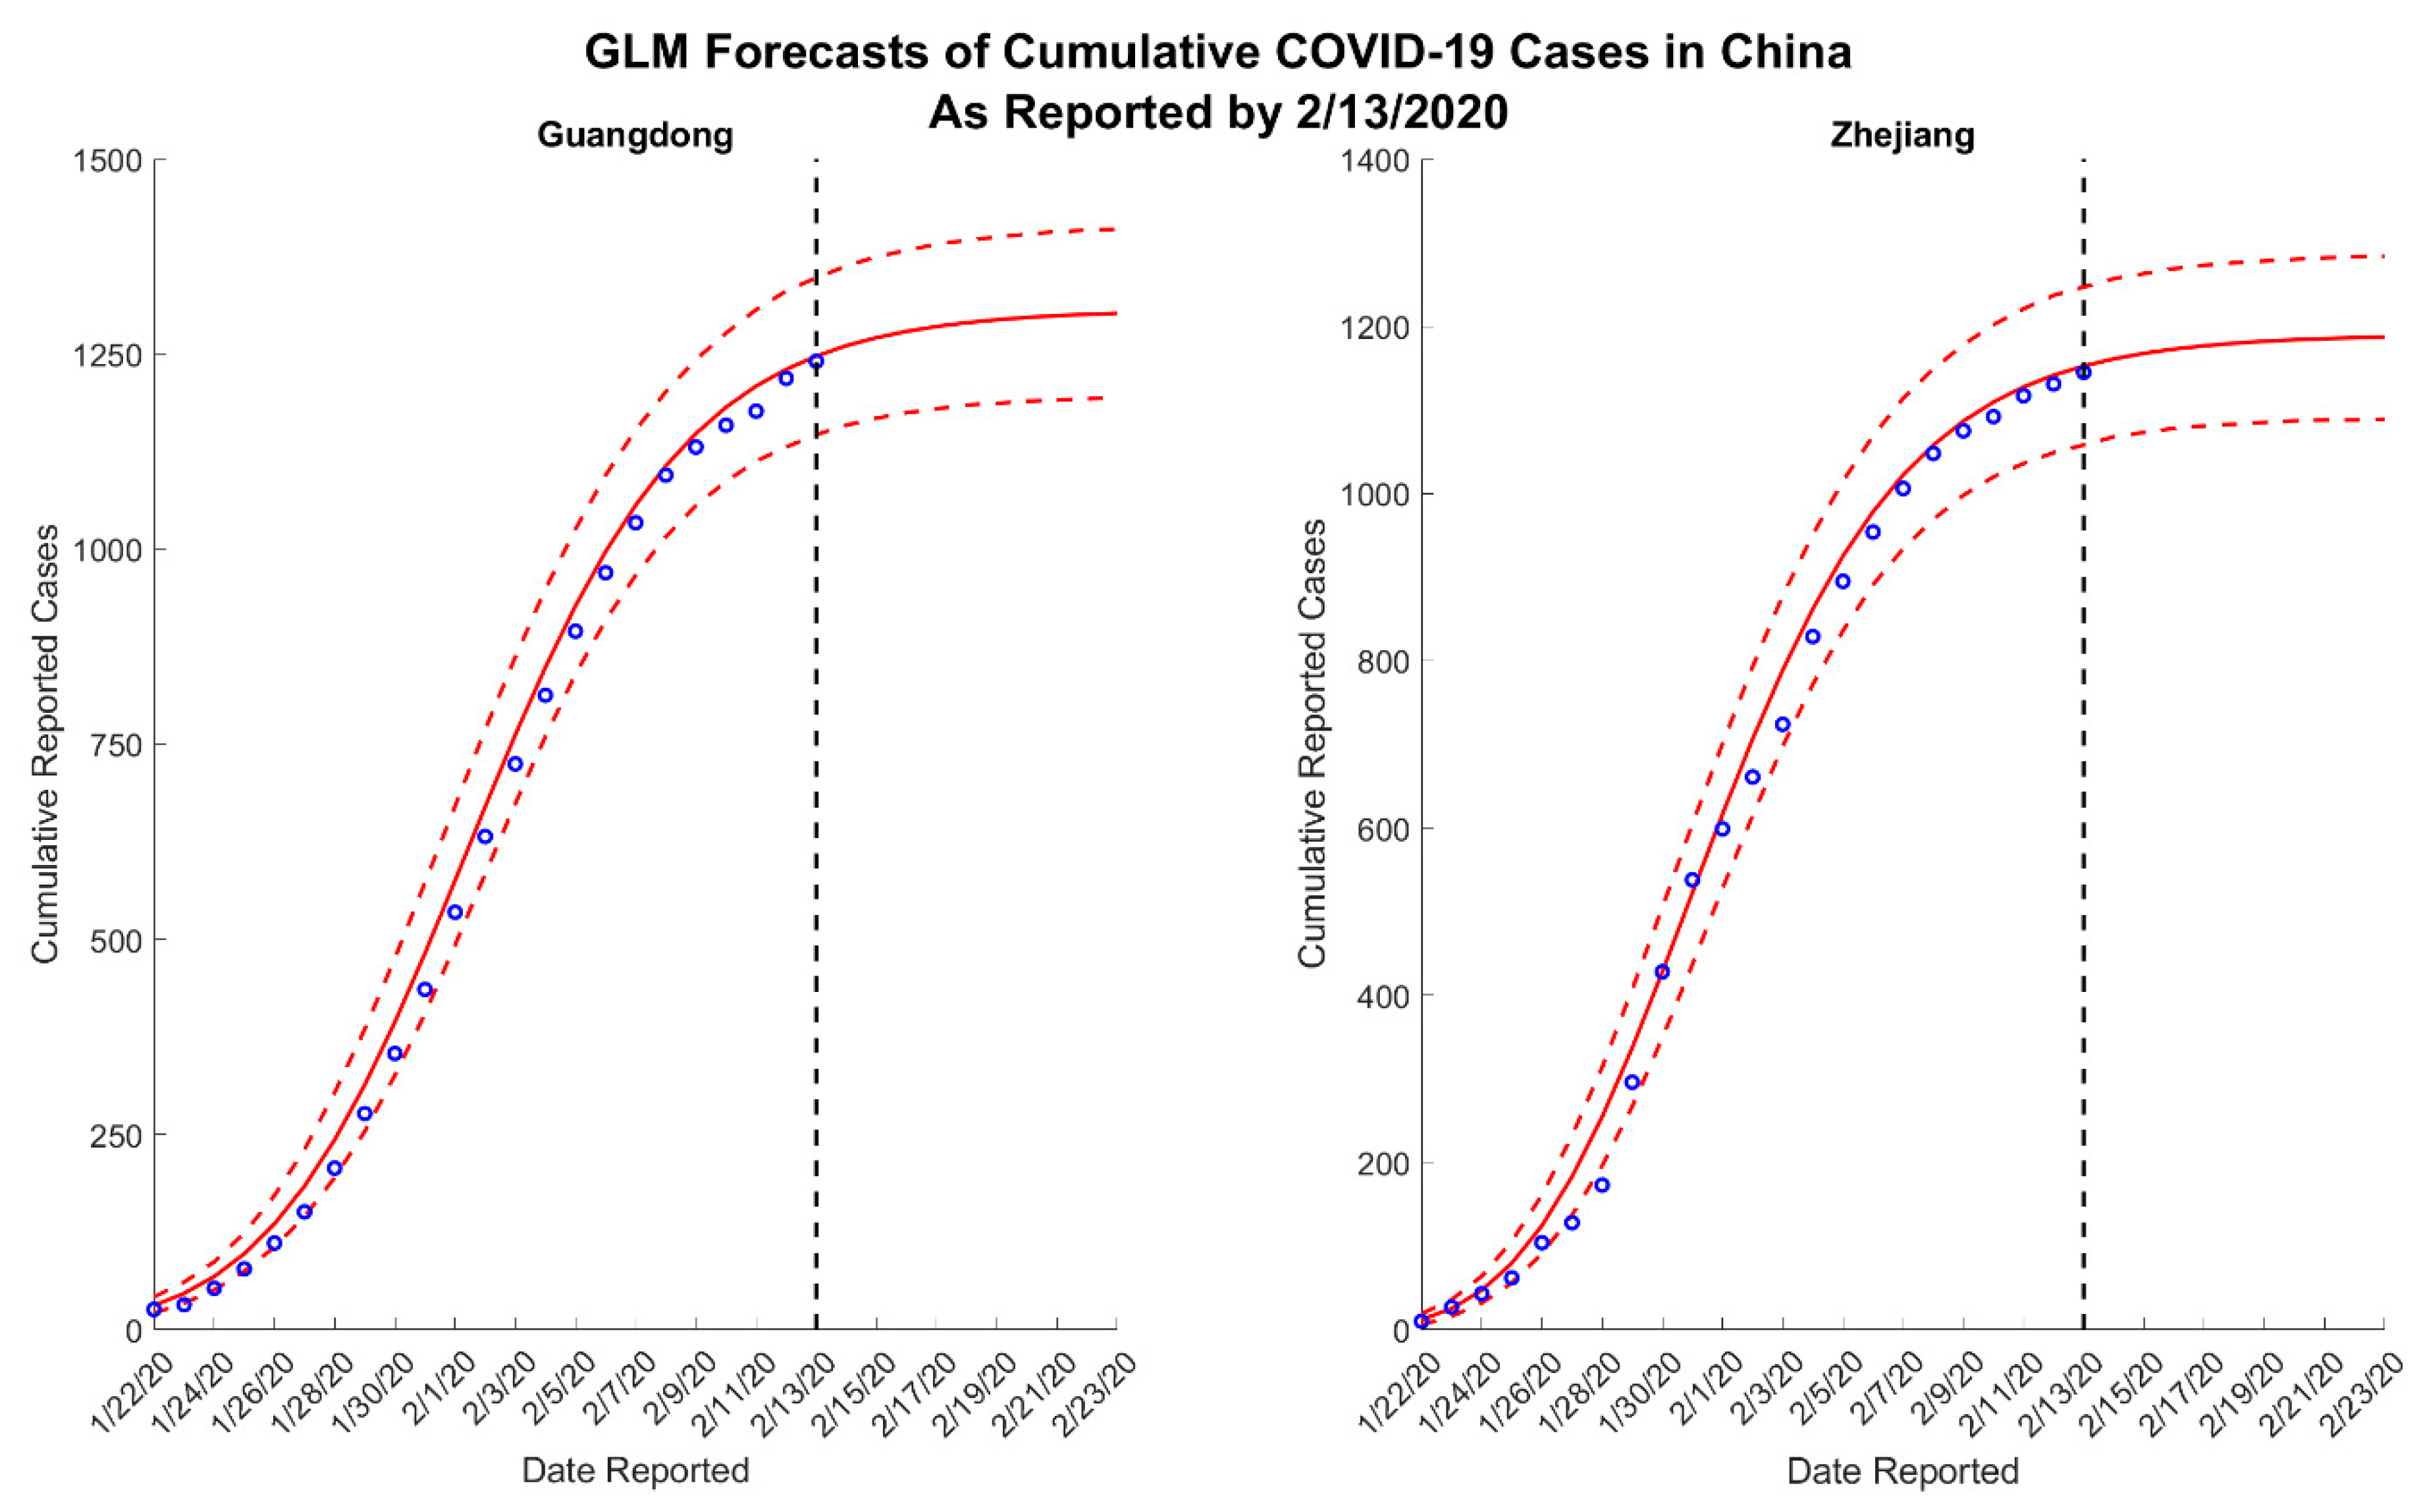
Appendix A.1. GLM
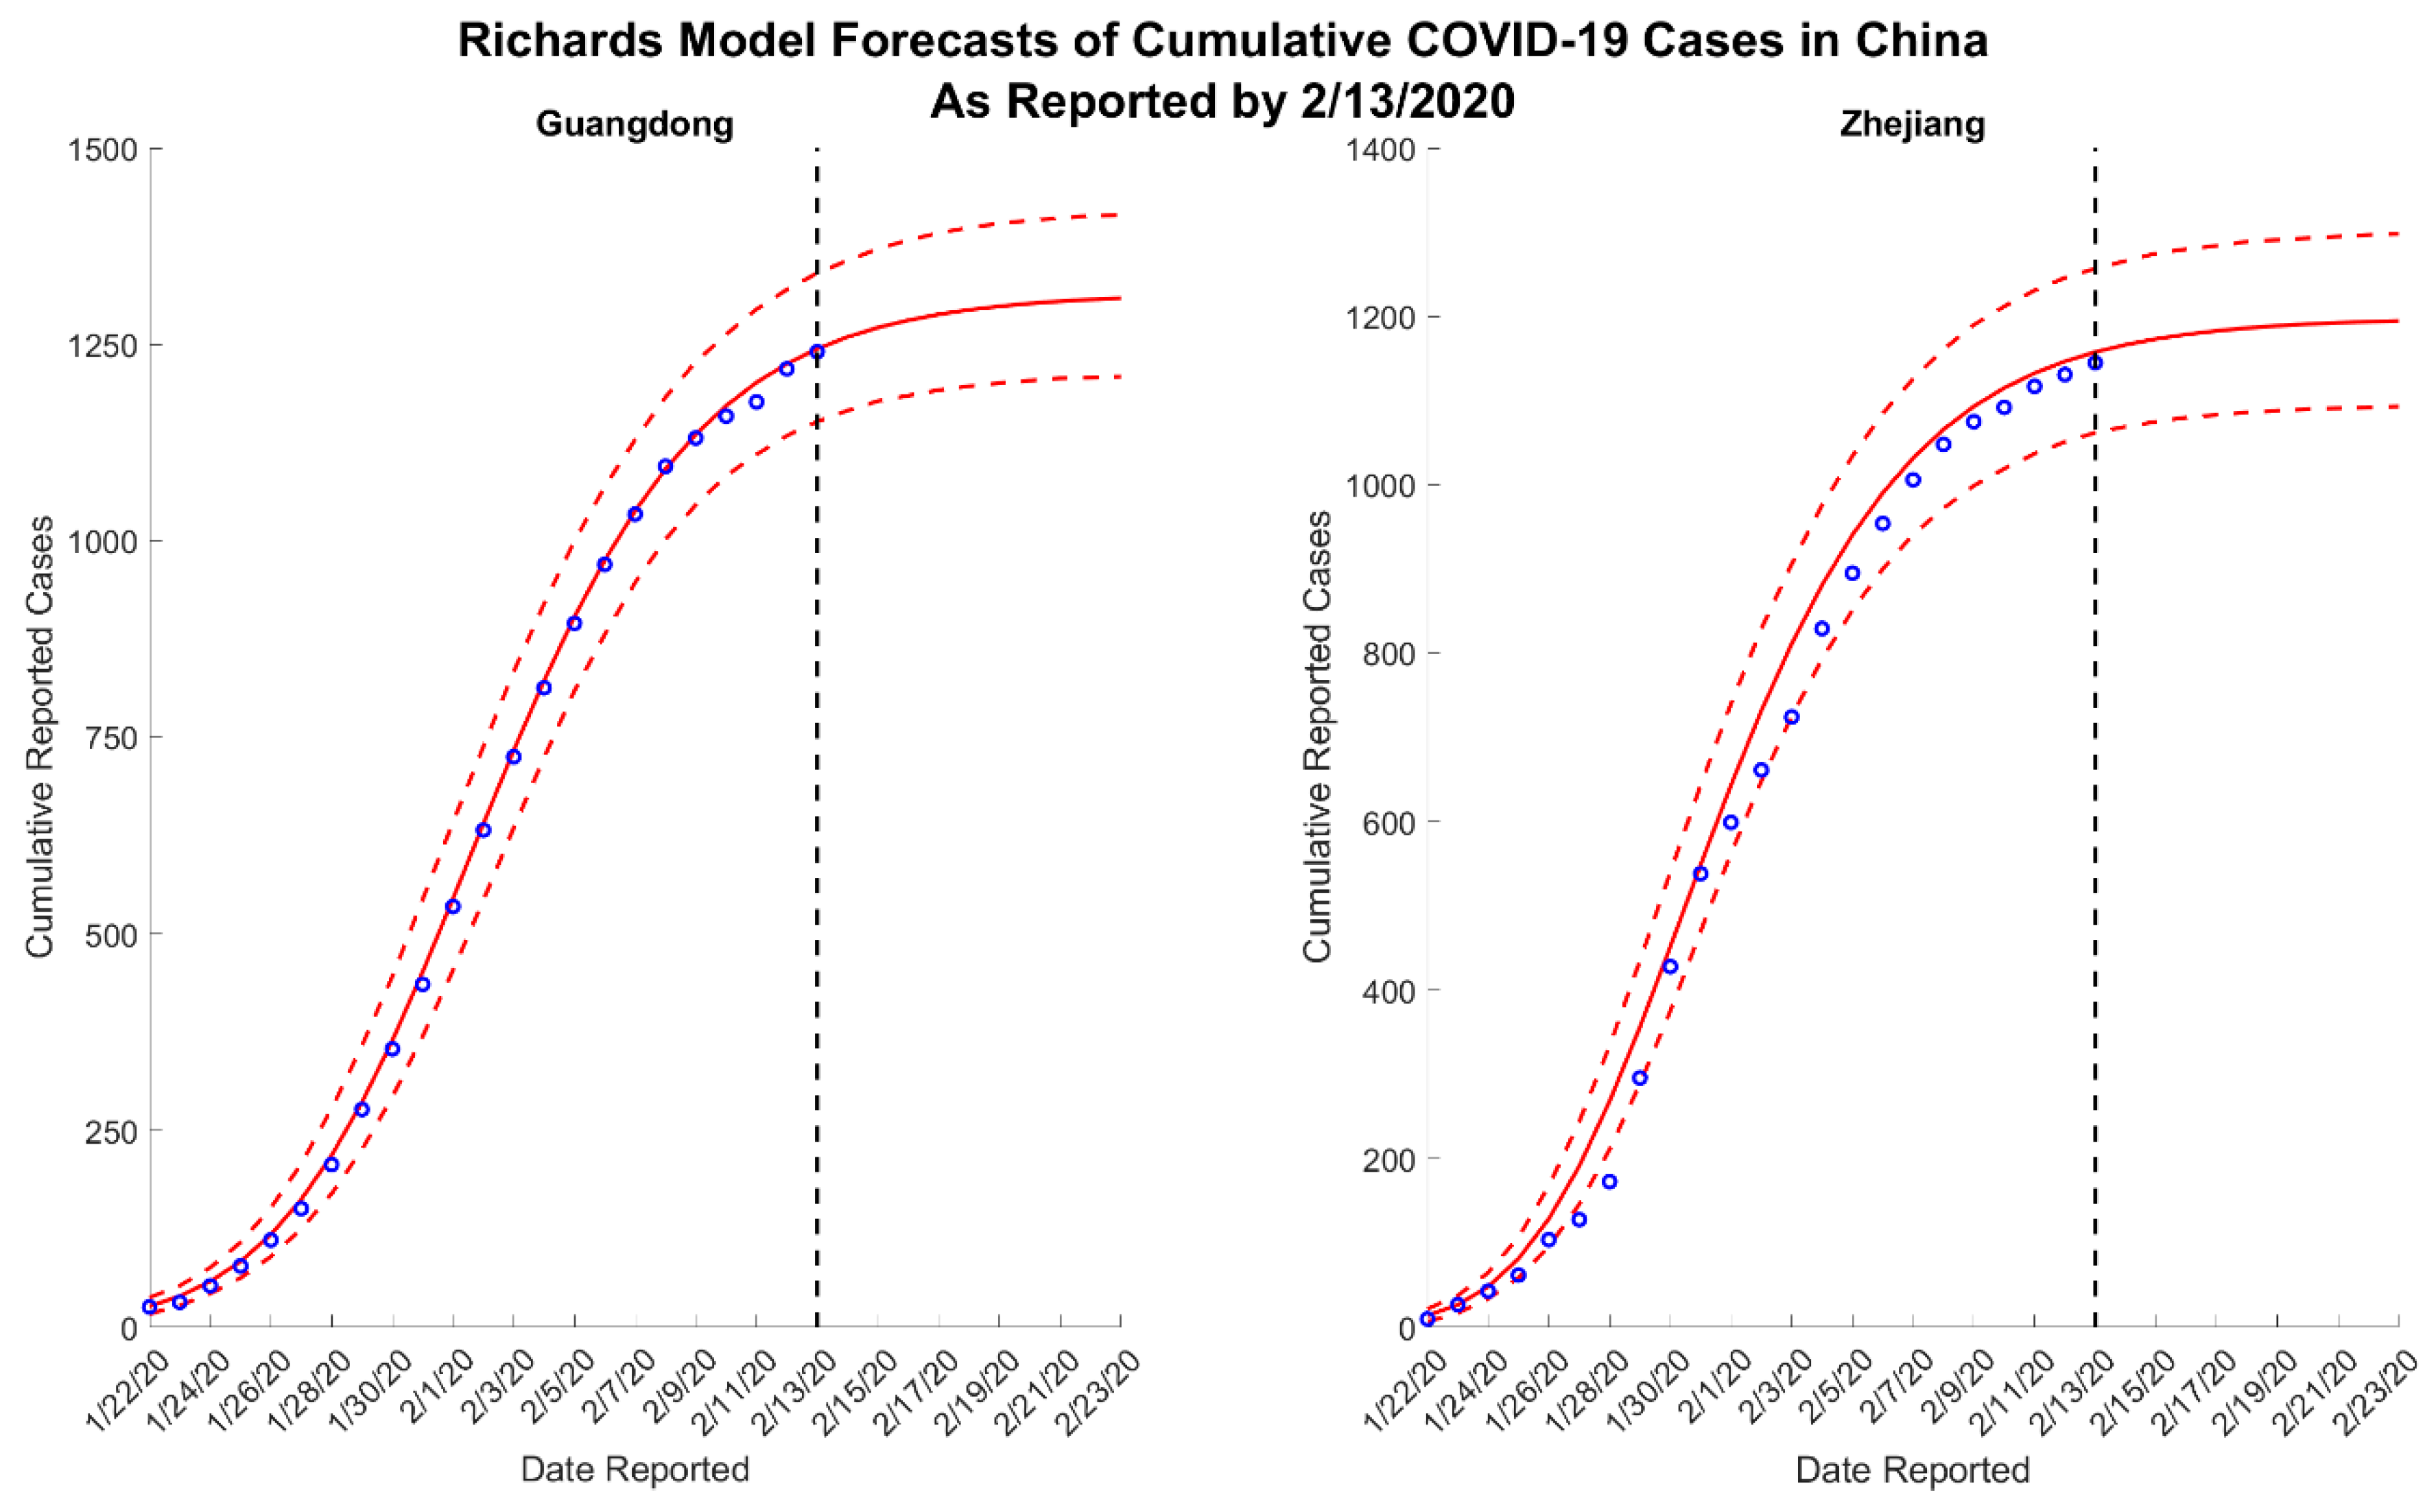
Appendix A.2. Richards Model
Appendix A.3. Sub-Epidemic Model
References
- Chinese National Health Commission. Reported Cases of 2019-nCoV. Available online: https://ncov.dxy.cn/ncovh5/view/pneumonia?from=groupmessage&isappinstalled=0 (accessed on 13 February 2020).
- World Health Organization. Novel Coronavirus (2019-nCoV) Situation Reports. Available online: https://www.who.int/emergencies/diseases/novel-coronavirus-2019/situation-reports (accessed on 13 February 2020).
- Li, Q.; Guan, X.; Wu, P.; Wang, X.; Zhou, L.; Tong, Y.; Ren, R.; Leung, K.S.M.; Lau, E.H.Y.; Wong, J.Y.; et al. Early Transmission Dynamics in Wuhan, China, of Novel Coronavirus-Infected Pneumonia. N. Engl. J. Med. 2020. [Google Scholar] [CrossRef]
- Mizumoto, K.; Kagaya, K.; Chowell, G. Early epidemiological assessment of the transmission potential and virulence of 2019 Novel Coronavirus in Wuhan City: China, 2019–2020. medRxiv 2020. [Google Scholar] [CrossRef] [Green Version]
- Sanche, S.; Lin, Y.T.; Xu, C.; Romero-Severson, E.; Hengartner, N.; Ke, R. The Novel Coronavirus, 2019-nCoV, is Highly Contagious and More Infectious Than Initially Estimated. Popul. Evol. 2020. [Google Scholar] [CrossRef] [Green Version]
- Pell, B.; Kuang, Y.; Viboud, C.; Chowell, G. Using phenomenological models for forecasting the 2015 Ebola challenge. Epidemics 2018, 22, 62–70. [Google Scholar] [CrossRef] [PubMed] [Green Version]
- Chowell, G.; Hincapie-Palacio, D.; Ospina, J.; Pell, B.; Tariq, A.; Dahal, S.; Moghadas, S.; Smirnova, A.; Simonsen, L.; Viboud, C. Using Phenomenological Models to Characterize Transmissibility and Forecast Patterns and Final Burden of Zika Epidemics. Public Libr. Sci. 2016. [Google Scholar] [CrossRef] [PubMed]
- Roosa, K.; Tariq, A.; Yan, P.; Hyman, J.; Chowell, G. Multi-model forecasts of the ongoing Ebola epidemic in the Democratic Republic of Congo, March–October 2019. Royal Society Interface, submitted. 2020. [Google Scholar]
- Chowell, G. Fitting dynamic models to epidemic outbreaks with quantified uncertainty: A primer for parameter uncertainty, identifiability, and forecasts. Infect. Dis. Model. 2017, 2, 379–398. [Google Scholar] [CrossRef] [PubMed]
- Chowell, G.; Tariq, A.; Hyman, J.M. A novel sub-epidemic modeling framework for short-term forecasting epidemic waves. BMC Med. 2019, 17, 164. [Google Scholar] [CrossRef] [Green Version]
- Wang, X.-S.; Wu, J.; Yang, Y. Richards model revisited: Validation by and application to infection dynamics. J. Theor. Biol. 2012, 313, 12–19. [Google Scholar] [CrossRef]
- Roosa, K.; Lee, Y.; Luo, R.; Kirpich, A.; Rothenberg, R.; Hyman, J.; Yan, P.; Chowell, G. Real-time forecasts of the 2019-nCoV epidemic in China from February 5th to February 24th, 2020. Infect. Dis. Model. 2020. [Google Scholar] [CrossRef]
- Richards, F. A flexible growth function for empirical use. J. Exp. Bot. 1959, 10, 290–301. [Google Scholar] [CrossRef]
- Roosa, K.; Chowell, G. Assessing parameter identifiability in compartmental dynamic models using a computational approach: Application to infectious disease transmission models. Theor. Biol. Med Model. 2019, 16. [Google Scholar] [CrossRef] [PubMed] [Green Version]
- Chowell, G.; Abdirizak, F.; Lee, S.; Lee, J.; Jung, E.; Nishiura, H.; Viboud, C. Transmission characteristics of MERS and SARS in the healthcare setting: A comparative study. BMC Med. 2015, 13. [Google Scholar] [CrossRef] [PubMed] [Green Version]
- Viboud, C.; Simonsen, L.; Chowell, G. A generalized-growth model to characterize the early ascending phase of infectious disease outbreaks. Epidemics 2016, 15, 27–37. [Google Scholar] [CrossRef] [PubMed] [Green Version]
- Chowell, G.; Luo, R.; Sun, K.; Roosa, K.; Tariq, A.; Viboud, C. Real-time forecasting of epidemic trajectories using computational dynamic ensembles. Epidemics 2020, 30. [Google Scholar] [CrossRef] [PubMed]
- Roosa, K.; Luo, R.; Chowell, G. Comparative assessment of parameter estimation methods in the presence of overdispersion: A simulation study. Math. Biosci. Eng. 2019, 16, 4299–4313. [Google Scholar] [CrossRef] [PubMed]
- Ganyani, T.; Roosa, K.; Faes, C.; Hens, N.; Chowell, G. Assessing the relationship between epidemic growth scaling and epidemic size: The 2014–2016 Ebola epidemic in West Africa. Epidemiol. Infect. 2018. [Google Scholar] [CrossRef] [Green Version]


© 2020 by the authors. Licensee MDPI, Basel, Switzerland. This article is an open access article distributed under the terms and conditions of the Creative Commons Attribution (CC BY) license (http://creativecommons.org/licenses/by/4.0/).
Share and Cite
Roosa, K.; Lee, Y.; Luo, R.; Kirpich, A.; Rothenberg, R.; Hyman, J.M.; Yan, P.; Chowell, G. Short-term Forecasts of the COVID-19 Epidemic in Guangdong and Zhejiang, China: February 13–23, 2020. J. Clin. Med. 2020, 9, 596. https://0-doi-org.brum.beds.ac.uk/10.3390/jcm9020596
Roosa K, Lee Y, Luo R, Kirpich A, Rothenberg R, Hyman JM, Yan P, Chowell G. Short-term Forecasts of the COVID-19 Epidemic in Guangdong and Zhejiang, China: February 13–23, 2020. Journal of Clinical Medicine. 2020; 9(2):596. https://0-doi-org.brum.beds.ac.uk/10.3390/jcm9020596
Chicago/Turabian StyleRoosa, Kimberlyn, Yiseul Lee, Ruiyan Luo, Alexander Kirpich, Richard Rothenberg, James M. Hyman, Ping Yan, and Gerardo Chowell. 2020. "Short-term Forecasts of the COVID-19 Epidemic in Guangdong and Zhejiang, China: February 13–23, 2020" Journal of Clinical Medicine 9, no. 2: 596. https://0-doi-org.brum.beds.ac.uk/10.3390/jcm9020596