Article

Identification of Candidate Genes Associated with Susceptibility to Ovarian Clear Cell Adenocarcinoma Using cis-eQTL Analysis

1
Department of Obstetrics and Gynecology, Dankook University Hospital, Cheonan 31116, Korea
2
Experimental Pathology Laboratory, Laboratory of Pathology, Center for Cancer Research, National Cancer Institute, National Institutes of Health, Bethesda, MD 20892, USA
3
Samsung Biomedical Research Institute, Samsung Medical Center, Sungkyunkwan University School of Medicine, Seoul 06351, Korea
4
Departments of Obstetrics and Gynecology, Samsung Medical Center, Sungkyunkwan University School of Medicine, Seoul 06351, Korea
*
Authors to whom correspondence should be addressed.
The first two authors contributed equally to this paper.
Submission received: 20 March 2020 / Revised: 12 April 2020 / Accepted: 14 April 2020 / Published: 16 April 2020
(This article belongs to the Special Issue Molecular Biology of Ovarian Cancer)

Abstract

:
Ovarian clear cell adenocarcinoma (Ov-CCA) has a higher prevalence in the Japanese ancestry than other populations. The ancestral disparities in Ov-CCA prevalence suggests the presence of Ov-CCA-specific genetic alterations and may provide an opportunity to identify the novel genes associated with Ov-CCA tumorigenesis. Using 94 previously reported genes as the phenotypic trait, we conducted multistep expression quantitative trait loci (eQTL) analysis with the HapMap3 project datasets. Four single-nucleotide polymorphisms (SNPs) (rs4873815, rs12976454, rs11136002, and rs13259097) that had different allele frequencies in the Japanese ancestry and seven genes associated in cis (APBA3, C8orf58, KIAA1967, NAPRT1, RHOBTB2, TNFRSF10B, and ZNF707) were identified. In silico functional annotation analysis and in vitro promoter assay validated the regulatory effect of rs4873815-TT on ZNF707 and rs11136002-TT on TNFRSF10B. Furthermore, ZNF707 was highly expressed in Ov-CCA and had a negative prognostic value in disease recurrence in our sample cohort. This prognostic power was consistently observed in The Cancer Genome Atlas (TCGA) clear cell renal cell carcinoma dataset, suggesting that ZNF707 may have prognostic value in clear cell histology regardless of tissue origin. In conclusion, rs4873815-TT/ZNF707 may have clinical significance in the prognosis and tumorigenesis of Ov-CCA, which may be more relevant to clear cell histology. Besides, this study may underpin the evidence that cis-eQTL analysis based on ancestral disparities can facilitate the discovery of causal genetic alterations in complex diseases, such as cancer.

1. Introduction

Gene expression levels can be considered as quantitative traits, and specific variants associated with transcript levels are referred to as expression quantitative trait loci (eQTL). eQTL analysis is a well-established in silico approach that provides evidence of the functional effects of specific loci on gene expression and identifies the novel candidate genes at the risk loci [1,2,3].
Identifying causal variants located outside of the protein coding region is an ingenious and perceptive way to discover the genetic landscape of complex diseases, including cancer [4]. There are two major applications for using eQTL analysis to investigate the genetic landscape in complex diseases [1]. Genome-wide association study (GWAS) is a well-established and effective method of identifying candidate risk loci associated with specific traits in large cohorts. The majority of candidate risk loci identified by GWAS are mainly located in the noncoding region and are assumed to be non-causal [5]. eQTL analysis can measure gene expression of these risk loci to identify novel susceptibility loci and associated genes that can be involved in gene regulation related to a specific trait [1]. Several studies on cancers, including epithelial ovarian carcinoma (EOC), have identified novel genes and proposed molecular pathways through eQTL analysis using the identified risk loci in GWAS [6,7,8]. In addition, using well-known genetic mutations or disease-specific characteristics as the phenotypic trait, several studies with eQTL analysis have already identified specific risk loci and associated novel candidate genes in multiple cancer types, including breast, prostate, lung, colorectal, and high-grade serous ovarian carcinoma (HGSOC) [3,9,10,11].
Epithelial ovarian carcinoma (EOC) is the second most common gynecologic cancer and the leading cause of death for patients with gynecologic cancer in developed countries [12]. Ovarian clear cell adenocarcinoma (Ov-CCA) is the second most common subtype of EOC and is characterized by resistance to conventional platinum-based chemotherapy, which causes poor prognosis [12,13,14,15]. In addition, a significant ethnic difference exists in the prevalence of Ov-CCA between Western and Japanese populations. Ov-CCA is a rare tumor in Europe and the United States (1–12%), whereas the prevalence in Japan is as high as 15–25% compared to non-Japanese Asian populations [14,16]. This ethnic difference is also observed in Japanese living in the United States. They exhibit a markedly higher incidence of Ov-CCA than Caucasians (3.4% vs. 9.0%) [12]. While socioeconomic factors have significant relevance in these disparities, ethnic difference in Ov-CCA prevalence suggests the presence of Ov-CCA-specific genetic alterations associated with ancestry. In this regard, recent advances in breast and prostate cancer research have demonstrated that genetic factors related to ancestry may be associate with tumorigenesis [17,18].
In this study, we conducted cis-eQTL analyses to identify candidate susceptibility loci using 94 previously reported genetic mutations in Ov-CCA as the phenotypic trait [19]. Given that disease-specific ancestral disparities can be used as the phenotypic trait in eQTL analysis [17,18], we hypothesized that specific susceptibility loci and its associated genes can be identified in Ov-CCA by Japanese ancestry. Lastly, to validate potential functional role of the identified novel susceptibility loci and associated genes in Ov-CCA, we performed expression and survival analysis of the identified genes in both our gene expression datasets and TCGA (The Cancer Genome Atlas) datasets.

2. Materials and Methods

2.1. Identification of Susceptibility Loci and Associated Genes through cis-eQTL Analysis

In a previous study, we had performed an integrative analysis using array comparative genomic hybridization (aCGH) and paired gene expression microarray data on 19 freshly frozen Ov-CCA samples. With this, 94 candidate genes were identified with frequent copy number alterations in Ov-CCA [19].
In this study, a three-step eQTL analysis was employed to identify susceptibility loci and related genes associated with Japanese ancestry. We used gene expression profiling and genotyping data from the HapMap3 project, which included 1099 individuals from eight ancestries (Table S1) [20]. The detailed workflow is described in Figure 1A.
First, with a set of 94 candidate genes treated as the phenotypic trait, the eQTL analysis (http:www.gtexportal.org/home/eqtl) was performed to identify specific single-nucleotide polymorphisms (SNPs) in genes of interest with the HapMap3 dataset using the Genevar tool (Wellcome Sanger Institute, Cambridge, UK, http://www.sanger.ac.uk/resources/software/genevar) [21]. We excluded SNPs if their imputation accuracy was r2 < 0.25. Allele frequencies for each SNP were also computed, and SNPs with minor allele frequencies (<0.1) were excluded from further analysis, as were SNPs that did not satisfy the Hardy–Weinberg equilibrium with p < 10−4. A total of 935 SNPs passed the filtering step (Table S2). Second, of the 935 SNPs, we sought those that were preferentially prevalent in the Japanese ancestry (JPT) in comparison to the European (CEU) or Chinese (CHB) ancestries. Four SNPs (rs4873815, rs12976454, rs11136002, and rs13259097) fit these criteria (Figure 1B). Lastly, to identify the gene associated with each of the four SNPs, we identified the association between the corresponding germline genotypes and the transcript abundances of mRNAs within 500 kb of either side of the corresponding loci based on linear regression coefficients. A cis-association was determined by significant correlation between the germline genotypes and the transcript levels at a false discovery rate (FDR) of 0.05. p-values were adjusted using the Benjamini–Hochberg method for multiple testing corrections. Through these workflows, seven associated genes (ZNF707, NAPRT1, APBA3, C8orf58, KIAA1967, RHOBTB2, and TNFRSF10B) were demonstrated (Figure 1A).

2.2. Functional Validation of Susceptibility Loci on Associated Genes

We performed an in silico functional analysis on four SNPs using Ensembl Variant Effect Predictor (VEP) analysis with Combined Annotation-Dependent Depletion (CADD) Phred score and LoFtool annotation tools to annotate and prioritize variants for further promoter assay [22,23,24].
Based on the results of in silico functional analysis, rs4873815/ZNF707 was selected for in vitro promoter assay. In addition, because rs11136002 was associated in cis with four genes among the seven identified genes, rs11136002/TNFRSF10B was also selected for promoter assay as representative.
In the multistep eQTL analysis of this study, alleles TT of rs4873815 and rs11136002 were most frequently expressed in Japanese ancestry. Accordingly, promoter assay was performed with the alleles TT of rs4873815 and rs11136002, which were expected to have regulatory effects on ZNF707 and TNFRSF10B, respectively. Allele CC of ZNF707 and TNFRSF10B, which had a significantly lower allelic frequency in JPT than CEU and CHB, were selected as control. In addition, each internal control vector contained only TNFRSF10B promoter or ZNF707 promoter, as in a previous study [25].
We conducted dual-luciferase reporter assays to investigate whether the promoter activity of ZNF707 and TNFRSF10B was regulated by rs4873815 and rs11136002, respectively. Promoter regions of ZNF707 and TNFRSF10B were amplified by PCR using genomic DNA from human embryonic kidney 293T cells (HEK293T).
The primers used for PCR were as follows:
TNFRSF10B-F: 5′-CCAAGAGCTCGCACCCGGGCCAGCGGCTG-3′
TNFRSF10B-R: 5′-CCGGAGATCTGGCGTCATTCGGGGCGGGGC-3′
ZNF707-F: 5′-CCGGGAGCTCGTGAGGACTAAACTGATC-3′
ZNF707-R: 5′-CAGGAAGCTTCCGGCCCCTCTAGGAG-3′
The 2000 base pairs containing promoter regions for ZNF707 and TNFRSF10B of PCR products were cloned at SacI and BglII for TNFRSF10B and SacI and HindIII sites for ZNF707 in a pGL3-basic firefly luciferase reporter plasmid (Promega Corporation, Madison, WI, USA). About 500 base pairs around the SNP region in rs11136002 and rs4873815 were amplified by PCR with genomic DNA isolated from the RMG-2 ovarian clear cell carcinoma cell line. The PCR products were cloned at the KpnI and SacI sites in a pGL3-basic plasmid containing TNFRSF10B promoter or ZNF707 promoter, respectively. The primers used for amplifying rs11136002 and rs4873815 genes were as follows:
rs1136002-F: 5′-CCGGGGTACCCACATCTGATCAAGGATTG-3′
rs1136002-R: 5′-CCGGGAGCTCGGAAACGATGAATACAGC-3′
rs4873815-F: 5′-CCGGGGTACCCTCAATATTGTTATATCC-3′
rs4873815-R: 5′-CCAAGAGCTCCACATCACATTTTTCTC-3′
The constructs were confirmed by Sanger method with BigDye® Terminator v3.1 cycle sequencing kit from SolGent Co., Ltd. (Daejeon, Korea). The sequences were analyzed by ABI 3730XL DNA analyzer (50 cm capillary). Each primer used for PCR reactions (described above) were used for sequencing of rs11136002 and rs4873815 genes. For sequencing TNFRSF10B promoter or ZNF707 promoter, inner primers were used as well as the primers used for PCR reactions because these promoters were about 2000 base pairs. The inner primers and the sequencing results are provided in Table S3.
For the promoter assay, each firefly luciferase reporter plasmid and Renilla luciferase reporter plasmid (pRL-SV40: Promega), an internal control for transfection efficiency, was transfected into the HEK293T cells. Sixteen hours after transfection, luciferase activity was measured by a dual-luciferase assay kit (Promega, Madison, WI, USA). Three biological replicates in triplicate were performed for the experiments to ensure reproducibility.

2.3. Analysis of the Clinical Significance of the Seven Identified Genes Using Our Sample Cohort

For validation of the four SNPs and seven associated genes in Ov-CCA, we first analyzed gene expression microarray data from our previous studies to investigate whether these genes were expressed differentially among Ov-CCA (n = 19), HGSOC (n = 26), and normal ovarian tissue (n = 7) [19,26]. The samples were collected prospectively from patients at Samsung Medical Center with Institutional Review Board (IRB) approval (2011-04-008, Seoul, South Korea) and informed consent. All the patients were treated with maximal debulking surgery followed by cisplatin-based combination chemotherapy. Optimality status was defined according to the size of the nodules remaining after surgery (<1 cm, optimal; ≥1 cm, suboptimal). Gene expression analyses of the HGSOC and normal ovarian tissue were performed using AffymetrixGeneChip Human Gene 1.0 ST oligonucleotide arrays (Affymetrix, Santa Clara, CA, USA, http://www.affymetrix.com). Analysis of the Ov-CCA was performed using the Agilent oligo microarray kit 8x60K according to the Agilent One-Color Microarray-Based Gene Expression Analysis Protocol (Agilent Technologies, Santa Clara, CA, USA, http://www.chem.agilent.com). To avoid the batch effect while maintaining biological variability, we performed quantile normalization for each method prior to batch effect correction. We used in silico Merging with Combat for batch effect correction (r/bioconductor packages) [27].
In addition, a Kaplan–Meier survival curve was plotted to investigate whether expression of seven genes was significantly associated with survival in HGSOC or Ov-CCA patients. In addition, multivariate Cox proportional hazards regression models were employed to evaluate the prognostic power of the identified genes in HGSOC and advanced-stage Ov-CCA.

2.4. Analysis of the Clinical Significance of the Seven Identified Genes Using TCGA Datasets

To further elucidate the clinical significance of the identified genes, we conducted survival analysis using gene expression profiles from the publicly available TCGA database (https://tcga-data.nci.nih.gov/tcga/tcgaHome2.jsp). As there were no Ov-CCA cases in the TCGA database, a clear cell renal cell carcinoma (TCGA-ccRCC) dataset, reported to have similar molecular profiles to that of Ov-CCA, was included in the survival analysis as an alternative [28]. In addition, the HGSOC dataset was included as a control.
Clinical information and molecular data, including mRNA expression, were obtained from the TCGA Data Portal. This study meets the publication guidelines provided by TCGA (http://cancergenome.nih.gov/publications/publicationguidelines).

2.5. Statistical Analysis

For promoter assay, statistical significance was measured using unpaired Student’s t-test. After confirming whether the data were normally distributed using the Shapiro–Wilk test, we used the Wilcoxon rank sum test to compare gene expressions among our sample cohorts. For survival analysis, expression values of a gene were dichotomized into high and low using the median as a cutoff. Overall survival (OS) was defined as the interval from the date of initial treatment to the date of last contact or death. Progression-free survival (PFS) was defined as the interval from the date of initial treatment to the date of progression, date of recurrence, or the date of last contact. PFS and OS curves were created with the Kaplan–Meier method and the log-rank test. All of the tests were two-sided, with statistical significance set at p < 0.05, and were performed using R software, version 3.1.3 (R Foundation, Vienna, Austria; http://www.R-project.org).

3. Results

3.1. Total of 935 SNPs Identified through cis-eQTL Analysis of 94 Genes Reported in Ov-CCA

eQTL analysis of 94 Ov-CCA-associated genes revealed a total of 935 eQTLs with significant correlations after FDR adjustment (FDR, 0.05) (Table S2). SNPs appeared most frequently on chromosomes 8 (628 SNPs) and 17 (174 SNPs). The three most frequent ancestries showing SNPs were CEU (200 SNPs), Maasai (MKK, 124 SNPs), and Luhya (LWK, 106 SNPs), while JPT only had 68 correlated SNPs (Table S1).

3.2. Four cis-eQTL with Differential Allelic Frequency in the Japanese Ancestry

Of the 935 identified cis-eQTLs, four SNPs (rs4873815, rs12976454, rs11136002, and rs13259097) had significantly different frequencies of alternative alleles among CEU, CHB, and JPT populations (x2 = 61.79, 108.50, 47.21, and 36.87, all of p < 0.001, respectively) (Figure 1B). Details of the difference in frequencies between CHB and JPT are summarized in Table S4.

3.3. Seven Genes Associated with Four SNPs in cis

Next, we identified the seven associated genes with statistically significant cis-eQTL associations with the four SNPs using the HapMap3 dataset. As shown in Table 1, rs4873815 was located on chromosome 8q24.3 and identified as a cis-eQTL for genes ZNF707 (p = 8.92e−4) and NAPRT1 (p = 4.41e−4). rs11136002 was located on chromosome 8p21.3 and identified as a cis-eQTL for C8orf58 (p = 5.53e−4), KIAA1967 (p = 9.19e−4), RHOBTB2 (p = 3.12e−4), and TNFRSF10B (p = 4.03e−4). rs12976454 was located on chromosome 19p13.3 and identified as a cis-eQTL for APBA3 (p = 3.40e−4). rs13259097 was located on chromosome 8p21.3 and identified as a cis-eQTL for RHOBTB2 (p = 3.87e−4).
Of these, C8orf58 was first identified in EOC through this study. NAPRT1, involved in the nicotinamide adenine dinucleotide (NAD) synthesis pathway, was not reported in our previous study of Ov-CCA. The remaining five genes were previously reported in a study that identified 94 candidate genes [19].

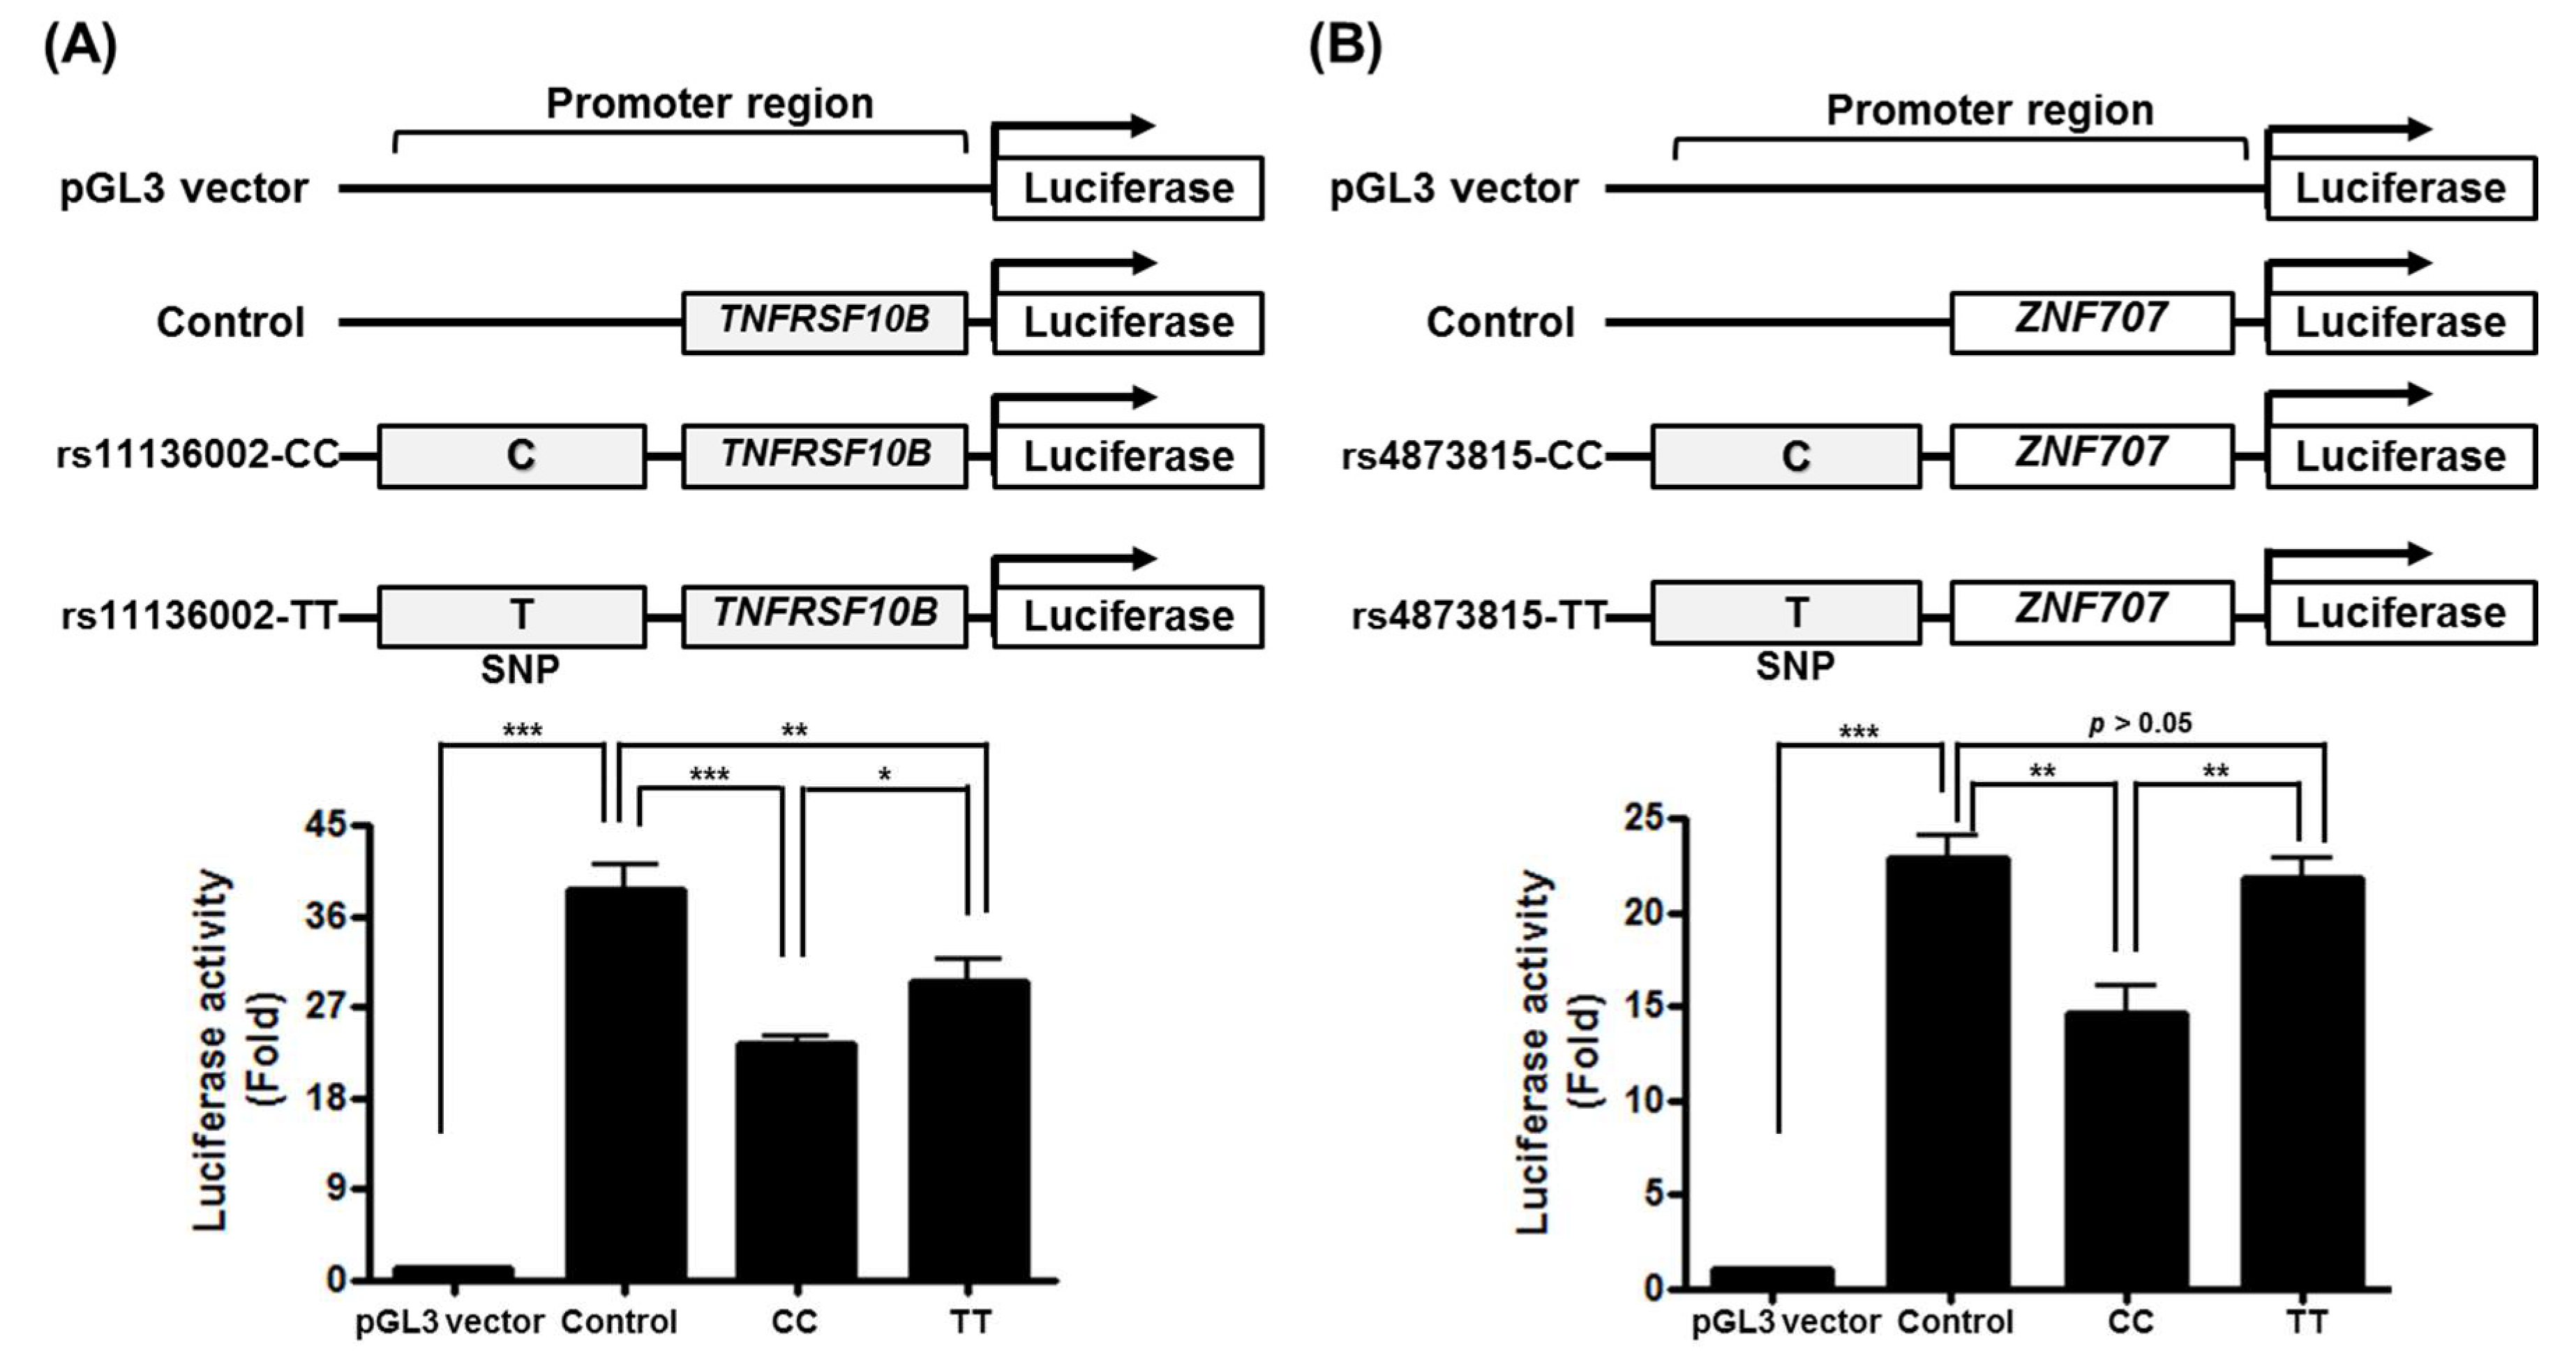
3.4. Potential Regulatory Effect of rs4873815-TT and rs11136002-TT on Associate Genes

In the VEP analysis, we annotated the affected transcripts of four SNPs and prioritized them based on CADD Phred scores and LoFtool toolsets. As shown in Figure S1, rs4873815 had a 12.08 CADD Phred score and 0.627 LoFtool score for the ZNF623 gene located near the ZNF707 gene, indicating that it is a possibly deleterious and phenotypically functional variant in an individual. In addition, because rs11136002 was associated in cis with four genes among seven identified genes, rs11136002/TNFRSF10B was selected for the promoter assay as representative.
To verify whether identified susceptibility loci affect promoter activity of associate genes, luciferase reporter assays were performed in HEK293T cells using rs4873815 and its candidate gene ZNF707 or rs11136002 and TNFRSF10B.
As shown in Figure 2, transcriptional activity with the T allele of rs4873815 (rs4873815-TT), which showed a high frequency in JPT, was significantly higher than that with the C allele of rs4873815 (rs4873815-CC, high frequency in CEU) of ZNF707 (p < 0.01).
Moreover, rs11136002-TT (high frequency in JPT) increased the transcriptional activity of TNFRSF10B compared to CC (high frequency in CEU) (p < 0.05). This significantly increased transcriptional activity demonstrates that TT, which showed a high frequency in JPT in both rs4873815 and rs11136002, may induce the expression of ZNF707 or TNFRSF10B, respectively, by regulating promoter activity.

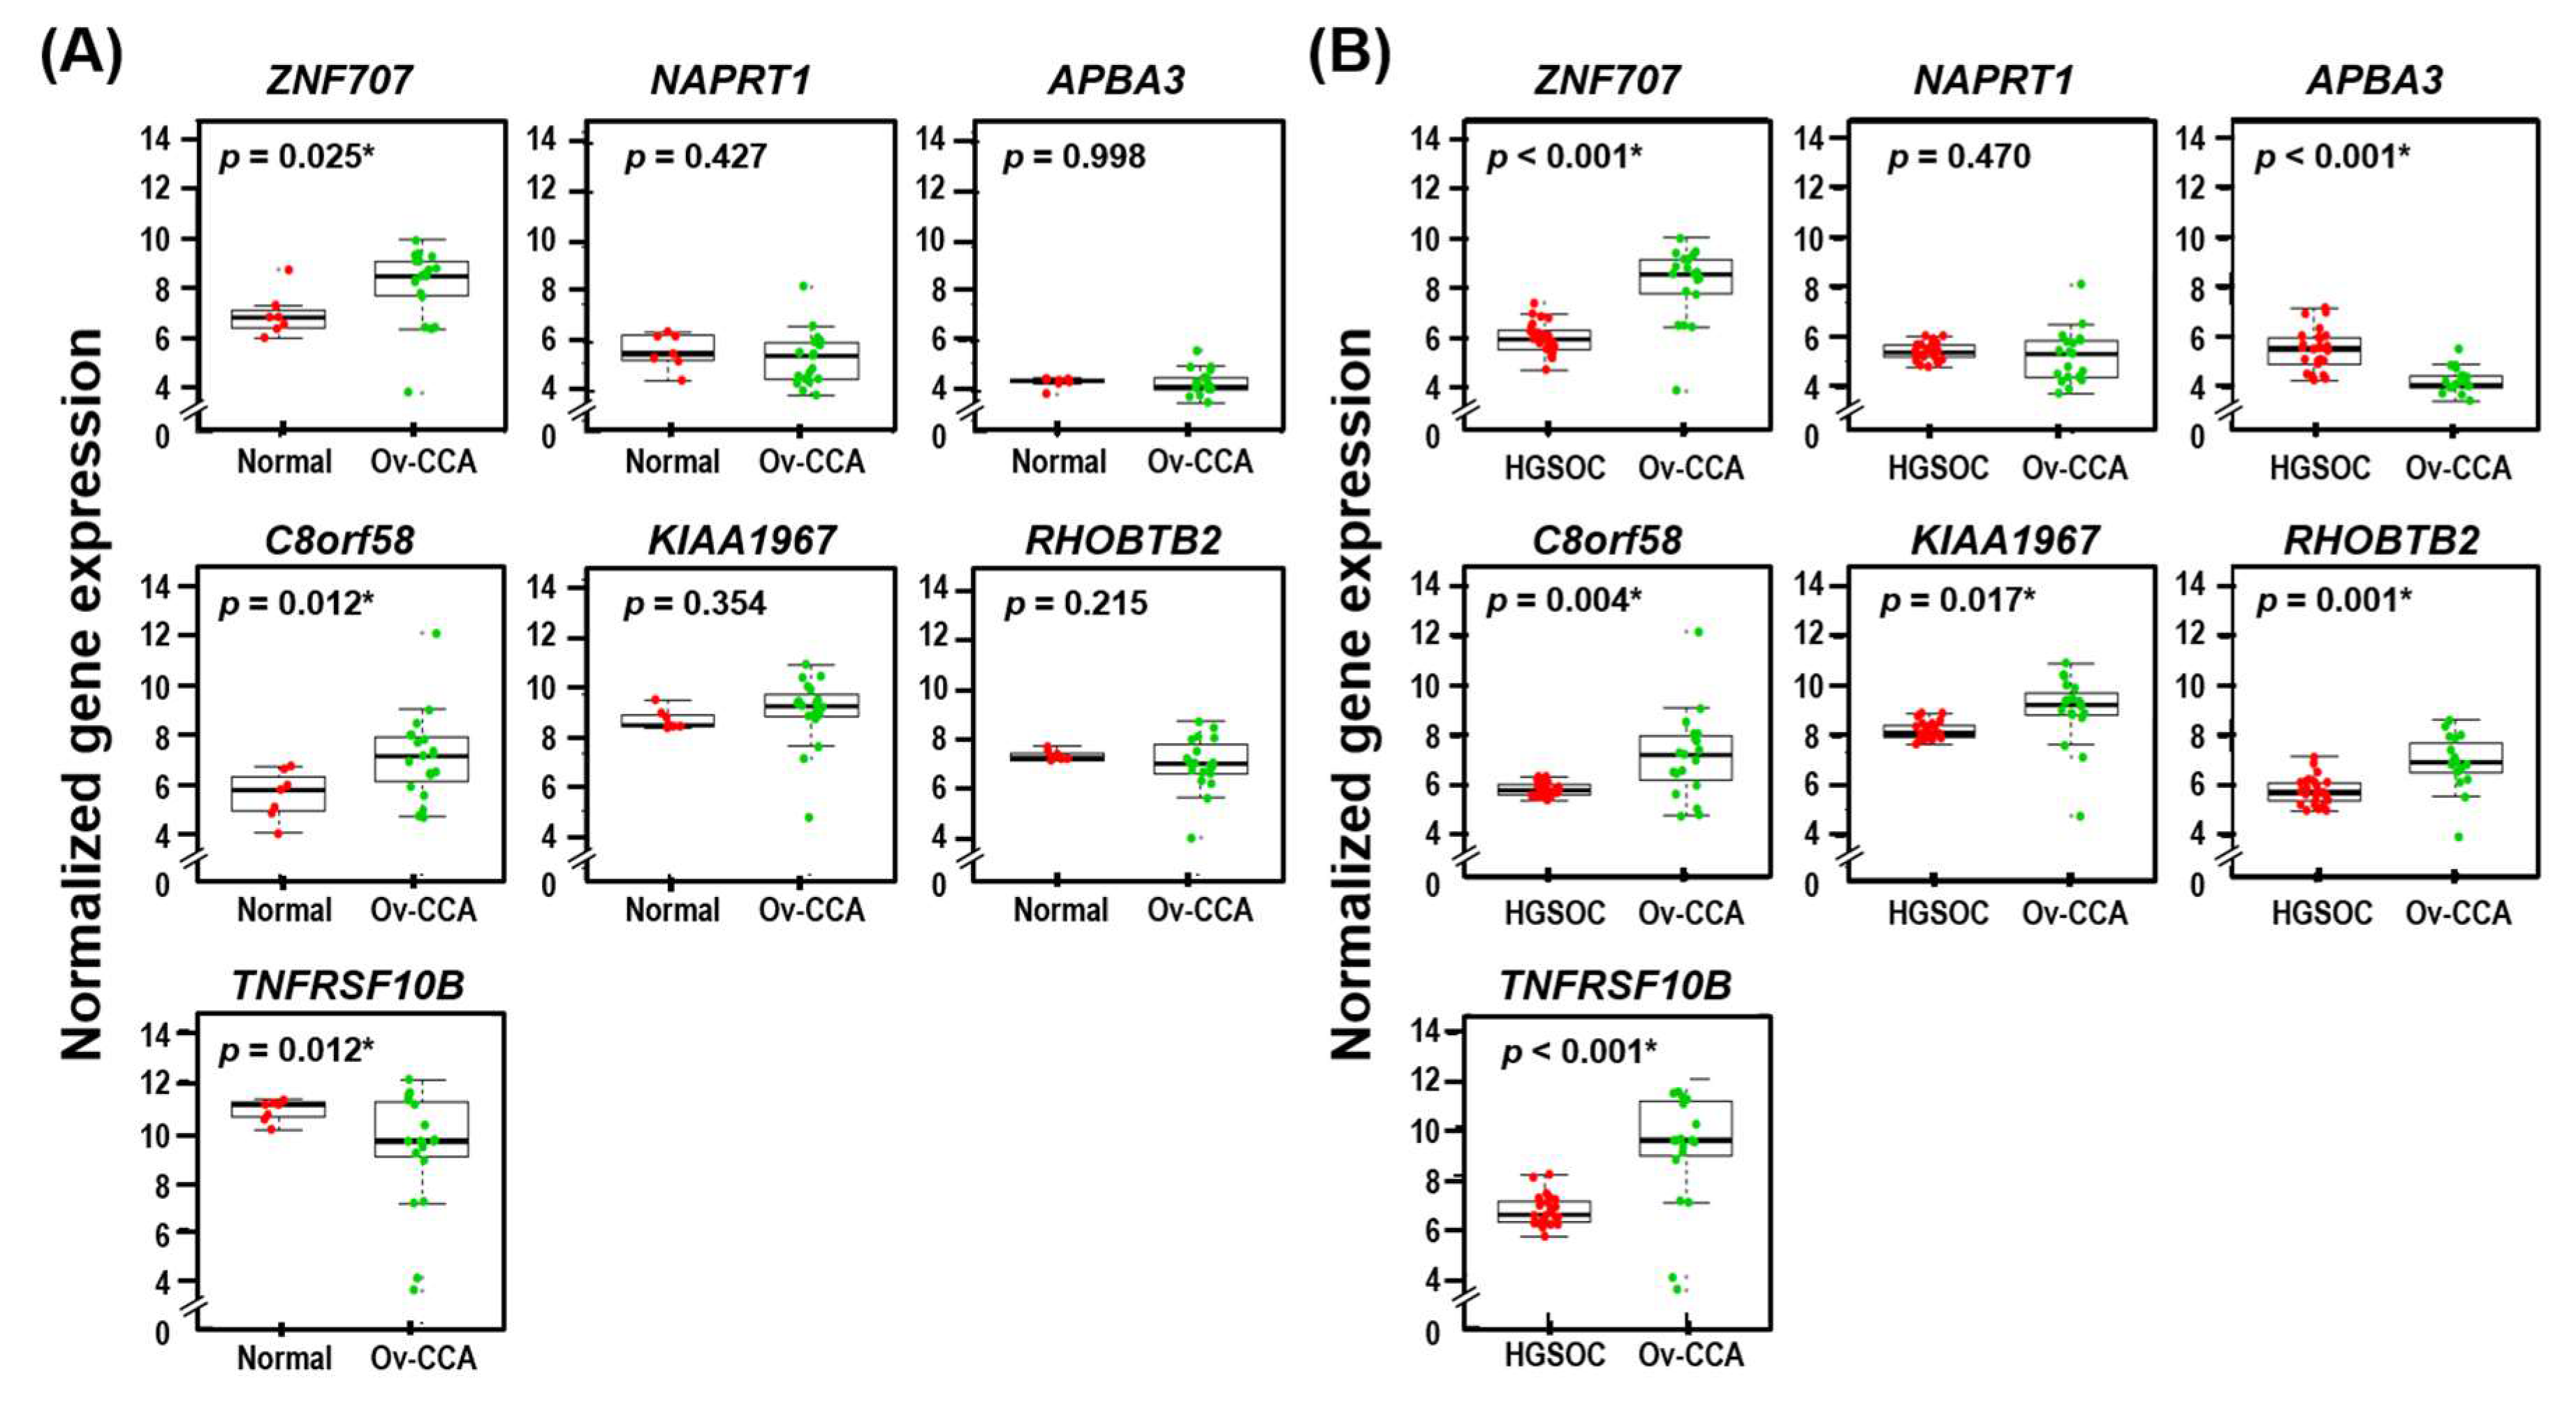
3.5. Seven Identified Genes Were Differentially Expressed in Ov-CCA Compared to Normal or HGSOC

Using the gene datasets from our sample cohort (7 normal ovarian tissue samples, 26 HGSOC samples, and 19 Ov-CCA samples), we examined the expression of the seven genes (APBA3, C8orf58, KIAA1967, NAPRT1, RHOBTB2, TNFRSF10B, and ZNF707) identified in this study. The clinicopathological features of EOC patients of our cohort are summarized in Table S5.
The expression of ZNF707 and C8orf58 (p = 0.025 and p = 0.012, respectively) in Ov-CCA was significantly higher than that of normal ovarian tissues. Meanwhile, the expression of TNFRSF10B (p = 0.012) was decreased significantly in Ov-CCA compared to normal ovarian tissue (Figure 3A).
Furthermore, we demonstrated that expression of ZNF707, C8orf58, KIAA1967, RHOBTB2, and TNFRSF10B was significantly increased in Ov-CCA in comparison to HGSOC (p < 0.001, p = 0.004, p = 0.017, p = 0.001, and p < 0.001, respectively), whereas expression of APBA3 was significantly lower in Ov-CCA (p < 0.001, Figure 3B).

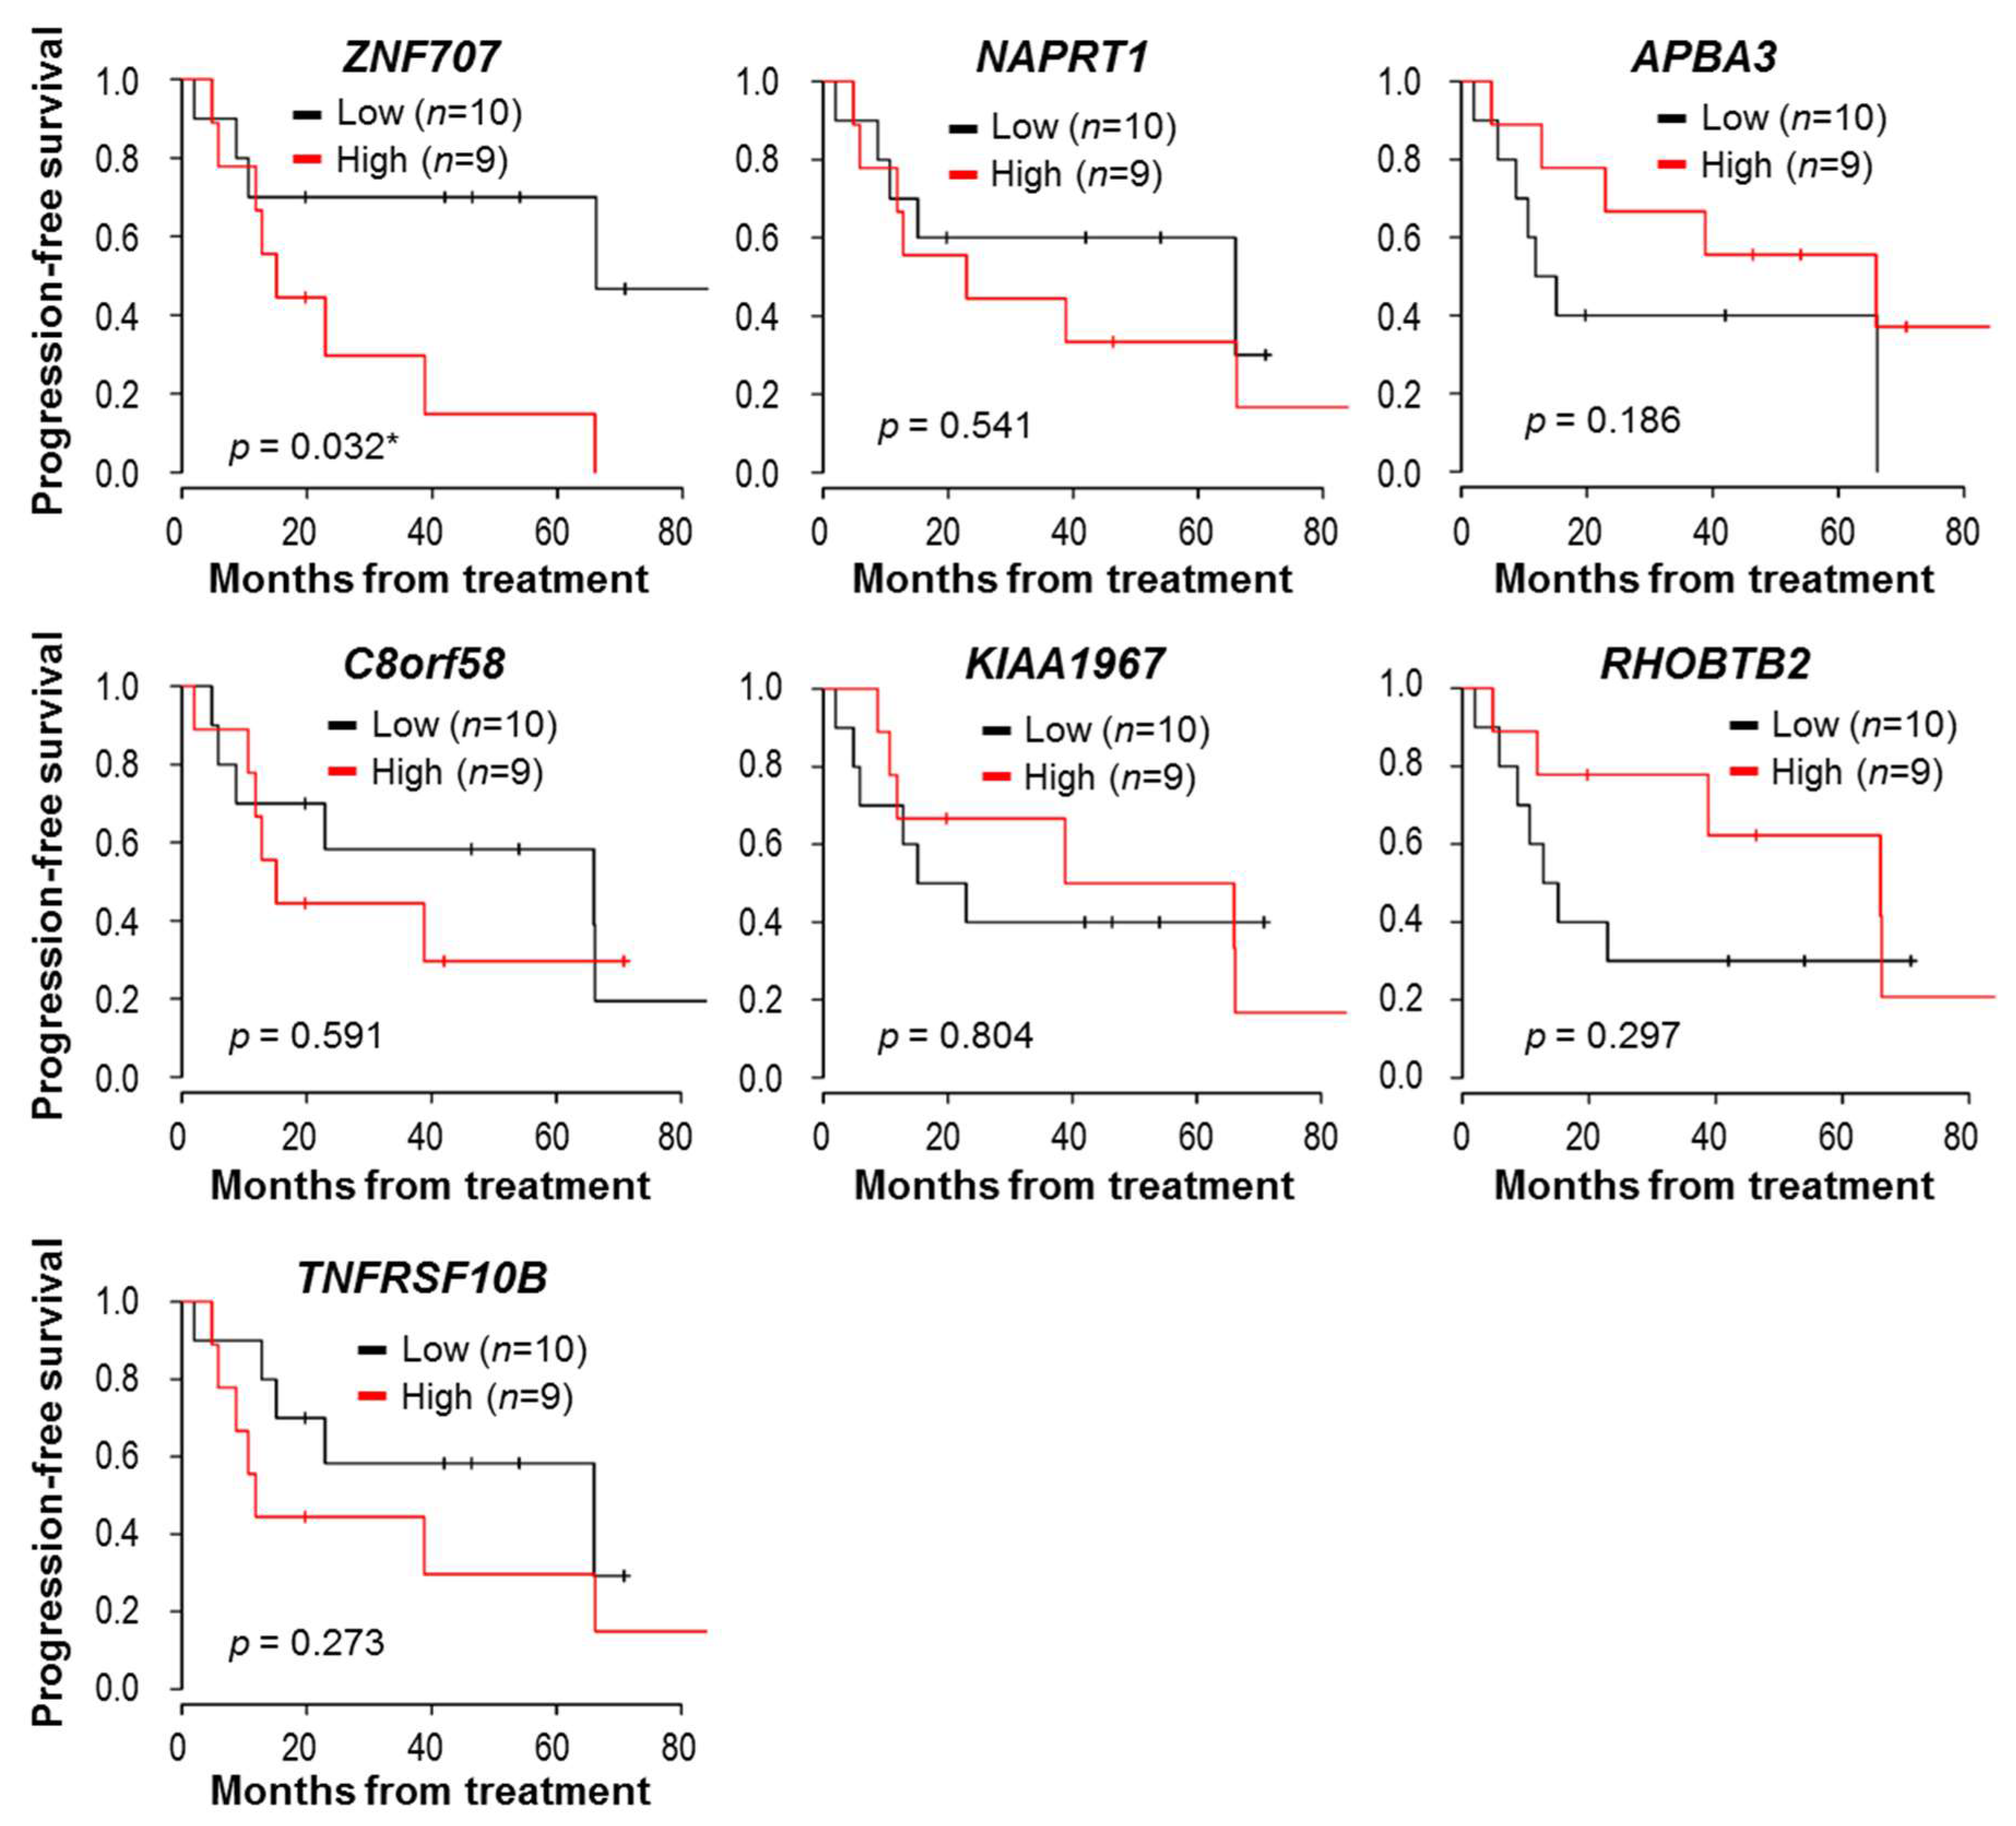
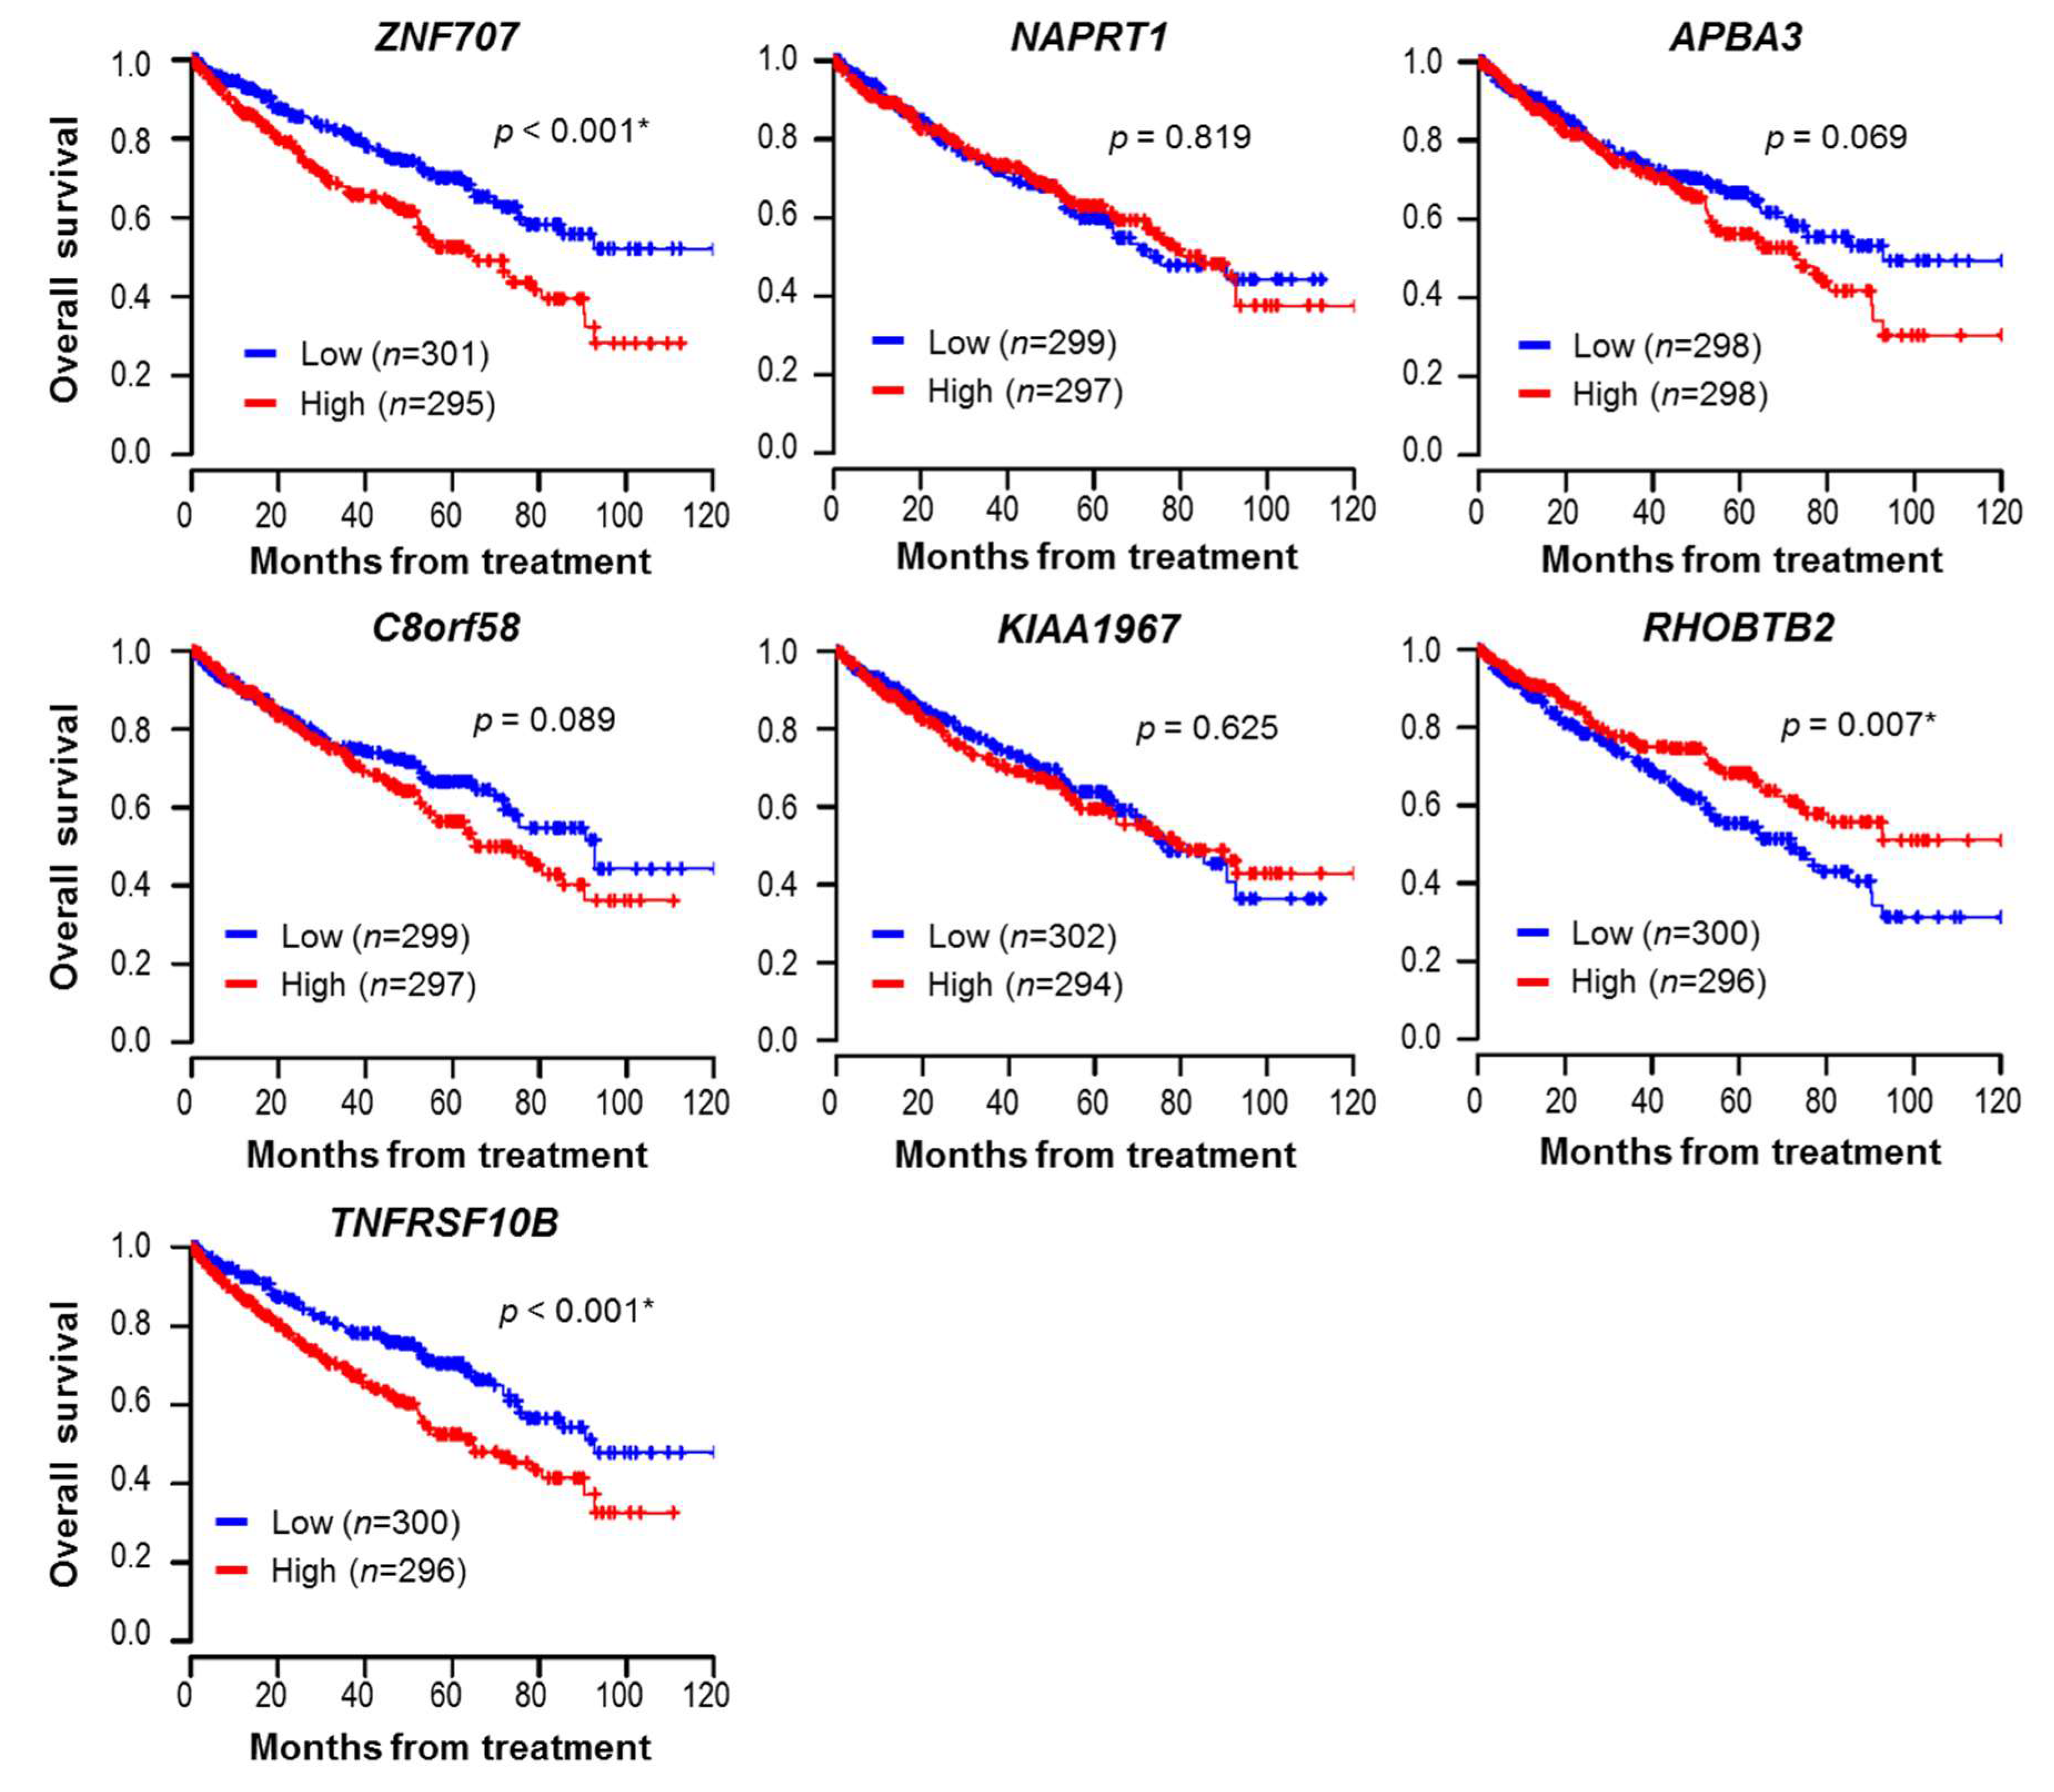
3.6. Prognostic Significance of the Identified Genes in Clear Cell Histology

The survival analysis was conducted using the datasets of our Ov-CCA and HGSOC samples. Although the analyzed sample was small, higher ZNF707 expression was statistically associated with decreased PFS in all stages of Ov-CCA sample analysis (p = 0.032) (Figure 4).
In addition, there was a significant association between C8orf58 and TNFRSF10B expression and PFS in the subset analysis with advanced-stage HGSOC (n = 26) and advanced-stage Ov-CCA (n = 10) samples (p = 0.009 and p = 0.025, respectively) (Figure S2). Meanwhile, there were no significant correlations between the identified genes and survival outcomes in the overall Ov-CCA and HGSOC dataset analysis (Figure S3).
Furthermore, to validate the above results in a relatively large cohort regardless of tissue origin, Kaplan–Meier plots of the TCGA-ccRCC datasets (n = 596) are presented in Figure 5. A higher expression of ZNF707 (median survival, 65.1 months vs. not reached; p < 0.001) or TNFRSF10B (64.9 months vs. 92.8 months, p < 0.001) and a lower expression of RHOBTB2 (71.8 months vs. not reached, p = 0.007) were significantly associated with decreased ccRCC patient overall survival. However, there were no significant survival differences for the seven genes in HGSOC (n = 265), as shown in Figure S4.

4. Discussion

Through multistep cis-eQTL analyses using HapMap3 dataset, four SNPs (rs4873815, rs12976454, rs11136002, and rs13259097) and seven associated genes (APBA3, C8orf58, KIAA1967, NAPRT1, RHOBTB2, TNFRSF10B, and ZNF707) were identified by differences in disease prevalence of Japanese ancestry. Of the seven genes identified, five (APBA3, KIAA1967, RHOBTB2, TNFRSF10B, and ZNF707) were reported in 94 previously identified genes, while the remaining two (C8orf58 and NAPRT1) are newly reported genes in Ov-CCA [19].
Multiple in silico and in vitro analyses were conducted to demonstrate the function of the four SNPs and seven associate genes in Ov-CCA. rs4873815-TT, which demonstrated enrichment in the Japanese ancestry compared to European and Chinese ancestries, induced promoter activity on ZNF707 compared to rs4873815-CC. In addition, rs11136002-TT, which was also enriched in the Japanese ancestry in comparison to the others, induced more promoter activity on the TNFRSF10B gene in comparison to rs11136002-CC. In expression analyses of our sample cohorts, ZNF707, C8orf58, and TNFRSF10B were differentially expressed in Ov-CCA compared to normal ovarian tissue or HGSOC. ZNF707, C8orf58, and TNFRSF10B showed significantly higher expression in Ov-CCA compared to HGSOC.
In survival analyses of our Ov-CCA cohort, only high expression of ZNF707 was associated with poor prognosis in Ov-CCA disease recurrence. To verify that these findings are consistently observed in large cohorts with similar molecular traits, survival analyses of the TCGA-ccRCC and TCGA-HGSOC datasets were conducted. High expression of ZNF707 and TNFRSF10B and low expression of RHOBTB2 were significantly associated with poor overall survival in the TCGA-ccRCC population, whereas there was no association in the HGSOC population.
These results demonstrate that the four susceptibility loci and seven identified genes, especially rs4873815-TT/ZNF707, may be plausible candidates for elucidating Ov-CCA carcinogenesis or prognostication. Moreover, high expression of ZNF707 may have prognostic power in clear cell histology regardless of tissue origin.
ZNF707 is one of the genes upregulated in EOC compared to normal human ovarian surface epithelial cells in cDNA microarray analysis (fold: 3.42, p < 0.05) [29]. Interestingly, Borghese et al. reported that ZNF707 is hypermethylated in ovarian endometrioma in comparison to eutopic endometrium (fold: 1.884) [30]. Given that endometriosis increases the risk of Ov-CCA [16], ZNF707 may play a functional role in tumorigenesis of endometriosis-associated Ov-CCA. Our findings support this rational assumption by deriving the result that ZNF707 is highly expressed in Ov-CCA and high ZNF707 expression has negative value in Ov-CCA prognostication. Based on previous research and our study findings, we suggest that ZNF707 may be involved in Ov-CCA tumorigenesis or prognostication.
Although the six remaining genes (APBA3, C8orf58, KIAA1967, NAPRT1, RHOBTB, and TNFRSF10B) did not show consistent association with survival outcome in EOC and clear cell histology, there have been several reports showing that the remaining genes are correlated with tumorigenesis in other cancers. TNFRSF10B is a member of the tumor necrosis factor (TNF) receptor superfamily that is activated by TNF-related apoptosis-inducing ligand (TRAIL), which has been demonstrated to induce selective apoptosis. Several polymorphisms and mutations of the TRAIL and TRAIL receptor genes have been suggested as risk or prognostic factors in lymphoid malignancies as well as breast, colon, liver, lung, and prostate cancer [31,32,33]. Specifically, loss of TNFRSF10B expression is a frequent event in hepatocellular carcinoma (HCC) [34] and lung [35] and testicular cancers [36].
RHOBTB2, also known as DBC2, is an important tumor suppressor gene related to various carcinomas, including those of the breast, bladder, colon, liver, lung, and prostate [37,38,39,40]. Furthermore, patients with RHOBTB2-negative breast cancer have been linked to poor prognosis, and RHOBTB2 silencing is an independent risk factor for breast cancer [40].
In addition, APBA3 promotes aerobic glycolysis by activating hypoxia-inducible factor 1 (HIF-1) in macrophages; therefore, inhibition of APBA3 in macrophages contributes to suppression of cancer cell metastasis [41]. C8orf58 is downregulated in HCC and coexpressed with MEG3 protein, which acts as a suppressor in tumor cells [42]. KIAA1967 has been reported as one of the fusion partners with FGFR2 by transcriptome sequencing in lung squamous cell carcinoma of the TCGA database [43]. Lastly, NAPRT1, a gene that codes for an NAD-producing enzyme, is amplified and overexpressed in a subset of common types of cancer, including ovarian cancer [44].
As we identified four SNPs and seven associated genes based on the difference of Ov-CCA prevalence by Japanese ancestry, the potential role of seven identified genes in Ov-CCA prognostication or tumorigenesis may be limited to Japanese ancestry. Given that ccRCC has a similar molecular profile to Ov-CCA [28], we performed expression and survival analyses to verify the clinical significance of seven associated genes with the TCGA-ccRCC dataset composed of various ancestries. In addition, further validation was conducted in a minority ancestry with our Korean EOC cohort. Through this multistep analysis using various cohorts, rs4873815-TT/ZNF707 demonstrated potential prognostic value in Ov-CCA patients. Although further investigation is needed, rs4873815-TT/ZNF707 may also have a prognostic power in clear cell histology regardless of cancer tissue.
Because the public Ov-CCA dataset was not available, the TCGA-ccRCC dataset was used as an alternative, based on the molecular similarity between ccRCC and Ov-CCA. In addition, our EOC cohort sample size was too small to generalize study findings. Six identified genes, excluding ZNF707, did not show significant differences or consistent results in the expression and survival analyses of Ov-CCA. It is possible that these six genes may have nothing to do with Ov-CCA tumorigenesis, that is, the risk locus can be an eQTL for the target gene, but this eQTL–target gene association may be independent of the risk of a specific trait [1]. However, the potential role of the remaining six genes should be comprehensively verified in the near future with relatively large and diverse Ov-CCA datasets.
In conclusion, we identified four SNPs and their seven associated genes in Ov-CCA through cis-eQTL analysis based on the differences in allelic frequencies of a Japanese ancestry. rs4873815-TT/ZNF707 may have clinical significance in the prognosis and tumorigenesis of Ov-CCA, which may be more relevant with clear cell histology.
This study suggests that cis-eQTL analysis using publicly available datasets may facilitate the discovery of novel genetic alterations in Ov-CCA and provide the basis for understanding its tumorigenesis. Although further investigation is needed to validate the potential role of the remaining six genes in Ov-CCA tumorigenesis, our findings support the existing evidence that genetic ancestry can be an attractive clue to complete the genomic landscape of complex diseases, such as cancer.

Supplementary Materials

The following are available online at https://0-www-mdpi-com.brum.beds.ac.uk/2077-0383/9/4/1137/s1. Figure S1: The results table with Ensembl Variant Effect Predictor (VEP) analysis of four susceptibility loci. Figure S2: Kaplan–Meier survival plot for seven genes in HGSOC (n = 26) and advanced-stage Ov-CCA (n = 10) samples. Figure S3: Kaplan–Meier survival plot for seven genes in all epithelial ovarian cancer samples (n = 45). Figure S4: Kaplan–Meier survival plot for seven genes in HGSOC populations (n = 265) of TCGA datasets. Table S1: Details of the HapMap3 dataset (release 3). Table S2: Details of the 935 identified SNPs. Table S3: Primers and sequencing result in Promoter assays. Table S4: Four SNPs with different allelic frequency between Japanese and Chinese populations. Table S5: Clinicopathologic characteristics of patients in our sample cohorts.

Author Contributions

Conceptualization, J.K., J.-Y.C., C.H.C., and S.M.H.; data curation, J.K.; formal analysis, J.K., J.-Y.C., J.R.H., C.H.C., and S.M.H.; investigation, J.R.H., Y.-Y.L., T.-J.K., J.-W.L., B.-G.K., D.-S.B., C.H.C., and S.M.H.; validation, Y.-Y.L., T.-J.K., J.-W.L., B.-G.K., and D.-S.B.; writing—original draft, J.K. and J.-Y.C.; writing—review & editing, J.K., J.R.H., C.H.C., and S.M.H. All authors have read and agreed to the published version of the manuscript.

Funding

This research was supported by grants from the Intramural Research Program of the National Institutes of Health (NIH), the National Cancer Institute (NCI), the Center for Cancer Research, and the Laboratory of Pathology at Samsung Medical Center (OTC1180321).

Conflicts of Interest

The authors declare no conflicts of interest.

References

  1. Nica, A.C.; Dermitzakis, E.T. Expression quantitative trait loci: Present and future. Philos. Trans. R. Soc. B Biol. Sci. 2013, 368, 20120362. [Google Scholar] [CrossRef]
  2. Chen, Q.R.; Hu, Y.; Yan, C.; Buetow, K.; Meerzaman, D. Systematic genetic analysis identifies Cis-eQTL target genes associated with glioblastoma patient survival. PLoS ONE 2014, 9, e105393. [Google Scholar] [CrossRef] [PubMed]
  3. Li, Q.; Stram, A.; Chen, C.; Kar, S.; Gayther, S.; Pharoah, P.; Haiman, C.; Stranger, B.; Kraft, P.; Freedman, M.L. Expression QTL-based analyses reveal candidate causal genes and loci across five tumor types. Hum. Mol. Genet. 2014, 23, 5294–5302. [Google Scholar] [CrossRef] [PubMed] [Green Version]
  4. Ward, L.D.; Kellis, M. Interpreting noncoding genetic variation in complex traits and human disease. Nat. Biotechnol. 2012, 30, 1095–1106. [Google Scholar] [CrossRef] [PubMed] [Green Version]
  5. Manolio, T.A. Genomewide association studies and assessment of the risk of disease. N. Engl. J. Med. 2010, 363, 166–176. [Google Scholar] [CrossRef] [PubMed] [Green Version]
  6. Freedman, M.L.; Monteiro, A.N.; Gayther, S.A.; Coetzee, G.A.; Risch, A.; Plass, C.; Casey, G.; De Biasi, M.; Carlson, C.; Duggan, D.; et al. Principles for the post-GWAS functional characterization of cancer risk loci. Nat. Genet. 2011, 43, 513–518. [Google Scholar] [CrossRef] [Green Version]
  7. Kelemen, L.E.; Lawrenson, K.; Tyrer, J.; Li, Q.; Lee, J.M.; Seo, J.H.; Phelan, C.M.; Beesley, J.; Chen, X.; Spindler, T.J.; et al. Genome-wide significant risk associations for mucinous ovarian carcinoma. Nat. Genet. 2015, 47, 888–897. [Google Scholar] [CrossRef]
  8. Lawrenson, K.; Song, F.; Hazelett, D.J.; Kar, S.P.; Tyrer, J.; Phelan, C.M.; Corona, R.I.; Rodriguez-Malave, N.I.; Seo, J.H.; Adler, E.; et al. Genome-wide association studies identify susceptibility loci for epithelial ovarian cancer in east Asian women. Gynecol. Oncol. 2019, 153, 343–355. [Google Scholar] [CrossRef]
  9. Pomerantz, M.M.; Shrestha, Y.; Flavin, R.J.; Regan, M.M.; Penney, K.L.; Mucci, L.A.; Stampfer, M.J.; Hunter, D.J.; Chanock, S.J.; Schafer, E.J.; et al. Analysis of the 10q11 cancer risk locus implicates MSMB and NCOA4 in human prostate tumorigenesis. PLoS Genet. 2010, 6, e1001204. [Google Scholar] [CrossRef]
  10. Li, Q.; Seo, J.H.; Stranger, B.; McKenna, A.; Pe’er, I.; Laframboise, T.; Brown, M.; Tyekucheva, S.; Freedman, M.L. Integrative eQTL-based analyses reveal the biology of breast cancer risk loci. Cell 2013, 152, 633–641. [Google Scholar] [CrossRef] [Green Version]
  11. Lawrenson, K.; Li, Q.; Kar, S.; Seo, J.H.; Tyrer, J.; Spindler, T.J.; Lee, J.; Chen, Y.; Karst, A.; Drapkin, R.; et al. Cis-eQTL analysis and functional validation of candidate susceptibility genes for high-grade serous ovarian cancer. Nat. Commun. 2015, 6, 8234. [Google Scholar] [CrossRef] [PubMed]
  12. McGuire, V.; Jesser, C.A.; Whittemore, A.S. Survival among U.S. women with invasive epithelial ovarian cancer. Gynecol. Oncol. 2002, 84, 399–403. [Google Scholar] [CrossRef]
  13. Heintz, A.P.; Odicino, F.; Maisonneuve, P.; Quinn, M.A.; Benedet, J.L.; Creasman, W.T.; Ngan, H.Y.; Pecorelli, S.; Beller, U. Carcinoma of the ovary. FIGO 26th Annual Report on the Results of Treatment in Gynecological Cancer. Int. J. Gynaecol. Obstet. 2006, 95 (Suppl. 1), S161–S192. [Google Scholar] [CrossRef]
  14. Anglesio, M.S.; Carey, M.S.; Kobel, M.; Mackay, H.; Huntsman, D.G. Vancouver Ovarian Clear Cell Symposium, S. Clear cell carcinoma of the ovary: A report from the first Ovarian Clear Cell Symposium, June 24th, 2010. Gynecol. Oncol. 2011, 121, 407–415. [Google Scholar] [CrossRef] [PubMed]
  15. Torre, L.A.; Bray, F.; Siegel, R.L.; Ferlay, J.; Lortet-Tieulent, J.; Jemal, A. Global cancer statistics, 2012. CA Cancer J. Clin. 2015, 65, 87–108. [Google Scholar] [CrossRef] [PubMed] [Green Version]
  16. Koshiyama, M.; Matsumura, N.; Konishi, I. Recent concepts of ovarian carcinogenesis: Type I and type II. Biomed. Res. Int. 2014, 2014, 934261. [Google Scholar] [CrossRef] [Green Version]
  17. Fejerman, L.; Stern, M.C.; John, E.M.; Torres-Mejia, G.; Hines, L.M.; Wolff, R.K.; Baumgartner, K.B.; Giuliano, A.R.; Ziv, E.; Perez-Stable, E.J.; et al. Interaction between common breast cancer susceptibility variants, genetic ancestry, and nongenetic risk factors in Hispanic women. Cancer Epidemiol. Prev. Biomark. 2015, 24, 1731–1738. [Google Scholar] [CrossRef] [Green Version]
  18. McKinnon, P.; Yuan, J.; Kensler, K.H.; Hu, Z.; Zhang, Y.; Zhang, T.; Jiang, J.; Xu, M.; Pan, Y.; Long, M.; et al. Integrative comparison of the genomic and transcriptomic landscape between prostate cancer patients of predominantly African or European genetic ancestry. PLoS Genet. 2020, 16. [Google Scholar] [CrossRef] [Green Version]
  19. Sung, C.O.; Choi, C.H.; Ko, Y.H.; Ju, H.; Choi, Y.L.; Kim, N.; Kang, S.Y.; Ha, S.Y.; Choi, K.; Bae, D.S.; et al. Integrative analysis of copy number alteration and gene expression profiling in ovarian clear cell adenocarcinoma. Cancer Genet. 2013, 206, 145–153. [Google Scholar] [CrossRef]
  20. Genomes Project, C.; Auton, A.; Brooks, L.D.; Durbin, R.M.; Garrison, E.P.; Kang, H.M.; Korbel, J.O.; Marchini, J.L.; McCarthy, S.; McVean, G.A.; et al. A global reference for human genetic variation. Nature 2015, 526, 68–74. [Google Scholar] [CrossRef] [Green Version]
  21. Yang, T.P.; Beazley, C.; Montgomery, S.B.; Dimas, A.S.; Gutierrez-Arcelus, M.; Stranger, B.E.; Deloukas, P.; Dermitzakis, E.T. Genevar: A database and Java application for the analysis and visualization of SNP-gene associations in eQTL studies. Bioinformatics 2010, 26, 2474–2476. [Google Scholar] [CrossRef] [PubMed] [Green Version]
  22. McLaren, W.; Gil, L.; Hunt, S.E.; Riat, H.S.; Ritchie, G.R.; Thormann, A.; Flicek, P.; Cunningham, F. The Ensembl Variant Effect Predictor. Genome Biol. 2016, 17, 122. [Google Scholar] [CrossRef] [PubMed] [Green Version]
  23. Fadista, J.; Oskolkov, N.; Hansson, O.; Groop, L. LoFtool: A gene intolerance score based on loss-of-function variants in 60 706 individuals. Bioinformatics 2017, 33, 471–474. [Google Scholar] [CrossRef] [PubMed]
  24. Gross, C.; de Ridder, D.; Reinders, M. Predicting variant deleteriousness in non-human species: Applying the CADD approach in mouse. BMC Bioinform. 2018, 19, 373. [Google Scholar] [CrossRef]
  25. Liu, L.; Pei, Y.F.; Liu, T.L.; Hu, W.Z.; Yang, X.L.; Li, S.C.; Hai, R.; Ran, S.; Zhao, L.J.; Shen, H.; et al. Identification of a 1p21 independent functional variant for abdominal obesity. Int. J. Obes. (London) 2019, 43, 2480–2490. [Google Scholar] [CrossRef]
  26. Choi, C.H.; Choi, J.J.; Park, Y.A.; Lee, Y.Y.; Song, S.Y.; Sung, C.O.; Song, T.; Kim, M.K.; Kim, T.J.; Lee, J.W.; et al. Identification of differentially expressed genes according to chemosensitivity in advanced ovarian serous adenocarcinomas: Expression of GRIA2 predicts better survival. Br. J. Cancer 2012, 107, 91–99. [Google Scholar] [CrossRef]
  27. Taminau, J.; Meganck, S.; Lazar, C.; Steenhoff, D.; Coletta, A.; Molter, C.; Duque, R.; de Schaetzen, V.; Weiss Solis, D.Y.; Bersini, H.; et al. Unlocking the potential of publicly available microarray data using inSilicoDb and inSilicoMerging R/Bioconductor packages. BMC Bioinform. 2012, 13, 335. [Google Scholar] [CrossRef]
  28. Ji, J.X.; Wang, Y.K.; Cochrane, D.R.; Huntsman, D.G. Clear cell carcinomas of the ovary and kidney: Clarity through genomics. J. Pathol. 2018, 244, 550–564. [Google Scholar] [CrossRef] [Green Version]
  29. Cho, H.; Lee, Y.S.; Kim, J.; Chung, J.Y.; Kim, J.H. Overexpression of glucose transporter-1 (GLUT-1) predicts poor prognosis in epithelial ovarian cancer. Cancer Investig. 2013, 31, 607–615. [Google Scholar] [CrossRef]
  30. Borghese, B.; Barbaux, S.; Mondon, F.; Santulli, P.; Pierre, G.; Vinci, G.; Chapron, C.; Vaiman, D. Research resource: Genome-wide profiling of methylated promoters in endometriosis reveals a subtelomeric location of hypermethylation. Mol. Endocrinol. 2010, 24, 1872–1885. [Google Scholar] [CrossRef] [Green Version]
  31. Lee, S.H.; Shin, M.S.; Kim, H.S.; Lee, H.K.; Park, W.S.; Kim, S.Y.; Lee, J.H.; Han, S.Y.; Park, J.Y.; Oh, R.R.; et al. Somatic mutations of TRAIL-receptor 1 and TRAIL-receptor 2 genes in non-Hodgkin’s lymphoma. Oncogene 2001, 20, 399–403. [Google Scholar] [CrossRef] [PubMed] [Green Version]
  32. Langsenlehner, T.; Langsenlehner, U.; Renner, W.; Kapp, K.S.; Krippl, P.; Hofmann, G.; Clar, H.; Pummer, K.; Mayer, R. The Glu228Ala polymorphism in the ligand binding domain of death receptor 4 is associated with increased risk for prostate cancer metastases. Prostate 2008, 68, 264–268. [Google Scholar] [CrossRef] [PubMed]
  33. Jung, J.H.; Chae, Y.S.; Moon, J.H.; Kang, B.W.; Kim, J.G.; Sohn, S.K.; Park, J.Y.; Lee, M.H.; Park, H.Y. TNF superfamily gene polymorphism as prognostic factor in early breast cancer. J. Cancer Res. Clin. Oncol. 2010, 136, 685–694. [Google Scholar] [CrossRef] [PubMed]
  34. Wen, J.; Song, C.; Liu, J.; Chen, J.; Zhai, X.; Hu, Z. Expression quantitative trait loci for TNFRSF10 influence both HBV infection and hepatocellular carcinoma development. J. Med. Virol. 2016, 88, 474–480. [Google Scholar] [CrossRef] [PubMed]
  35. Zhao, X.; Liu, X.; Su, L. Parthenolide induces apoptosis via TNFRSF10B and PMAIP1 pathways in human lung cancer cells. J. Exp. Clin. Cancer Res. 2014, 33, 3. [Google Scholar] [CrossRef] [PubMed] [Green Version]
  36. Beyer, U.; Kronung, S.K.; Leha, A.; Walter, L.; Dobbelstein, M. Comprehensive identification of genes driven by ERV9-LTRs reveals TNFRSF10B as a re-activatable mediator of testicular cancer cell death. Cell Death Differ. 2016, 23, 64–75. [Google Scholar] [CrossRef] [PubMed] [Green Version]
  37. Emi, M.; Fujiwara, Y.; Nakajima, T.; Tsuchiya, E.; Tsuda, H.; Hirohashi, S.; Maeda, Y.; Tsuruta, K.; Miyaki, M.; Nakamura, Y. Frequent loss of heterozygosity for loci on chromosome 8p in hepatocellular carcinoma, colorectal cancer, and lung cancer. Cancer Res. 1992, 52, 5368–5372. [Google Scholar]
  38. Lundgren, R.; Mandahl, N.; Heim, S.; Limon, J.; Henrikson, H.; Mitelman, F. Cytogenetic analysis of 57 primary prostatic adenocarcinomas. Genes Chromosomes Cancer 1992, 4, 16–24. [Google Scholar] [CrossRef]
  39. Knowles, M.A.; Aveyard, J.S.; Taylor, C.F.; Harnden, P.; Bass, S. Mutation analysis of the 8p candidate tumour suppressor genes DBC2 (RHOBTB2) and LZTS1 in bladder cancer. Cancer Lett. 2005, 225, 121–130. [Google Scholar] [CrossRef]
  40. Mao, H.; Qu, X.; Yang, Y.; Zuo, W.; Bi, Y.; Zhou, C.; Yin, H.; Deng, B.; Sun, J.; Zhang, L. A novel tumor suppressor gene RhoBTB2 (DBC2): Frequent loss of expression in sporadic breast cancer. Mol. Carcinog. 2010, 49, 283–289. [Google Scholar] [CrossRef]
  41. Hara, T.; Nakaoka, H.J.; Hayashi, T.; Mimura, K.; Hoshino, D.; Inoue, M.; Nagamura, F.; Murakami, Y.; Seiki, M.; Sakamoto, T. Control of metastatic niche formation by targeting APBA3/Mint3 in inflammatory monocytes. Proc. Natl. Acad. Sci. USA 2017, 114, E4416–E4424. [Google Scholar] [CrossRef] [PubMed] [Green Version]
  42. Zhang, L.; Liu, X.; Zhang, X.; Chen, R. Identification of important long non-coding RNAs and highly recurrent aberrant alternative splicing events in hepatocellular carcinoma through integrative analysis of multiple RNA-Seq datasets. Mol. Genet. Genom. 2016, 291, 1035–1051. [Google Scholar] [CrossRef] [PubMed]
  43. Wu, Y.M.; Su, F.; Kalyana-Sundaram, S.; Khazanov, N.; Ateeq, B.; Cao, X.; Lonigro, R.J.; Vats, P.; Wang, R.; Lin, S.F.; et al. Identification of targetable FGFR gene fusions in diverse cancers. Cancer Discov. 2013, 3, 636–647. [Google Scholar] [CrossRef] [PubMed] [Green Version]
  44. Piacente, F.; Caffa, I.; Ravera, S.; Sociali, G.; Passalacqua, M.; Vellone, V.G.; Becherini, P.; Reverberi, D.; Monacelli, F.; Ballestrero, A.; et al. Nicotinic Acid Phosphoribosyltransferase Regulates Cancer Cell Metabolism, Susceptibility to NAMPT Inhibitors, and DNA Repair. Cancer Res. 2017, 77, 3857–3869. [Google Scholar] [CrossRef] [Green Version]
Figure 1. Identification of Susceptibility Loci and Associated Genes through cis-eQTL Analysis. (A) Flowchart of the study. (B) Four single-nucleotide polymorphisms (SNPs) differentially distributed among European (CEU), Chinese (CHB), and Japanese (JPT) populations. p-values < 0.001 are flagged with asterisk (*).
Jcm 09 01137 g001
Figure 2. Promoter activity of (A) rs11136002/TNFRSF10B and (B) rs4873815/ZNF707. Compared to the pGL3 vector, Allele CC and Allele TT exhibited significant induction of promoter activities in each locus. Between the two allele constructs (CC vs. TT), the transcriptional activity of TT was significantly higher than that of CC in both loci, implying that the transcription regulation is allele-specific in both genes. Each bar represents mean ± SEM of firefly luciferase activity normalized to Renilla luciferase activity. * p < 0.05, ** p < 0.01, *** p < 0.001.
Jcm 09 01137 g002
Figure 3. Expression of seven identified genes of our ovarian sample cohorts. (A) between normal ovarian tissue samples (n = 7) and Ov-CCA (n = 19) samples and (B) between high-grade serous ovarian cancer (HGSOC; n = 26) and Ov-CCA (n = 19) samples. p-values < 0.05 are flagged with an asterisk (*).
Jcm 09 01137 g003
Figure 4. Kaplan–Meier survival plot for seven genes in all stages of Ov-CCA (n = 19) samples. Expression values of each gene were dichotomized into high and low expression using the median as a cutoff. Black line: low expression, red line: high expression. p-values < 0.05 are flagged with an asterisk (*).
Jcm 09 01137 g004
Figure 5. Kaplan–Meier survival plot for seven genes in clear cell renal cell carcinoma (ccRCC) populations (n = 596) of The Cancer Genome Atlas (TCGA) datasets. Overall survival analysis was performed using the TCGA-ccRCC dataset. Expression values of each gene were dichotomized into high and low expression using the median as a cutoff. Blue line: low expression, red line: high expression. p-values < 0.05 are flagged with an asterisk (*).
Jcm 09 01137 g005
Table 1. Four SNPs and seven associated genes of ovarian clear cell adenocarcinoma (Ov-CCA).
SNPChr.CytobandSNP PositionTranscripts
Associated
in cis
Gene StartGene Endp-Value
rs487381588q24.3144796206ZNF7071448245161448495148.92e−4
8q24.3 NAPRT11447281011447316564.41e−4
rs129764541919p13.33495971APBA3370177137126733.40e−4
rs1113600288p21.322273027C8orf5822513067225176055.53e−4
8p21.3 KIAA196722518202225339209.19e−4
8p21.3 RHOBTB222913059229336553.12e−4
TNFRSF10B22933598229826374.03e−4
rs1325909788p21.322189689RHOBTB222913059229336553.87e−4
SNP, Single-nucleotide polymorphism; Chr., chromosome.

