
Enhancement in Interply Toughness of BMI Composites Using Micro-Thin Films


School of Mechanical & Aerospace Engineering, Nanyang Technological University, Singapore 639 798, Singapore
*
Authors to whom correspondence should be addressed.
J. Compos. Sci. 2021, 5(2), 49; https://0-doi-org.brum.beds.ac.uk/10.3390/jcs5020049
Submission received: 19 January 2021
/
Revised: 31 January 2021
/
Accepted: 2 February 2021
/
Published: 4 February 2021
(This article belongs to the Special Issue Feature Papers in Journal of Composites Science in 2021)
Abstract
:Nowadays, laminated composites are widely used in the aerospace sector. All laminates have interply/interlaminar interfaces even if they are made using automated processes. The interfaces act as the areas of weaknesses and the potential crack initiation regions. Hence, any enhancement in the crack initiation and propagation resistance is always sought after. Usage of polymeric thin films is one of the promising and viable ways to achieve this. It is also easy to incorporate micro-thin films into any automation process. In the present study, different customized thin films that are compatible with Glass/BMI composites are fabricated. Fracture toughness tests in Mode I (opening mode), Mode II (sliding mode) and Mixed Mode I/II are conducted respectively using Double Cantilever Beam (DCB), End Notch Flexure (ENF) and Mixed Mode Bending (MMB) test specimens. This paper discusses the manufacturing of compatible micro-thin films. The various challenges faced during the manufacturing and incorporation of thin films are presented. The results of the various fracture toughness tests are examined. Mechanisms through which the different films help in resisting the crack initiation and propagation are deliberated and discussed. The incorporation of this technique in Automated Fiber Placement (AFP) is also discussed.
1. Introduction
Fiber-reinforced composites are now receiving greater attention in both the research and industrial communities. Industrial applications have been successful in various fields including aerospace, construction, automobile, sporting goods, marine and power plants [1]. Most of the composites used currently are laminated, consisting of many numbers of plies stacked one over the other in any desired configuration and proper load transfer between these plies is of utmost importance. The region between two neighboring plies, known as the interlaminar region plays a major role in this load transfer. There is a high chance of fracture occurring in this region owing to crack propagation, which may lead to delamination. The interfaces so developed act as areas of weaknesses and potential crack initiation regions. Hence, strengthening the interfaces is of paramount importance to fully exploit the potential of composites [2,3,4,5].
The layer to layer architecture of the laminates has a direct influence on their impact resistance. Various studies have acknowledged that Compression After Impact (CAI) properties could be vastly improved upon interleaving with a film having a much higher intrinsic toughness than the matrix [6,7,8]. The presence of a toughened interlaminar layer suppresses or delays interlaminar damage, and the resistance to delamination of the laminates under impact loading is significantly improved [1,9]. It is also shown to reduce the level of damage induced by a given impact energy. Also, damaged interleaved composites exhibited higher load bearing capability when compared with the non-interleaved equivalent [10]. This method, known as the ex-situ concept, has been proved successful in epoxy-based laminates [11].
The present research used glass/Bismaleimide (BMI) prepreg and thin in-house manufactured thermoplastic films. The glass/BMI prepreg (HTM556/GF0301) used in this study was procured from Argosy International Inc. The films were made from ELVAX 3185, a copolymer of Ethylene Vinyl Acetate (EVA) pellets procured from DuPont, USA. EVA was chosen because of the easy availability, low cost and more importantly, the compatibility with the prepreg used. The performance of the thin film interleaved laminated composites was investigated in this work.
2. Background
Bismaleimides (BMIs) are structural resins with high performance, exemplary chemical and corrosion resistance, heat resistance, “hot-wet” properties and excellent mechanical property retention at elevated temperatures when compared with epoxy systems. However, the use of composites based on BMI in the primary structures of aircraft has been limited mostly by poor damage resistance and degradation in the compression strength after impact (CAI).
One of the acknowledged methods to improve the toughness is by incorporating a suitable thermoplastic component into the BMI matrix system to form a toughened two-phase microstructure [11]. However, this method cannot be adopted universally, especially to a commonly used BMI based prepreg system. Interleaving of thermoplastic films in between BMI-based prepreg plies to improve the fracture toughness of the laminate is certainly a viable option in such cases [10].
Therefore, the procured thermoplastic pellets were separately converted into custom-made thin films for easy interleaving. This offered many advantages over ready-made films, procuring directly from companies. Films could be made to any desired thicknesses, any sort of contamination could be avoided, and there were no unknowns. The custom-made thin films were then carefully interleaved between the BMI prepreg layers during laying up and subsequently co-cured in an autoclave.
The effectiveness of the interleaved film and the role of the film thickness were studied in Mode I, Mode II, as well Mixed Mode cases according to ASTM D5528, ASTM D7905 and ASTM D6671 standards respectively [12,13,14]. A mixed-mode test was important, as in reality, the different modes of failure mostly occur simultaneously and in a coupled manner. Among the many available test specimens, Double Cantilever Beam (DCB), End Notch Flexure (ENF) and Mixed Mode Bending (MMB) specimens were used for these studies.
3. Materials and Methods
3.1. Thermoplastic Films Fabrication
To begin with, finding a suitable thermoplastic material that was compatible with Glass/BMI prepregs was of vital importance. The main criterion to be satisfied was that the film’s curing temperature should be around the curing temperature of the glass/BMI prepreg. The chosen thermoplastic should also infuse and bond well with the prepreg. The glass/BMI prepreg had its maximum curing temperature at 190 °C, so ideally a film that cures along with the prepreg was required.
To identify a compatible thermoplastic material, an extensive literature survey was carried out (e.g., [1,7,10,15,16,17,18,19,20,21,22,23,24,25,26,27,28,29,30,31,32,33,34]). A few materials were selected initially and their characteristics after melting as well as during the cool down process were studied. This was carried out by heating a small quantity of the material to a temperature higher than its melting point and then subsequently cooling it. The flowability and plasticity of the material were examined, and the best material found was EVA. It was selected for incorporation during the further stages of the research.
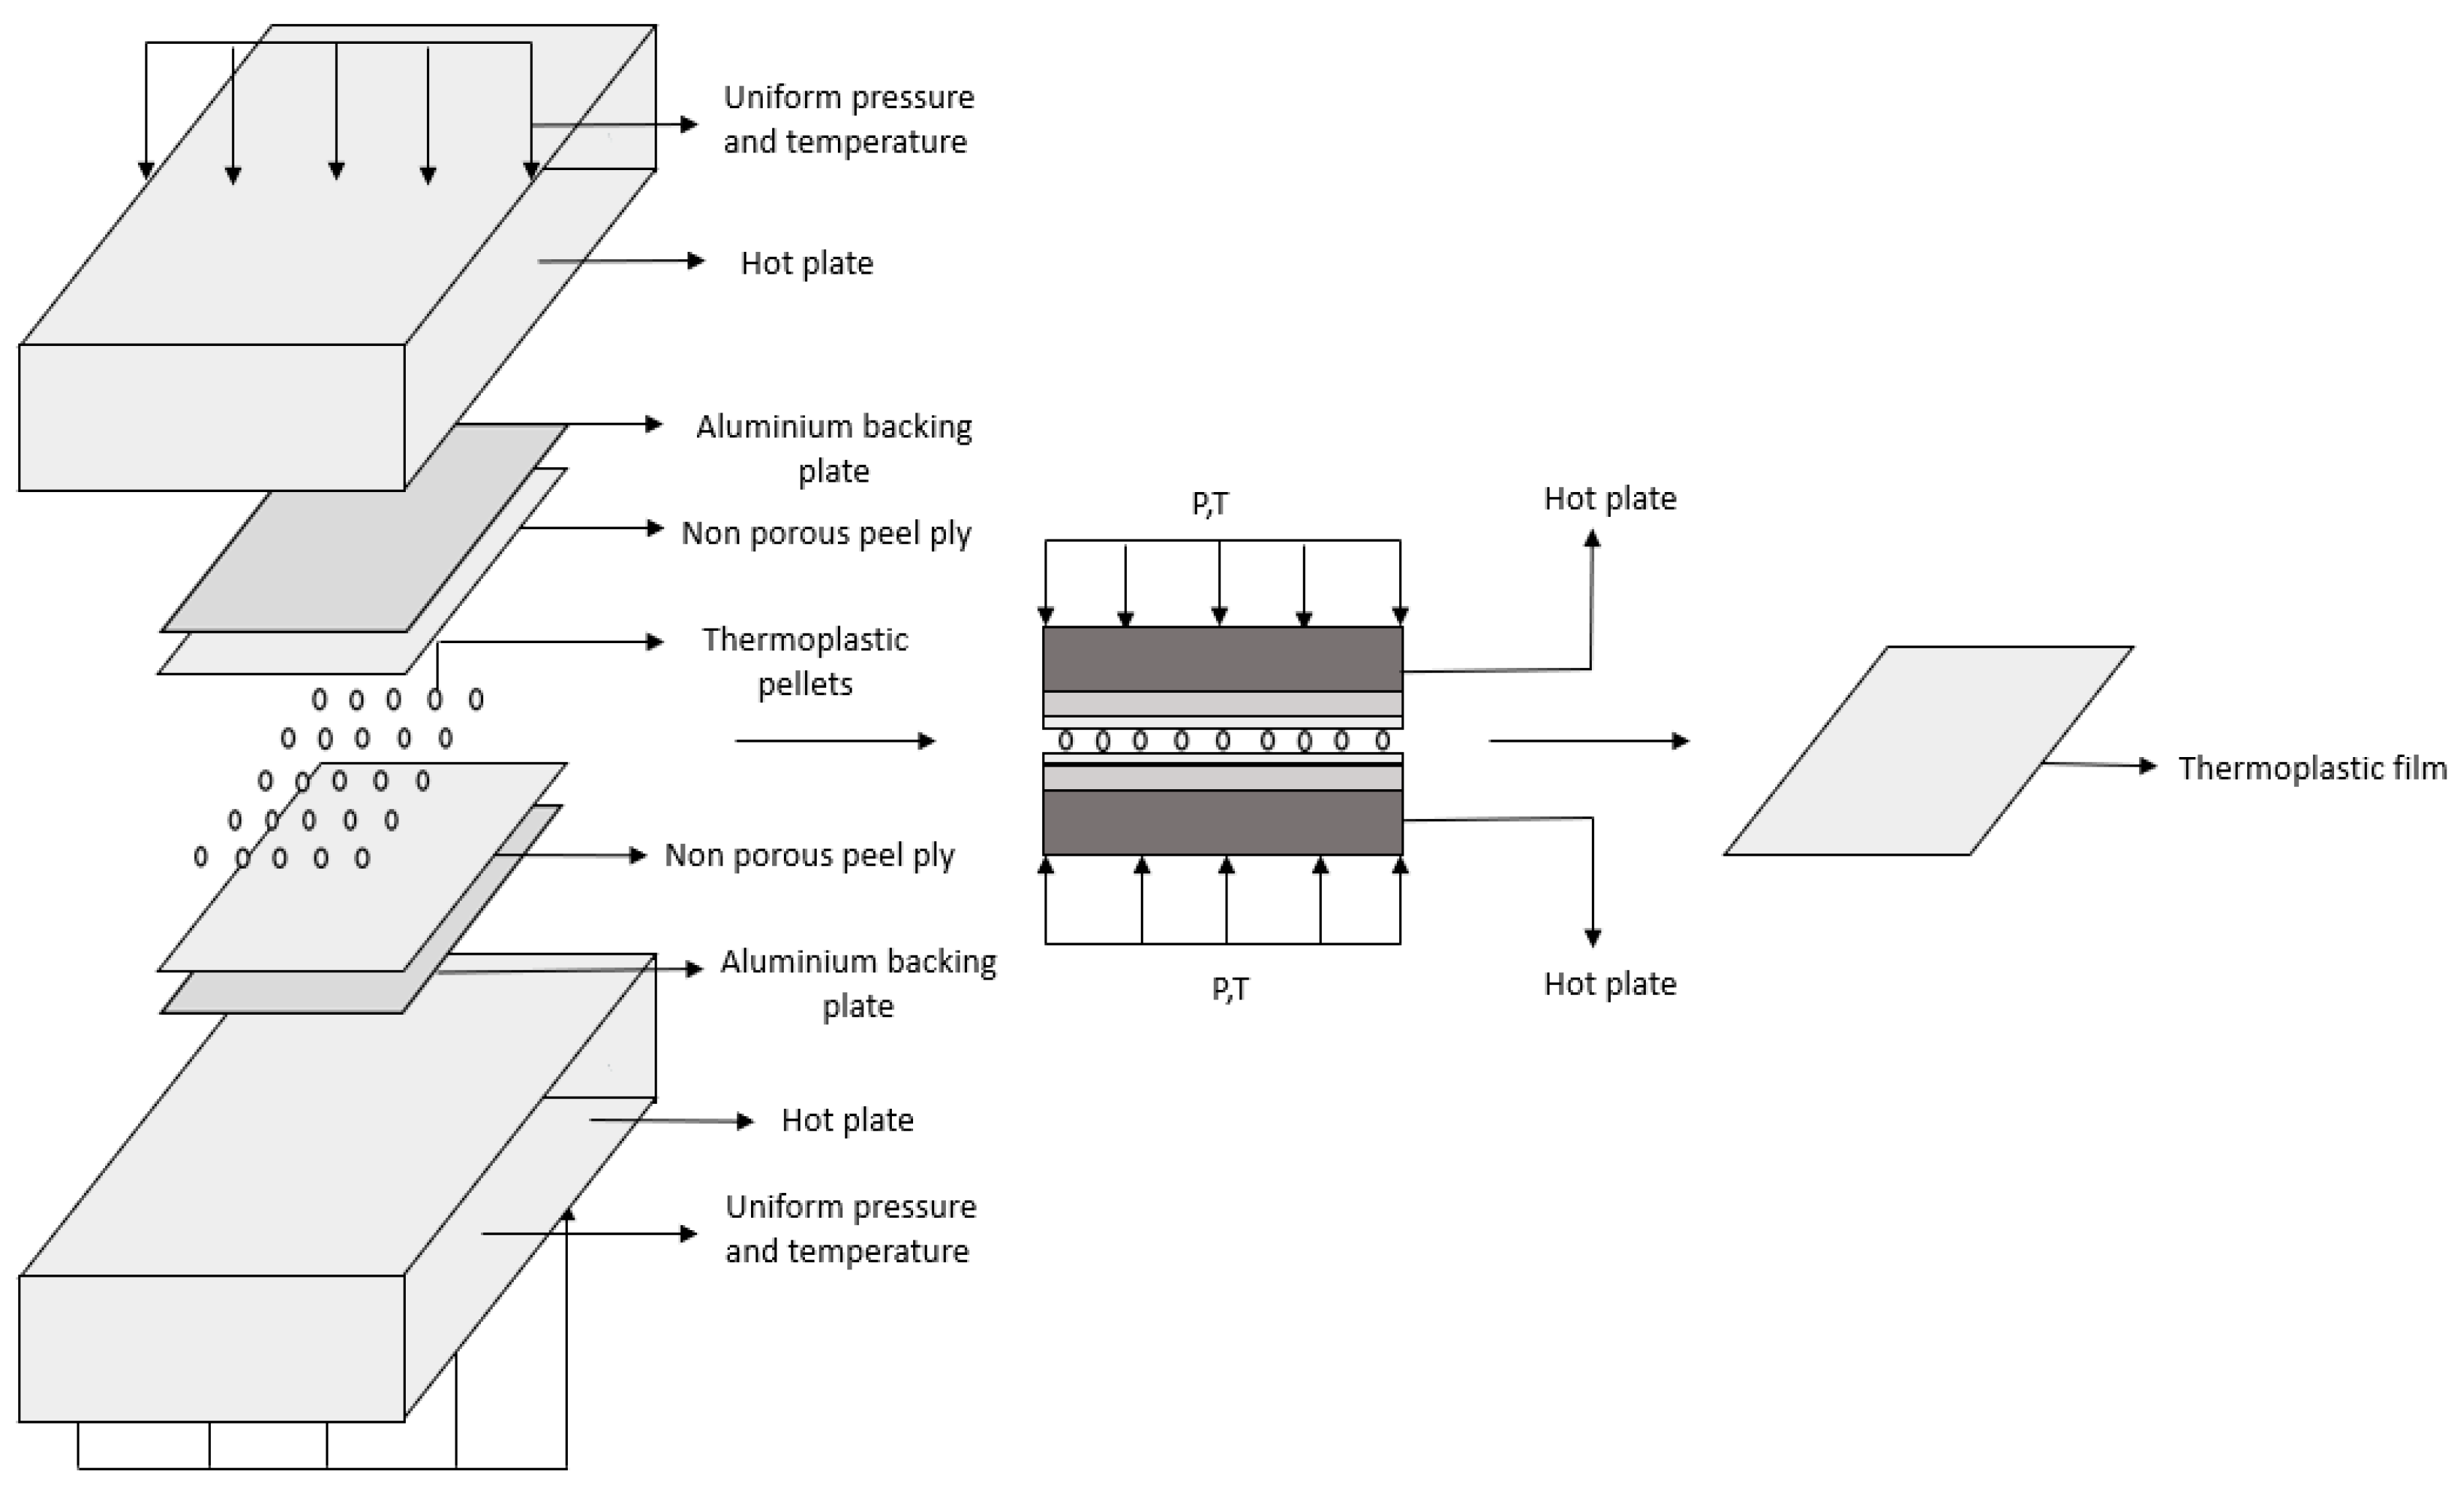
The thermoplastic films used in this study were fabricated from EVA pellets using a hot press. The schematic of the thermoplastic film fabrication is shown in Figure 1. In the first step, thermoplastic pellets were spread evenly on a non-porous sheet placed over an aluminum backing plate free of surface defects. It transmitted normal pressure and temperature and provided a smooth surface on the finished thermoplastic film. Another non-sticky ply and a plate was placed over the evenly spread pellets.
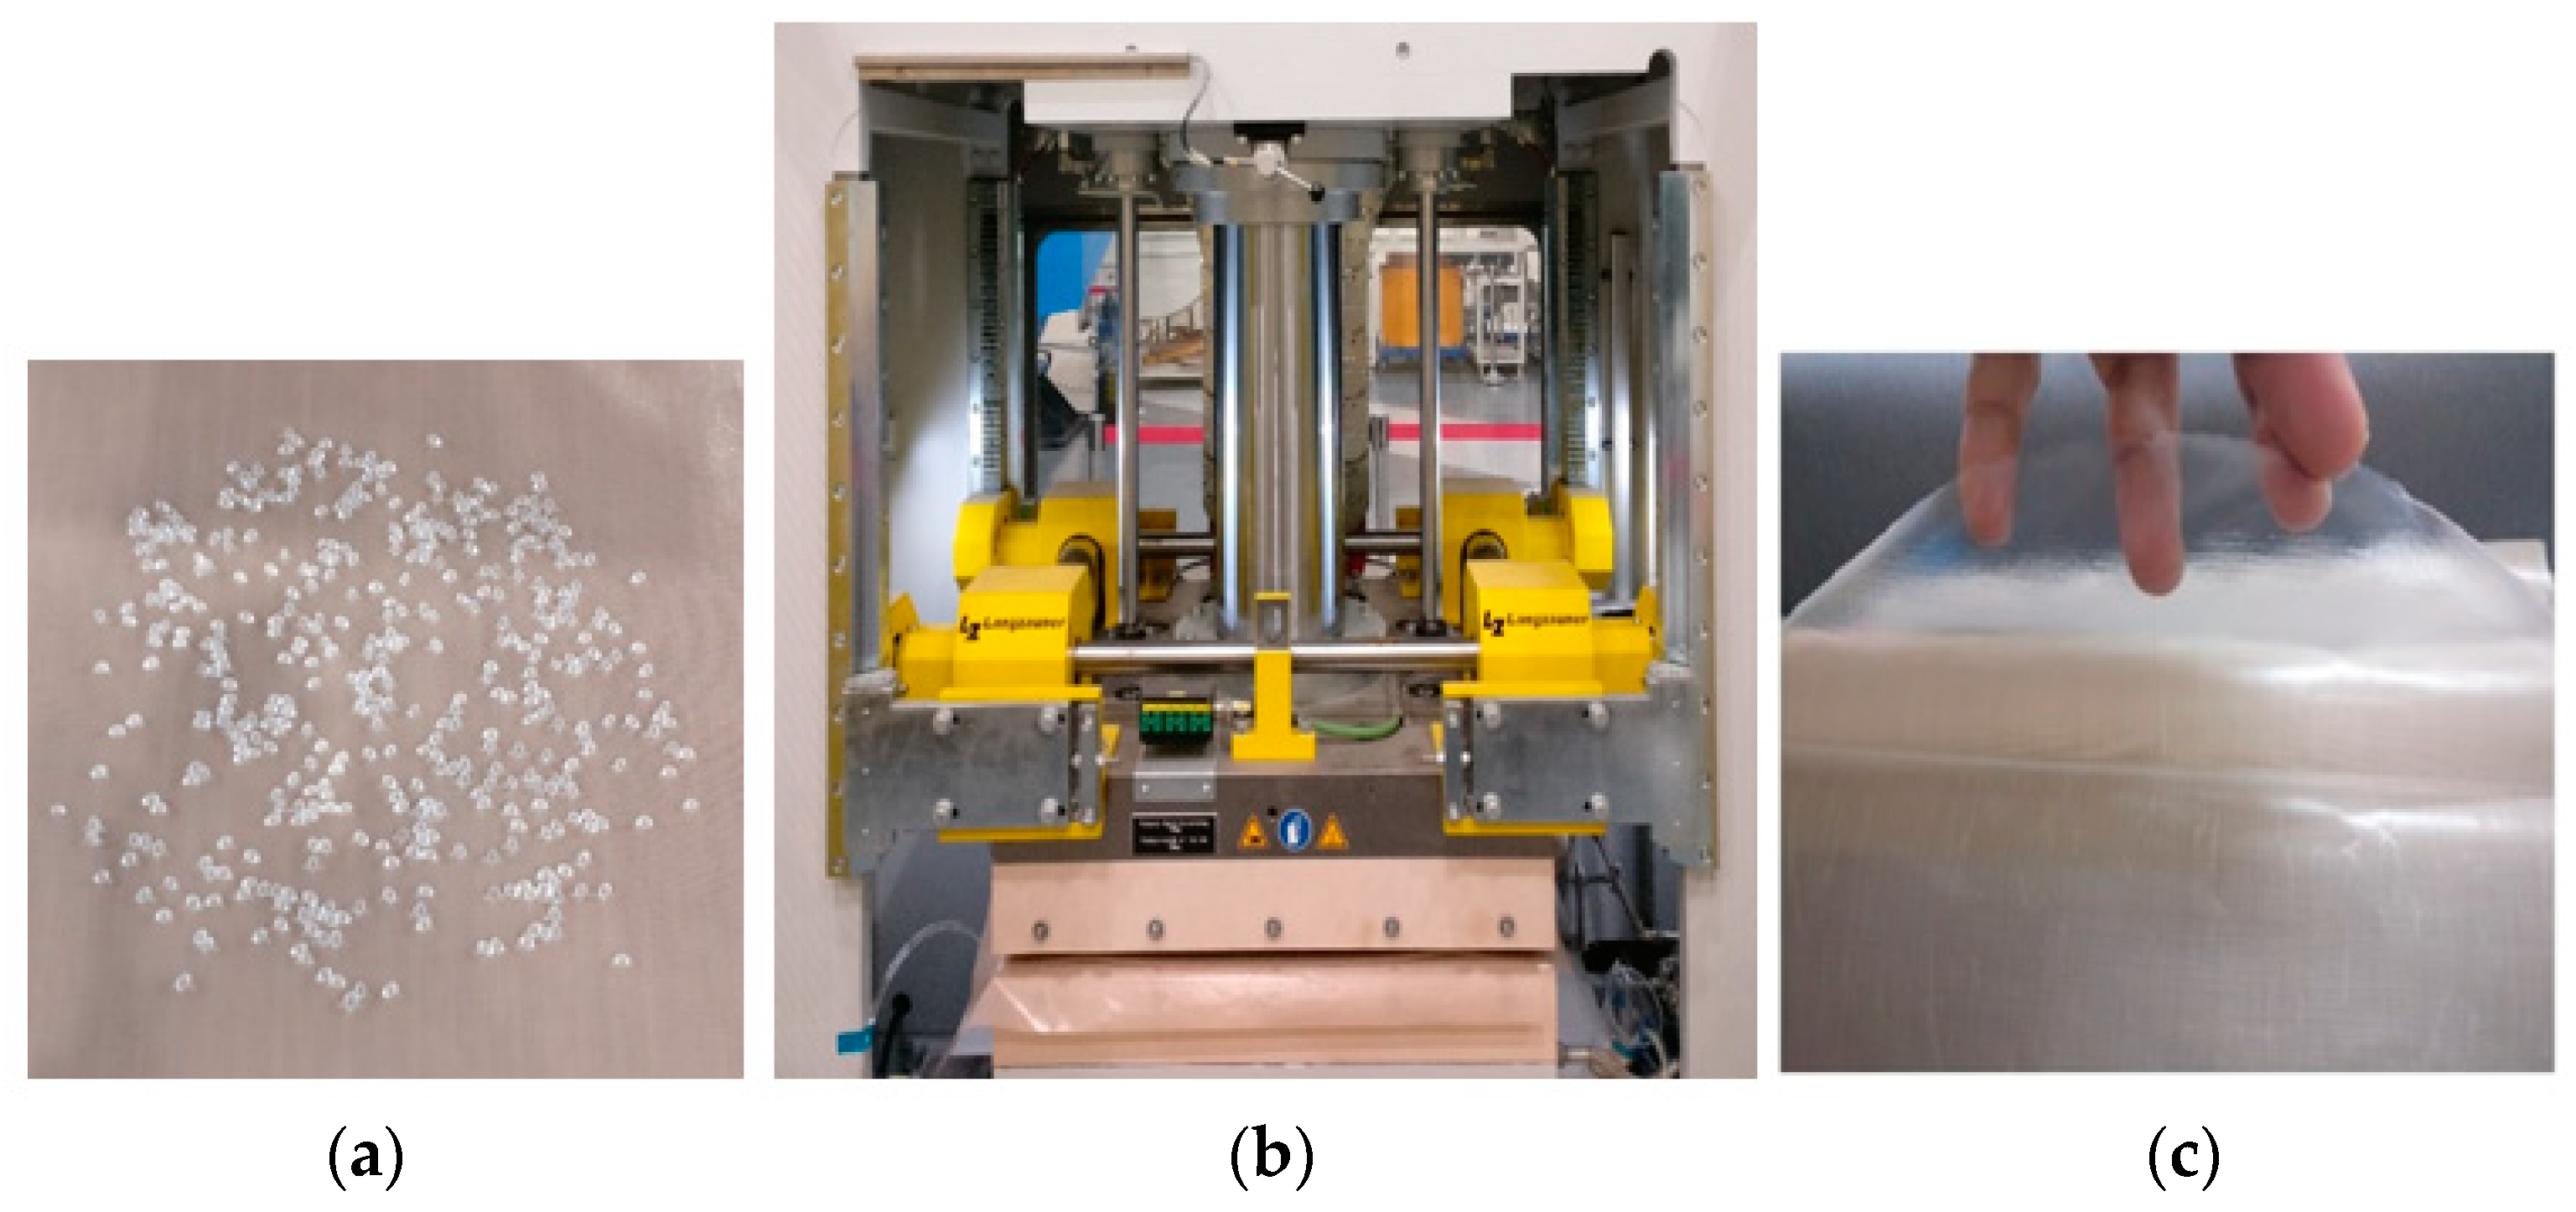
Both platens of the hot press were moved together, such that they just contacted the evenly spread pellets without applying considerable pressure. The temperature of the hot press was set at 170 °C. Upon reaching the set temperature, adequate pressure was applied depending upon the thickness of the film required. The hot press was run for an hour before allowing it to cool down to room temperature to take out the film. Figure 2 depicts the fabrication of the film from the pellets. Thermoplastic films with average thicknesses of 50 μm, 150 μm and 220 μm were fabricated using this technique by varying the quantity of the pellets used as well as the pressure applied.
The film fabrication parameters used are tabulated in Table 1. After the fabrication, thickness measurement was carried out at 16 points within each film area to ensure thickness control. The coefficients of variation obtained for 50 μm, 150 μm and 220 μm films were 4.3%, 4.6% and 5.3%, respectively. Handling these thin films was also difficult. They were stored in between the non-porous peel plies and carefully placed between the prepregs during incorporation without any wrinkles.
3.2. Sample Preparation
In total, 12 batches (five specimens in each batch) of GFRP laminates were produced; four for each of the Mode I, Mode II and Mixed-Mode I/II tests. The specimen nomenclature of the fabricated specimens is tabulated in Table 2.
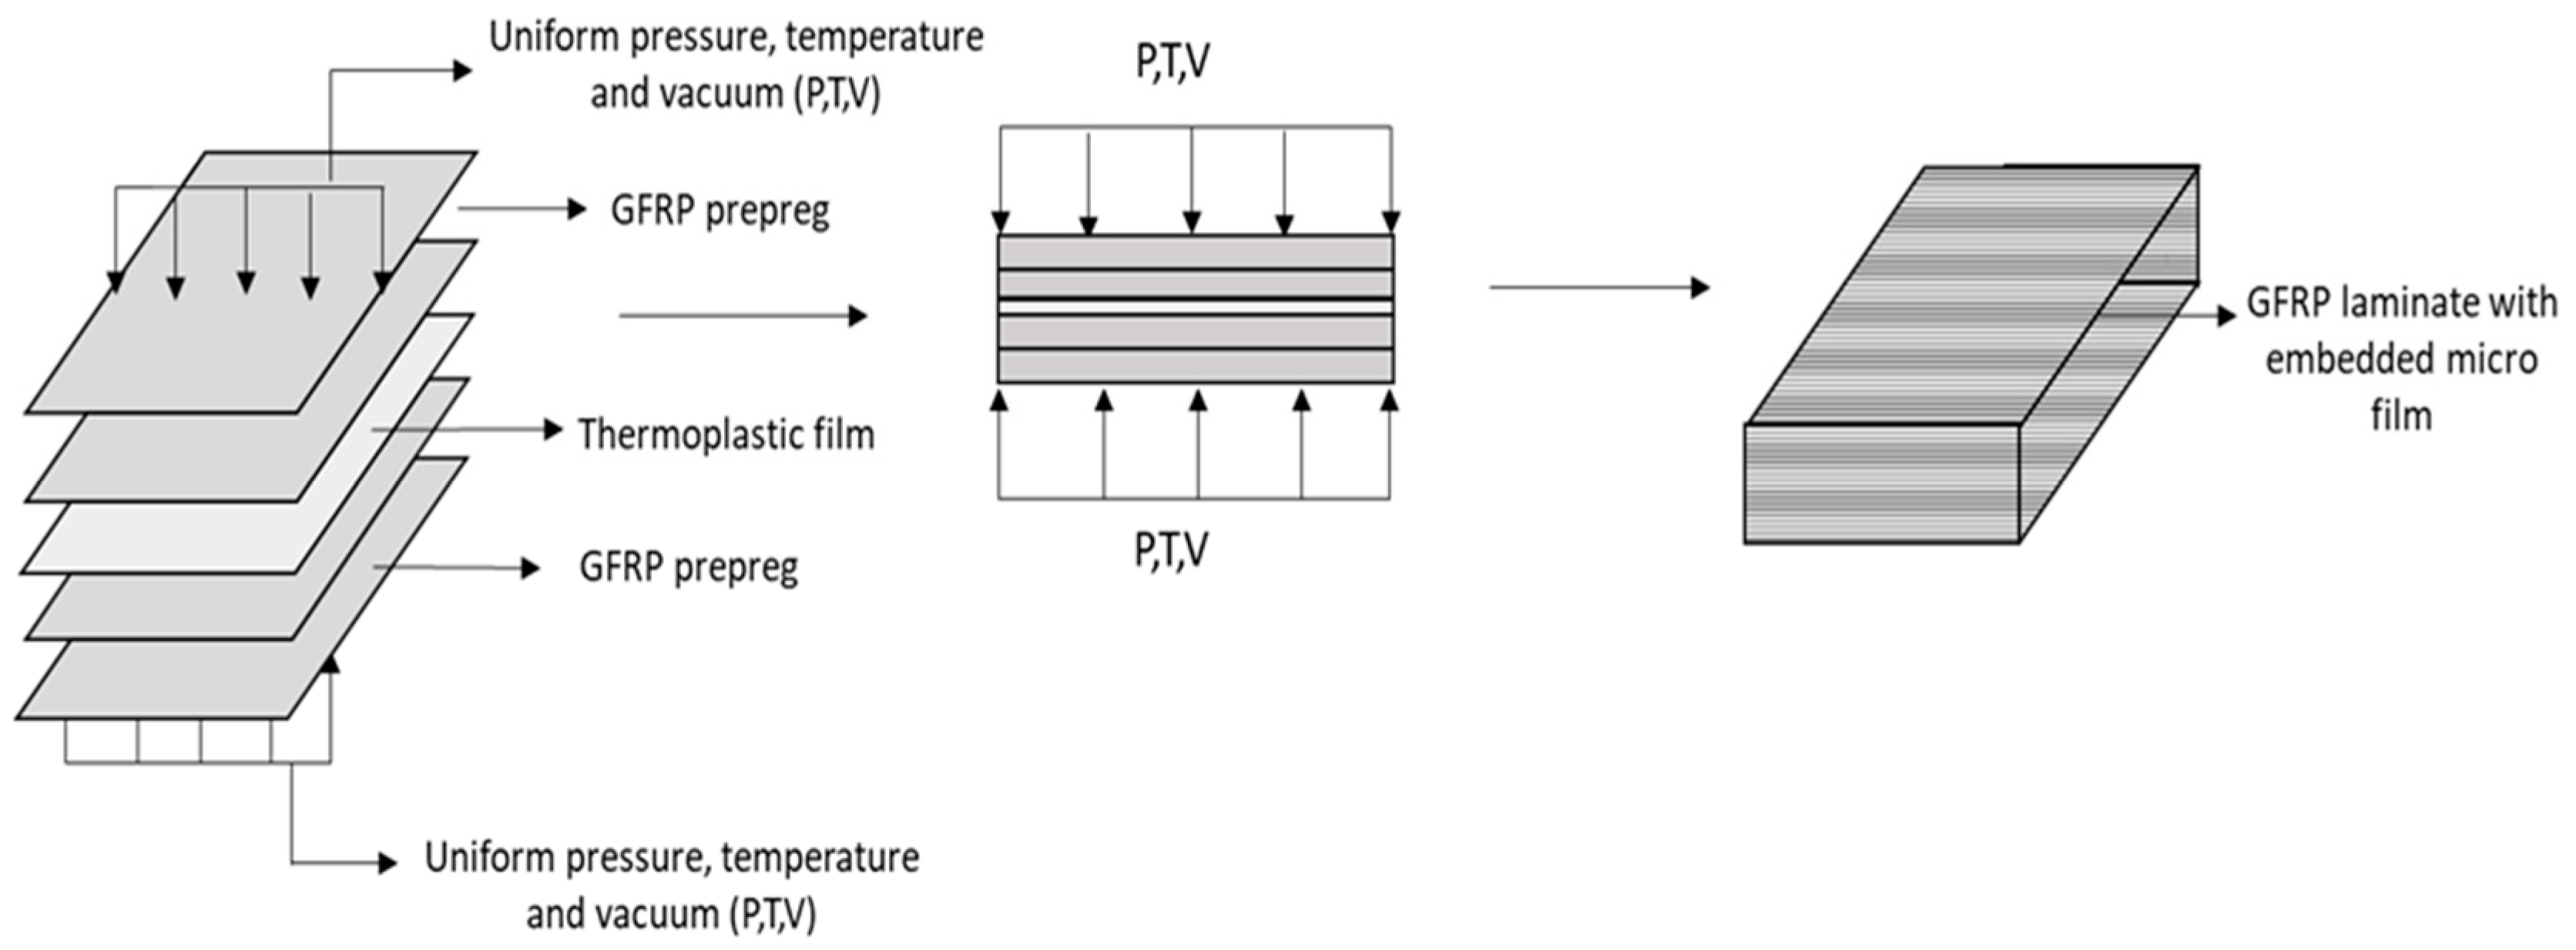
For batch one (without any interleaf), prepreg plies of Glass/BMI measuring (210 × 130) mm were cut from the roll and stacked together to form an initial lay-up of 44 layers. The layup was performed by hand with the help of a metallic roller which aided in removing the trapped air bubbles as well as prevented the formation of wrinkles. A non-adhesive insert of 10 μm thickness was placed at the midplane of the laminate to initiate delamination.
The layups of the other three batches having the same number of plies and ply dimensions, but with one type of thermoplastic film placed at the midplane were also made. All the laminates for each batch were cured together in an autoclave as per the manufacturer’s specified cure cycle. The composite laminates were then cut to form test specimens of dimensions (190 × 21 × 3.5) mm, conforming to the respective standards (ASTM D5528, ASTM D7905 and ASTM D6671), using a diamond-tipped circular saw. The laminate manufacturing schematic is shown in Figure 3.
In each fracture mode, interleaves of three different thicknesses were tested and compared with samples having no interleaf material.
3.3. Test Methods
Mode I and Mode II interlaminar fracture toughness (GI and GII) tests were performed using a Universal Testing Machine (UTM), INSTRON 5569 comprising of a 50 kN load cell while the Mixed-Mode I/II interlaminar fracture toughness (G) tests were performed using a SHIMADZU UTM with a 10 kN load cell.
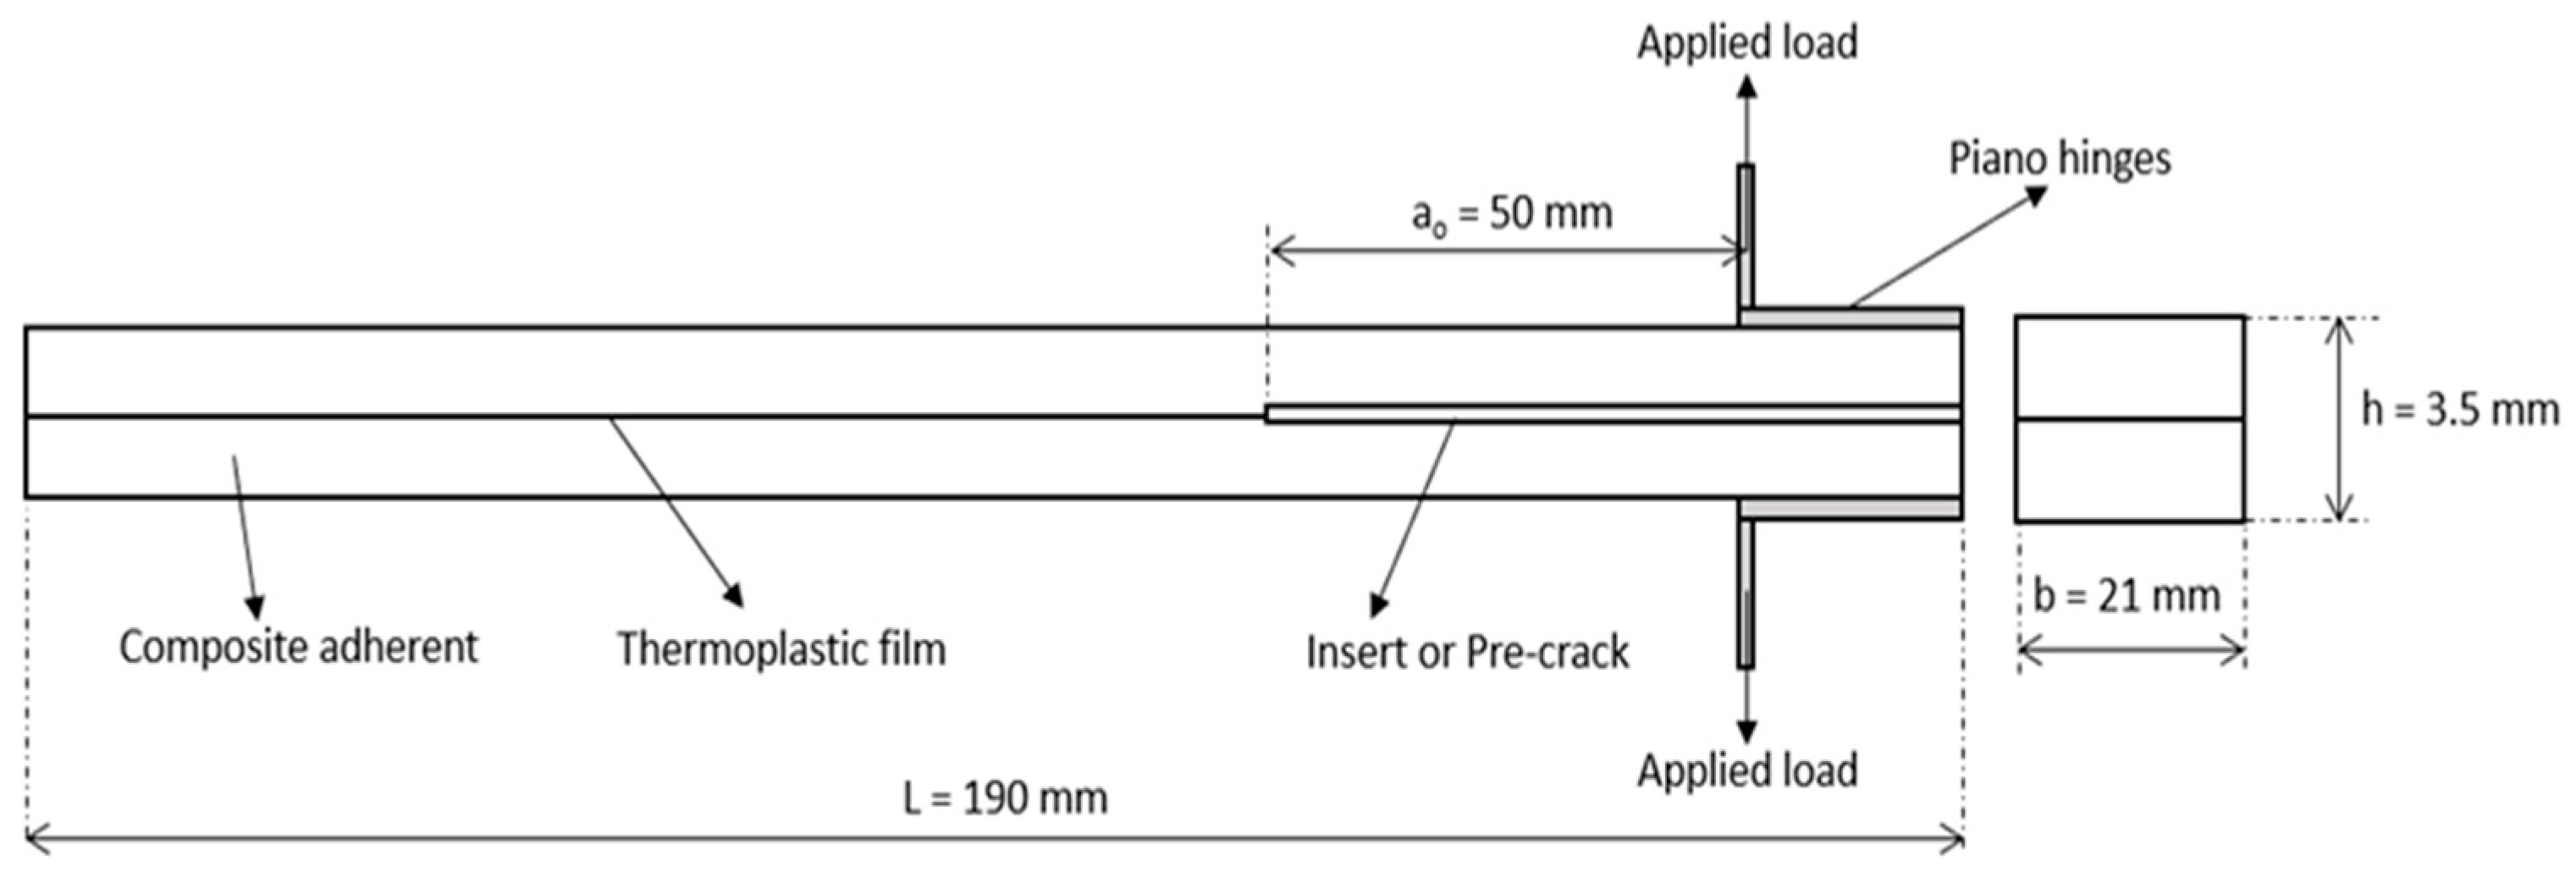
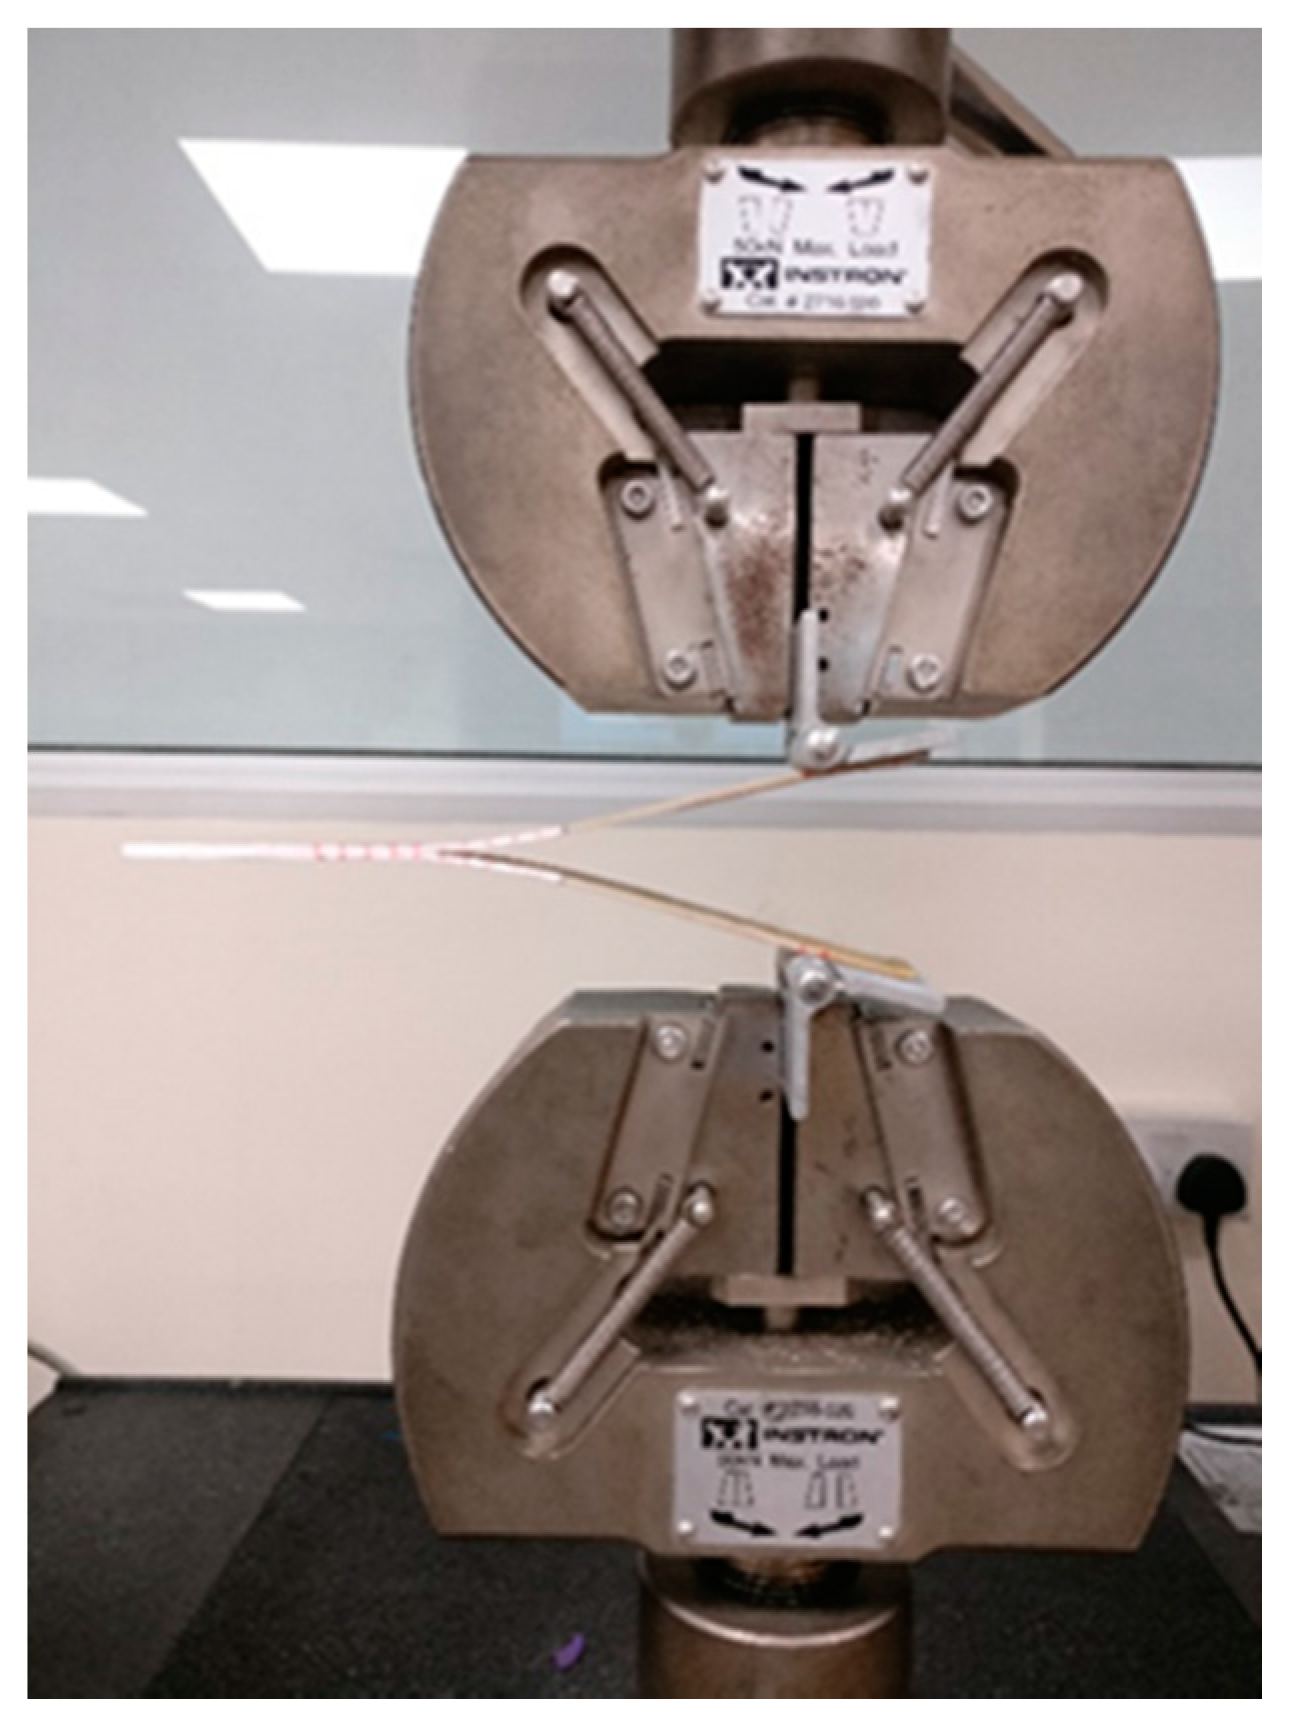
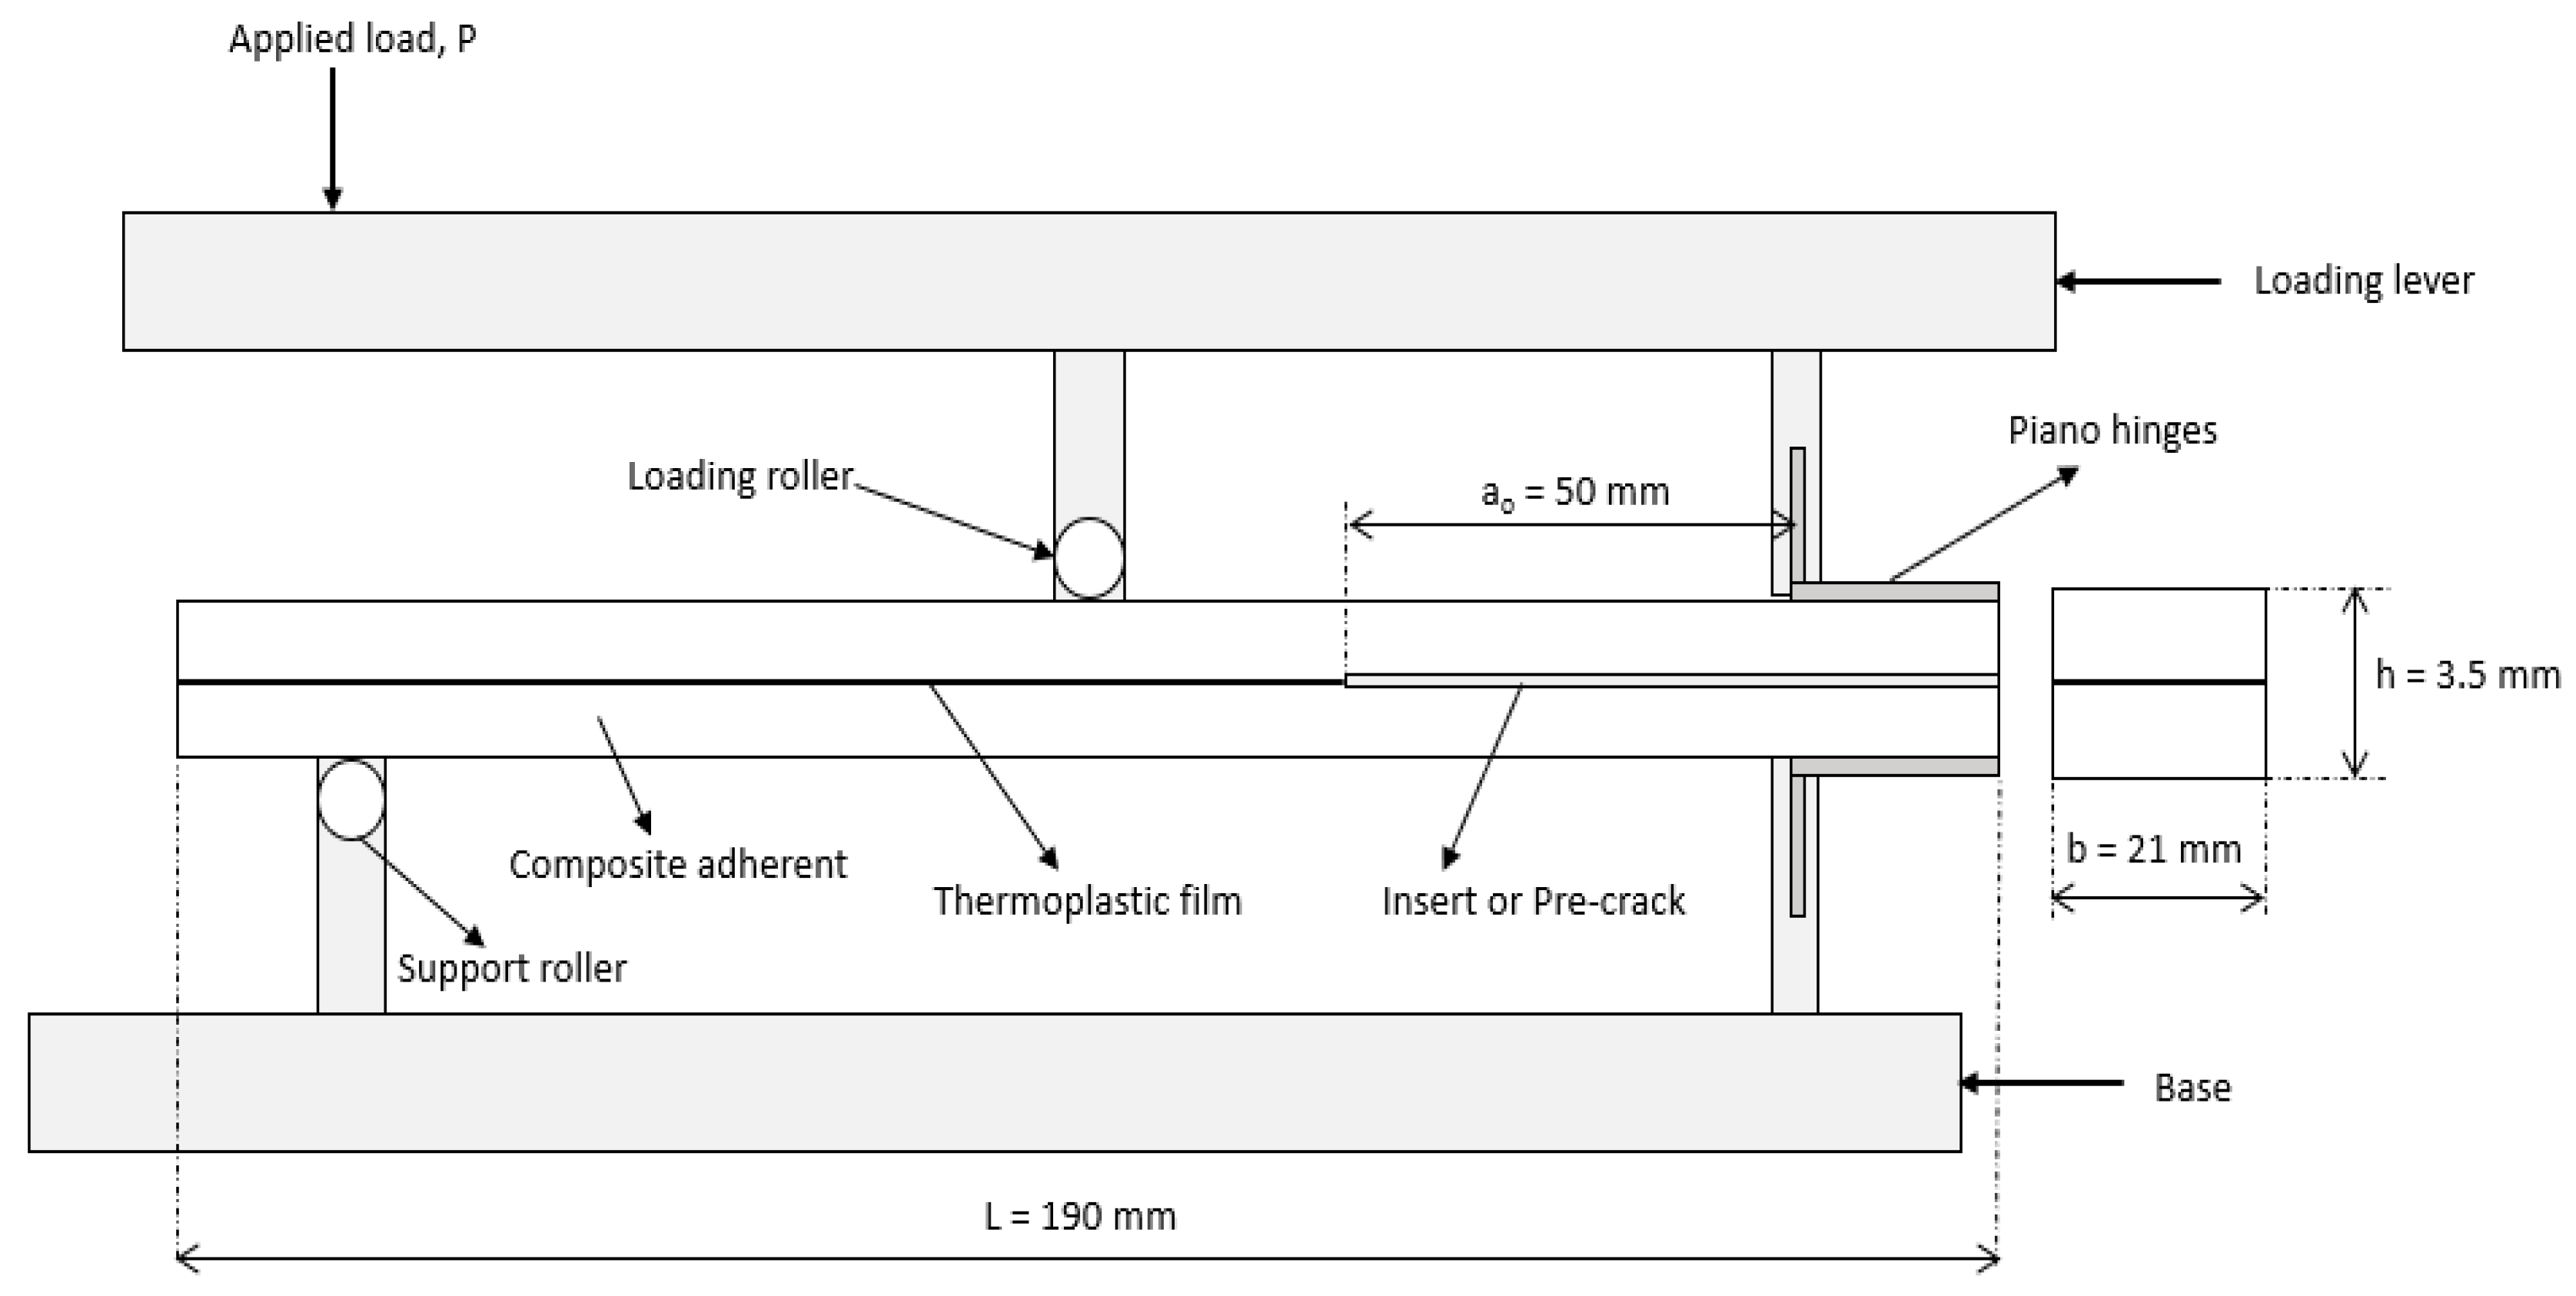
Mode I interlaminar fracture toughness, GI, of all the batches of composites were determined using DCB specimens. The DCB specimen is a rectangular, uniformly thick GFRP specimen with a non-adhesive insert present on the midplane which acts as a delamination initiator. Piano hinges bonded to one end of the specimen were used to apply opening forces perpendicular to the specimen face avoiding any moment at the point of loading. The schematic of the DCB specimen is shown in Figure 4. For better adhesion, both the base of the piano hinge as well as the specimen ends were scrubbed with sandpaper. Acetone was used to clean the scrubbed surfaces before bonding was carried out using a cyanoacrylate-based adhesive. Special care was taken during bonding so that the excess adhesive did not flow towards the non-adhesive insert placed at the midplane of the laminate.
The crosshead movement of the UTM was used to control the opening of the ends of the specimen. A uniform displacement rate of 2 mm/min was set for all the specimens so that steady crack propagation ensued. Figure 5 shows the DCB specimen under Mode I test. A record of applied load and the corresponding crosshead displacement was stored digitally and post-processed. The crack growth was monitored closely by noting the load and displacement values at pre-set crack lengths, with the aid of a hand-held magnifying glass.
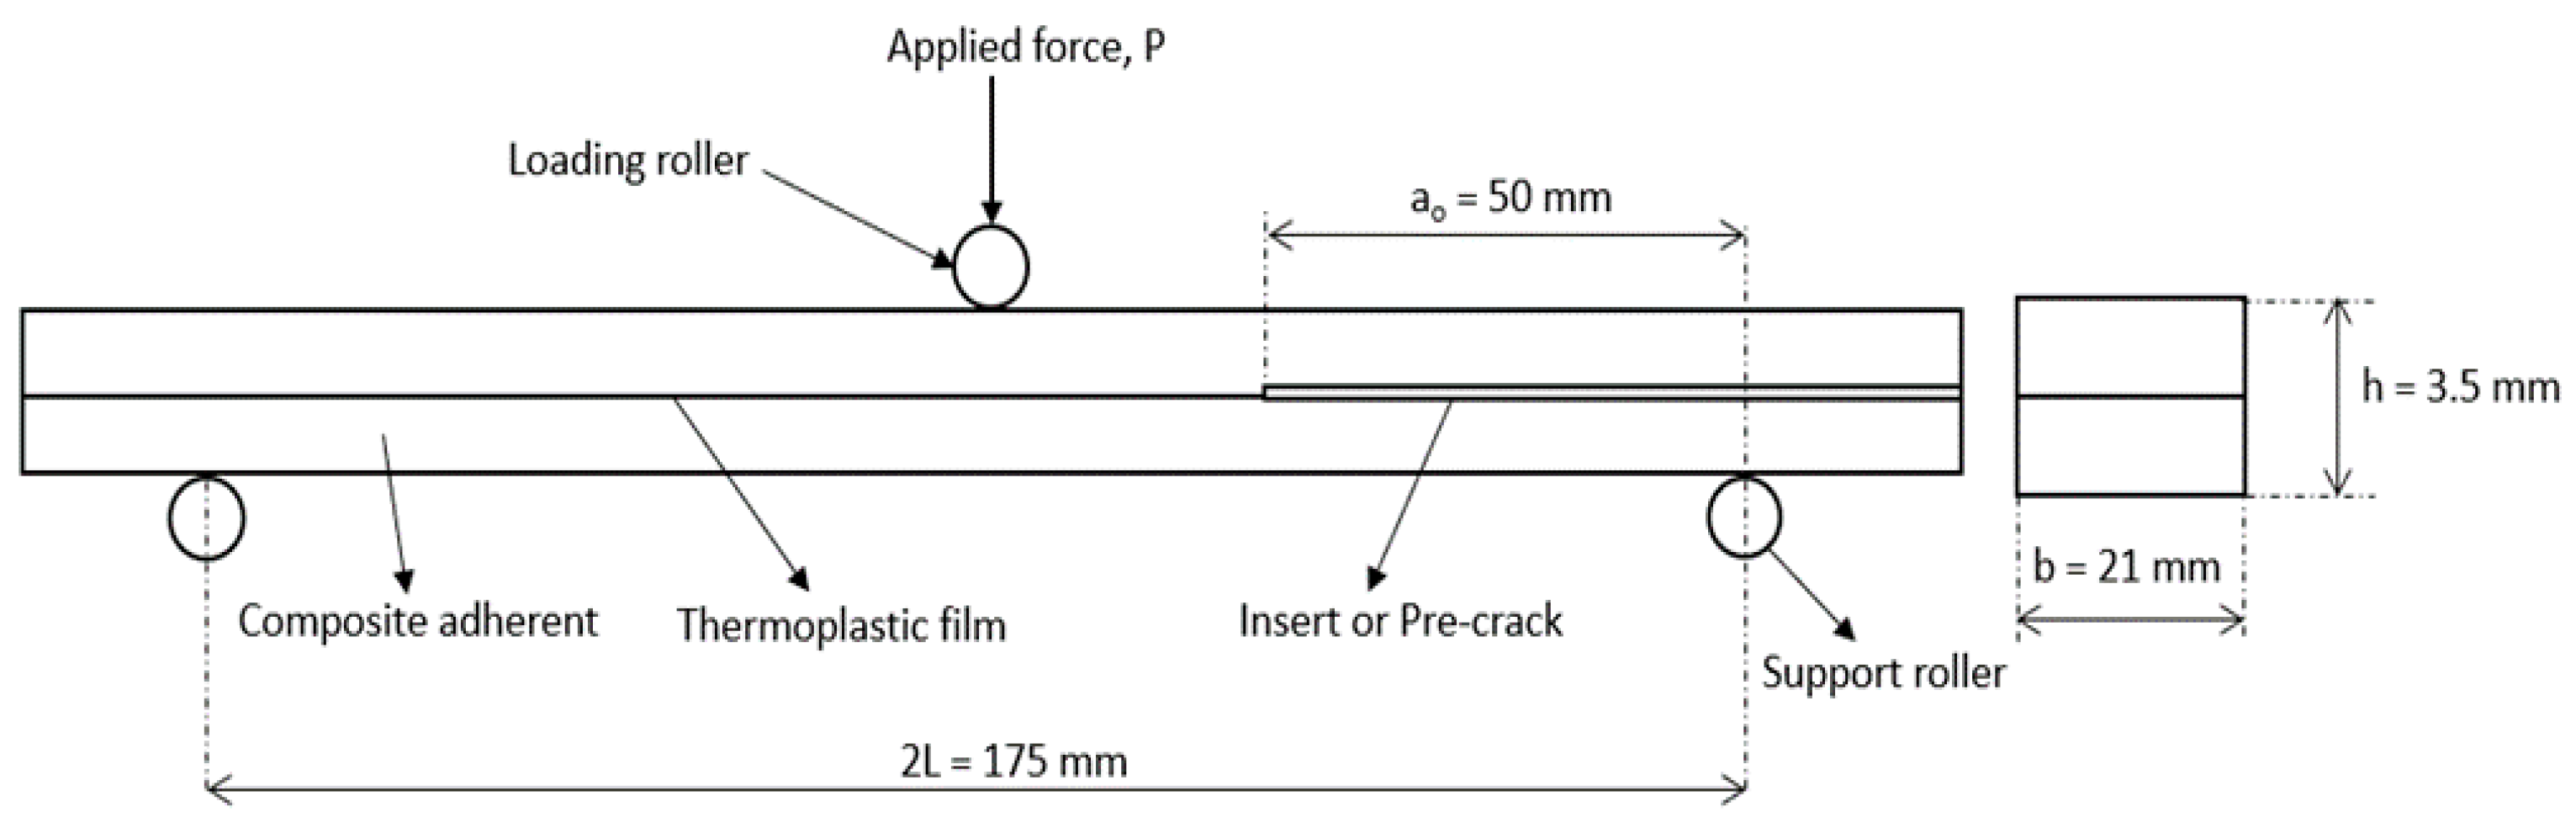
ENF specimens were used to find out the Mode II interlaminar fracture toughness, GII, of all the batches of laminates. The ENF specimen is like the DCB specimen in shape, with a non-adhesive insert kept at the midplane. Figure 6 shows the schematic of the ENF specimen.
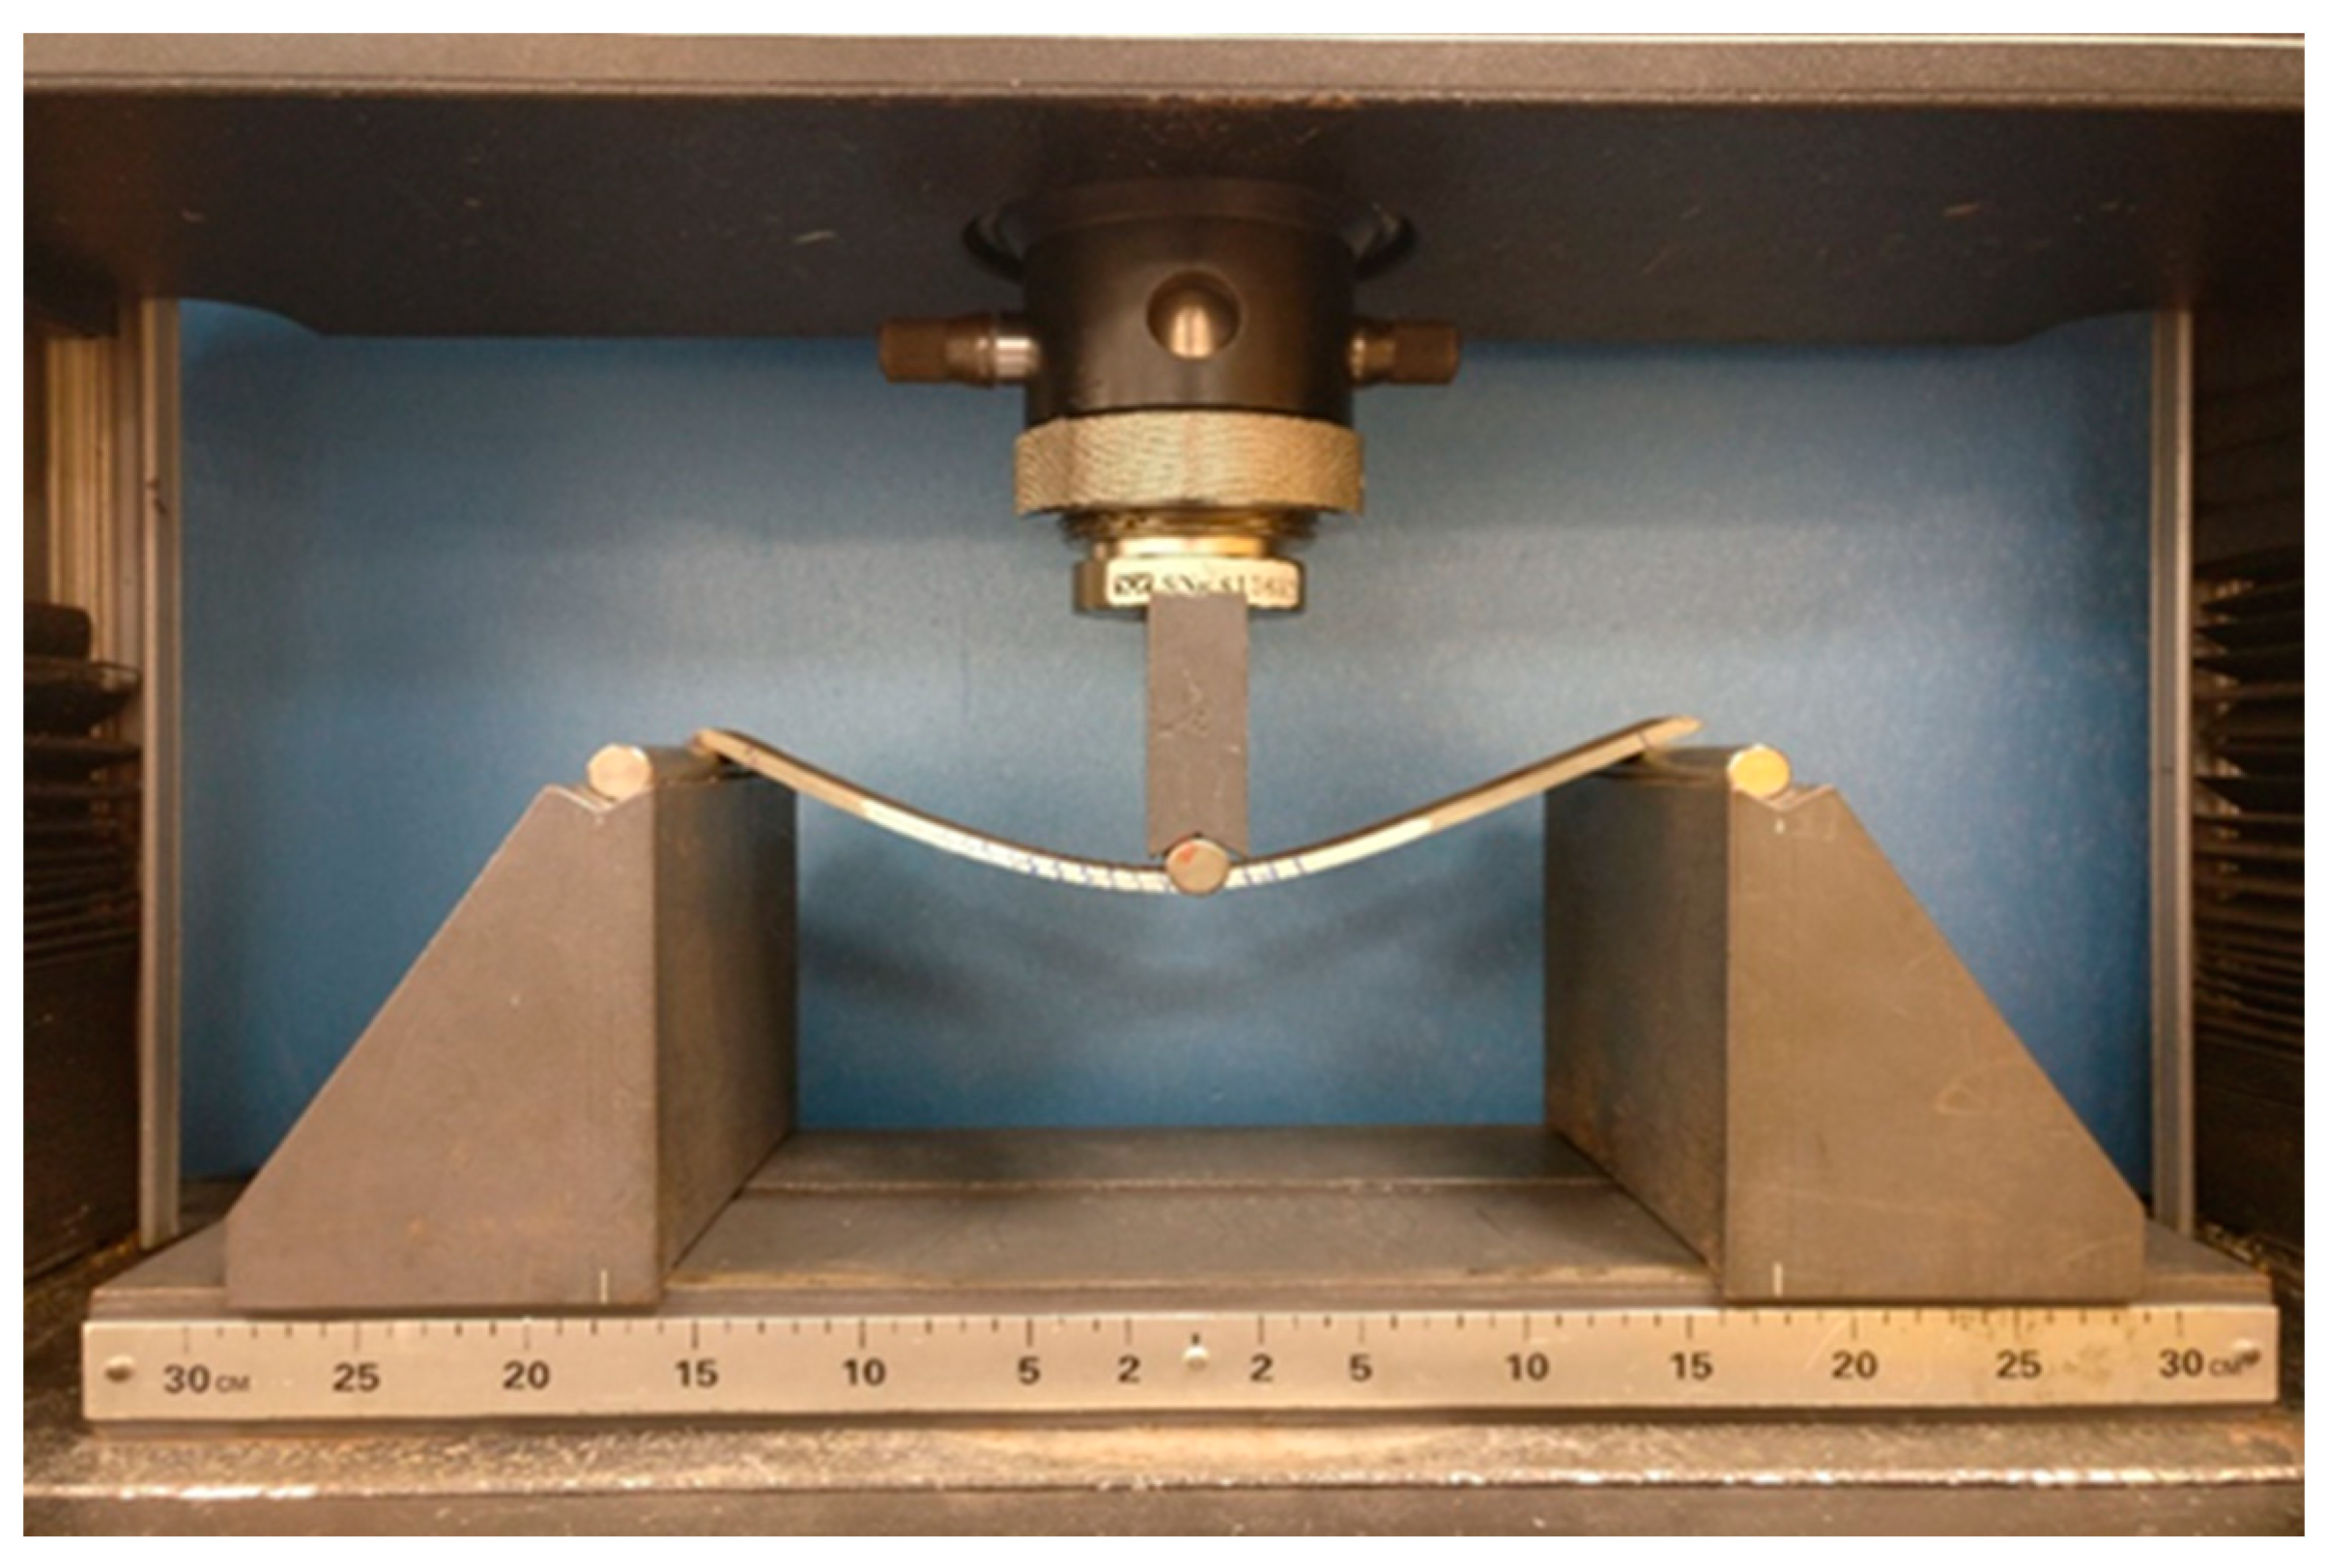
Unlike the Mode I test, which was basically a tensile test, Mode II is a flexural test (3-point bending). The test was performed conforming to ASTM D7905. A uniform displacement rate of 2 mm/min was set for all the specimens to ensure steady crack propagation. Figure 7 shows the ENF specimen under the Mode II test.
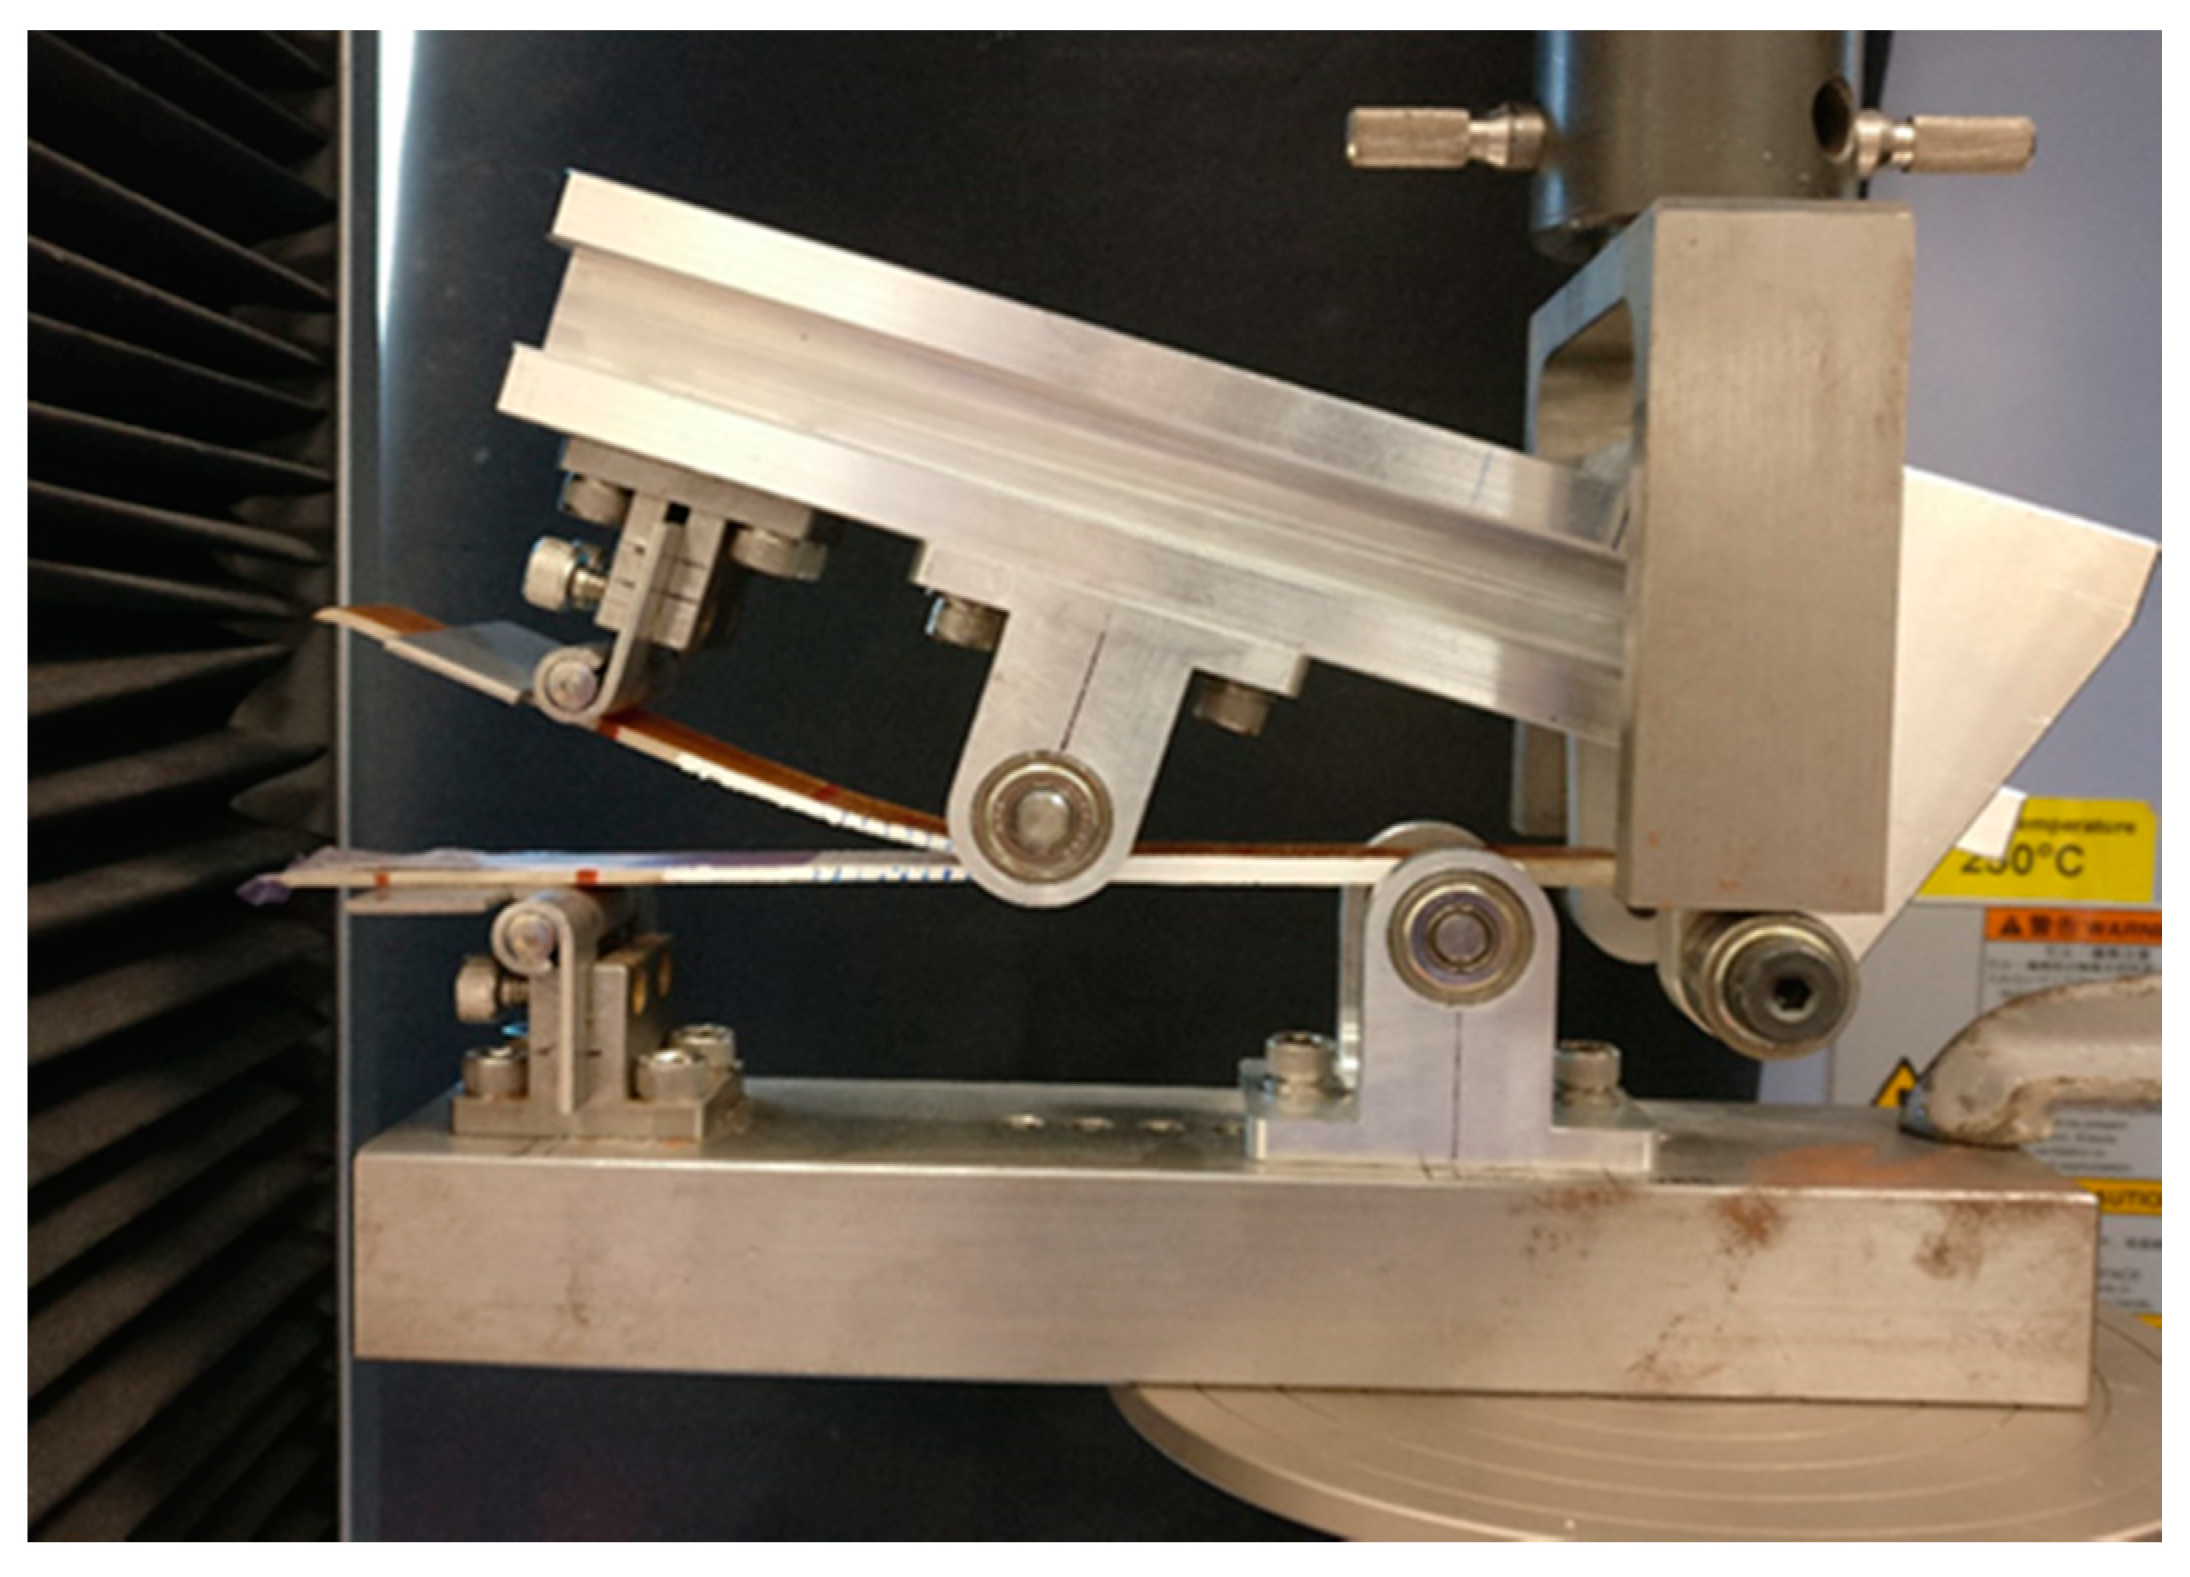
Mixed-Mode I/II interlaminar fracture toughness, Gc, of all the batches of composites was determined using MMB specimens. In this test, both opening, as well as sliding of both the top and bottom surfaces of the specimens, occur. It is a combination of both the DCB and ENF tests.
A non-adhesive insert was placed on the midplane to act as a delamination initiator. Piano hinges bonded to one end of the specimen were used to apply opening forces perpendicular to the specimen face avoiding any moment at the point of loading. A uniform displacement rate of 1 mm/min was set for all the specimens so that steady crack propagation was ensured. The MMB specimen under test and the schematic of the specimen are shown in Figure 8 and Figure 9 respectively.
Numerous techniques for calculating the interlaminar fracture toughness are currently available. In the present study, a compliance calibration methodology involving linear elastic fracture mechanics is adopted for this purpose [35].
where,
C = δ/P
- G: Interlaminar fracture toughness
- P: Load
- b: Width of test specimen
- C: Compliance
- : Slope of compliance-crack length plot
- δ: Deflection
The interlaminar fracture toughness is calculated using Equation (1) mentioned above. The slope of the compliance-crack length plot as well as the compliance, obtained using Equation (2), are involved in the calculation, hence the name.
4. Results and Discussions
As mentioned previously, three types of tests were conducted in the current research work viz Mode I, Mode II and Mixed-Mode I/II interlaminar fracture toughness tests. The corresponding test results are presented and discussed in the following sections.
4.1. Mode I Interlaminar Fracture Toughness
The interlaminar fracture toughness of composites plays a key role in hindering delamination, especially in the laminated type. The Mode I fracture toughness test of the baseline and interleaved samples was conducted experimentally using the DCB test specimens. A compliance method was used to determine the Mode I interlaminar fracture toughness of all the DCB samples.
4.1.1. Fracture Surface
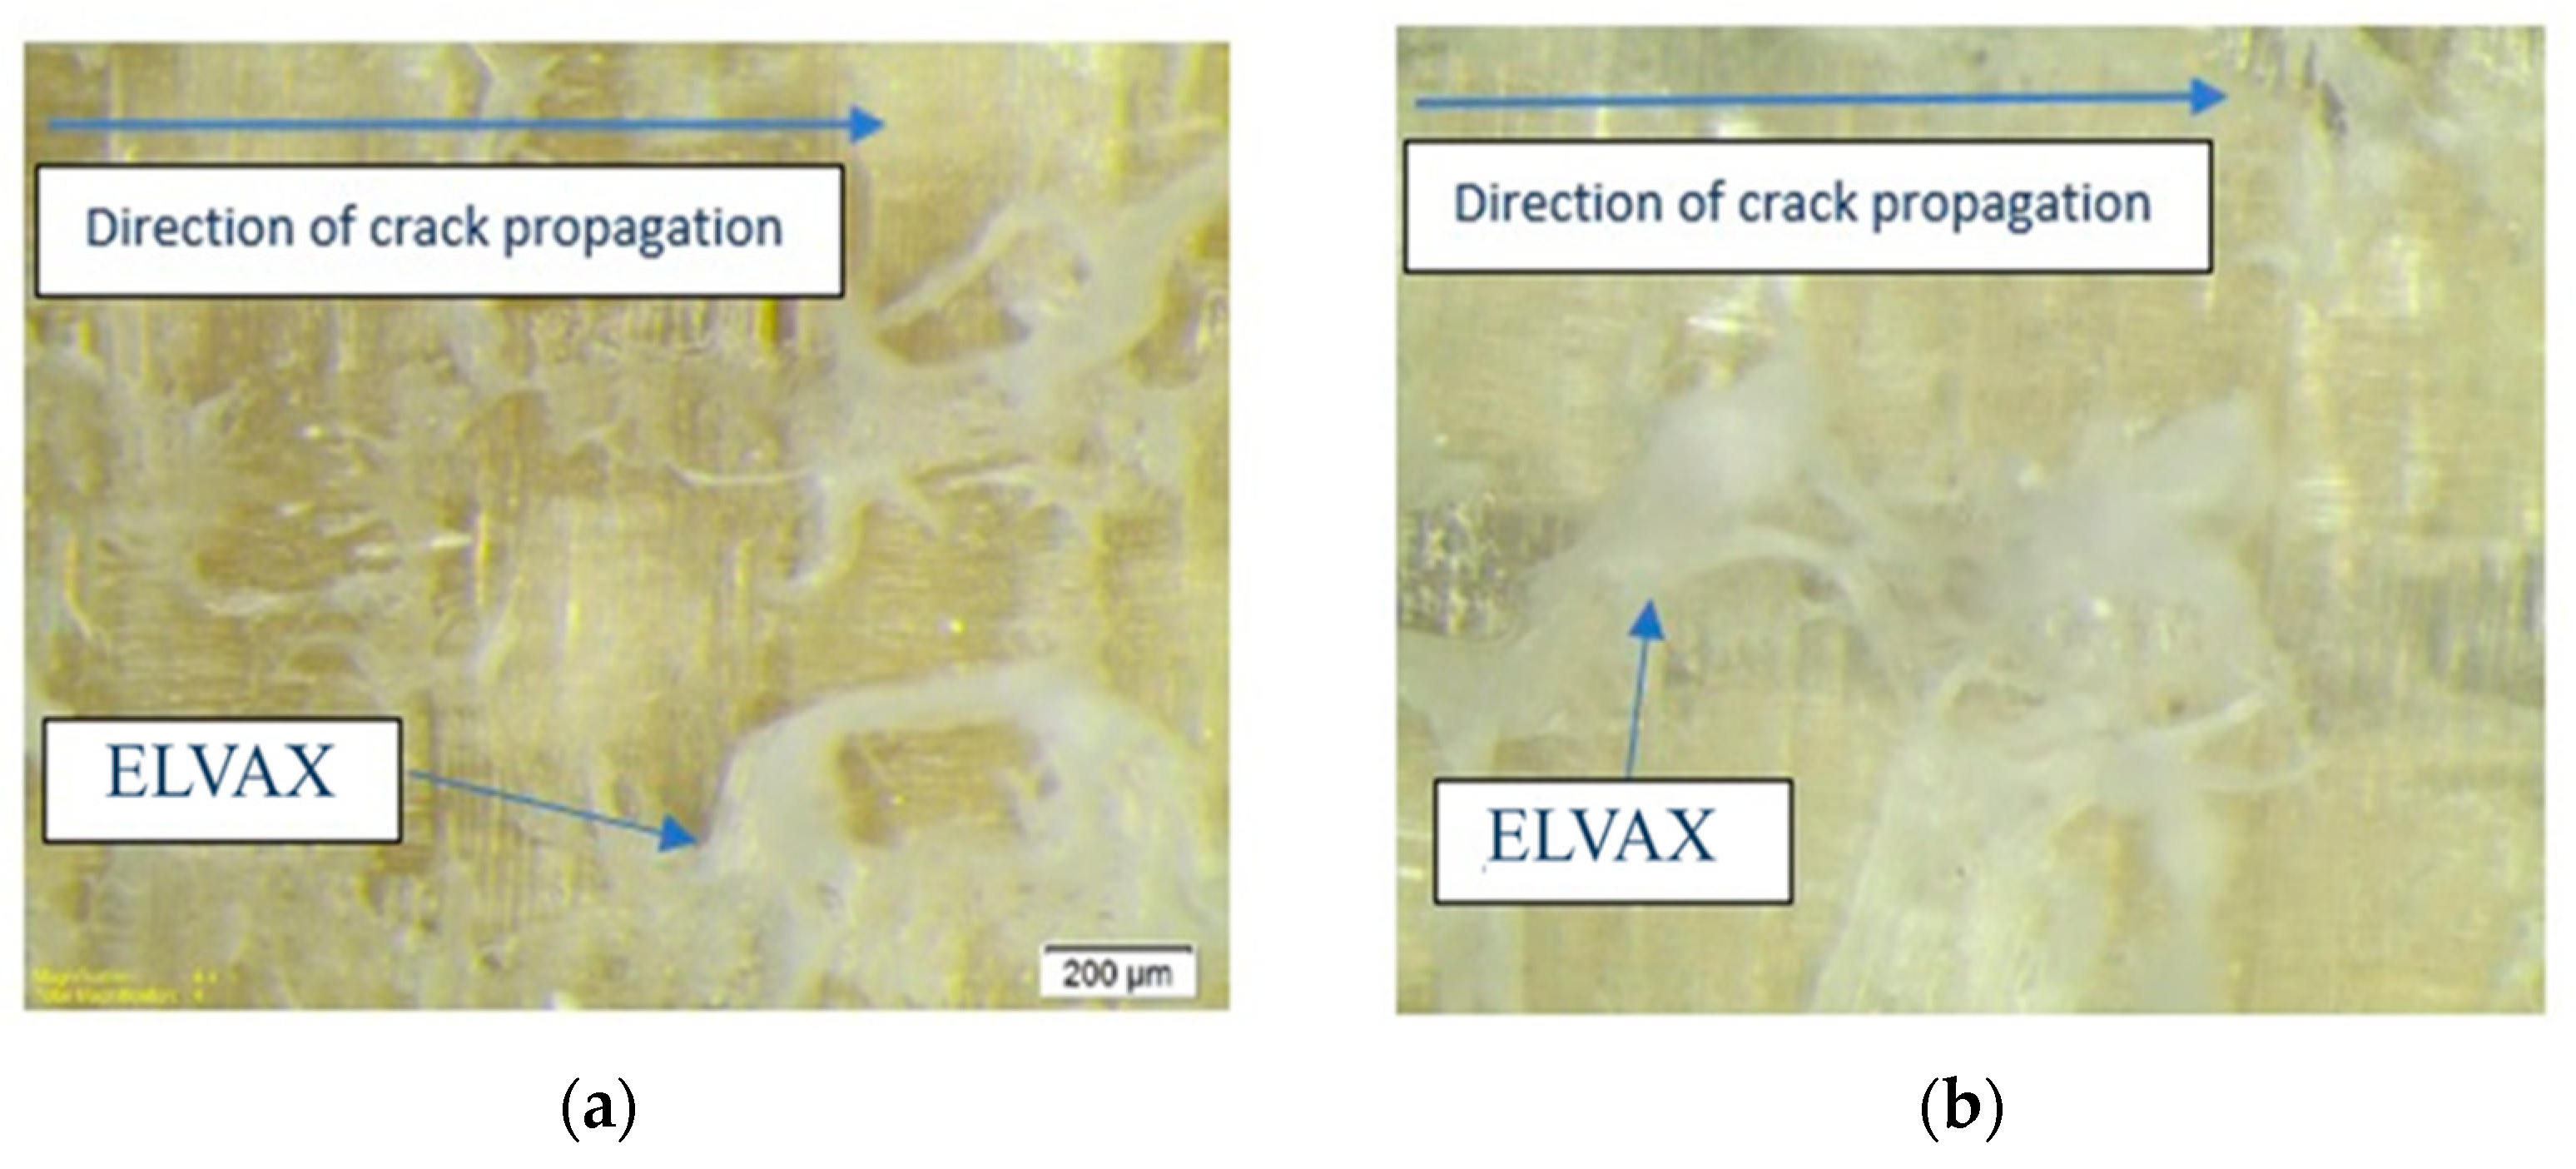
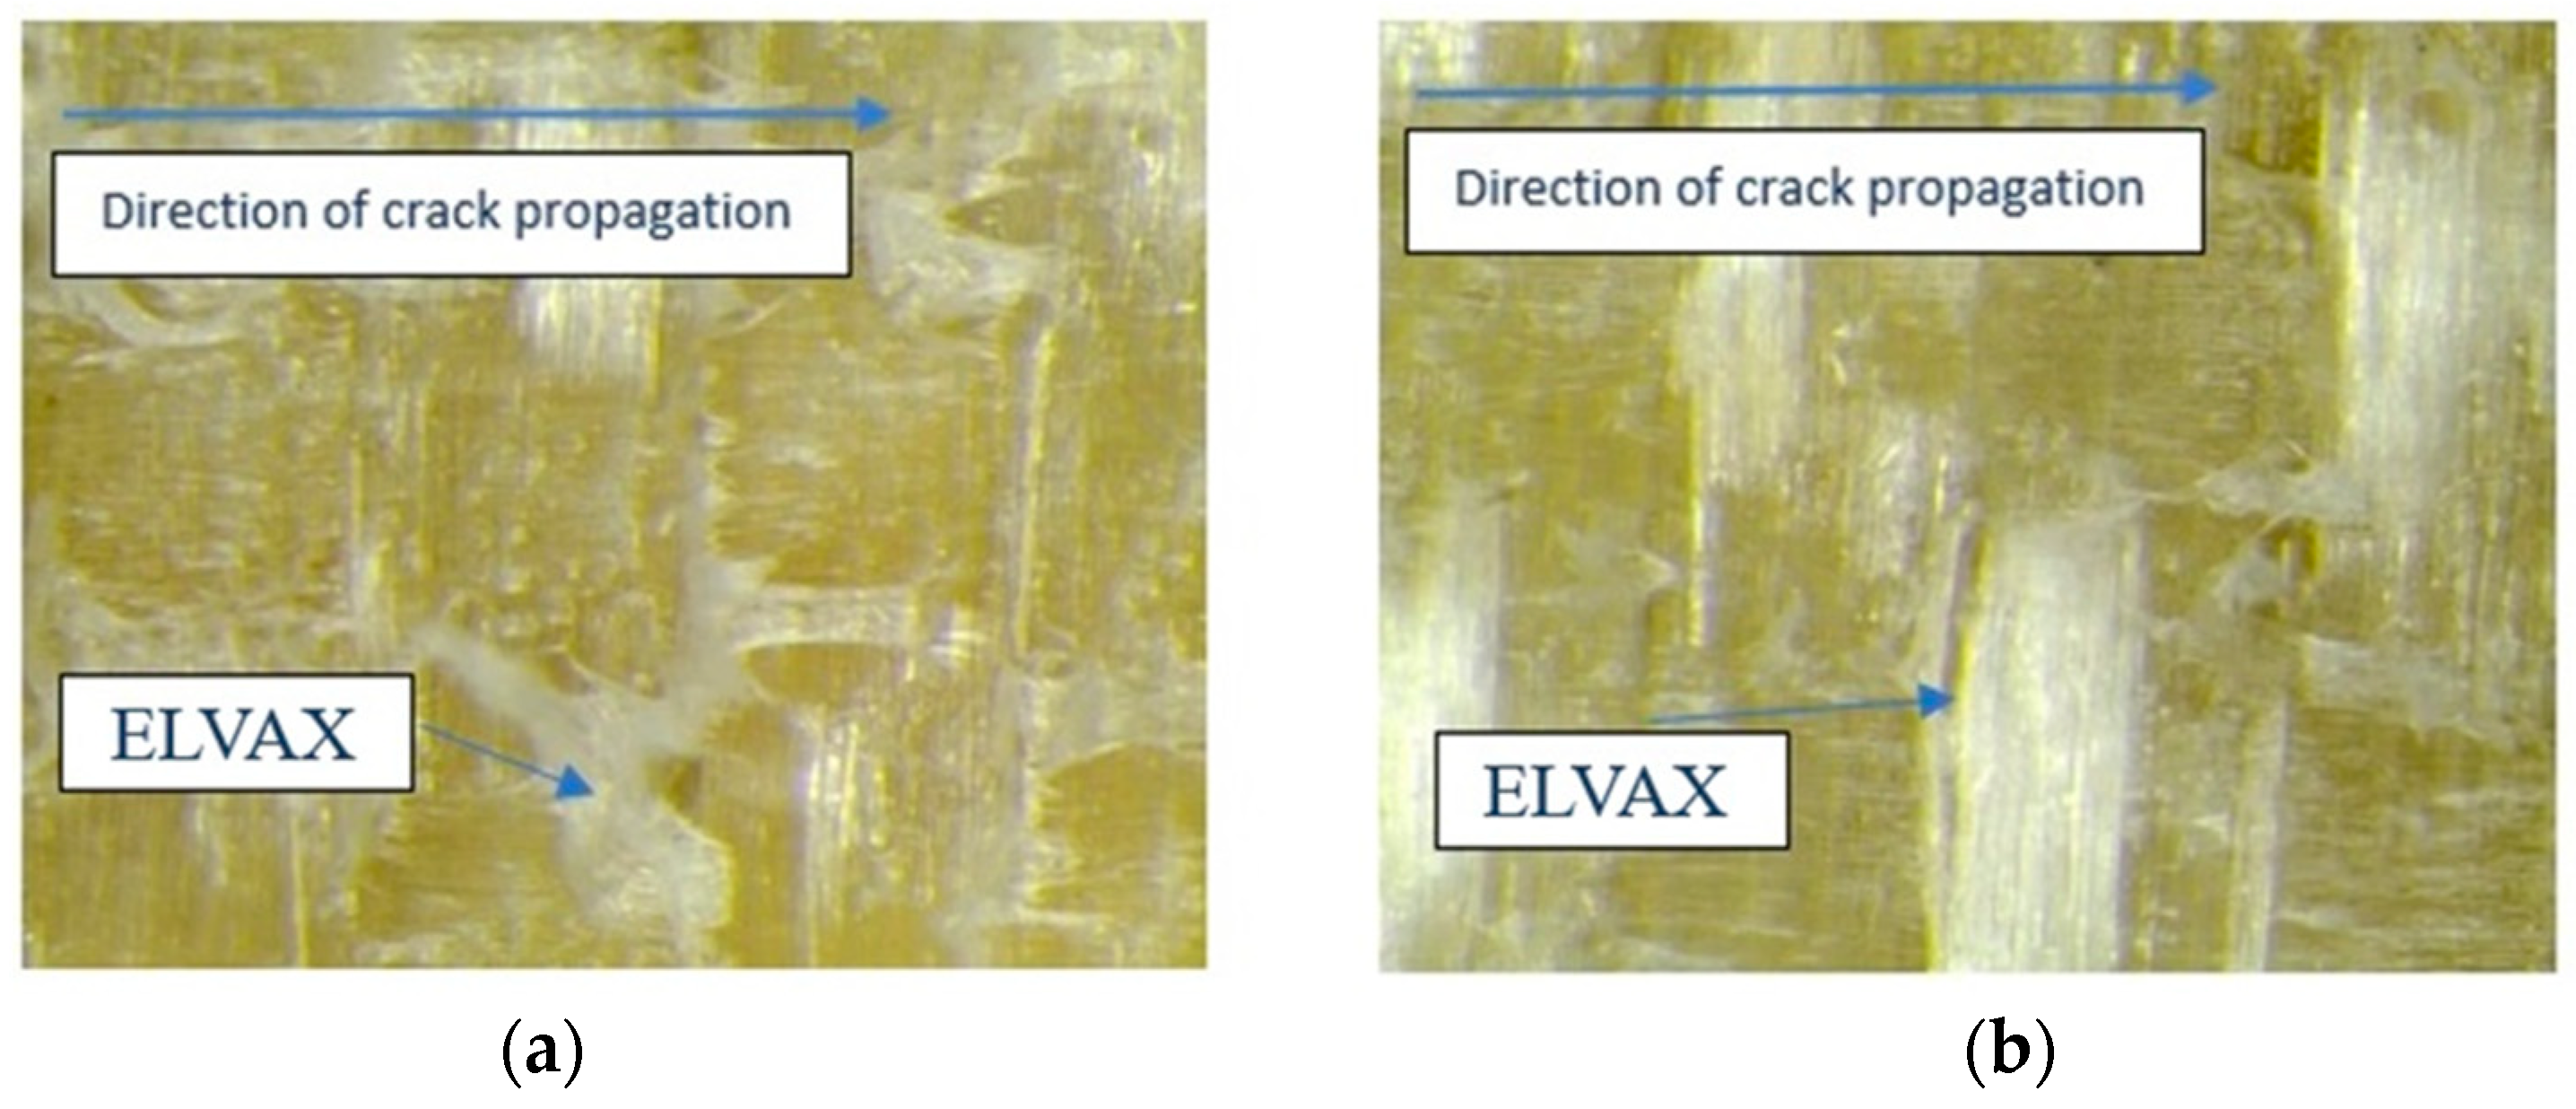
The fracture surfaces (midplane of the laminate) of the DCB test specimen observed under an optical microscope are shown in Figure 10. The direction of the crack propagation is from left to right as indicated by the arrows. The adhesive was evident on both the top as well as bottom surface and hence the mode of failure endured was cohesive in nature in the adhesive. This assured that the bonding between both the surfaces was proper and the used interleaving film had been distributed throughout the surface of adjacent bonded substrates. It can also be inferred that the limiting factor for the bond strength was the characteristics of the used interleaving film and not any improper bonding technique. Hence the results of the conducted DCB tests are reliable and valid.
4.1.2. Force-Displacement Curve
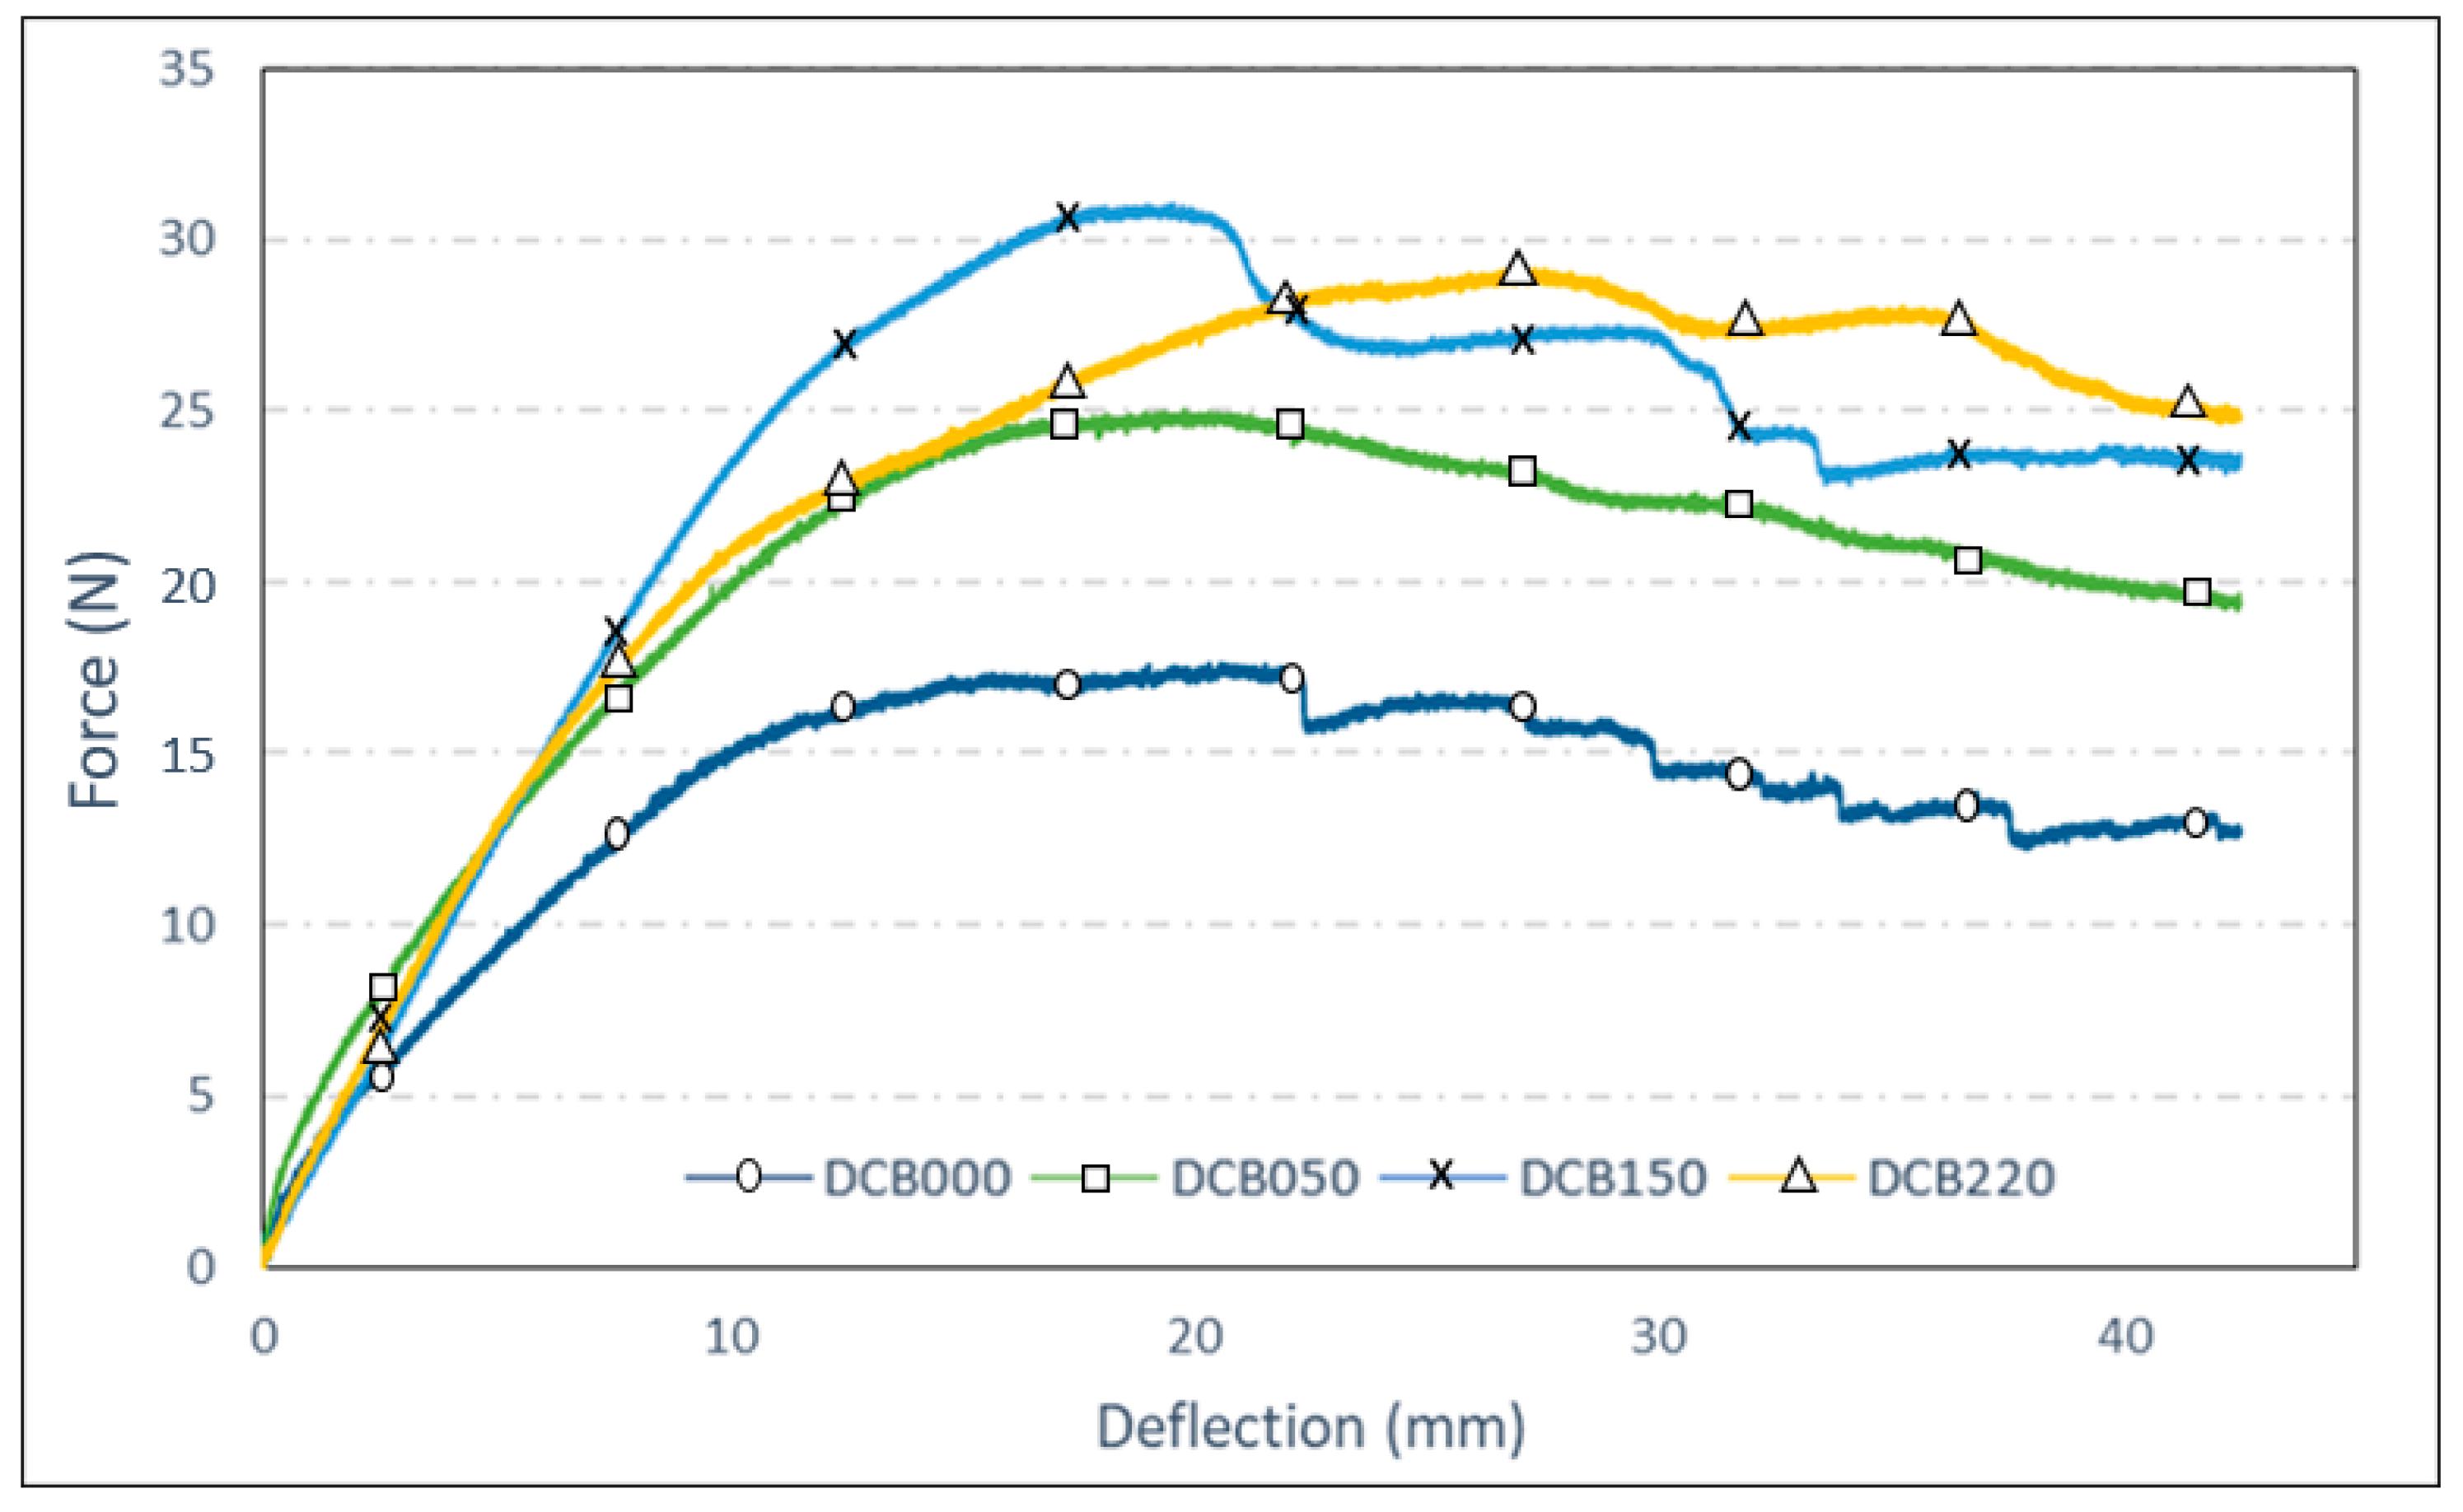
A graph of the applied load versus crosshead displacement for all the batches of GFRP tested in Mode I is plotted in Figure 11. The curves depict an average of all the specimens tested in each batch. The plots are a combination of smooth curves and regions with slight falls. The smooth curves prove that the observed crack growth for a displacement rate of 2 mm/min was stable. In the regions of fall, visible crack propagation as well as drop in the load was observed. Deviation from the initial linear curve indicates the onset of crack growth. Also, it is evident from the plot that the applied load value for all the cases increases almost linearly till it reaches the maximum, as the crack growth is arrested in this region. This maximum value coincides with the point when the crack starts to propagate. After crossing the maximum value, the load value decreases almost linearly as the crack continues to grow. In short, initially, there is an ascending region after which a plateau is present. This type of curve coincides with the well-known stick-slip behavior where the “stick” portion corresponds to the initial region of load increase and the “slip” corresponds to the region where the drop-in load occurs. During slip, some sounds were audible which corresponded to the matrix/adhesive cracking and in some cases, fiber pull-out.
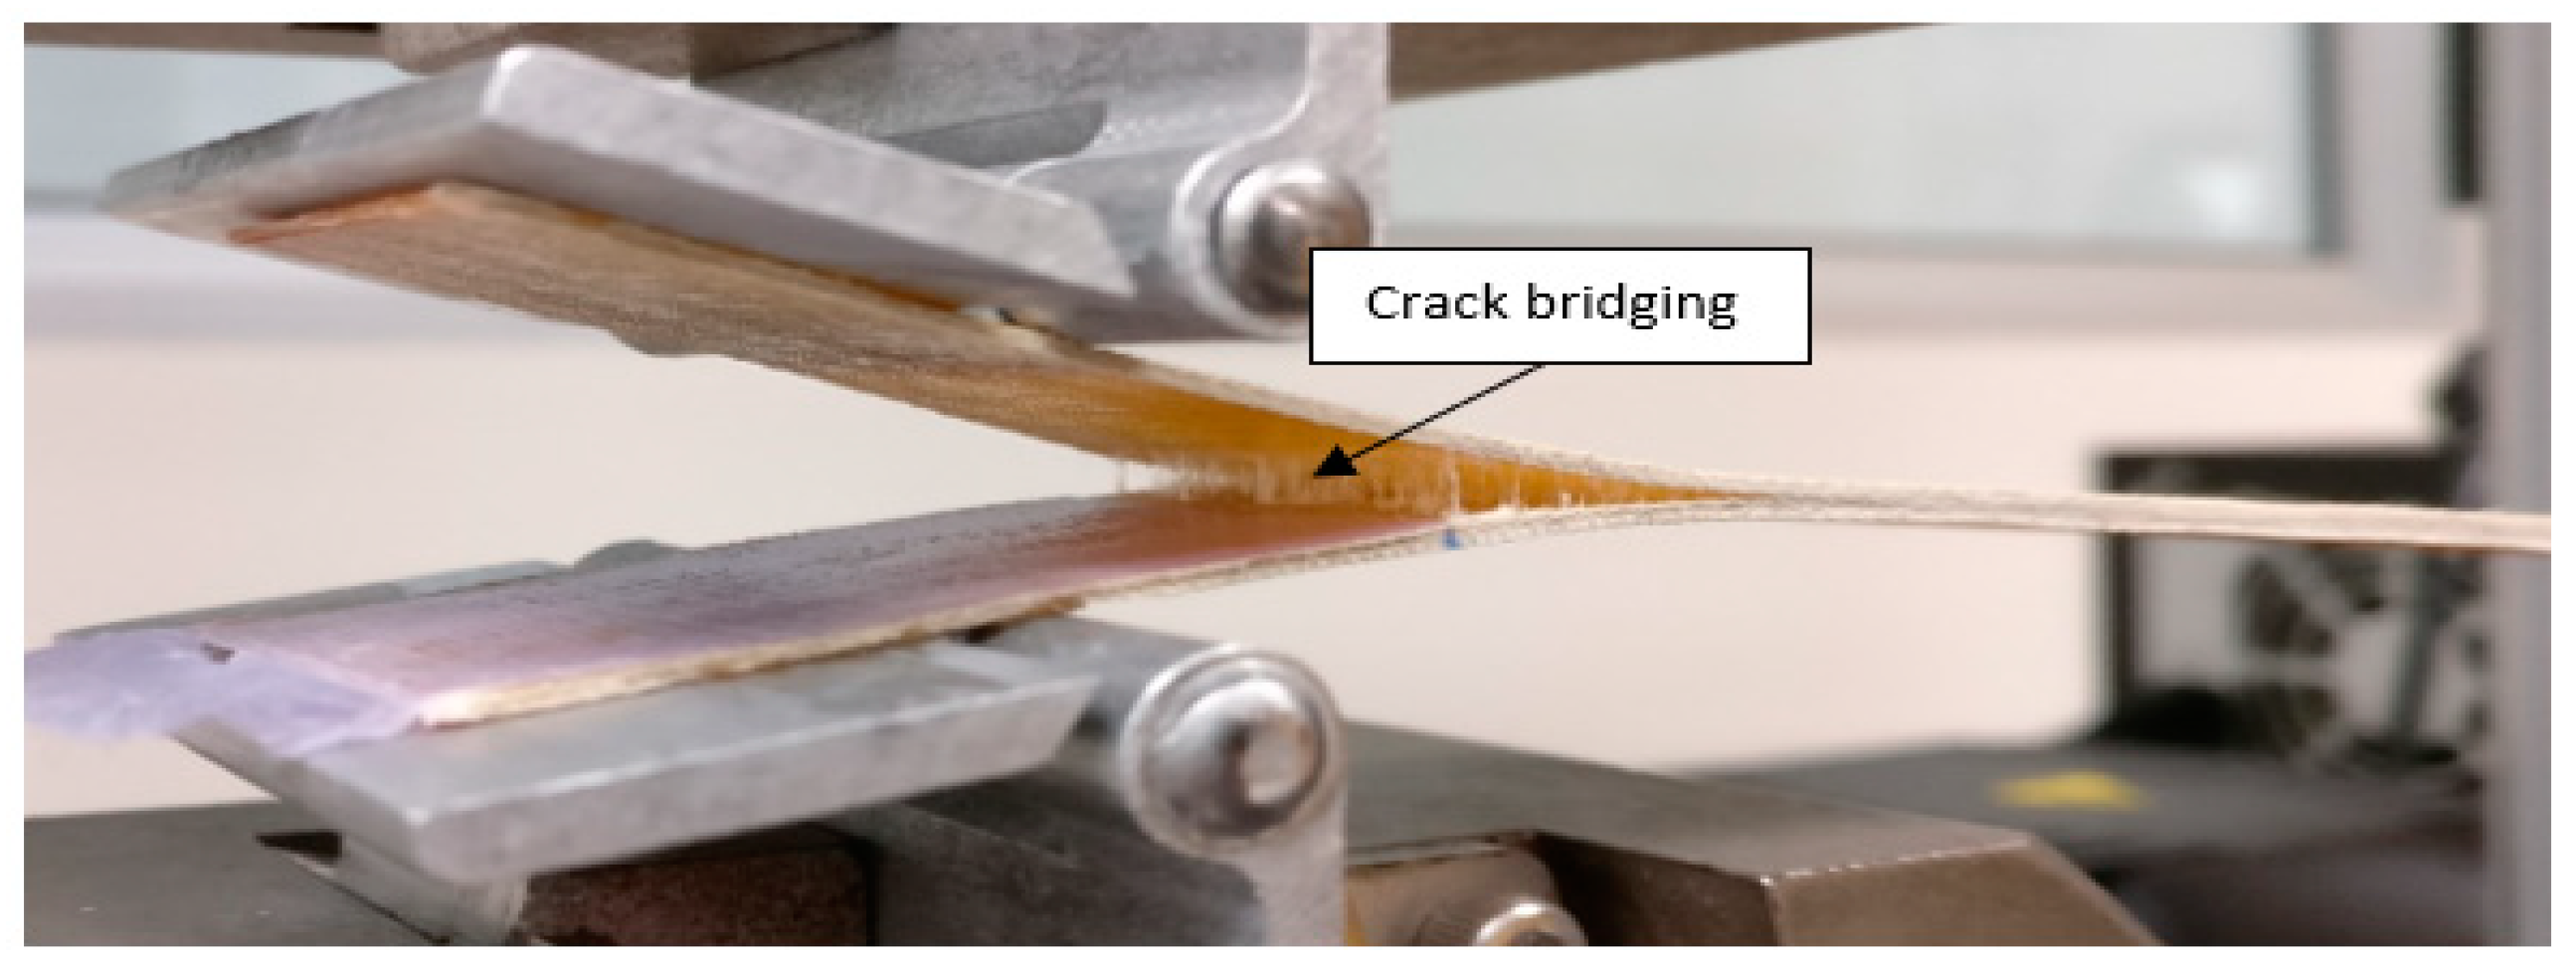
The load-displacement curve gets shifted upwards with increasing film thickness as evident from Figure 11. This implies that as the film thickness increased, the resistance to delamination also increased. This increase can be attributed to the crack bridging phenomenon caused by the adhesive interface as illustrated in Figure 12. The applied interleaving film layer provides extra bonding between the two adjacent plies and hinders the crack propagation, thereby increasing the delamination resistance, shifting the load-displacement curve upwards.
Due to the presence of slip, it was very difficult to track the crack growth in this region as the crack would cross the marking in a haste. Hence some modifications were made to the ASTM standard regarding the intervals at which the crack propagation is tracked. For this Mode I test, crack propagation data was recorded at every 5 mm interval from 0 to 50 mm.
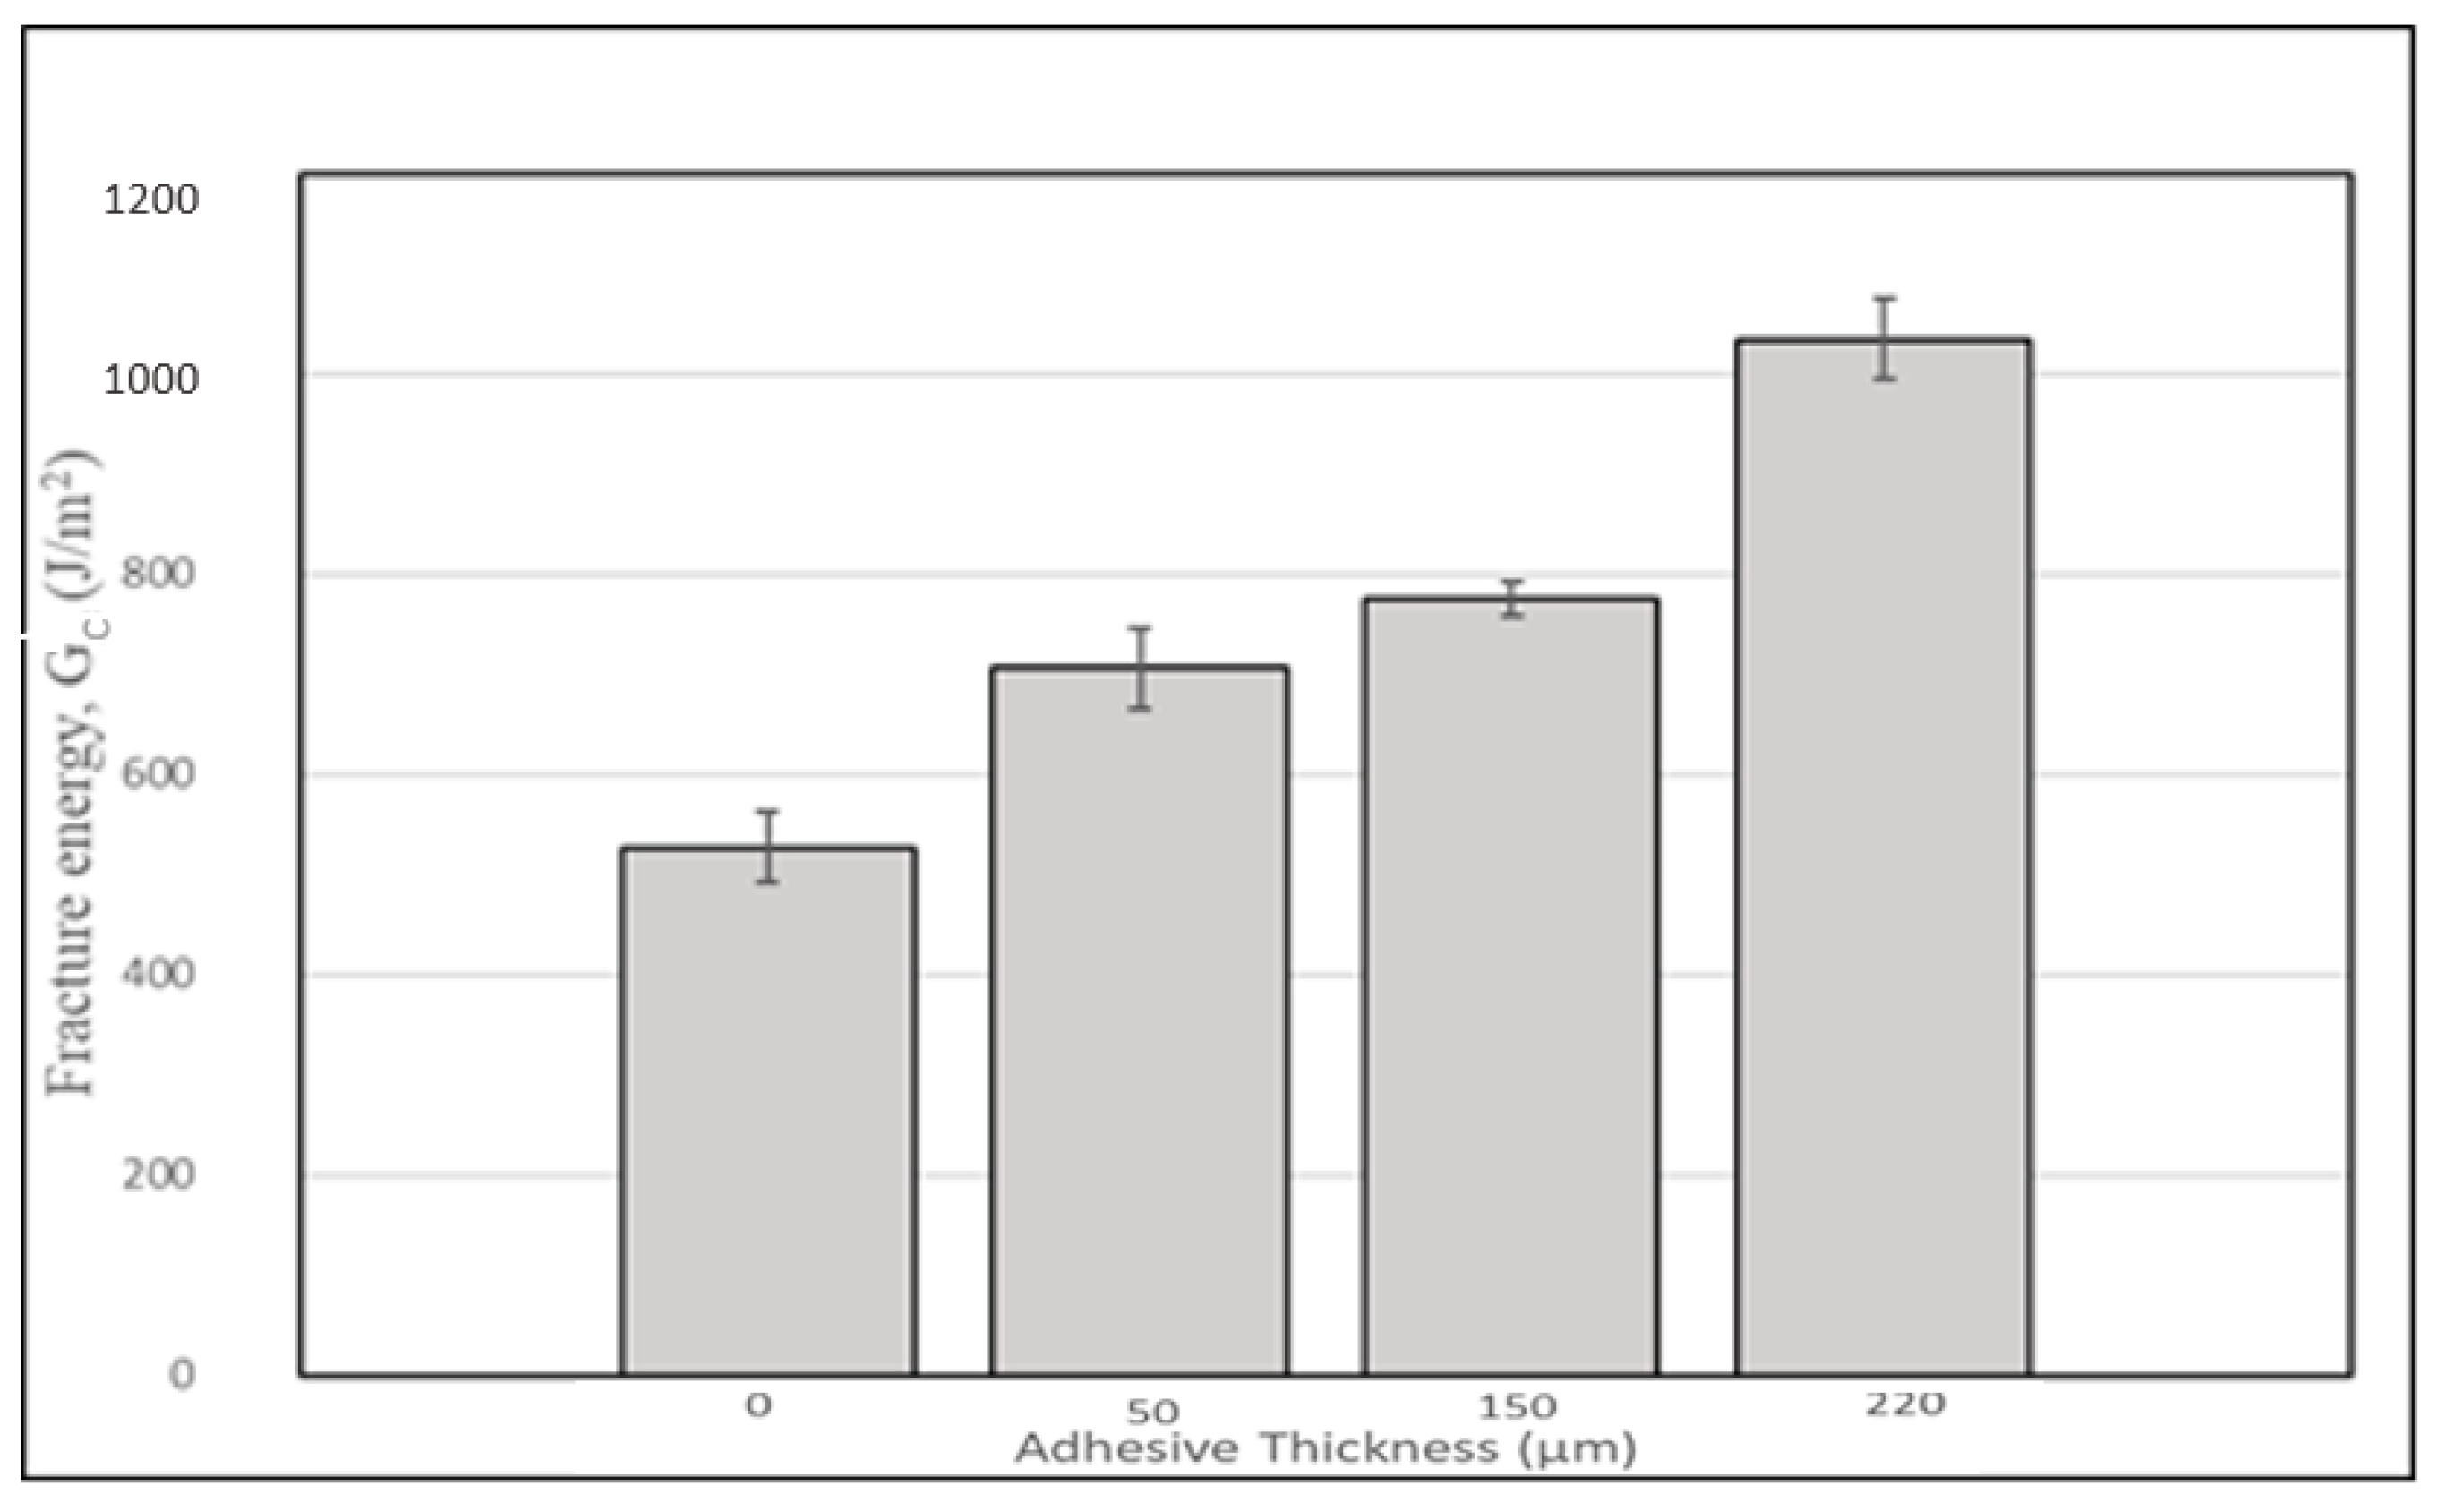
4.1.3. Fracture Energy Comparison
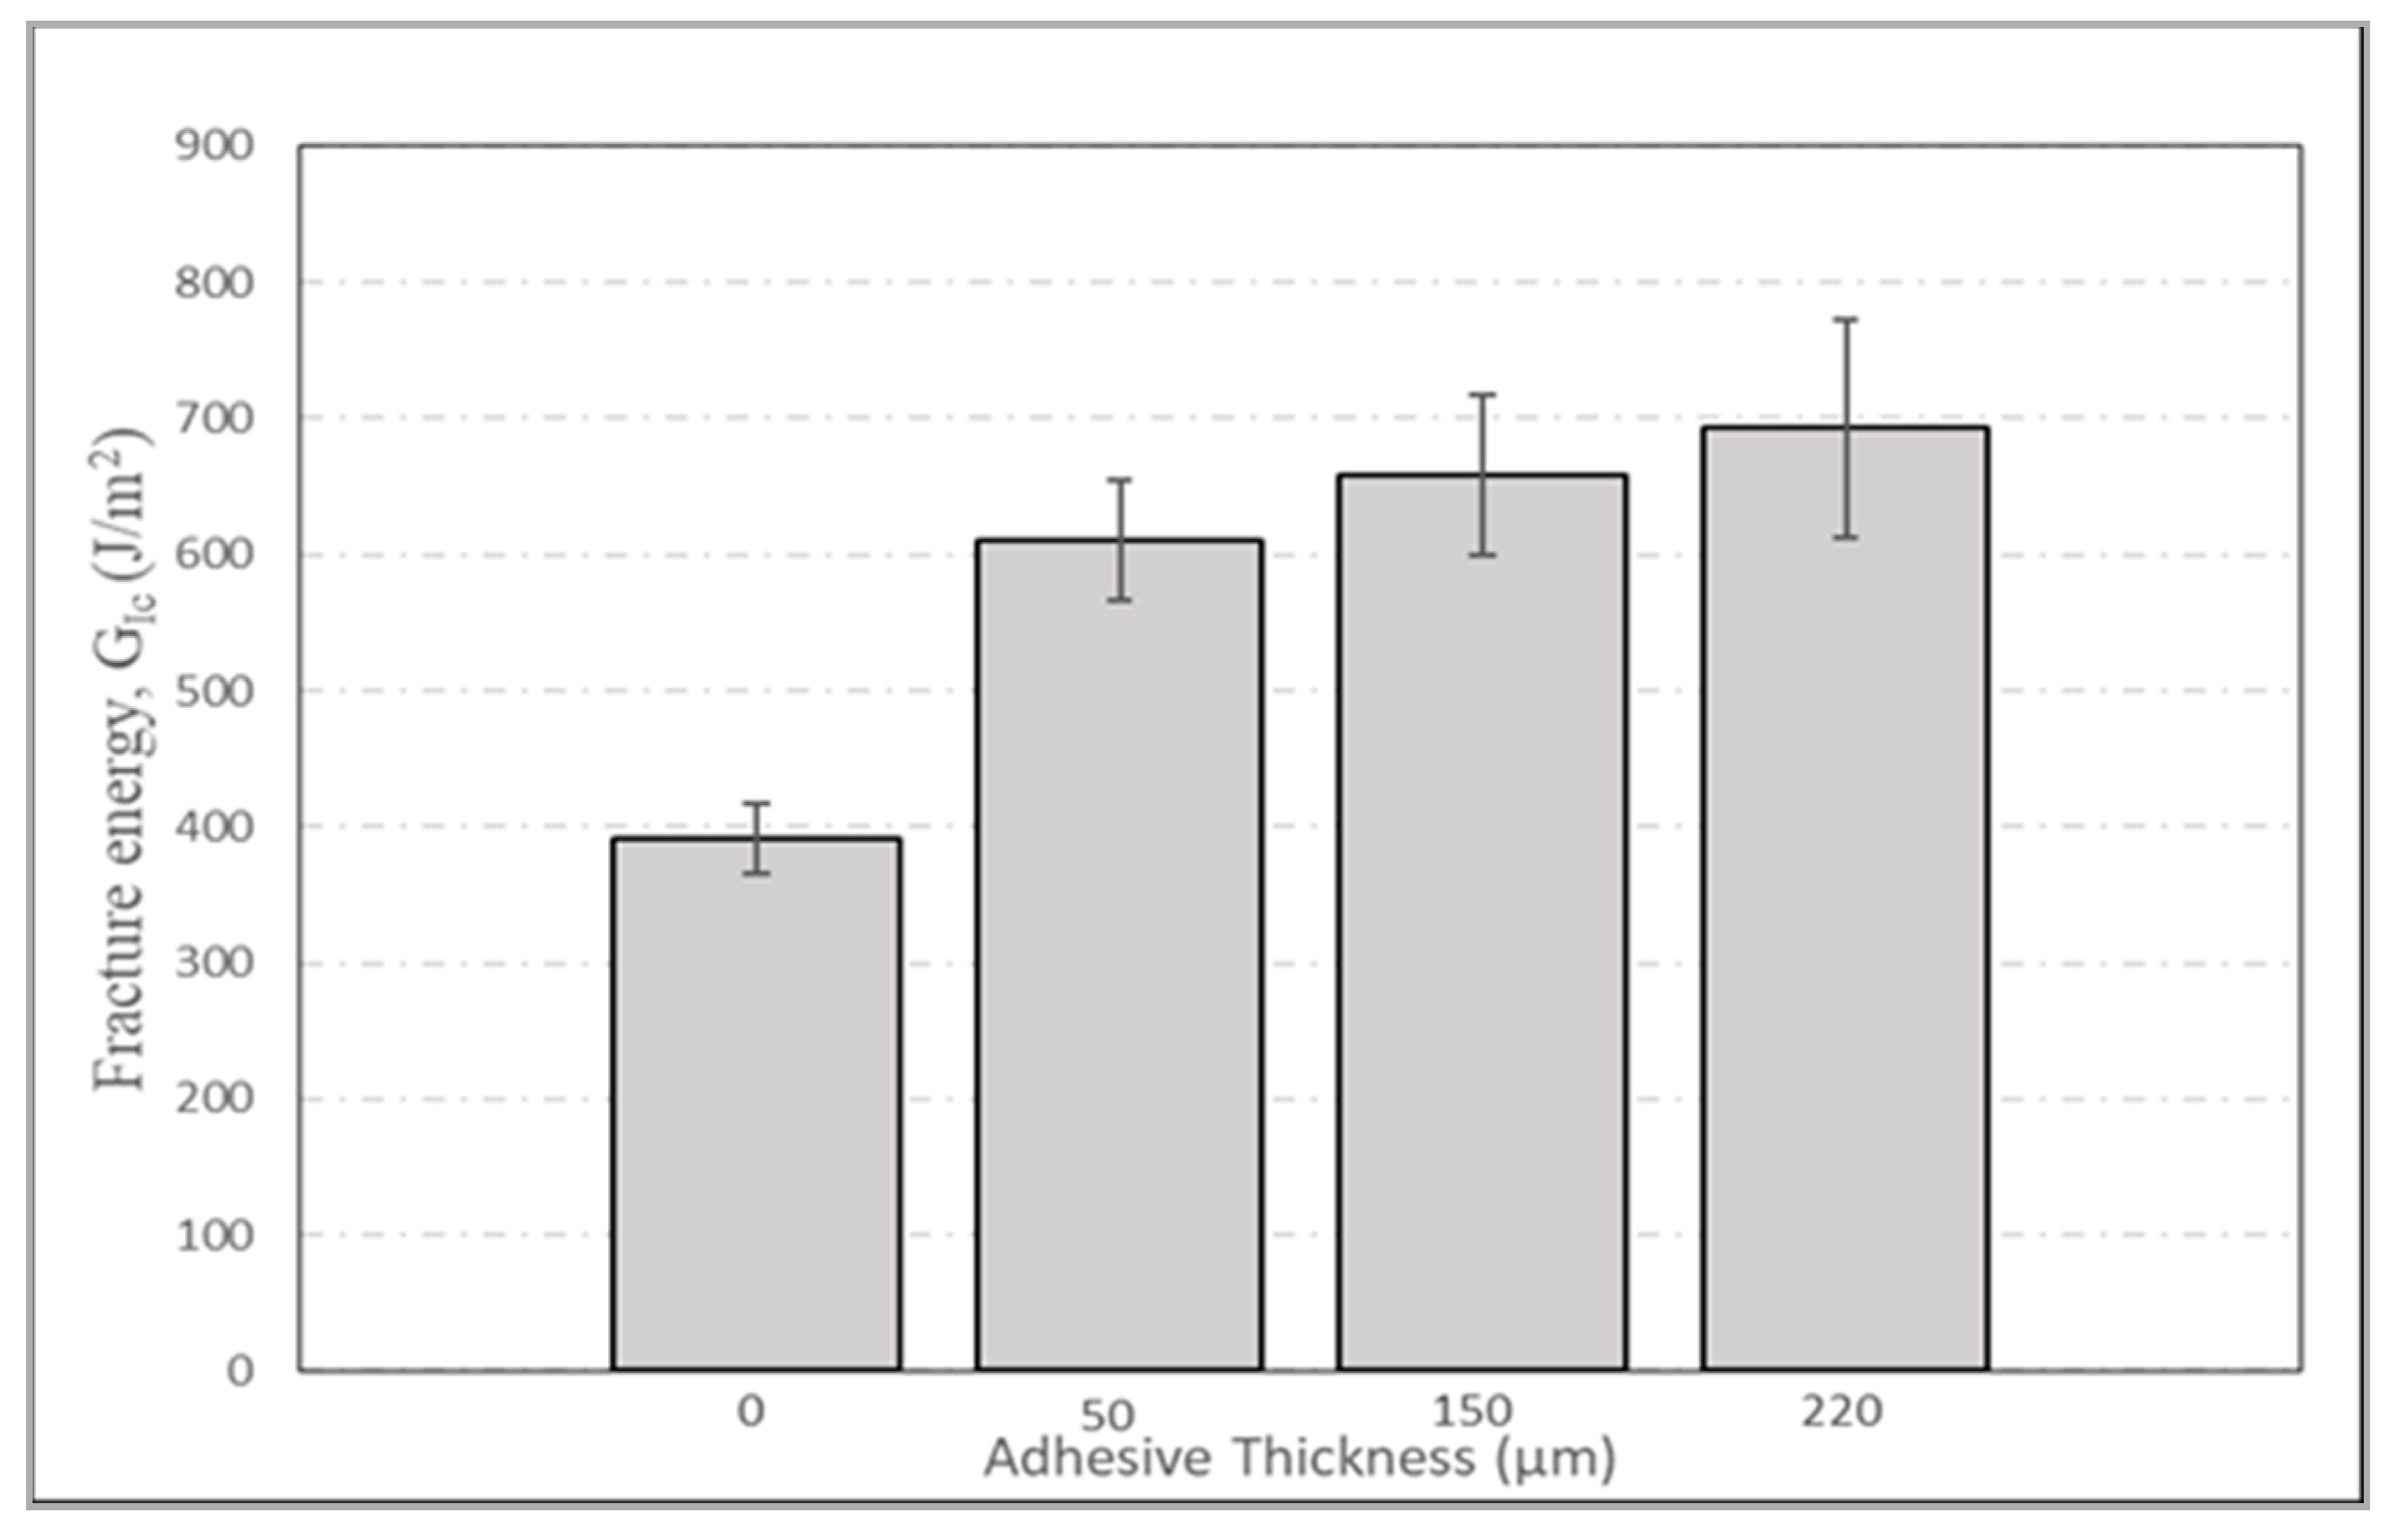
A comparison between the fracture energies of all the batches of GFRP tested in Mode I is depicted in Figure 13. Error bars are also included wherever deemed necessary. It can be inferred clearly from the plot that the batches with thermoplastic film interleave exhibit higher delamination resistance than the batch without any film. The fracture energy for the first batch is only 392 J/m2 whereas it is 693 J/m2 for the last batch with 220 μm interleaving film. This equates to a significant increase of 77% in the fracture energy in Mode I. The effect of interleaving film thickness on the fracture energy in Mode I is tabulated in Table 3.
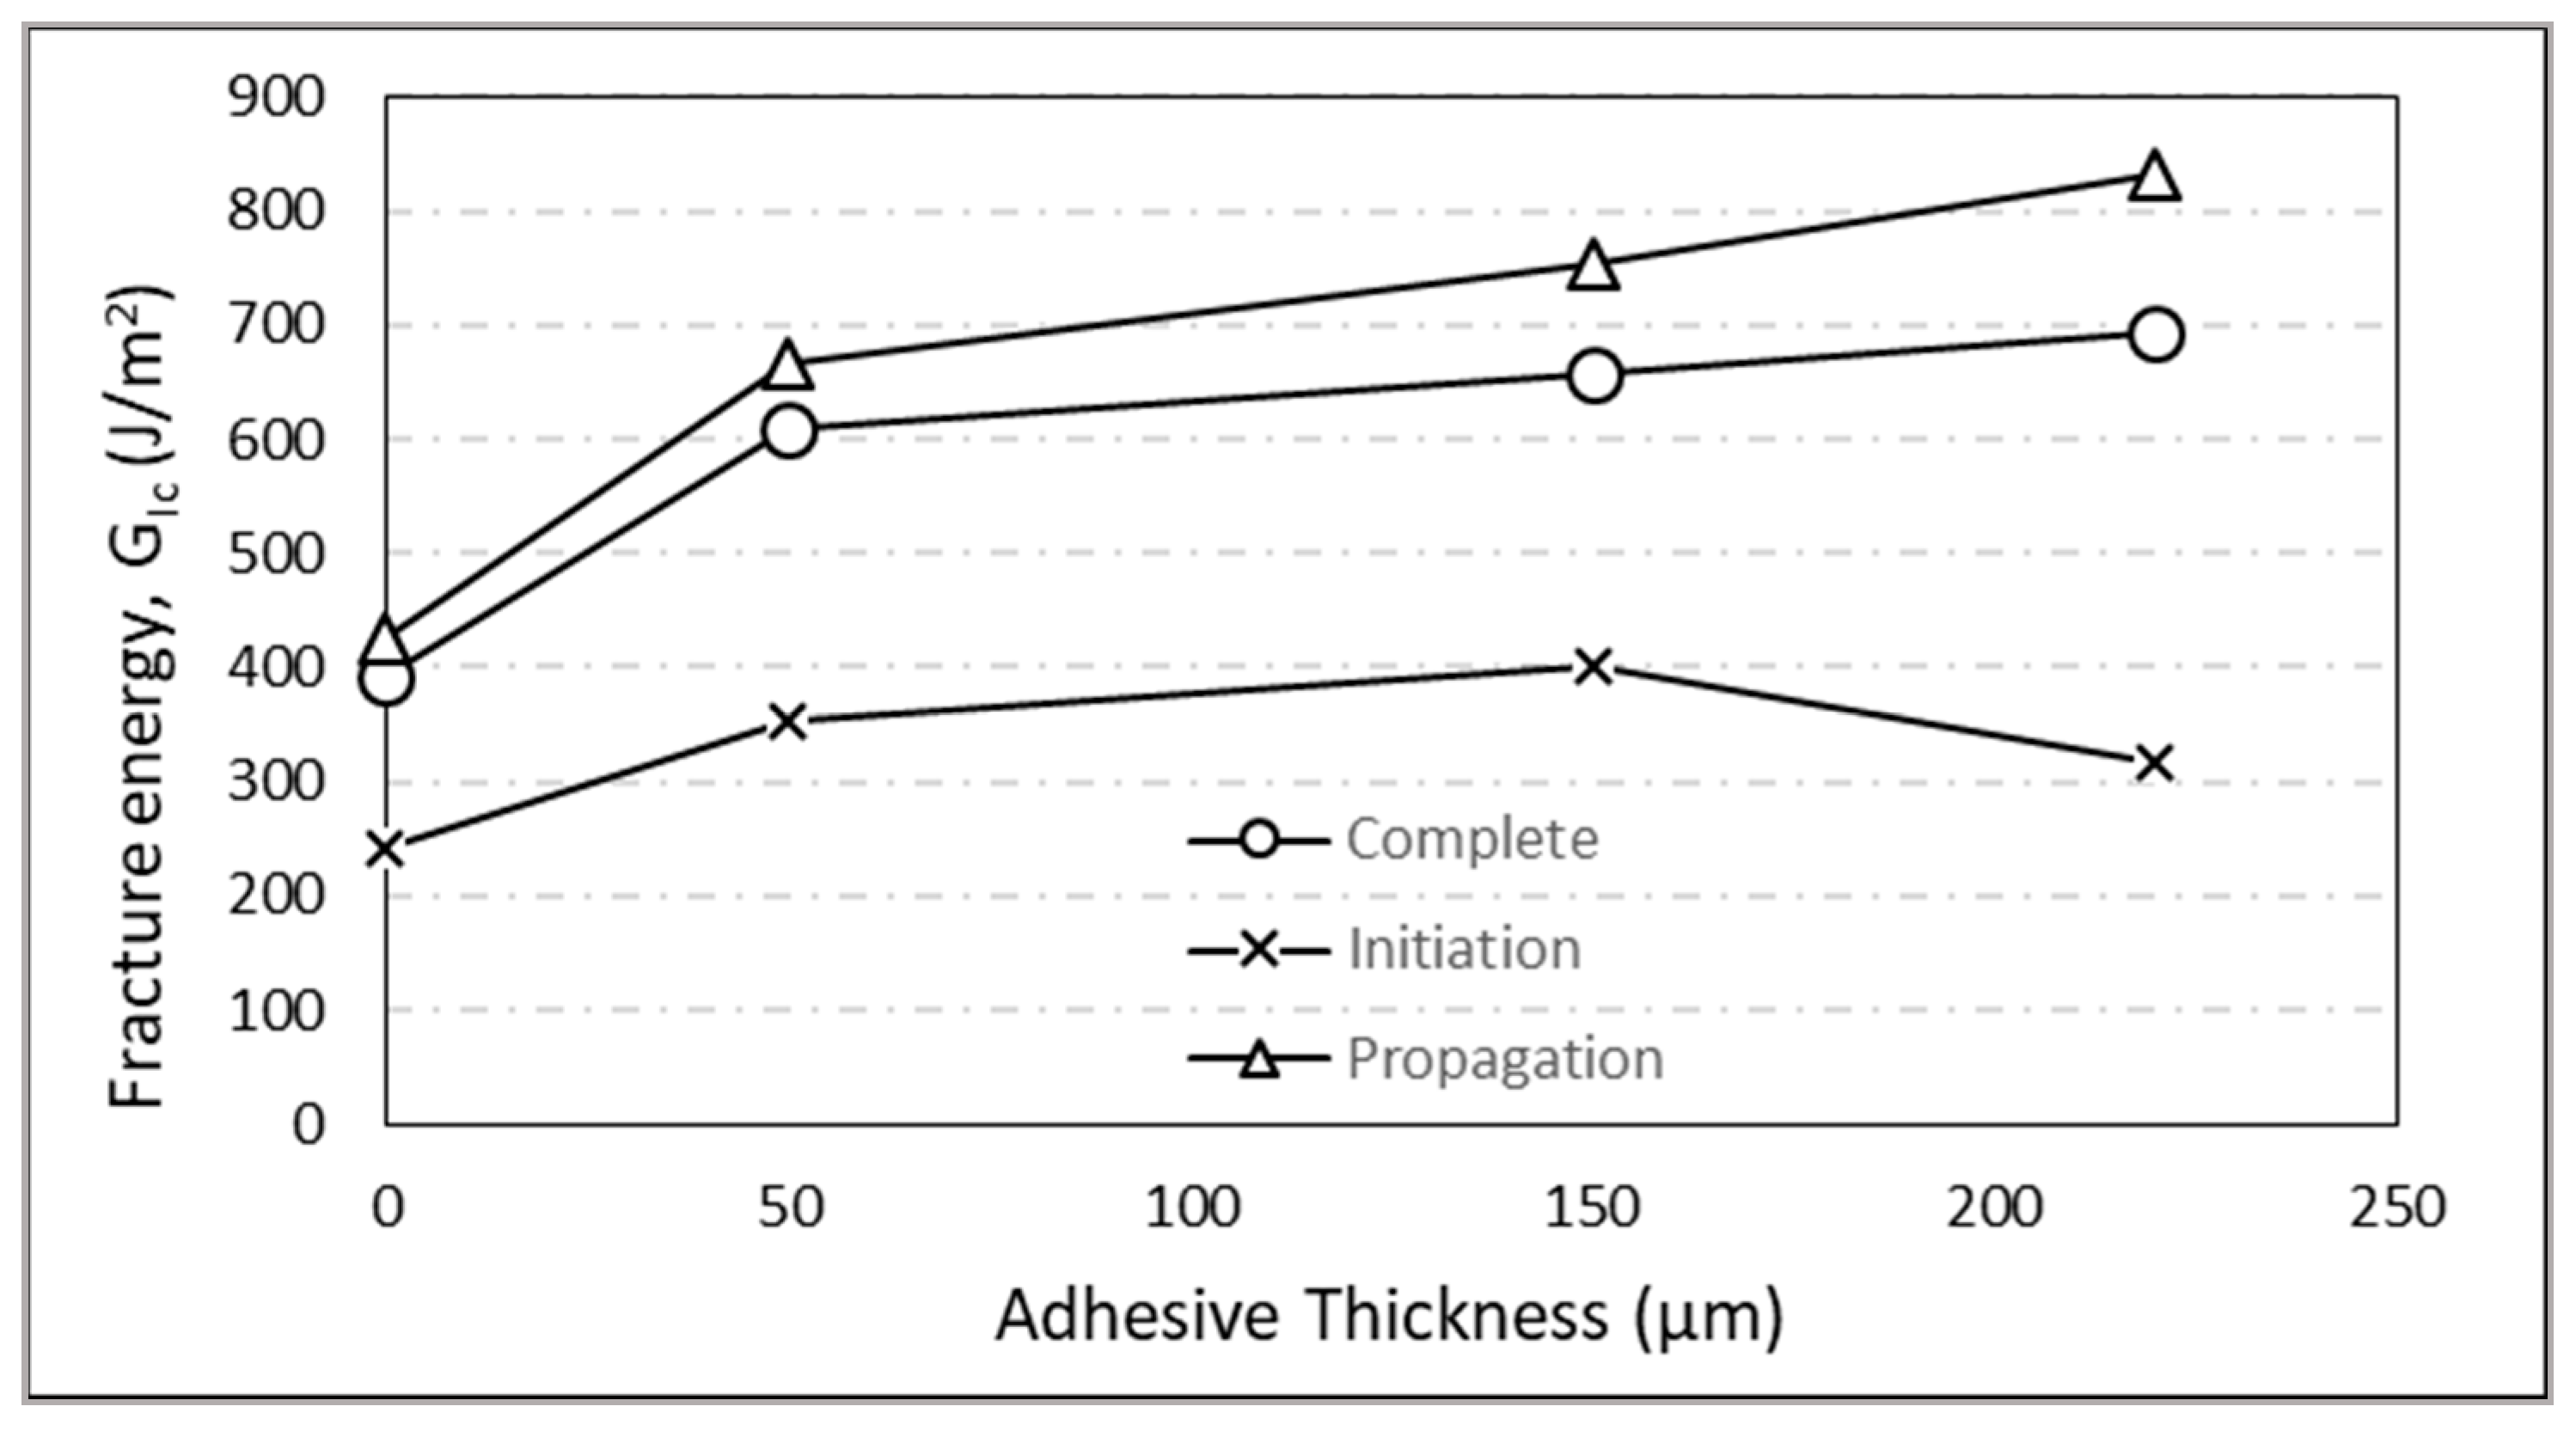
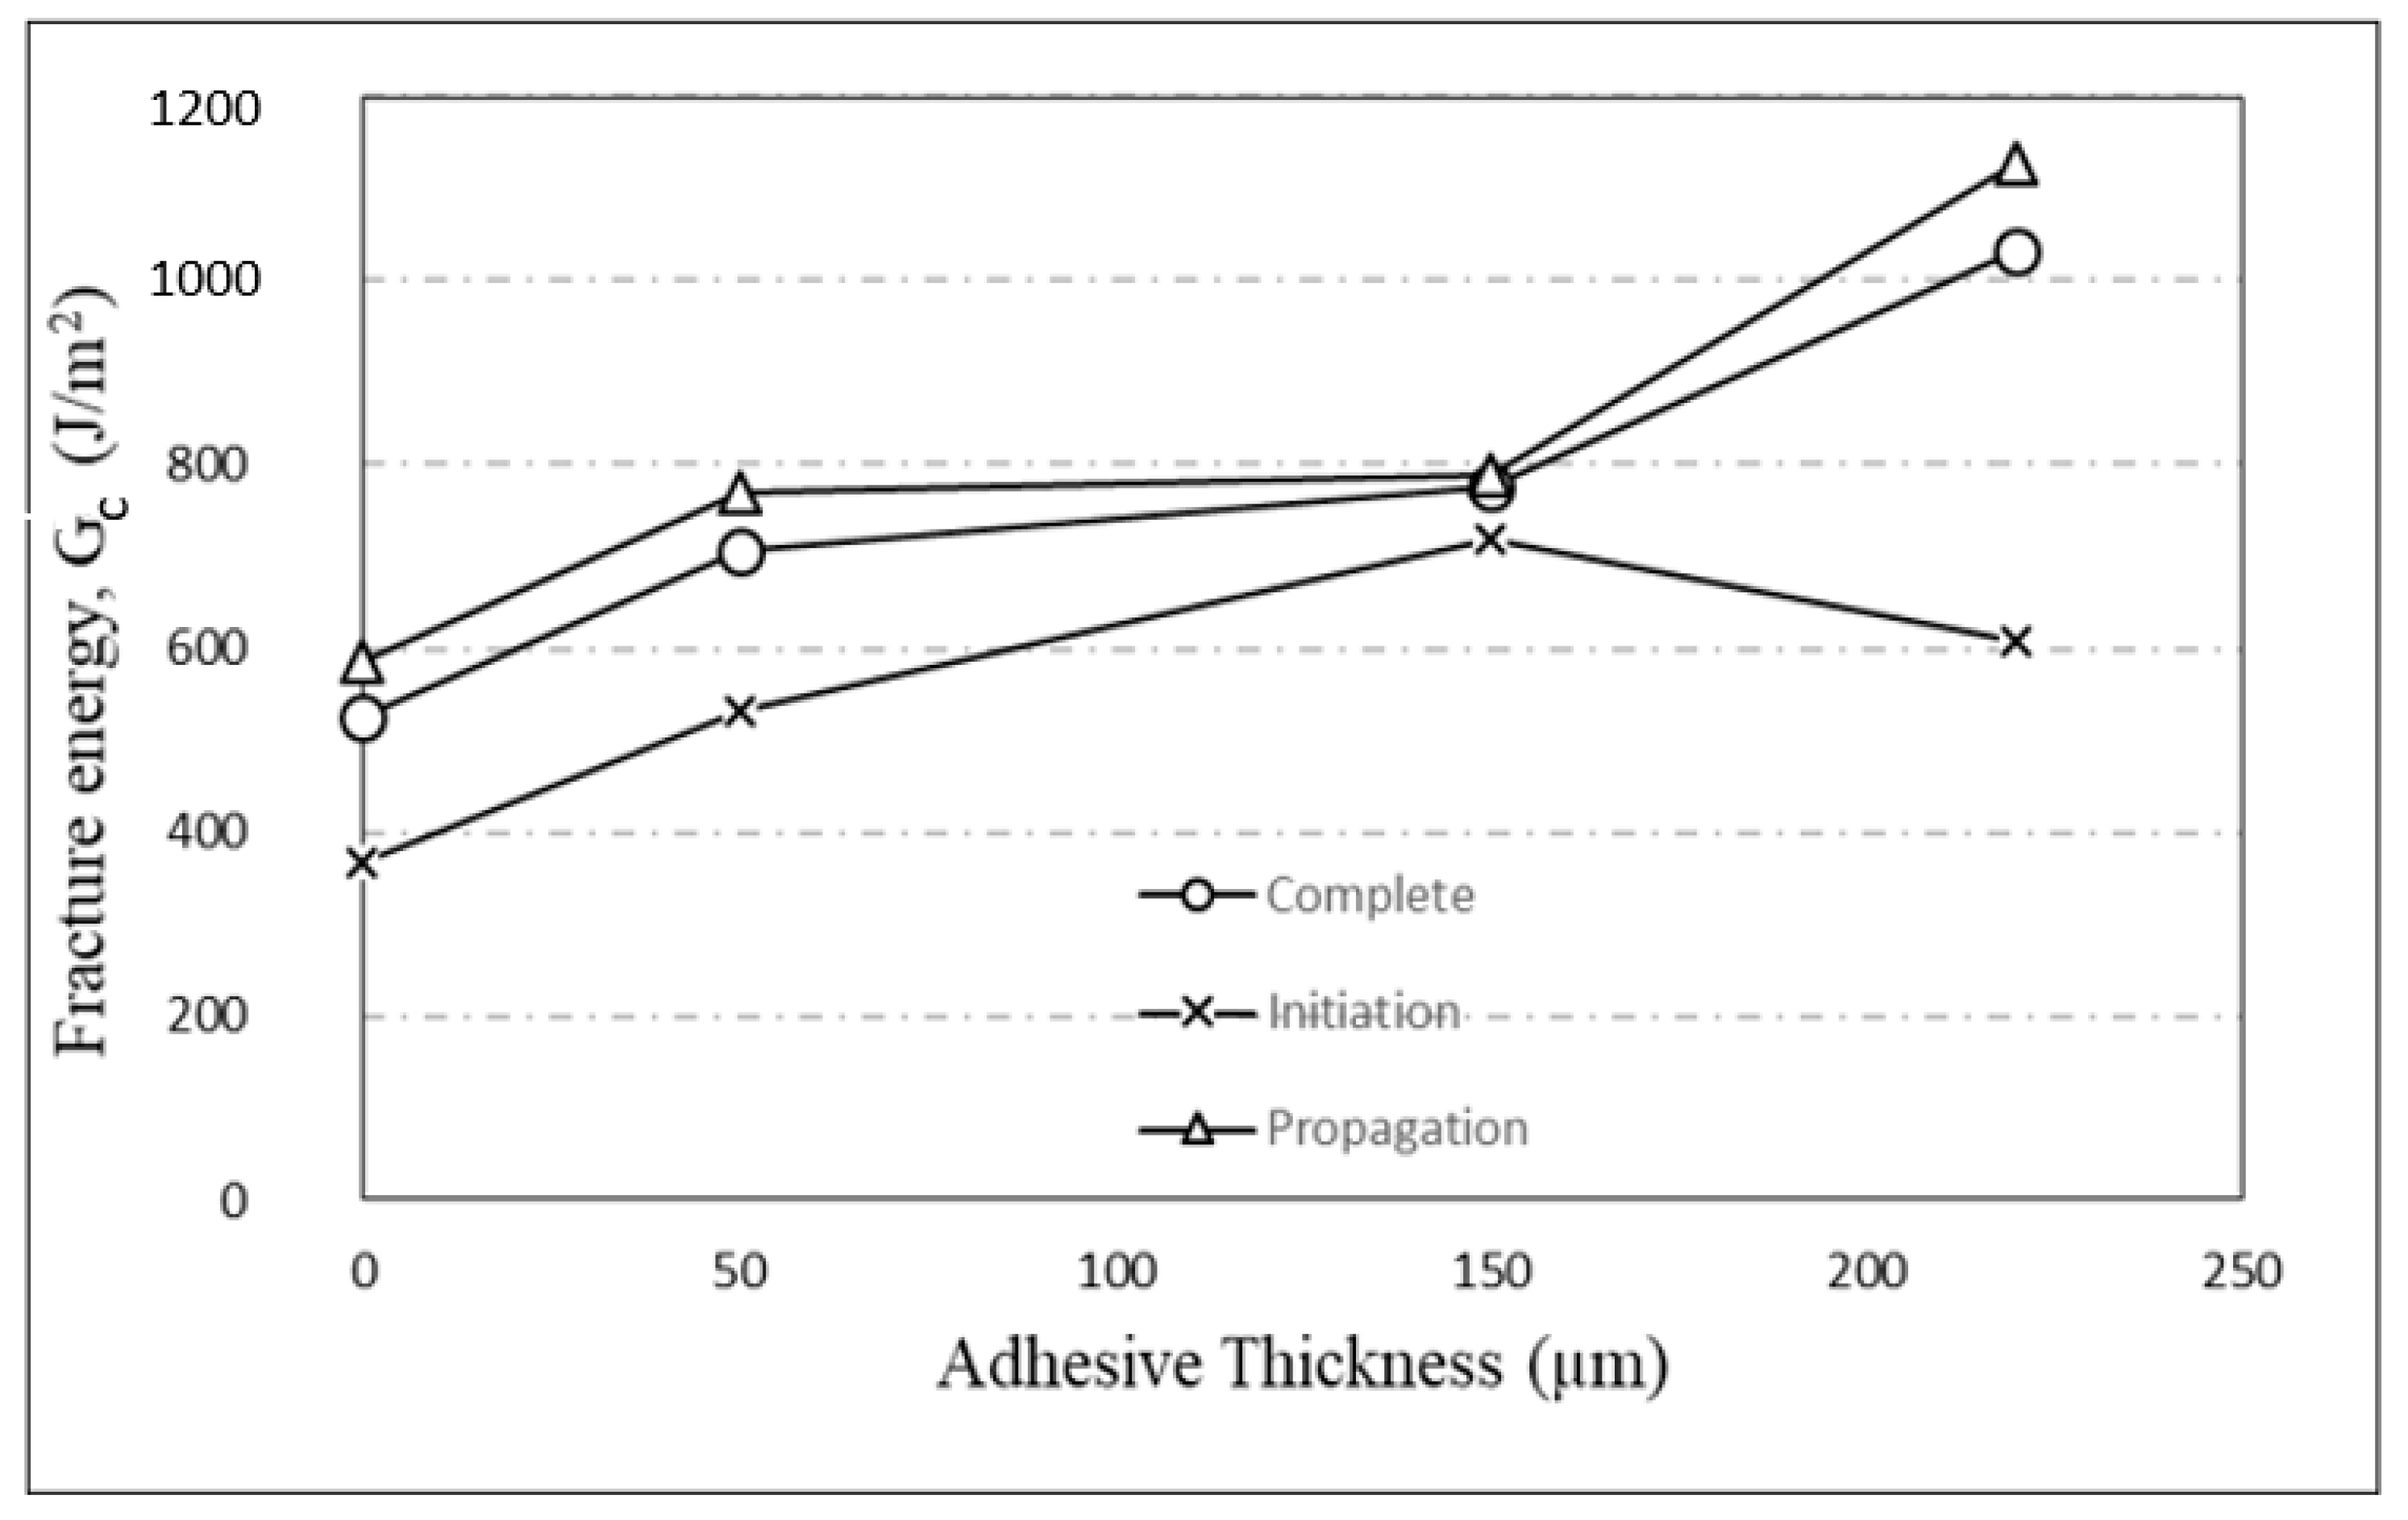
The steady increase in fracture energy observed in Figure 13 may be explained by the bridging action performed by the interleaved thermoplastic film, clearly depicted in Figure 11. The interleaved film bridges both the top and bottom surfaces of the DCB specimen, thereby delaying the crack growth. This increases the delamination resistance and transpires as the increased interlaminar fracture toughness. However, from Figure 14, it may be observed that the initiation fracture energy does not follow this trend. The interleaved film initially helped in resisting the crack initiation. Therefore, the fracture energy value increased till the 150-micron film thickness. The resistance to crack initiation decreased as the thickness was increased further. The thicker film acted as a separation layer and did not conform to the fiber architecture as desired, leading to the lower initiation fracture energy value.
4.2. Mode II Interlaminar Fracture Toughness
Fracture toughness tests of the baseline and interleaved samples in sliding mode or Mode II were conducted experimentally using ENF test specimens. A compliance method was used to determine the Mode II interlaminar fracture toughness of all the ENF samples. The various findings pertaining to ENF tests are elaborated on in the following subsections.
4.2.1. Fracture Surface
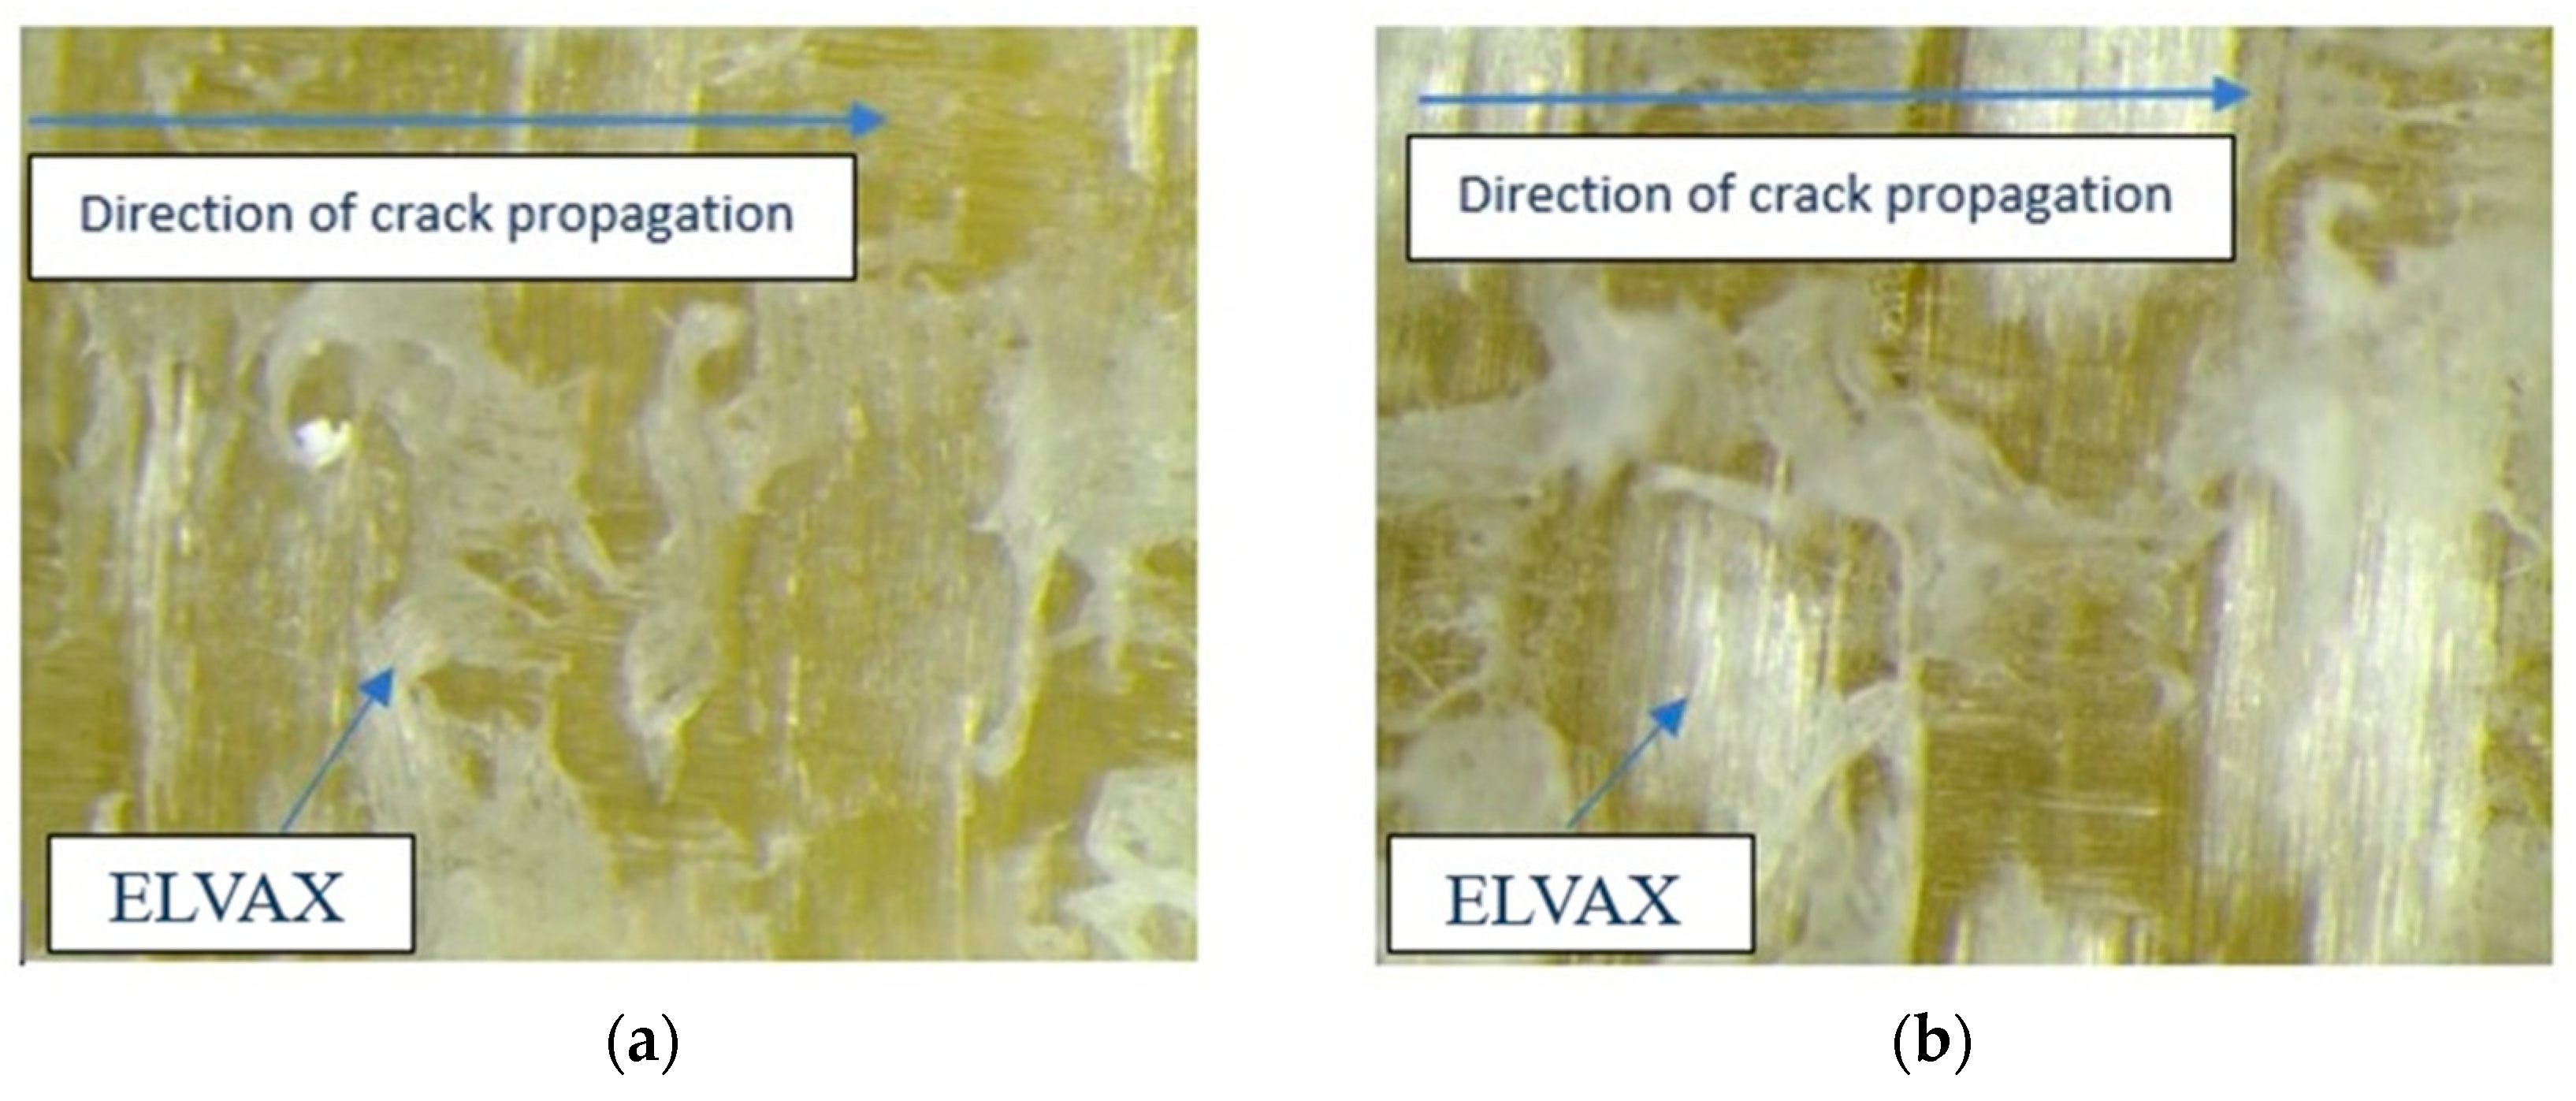
Figure 15 shows the fracture surfaces of the tested ENF specimen observed under an optical microscope. The direction of the crack propagation, as well as the adhesive residues, are clearly indicated in the same. The fracture surface is like that of the DCB samples with the presence of an adhesive layer on both the surfaces and failure of cohesion in the adhesive is observed. The used interleaving film exhibited good bonding characteristics with the GFRP/BMI laminate. Hence the results of the ENF tests are reliable and the effect of interleaving film on the fracture toughness may be inferred from these results.
4.2.2. Force-Displacement Curve
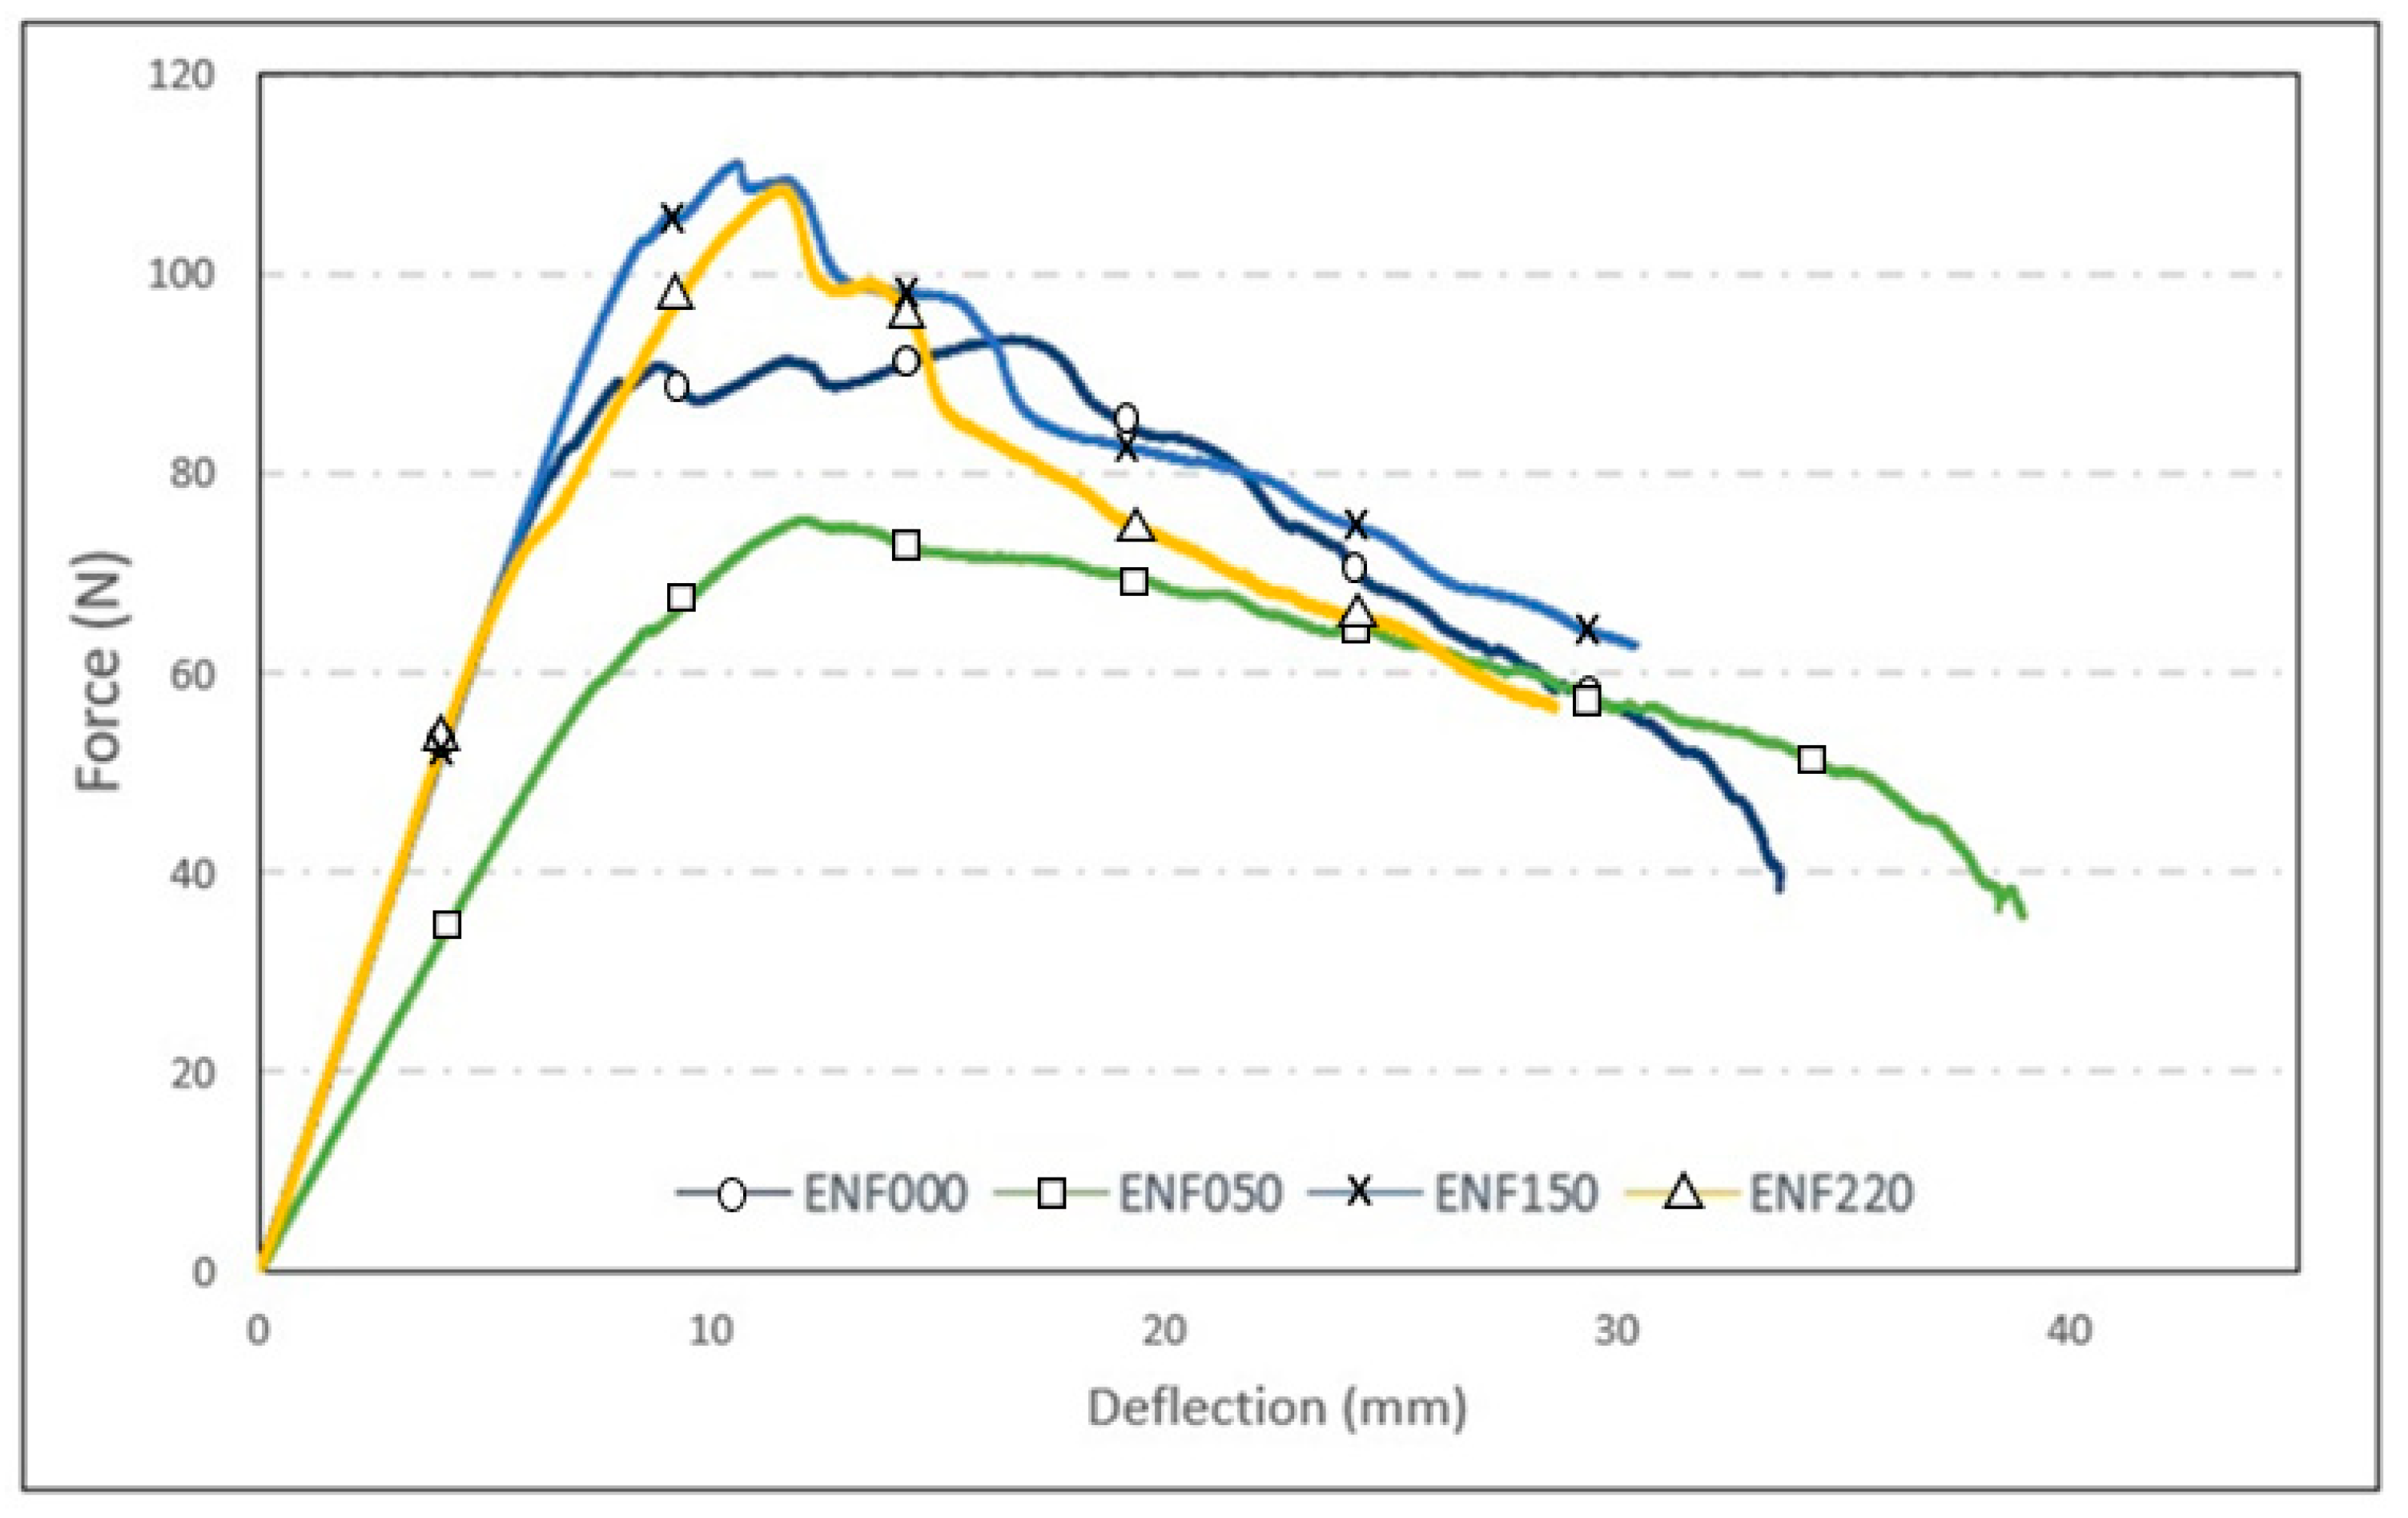
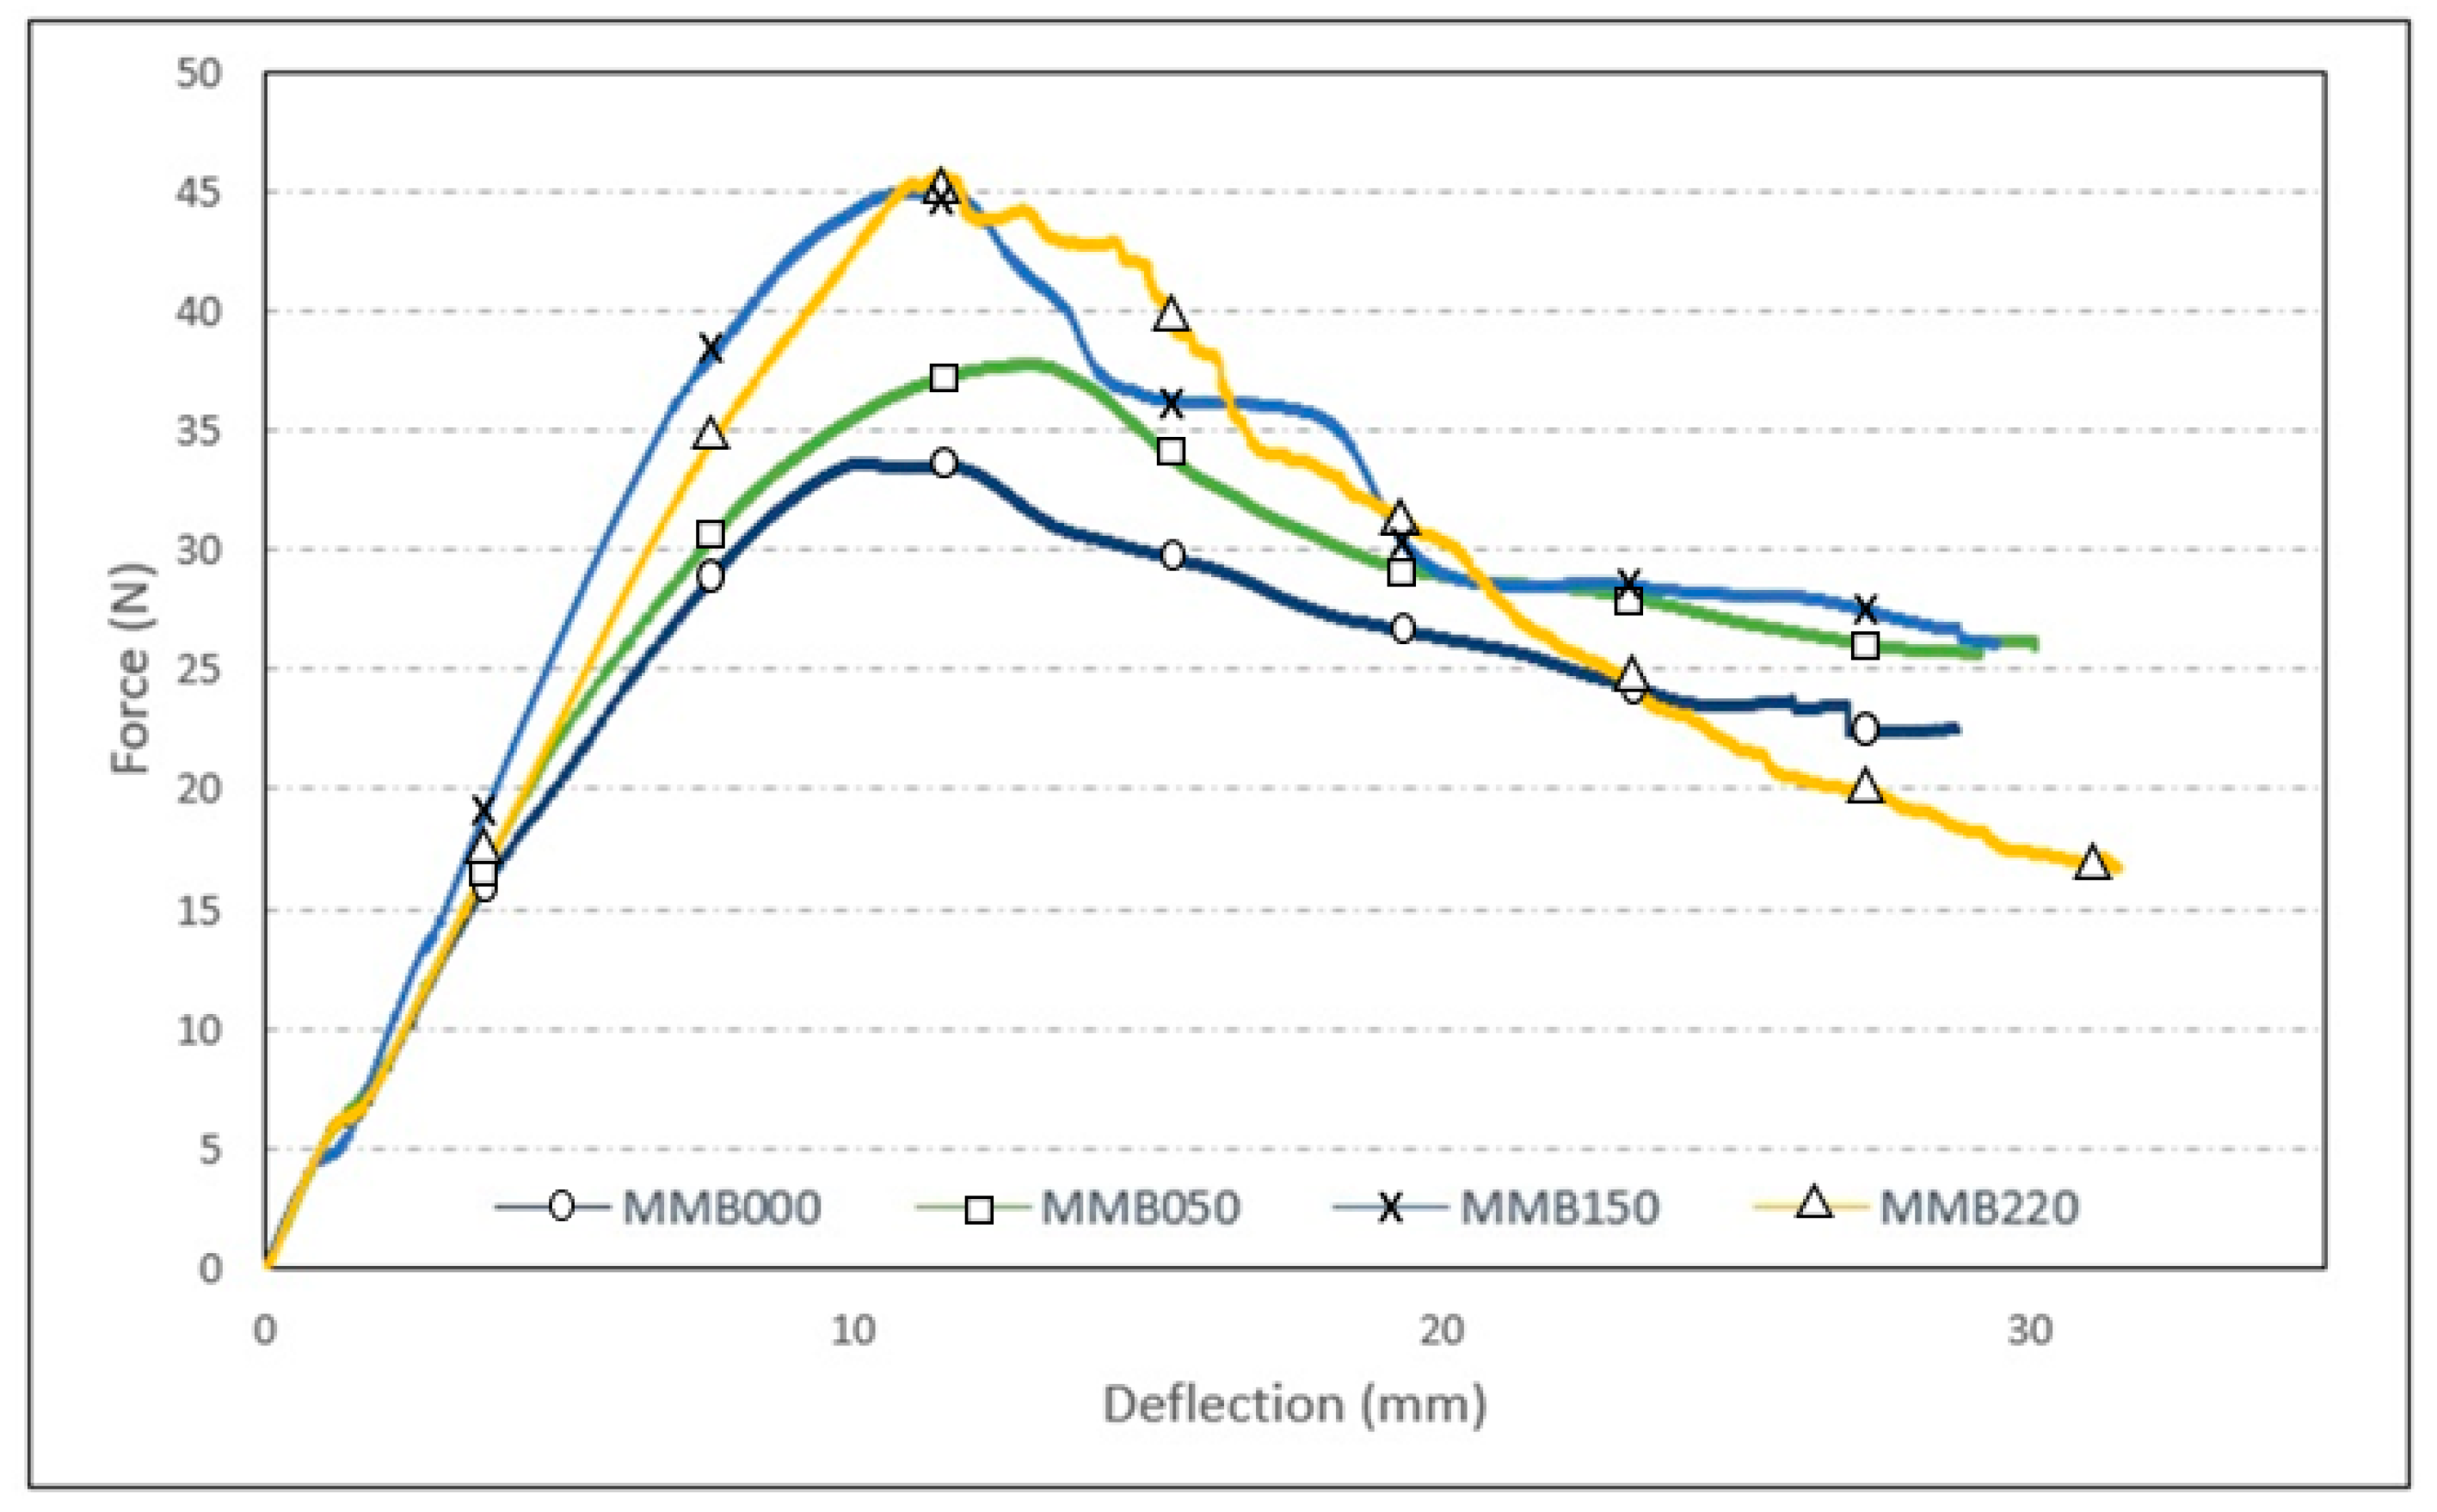
Figure 16 depicts a plot of applied load versus crosshead displacement for all the batches of GFRP tested in Mode II. Like the load-displacement curve of samples tested in Mode I, these plots show an average of all the specimens tested in each batch and are a combination of smooth curves and regions with falls. The crack growth could be tracked effectively using a displacement rate of 2 mm/min. Regions of fall coincided with load drop as well as slightly faster crack growth. This is because as the resistance to crack growth decreased, the load also decreased as indicated by the fall in the graph.
The initial linear increase owing to the resistance to crack growth, observed for the Mode I case is also present here. Once the crack starts growing, the load value decreases correspondingly. This type of curve coincides with the well-known stick-slip behavior where the “stick” portion corresponds to the initial region of load increase and the “slip” corresponds to the region where the drop-in load occurs. In the regions of slip, it is difficult to track the crack propagation as it would grow faster. When compared with the Mode I test, crack tracking is much more difficult as there are more regions of undulations in the load-displacement plot. Hence some modifications were made to the ASTM standard regarding the intervals at which the crack growth is tracked. For this mode II test, crack propagation data was also recorded at every 5 mm interval from 0 to 50 mm, like Mode I tests.
4.2.3. Fracture Energy Comparison
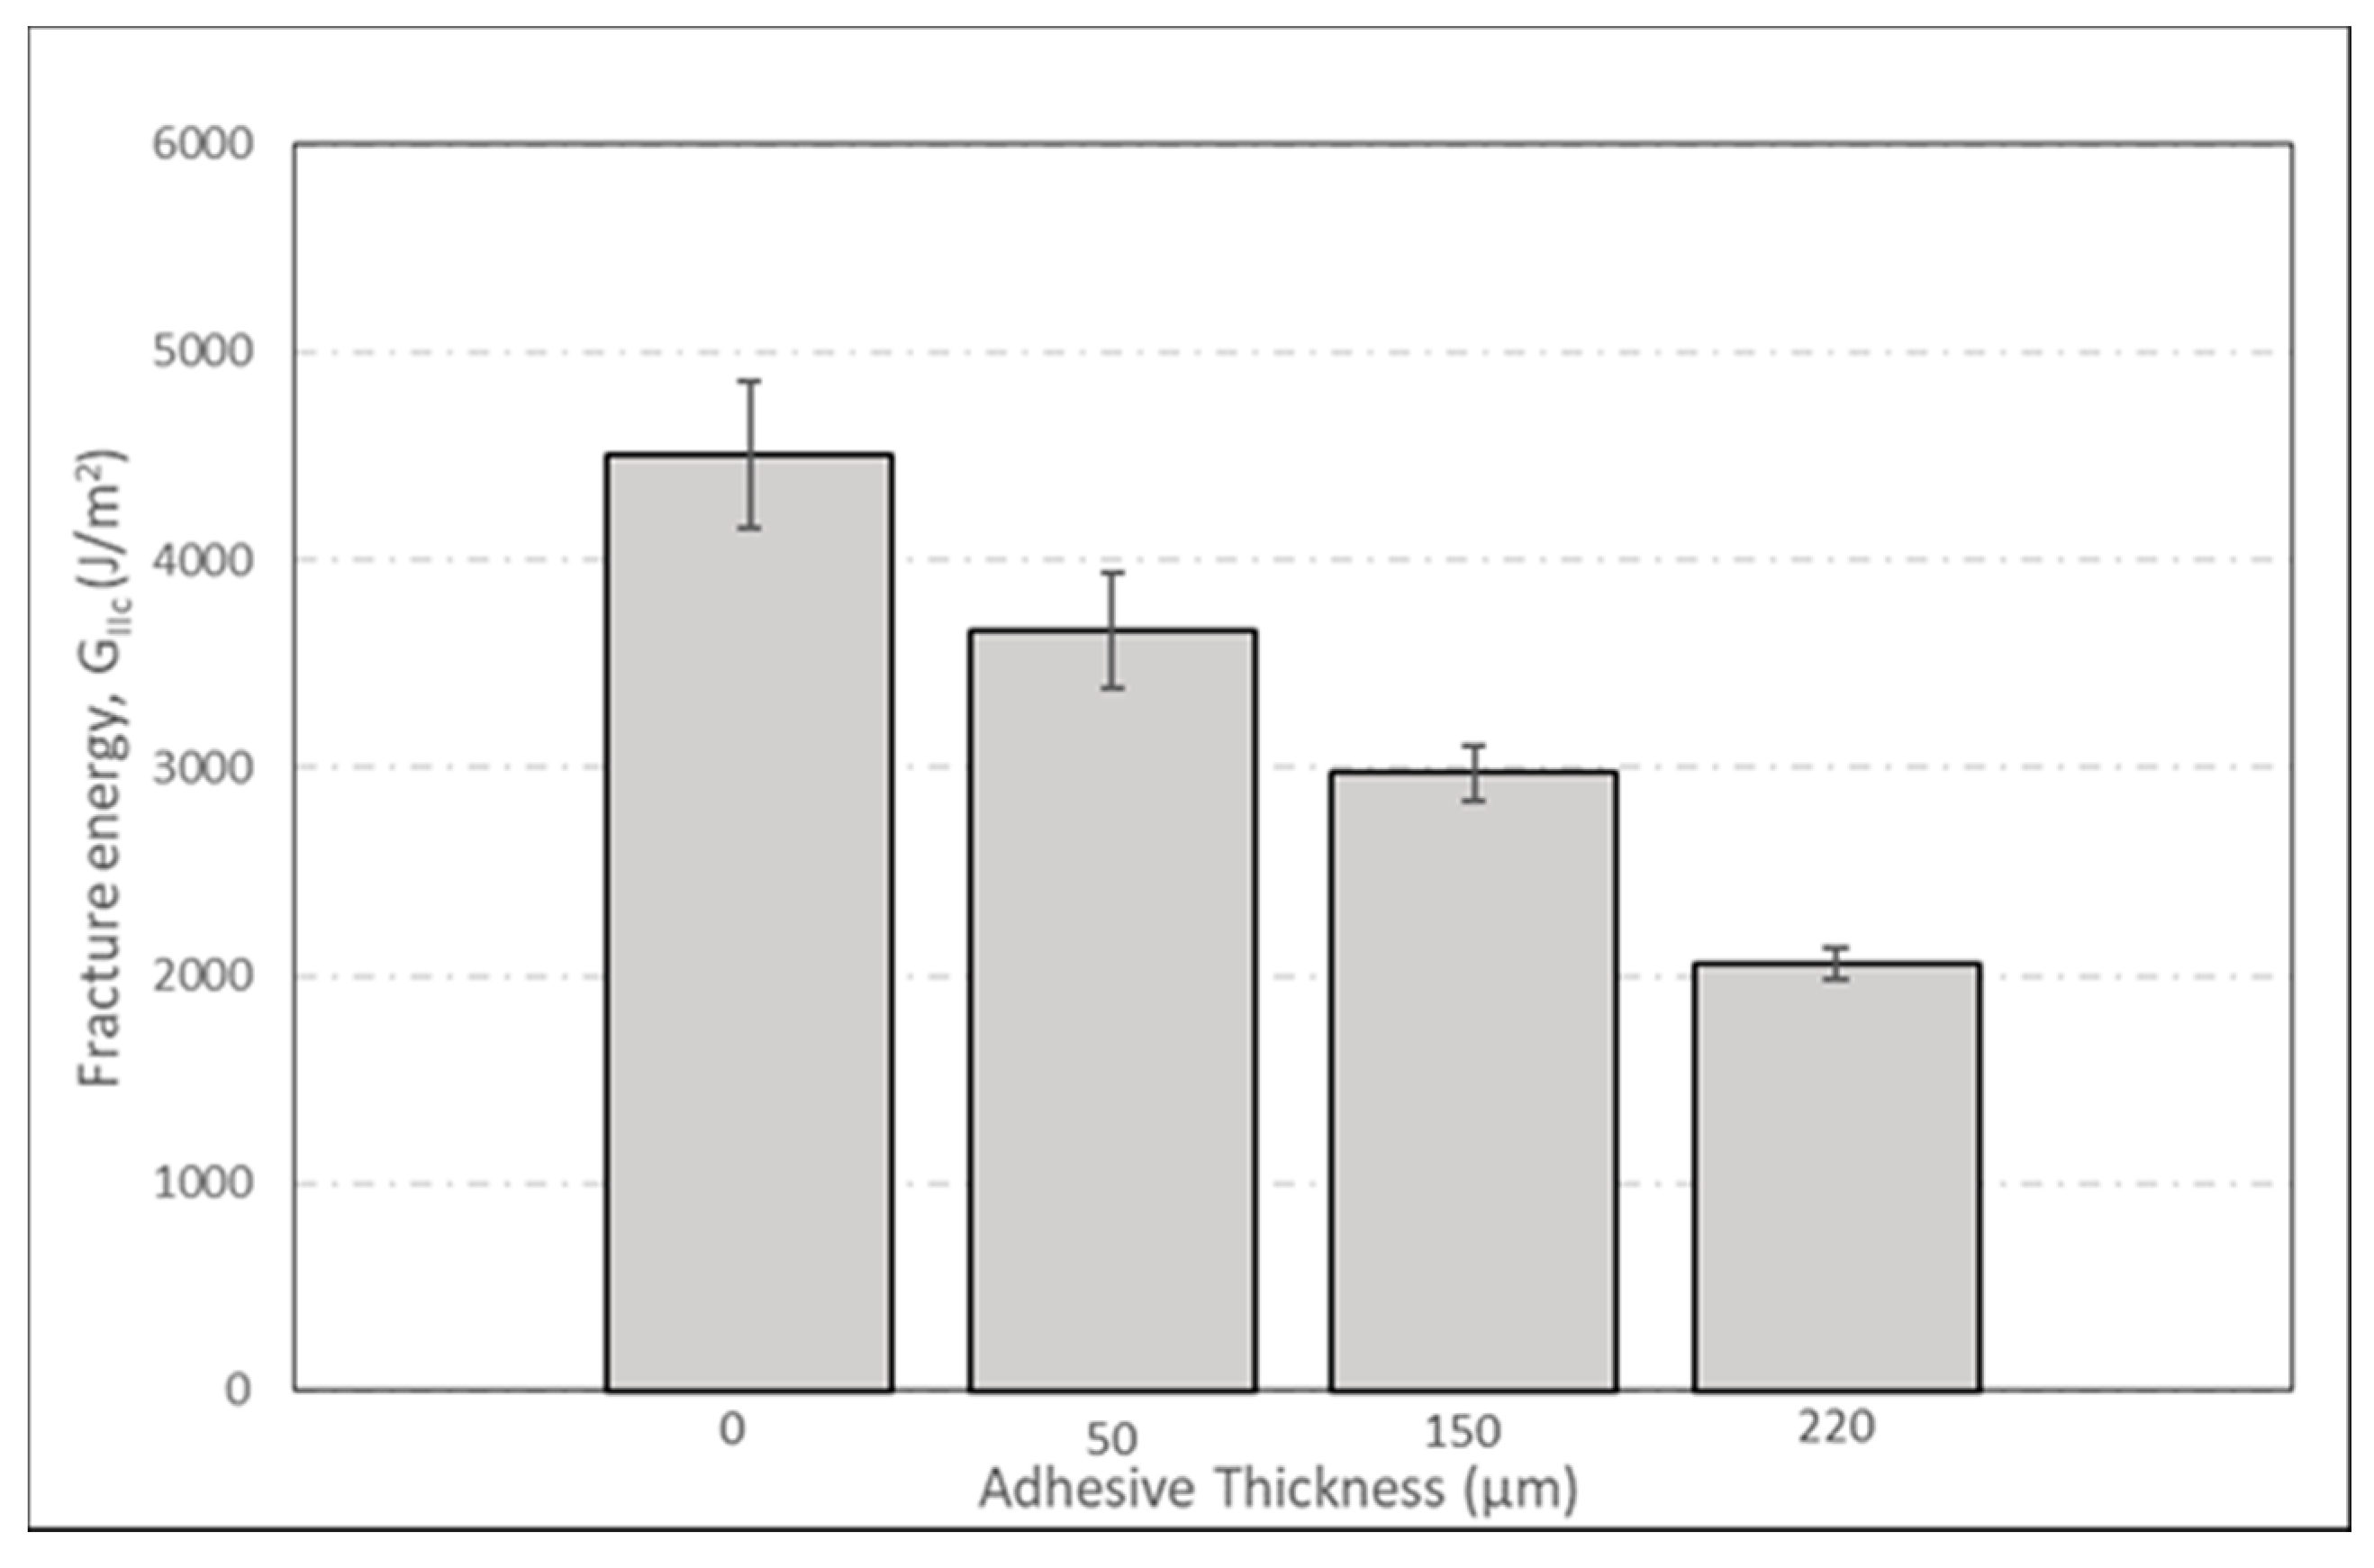
Figure 17 compares the fracture energies of all the batches of GFRP tested in Mode II. It can be deduced clearly from the plot that the batch without any thermoplastic film interleave exhibits higher delamination resistance than the batches with interleaving films. The fracture energy for the first batch is 4502 J/m2 whereas it is only 2058 J/m2 for the fourth batch with 220 μm interleaving film. This equates to a significant decrease of 54% in the fracture energy in Mode II as the film thickness is increased to 220 μm. The crack-bridging phenomenon present in the Mode I case was not a significant factor here. The resistance to both crack initiation and propagation decreased as the film thickness was increased. This is reflected in the reduced fracture energy values. In this mode, the interleaved film acted as a separation layer. Table 4 shows the effect of interleaving film thickness on the fracture energy in Mode II.
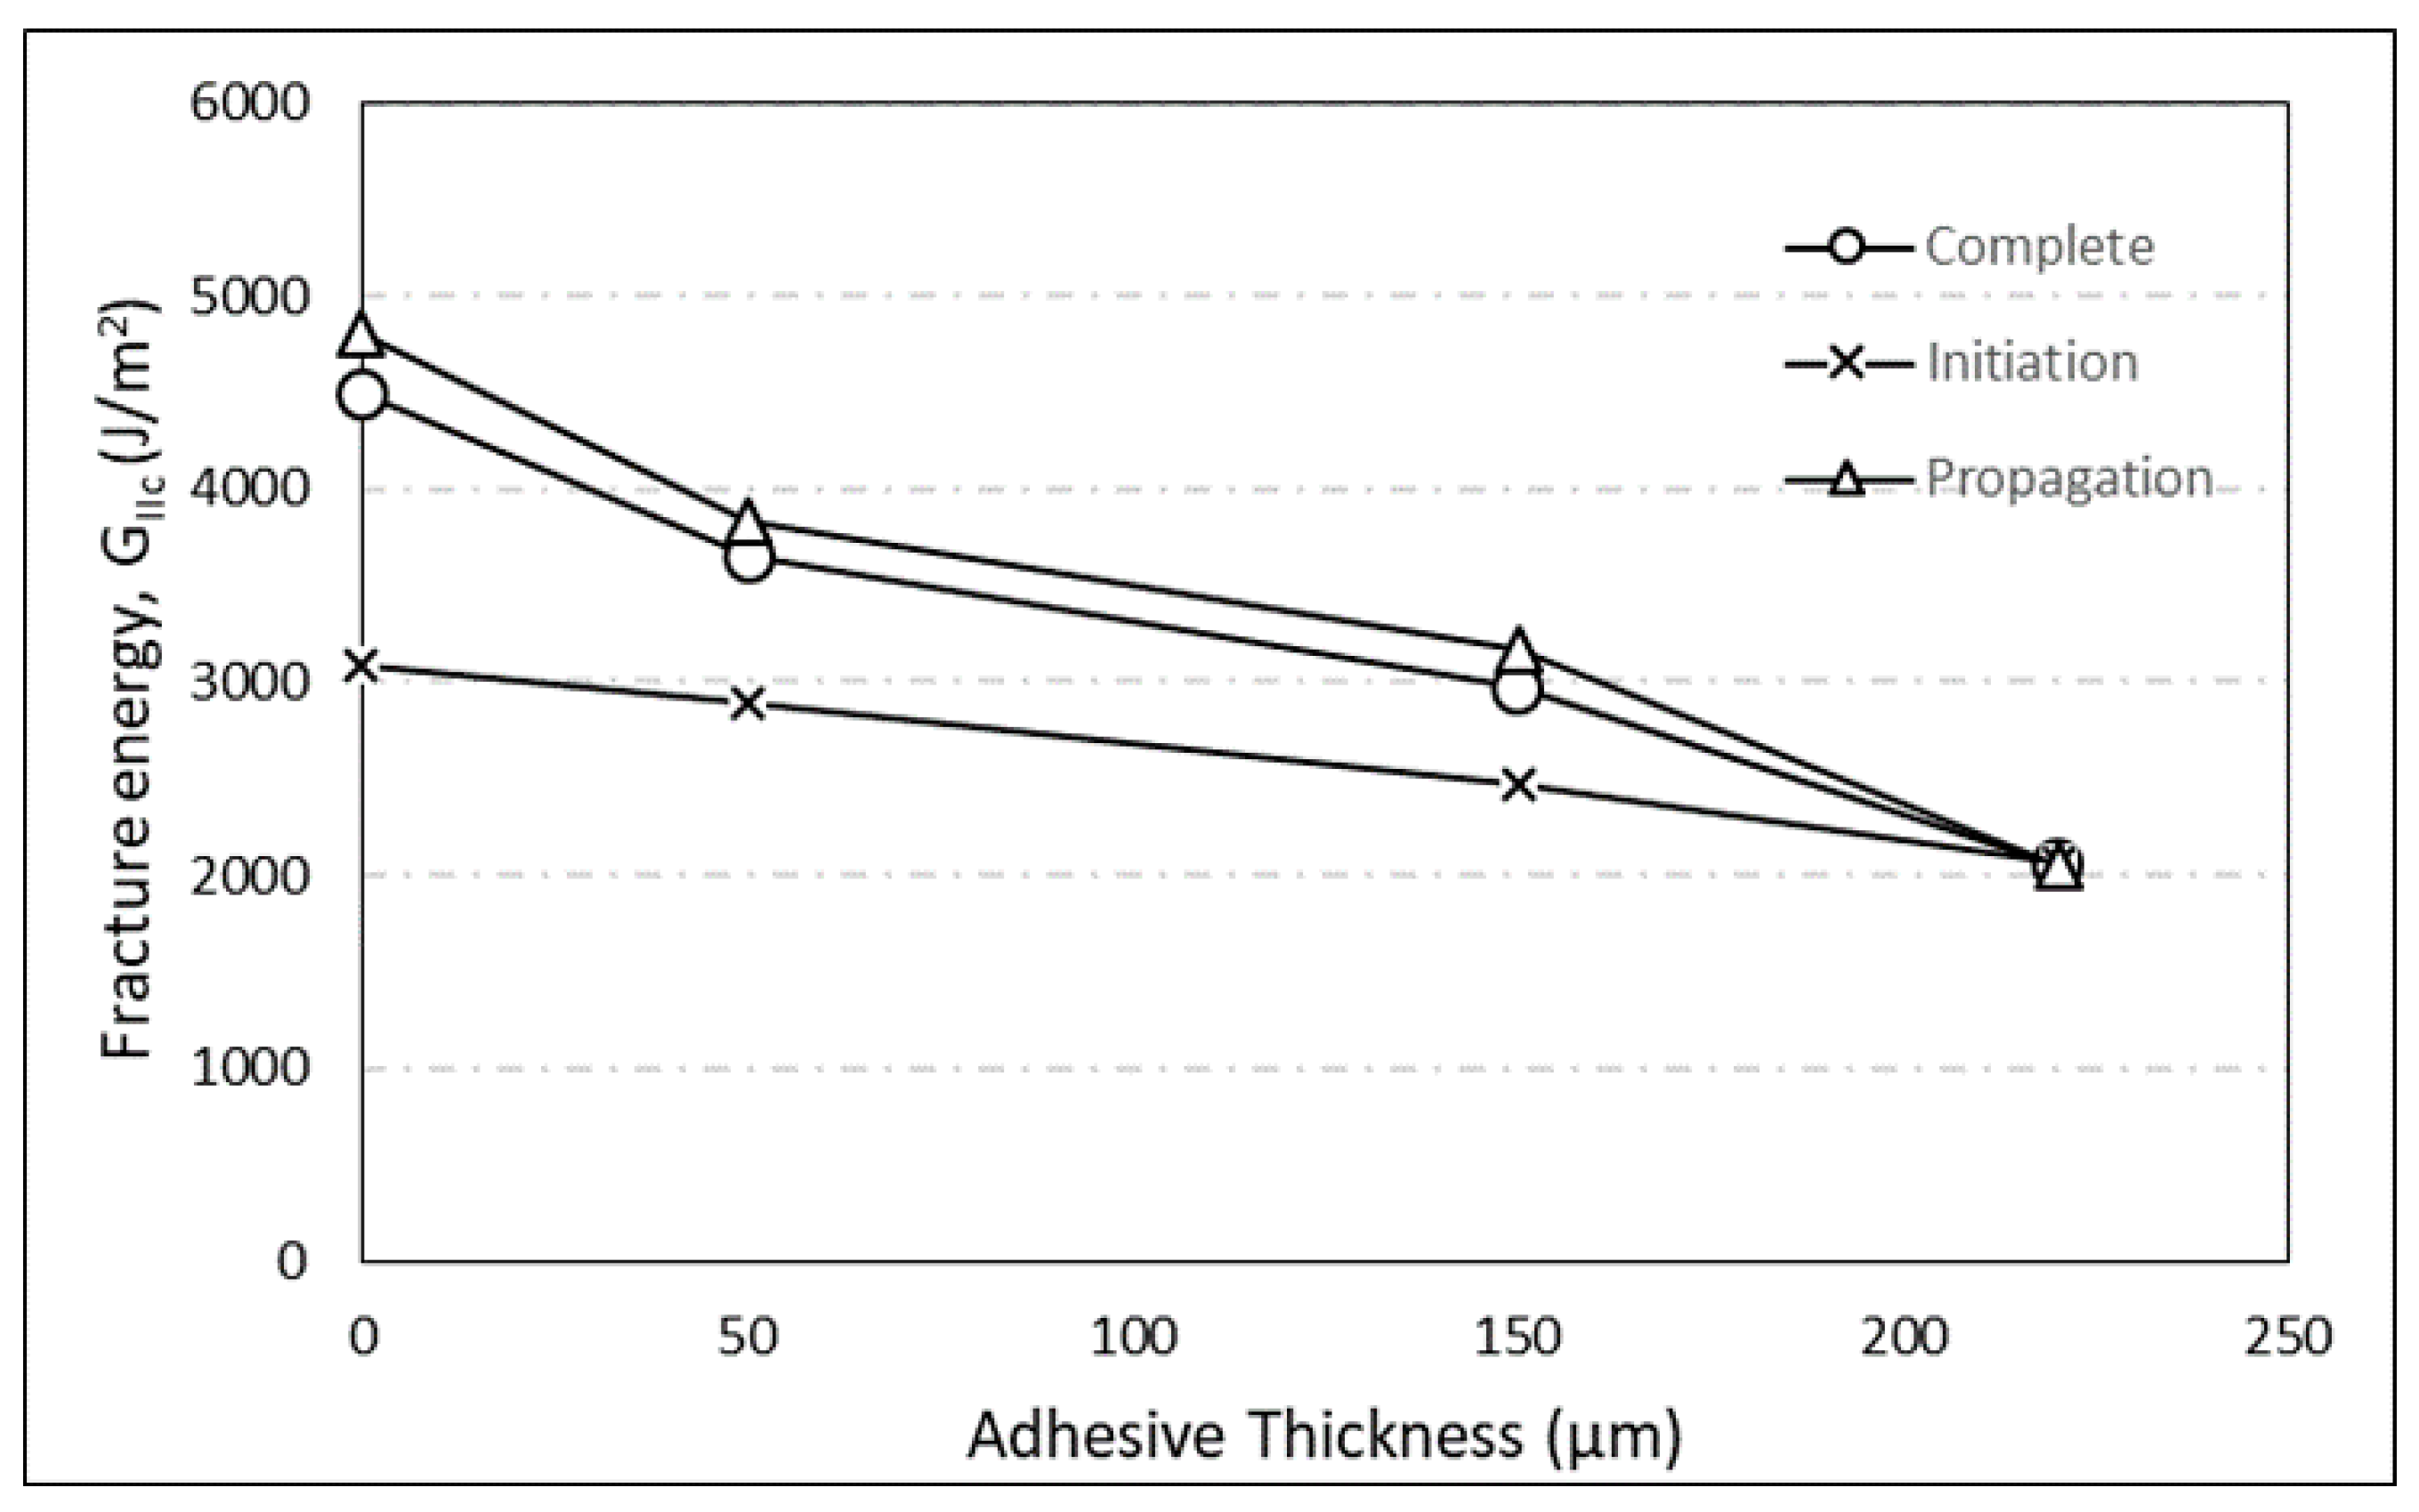
As evident from Figure 18, both the initiation and the propagation fracture energies decreased with the increase in interleaf thickness.
4.3. Mixed Mode Interlaminar Fracture Toughness
Fracture toughness tests of the non-interleaved and interleaved samples in Mixed-Mode I/II were conducted using MMB test specimens. The corresponding results are explained in this section.
4.3.1. Fracture Surface
The fracture surfaces of the MMB test specimen observed under an optical microscope are shown in Figure 19. The direction of the crack propagation and the adhesive layer is clearly marked on the same. Like the DCB and ENF specimens, the MMB samples had also experienced failure in cohesion in the adhesive. The bonding between both the surfaces was found to be proper and the used interleaving film was compatible with the glass/BMI. This failure mode is generally preferred as it ensures complete bonding between the adherends.
4.3.2. Force-Displacement Curve
A graph of the applied load versus crosshead displacement for all the batches of GFRP in Mixed-Mode I/II is plotted in Figure 20. The curves are an average of all the specimens tested in each batch. The plots are smoother than the corresponding Mode II curves but with much more undulations than the Mode I plots. Since the crack tracking with a displacement rate of 2 mm/min was not successful, 1 mm/min was used for all the MMB tests. This rate resulted in stable crack growth which could be easily tracked. Two of the curves, with no interleaving film and with 220 μm interleaving film follow the same trend as the previous two tests. The load value for these two cases increases almost linearly till it reaches the maximum after which it decreases almost linearly as the crack continues to grow. This follows the same stick-slip behavior that was noticed in the previous two tests as well. For the curves with 50 μm interleaving film and with 150 μm interleaving film, this linear behavior was not observed.
Although a displacement rate of 1 mm/min led to steady crack growth, it was difficult to track the crack propagation in regions of slip. Hence some alterations were made to the ASTM standard regarding the intervals at which the crack propagation is tracked. For this Mixed-Mode I/II test, crack propagation data was also recorded at every 5 mm interval from 0 to 50 mm, like the previous two cases.
4.3.3. Fracture Energy Comparison
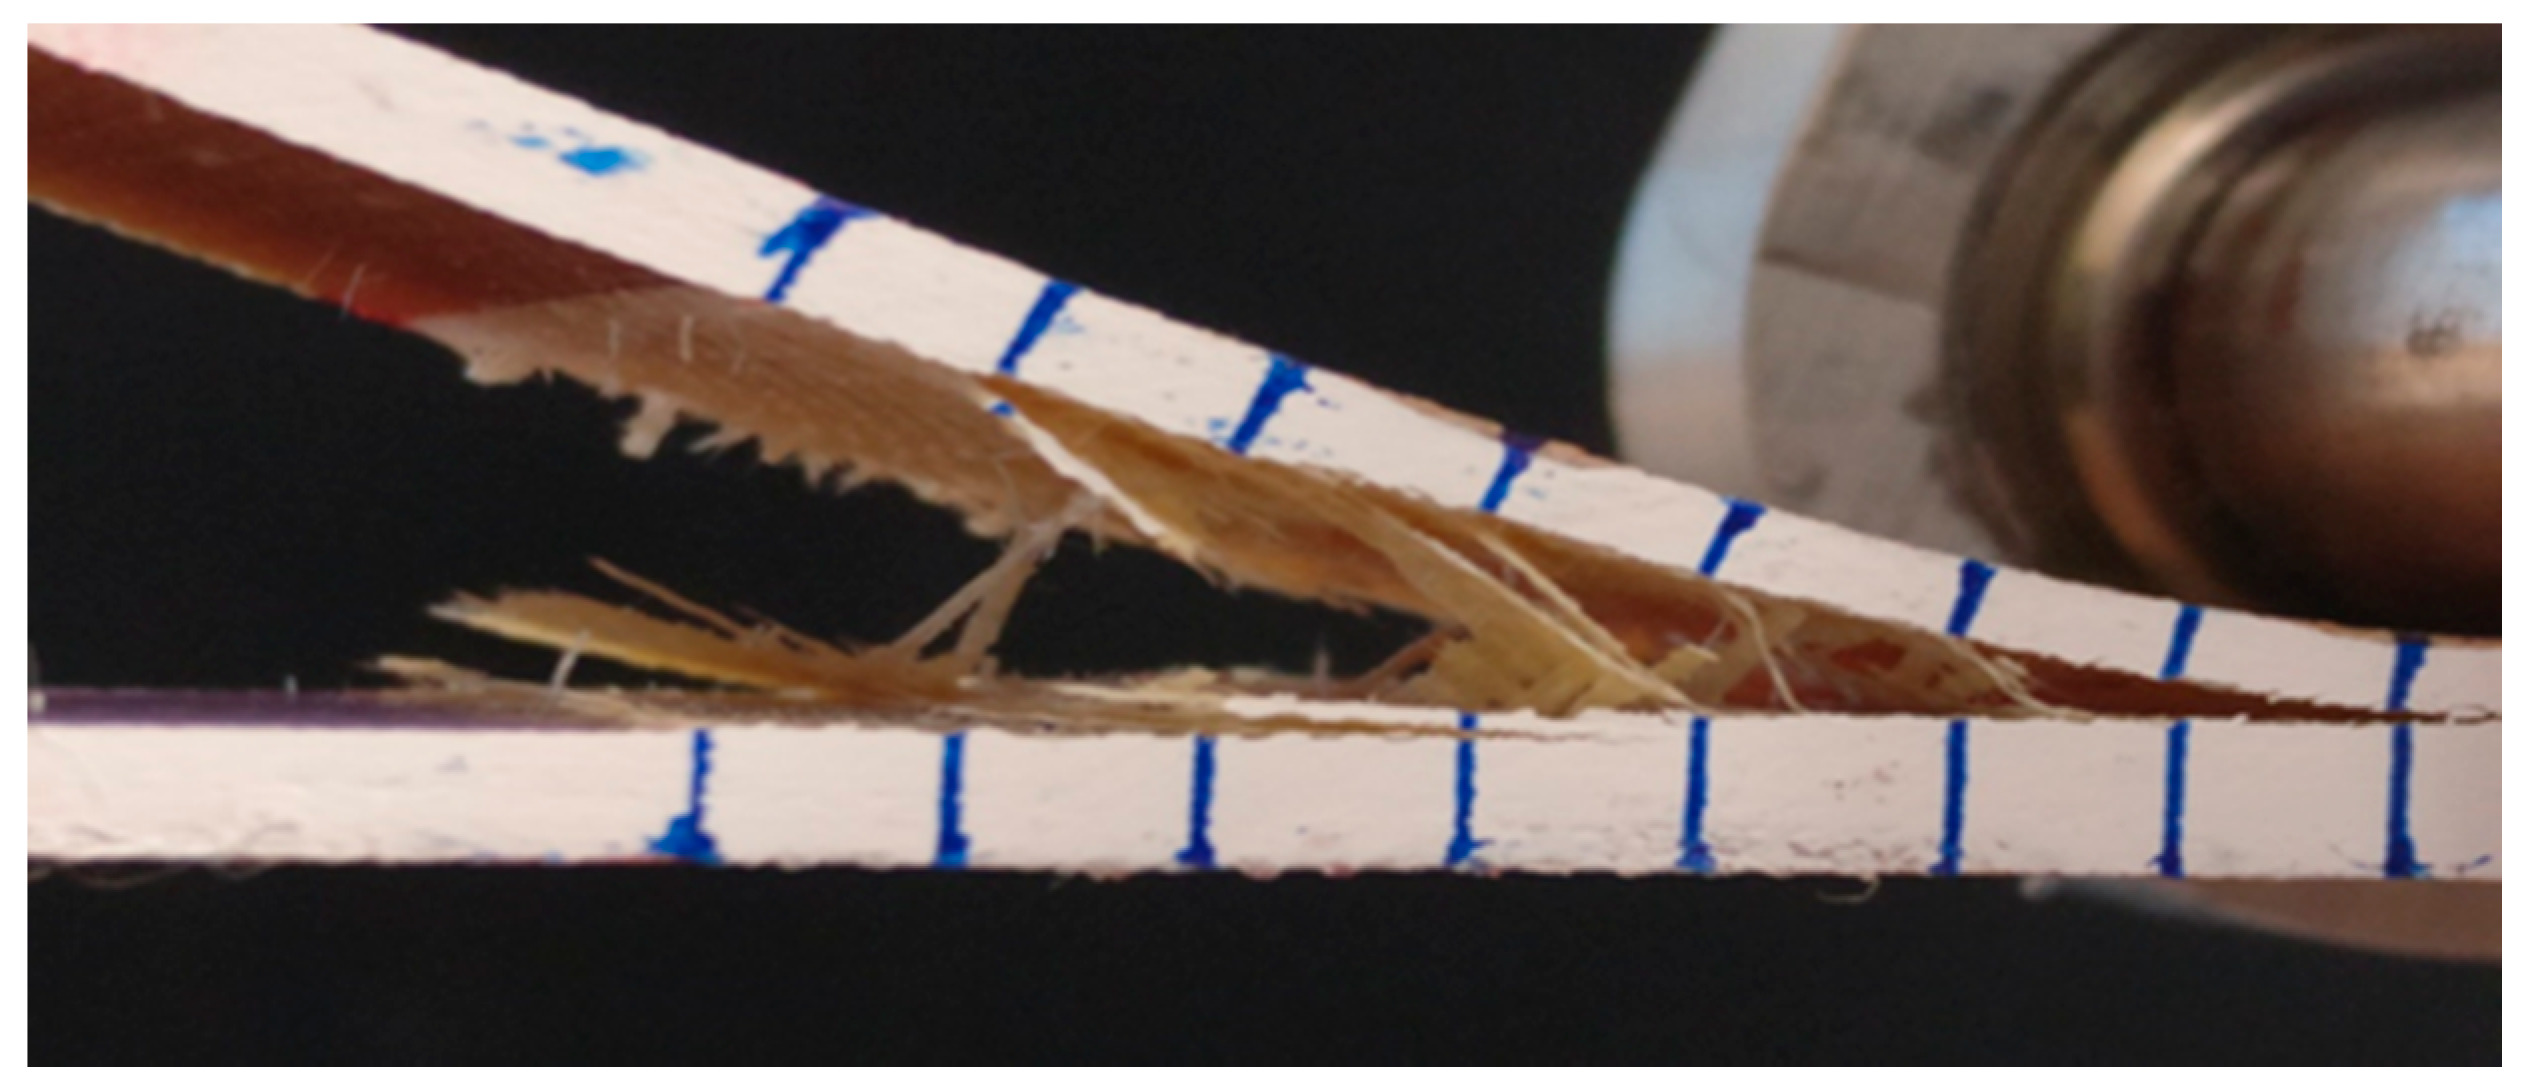
A comparison between the fracture energies of all the batches of GFRP tested in Mixed-Mode I/II is depicted in Figure 21 and the effect of interleaving film thickness on the fracture energy in this mode is tabulated in Table 5. Figure 22 shows plots of both the initiation and propagation fracture energies separately. The fracture energies for delamination growth less than 10 mm and more than 10 mm were averaged to get the initiation and propagation fracture energies respectively. It can be inferred clearly from the plot that the batches with thermoplastic film interleave exhibit higher delamination resistance than the batch without any film. The fracture energy for the first batch is only 527 J/m2 whereas it is 1034 J/m2 for the last batch with 220 μm interleaving film. This amounts to a significant increase of 96% in the fracture energy in Mixed-Mode and hence, the interleaving film increases the fracture toughness of GFRP in Mixed-Mode I/II. This positive influence may be accounted to the fiber filament bridging phenomenon shown in Figure 23 which leads to an increased delamination resistance for the MMB test specimens.
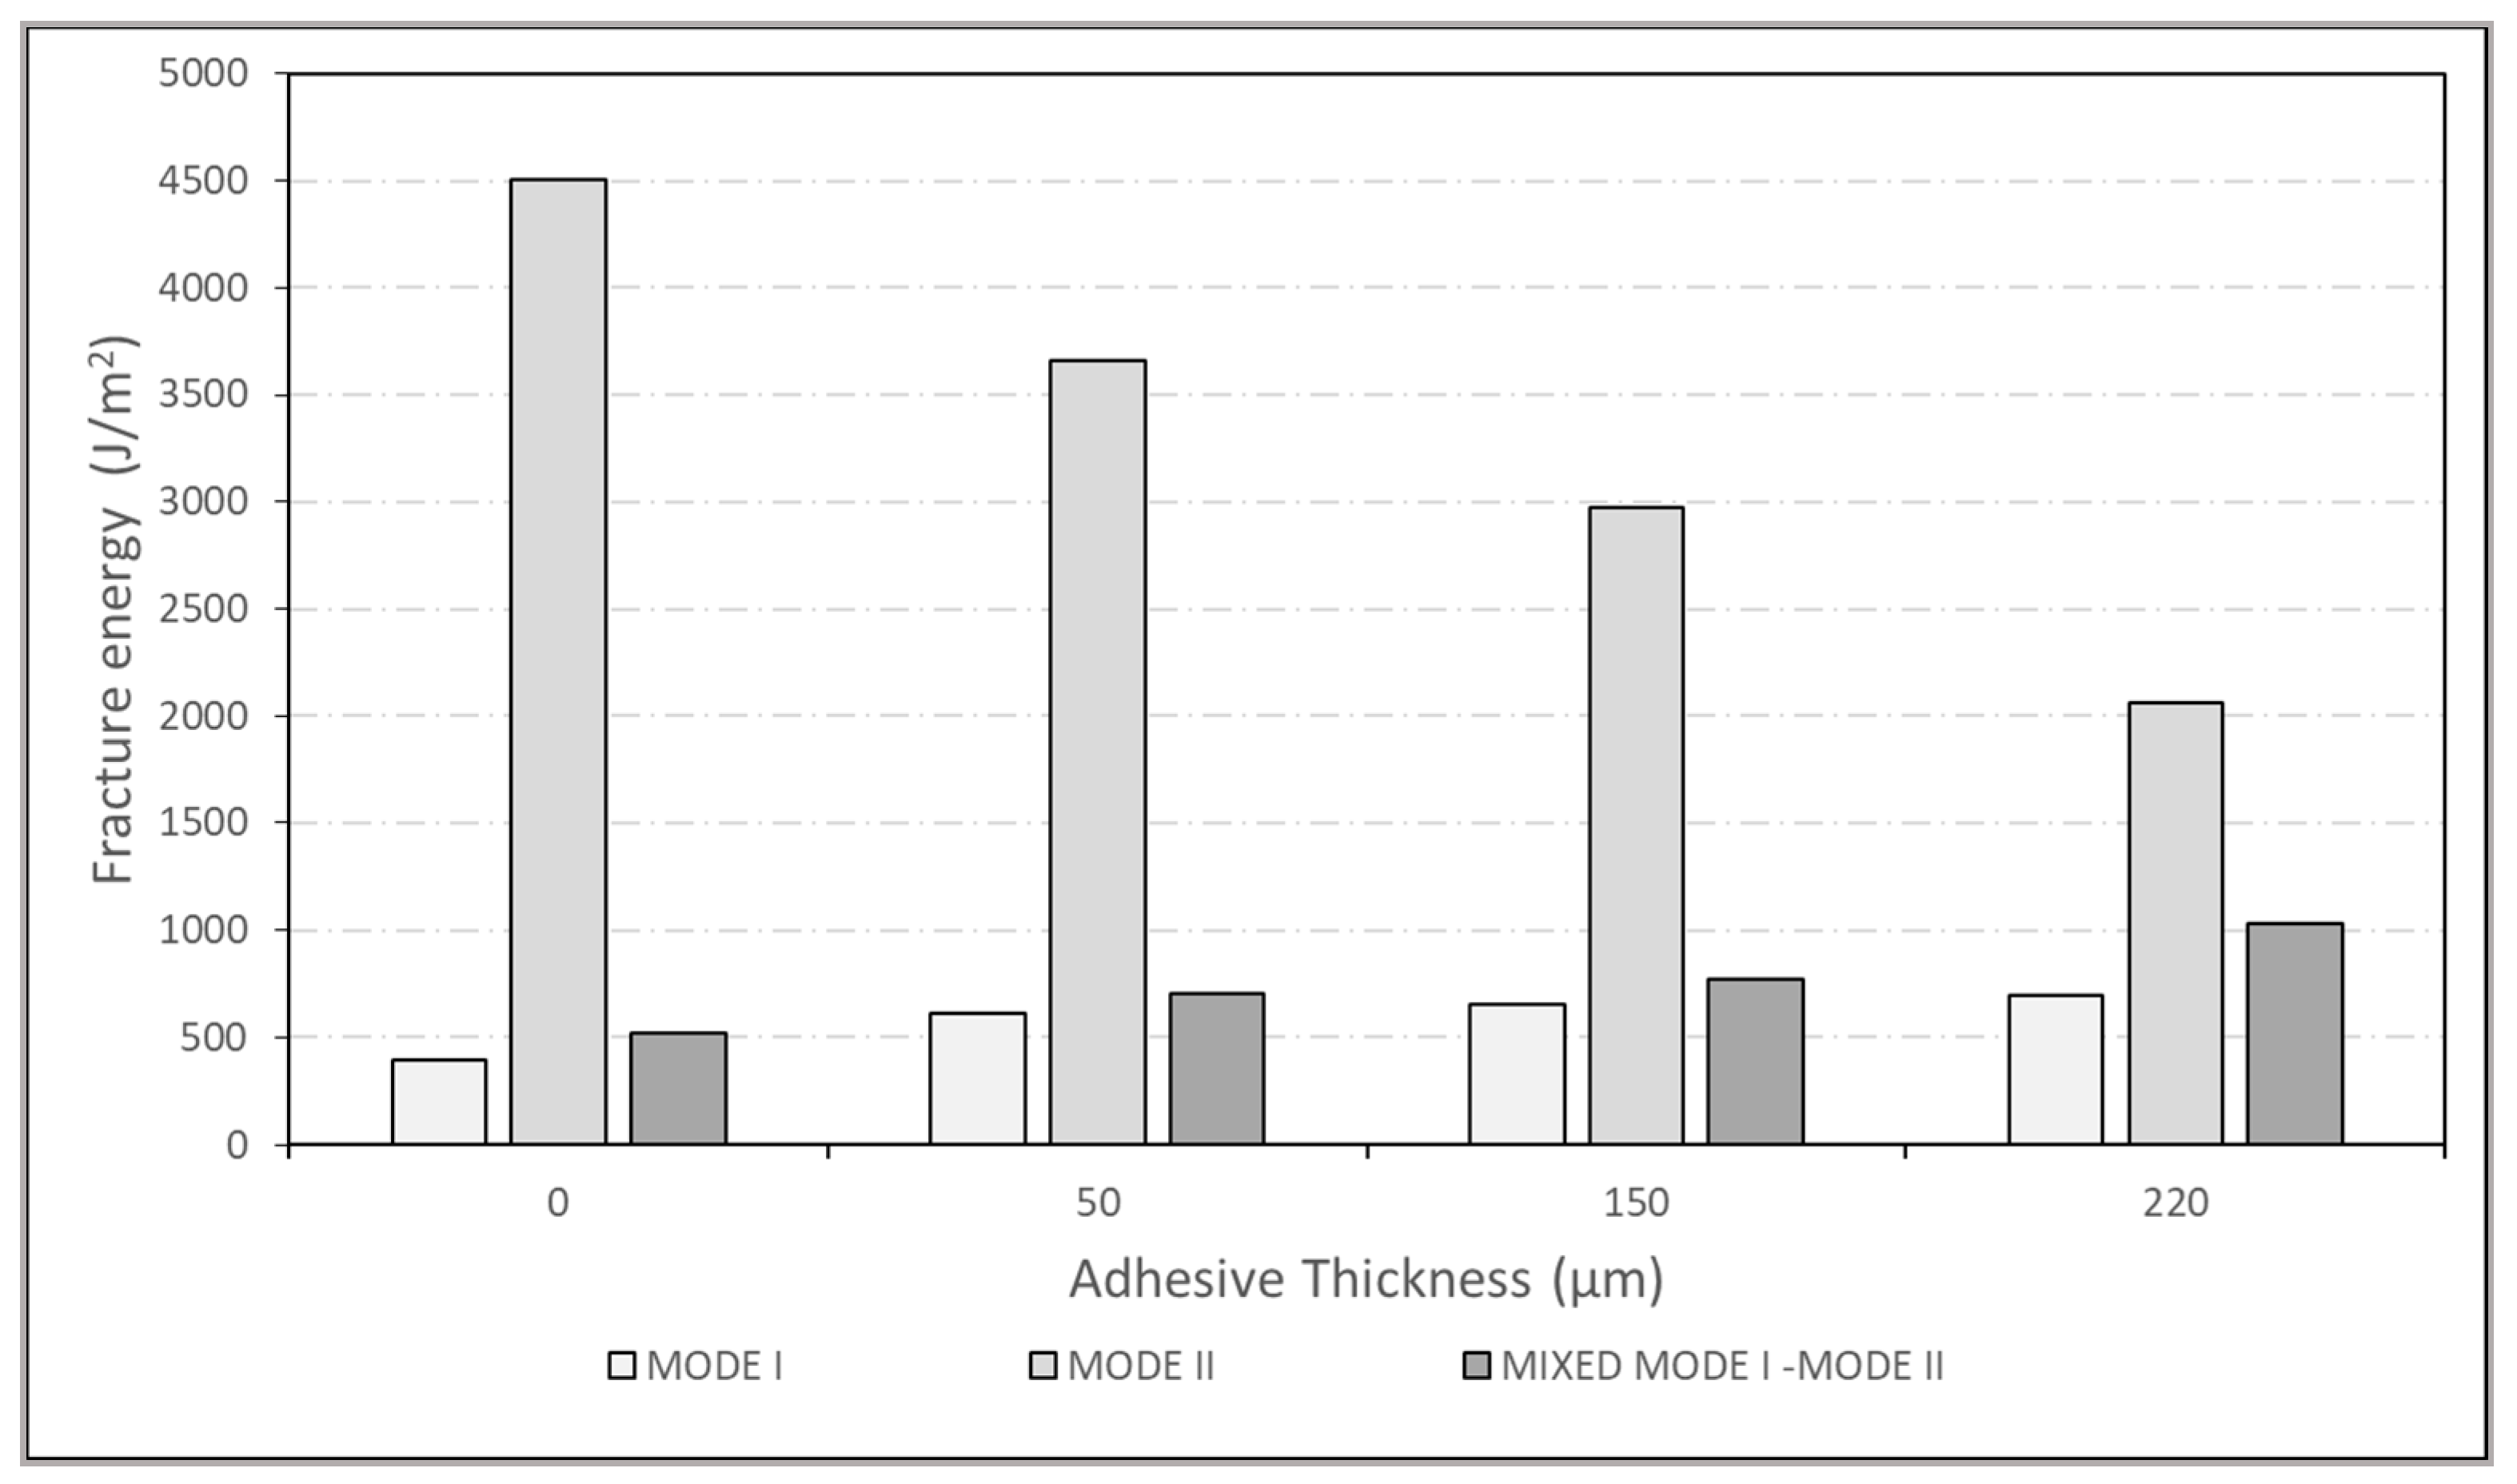
All the results of the fracture toughness tests conducted are combined and depicted clearly in Figure 24. The role of interleaving film thickness on IFT is investigated. The obtained results indicate that the incorporated thermoplastic interleaf has a positive impact on the Mode I as well as Mixed-Mode I/II interlaminar fracture energies. The inclusion of a 50 μm thermoplastic interleaf layer led to an increase in IFT of 56% for Mode I and 34% for Mixed-Mode I/II.
Mode I and Mixed-Mode I/II delamination resistance increased visibly when the film thickness was increased from 0 to 220 μm. The increased delamination resistance transpired directly into the improved Mode I and Mixed-Mode I/II IFT, which improved by 77% and 96% respectively. Mode II IFT was found to be nearly 3–10 times larger than Mode I IFT and 2–8 times higher than the Mixed-Mode IFT, for the interleaving film thickness range investigated in the current study. Unlike Mode I and Mixed-Mode I/II, the crack bridging phenomenon was absent in the sliding mode or Mode II, and the IFT decreased by more than half as the interleaving film thickness was increased from 0 to 220 μm. The smooth nature of the thermoplastic interleave reduces the bonding friction between the adjacent layers and ultimately leads to a reduction in the Mode II IFT.
5. Conclusions
The main conclusions obtained from the current study are mentioned below:
- Accomplished systematically and fine-tuned the thermoplastic film making process such that the EVA films contained no (minimum) defects and porosity. Smooth films having uniform thickness throughout were fabricated.
- It is found that the melting temperature of the thermoplastic film should be slightly less than the curing temperature of the prepreg material. Also, the chemical compatibility between the film and prepreg matrix should be favorable. This was the case in the current studies.
- Interlaminar fracture toughnesses in Mode I, Mode II as well as Mixed-Mode I/II were determined experimentally. The thermoplastic interleaf was found to have a positive impact on Mode I as well as Mixed-Mode I/II interlaminar fracture energy.
- The interleaving method utilized for coupon level study can be directly translated to AFP laminates, either by incorporating one large thermoplastic film in the midplane of the laminate or by adopting selective interleaving at ply interfaces. The latter results in cost, time as well as weight savings and may be carried out after identifying the potential weak zones that are most susceptible to failure. For example, interleaving the film in the midplane is beneficial for tackling bending loads. For tension, symmetrically interleaving the film after few layers is desirable. Adding more films closer to the surface is recommended for impact loads.
- The thermoplastic films used in the present study are very thin viz; 50 μm, 150 μm and 220 μm. Hence, the weight penalty owing to film interleaving was found to be negligibly small.
Author Contributions
Conceptualization, E.M. and S.C.J.; Data curation, E.M.; Formal analysis, E.M.; Funding acquisition, S.C.J.; Investigation, E.M.; Methodology, E.M.; Project administration, E.M. and P.M.; Resources, E.M. and S.C.J.; Software, E.M.; Supervision, S.C.J. and P.M.; Validation, E.M., S.C.J. and P.M.; Visualization, E.M.; Writing—original draft, E.M.; Writing—review and editing, E.M. and S.C.J. All authors have read and agreed to the published version of the manuscript.
Funding
This research received no external funding.
Institutional Review Board Statement
Not applicable.
Informed Consent Statement
Not applicable.
Data Availability Statement
The data presented in this study are available on request from the corresponding author. The data are not publicly available due to Non-Disclosure Agreement (NDA) restrictions.
Conflicts of Interest
The authors declare no conflict of interest.
References
- Kishi, H.; Kuwata, M.; Matsuda, S.; Asami, T.; Murakami, A. Damping properties of thermoplastic-elastomer interleaved carbon fiber-reinforced epoxy composites. Compos. Sci. Technol. 2004, 64, 2517–2523. [Google Scholar] [CrossRef]
- Kim, J.K.; Sham, M.L.; Hamada, H.; Hirai, Y.; Fujihara, K.; Saidpour, H.; Sezen, M.; Dong, Y.J.; Yang, H.S.; Bai, Y.L.; et al. Effect of surface treatment on mode I interlaminar fracture behaviour of plain glass woven fabric composites: Part I. Report of the 2nd round-robin test results. Compos. Interfaces 2000, 7, 227–242. [Google Scholar] [CrossRef]
- Hojo, M.; Ando, T.; Tanaka, M.; Adachi, T.; Ochiai, S.; Endo, Y. Modes I and II interlaminar fracture toughness and fatigue delamination of CF/epoxy laminates with self-same epoxy interleaf. Int. J. Fatigue 2006, 28, 1154–1165. [Google Scholar] [CrossRef]
- Denkena, B.; Schmidt, C.; Weber, P. Automated Fiber Placement Head for Manufacturing of Innovative Aerospace Stiffening Structures. Procedia Manuf. 2016, 6, 96–104. [Google Scholar] [CrossRef] [Green Version]
- Garg, A.C. Delamination—A damage mode in composite structures. Eng. Fract. Mech. 1988, 29, 557–584. [Google Scholar] [CrossRef]
- Xuefeng, A.N.; Shuangying, J.I.; Tang, B.; Zhang, Z.; Yi, X.-S. Toughness improvement of carbon laminates by periodic interleaving thin thermoplastic films. J. Mater. Sci. Lett. 2002, 21, 1763–1765. [Google Scholar] [CrossRef]
- Li, X.; Lei, X.; Ma, H.; Li, H.; Yi, X.-S. Toughness improvement of PMR-type polyimide and laminated graphite systems by ex-situ concept. J. Mater. Sci. 2005, 40, 5067–5070. [Google Scholar]
- Chun, H.W.; Sidhu, K.; Yang, T.; Zhang, J.; Shanks, R. Interlayer self-healing and toughening of carbon fibre/epoxy composites using copolymer films. Compos. Part A 2012, 43, 512–518. [Google Scholar]
- Masters, J.E. Improved impact and delamination resistance through interleafing. Mechanical and corrosion properties. Series A. Key Eng. Mater. 1991, 37, 317. [Google Scholar] [CrossRef]
- Li, L.; Sullivan, P.L.; Liew, K.M. The Influence of Thermoplastic Film Interleaving on the Interlaminar Shear Strength and Mode I Fracture of Laminated Composites. J. Eng. Mater. Technol. 1996, 118, 302–309. [Google Scholar] [CrossRef]
- Cheng, Q.; Fang, Z.; Xu, Y.; Yi, X.-S. Improvement of the Impact Damage Resistance of BMI/Graphite Laminates by the Ex-situ Method. High Perform. Polym. 2006, 18, 907–917. [Google Scholar] [CrossRef]
- ASTM D5528-13. Standard Test Method for Mode I Interlaminar Fracture Toughness of Unidirectional Fiber-Reinforced Polymer Matrix Composites; ASTM International, American Society for Testing and Materials: West Conshohocken, PA, USA, 2013. [Google Scholar]
- ASTM D7905/D7905M-19. Standard Test Method for Determination of the Mode II Interlaminar Fracture Toughness of Unidirectional Fiber-Reinforced Polymer Matrix Composites; ASTM International, American Society for Testing and Materials: West Conshohocken, PA, USA, 2019. [Google Scholar]
- ASTM D6671/D6671M-19. Standard Test Method for Mixed Mode I-Mode II Interlaminar Fracture Toughness of Unidirectional Fiber Reinforced Polymer Matrix Composites; ASTM International, American Society for Testing and Materials: West Conshohocken, PA, USA, 2019. [Google Scholar]
- Guozheng, L.; Zhang, Z.; Yang, J.; Wang, X. BMI Based Composites With Low Dielectric Loss. Polym. Bull. 2007, 59, 269–278. [Google Scholar]
- Jiang, W.; Tjong, S.C.; Chu, P.K.; Li, R.K.Y.; Kim, J.K.; Mai, Y.W. Interlaminar Fracture Properties of Carbon Fibre/Epoxy Matrix Composites Interleaved with Polyethylene Terephthalate (Pet) Films. Polym. Polym. Compos. 2001, 9, 141–145. [Google Scholar] [CrossRef]
- Kou, C.-H.; Xu, L.Y. Effect of the Interfacial Interleaf to the Interlaminar Fracture and Intralaminar Fracture of a New BMI Matrix Composites System. J. Reinf. Plast. Compos. 1994, 13, 509. [Google Scholar]
- Sela, N.; Ishai, O. Interlaminar fracture toughness and toughening of laminated composite materials: A review. Composites 1989, 20, 423–435. [Google Scholar] [CrossRef]
- Tanimoto, T. Suppression of interlaminar damage in carbon/epoxy laminates by use of interleaf layers. Scr. Met. Mater. 1994, 31, 1073–1078. [Google Scholar] [CrossRef]
- Feng, G.; Jiao, G.; Lu, Z.; Ning, R. Mode II Delamination and Damage Resistance of Carbon/Epoxy Composite Laminates Interleaved with Thermoplastic Particles. J. Compos. Mater. 2007, 41, 111. [Google Scholar]
- Boyd, S.E.; Bogetti, T.A.; Staniszewski, J.M.; Lawrence, B.D.; Walter, M.S. Enhanced delamination resistance of thick-section glass-epoxy composite laminates using compliant thermoplastic polyurethane interlayers. Compos. Struct. 2018, 189, 184–191. [Google Scholar] [CrossRef]
- Mohan, C.C.; Harini, K.; Karthikeyan, S.; Sudharsan, K.; Sukumar, M. Effect of film constituents and different processing conditions on the properties of starch based thermoplastic films. Int. J. Biol. Macromol. 2018, 120 Pt B, 2007–2016. [Google Scholar] [CrossRef]
- Daelemans, L.; Van Der Heijden, S.; De Baere, I.; Rahier, H.; Van Paepegem, W.; De Clerck, K. Improved fatigue delamination behaviour of composite laminates with electrospun thermoplastic nanofibrous interleaves using the Central Cut-Ply method. Compos. Part A Appl. Sci. Manuf. 2017, 94, 10–20. [Google Scholar] [CrossRef]
- Del Saz-Orozco, B.; Ray, D.; Stanley, W.F. Effect of thermoplastic veils on interlaminar fracture toughness of a glass fiber/vinyl ester composite. Polym. Compos. 2017, 38, 2501–2508. [Google Scholar] [CrossRef]
- Guo, M.; Liu, L. Structuring the thermoplastic interleaf with lotus-leaf-like structure and its interlaminar toughening for CFRPs. Compos. Sci. Technol. 2019, 183, 107825. [Google Scholar] [CrossRef]
- Gürakin, H.K.; Turan, A.C.; Deligöz, H. Synthesis of a novel polyester-ether copolymer and its derivatives as antistatic additives for thermoplastic films. Polym. Test. 2020, 81, 106214. [Google Scholar] [CrossRef]
- Li, W.; Xiang, D.; Wang, L.; Harkin-Jones, E.; Zhao, C.; Wang, B.; Yuntao, L. Simultaneous enhancement of electrical conductivity and interlaminar fracture toughness of carbon fiber/epoxy composites using plasma-treated conductive thermoplastic film interleaves. RSC Adv. 2018, 8, 26910–26921. [Google Scholar] [CrossRef] [Green Version]
- Liu, Y.; Li, X.; Wang, W.; Sun, Y.; Wang, H. Decorated wood fiber/high density polyethylene composites with thermoplastic film as adhesives. Int. J. Adhes. Adhes. 2019, 95, 102391. [Google Scholar] [CrossRef]
- Matsumoto, K.; Ishikawa, T.; Tanaka, T. A novel joining method by using carbon nanotube-based thermoplastic film for injection over-molding process. J. Reinf. Plast. Compos. 2019, 38, 616–627. [Google Scholar] [CrossRef]
- Niazi, M.B.K.; Broekhuis, A.A. Oxidized potato starch based thermoplastic films: Effect of combination of hydrophilic and amphiphilic plasticizers: Plasticized thermoplastic starch films. Starch-Stärke 2016, 68, 785–795. [Google Scholar] [CrossRef]
- Wong, D.W.; Zhang, H.; Bilotti, E.; Peijs, T. Interlaminar toughening of woven fabric carbon/epoxy composite laminates using hybrid aramid/phenoxy interleaves. Compos. Part A Appl. Sci. Manuf. 2017, 101, 151–159. [Google Scholar] [CrossRef]
- Yasaee, M.; Killock, C.; Hartley, J.; Bond, I.P. Control of Compressive Fatigue Delamination Propagation of Impact Damaged Composites Using Discrete Thermoplastic Interleaves. Appl. Compos. Mater. 2014, 22, 559–572. [Google Scholar] [CrossRef] [Green Version]
- Zhang, H.; Bharti, A.; Li, Z.; Du, S.; Bilotti, E.; Peijs, T. Localized toughening of carbon/epoxy laminates using dissolvable thermoplastic interleaves and electrospun fibres. Compos. Part A Appl. Sci. Manuf. 2015, 79, 116–126. [Google Scholar] [CrossRef]
- Zhang, H.; Liu, Y.; Huang, M.; Bilotti, E.; Peijs, T. Dissolvable thermoplastic interleaves for carbon nanotube localization in carbon/epoxy laminates with integrated damage sensing capabilities. Struct. Health Monit. 2016, 17, 59–66. [Google Scholar] [CrossRef]
- Blackman, B.; Dear, J.P.; Kinloch, A.J.; Osiyemi, S. The calculation of adhesive fracture energies from double-cantilever beam test specimens. J. Mater. Sci. Lett. 1991, 10, 253–256. [Google Scholar] [CrossRef]
Figure 1.
Thermoplastic film manufacturing schematic.

Figure 2.
(a) Thermoplastic pellets; (b) Pellets being compressed in a hot press; (c) Fabricated thermoplastic film.
Figure 2.
(a) Thermoplastic pellets; (b) Pellets being compressed in a hot press; (c) Fabricated thermoplastic film.

Figure 3.
GFRP laminate manufacturing schematic.

Figure 4.
Schematic of DCB specimen.

Figure 5.
DCB specimen under test.

Figure 6.
Schematic of ENF specimen.

Figure 7.
ENF specimen under test.

Figure 8.
MMB specimen under test.

Figure 9.
Schematic of MMB specimen.

Figure 10.
Optical microscopic images of Mode I specimen (a) Bottom surface; (b) Top surface.

Figure 11.
Force-Displacement plots for Mode I tests.

Figure 12.
Crack bridging during DCB test in Mode I.

Figure 13.
Variation of fracture energy with interleaving film thickness in Mode I.

Figure 14.
Mode I fracture energy variation with thin film thickness.

Figure 15.
Optical microscopic images of Mode II specimen (a) Bottom surface; (b) Top surface.

Figure 16.
Force-Displacement comparison of different batches of GFRP in Mode II.

Figure 17.
Variation of fracture energy with interleaving film thickness in Mode II.

Figure 18.
Mode II fracture energy variation with thin film thickness.

Figure 19.
Optical microscopic images of Mixed-Mode I/II specimen (a) Bottom surface; (b) Top surface.
Figure 19.
Optical microscopic images of Mixed-Mode I/II specimen (a) Bottom surface; (b) Top surface.

Figure 20.
Force-Displacement comparison of different batches of GFRP in Mixed Mode I/II.

Figure 21.
Variation of fracture energy with the interleaving film thickness in Mixed-Mode I/II.

Figure 22.
Mixed Mode I/II fracture energy variation with thin film thickness.

Figure 23.
Fiber filament bridging during MMB test in Mixed Mode I/II.

Figure 24.
Final interlaminar fracture energy comparison of all batches of GFRP in different modes.


Table 1.
Thermoplastic film fabrication parameters.
| Thickness of Thermoplastic Film (μm) | Weight of Pellets (g) | Aerial Weight (g/m2) 1 | Applied Platen Pressure (MPa) | Applied Platen Temperature (°C) |
|---|---|---|---|---|
| 50 | 10.5 | 48 | 13.5 | 170 |
| 150 | 10 | 144 | 2.125 | 170 |
| 220 | 10 | 211.2 | 0.425 | 170 |
1 Based on a density of 960 kg/m3.
Table 2.
Specimen nomenclature based on the interleaf film thickness.
| Sr. No. | Interleaf Film Thickness (μm) | Number of Specimens | Total | ||
|---|---|---|---|---|---|
| Mode I | Mode II | Mixed Mode I/II | |||
| 1 | 0 | 5 (DCB000) | 5 (ENF000) | 5 (MMB000) | 15 |
| 2 | 50 | 5 (DCB050) | 5 (ENF050) | 5 (MMB050) | 15 |
| 3 | 150 | 5 (DCB150) | 5 (ENF150) | 5 (MMB150) | 15 |
| 4 | 220 | 5 (DCB220) | 5 (ENF220) | 5 (MMB220) | 15 |
| 60 | |||||
Table 3.
Effect of interleaving film thickness on the fracture energy in Mode I.
| Adhesive Thickness (μm) | Fracture Energy, GIc (J/m2) | Change in Fracture Energy (%) | Coefficient of Variation (%) |
|---|---|---|---|
| 0 | 392 ± 26 | - | 6.6 |
| 50 | 610 ± 44 | 55.6 (+) | 7.2 |
| 150 | 658 ± 59 | 67.8 (+) | 8.9 |
| 220 | 693 ± 79 | 76.7 (+) | 11.4 |
Table 4.
Effect of interleaving film thickness on the fracture energy in Mode II.
| Adhesive Thickness (μm) | Fracture Energy, GIIc (J/m2) | Change in Fracture Energy (%) | Coefficient of Variation (%) |
|---|---|---|---|
| 0 | 4502 ± 353 | - | 7.8 |
| 50 | 3663 ± 277 | 18.6 (−) | 7.6 |
| 150 | 2973 ± 131 | 33.9 (−) | 4.4 |
| 220 | 2058 ± 77 | 54.3 (−) | 3.7 |
Table 5.
Effect of interleaving film thickness on the fracture energy in Mixed-Mode I/II.
| Adhesive Thickness (μm) | Fracture Energy, GC (J/m2) | Change in Fracture Energy (%) | Coefficient of Variation (%) |
|---|---|---|---|
| 0 | 527 ± 35 | - | 6.6 |
| 50 | 706 ± 41 | 33.9 (+) | 5.8 |
| 150 | 775 ± 18 | 47.1 (+) | 2.3 |
| 220 | 1034 ± 40 | 96.2 (+) | 3.8 |
Publisher’s Note: MDPI stays neutral with regard to jurisdictional claims in published maps and institutional affiliations. |
© 2021 by the authors. Licensee MDPI, Basel, Switzerland. This article is an open access article distributed under the terms and conditions of the Creative Commons Attribution (CC BY) license (http://creativecommons.org/licenses/by/4.0/).
Share and Cite
MDPI and ACS Style
Mathew, E.; Joshi, S.C.; Manikandan, P. Enhancement in Interply Toughness of BMI Composites Using Micro-Thin Films. J. Compos. Sci. 2021, 5, 49. https://0-doi-org.brum.beds.ac.uk/10.3390/jcs5020049
AMA Style
Mathew E, Joshi SC, Manikandan P. Enhancement in Interply Toughness of BMI Composites Using Micro-Thin Films. Journal of Composites Science. 2021; 5(2):49. https://0-doi-org.brum.beds.ac.uk/10.3390/jcs5020049
Chicago/Turabian StyleMathew, Eldho, Sunil Chandrakant Joshi, and Periyasamy Manikandan. 2021. "Enhancement in Interply Toughness of BMI Composites Using Micro-Thin Films" Journal of Composites Science 5, no. 2: 49. https://0-doi-org.brum.beds.ac.uk/10.3390/jcs5020049