
Mechanical and Microstructural Assessment of Inhomogeneities in Oxide Ceramic Matrix Composites Detected by Air-Coupled Ultrasound Inspection


Abstract
:1. Introduction
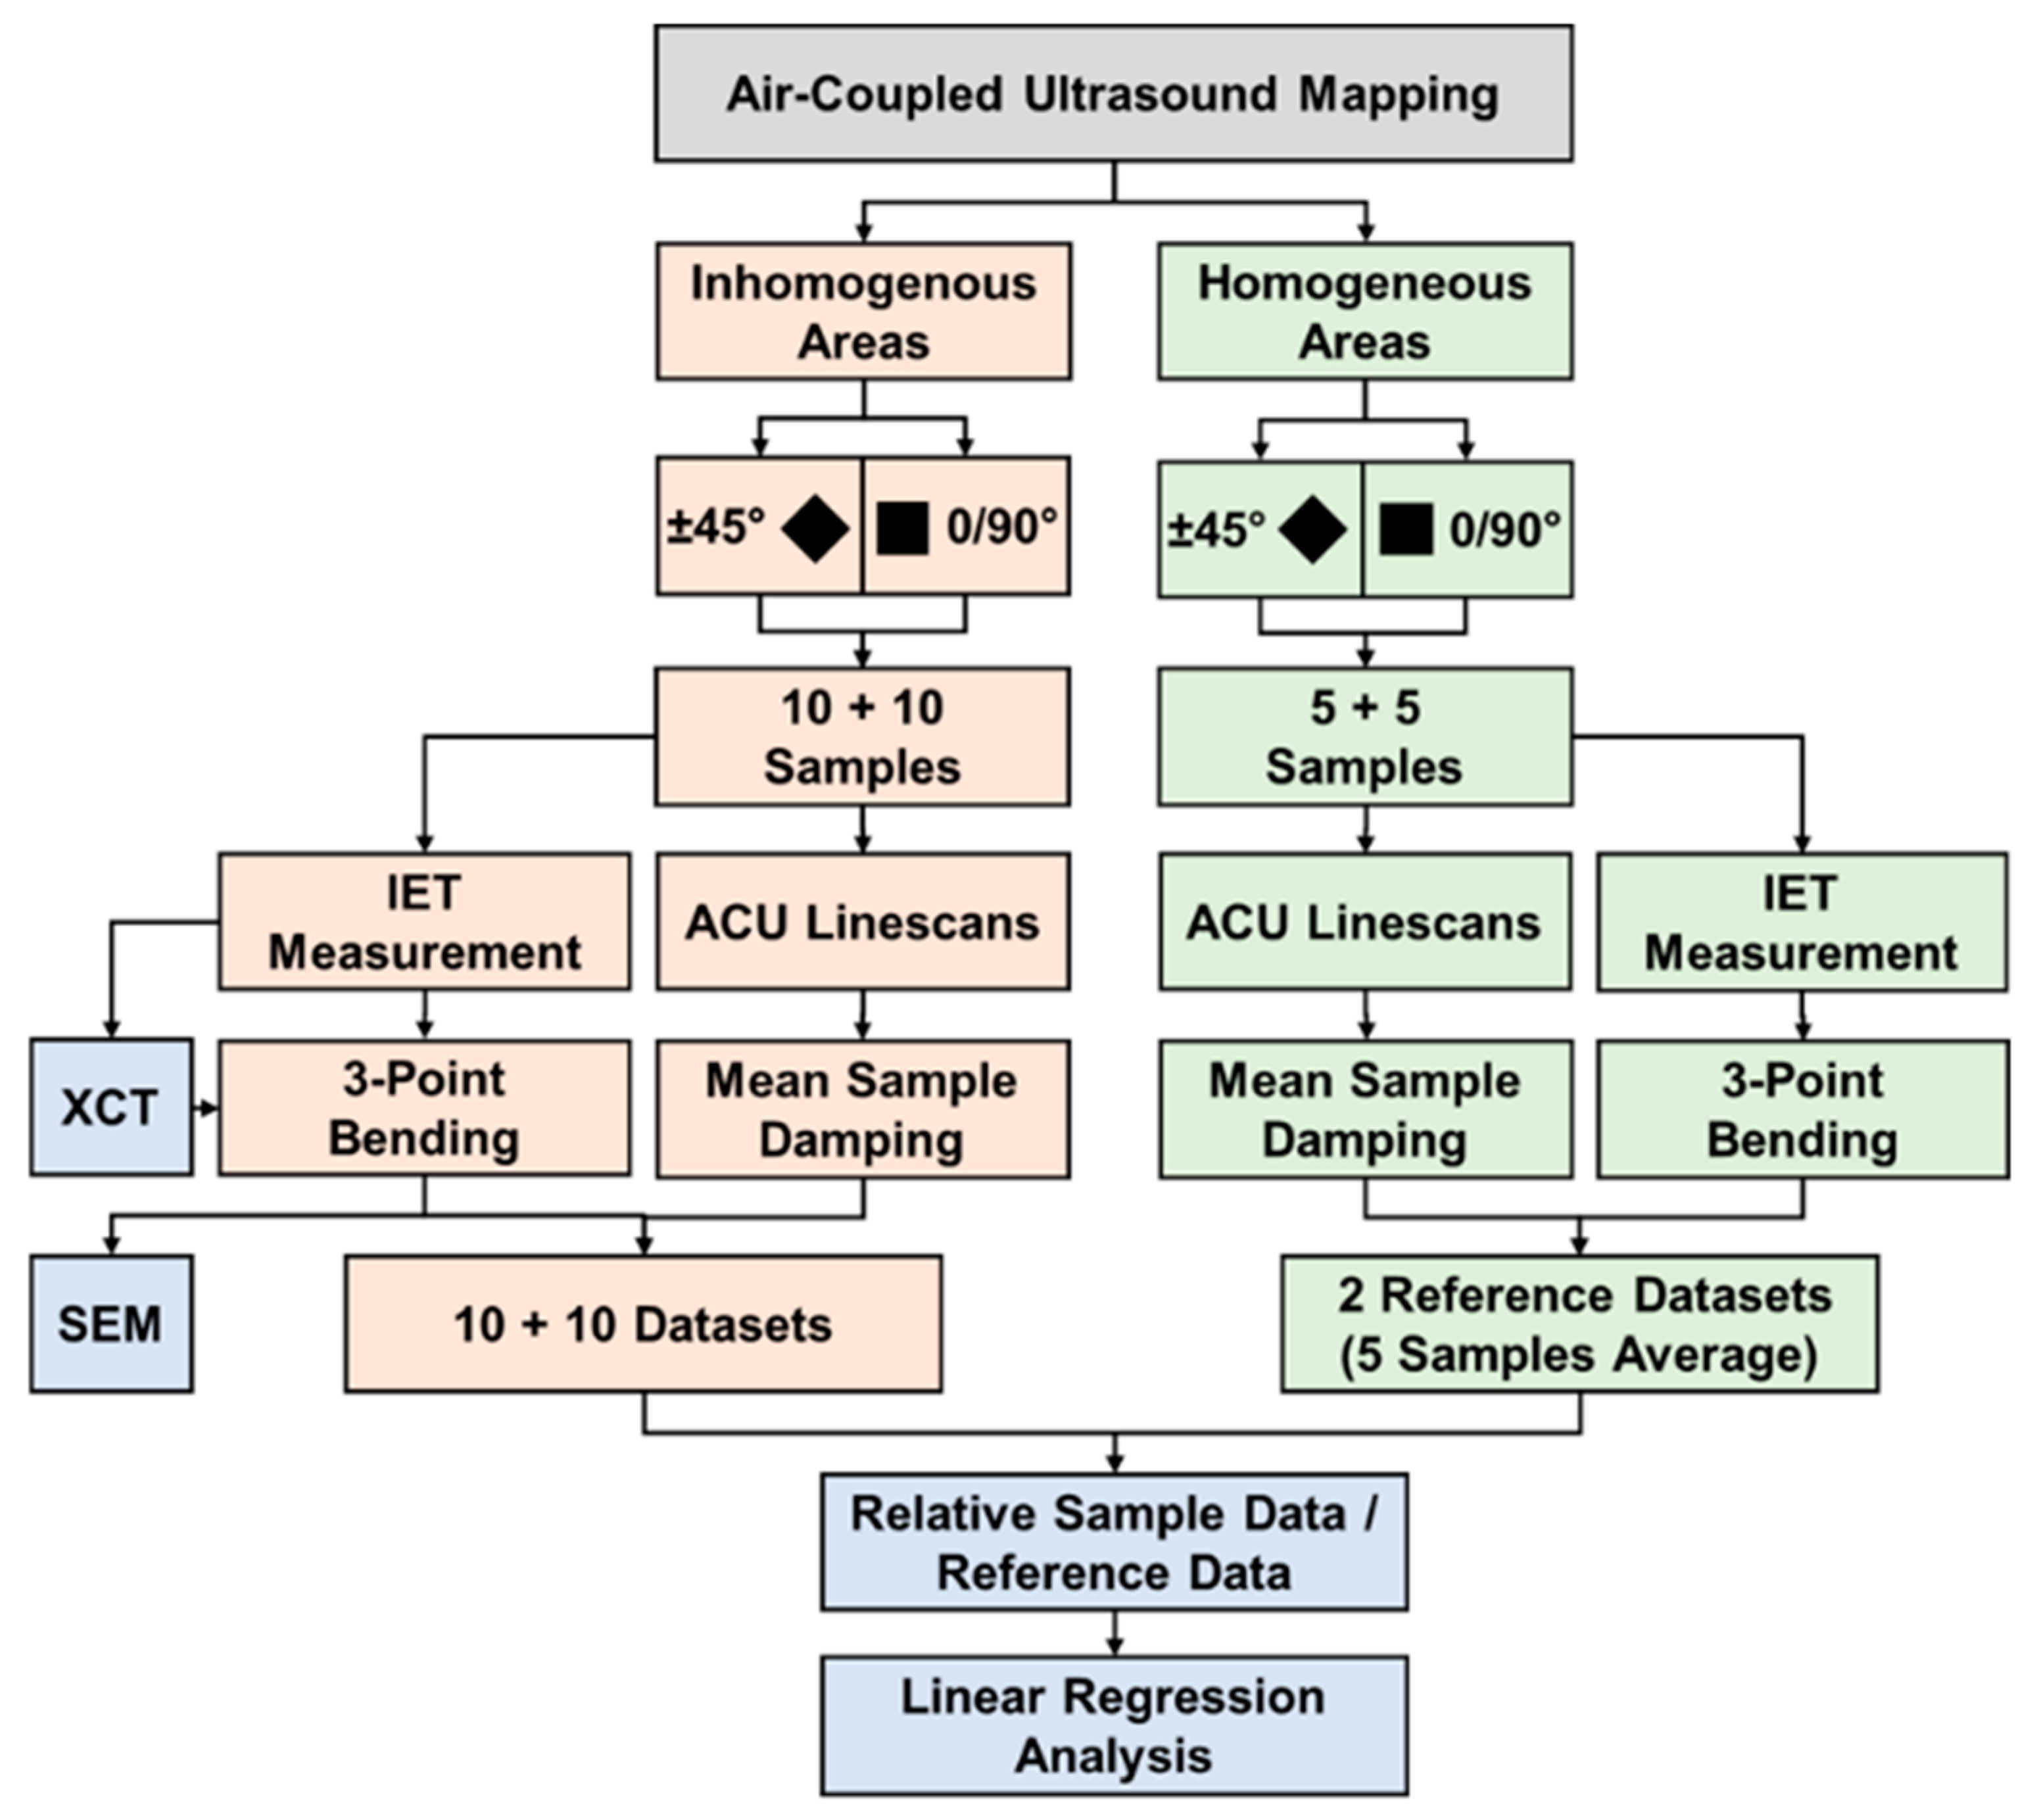
2. Methodology
2.1. Material
2.2. Air-Coupled Ultrasound Inspection (ACU)
2.3. Resonant Frequency Damping Analysis (RFDA)
2.4. X-ray Computed Tomography
2.5. Mechanical and Microstructural Analysis
3. Results and Discussion
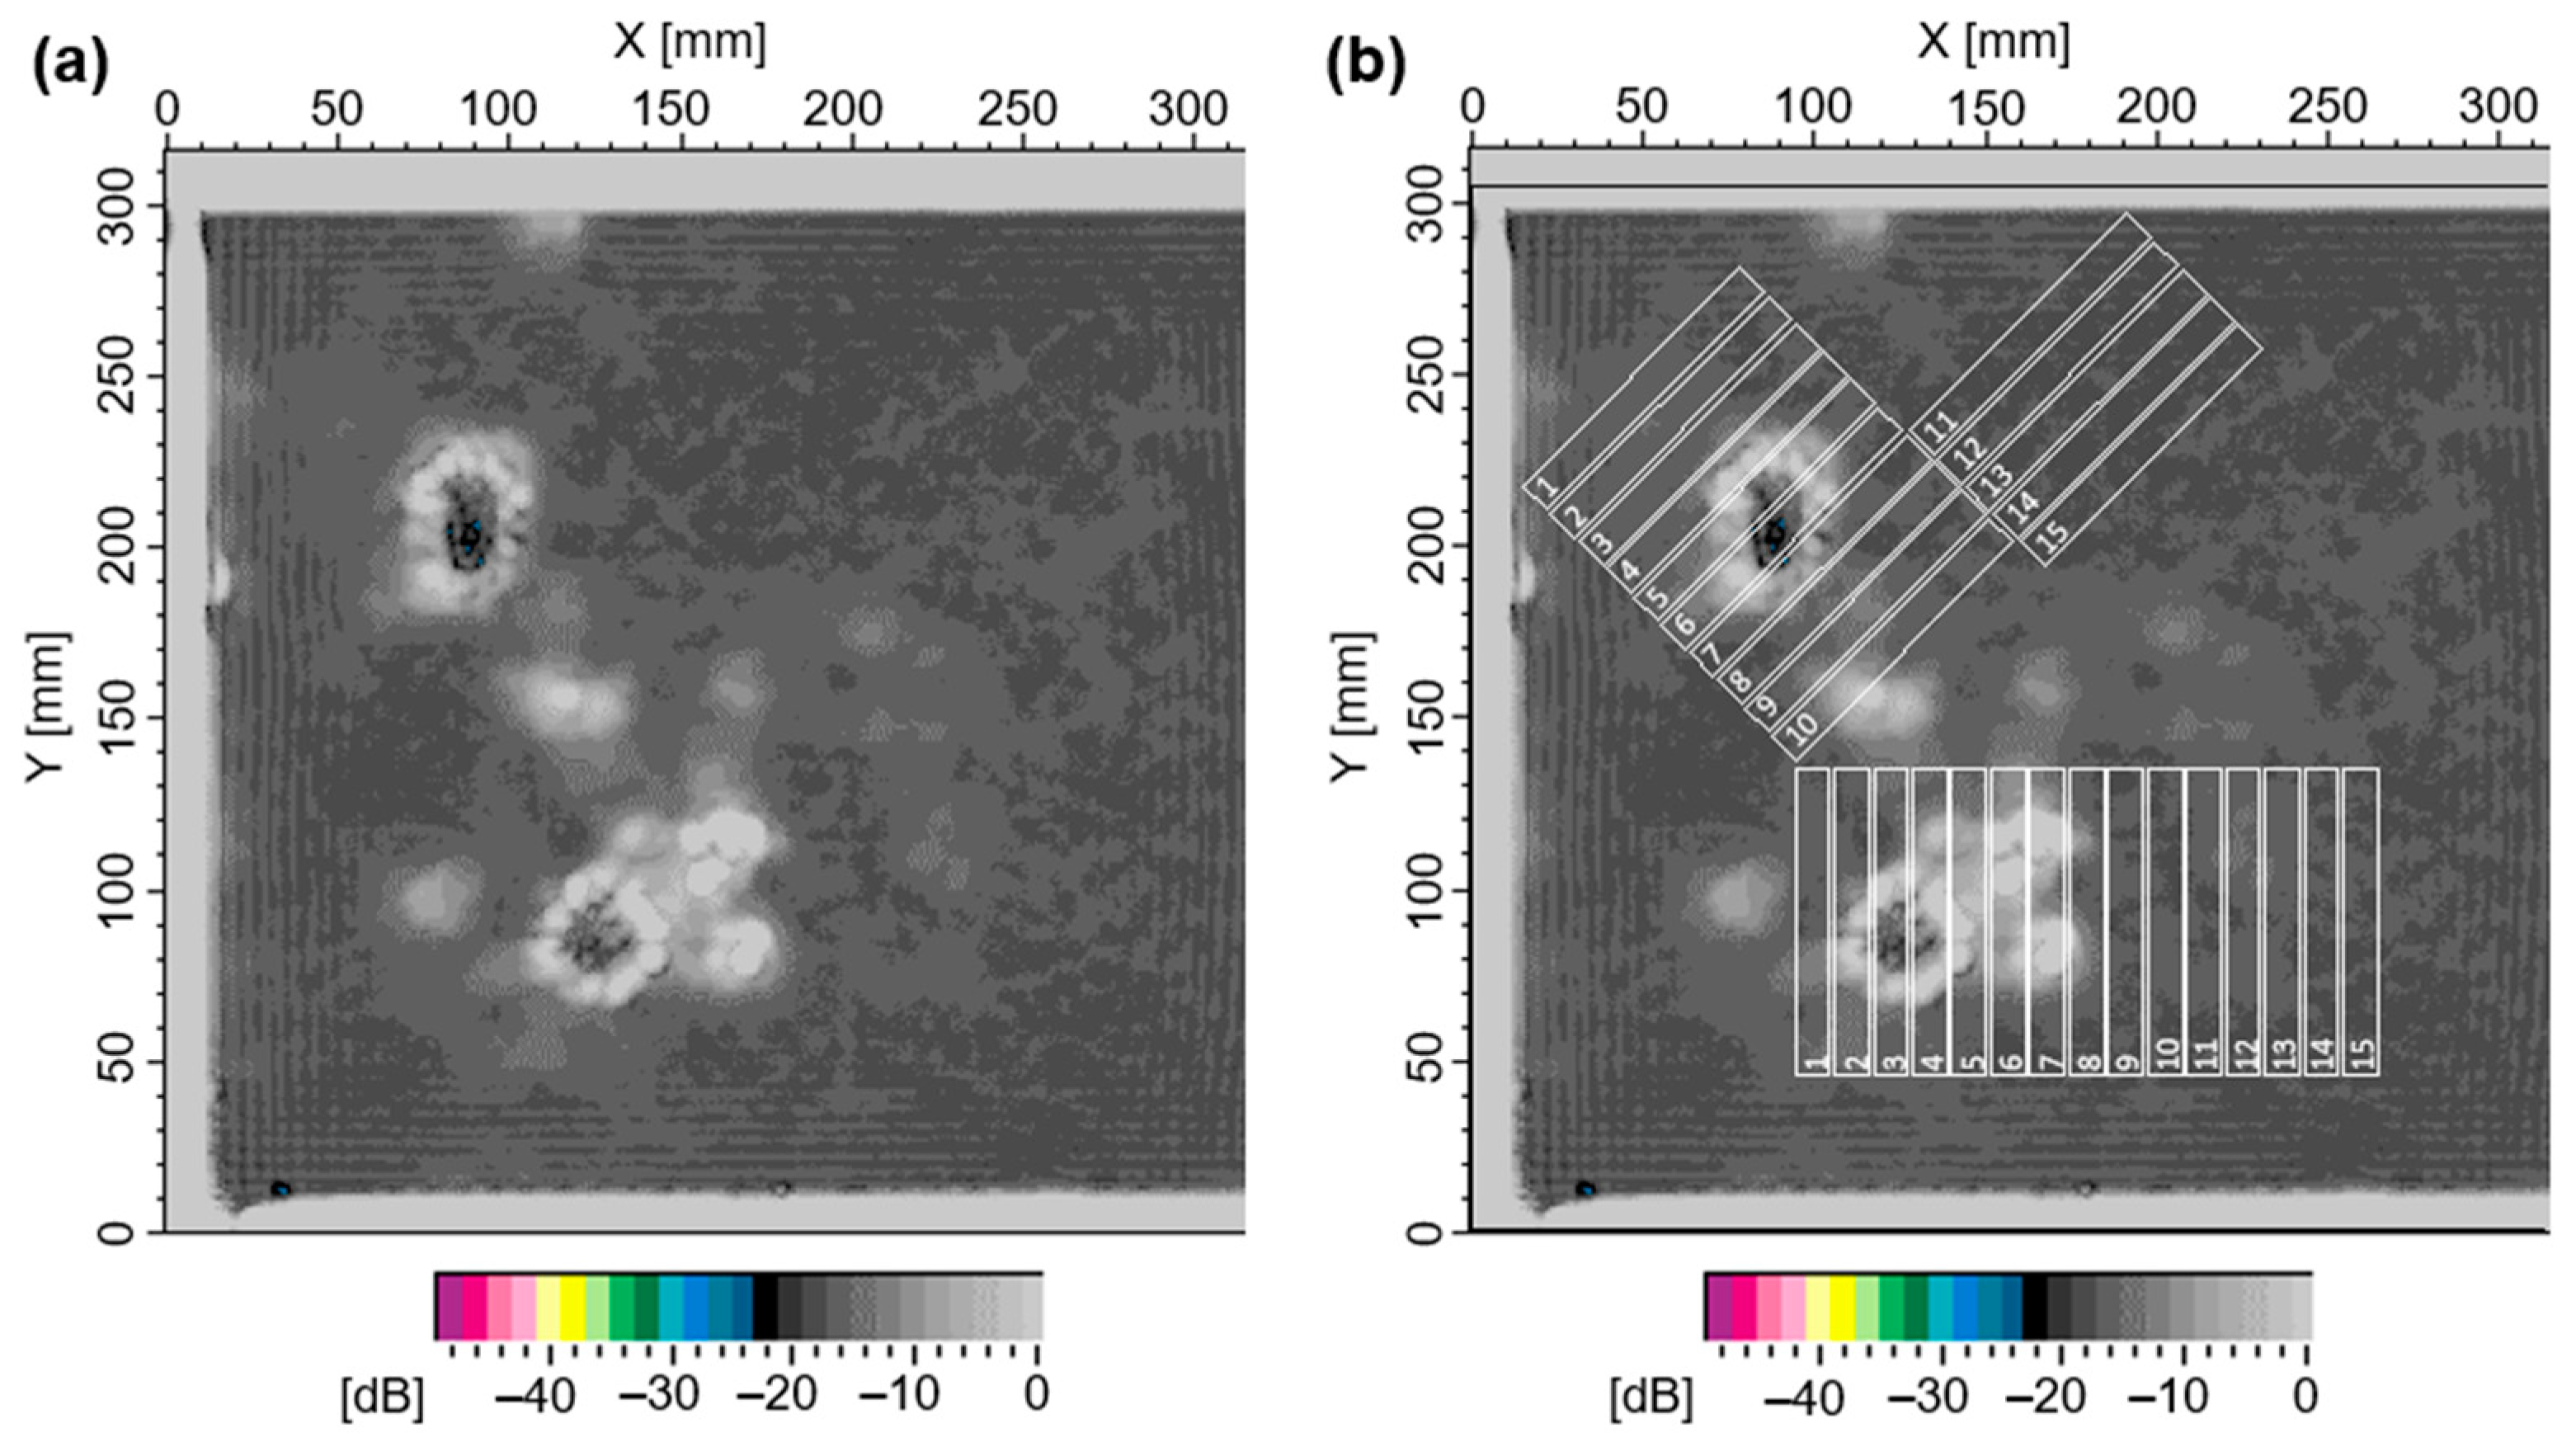
3.1. Air-Coupled Ultrasound Inspection of the Ox-CMC Plate
3.2. Characterization of Bending Bars
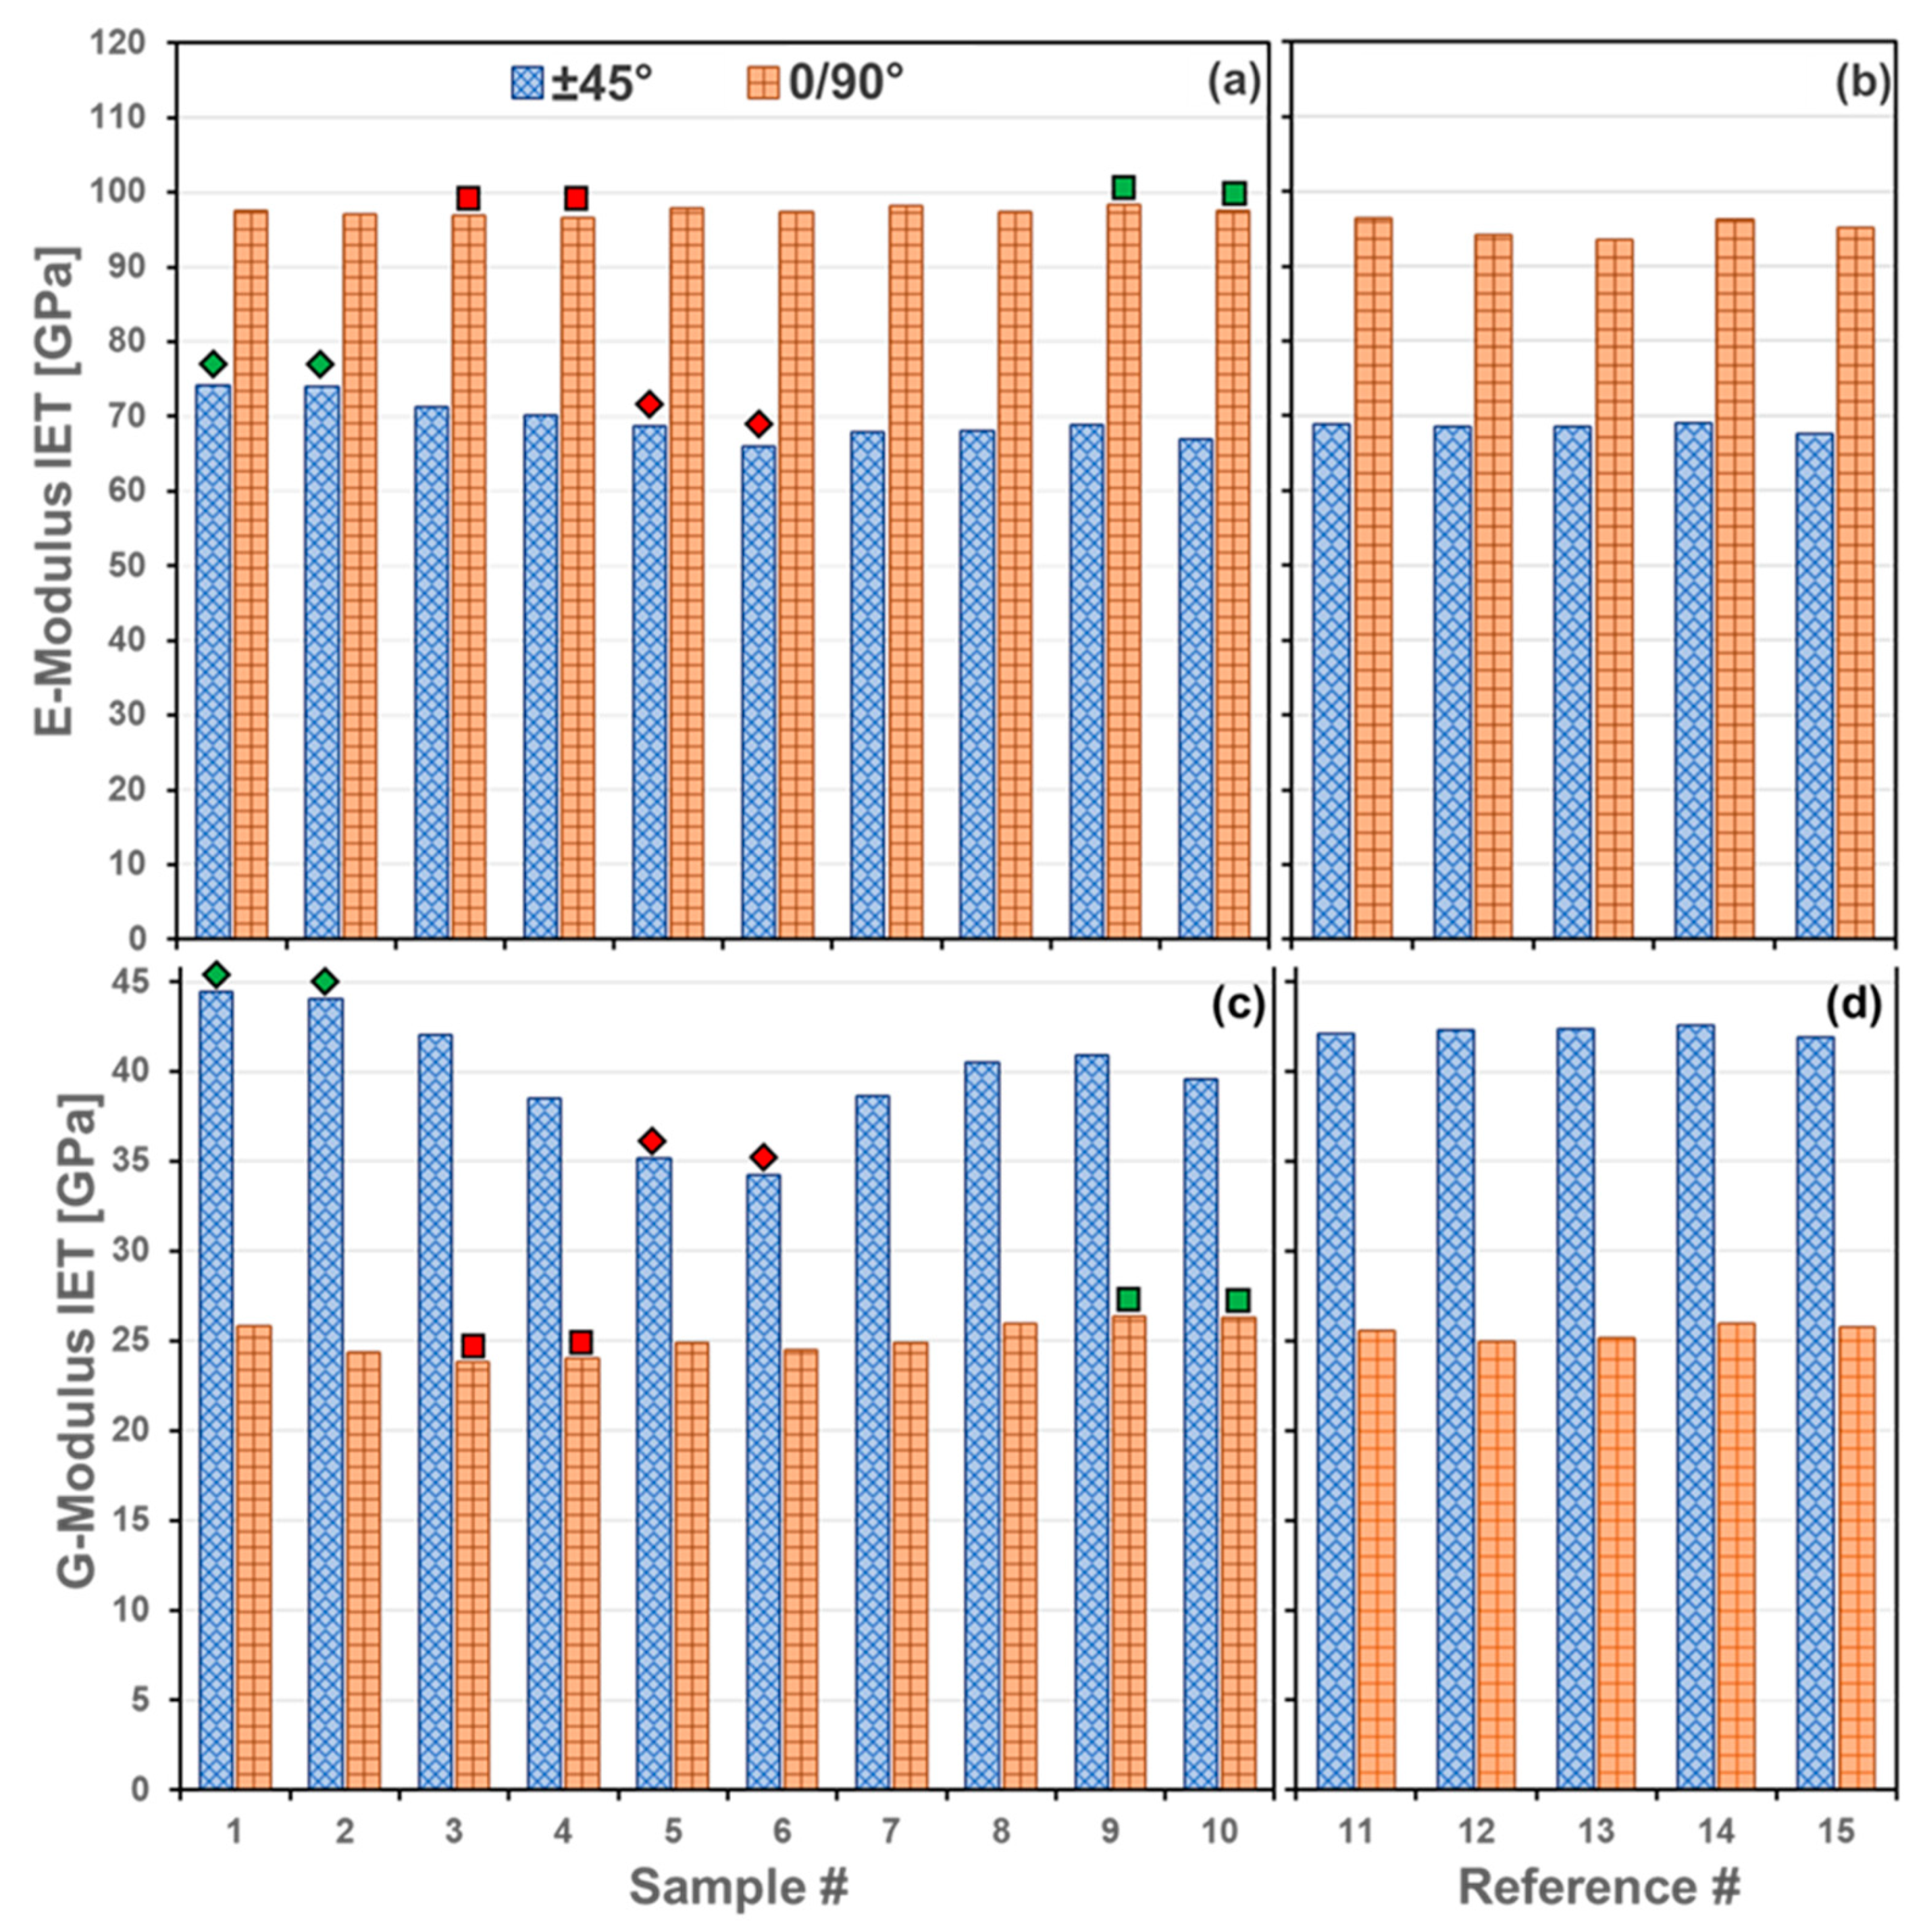
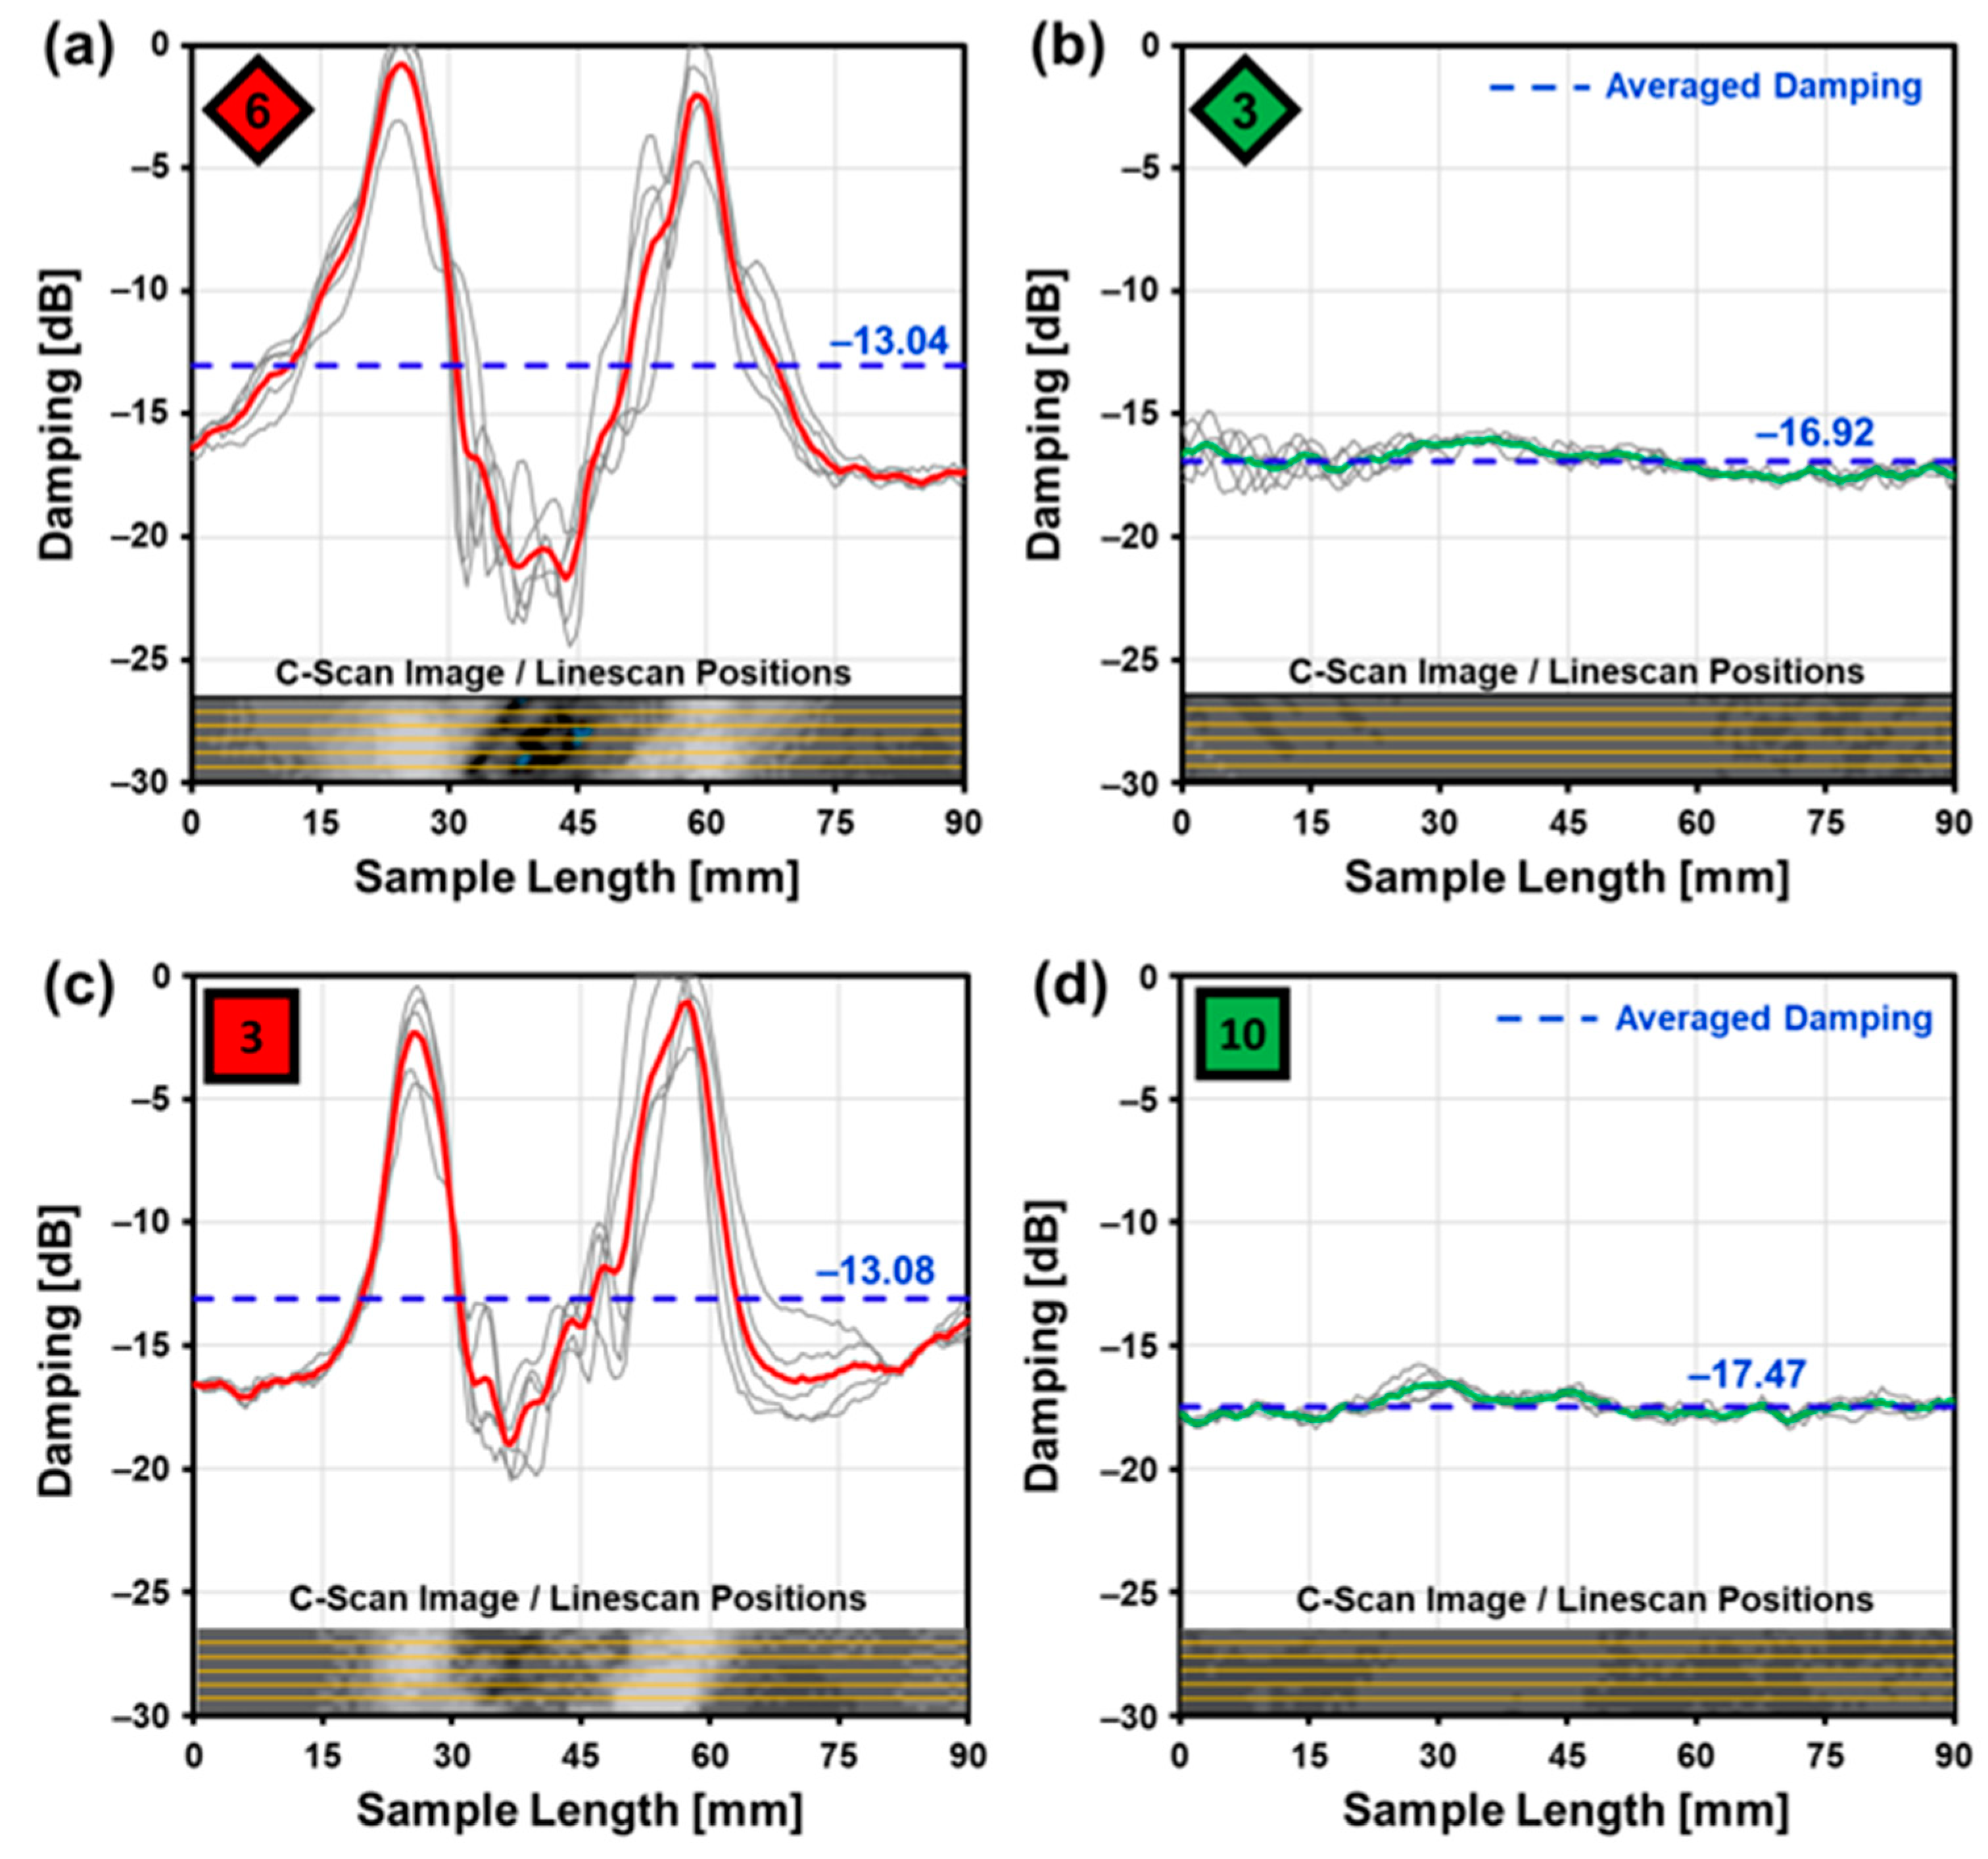
3.2.1. Resonant Frequency Damping Analysis
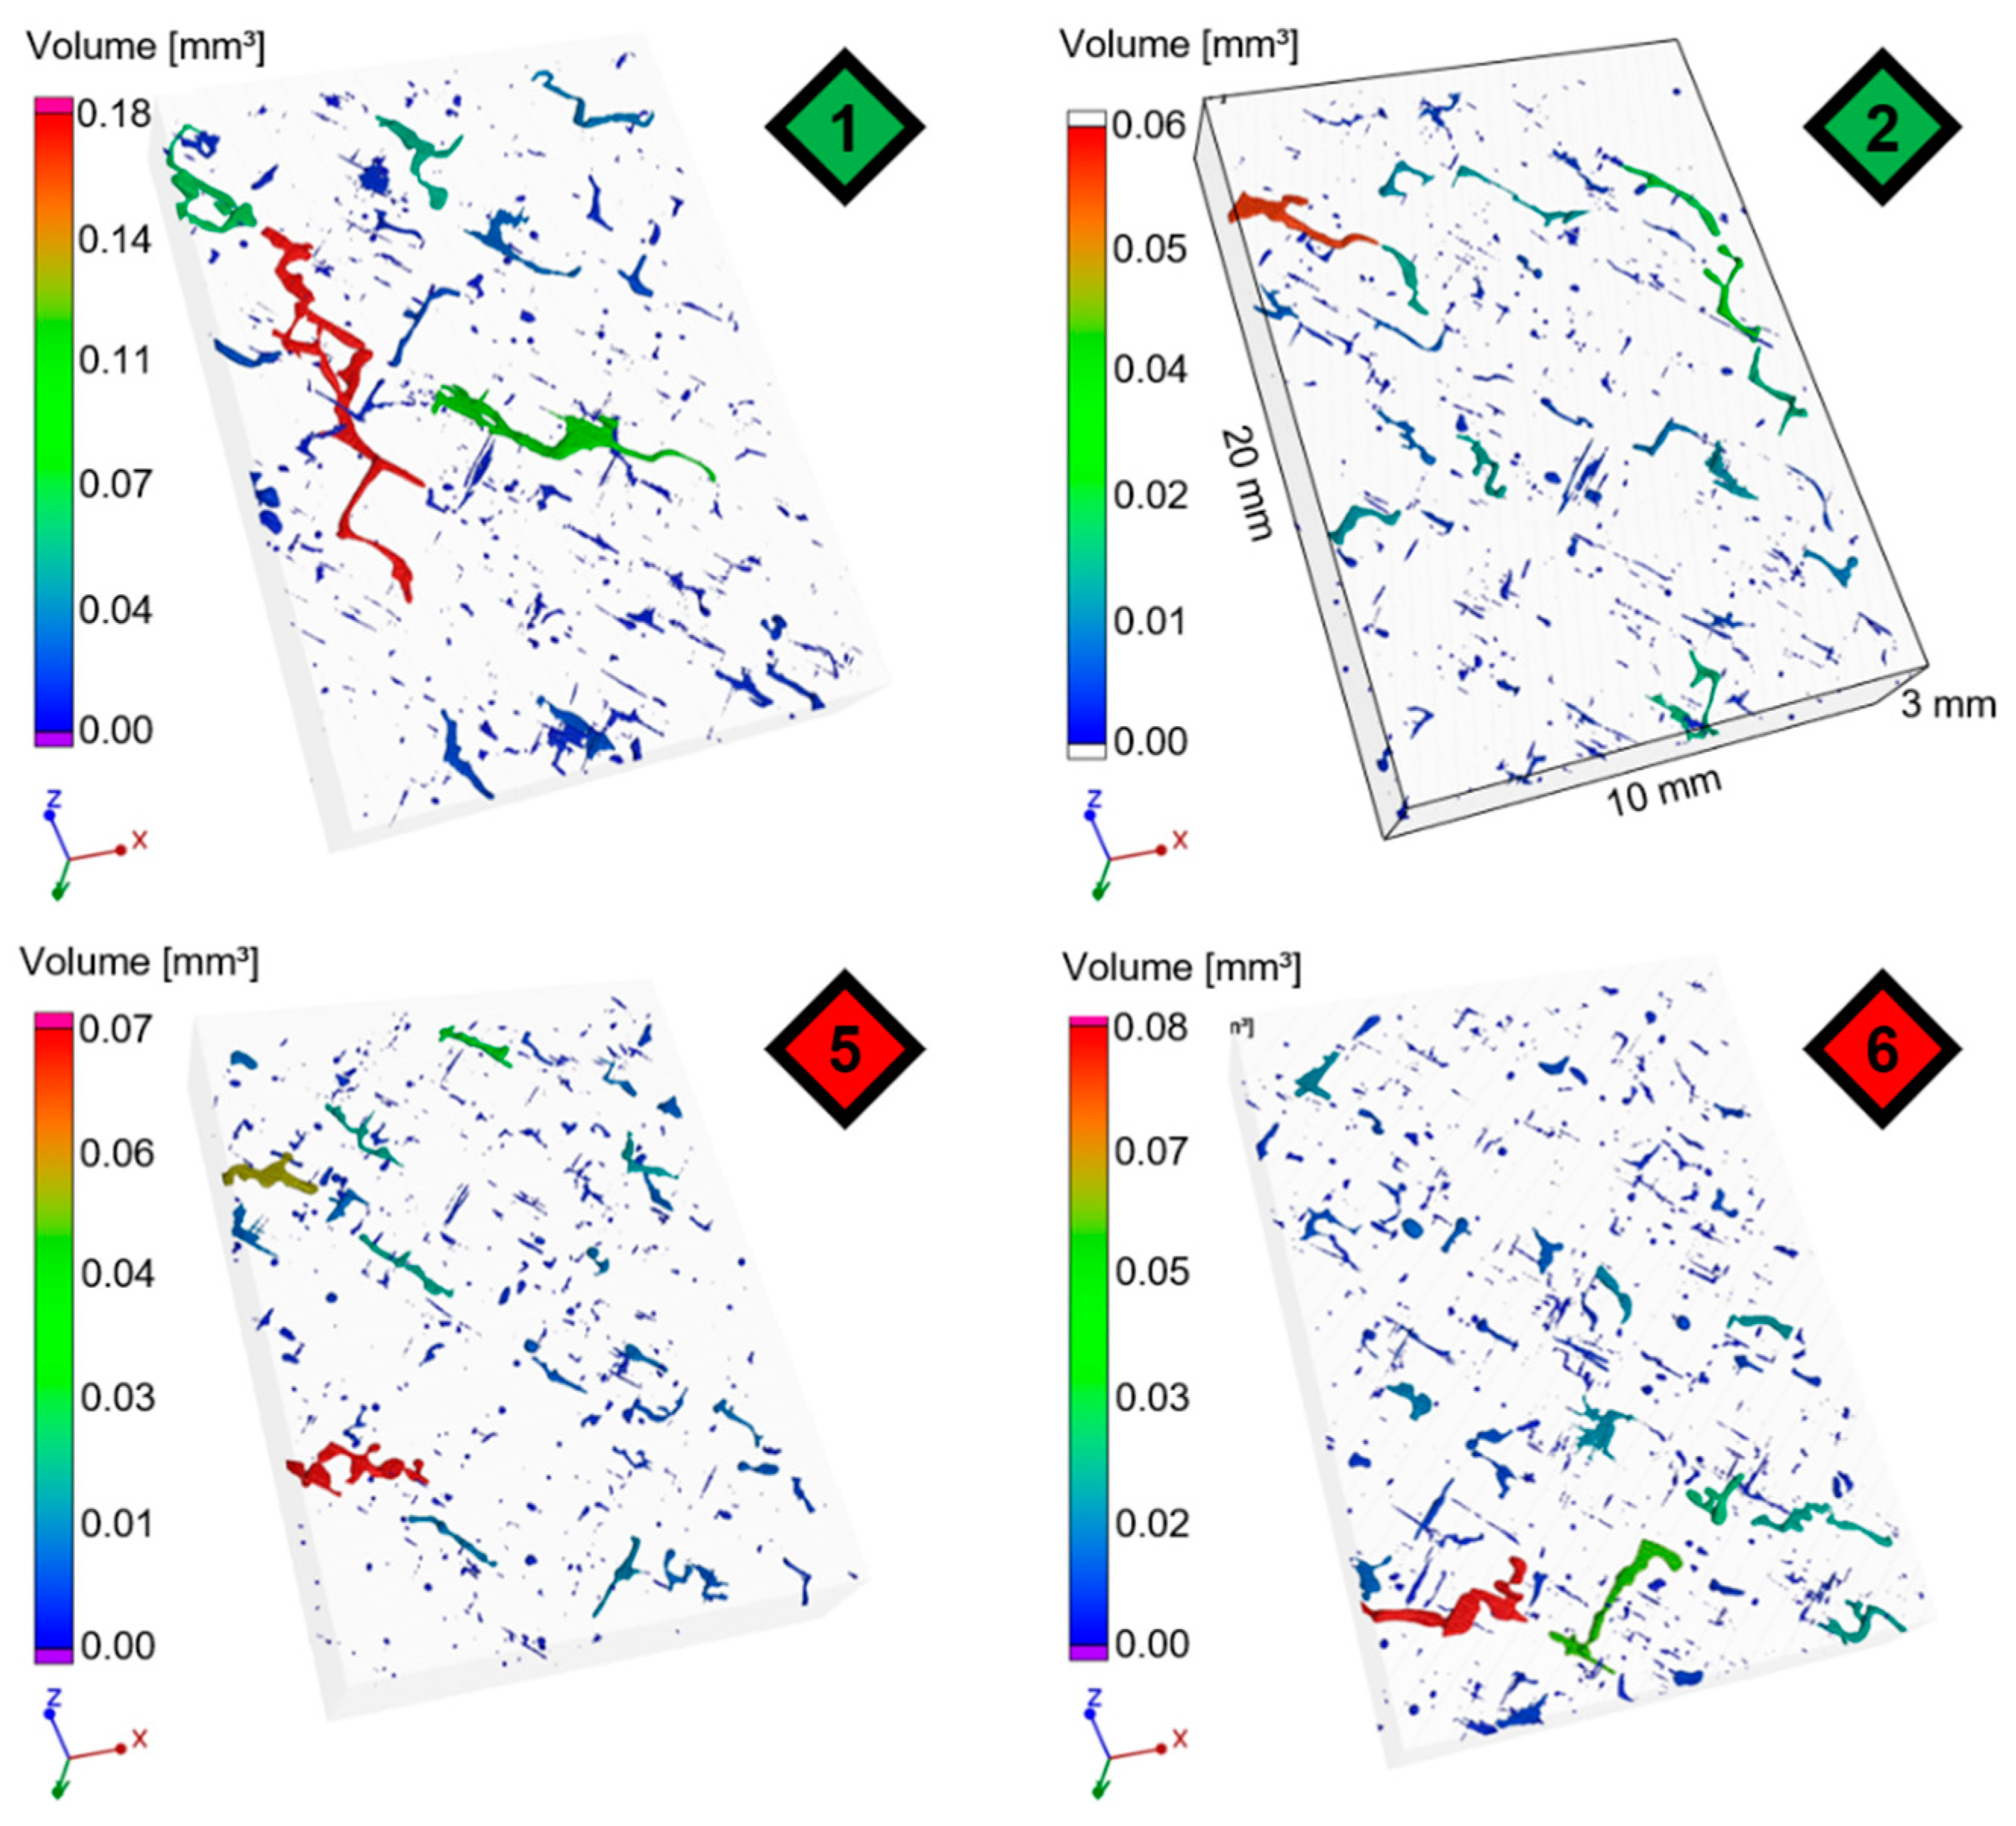
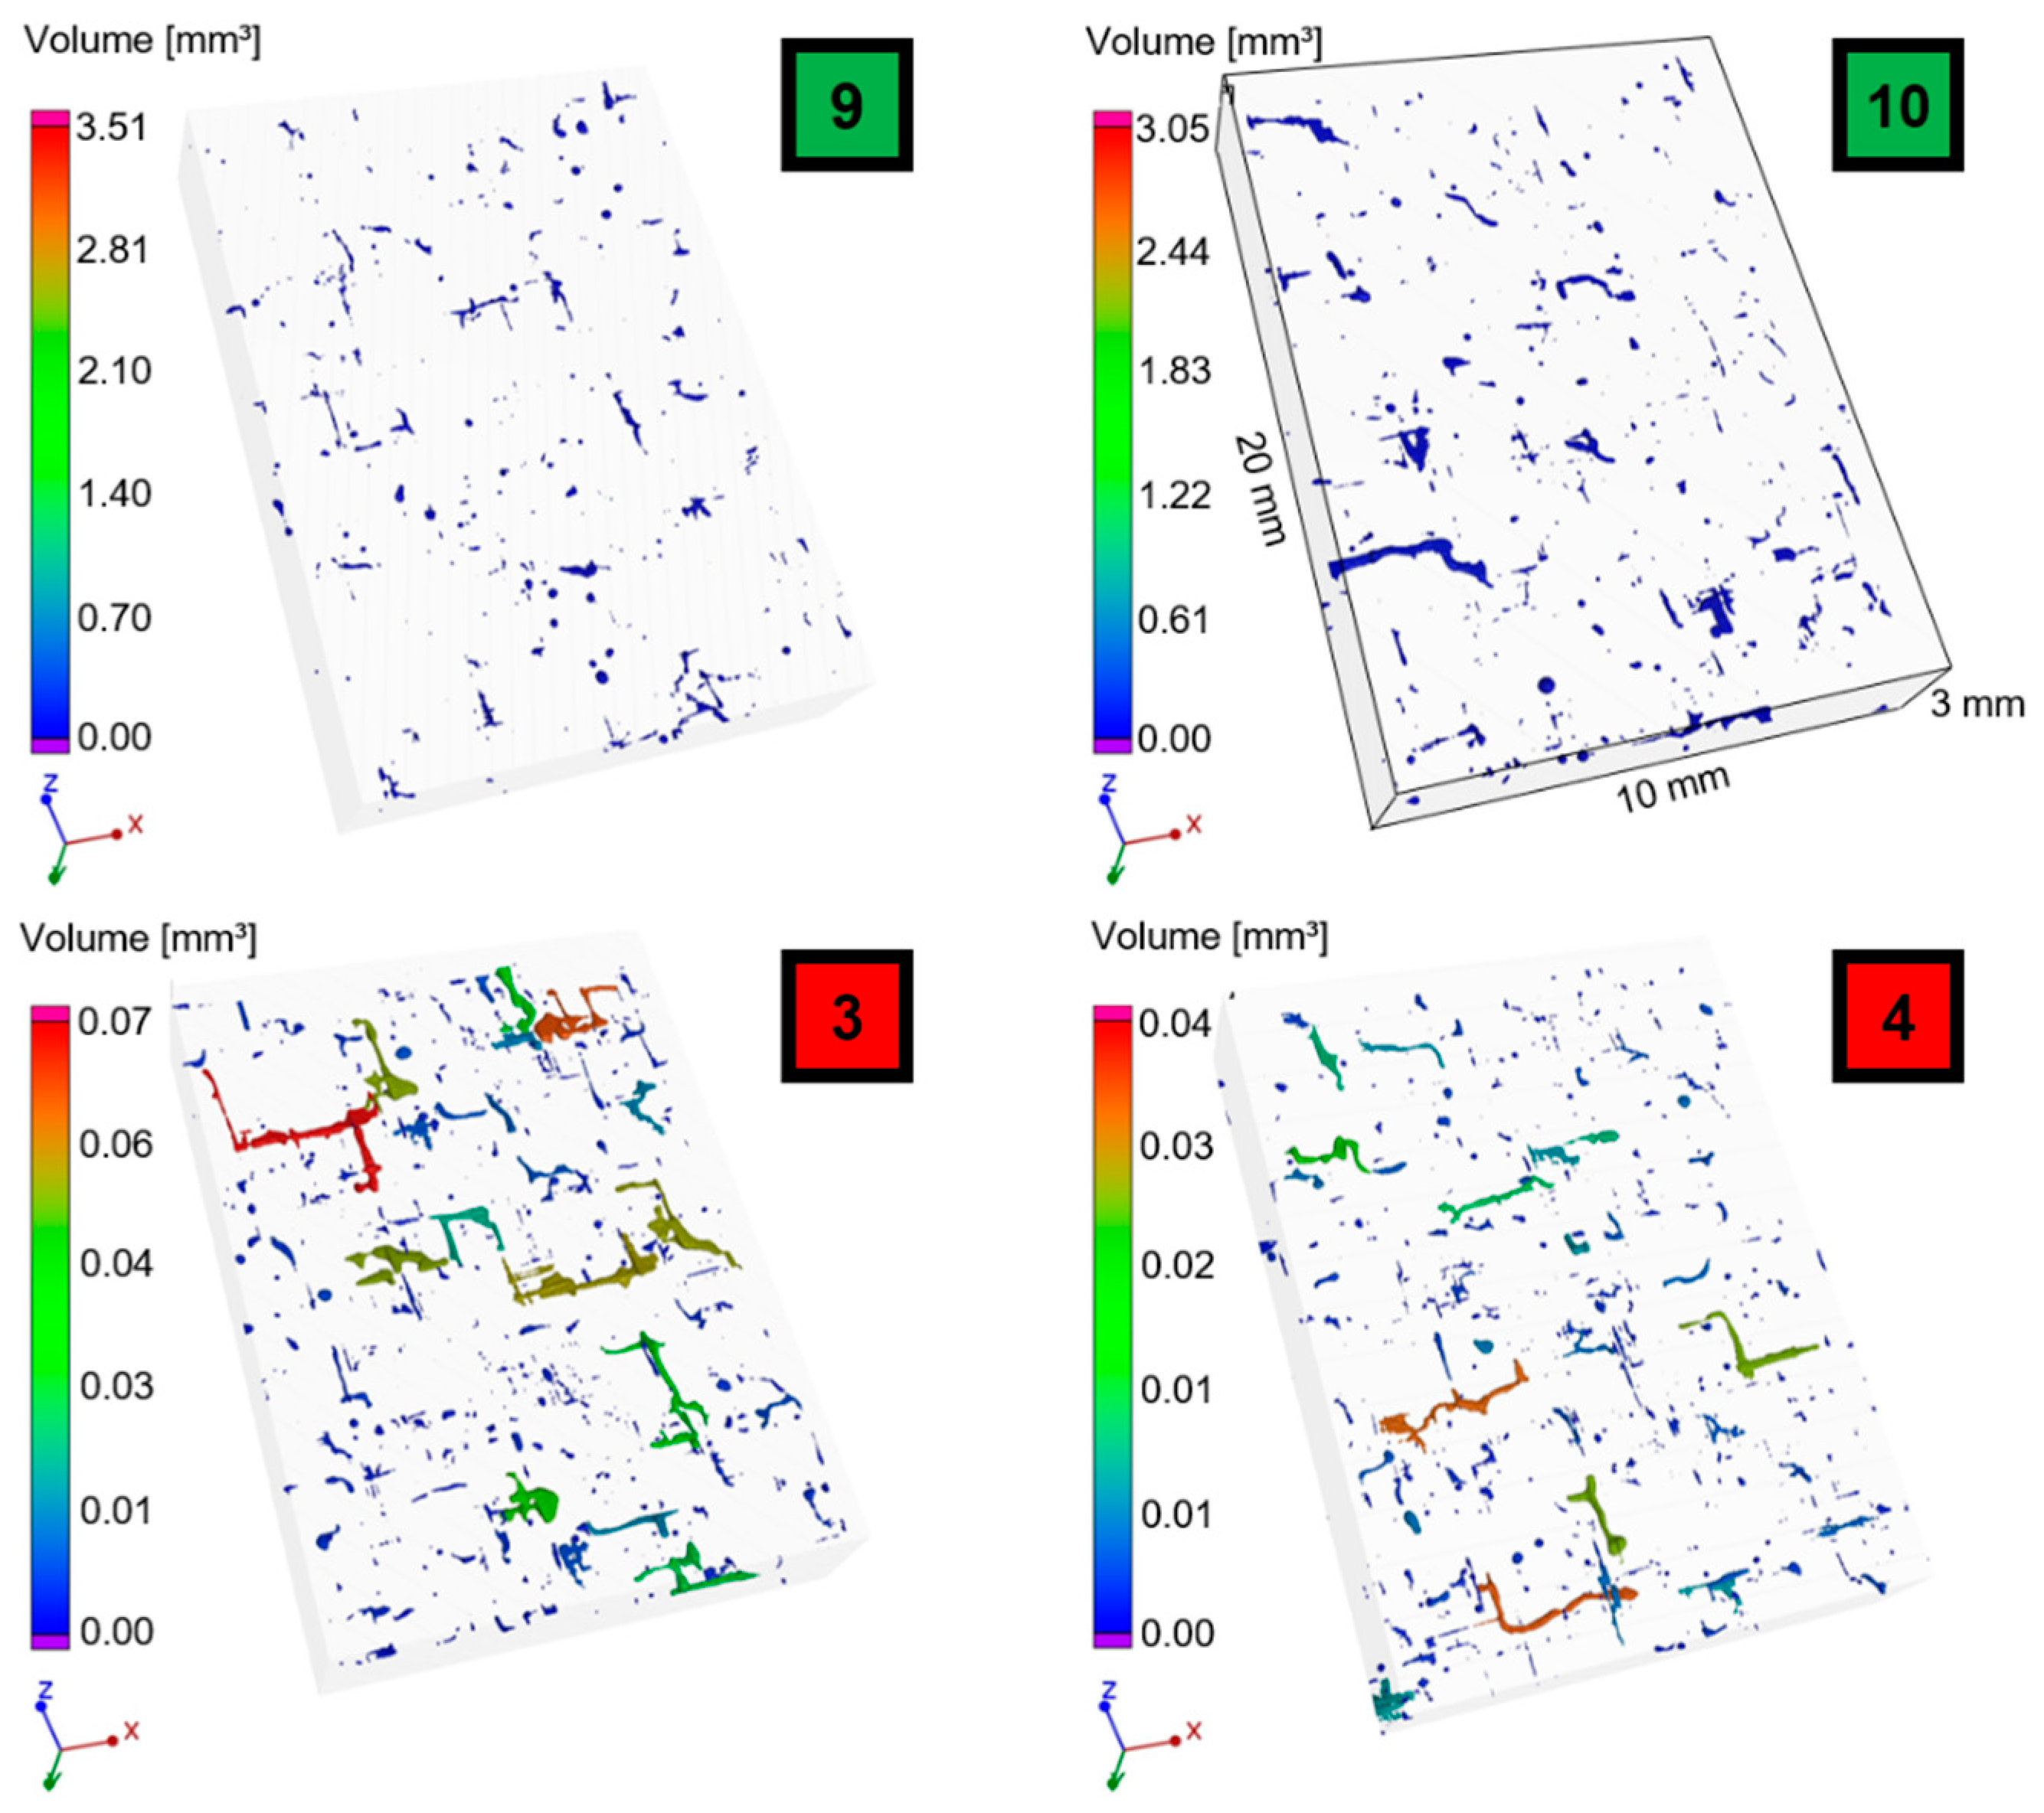
3.2.2. X-ray Computed Tomography Analysis
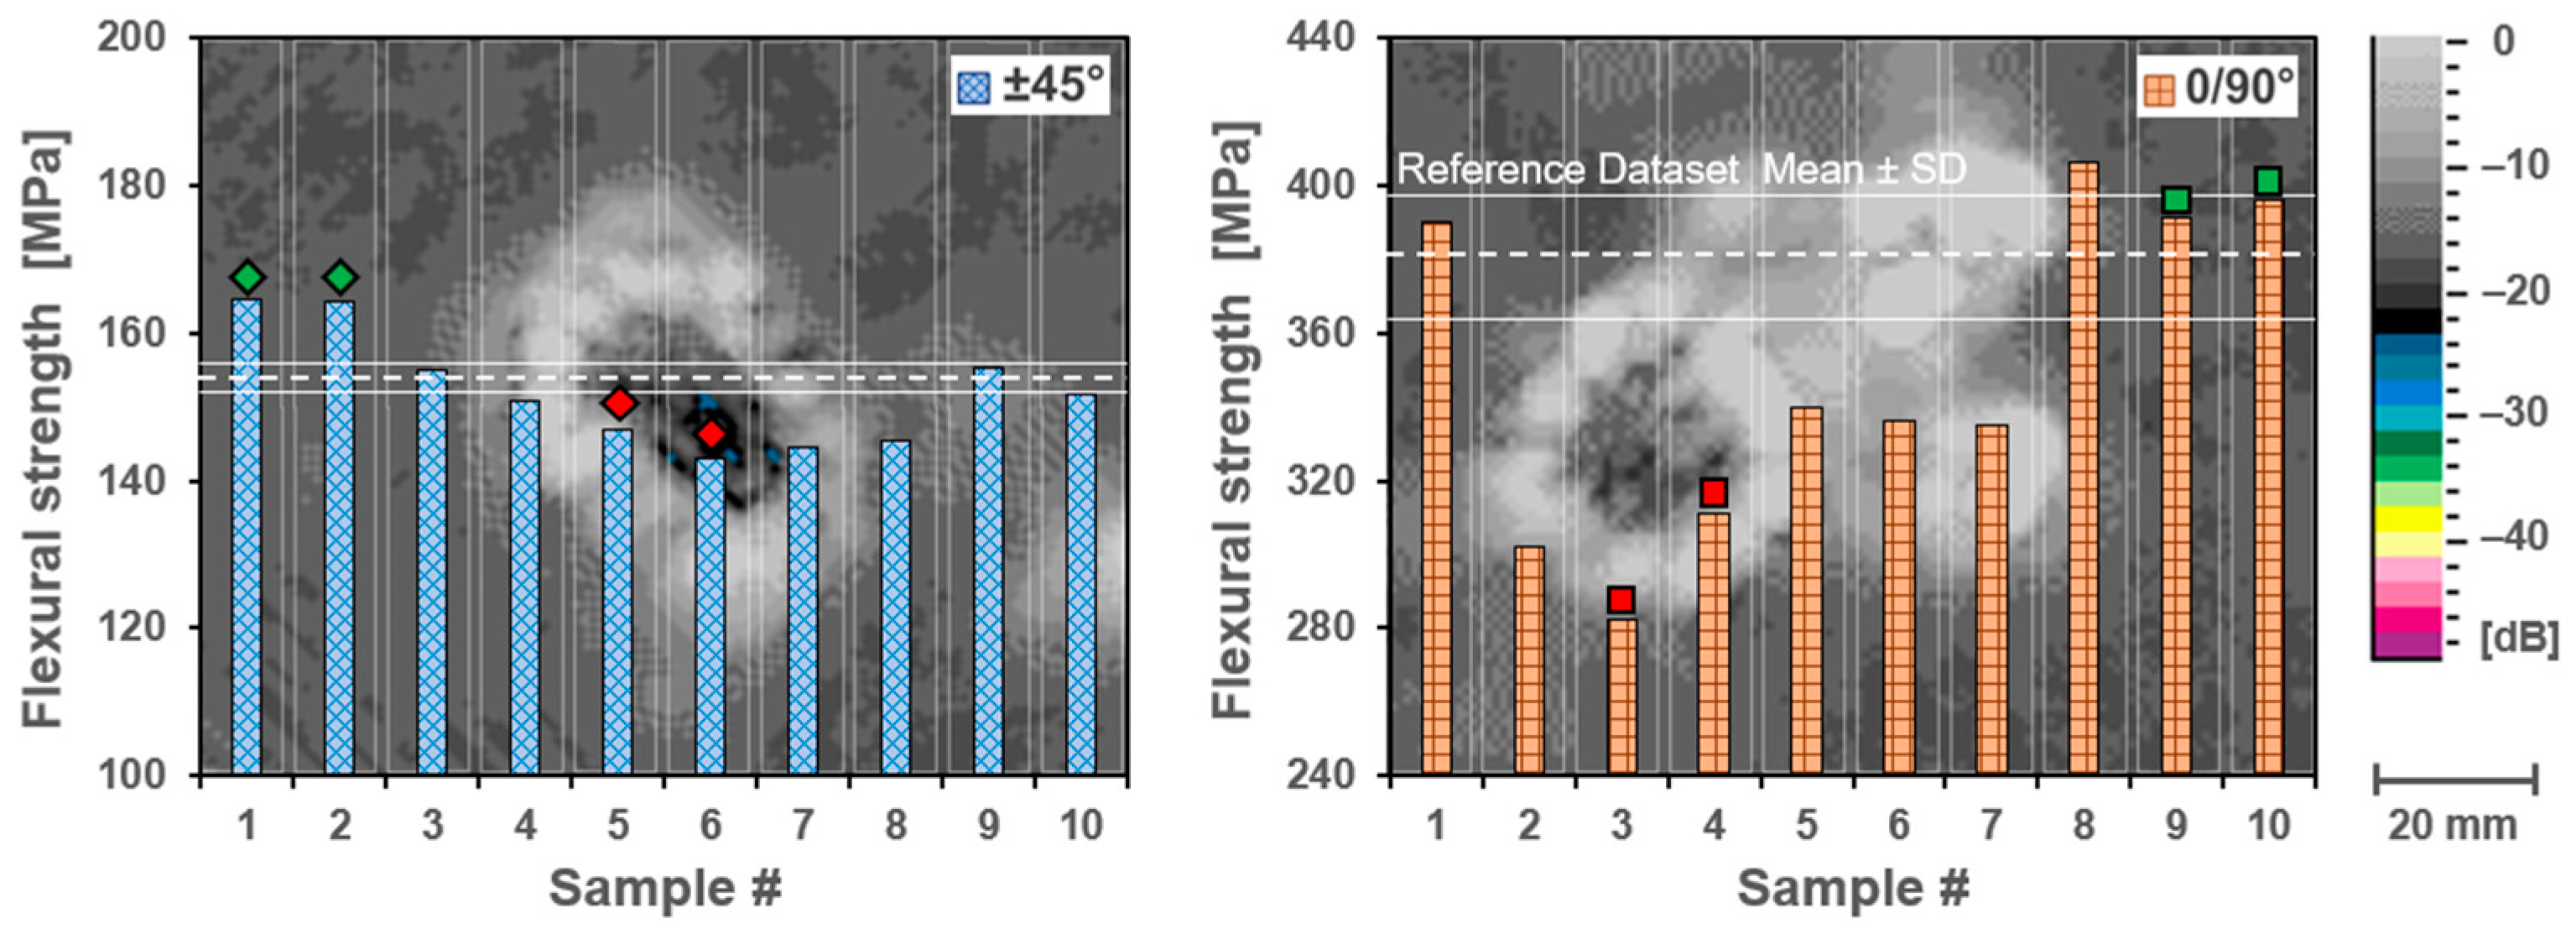
3.2.3. Three-Point Flexural Tests
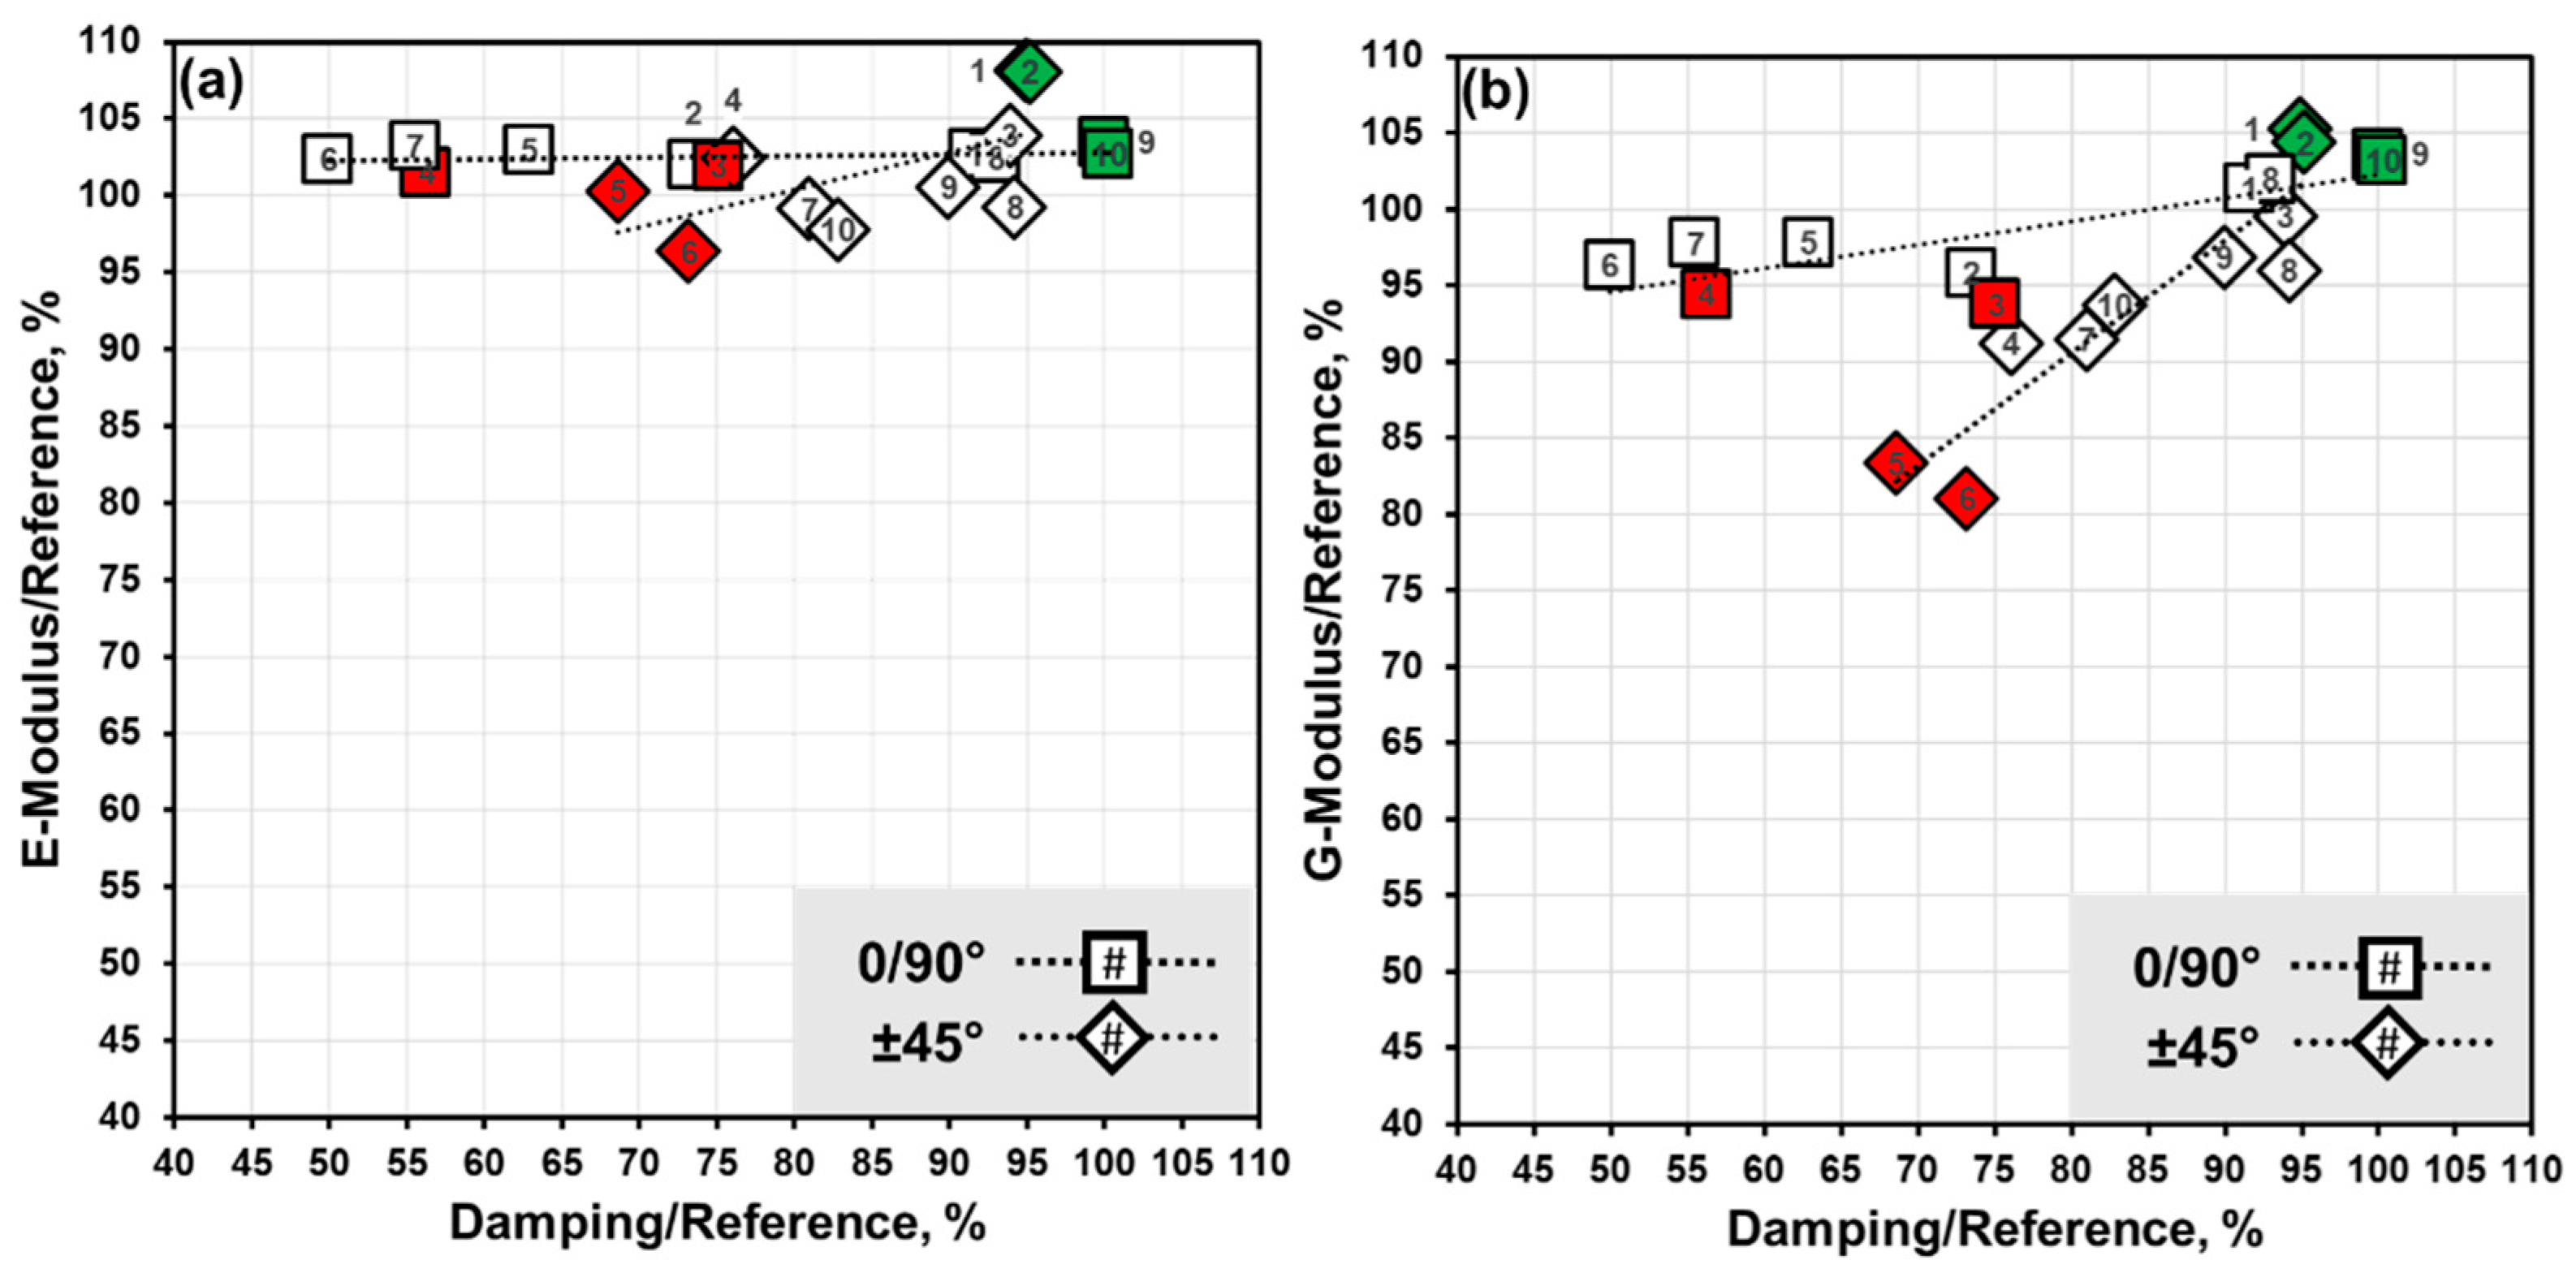
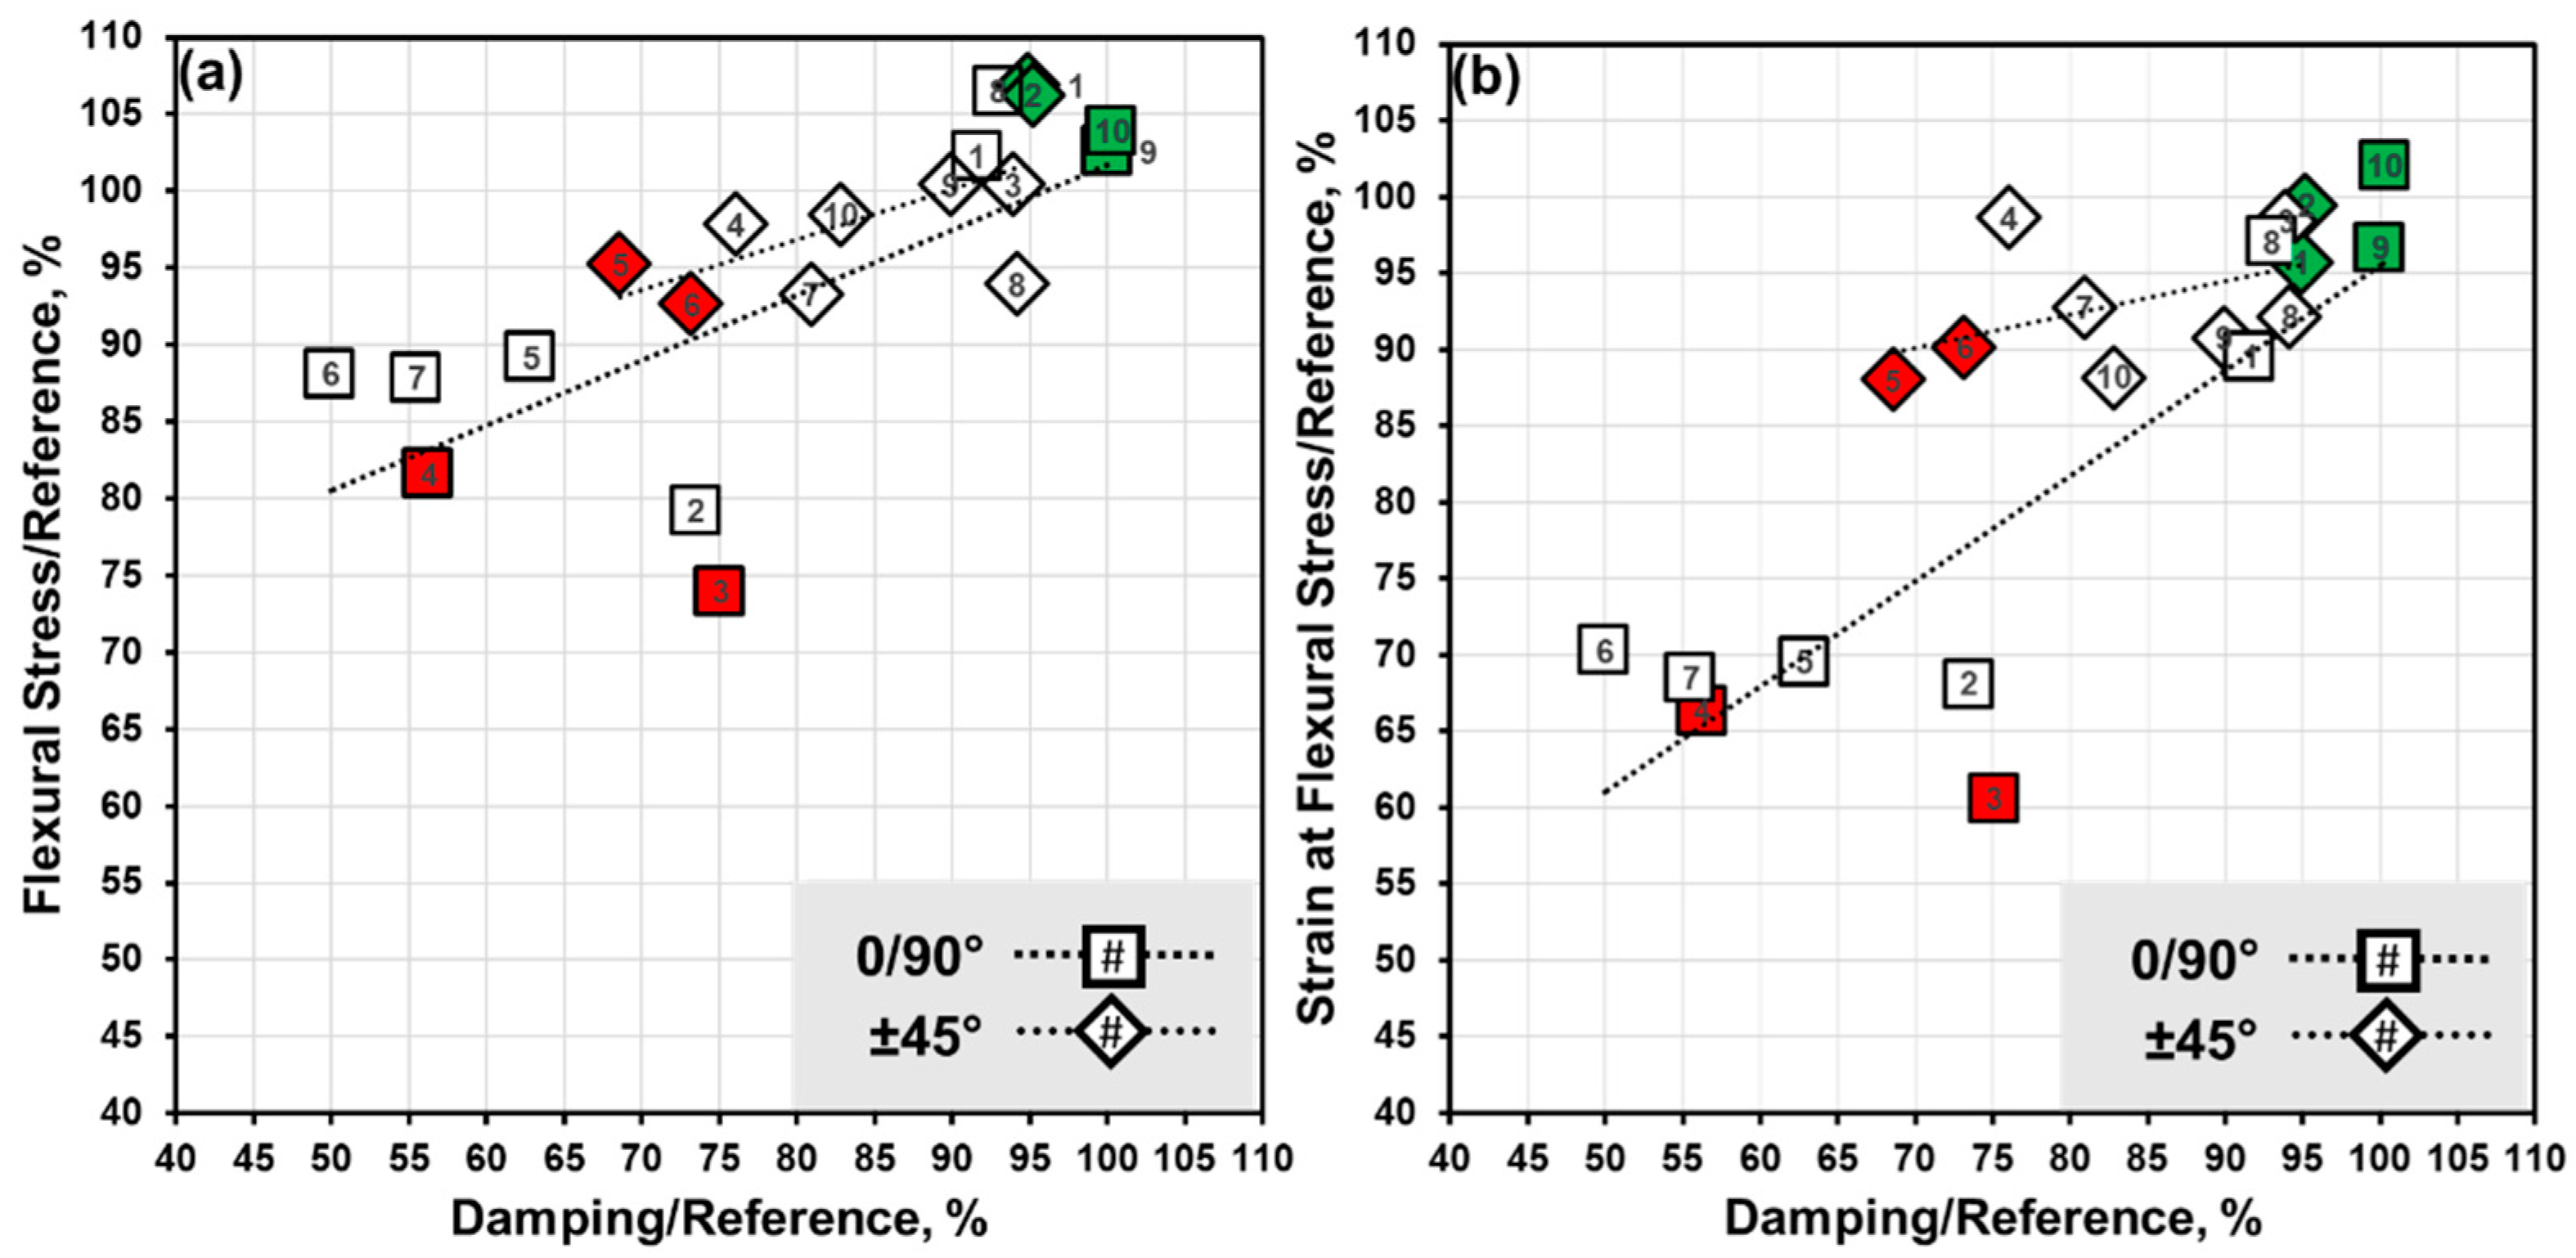
3.3. Correlation of ACU Heatmaps and Local Mechanical Properties
3.3.1. Data Extraction and Analyses
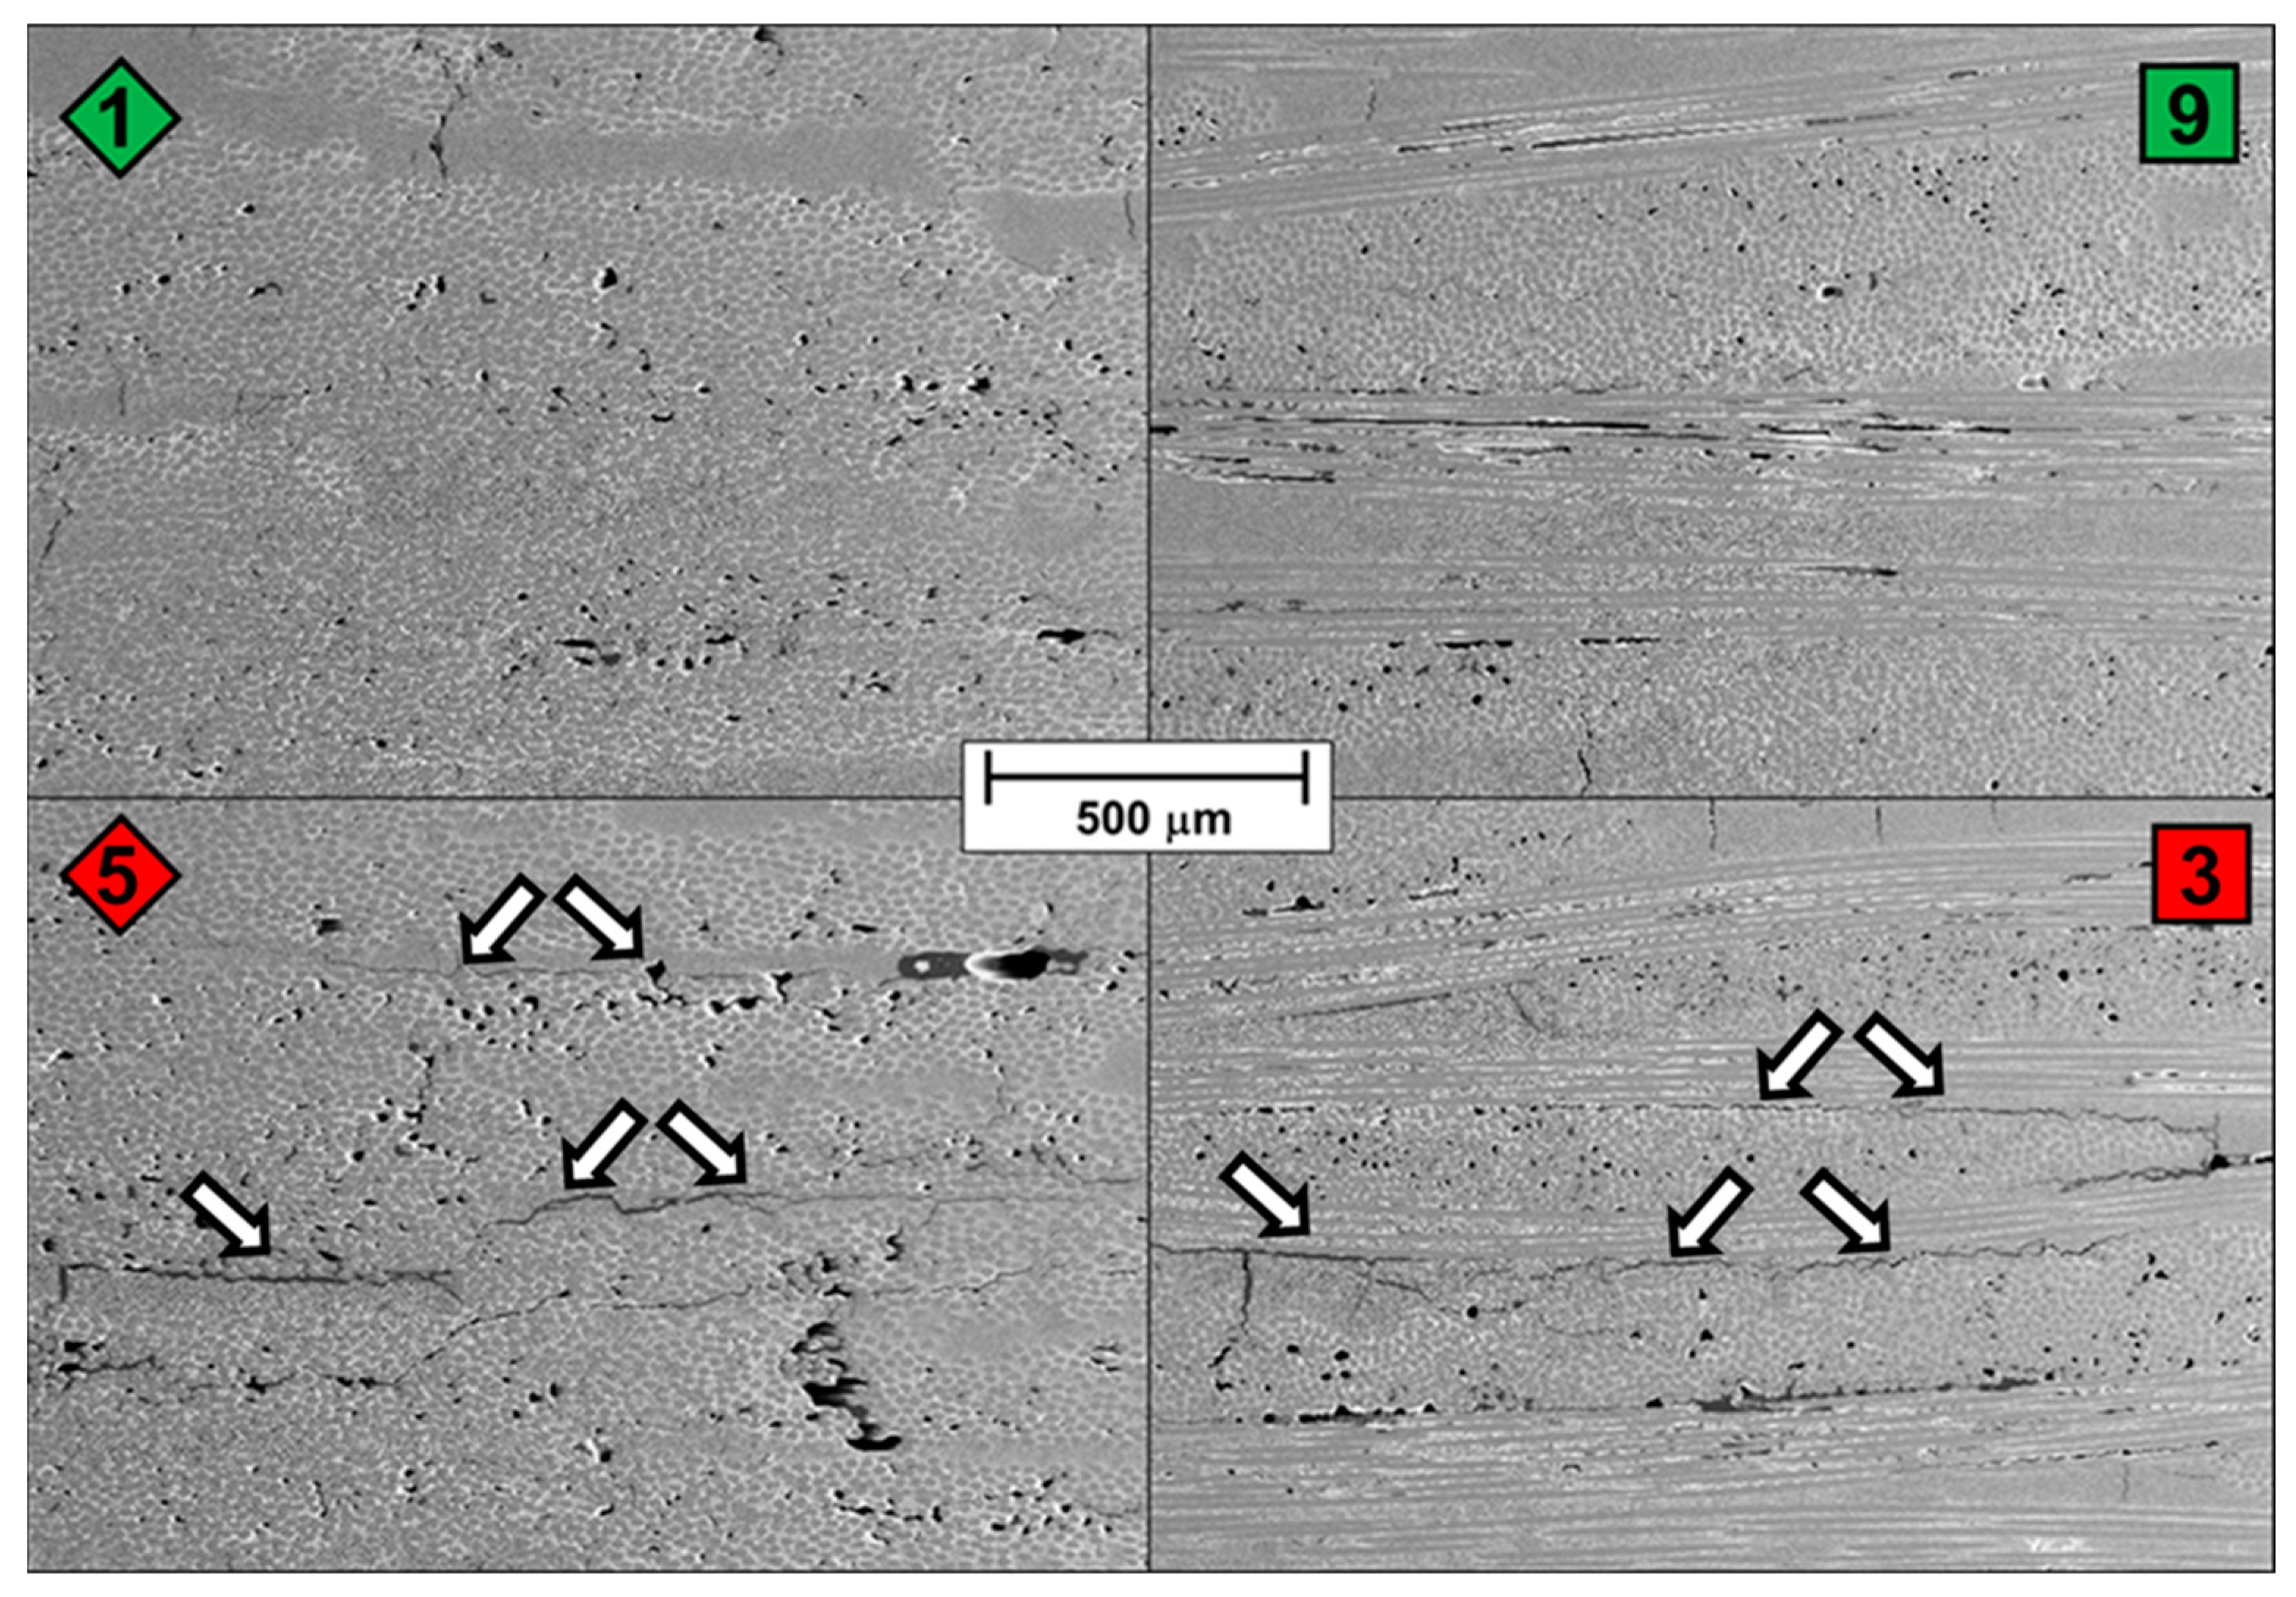
3.3.2. Supporting Microstructural Analysis
3.4. General View on the Employed Methodology
4. Conclusions
Author Contributions
Funding
Acknowledgments
Conflicts of Interest
References
- Schmücker, M.; Mechnich, P. All-oxide ceramic matrix composites with porous matrices. In Ceramic Matrix Composites: Fiber Reinforced Ceramics and Their Applications; Krenkel, W., Ed.; Wiley-VCH: Weinheim, Germany, 2008; pp. 205–229. [Google Scholar]
- Newman, B.; Schäfer, W. Processing and Properties of Oxide/Oxide Composites for Industrial Applications. In High Temperature Ceramic Matrix Composites; Krenkel, W., Naslain, R., Schneider, H., Eds.; Wiley-VCH: Weinheim, Germany, 2001; pp. 600–609. [Google Scholar]
- Shi, Y.; Hönig, S.; Frieß, M.; Rüdinger, A.; Pritzkow, W.; Koch, D. Manufacture and characterization of oxide ceramic matrix composites out of commercial pre-impregnated fabrics. Ceram. Int. 2018, 44, 2320–2327. [Google Scholar] [CrossRef]
- Pritzkow, W.E.; Wehner, F.; Koch, D. Oxide Fiber Reinforced Oxide Ceramic Matrix Composite—An Alternative to Metallic Alloys at High Temperature. In Encyclopedia of Materials: Metals and Allloys; Caballero, F.G., Ed.; Elsevier: Oxford, UK, 2020; pp. 425–441. [Google Scholar]
- Pritzkow, W.E.; Almeida, R.S.; Mateus, L.B.; Tushtev, K.; Rezwan, K. All-oxide ceramic matrix composites (OCMC) based on low cost 3M Nextel™ 610 fabrics. J. Eur. Ceram. Soc. 2021, 41, 3177–3187. [Google Scholar] [CrossRef]
- Tushtev, K.; Martin Almeida, R.S. 5.5 Oxide/Ox-CMCs—Porous Matrix Composite Systems; Composites with Interface Coatings. In Comprehensive Composite Materials II; Beaumont, P.W., Zweben, C.H., Eds.; Elsevier: Oxford, UK, 2018; pp. 130–157. [Google Scholar]
- Keller, K.A.; Jefferson, G.; Kerans, R.J. Oxide-Oxide Composites. In Ceramic Matrix Composites: Materials, Modeling and Technology; Bansal, N.P., Lamon, J., Eds.; John Wiley & Sons: Hoboken, NJ, USA, 2014; pp. 236–272. [Google Scholar]
- Mechnich, P.; Welter, M. Porous Oxide Ceramic Matrix Composites—Properties, Manufacturing, and Applications. In Encyclopedia of Materials: Composites; Brabazon, D., Ed.; Elsevier: Oxford, UK, 2021; pp. 48–54. [Google Scholar]
- Ullmann, T.; Shi, Y.; Rahner, N.; Schmücker, M. Quality assurance for the manufacturing of oxide fiber reinforced ceramic composites for aerospace applications. In Proceedings of the 4th International Symposium on NDT in Aerospace, Augsburg, Germany, 13–15 November 2012; pp. 1–11. [Google Scholar]
- Ullmann, T.; Shi, Y.; Aoki, R. Capabilities of Lock-in Thermography for Non-destructive Inspection of Fibre Reinforced Composites. In Proceedings of the 11th International Conference on Quantitative InfraRed Thermography, Naples, Italy, 11–14 June 2012. [Google Scholar] [CrossRef]
- Asokkumar, A.; Jasiūnienė, E.; Raišutis, R.; Kažys, R.J. Comparison of Ultrasonic Non-Contact Air-Coupled Techniques for Characterization of Impact-Type Defects in Pultruded GFRP Composites. Materials 2021, 14, 1058. [Google Scholar] [CrossRef] [PubMed]
- Schmidt, T.; Dutta, S.; Ullmann, T. Production integrated NDT by means of automated Thermography. In Proceedings of the 2012 International Conference on Quantitative InfraRed Thermography, Naples, Italy, 11–14 June 2012; Cardone, G., Ed.; NDT.net: Rheinland-Pfalz, Germany, 2012. [Google Scholar] [CrossRef]
- Huber, A. Non-destructive testing of future rocket boosters using air-coupled ultrasound. In Proceedings of the 19th World Conference of Non-Destructive Testing, Munich, Germany, 13–17 June 2016; pp. 1–9. [Google Scholar]
- Schönheits, M.; Huber, A.; Gänswürger, P. Air-coupled Ultrasonic Inspection with Adaptive Lamb Wave Control. In Proceedings of the 16th International Conference on Informatics in Control, Automation and Robotics, 2nd ed.; Gusikhin, O., Madani, K., Zytoon, J., Eds.; Science and Technology Publications: Prague, Czech Republic, 2019; pp. 430–438. [Google Scholar]
- Neuenschwander, J.; Furrer, R.; Roemmeler, A. Application of air-coupled ultrasonics for the characterization of polymer and polymer-matrix composite samples. Polym. Test. 2016, 56, 379–386. [Google Scholar] [CrossRef]
- Kudela, P.; Radzienski, M.; Ostachowicz, W. Impact induced damage assessment by means of Lamb wave image processing. Mech. Syst. Signal Process. 2018, 102, 23–36. [Google Scholar] [CrossRef]
- Laureti, S.; Rizwan, M.K.; Malekmohammadi, H.; Burrascano, P.; Natali, M.; Torre, L.; Rallini, M.; Puri, I.; Hutchins, D.; Ricci, M. Delamination Detection in Polymeric Ablative Materials Using Pulse-Compression Thermography and Air-Coupled Ultrasound. Sensors 2019, 19, 2198. [Google Scholar] [CrossRef] [PubMed] [Green Version]
- Panda, R.S.; Rajagopal, P.; Balasubramaniam, K. Characterization of delamination-type damages in composite laminates using guided wave visualization and air-coupled ultrasound. Struct. Health Monit. 2017, 16, 142–152. [Google Scholar] [CrossRef]
- Schmelt, A.S.; Marhenke, T.; Hasener, J.; Twiefel, J. Investigation and Enhancement of the Detectability of Flaws with a Coarse Measuring Grid and Air Coupled Ultrasound for NDT of Panel Materials Using the Re-Radiation Method. Appl. Sci. 2020, 10, 1155. [Google Scholar] [CrossRef] [Green Version]
- Quattrocchi, A.; Freni, F.; Montanini, R. Air-coupled ultrasonic testing to estimate internal defects in composite panels used for boats and luxury yachts. Int. J. Interact. Des. Manuf. 2020, 14, 35–41. [Google Scholar] [CrossRef]
- Bustamante, L.; Jeyaprakash, N.; Yang, C.-H. Evaluation of Defect Detection in Aluminium, CFRP and Epoxy Resin Plates Using Non-contact Air-Coupled Ultrasonic Waves. Int. J. Precis. Eng. Manuf. 2020, 21, 1843–1856. [Google Scholar] [CrossRef]
- Yilmaz, B.; Asokkumar, A.; Jasiūnienė, E.; Kažys, R.J. Air-Coupled, Contact, and Immersion Ultrasonic Non-Destructive Testing: Comparison for Bonding Quality Evaluation. Appl. Sci. 2020, 10, 6757. [Google Scholar] [CrossRef]
- Vasechko, V.; Schmücker, M.; Rahner, N.; Ullmann, T. Air-Coupled Ultrasonic Inspection Technique as NDT Tool for Evaluation of Porous Wound Oxide/Oxide Composite Ceramics. In Proceedings of the 19th World Conference of Non-Destructive Testing, Munich, Germany, 13–17 June 2016; pp. 1–9. [Google Scholar]
- Zok, F.W.; Levi, C.G. Mechanical Properties of Porous-Matrix Ceramic Composites. Adv. Eng. Mater. 2001, 3, 15–23. [Google Scholar] [CrossRef]
- Puchegger, S.; Loidl, D.; Peterlik, H.; Kromp, K. Determination of Elastic Modules in Dependence on Orientation by the Resonant Beam Technique. In Advanced Materials Forum III; Vilarinho, P.M., Ed.; Trans Tech Publications: Zürich, Switzerland, 2006; pp. 815–824. [Google Scholar]


| Specimen No. | Geom. Density (g/cm3) | Impulse Excitation Technique | 3-Point Bending Test | |||
|---|---|---|---|---|---|---|
| Young’s Modulus (GPa) | Shear Modulus (GPa) | Flexural Strength (MPa) | Strain at Flexural Strength % | Bending Modulus (GPa) | ||
| Fiber Orientation ± 45° Samples | ||||||
| 1 | 3.03 | 74 | 45 | 165 | 0.487 | 71 |
| 2 | 3.03 | 74 | 44 | 164 | 0.506 | 64 |
| 3 | 3.03 | 71 | 42 | 155 | 0.501 | 73 |
| 4 | 3.01 | 70 | 39 | 151 | 0.502 | 67 |
| 5 | 2.98 | 69 | 35 | 147 | 0.448 | 69 |
| 6 | 2.97 | 66 | 34 | 143 | 0.459 | 68 |
| 7 | 2.99 | 68 | 39 | 144 | 0.472 | 68 |
| 8 | 3.00 | 68 | 41 | 145 | 0.469 | 69 |
| 9 | 2.99 | 69 | 41 | 155 | 0.462 | 74 |
| 10 | 2.97 | 67 | 40 | 152 | 0.449 | 75 |
| Mean ± SD | 3.00 ± 0.03 | 70 ± 3 | 40 ± 3.4 | 152 ± 8 | 0.476 ± 0.022 | 70 ± 3 |
| 11 | 2.98 | 69 | 42 | 155 | 0.516 | 62 |
| 12 | 2.97 | 69 | 42 | 156 | 0.511 | 67 |
| 13 | 2.97 | 69 | 42 | 156 | 0.524 | 65 |
| 14 | 2.98 | 69 | 43 | 151 | 0.487 | 65 |
| 15 | 2.96 | 68 | 42 | 153 | 0.508 | 67 |
| Mean ± SD | 2.97 ± 0.01 | 69 ± 1 | 42 ± 0.3 | 154 ± 2 | 0.509 ± 0.014 | 65 ± 2 |
| Fiber Orientation 0/90° Samples | ||||||
| 1 | 3.00 | 98 | 26 | 390 | 0.498 | 100 |
| 2 | 3.00 | 97 | 24 | 302 | 0.379 | 97 |
| 3 | 2.99 | 97 | 24 | 282 | 0.337 | 95 |
| 4 | 2.99 | 97 | 24 | 311 | 0.369 | 102 |
| 5 | 3.00 | 98 | 25 | 340 | 0.387 | 100 |
| 6 | 3.00 | 97 | 25 | 336 | 0.391 | 96 |
| 7 | 3.00 | 98 | 25 | 335 | 0.381 | 97 |
| 8 | 2.99 | 98 | 26 | 406 | 0.540 | 101 |
| 9 | 2.99 | 99 | 26 | 391 | 0.538 | 100 |
| 10 | 3.00 | 98 | 26 | 396 | 0.568 | 96 |
| Mean ± SD | 3.00 ± 0.01 | 97 ± 1 | 25 ± 0.9 | 349 ± 44 | 0.439 ± 0.087 | 98 ± 3 |
| 11 | 2.98 | 96 | 26 | 398 | 0.590 | 94 |
| 12 | 2.96 | 94 | 25 | 387 | 0.548 | 94 |
| 13 | 2.96 | 94 | 25 | 386 | 0.596 | 90 |
| 14 | 2.98 | 96 | 26 | 354 | 0.504 | 92 |
| 15 | 2.97 | 95 | 26 | 382 | 0.545 | 97 |
| Mean ± SD | 2.97 ± 0.01 | 95 ± 1 | 25 ± 0.4 | 381 ± 16 | 0.557 ± 0.038 | 93 ± 3 |
| Fiber Orientation ± 45° Samples | Fiber Orientation 0/90° Samples | ||
|---|---|---|---|
| Specimen No. | Calc. Pore Volume, % | Specimen No. | Calc. Pore Volume, % |
| 1 | 0.23 | 9 | 0.07 |
| 2 | 0.39 | 10 | 0.17 |
| 5 | 0.28 | 3 | 0.38 |
| 6 | 0.25 | 4 | 0.08 |
| Linear Regression R2/ANOVA F-Values | E-Modulus | G-Modulus | Flexural Strength | Strain at Flexural Strength |
|---|---|---|---|---|
| ±45° Samples | 0.363/4.557 * | 0.853/46.252 | 0.423/5.873 | 0.257/2.773 * |
| 0/90° Samples | 0.108/0.969 * | 0.650/14.853 | 0.501/8.063 | 0.733/21.947 |
Publisher’s Note: MDPI stays neutral with regard to jurisdictional claims in published maps and institutional affiliations. |
© 2021 by the authors. Licensee MDPI, Basel, Switzerland. This article is an open access article distributed under the terms and conditions of the Creative Commons Attribution (CC BY) license (https://creativecommons.org/licenses/by/4.0/).
Share and Cite
Roßdeutscher, J.; Mechnich, P.; Flucht, F.; Shi, Y.; Jemmali, R. Mechanical and Microstructural Assessment of Inhomogeneities in Oxide Ceramic Matrix Composites Detected by Air-Coupled Ultrasound Inspection. J. Compos. Sci. 2021, 5, 286. https://0-doi-org.brum.beds.ac.uk/10.3390/jcs5110286
Roßdeutscher J, Mechnich P, Flucht F, Shi Y, Jemmali R. Mechanical and Microstructural Assessment of Inhomogeneities in Oxide Ceramic Matrix Composites Detected by Air-Coupled Ultrasound Inspection. Journal of Composites Science. 2021; 5(11):286. https://0-doi-org.brum.beds.ac.uk/10.3390/jcs5110286
Chicago/Turabian StyleRoßdeutscher, Jan, Peter Mechnich, Ferdinand Flucht, Yuan Shi, and Raouf Jemmali. 2021. "Mechanical and Microstructural Assessment of Inhomogeneities in Oxide Ceramic Matrix Composites Detected by Air-Coupled Ultrasound Inspection" Journal of Composites Science 5, no. 11: 286. https://0-doi-org.brum.beds.ac.uk/10.3390/jcs5110286