1. Introduction
Adoption of polymer matrix carbon fiber composite materials in high volume applications (such as automotive applications) is not widespread and the rate of adoption has been slow. This is partly because of their higher costs compared to traditional materials (specifically the cost of the carbon fibers). Carbon fiber manufacturing can be split into 3 major steps: making the polyacrylonitrile (PAN) precursor, stabilization in air, and carbonization in an inert environment [
1]. The PAN precursor is made from crude oil, which is refined and filtered (into dope), and coagulated in a specialized coagulation bath [
2]. This precursor then undergoes stabilization in air by applying tension to the precursor at a temperature between 200 and 300 °C for about 2 h [
1]. This is followed by carbonization in an inert environment, usually
, also under tension, but at an elevated temperature between 1000 and 1700 °C, followed by an additional carbonization step (also in an inert environment) at 2500–3000 °C [
1]. The most expensive part of this process is the cost of the precursor fiber, which makes up 53% of the total cost of the carbon fiber, followed by the carbonization step, which makes up 24% of the total cost of the carbon fiber [
3].
Work has been done to lower the cost of the precursor and the carbonization steps while retaining as much strength in the carbon fiber as possible. Decreasing the solvent content in the coagulation bath [
4], lowering the pH level [
5] and the temperature [
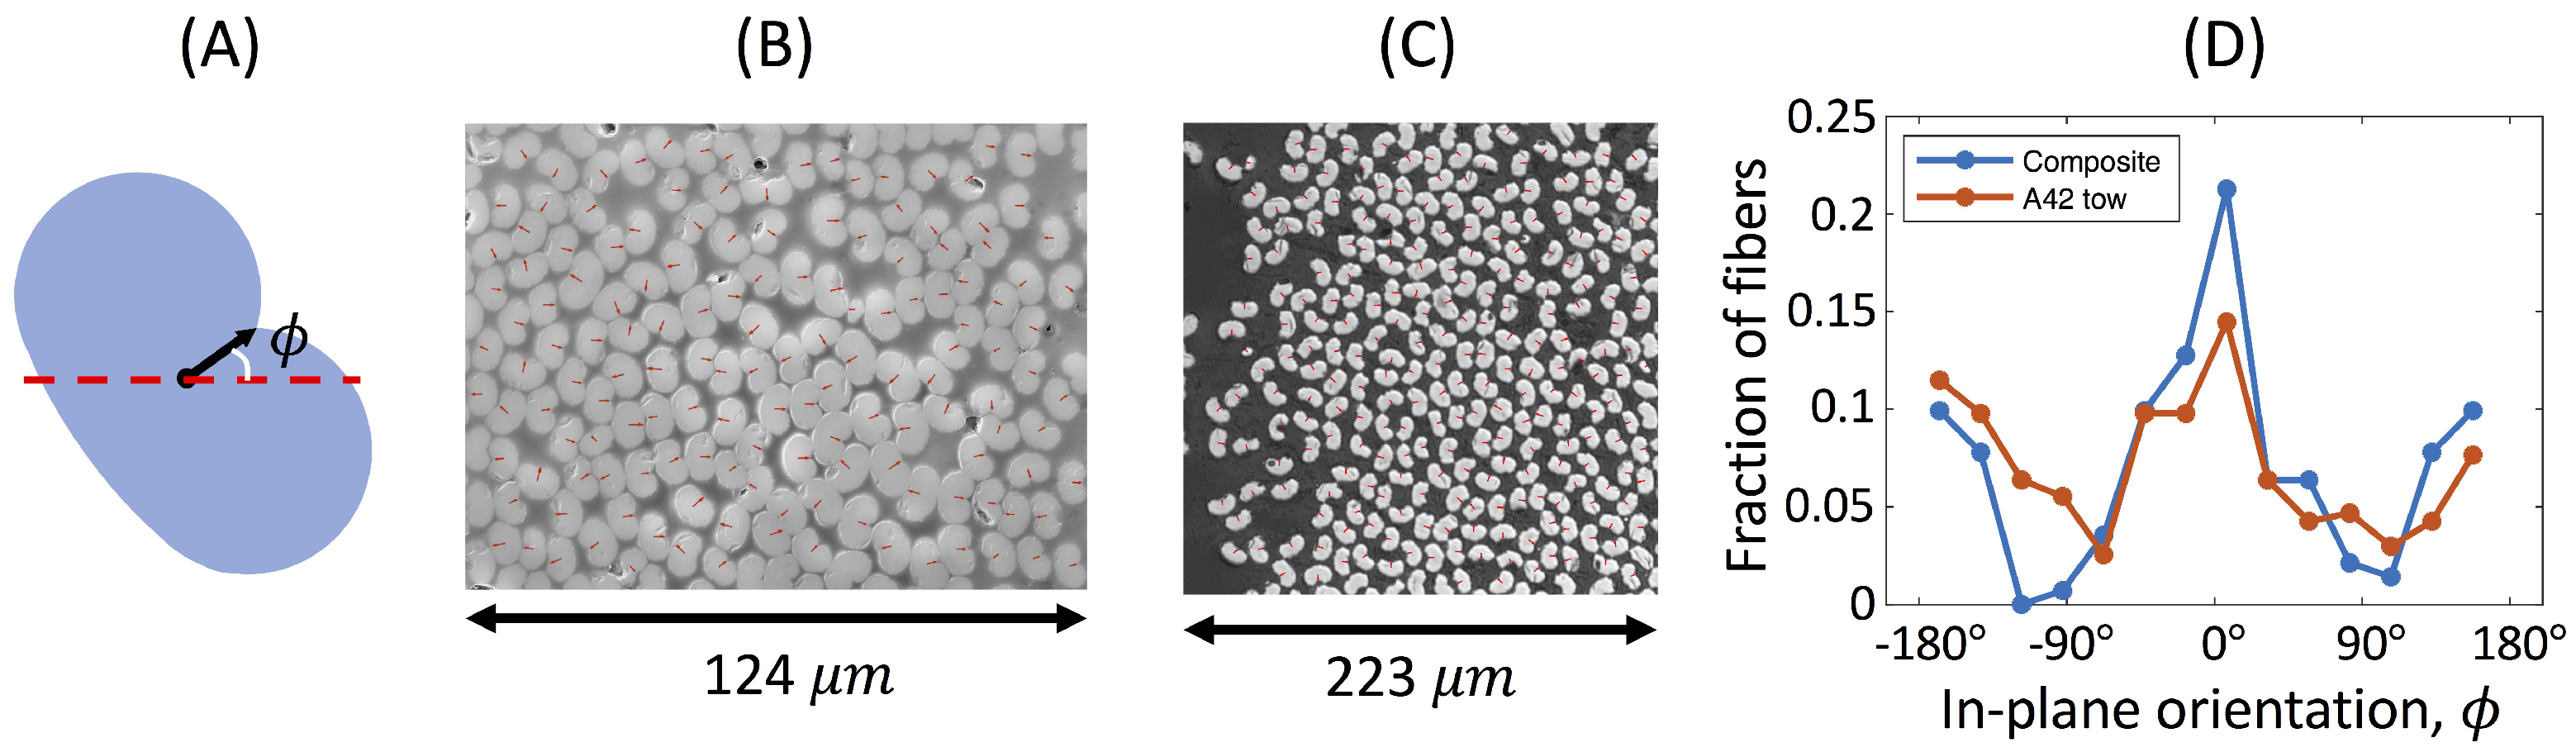
6] of the coagulation bath, all lower the cost of the precursor production by increasing the mass transfer rate in the coagulation bath, resulting in faster precursor production. However, the increased mass transfer produces a fiber with an irregular cross-section, sometimes referred to as bean-shaped (an example can be seen in
Figure 1A). This shape is a result of an instability at the surface of the precursor due to the high mass transfer rate, causing a collapse at one point (hence the bean-shape and the inner corner).
Unfortunately lower cost precursors have higher traditional carbonization costs due to their molecular structure [
2,
7]. Researchers at Oak Ridge National Laboratory created novel techniques for reducing the carbonization costs of low cost precursors. Specifically, unique chemical baths and pre-treatments were used to lower the required temperature (thereby reducing operational costs) as well as developing a microwave assisted plasma carbonization technique [
8]. Through these innovations, carbon fiber strengths in excess of 2.5 GPa and moduli of 220 GPa have been achieved using low cost precursors and carbonization processes [
8].
Composites made with carbon fibers which have a bean-shaped cross-section have been used in the Ford Fusion B-pillar [
9]. The composite material system, which used A42 carbon fibers and a P6300 epoxy matrix, was reported to have an ultimate stress (bulk) of 1568 MPa, with the P6300 epoxy system designed specifically to aid in high volume production (due to its ease in processing). As lower cost composite materials grow in their use, it becomes important to understand their micromechanical behaviors in order to predict their failure modes for component lifing. Computational tools have been shown to be very useful in this, such as the use of periodic representative volume elements to study the effect of fiber shape [
10]. Additionally, researchers have shown that the extended finite element method can be useful in computing the transverse homogenized elastic constants [
11]. The realm of virtual material design has enabled the computational analysis of highly complex fiber cross-sections [
12].
While work has been done to explore the transverse properties of composites with irregular fibers, the effect of the fiber cross-section on the longitudinal micromechanical properties remains unknown, especially for bean-shaped fiber cross-sections. Therefore, this work analyzed the microstructure of an A42/P6300 composite material using finite element analysis (FEA) simulations, which were used to compare the longitudinal micromechanical behavior to a typical aerospace carbon fiber (T650) microstructure, which contains circular cross-section carbon fibers. Through the analysis of the microstructure, a definition of the in-plane angle for the bean-shaped fibers has been proposed, and shown to be effective in capturing the distribution of the in-plane orientation.
2. Material and Methods
The material studied in this work was a unidirectional A42/P6300 composite, which was manufactured using resin transfer molding at the MDLab in the Indiana Manufacturing Institute. The finished component was sectioned, polished, and inspected using scanning electron microscopy (SEM), where the SEM image can be seen in
Figure 1B. Additionally, an A42 fiber bundle (prior to resin transfer) was inspected using SEM for comparison (
Figure 1C). This was also conducted at the MDLab, and required the fibers to be loosely adhered together using a quick-setting adhesive, followed by polishing and SEM imaging to examine the fibers, as can be seen in
Figure 1C.
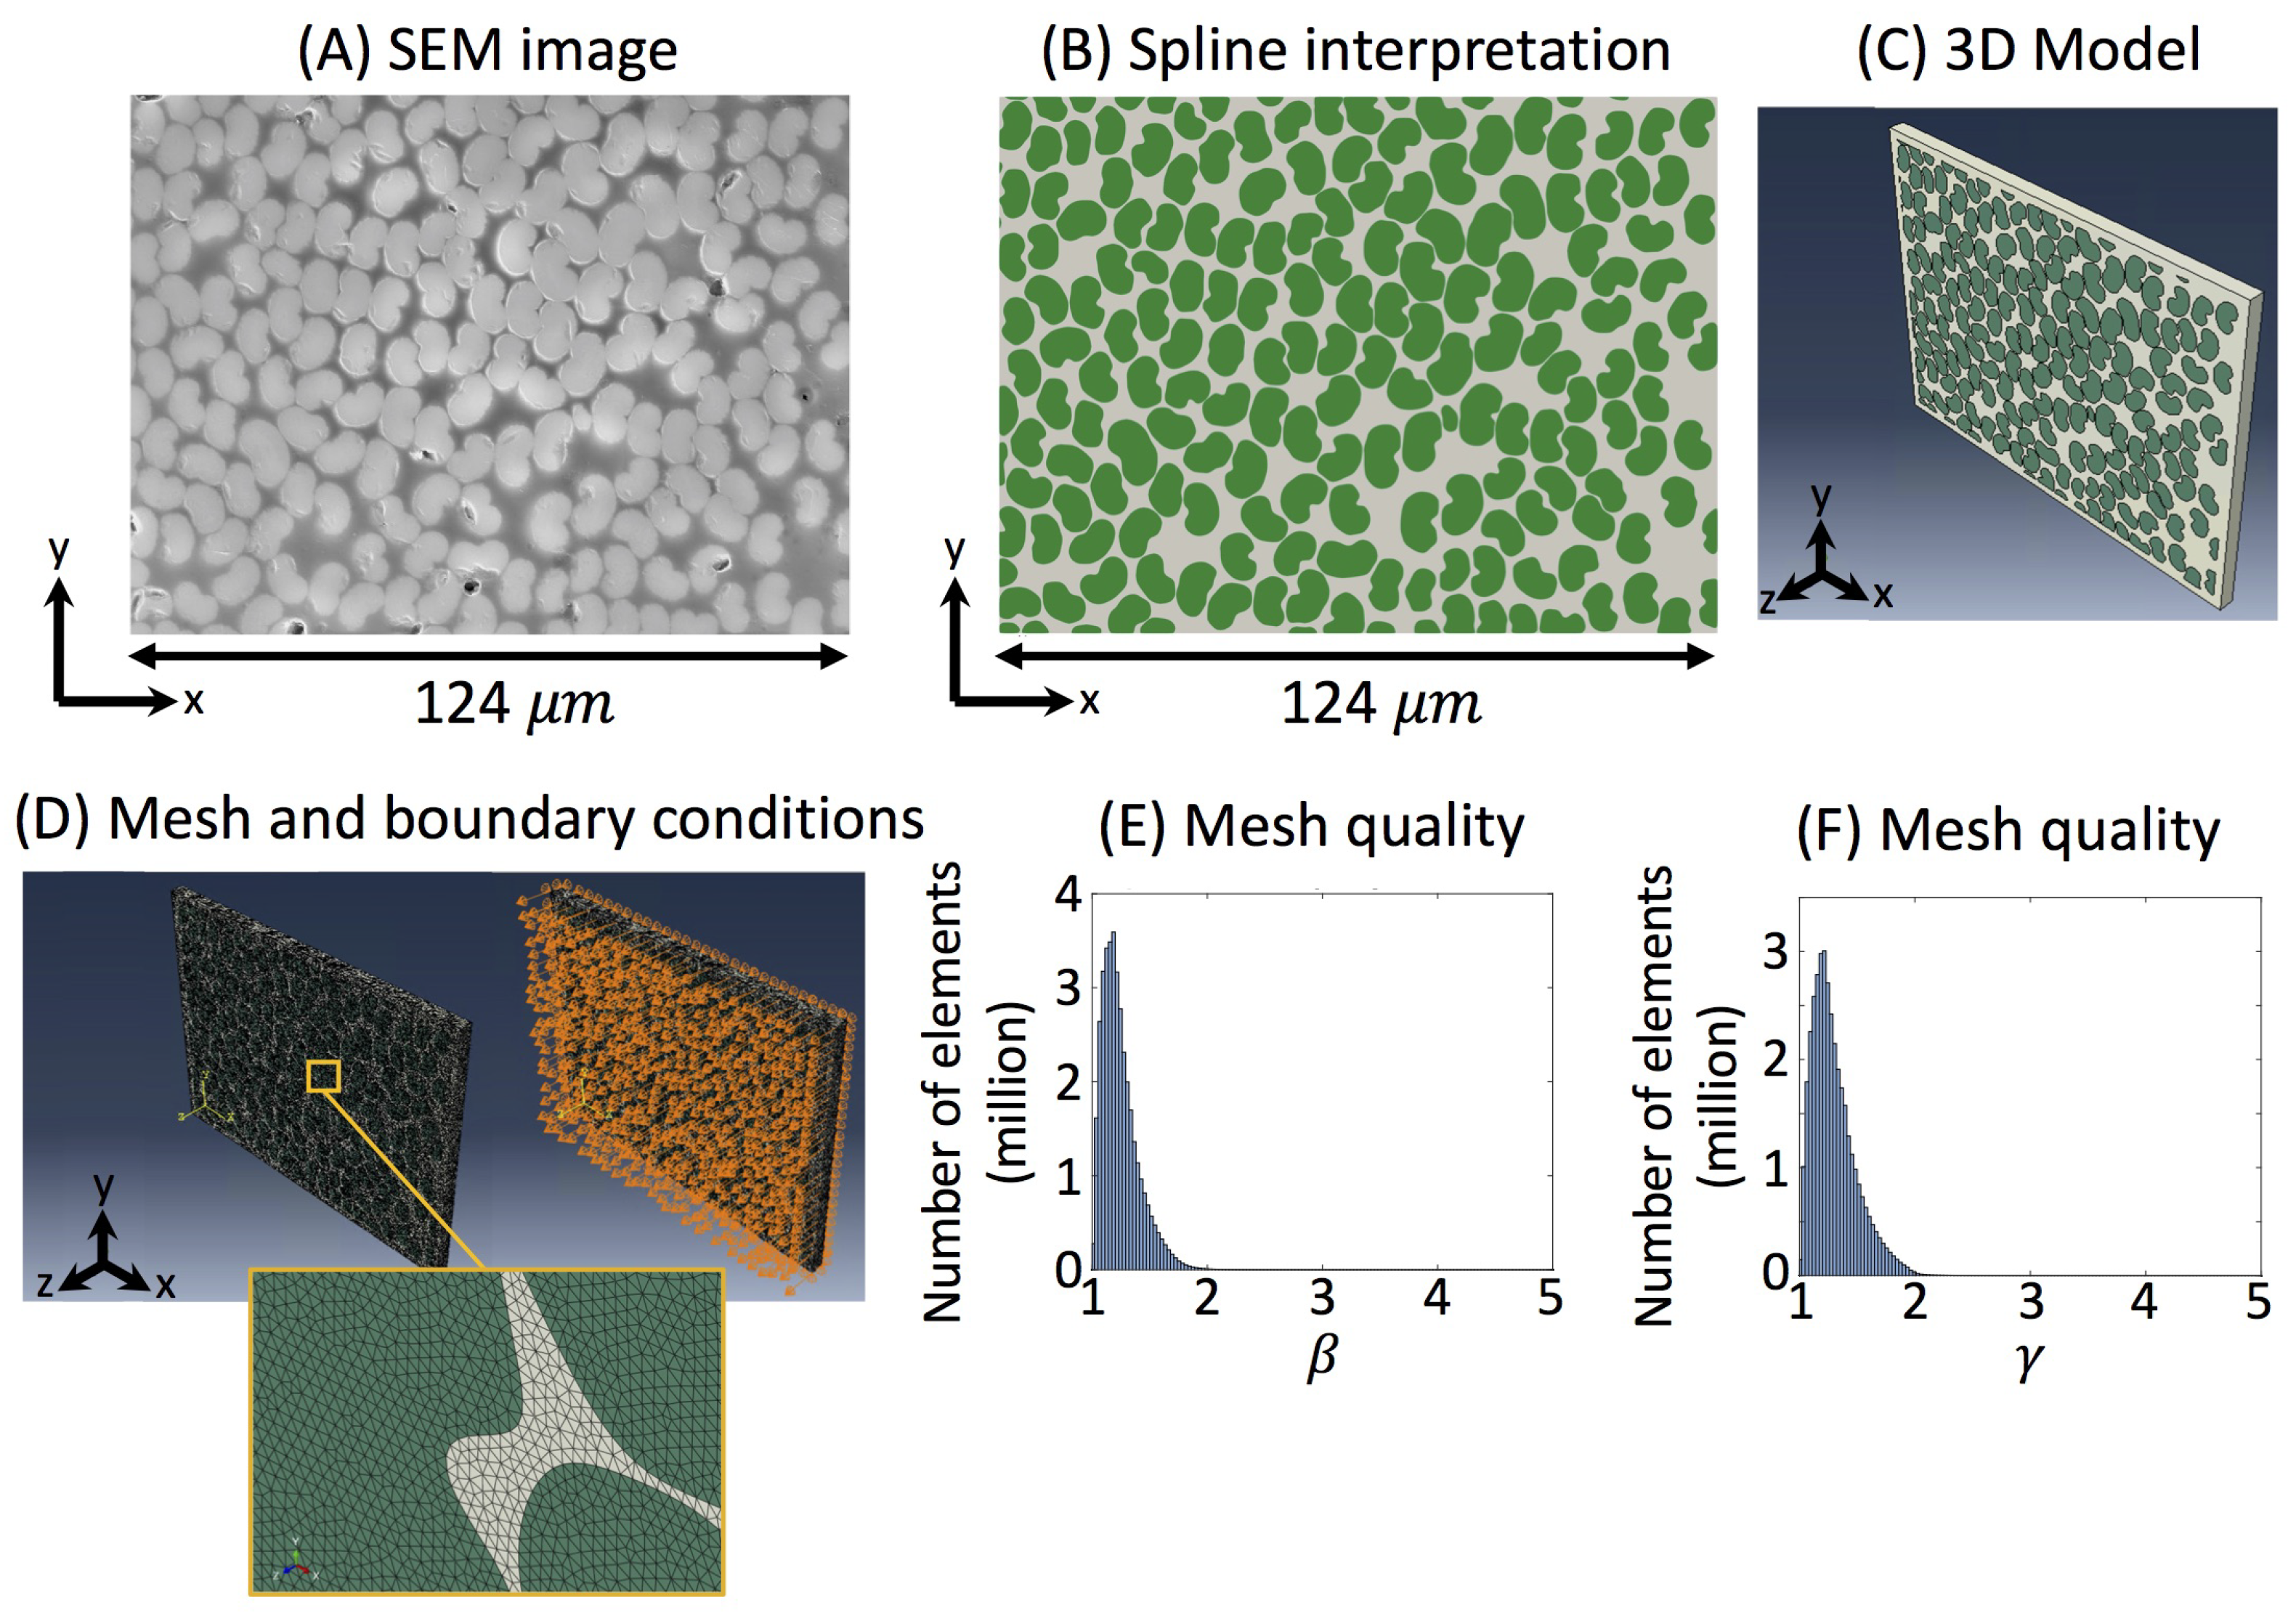
The SEM image of the A42/P6300 composite (
Figure 2A) was post-processed using a series of image processing steps. First, Weka segmentation was used, which is a machine learning image segmentation plug-in within Fiji [
13]. Specifically, through point-and-click training, the Weka module was used to segment the pixels of the fibers and the matrix from the SEM image. Next, a watershed based method [
14,
15] (implemented in Matlab) was used to separate fiber features which were touching. Finally, ModLayer was used to validate the segmentation, and correct any instances of over- or under-segmentation [
16], resulting in a segmented image, as can be seen in
Figure 2B, where the fiber area fraction was found to be 65%.
Virtual microstructures (for the unidirectional fiber composites) were generated to explore varying distributions of fibers, as well as a statistically equivalent microstructures, where the fiber volume fraction and the fiber size distribution could be user-controlled to match across all microstructures. Specifically, a computer generated A42/P6300 microstructure (with random in-plane orientations) was created, as well as a statistically equivalent T650/P6300 microstructure (which had circular cross-section fibers). In order to accomplish this, a Matlab fiber packing algorithm was created that uses a template fiber (which can be either a bean-shaped A42 cross-section or a circular cross-section) to generate the microstructure of interest, where the template fiber could be iteratively processed and placed in the 2D model. This is similar to the procedure used by Gao et al. [
17], however this work used a bean-shaped fiber as a template (where a representative fiber was chosen from the SEM image as the template fiber).
In the computer generated microstructures, the variations in fiber size (cross-sectional area) as well as the in-plane orientation was implemented by providing the algorithm a specific desired distribution (in the form of a histogram) of fiber size and in-plane orientation. The algorithm then iteratively used the distance transform and a Monte Carlo method to resize, rotate, and place each fiber, while achieving the correct size and orientation distributions and the desired fiber volume fraction (area fraction in 2D).
The microstructures were analyzed using FEA simulations, where each unidirectional fiber microstructure was padded with a 2.5
m matrix buffer, and was extruded by 5
m as can be seen in
Figure 2C. The process involved an automated python script which extracted the boundary pixels of each fiber, then used Abaqus to create a 2D sketch of each fiber boundary using B-splines, followed by 3D extrusion of each fiber. The final 3D microstructure was meshed using tetrahedral elements, and the quality of the mesh was analyzed using
and
, which are geometric parameters that use the radius of a circumscribed sphere for a tetrahedral element,
, the radius of an inscribed sphere for a tetrahedral element,
, the root mean square value of the lengths of an element’s edges,
, and the volume of the tetrahedral element,
V, to compute
and
[
18,
19]:
The mesh quality is shown in
Figure 2E,F, where values of
and
between 1 and 3 are considered good quality elements [
18,
19]. Elements for the fibers and the matrix were assigned isotropic linear elastic properties, with a user-defined material subroutine (UMAT) used for the ultimate strength of each constituent. The elements for the A42 fibers were assigned
GPa,
, and
MPa using an elastic-brittle failure model [
17]. For simulations which used T650 fibers (with circular cross-sections), fiber elements were assigned
GPa,
, and
MPa using an elastic-brittle failure model [
20]. The P6300 matrix elements (matrix used in all three simulations) were assigned
GPa,
, and
MPa using an elastic-brittle failure model, which is representative of P6300 epoxy in tension (as was done in this work) [
17]. The boundary conditions (
Figure 2D) applied to the model were rollers on the -Z, -X, and -Y surfaces, with rollers and a displacement of +0.075
m on the +Z surface (representing a 1.5% elongation, which is the expected elongation to failure) [
9]. The UMAT allowed failure to be detected in either the fibers or the matrix, depending on which elements reached their failure criteria during the simulation.
3. Results and Discussion
Computing fiber orientation from 2D images, even for circular cross-sections, can be very challenging [
15,
21,
22], and studies with bean-shaped fibers used an elliptical cross-sectional approximation [
23]. In this work, the fibers are unidirectional, and therefore the out-of-plane orientation is 0°. For a circular cross-section fiber, the in-plane orientation would therefore be trivial. However, this is not the case for the bean-shaped cross-sections studied in this work. A definition is proposed in this work for the in-plane angle,
, as the angle of the vector pointing from the centroid of the cross-section, to the collapsed surface point (referred to as the inner corner) as has been shown in
Figure 1A. A Matlab algorithm which isolated the boundary pixels of each fiber cross-section was used to compute this vector for each fiber in the segmented and post-processed SEM image of the A42/P6300 composite, in order to compute the distribution of the in-plane orientations. It was found that the in-plane orientation of the fibers of the analyzed image was not random, and instead contained peaks at
, as can be seen in
Figure 1D. A fiber bundle (prior to resin infusion) which was inspected using SEM (
Figure 1C) and processed through the same procedure (to compute all in-plane angles) showed a matching distribution (
Figure 1D). This implies that the in-plane orientation of the fibers is not a byproduct of the resin transfer molding, but is inherent to the fiber tow. Optimizing or altering this in-plane orientation distribution would therefore require altering the processes by which the fibers are rolled and packaged.
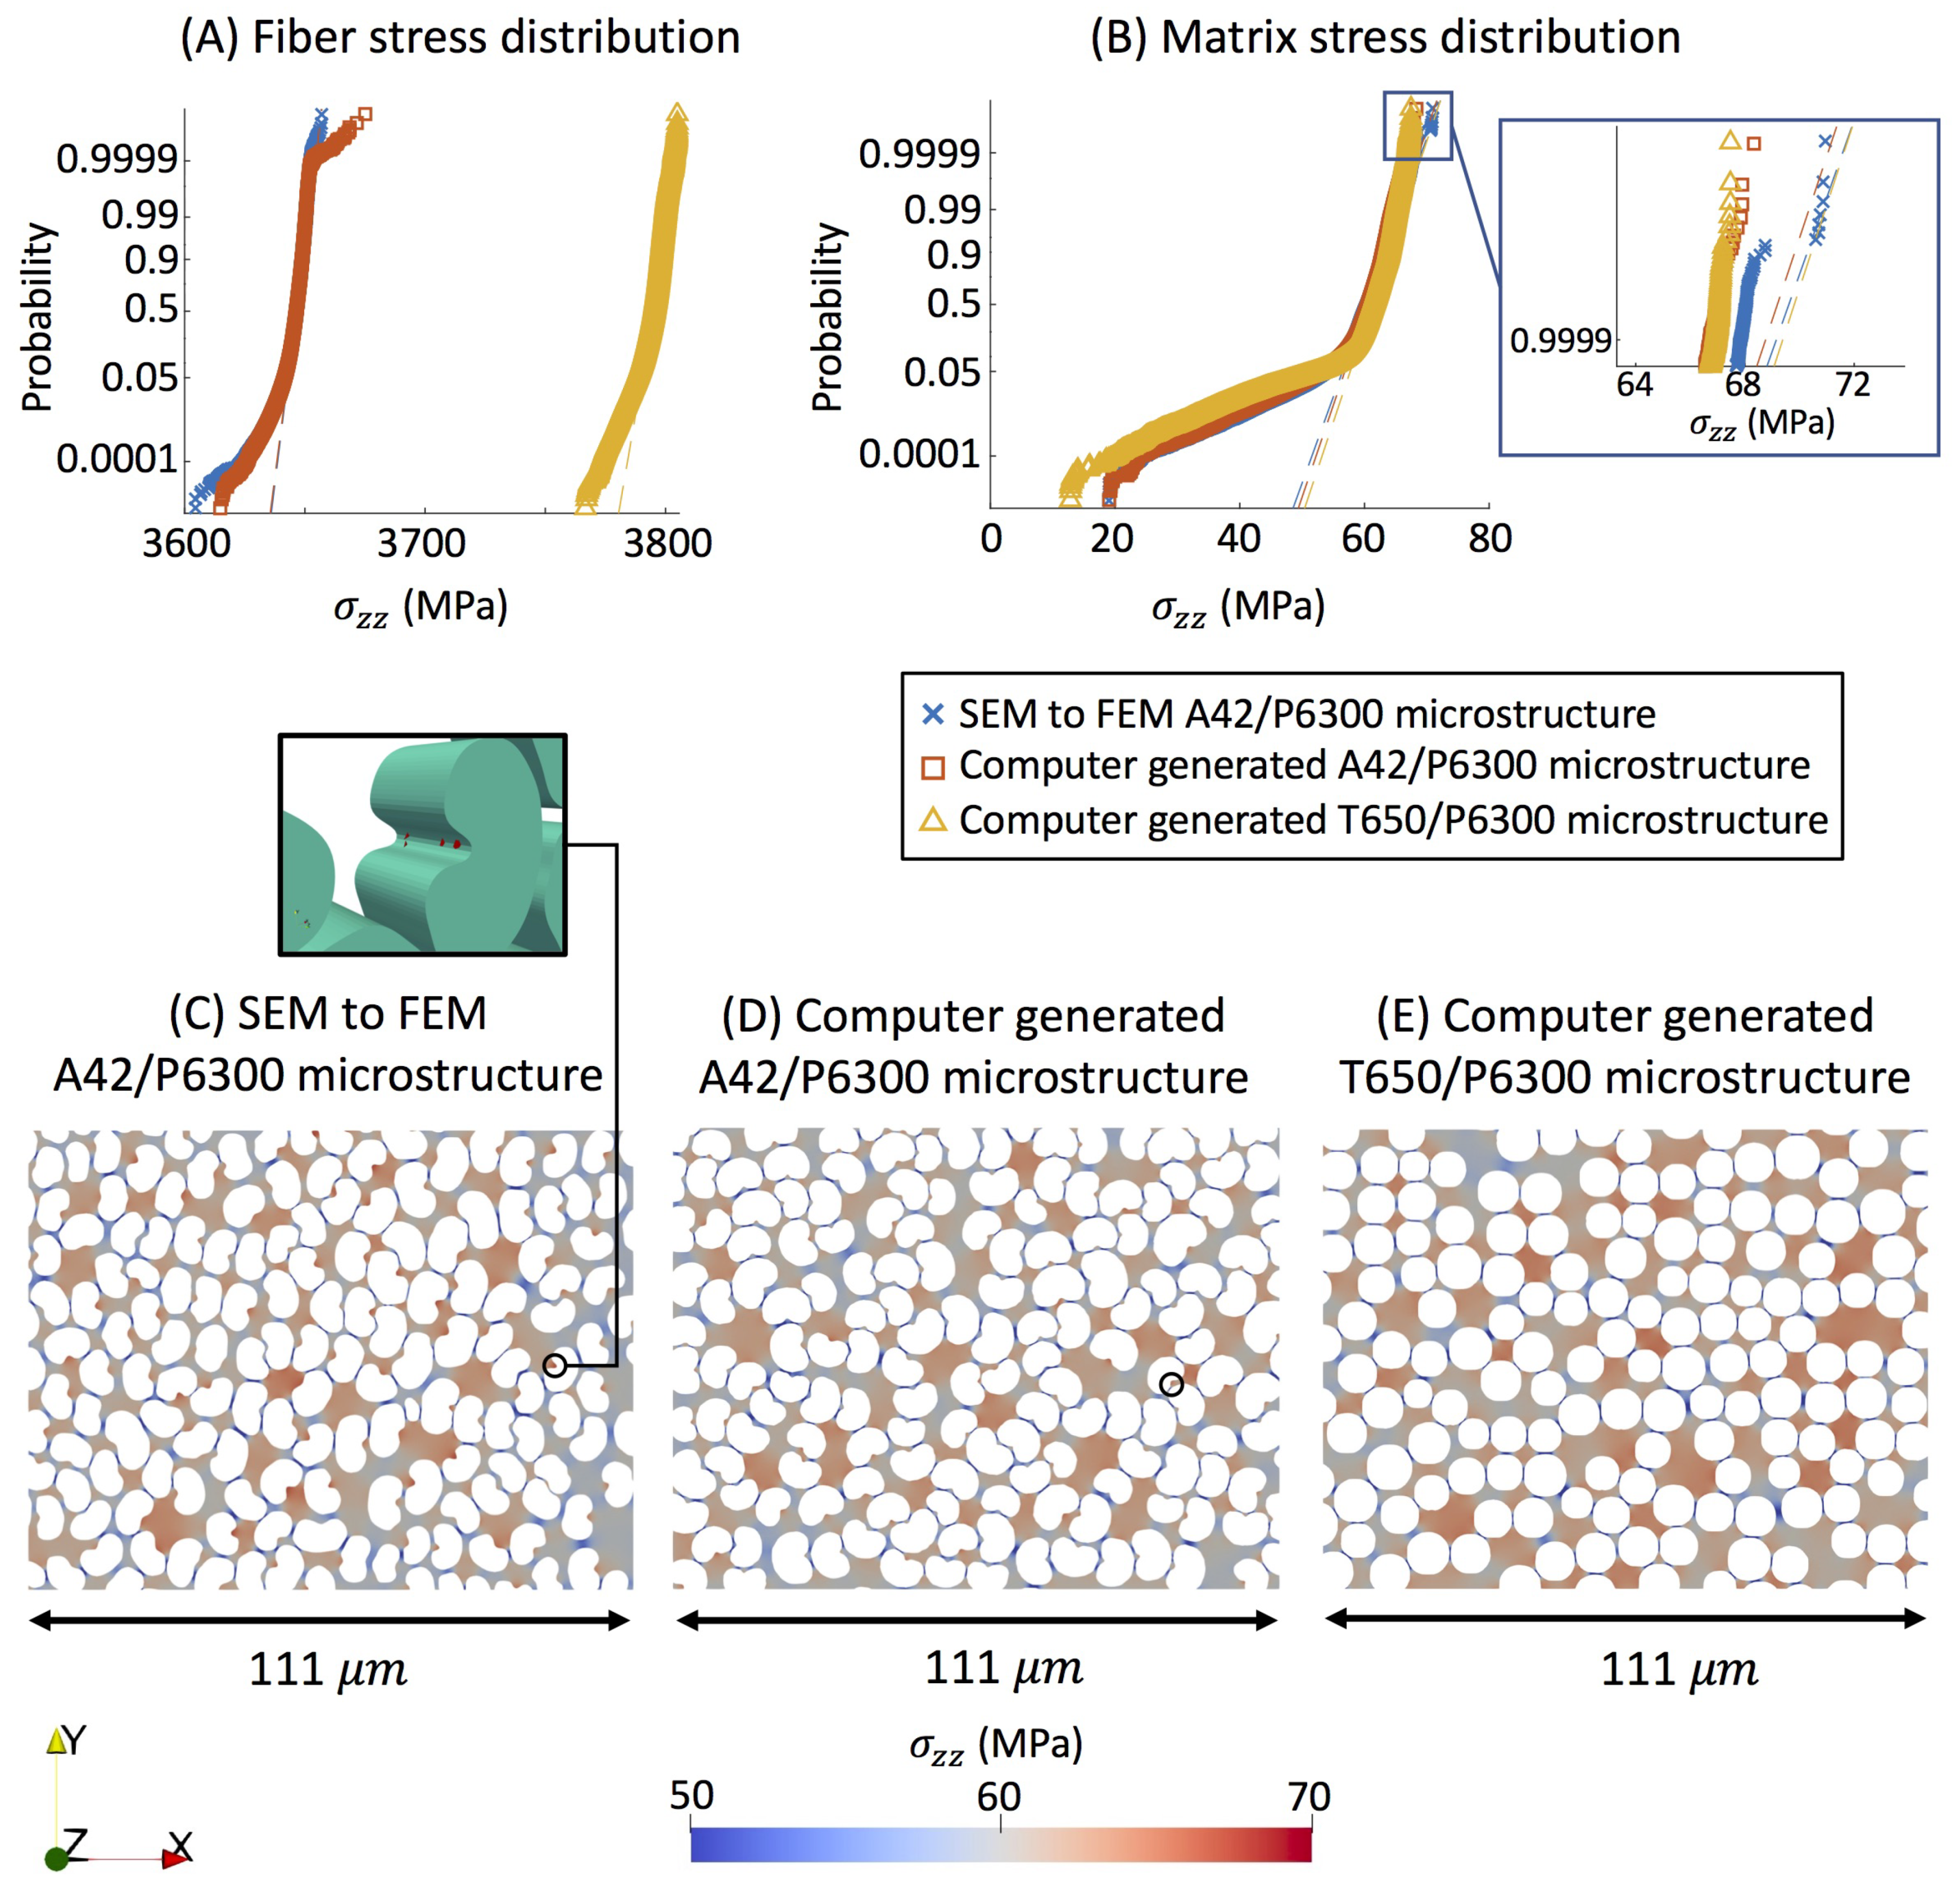
FEA analyses were performed on three microstructures: (i) A42 fibers instantiated from the SEM image (where
showed peaks at
), (ii) statistically equivalent A42 fibers (with random
, but equivalent volume fraction and fiber size distribution), and (iii) statistically equivalent T650 cylindrical fibers (with equivalent volume fraction and fiber size distribution). The stresses in the fibers are compared in
Figure 3A, and the stresses in the polymer matrix are compared in
Figure 3B, using a probability plot. Each probability plot shows a dashed line which represents a theoretical normal distribution. This can be useful for exploring the extremes of a distribution, which was important in this work which used a maximum stress failure criteria. It was found that the SEM to FEM A42 microstructural stress distributions aligned well with the computer generated A42 microstructural stresses. However, the random in-plane orientations of the computer generated A42 microstructure, as well as the use of a cross-sectional fiber template (where fiber curvature was more uniform across all fibers) resulted in higher extreme values of stress in the fibers, which can be seen in
Figure 3A. This appears to have alleviated the matrix stresses in the computer generated A42/P6300 microstructure, and transferred more load to the fibers. There exists an opportunity to increase load transfer from the matrix to the fibers (and thereby load bearing capability) by optimizing fiber production processes to tailor the curvature of all fibers in a given microstructure and their in-plane orientations.
The SEM to FEM A42/P6300 microstructure was simulated to reach failure (at a local point within the matrix) at an average bulk stress of 2108 MPa. The location of failure, which was simulated and computed using the Abaqus UMAT, was found at the inner corner of a fiber near a resin-rich area, as can be seen in
Figure 3C. In contrast, the location of failure in the computer generated A42/P6300 microstructure (with random
) is shown in
Figure 3D, also at a fiber’s inner corner but at a region of closely packed fibers (fiber agglomeration). This shows that the morphology of the bean-shaped fibers will likely initiate microstructural fracture at a fiber’s inner corner, however it is unclear whether resin rich areas or fiber agglomerations are more detrimental. Lastly, this can be compared to the computer generated T650/P6300 microstructure, which sustained an average bulk stress of 2260 MPa and failure was not established in the matrix or fiber elements. This is partly due to the slightly higher stiffness of a T650 fiber (which is 4% stiffer), as well as its uniform circular cross-section.
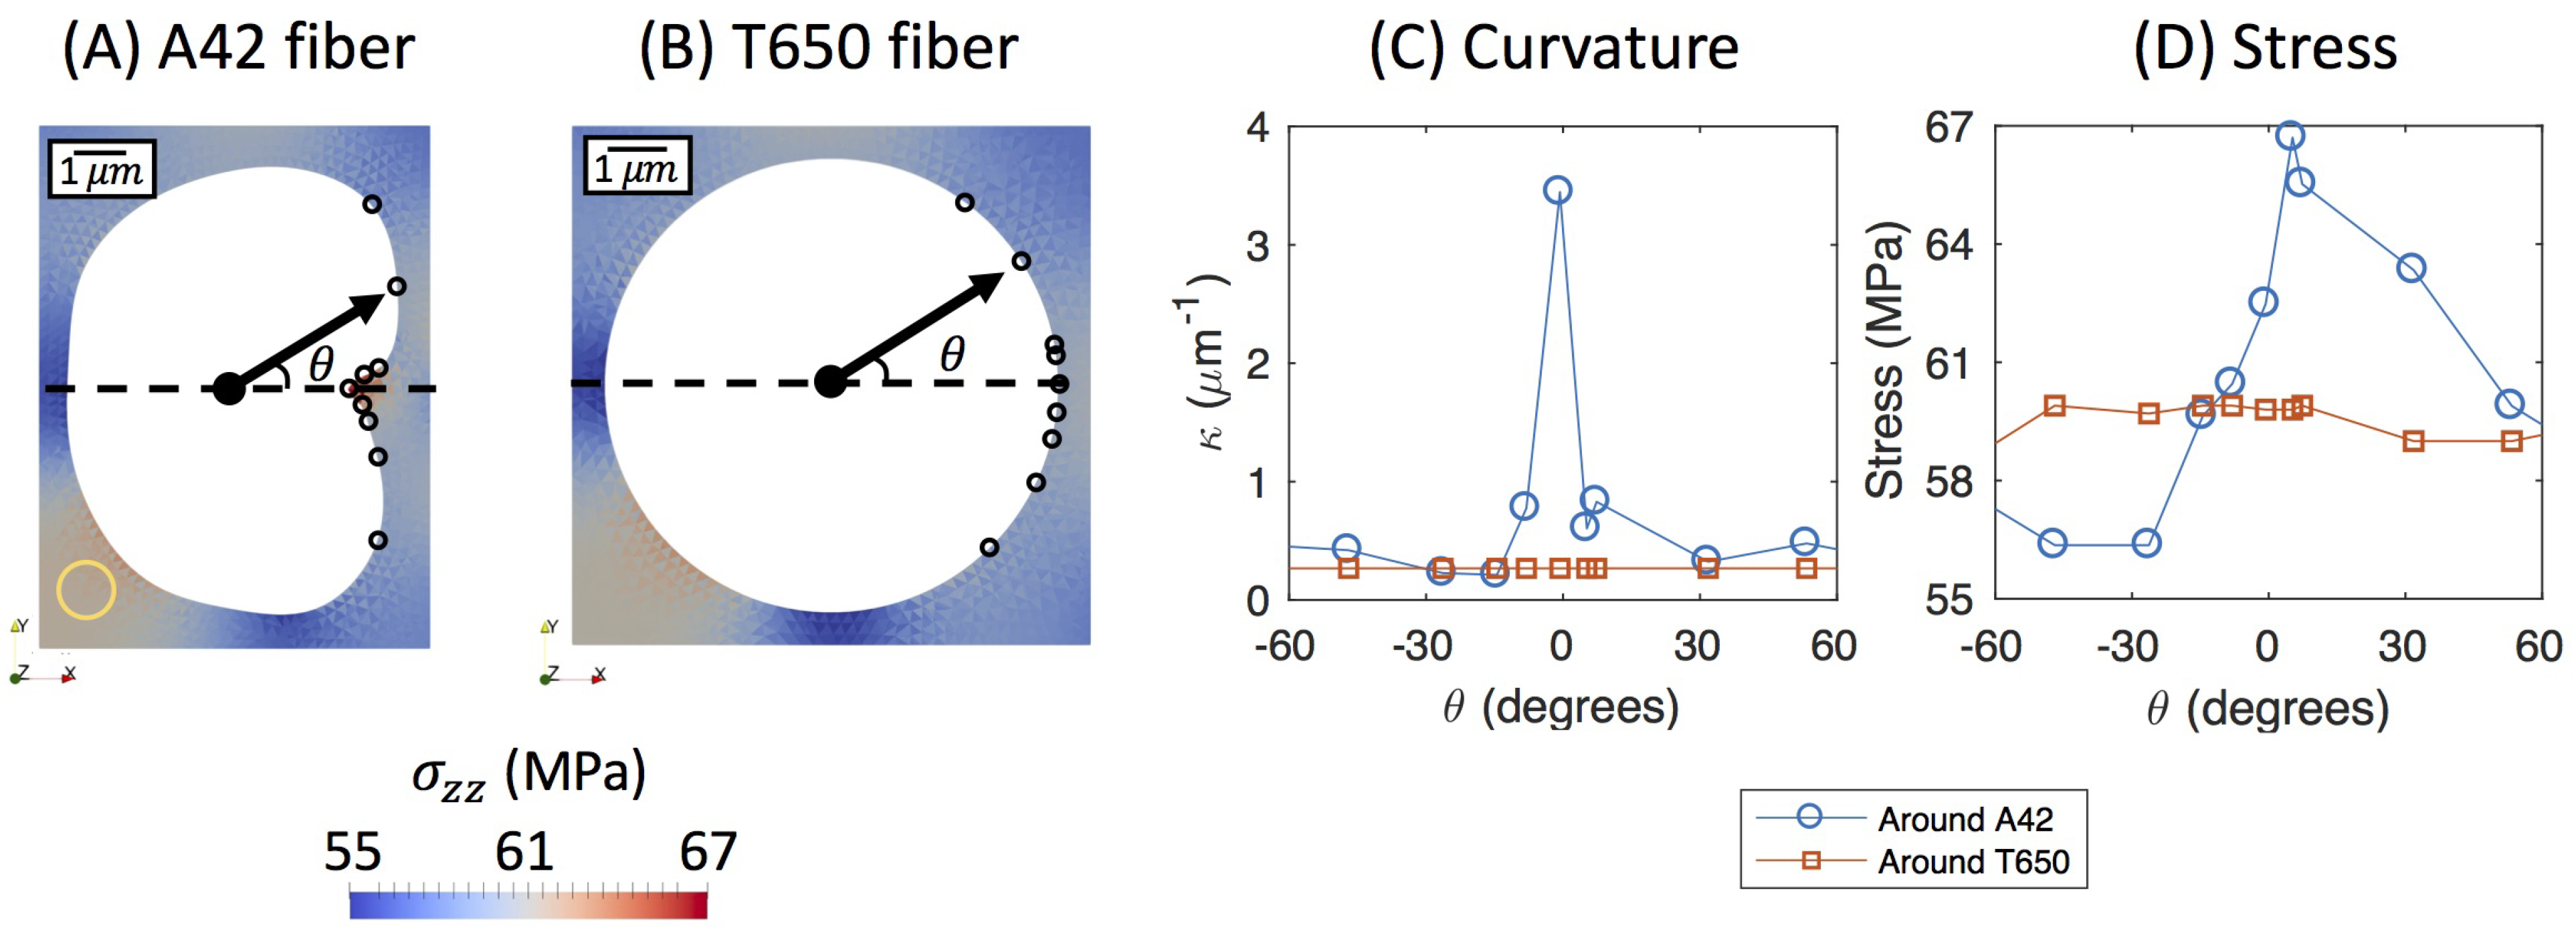
In order to study the specific effect of the A42 fiber curvature, a single fiber representative volume element was analyzed, as shown in
Figure 4. A representative A42 fiber cross-section was used to generate the model in
Figure 4A, and a circular cross-section T650 fiber was used in the statistically equivalent (fiber area and fiber volume fraction) model in
Figure 4B. The models were loaded in the fiber direction with the same boundary conditions discussed in
Section 2, and the stress in the matrix was probed at varying locations around the perimeter of the fiber (specifically focusing on the region of the collapsed surface point or inner corner). The curvature,
, which is the inverse of the radius of curvature at the probed location, can be seen in
Figure 4C, where as expected the A42 fiber had a much higher curvature (3.18
m
higher) than the circular T650 carbon fiber. The corresponding matrix stress has been plotted in
Figure 4D, where it can be seen that the higher curvature in the A42 fiber led to a matrix stress that was 7 MPa higher. This quantifies the contribution of the fiber curvatures leading to higher matrix stresses, and it shows that controlling the degree and uniformity of this curvature could lead to future optimizations in the desired microstructural stress distributions.
It is important to note that this work has examined only the longitudinal (fiber direction) properties. This is partly because other works have examined transverse properties in detail of other irregularly shaped fiber cross-sections [
10,
11,
12]. Additionally, similar types of behavior (in terms of stress concentration) under more complex stress states would be expected, including laminates made of these materials. Any fine-tuning of these properties would hinge on the potential to optimize the microstructure, including the curvature of the fiber cross-sections. Tailoring the curvature of the collapsed surface point of the bean-shaped fibers may require adjustments to the coagulation bath during the precursor production, including possibly developing new chemical treatments that help control the curvature of the collapsed surface point to ensure it is consistent across all precursor fibers. On the other hand, tailoring the in-plane orientation may require mechanical adjustments to the production process, such as modifications to the fiber rolling process, which may prove to be very challenging, since it would require quality inspections of the in-plane orientation of fibers during production. The present study could potentially aid in the design of composites with improved performance, which needs to be balanced with the associated increased production costs. Without any optimizations to the processing, the use of these bean-shaped composites may contribute potential enhancements or benefits, such as the increased surface area contact which could improve fiber-matrix bonding. There remains a need to examine such potential enhancements in the fiber-matrix interface and its impact on potential fiber-matrix debonding.


