Article

Experimental Analysis of Residual Stresses in CFRPs through Hole-Drilling Method: The Role of Stacking Sequence, Thickness, and Defects

1
Institute of Materials Engineering, University of Kassel, Mönchebergstr. 3, 34125 Kassel, Germany
2
Institute of Applied Mechanics, Technical University of Brauschweig, Pockelsstraße 3, 38106 Brauschweig, Germany
3
Institute for Lightweight Design with Hybrid Systems, University of Paderborn, Mersinweg 7, 33100 Paderborn, Germany
*
Author to whom correspondence should be addressed.
J. Compos. Sci. 2022, 6(5), 138; https://0-doi-org.brum.beds.ac.uk/10.3390/jcs6050138
Submission received: 19 March 2022 / Revised: 30 April 2022 / Accepted: 5 May 2022 / Published: 9 May 2022
(This article belongs to the Special Issue Carbon Fiber Composites, Volume II)

Abstract

:
Carbon fiber reinforced plastics (CFRPs) gained high interest in industrial applications because of their excellent strength and low specific weight. The stacking sequence of the unidirectional plies forming a CFRP laminate, and their thicknesses, primarily determine the mechanical performance. However, during manufacturing, defects, e.g., pores and residual stresses, are induced, both affecting the mechanical properties. The objective of the present work is to accurately measure residual stresses in CFRPs as well as to investigate the effects of stacking sequence, overall laminate thickness, and the presence of pores on the residual stress state. Residual stresses were measured through the incremental hole-drilling method (HDM). Adequate procedures have been applied to evaluate the residual stresses for orthotropic materials, including calculating the calibration coefficients through finite element analysis (FEA) based on stacking sequence, laminate thickness and mechanical properties. Using optical microscopy (OM) and computed tomography (CT), profound insights into the cross-sectional and three-dimensional microstructure, e.g., location and shape of process-induced pores, were obtained. This microstructural information allowed for a comprehensive understanding of the experimentally determined strain and stress results, particularly at the transition zone between the individual plies. The effect of pores on residual stresses was investigated by considering pores to calculate the calibration coefficients at a depth of 0.06 mm to 0.12 mm in the model and utilizing these results for residual stress evaluation. A maximum difference of 46% in stress between defect-free and porous material sample conditions was observed at a hole depth of 0.65 mm. The significance of employing correctly calculated coefficients for the residual stress evaluation is highlighted by mechanical validation tests.

1. Introduction

Carbon fiber reinforced plastics (CFRPs), i.e., carbon fiber used as reinforcement elements in a polymer matrix, have found extensive use in the aviation and automotive industries because of their outstanding properties, such as high strength and stiffness, low density, high fatigue resistance as well as low thermal expansion coefficient [1]. However, the laminate characteristics, i.e., the thickness of each ply, fiber orientation, as well as the number of layers, have to be considered carefully for acquiring these excellent mechanical properties in a CFRP laminate. By choosing adequate laminate characteristics, the CFRP’s material properties can be directly tailored. In the past years, a great amount of work has been conducted to improve the mechanical performance of CFRP components, e.g., fatigue resistance [2] and energy absorption capacity [3].
In general, residual stresses are formed in the course of the manufacturing of CFRPs for various reasons. In particular, the differences in the coefficient of thermal expansion (CTE) between the carbon fibers and the resin system, the differences in the mechanical properties arising from variation in the fiber orientation, and the cure shrinkages of the resin are of utmost importance [4,5]. The process-induced residual stresses, in turn, can cause fiber waviness, transverse cracking, delamination, and geometric distortion. Moreover, process-induced pores have to be considered in the CFRPs, as they can have a significant influence on the mechanical performance of a wide range of composite materials [6]. The formation of pores in the manufacturing of CFRPs is a complex phenomenon, and some of the involved elementary processes are still not well understood. The underlying mechanisms vary from manufacturing process to manufacturing process because of the differences in thermodynamic and rheological phenomena [7]. Taking the pre-preg process technology as an example, the formation of pores is mainly induced by an insufficient curing process, air entrapment either during impregnation or during laying up, and moisture dissolved in the resin [7]. For further details on pore formation mechanisms in different CFRPs manufacturing processes and the effect on the mechanical performance, the reader is referred to [7].
The determination of residual stresses in CFRPs using robust experimental approaches paves the way not only for optimizing the manufacturing parameters in order to reduce residual stresses but also for a damage-tolerant design by exploiting residual stresses instead of increasing safety margins and overall dimensions (resulting in cost and weight increase), respectively. In the past years, several methods have been developed for measuring residual stresses in CFRP components [8]. One commonly used method is to estimate the residual stresses from the experimentally determined curvature of a structure through a simplified model. However, this method can only be used for unsymmetric CFRP composites. Moreover, this approach cannot provide residual stress values in each individual ply [9]. The layer-removal method is another common technique for analyzing residual stresses, involving the measurement of the curvature following the progressive removal of thin layers from the sample surface [10]. Using this method, evaluation of ply level residual stresses is feasible. However, the complete and precise removal of thin material layers is challenging. Furthermore, this method is limited to flat coupons.
Alternatively, the hole-drilling method (HDM) is a well-known approach for measuring the residual stresses in composites, being capable of providing in-depth residual stress profiles [11]. The HMD has been standardized in ASTM E837-13a [12], specifying measurement procedure and range, minimum requirements of instrumentation, algorithms, and coefficients for the computation of uniform and nonuniform stress distributions, as well as error sources. As described in ASTM E837-13a, the HDM was originally developed for residual stress measurement in isotropic materials, with the assumption that the relaxed strain response has a simple trigonometric form. However, this assumption does not hold true for orthotropic materials. For accurate analysis of the residual stress state in orthotropic materials, such as CFRPs, the standard model [12] has been adapted, as can be seen in [1,11,13].
With respect to approaches for determining the calibration coefficients, the integral method provides more accurate in-depth residual stress results compared with the differential method [14]. The calibration coefficients need to be calculated through finite element analysis (FEA) based on the material type and thickness of the sample. The influence of material properties and thickness of metallic samples on the calculated calibration coefficients and the resulting residual stress values have been reported in recent years [14,15,16]. For instance, in [14], the influence of Poisson’s ratio on the calibration coefficients for the HDM was studied. Depending on the hole depth, it was found that the maximum difference in calibration coefficients for Poisson’s ratios of 0.2 and 0.4, compared with an assumed value of 0.3, can be as high as 17% for individual calibration coefficients. However, an almost ideally linear behavior of the calibration coefficients can be observed within Poisson’s ratio range of 0.2 to 0.45. Magnier et al. [15] calculated the calibration coefficients of metallic sheets featuring different thickness values. Afterward, the coefficients obtained were used for the evaluation of the residual stresses using the HDM. If the real thickness of the samples was not accounted for, pronounced errors were found in that study. In particular, this holds true for thicknesses below 1 mm, while only minor errors were noticed for thicknesses above 1.6 mm. In the ASTM E837 [17], residual stress measurement by the HDM assumes that the drilled hole has a flat bottom geometry. However, the commonly employed cutting tools for the HDM are end mills, which usually have chamfers or fillets on the edges. Therefore, chamfers or fillets are directly transferred to the blind hole bottom geometry. Blödorn et al. [18] calculated calibration coefficients through FEA, considered the real hole geometry, and performed residual stress evaluation for A36 steel, AISI304L stainless steel, and AA6061 aluminum alloy. Considerable differences in residual stresses were found, in particular in the two first hole depth increments with a 50% deviation. Recently, Kümmel et al. [19] adopted the HDM to measure the residual stresses in ultrafine-grained laminated metal composites, where steel layers were positioned at the top and bottom surface of the sample, and an aluminum layer was positioned in the middle. When the aluminum core was not considered for the calculation of the calibration coefficients, assuming that composite is a homogeneous material, the evaluated residual stresses were overestimated by about 50% compared with the model of the actual structure. A very limited number of studies are available in the literature detailing this kind of analysis for composite materials. Sicot et al. [20] measured residual stresses by HDM in [02/902]S and [08] CFRP laminates fabricated by different cure cycles. The calibration coefficients were calculated by considering the real ply stacking sequence. It was found that for unidirectional CFRP laminate, the residual stress level remains low for different cooling conditions, and the influence of cooling conditions on residual stress values is small. With respect to cross ply laminates, it was observed that the cooling conditions have an important effect on the residual stress level, and the stress increases considerably with the cooling rate. The measured residual stresses were compared to those predicted by a thermoviscoelastic approach to the classical theory of laminate. Both results were in good agreement. In other studies [13,21], calibration coefficients for glass/carbon fiber reinforced plastics (GFRP/CFRPs) were calculated based on their real geometry, thickness, and stacking sequence. The relation between the coefficients and the residual stresses was studied. Only when the actual geometry was taken into account the correct calibration coefficients were obtained, as demonstrated by mechanical bending tests in combination with FEA.
In high-tech applications requiring high strength and stiffness and, concomitantly, low weight, thin-walled CFRP laminates with complex stacking sequence are designed and used. Commonly, the manufacturing of CFRP components and structures leads to pores and defects. The objective of this work is to provide a comprehensive study on the residual stress measurement results using HDM, considering the roles of pores, stacking sequence, and thickness. Focus is given to the determination of calibration coefficients, taking into account the aforementioned factors, as well as their influence on the subsequent residual stress estimation. Furthermore, the two- and three-dimensional microstructures of CFRP laminates are characterized, which allows for a thorough understanding of the experimentally determined strain and stress results, in particular at the transition zone between the individual plies. The reliability of the residual stress measurement is validated by mechanical bending tests in combination with FEA. Potentially, this method can be used in the majority of cases concerning composite laminate materials.

2. Materials and Methods

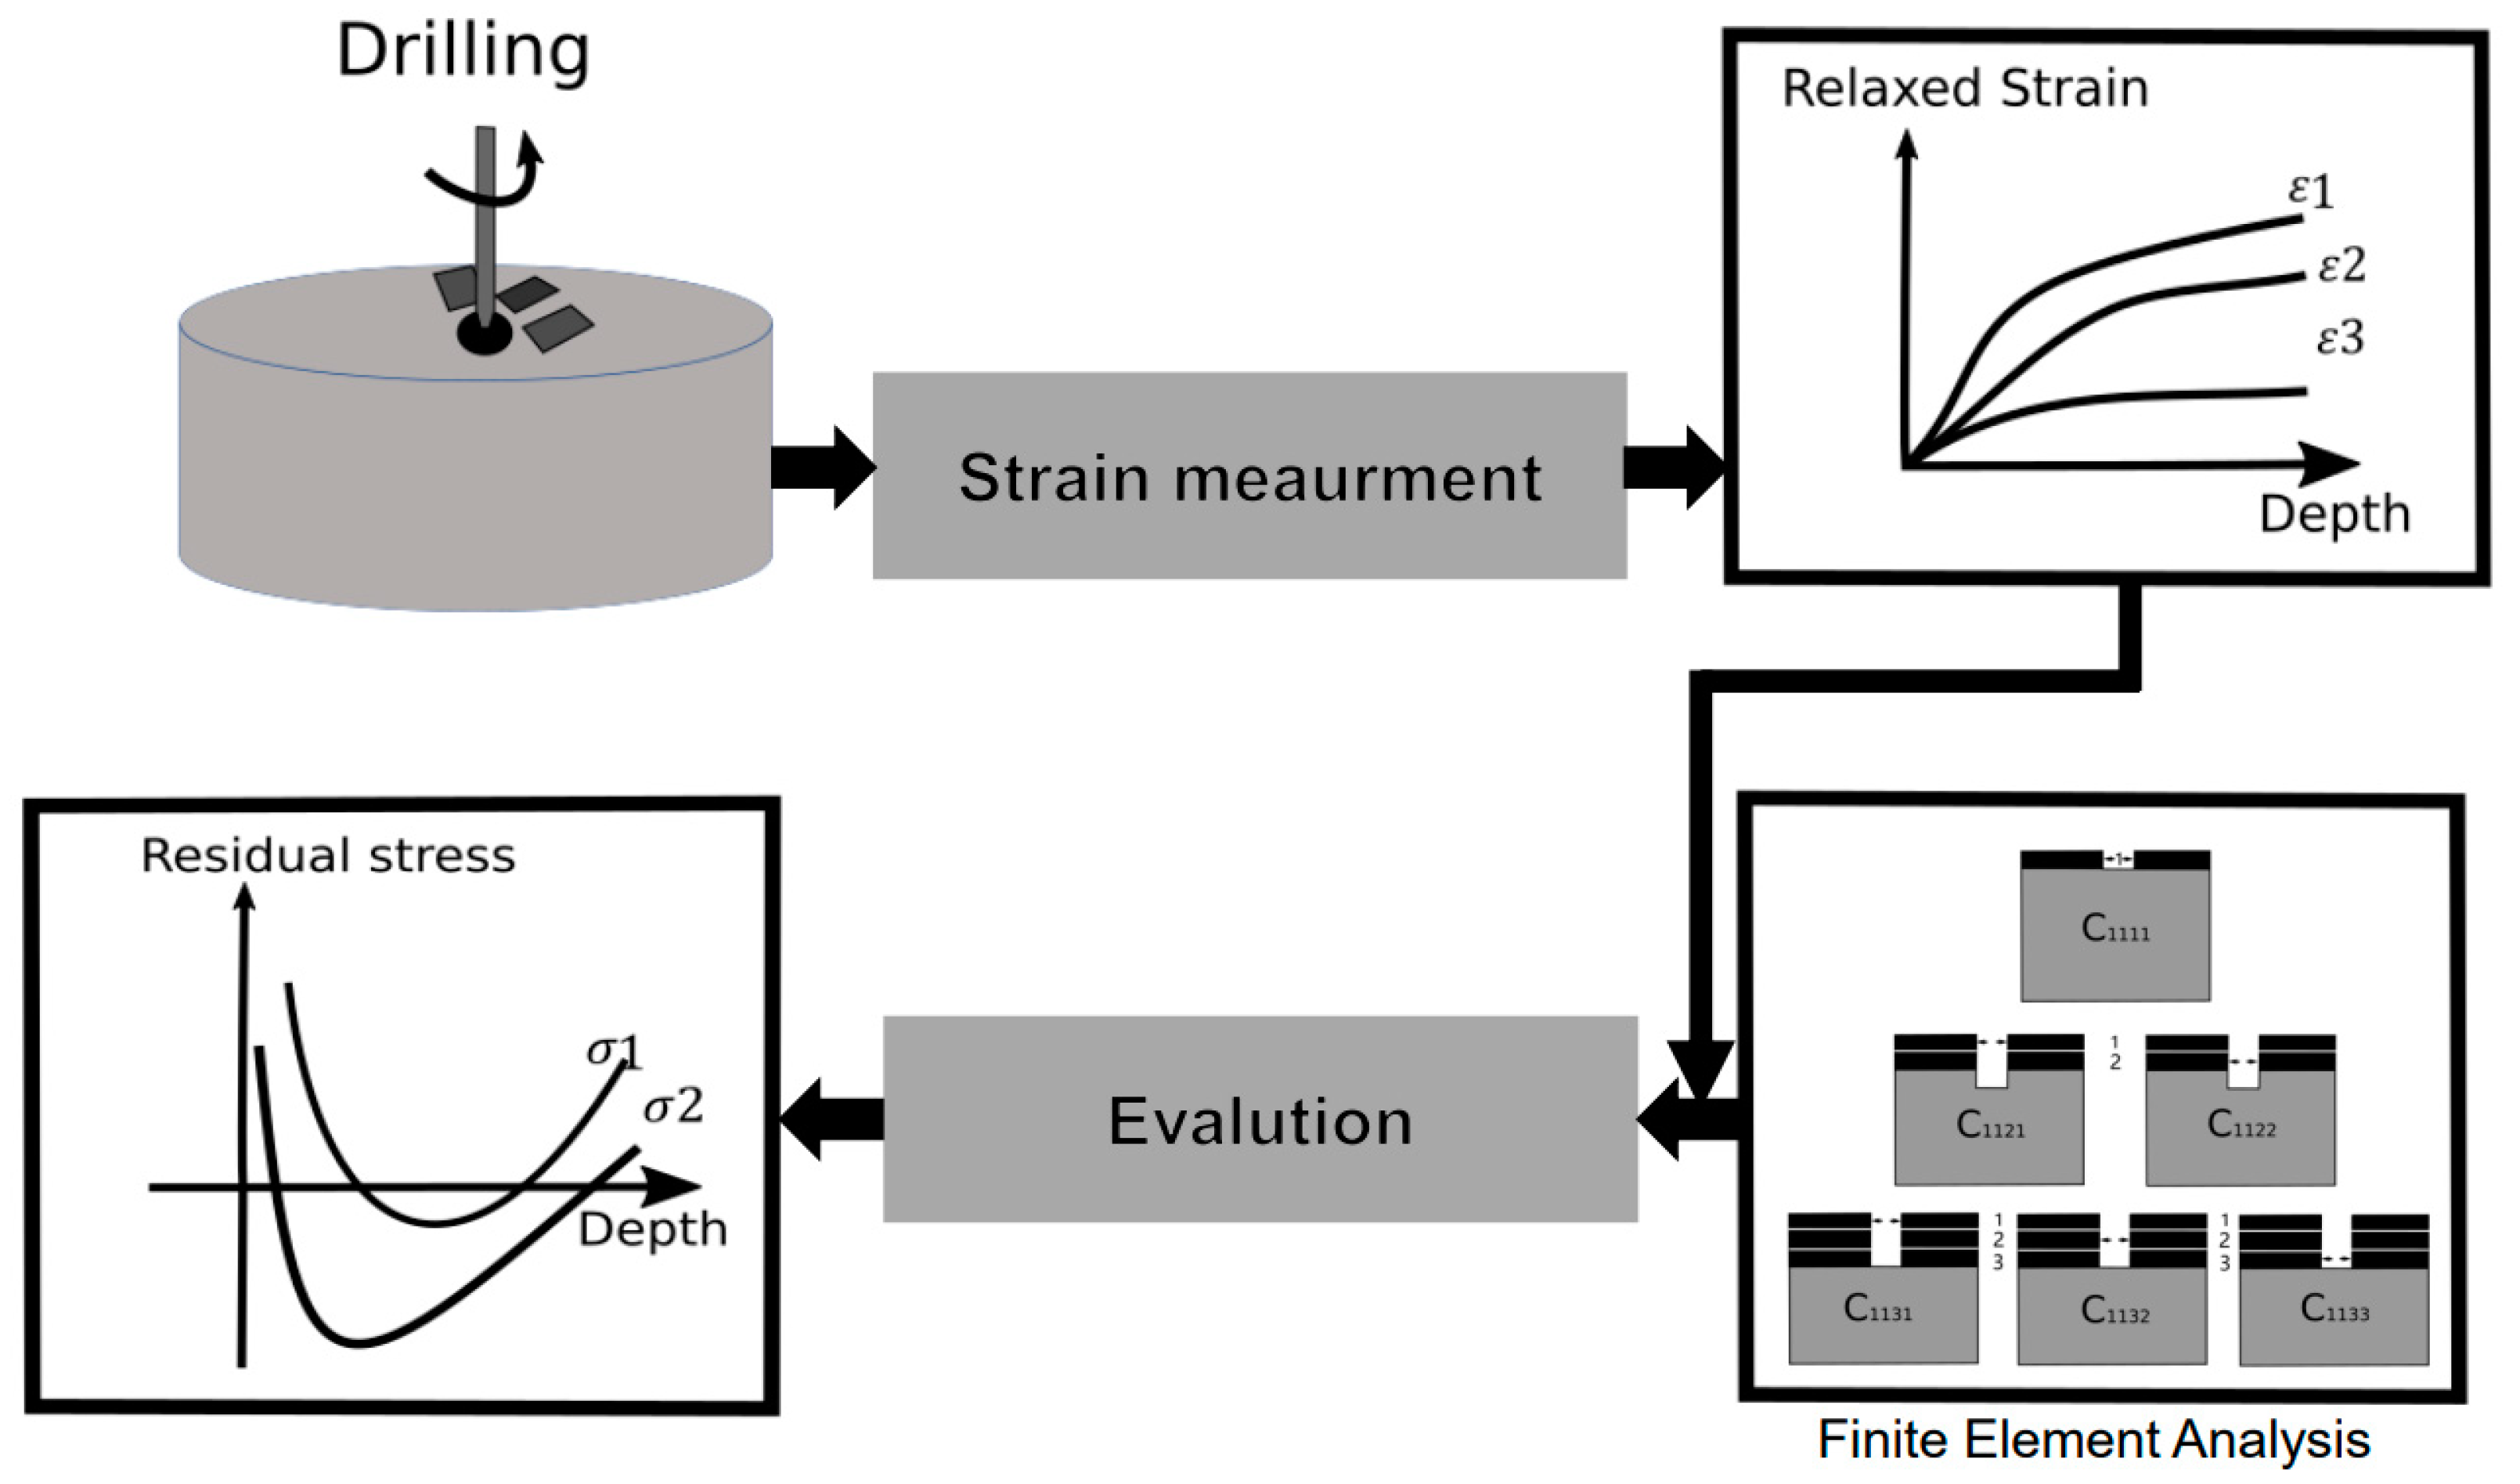
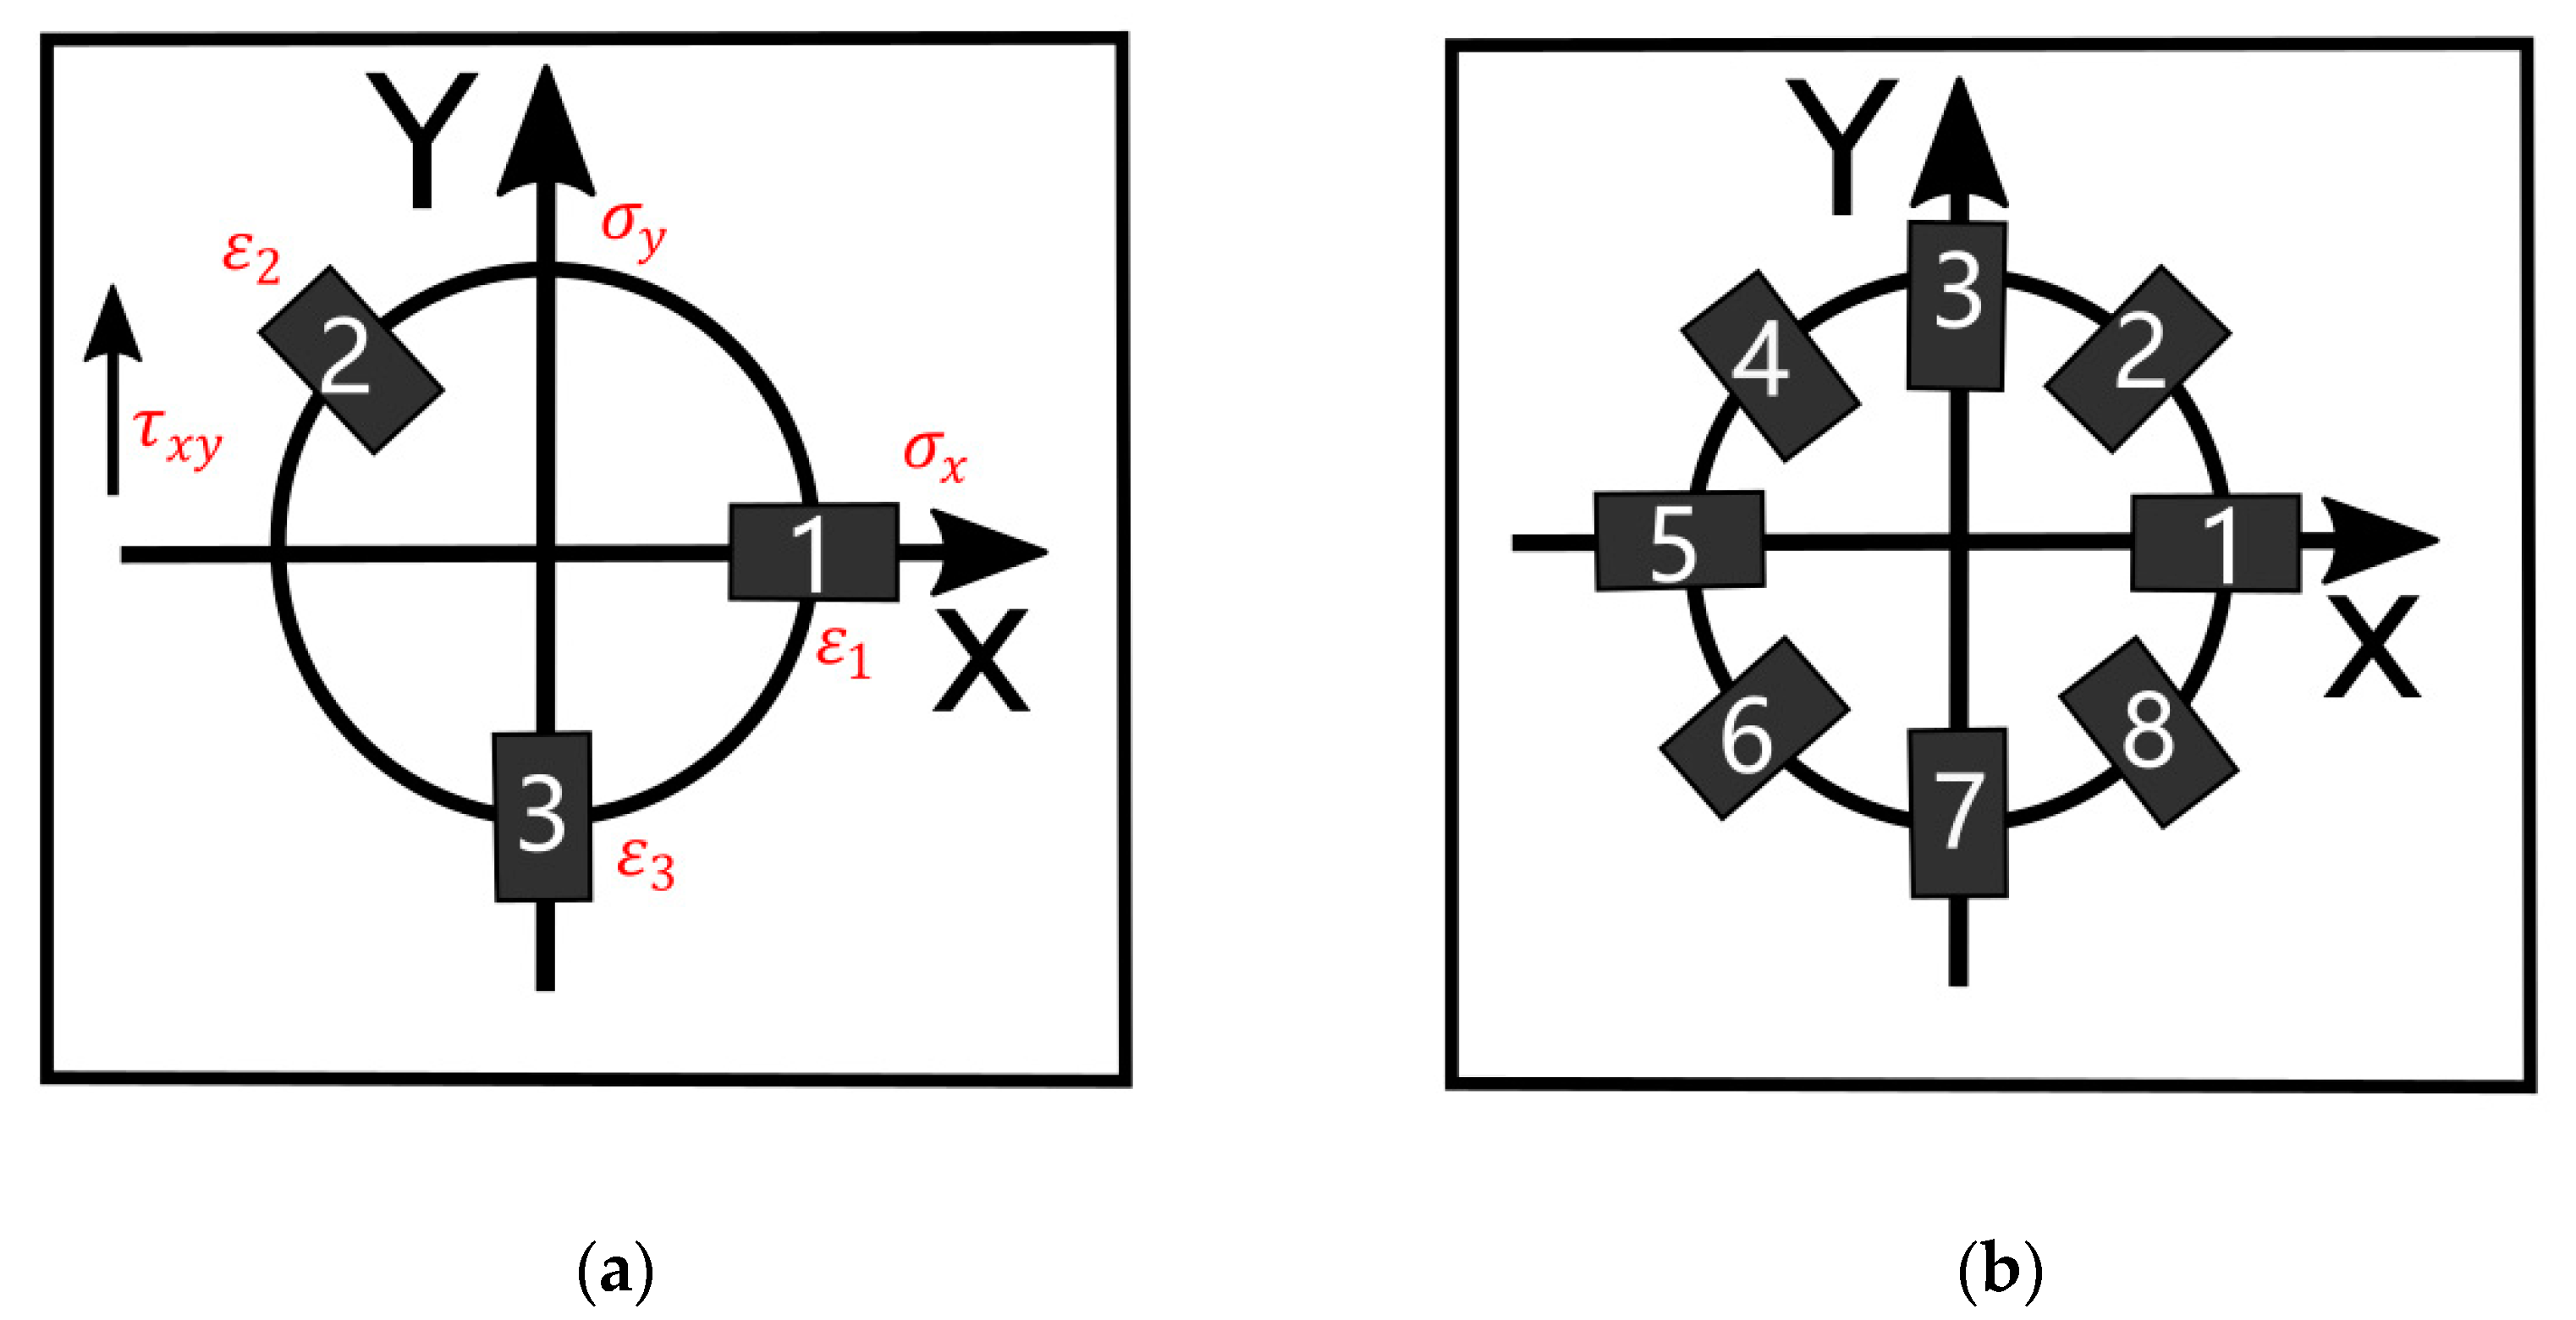
2.1. Theory of the Hole-Drilling Method

The HDM is a well-known approach to measure residual stresses by successively drilling a hole in the surface of a sample. Employing HDM, the residual stresses cannot be directly measured but are derived from strains, which are relaxed during the drilling process and concomitantly measured as a function of depth. A small hole is drilled at the geometrical center of a strain gauge used for strain measurement. Eventually, the relationship between residual stress and relaxed strain can be established via calibration coefficients, which need to be calculated through FEA. Figure 1 illustrates the workflow of measuring the residual stresses using HDM.
For establishing the stress–strain relationship in isotropic materials, the relaxed strain response is assumed to be of simple trigonometric form. However, this assumption is not valid in anisotropic materials [22]. For analyzing and measuring the residual stress in CFRPs featuring highly anisotropic characteristics and assuming that the material behaves elastically the stress–strain relationship can be expressed as follows:
( ε 1 ε 3 ε 2 ) = [ C 11 C 12 C 13 C 21 C 22 C 23 C 31 C 32 C 33 ] · ( σ x σ y τ x y ) = [ C ] · ( σ )
In Equation (1), the directions of strains ε 1 , ε 2 , and ε 3 and stresses σ x , σ y , and τ x y are defined as depicted in Figure 2a. Furthermore, matrix C (constituted of the coefficients Ckl) represents the relationship between the residual stresses and the relaxed strains and depends on the material properties and thickness of the sample, the depth of the hole, as well as the geometry of the strain gauge. More details on calculating the calibration coefficients Ckl by separately imposing boundary conditions can be found in [11].
The general stress–strain relation in Equation (1) can only be applied for stresses being uniformly distributed over the thickness. In order to account for in-depth nonuniform residual stresses, the incremental HDM can be employed. This method is based on the measurement of the surface deformation upon a sequence of drilling steps, i.e., a small hole at the surface of a stressed material is incrementally drilled. For this purpose, Equation (1) can be adapted by an incremented integral formulation, where i indicates the actual drilling step and j denotes all steps up to the current one:
( ε ) i = ( ε 1 ε 3 ε 2 ) i = [ C 11 C 12 C 13 C 21 C 22 C 23 C 31 C 32 C 33 ] i j . ( σ x σ y τ x y ) j = [ C ] i j · ( σ ) j       1 j i
For the incremental HDM, the coefficients Cklij in Equation (2) are determined not only by the residual stress in the last drill increment i but also by the residual stresses relaxed in all previous increments j . For clarity, Figure 3 schematically depicts the procedure to constitute the calibration coefficients matrix [C11]ij. In the first drilled layer, C1111 indicates the influence of the stress σ1 (being present in the 1st increment) on the measured strain ε1. When the second layer is drilled, C1121 and C1122 define the influence of the stress σ1 imposed in both the 1st and the 2nd increment on the strain ε1. The same procedure can be used to calculate C1131, C1132, and C1133.
Due to the presence of defects in CFRP laminates, unexpected strain measurements might be observed during the drilling process [13]. In this work, a strain gauge rosette with 8 gauges is used to provide redundancy and, thus, improve the reliability of the strain analysis [13]. Figure 2b illustrates the setup of 8-rosette strain gauge already used in previous works [1,13,23]. Please note that only strain information in three directions is required for the residual stress evaluation using Equation (2). Eight different combinations of strain gauge directions are employed in the present work: (1,2,3), (2,3,4), (3,4,5), (4,5,6), (5,6,7), (6,7,8), (7,8,1), and (8,1,2).
In order to determine the compliance matrices [C]ij, the corresponding coefficients need to be calculated using FEA. In the present work, the commercial software ABAQUS was used. A cylinder with 500 mm in diameter (thickness according to the actual thickness of the sample) was discretized with eight-node solid elements of type C3D8R. Figure 4 shows the finite element model, including local mesh refinement in the direct vicinity of the drilled hole. The mesh refinement was performed manually by directly specifying the number of elements based on the partitioning function in ABAQUS. The number of elements was iteratively increased until changes in the calculated matrix coefficients became negligible. The mesh in the model remained the same during the entire simulation process. With respect to the prescribed mechanical boundary conditions, the circular boundaries are fixed in all directions, while the part of the model below the hole is allowed to deform freely.
In the present work, a hole drilled in 25 increments was considered: 10 steps of 20 μm and then 15 steps of 40 μm thickness. The calculation time for these 25 increments was about 7 days using a dual-processor Intel Xeon ×5660. The step size of 20 μm was not chosen for the whole simulation in order to avoid high computational cost. In the experiment, however, a step size of 20 μm was employed in the entire drilling procedure, ensuring a smooth strain profile as a function of the drilling depth, in particular across the interface between two adjacent layers. The experimentally determined strains were approximated and smoothed with a polynomial of 6th order for residual stress evaluation. The strains at a given depth, for which the calibration coefficients were calculated, were chosen for evaluating the residual stresses.
Properties required as input include the stacking sequence and the actual material properties of the unidirectional plies. Note that each unidirectional ply is considered to be homogeneous and orthotropic, and plies differ only by orientation. The (residual) stresses are prescribed as the boundary conditions on the hole walls for every actual total hole depth. The relaxed strains follow from the displacement data. The drilling process is simulated by removing material (elements) with the “Remove” function, using a Python script written by the authors. This procedure is repeated until all calibration coefficients are determined. More information on the calculation of the coefficients using FEA can be found in [11].

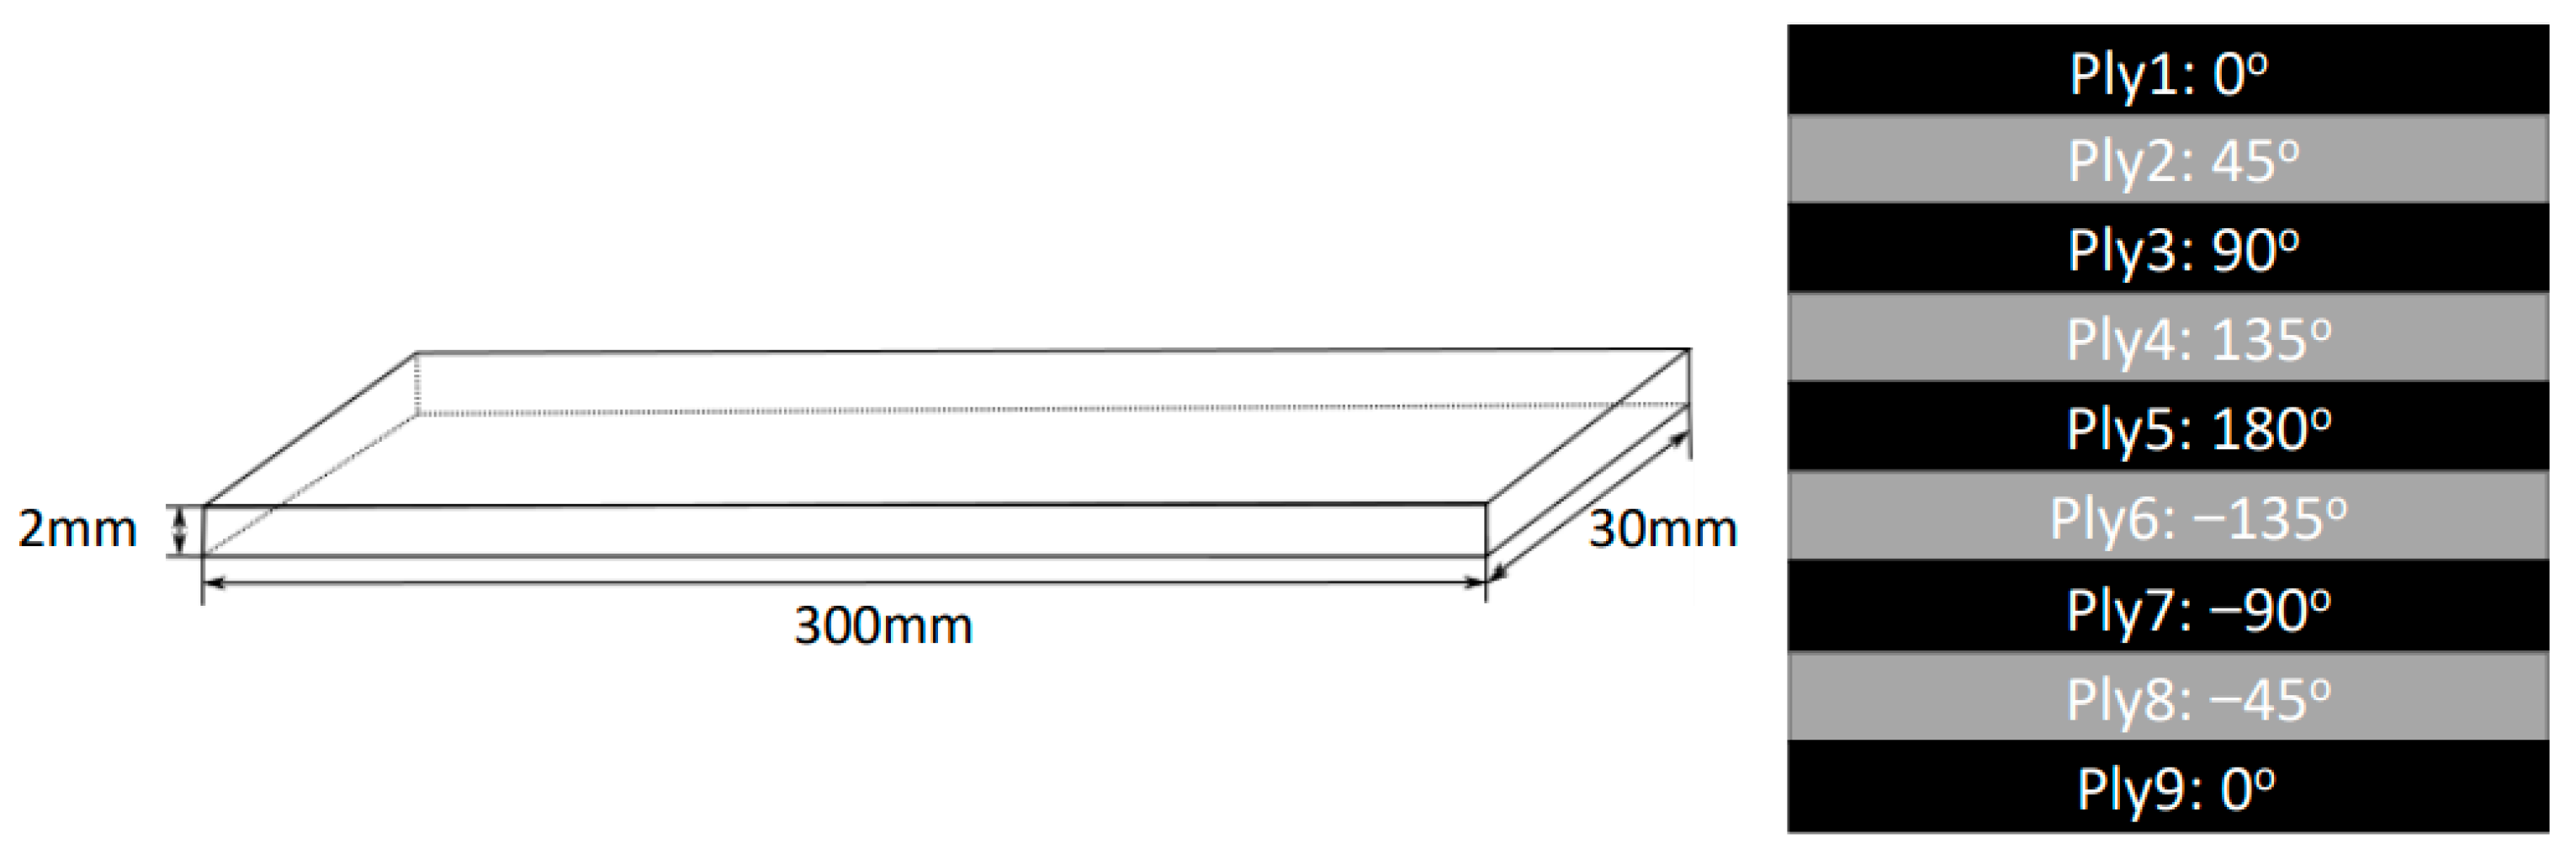
2.2. Sample Manufacturing

One objective of the present work is to compare the residual stresses of samples featuring different stacking sequences and thicknesses. One CFRP sample [0/45/90/135/180/−135/−90/−45/0] (9 plies) with dimensions of 300 × 30 × 2 mm3 was manufactured by the pre-preg-process technology employing a pressure of 0.5 MPa at a temperature of 200 °C. For further details on the manufacturing process, the reader is referred to [23]. After manufacturing, the sample was cooled down under a laboratory atmosphere with a cooling rate of approximately 100 °C/min. The carbon fiber pre-pregs used were of type C U255-0/NF-E322/37% (with an epoxy resin content of 37%). In order to investigate the influence of the stacking sequence on the residual stress state, a unidirectional CFRP laminate (9 plies) was manufactured with the same process parameters. Furthermore, CFRP laminates with different thicknesses of 1 mm (4 plies), 2 mm (8 plies), and 3 mm (12 plies) were fabricated with stacking sequence [0/90]s. Again, the manufacturing and cooling parameters are the same as detailed before. The mechanical properties of the unidirectional plies used for fabrication of the different laminates are Ex = 126.15 (GPa), Ey = 7.97 (GPa), Ez = 7.97 (GPa), νxy = 0.37, νxz = 0.37, νyz = 0.37, Gxy = 7.11 (GPa), Gxz = 7.11 (GPa), and Gyz = 2.9 (GPa), experimentally determined according to DIN EN ISO 527 [13]. Figure 5 shows the dimensions and stacking sequence of the multidirectional CFRP sample. As this sample is symmetrically constructed and, thus, characterized by a self-balanced residual stress state, pronounced deformation (bending) was not observed after the sample was removed from the die. Schematics for the other samples are not shown to avoid redundancy.

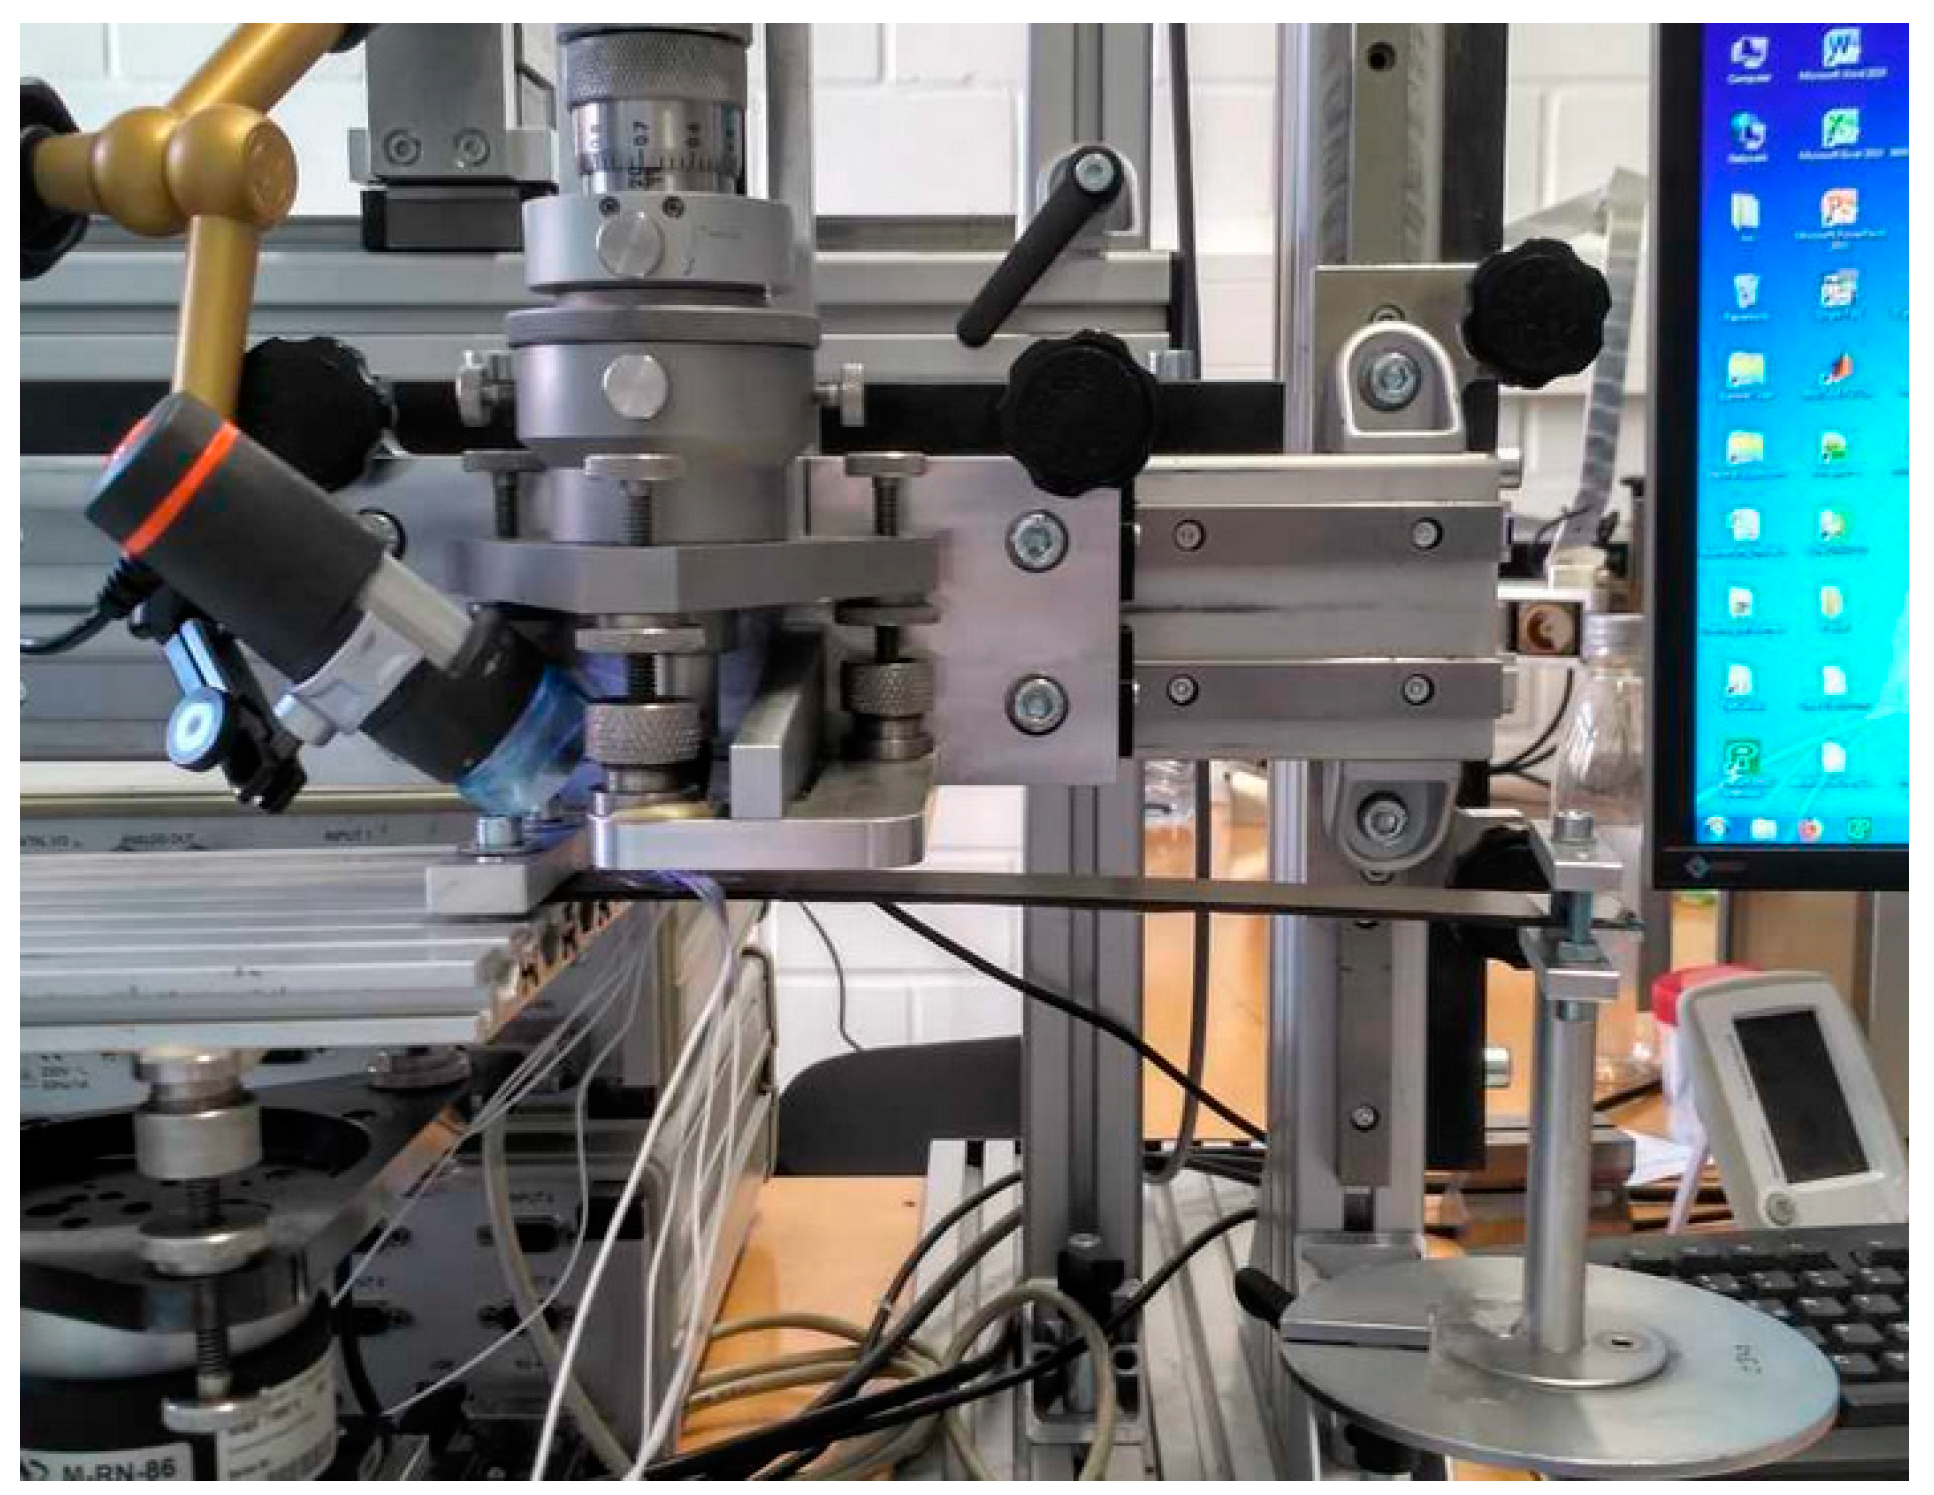
2.3. Hole-Drilling Process

For the incremental HDM, a small hole at the geometrical center of a strain gauge rosette featuring eight grids (Hottinger Baldwin Messtechnik, Figure 2b) was incrementally drilled. The strain gauges were attached to the laminate surface and connected to a bridge amplifier, using a supply voltage of 1 V. A carbide tungsten tool (ref H2.010, Komet) with a nominal diameter of 1 mm was used for drilling. An air turbine was used with a drilling speed of about 300,000 rpm (at 3 bar) and an orbital movement. Using this setup, the formation of new stresses in the material can be effectively avoided since chips produced by the side surface of the cutting tool have a shorter and less constrained exit path [13]. Because of the orbital movement, the final hole diameter is around 2 mm, which is in accordance with the inner diameter of the strain gauge rosette. Small drilling steps of 20 µm were chosen in order to have a smooth strain profile across the piles. In order to ensure the accuracy of the strain measurement used for residual stress evaluation, it should be emphasized that some further aspects have to be carefully considered: (1) precise alignment of the strain gauge alongside the fiber direction (errors induced by misalignment of strain gauges have been discussed in [13,23]), (2) exact position of the drill to be placed at the geometric center of the strain gauge rosette [12], (3) adoption of the correct zero-depth setting (an overestimation of residual stresses was reported for an incorrectly chosen zero-depth setting [13]), and (4) the measured strains are approximated and smoothed with a polynomial of 6th order for residual stress evaluation.

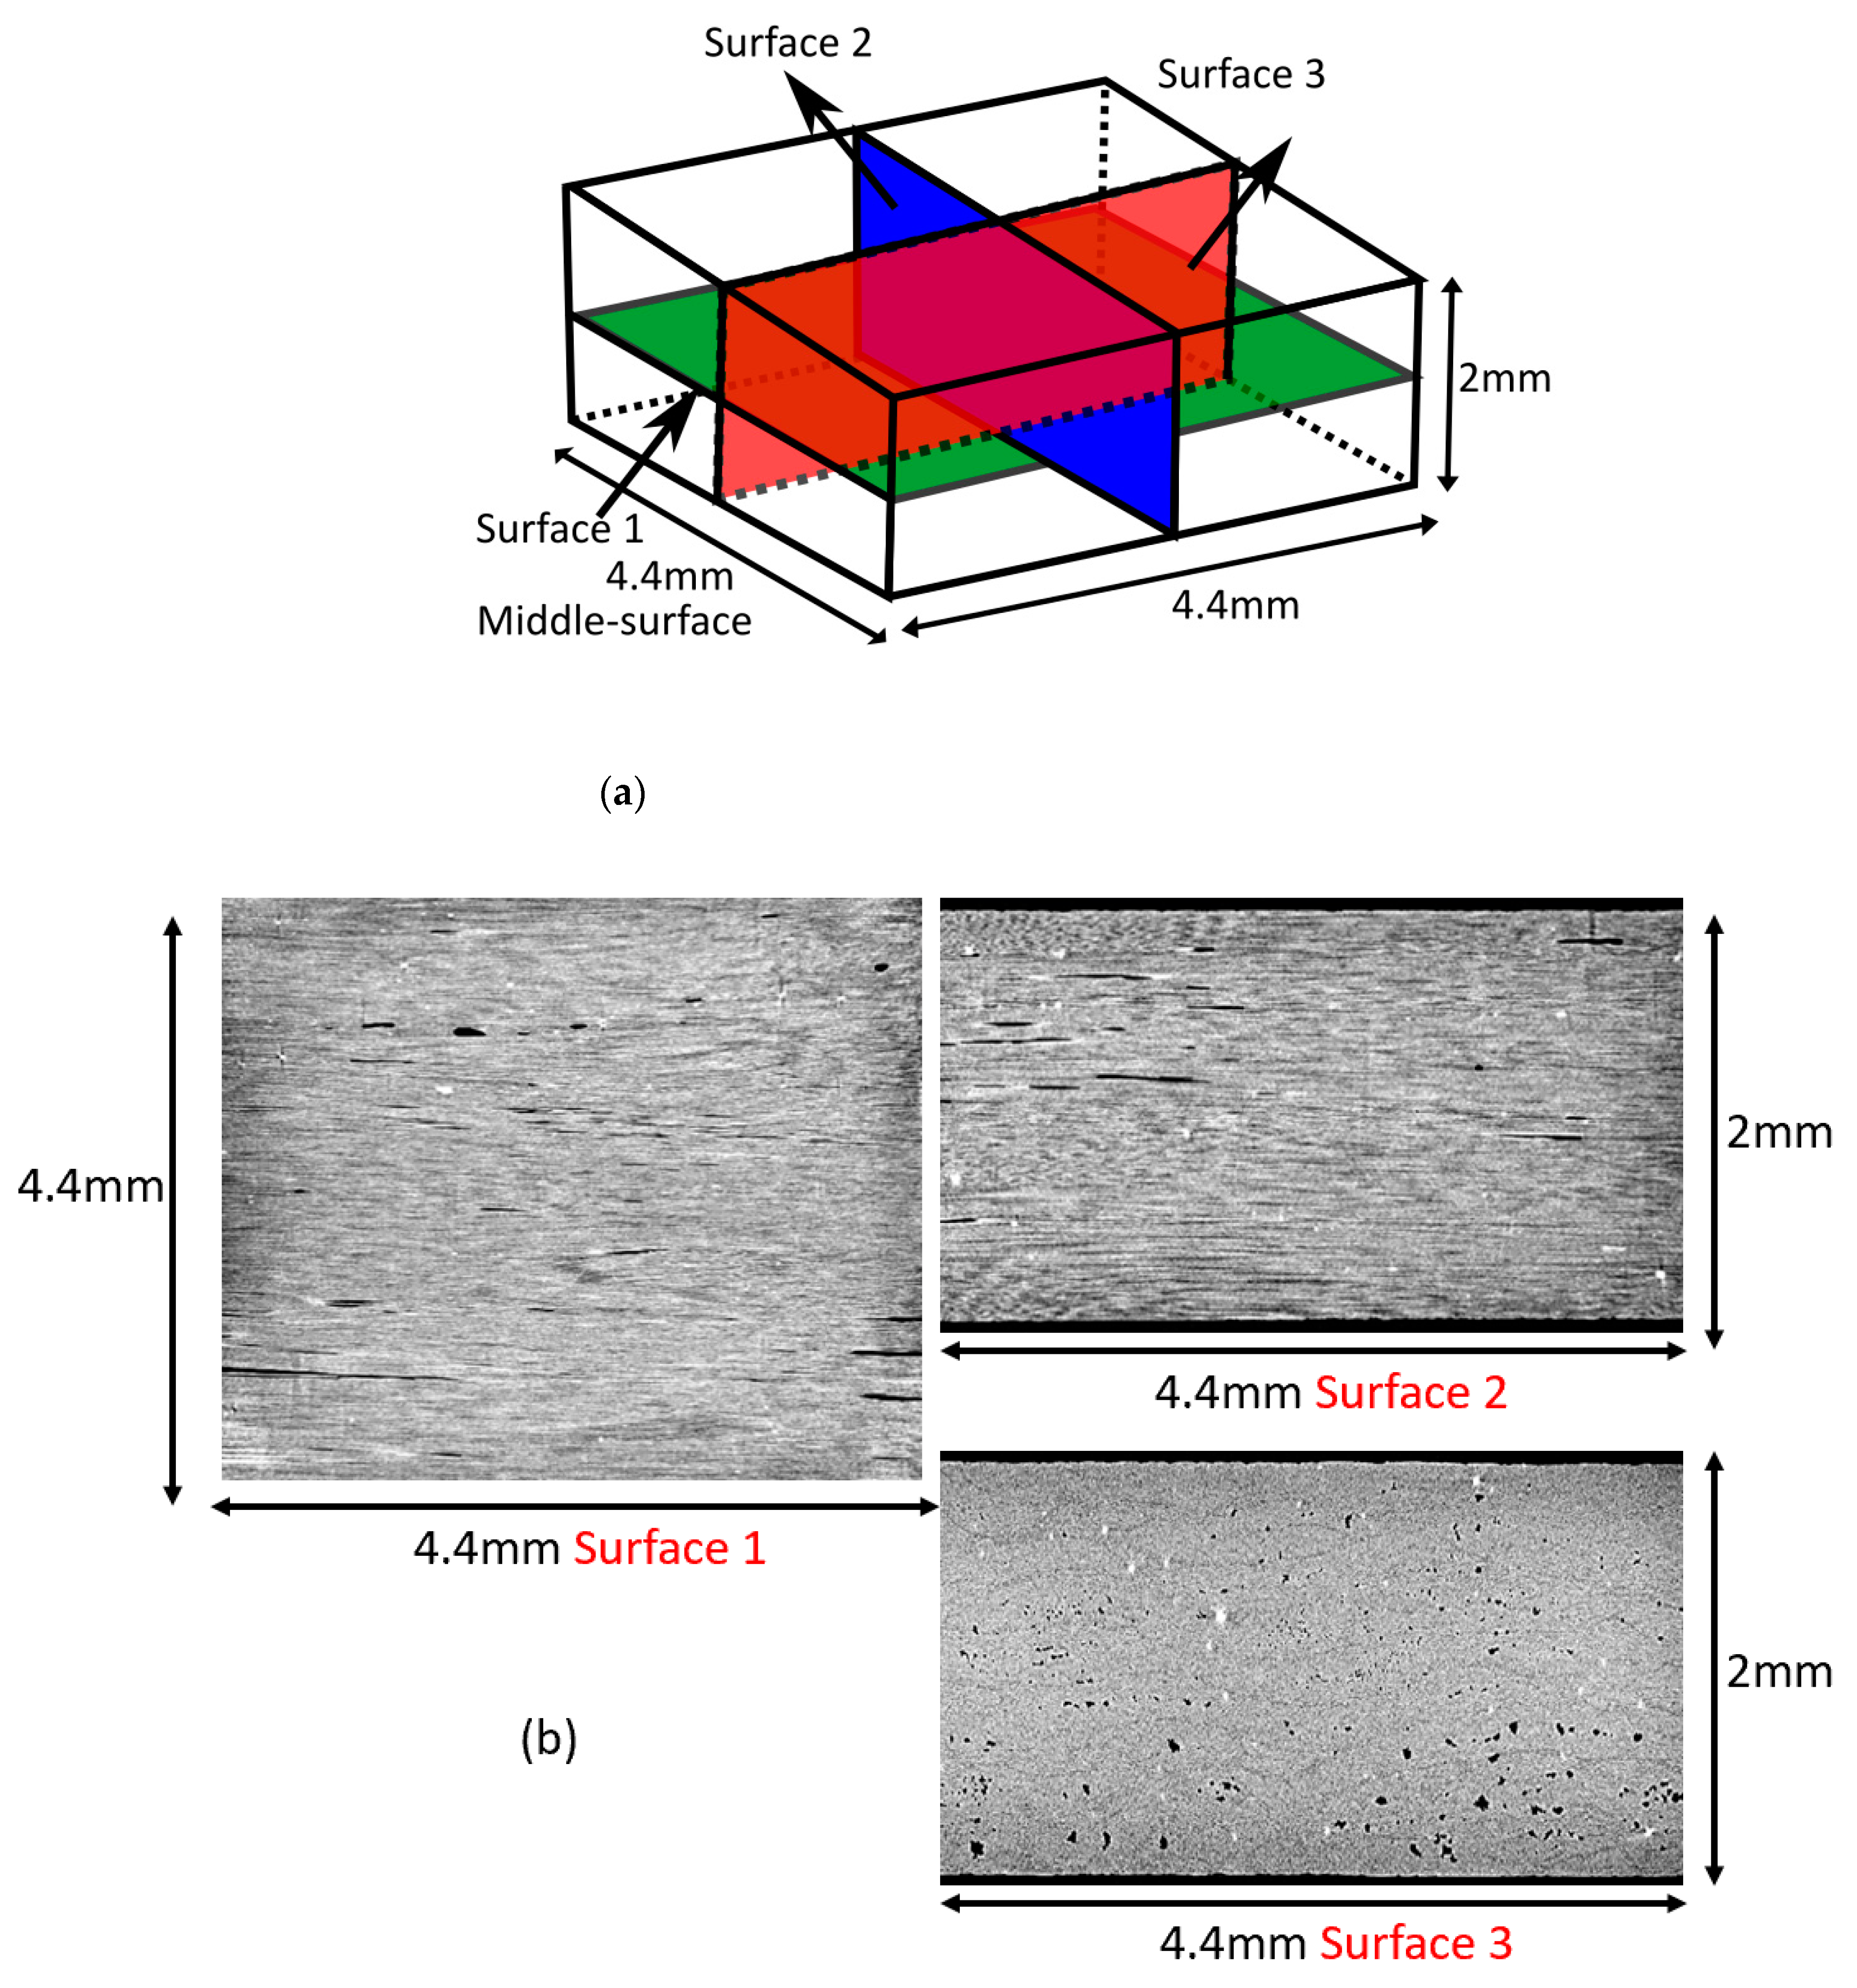
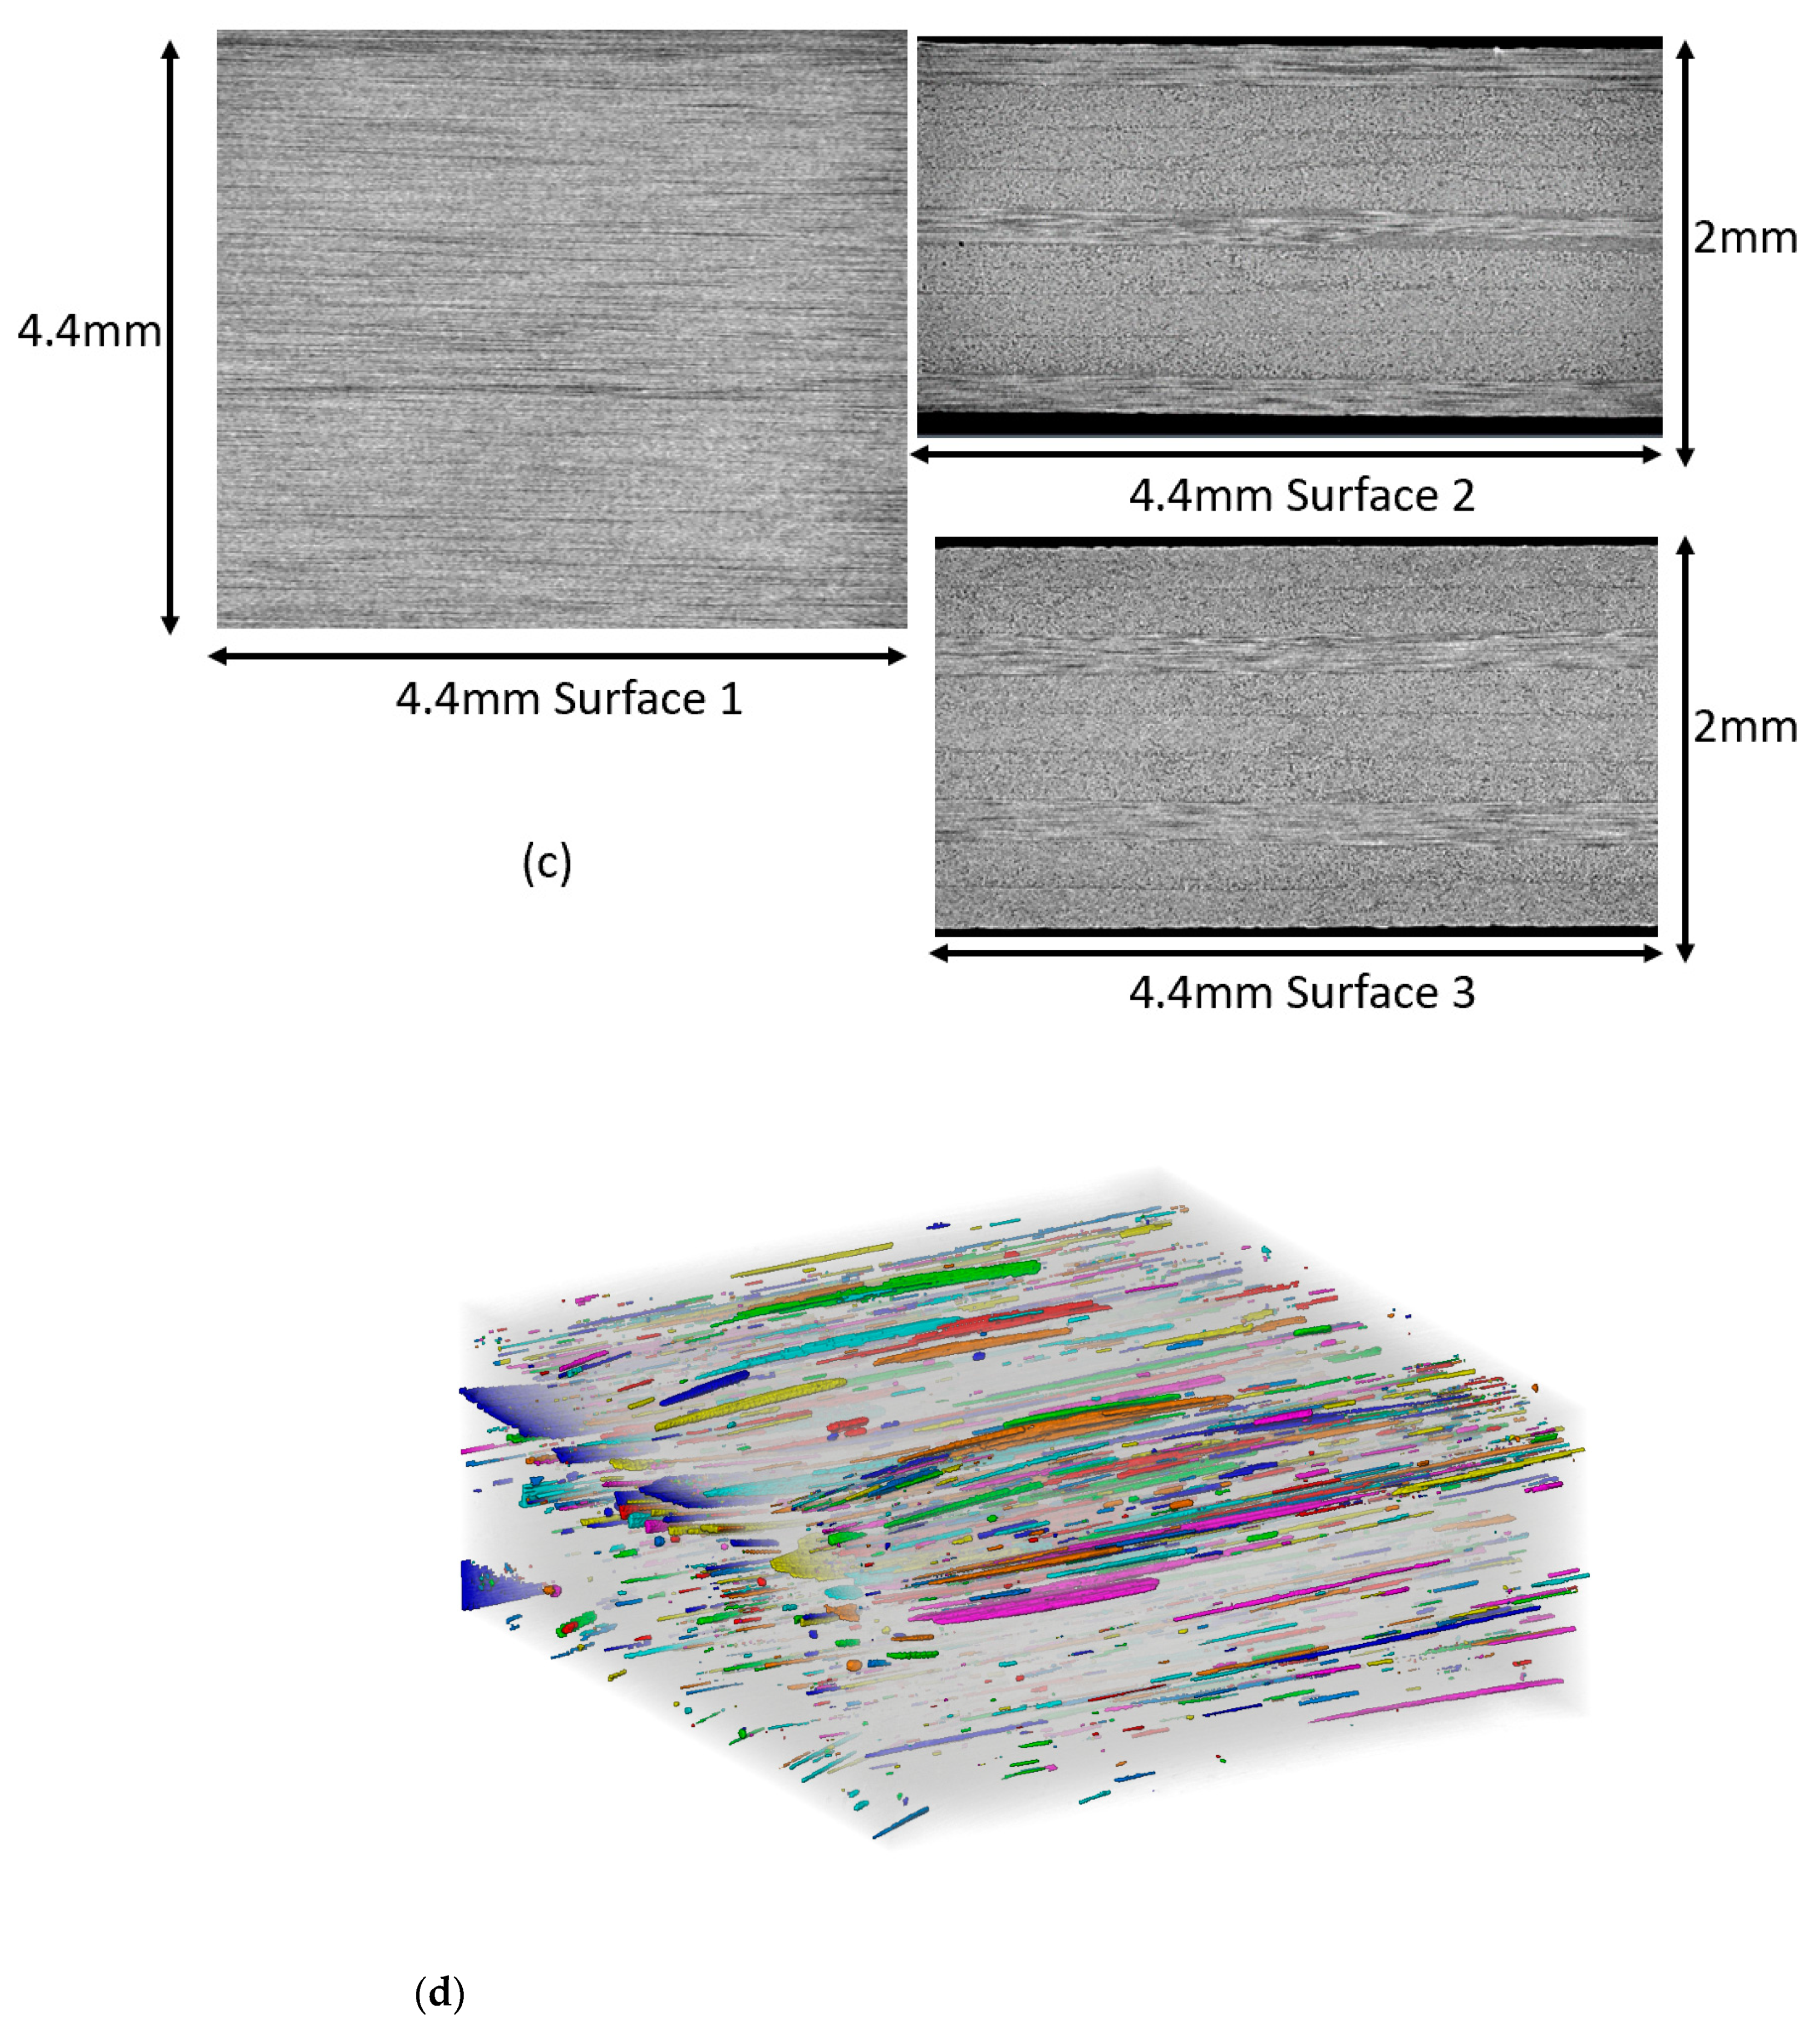
2.4. Microstructure Characterization

The two-dimensional cross-sectional microstructure was characterized using optical microscopy (OM). Following manufacturing, samples were cut and embedded in an epoxy resin. The embedded samples were ground down using 400, 600, 800, and 1500 grit size silicon carbide abrasive paper and finally polished with 1 μm diamond paste. Defect analysis within the sample volume was carried out using an RX Solutions EasyTom 160-150 computed tomography (CT) system. For the investigations, samples with dimensions of 2.8 × 2.4 × 2 mm3 were cut from the center of the original laminates. CT scans were conducted at 70 kV and 100 µA. These settings enabled a spatial resolution of smaller than 4 µm. A total of 1440 projections were collected at a pixel size of 4.5 µm. The volumetric (absorption contrast) images were reconstructed using the Feldkamp, Davis, and Kres (FDK) algorithm [24], cropped to the sample size, and normalized in the greyscale range. For visualization of the pores, threshold-based segmentation was employed since the contrast between ambient air and the CRFP samples was high. However, it should be noted that pores being in size close to the voxel size cannot be detected reliably because of the partial volume effect and noise. Thus, only pores with at least 9 µm in diameter (two voxels) were retained.

3. Results and Discussion

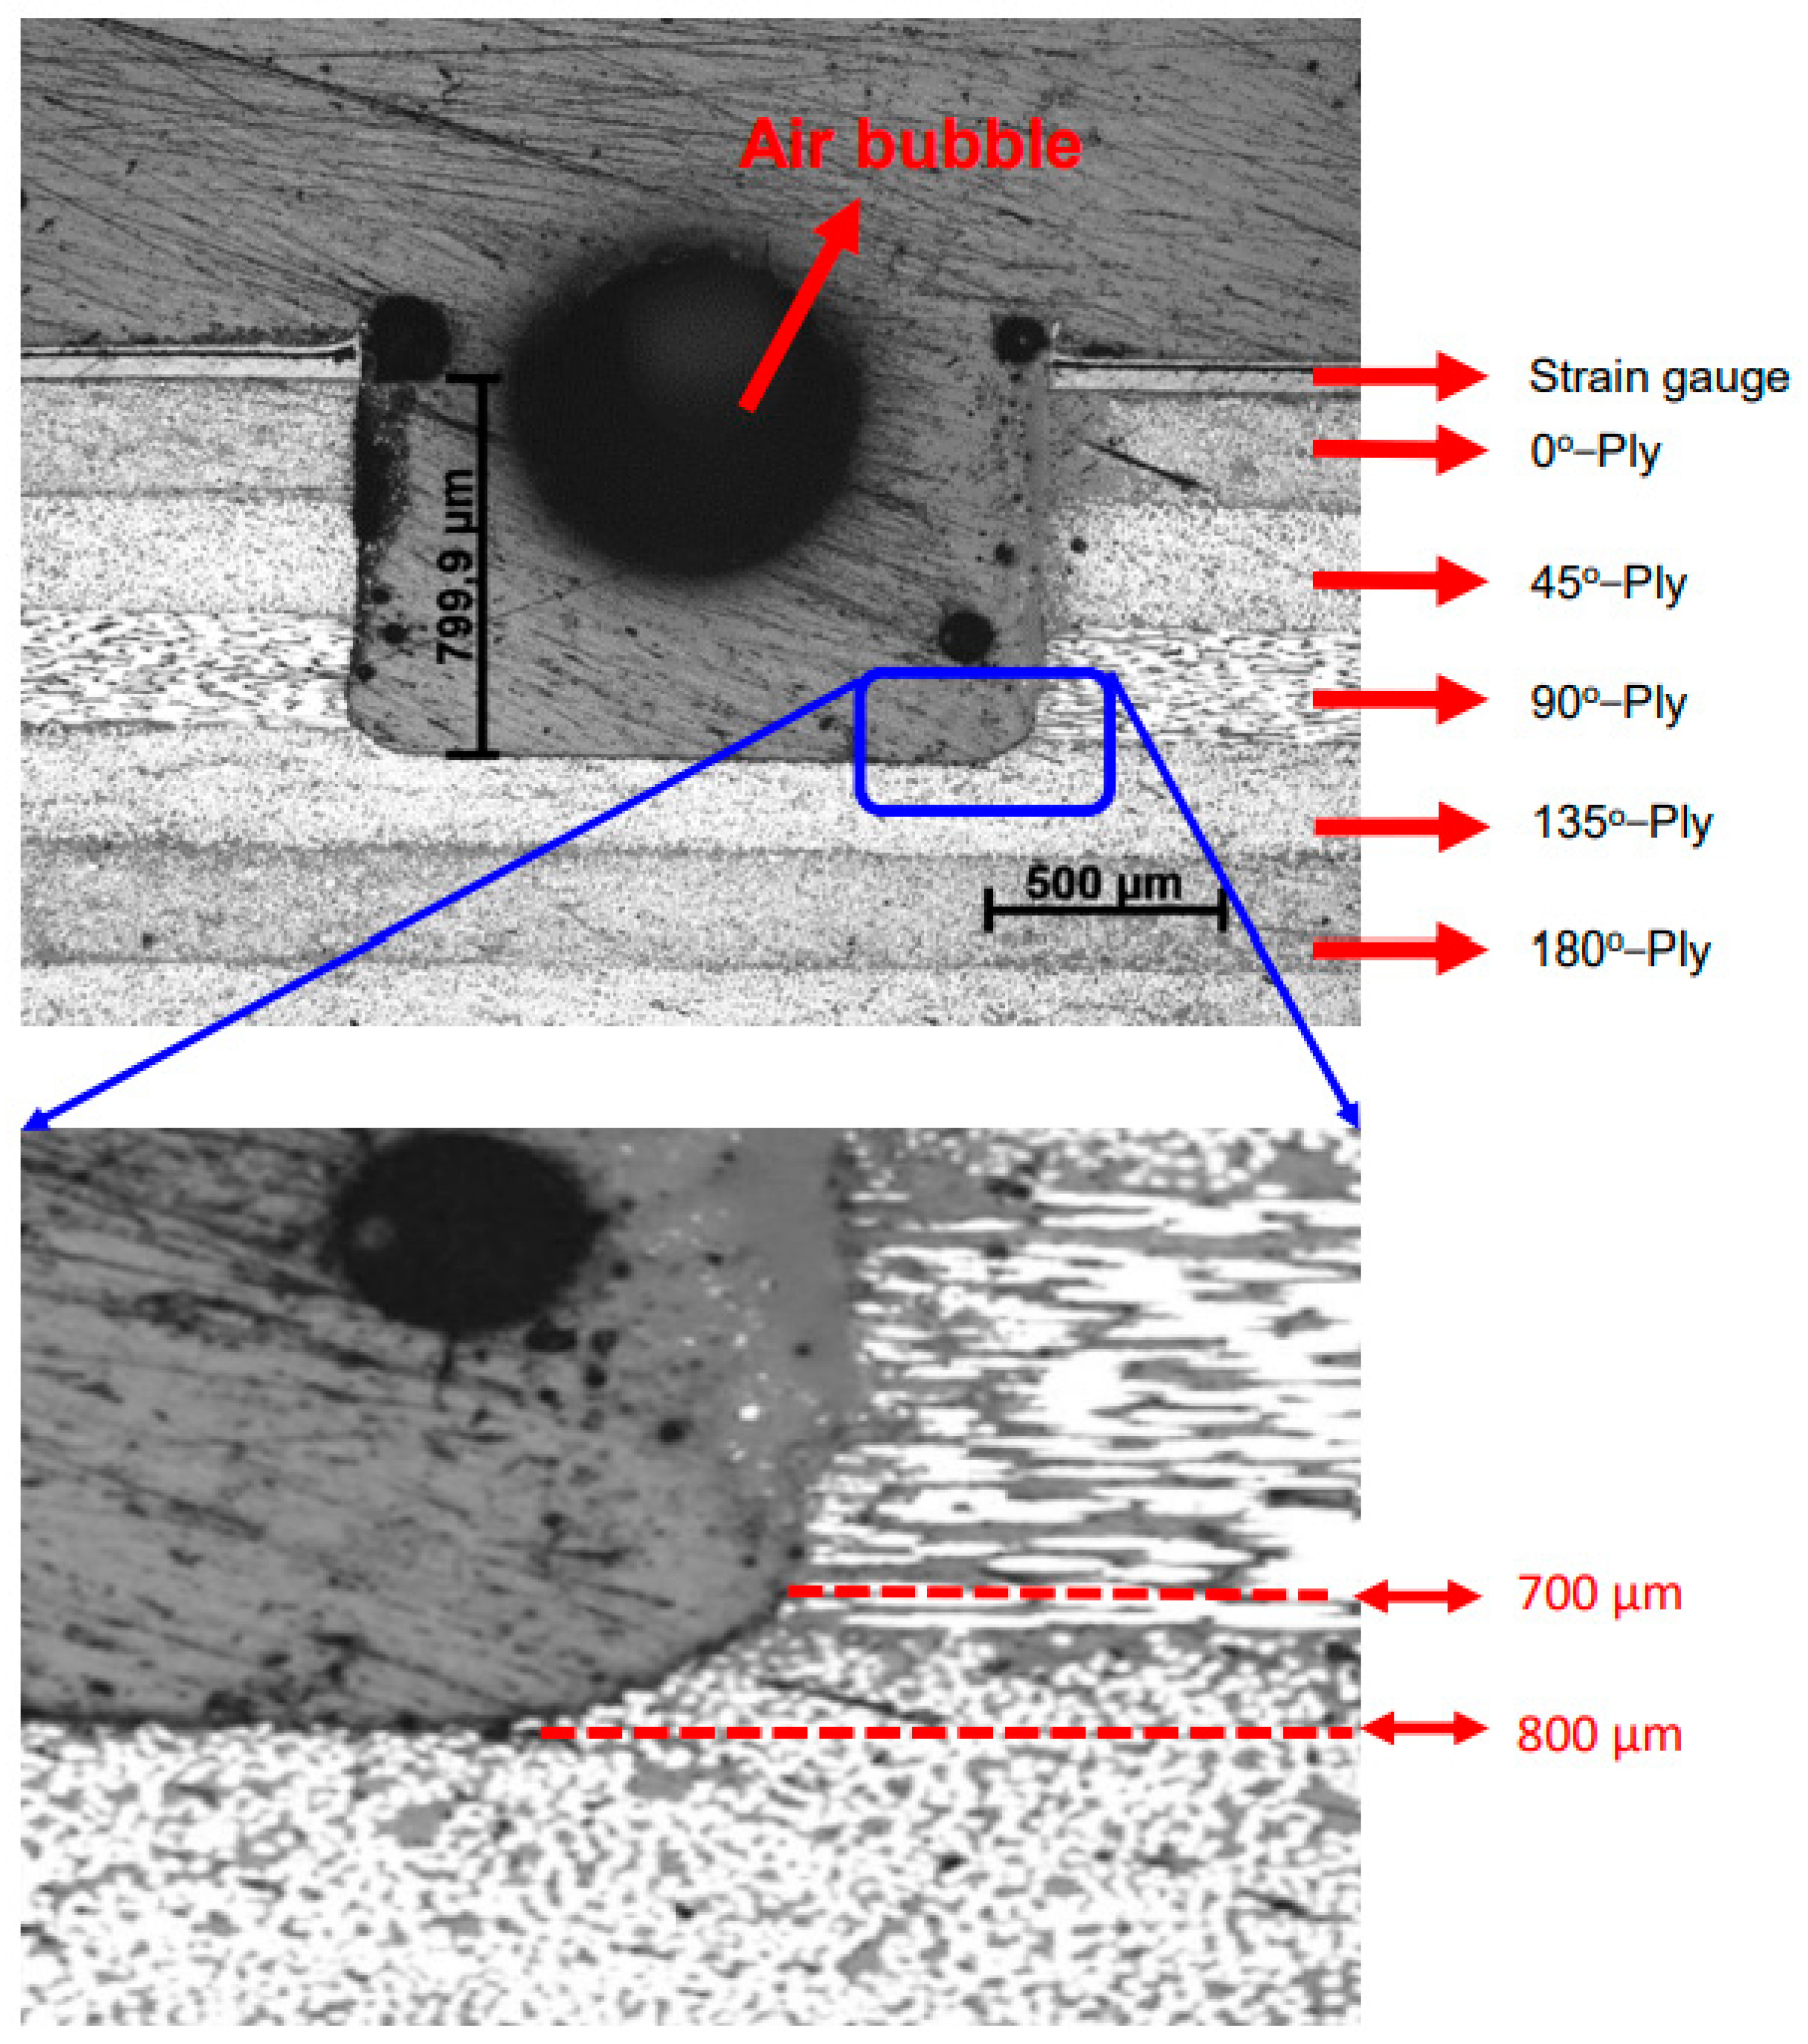
3.1. Microstructure Characterization

In Figure 6, a cross-sectional optical micrograph of the multidirectional CFRP sample (c.f. Figure 5) is shown, providing information on the thicknesses of the individual ply. Beside the stacking sequence, these values are used as input parameters to the FEA model for calculating the calibration coefficients (cf. Section 2.1). It can be directly seen that the thickness of each ply is not exactly the same. The cross-sectional microstructures of the other samples are not shown for brevity.
Figure 7 shows an example of the cross-sectional microstructure of a drilled hole in the multidirectional CFRP sample, detailing the quality and the depth of the drilled hole. The results are representative for the other samples (not shown here) as well. The drilled hole quality is of utmost importance for the accuracy of the residual stress evaluation. According to ASTM–E837 [12], a reliable measurement (in the case of nonuniform residual stresses) can be made up to a maximum depth of 0.4 times the diameter of the hole. Since the hole diameter is 2 mm in the present work (cf. Section 2.3), a depth limit of around 800 μm is set. The depth of the hole shown in Figure 7, measuring 0.8 mm, is evidence of the good controllability and high precision of the drilling device used. Moreover, the hole is orthogonal to the bottom face of the sample, and substantial damage is not observed. The aforementioned characteristics imply that the drilled hole is of good quality. However, the used cutting tool is an end cutter with a chamfer on the edges (not shown), and related effects are potentially enlarged by the air turbine vibration. Consequently, chamfers or fillets are directly transferred to the blind hole bottom geometry, as can be seen at a depth of 700 to 800 μm, shown in Figure 7. Thus, the results in this depth range are excluded from the analysis.
In this section, the process-induced defect population in the uni- and multidirectional CFRP samples is characterized, and the effect of stacking sequence on the porosity and pore morphology is shown. Please be reminded that both samples consisted of nine plies (same thickness) and were fabricated with the same process parameters (cf. Section 2.2). The pre-preg technology used for fabrication is known for a variety of phenomena finally contributing to pore formation [25]. Thus, the porosity and pore morphology are dependent on material properties, reinforcement structure, stacking sequence, thickness, and processing parameters (temperature, pressure, and curing time). Figure 8 depicts two- and three-dimensional CT images. On the one hand, it is well-known that two-dimensional images are section-biased, i.e., dependent on the cutting direction. However, cross-sectional views can provide clear information on the volume fraction and shape of the pores. With respect to the pore distribution, three-dimensional images provide additional information. Therefore, both two- and three-dimensional data are shown.
Figure 8a sketches the cut planes for two-dimensional microstructure characterization. Figure 8b,c show cross sections along the three orthogonal directions for the uni- and multidirectional CFRP, respectively. The section orientations are the same for both samples, and black areas represent pores. In Figure 8b, it can be seen that many pores are present in the middle area. This observation can be explained by an inhomogeneous distribution of the temperature and curing degree in the middle of the sample, as well as by the fact that the trapped pores in the middle of the sample have more difficulties in migrating to the edge during curing. In contrast to the unidirectional CFRP, only a few pores are found in the multidirectional sample. As reported in previous work [7], more pores could be induced in multidirectional CFRP than in unidirectional CFRP owing to the following reasons: (1) because of the complex stacking sequence, the air entrapment in multidirectional CFRP is more pronounced, and (2) a nonuniform distribution of the pressure and temperature leads to a nonuniform curing degree in multidirectional CFRP. However, the reverse case is observed in the present work, which can be explained by the employed process parameters not being optimized for both types of laminates. However, the present work focuses on the residual stress analysis, while process parameter optimization was out of scope.
A three-dimensional image of the unidirectional CFRP sample is shown in Figure 8d, revealing interlaminar and intralaminar pores. Most of the pores are elongated in the adjacent fiber direction and are quite long (needle-like voids). In line with the two-dimensional images in Figure 8c, the three-dimensional image of the multidirectional CFRP (Figure 8d) shows hardly any pores at all, keeping in mind that pores of dimensions similar to the voxel size are not displayed. Based on the assessment of CT data, the porosity of the uni- and multidirectional CFRP is 1% and 0.05%, respectively.

3.2. Calibration Coefficients: Relation between Residual Stress and Surface Strain

Details about the calculation of the calibration coefficients have been introduced in Section 2.1. In the following, the influence of the stacking sequence and the presence of pores on the calculated calibration coefficients is presented.

3.2.1. Effect of Stacking Sequence

Although strain gauges with eight grids have been employed in the present work in order to provide redundant strain information during drilling, only three grids are required for residual stress evaluation. To assess the effect of stacking sequence on the calibration coefficients, uni- and multidirectional CFRP samples with the same theoretical thickness (nine plies) were investigated. For clarity, only C11ij of Equation (2) will be in focus here. Furthermore, only grids No. 1 to 3 are considered, featuring angles with respect to the fiber direction of 0°, 45°, and 90°, respectively.
Table 1 shows the calculated calibration coefficients C11ij for the uni- (a) and multidirectional (b) CFRP, as well as the relative difference between the two samples (c) up to a maximum hole depth of 400 μm. At this depth, two plies are drilled, whereas, in the multidirectional CFRP sample, the first ply is at 0° fiber direction and the second ply at 45° fiber direction. From Table 1, it can be seen that the values of the upper triangular matrix are zero (cf. Figure 3 for a schematic explanation). Moreover, in each row, the absolute values decrease from left to right. This observation can be rationalized by a smaller deformation induced on the sample surface by force imposed on the bottom layer relative to an upper layer. Consequently, it can be concluded that there is a limit to the maximum depth, as also reported in [12]. Furthermore, the absolute values increase from top to bottom. This tendency is based on the fact that the compliance of the material is increased when more layers are drilled. Generally speaking, a difference in the calibration coefficients between uni- and multidirectional CFRP can be observed. Since even in the first ply, featuring the same fiber orientation in both samples, differences are present, a significant influence of the stacking sequence is demonstrated. For quantitative analysis, the percentage deviations are shown in Table 1c, where the values of the unidirectional CFRP are taken as reference. In the first ply, the highest difference of approximately 45% is at the first removed increment, as the surface strain response is very sensitive.

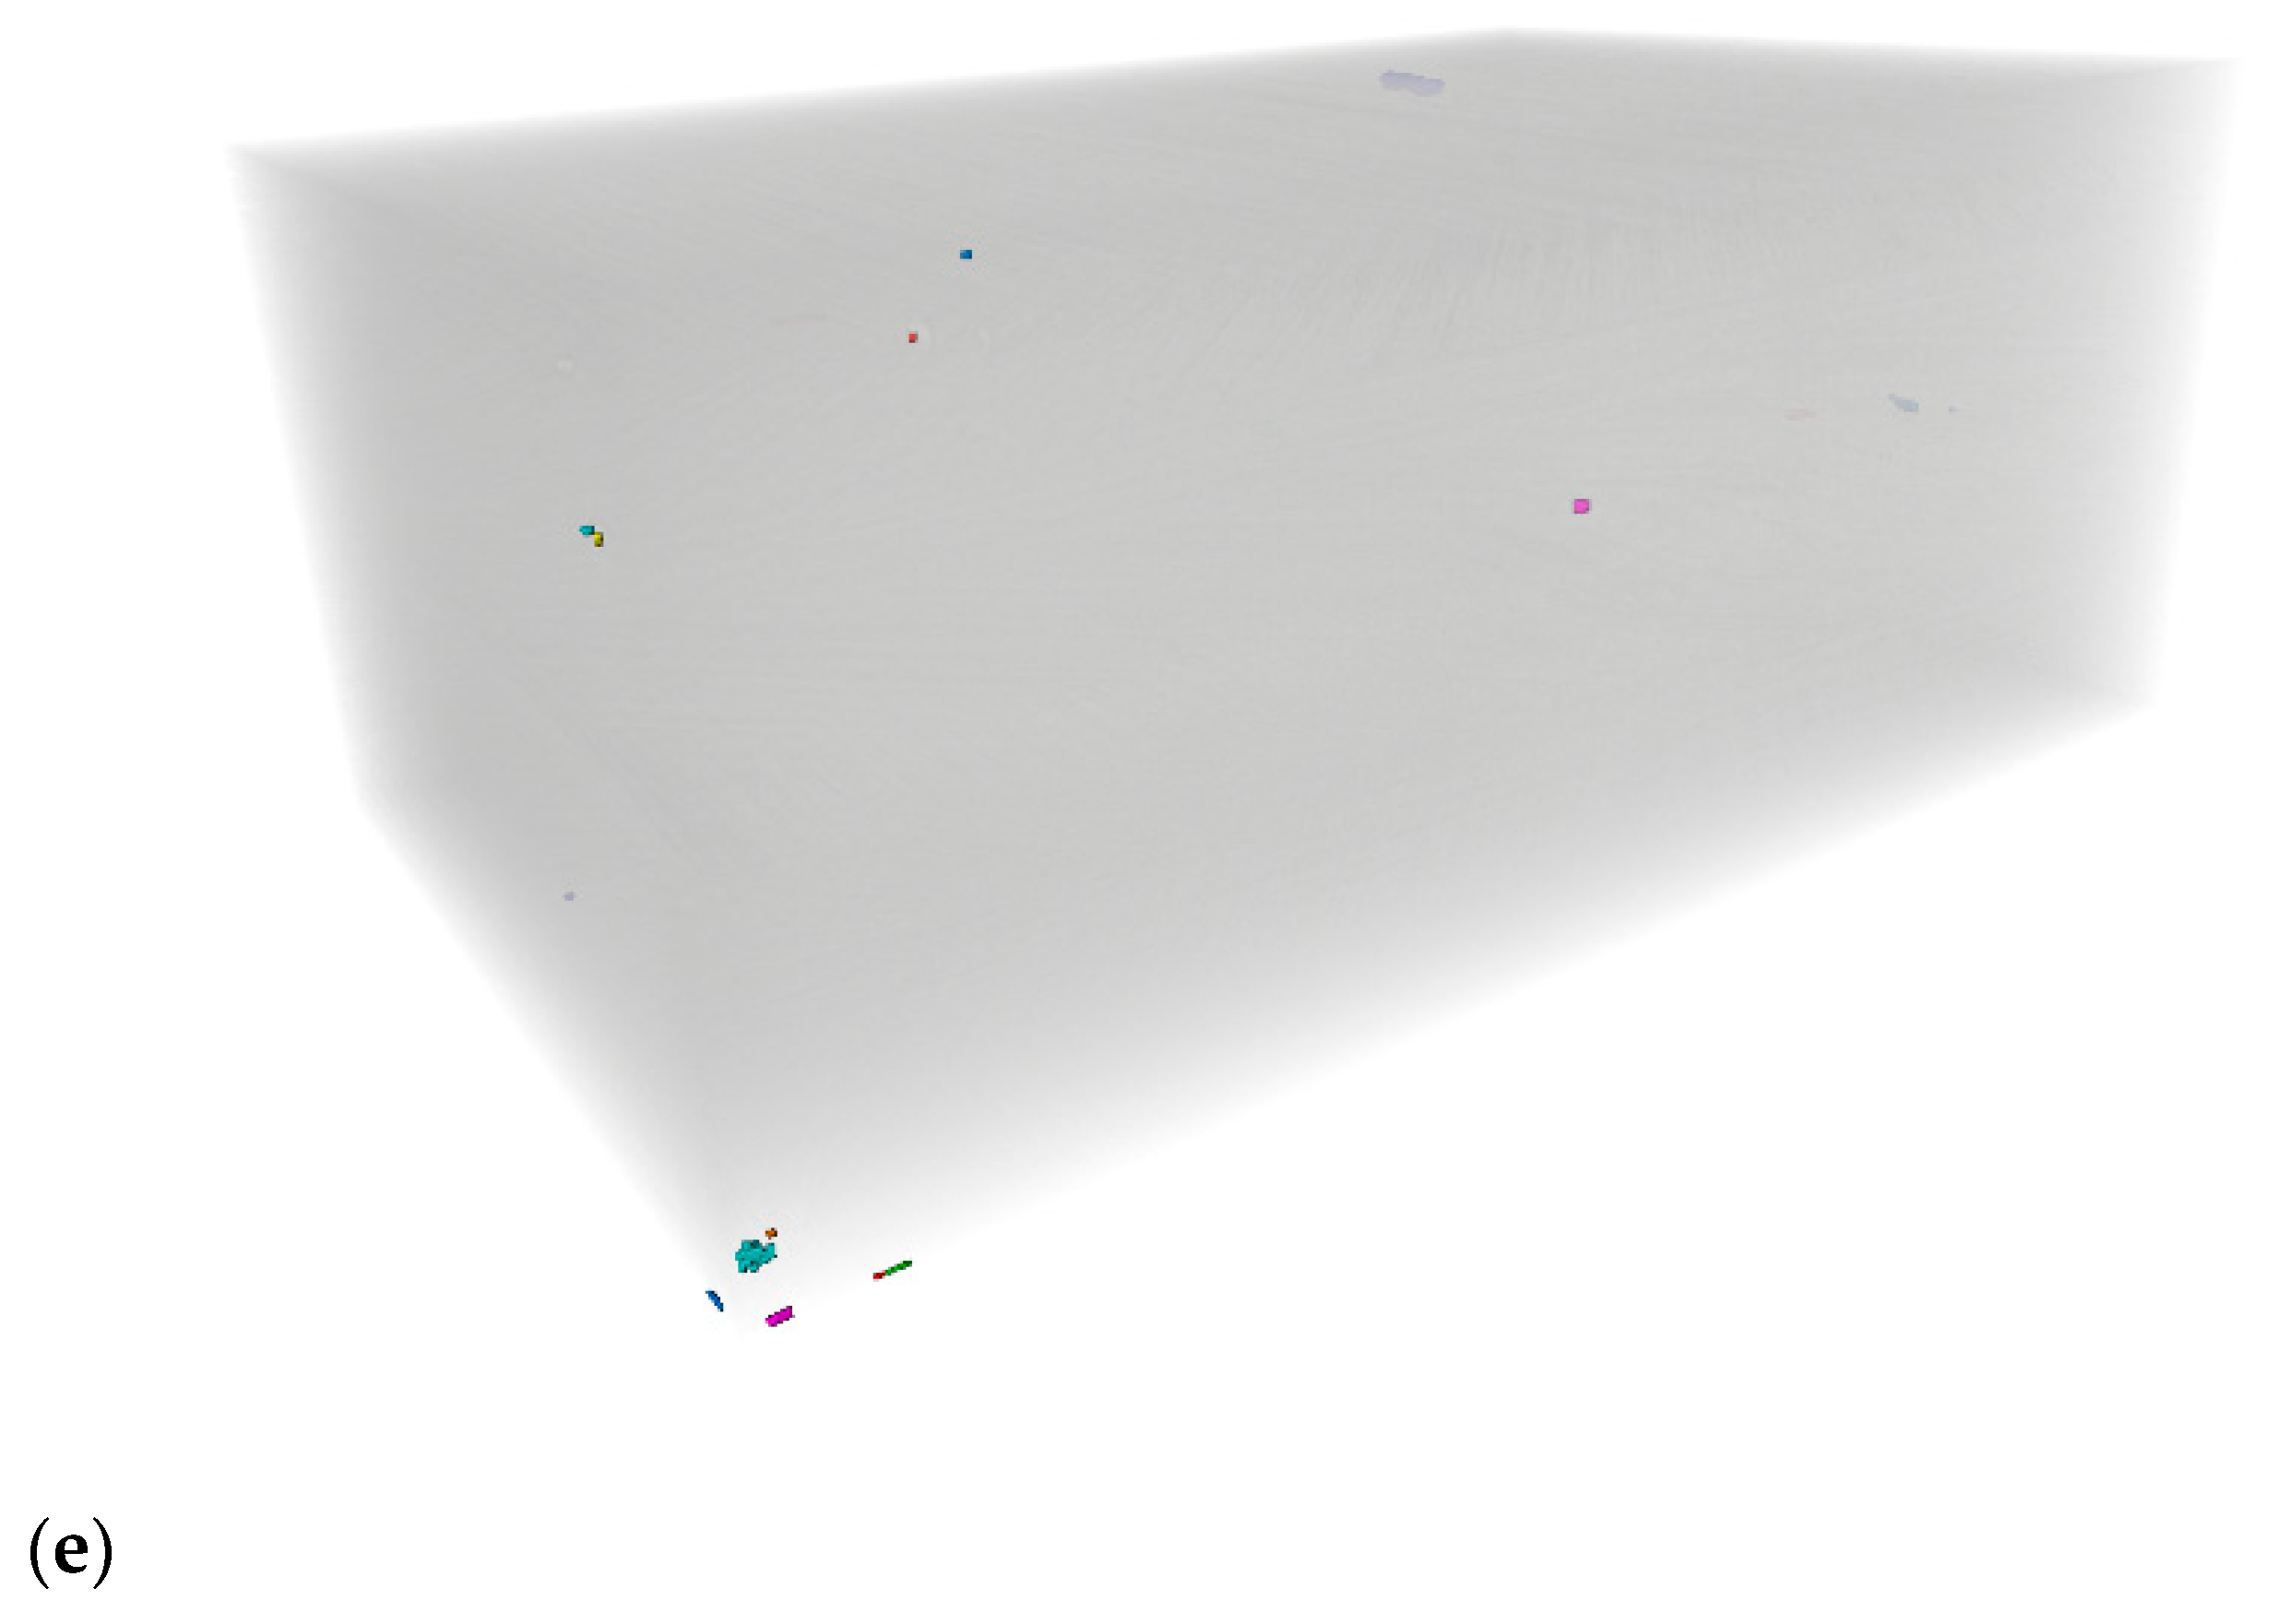
3.2.2. Effect of Pores

The underlying mechanisms for the formation of pores in CFRP have been detailed in Section 3.1. As will be shown in the present section, the process-induced pores significantly affect the residual stress measurement results obtained by HDM if they appear in high density and large size in the direct vicinity of the drilled hole. In order to estimate this effect, the FEA has been modified as follows: the elements to be drilled at a depth between 60 and 120 μm were set as pores, assigning Young’s modulus of 1 MPa and a Poisson’s ratio of 0. Afterwards, the FEA was conducted with boundary conditions as previously described. Since the multidirectional CFRP laminate is characterized by a very low degree of porosity (Figure 8a,b), only coefficients for the unidirectional laminate have been calculated.
Table 2 shows the calculated coefficients C11ij for the unidirectional CFRP being characterized by pronounced porosity at a depth between 60 and 120 μm. It is obvious that the coefficients in the items of the matrix defined as pores (marked in red) have constant values. In the incremental HDM, the coefficients are not only a function of the current drilling step but also of all previous increments. Therefore, the coefficients of a porous sample are not the same as in the case without pores. The influence of pores on the estimated residual stresses will be shown in a subsequent section.

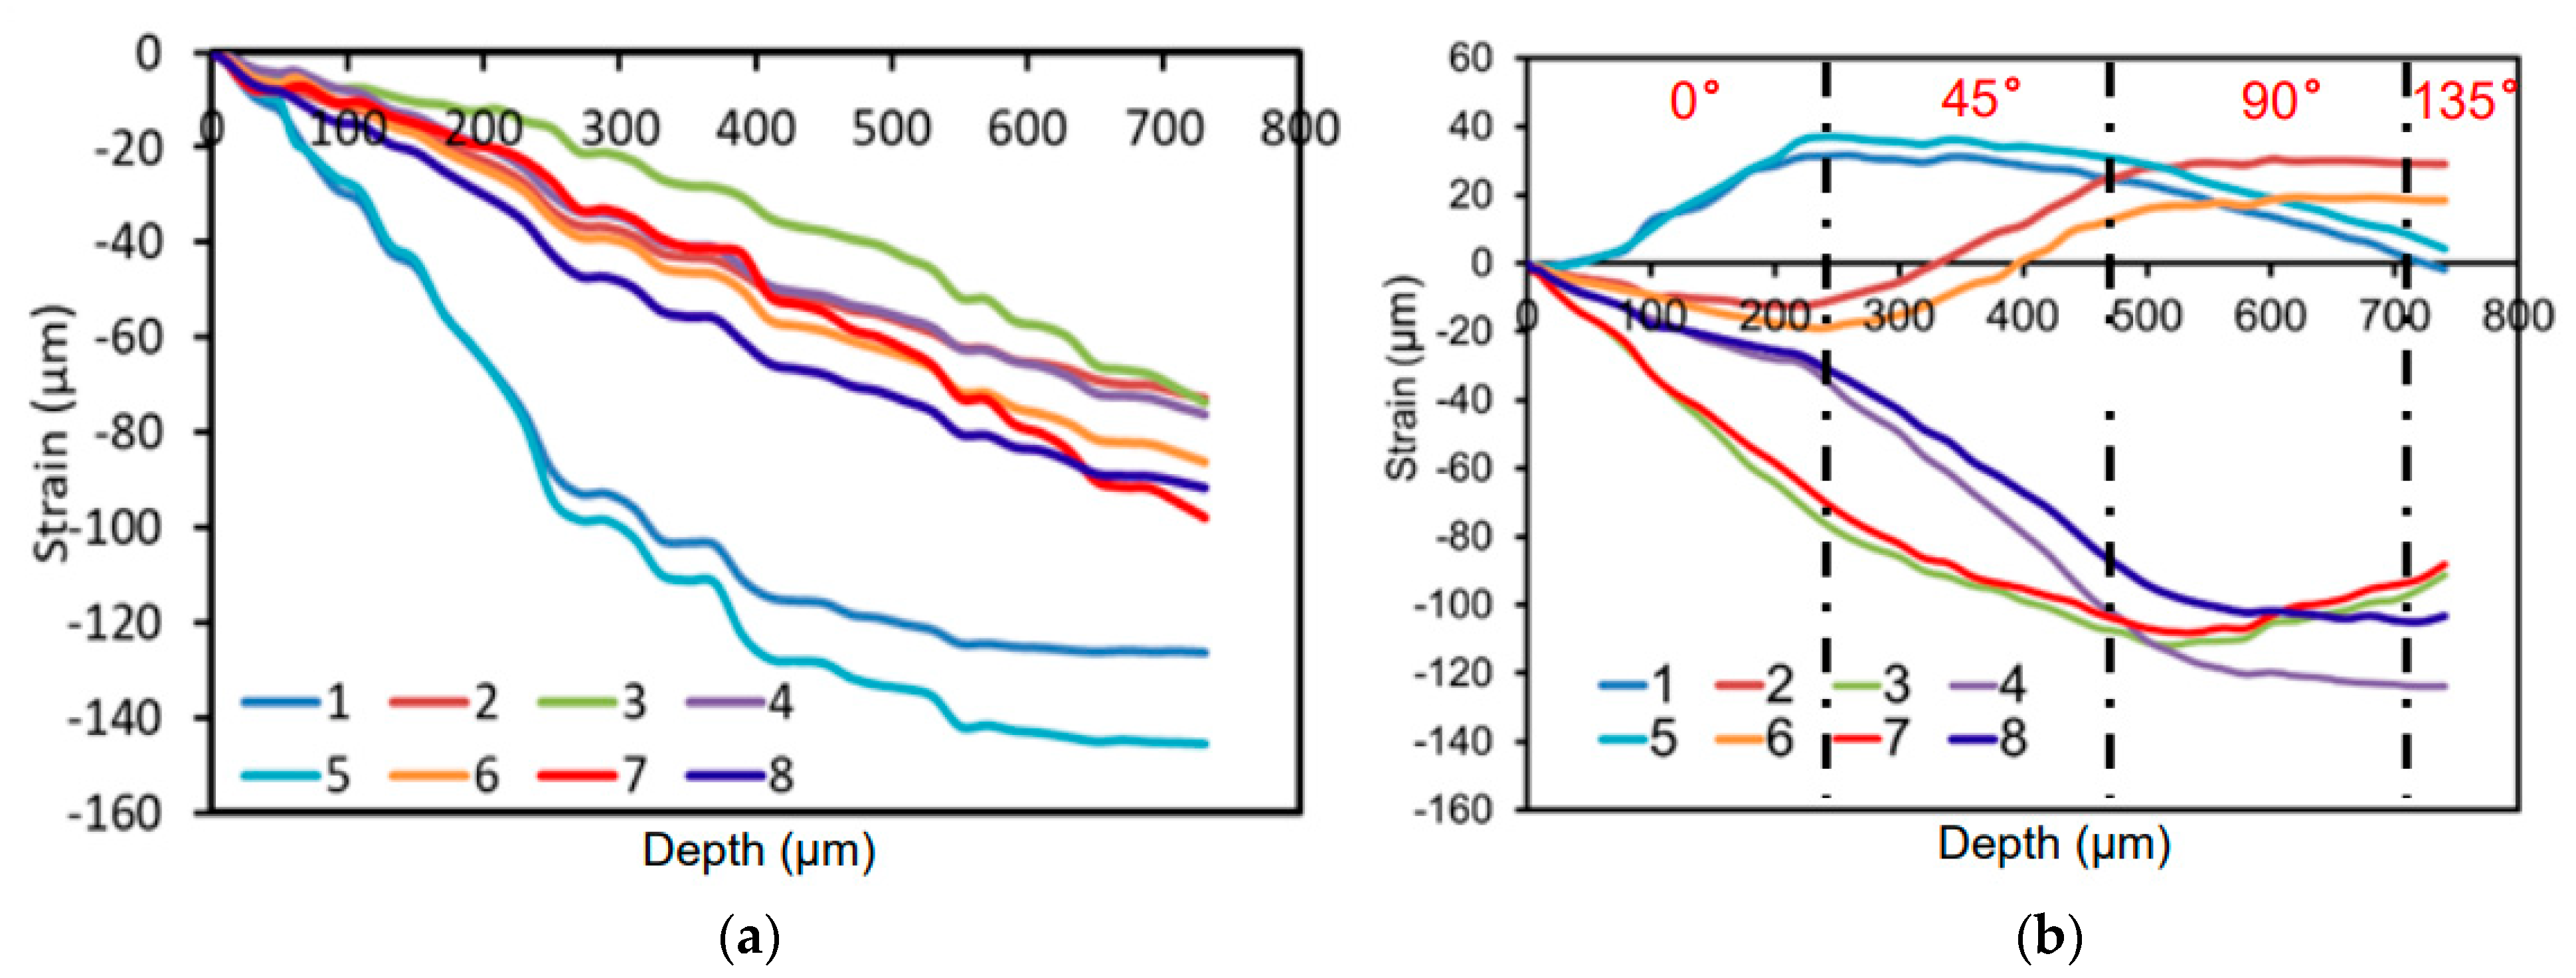
3.2.3. Strain Results by HDM

Figure 9a and b show the strain-depth results for the uni- and multidirectional CFRP samples, respectively. The absolute strain values increase with increasing drilling depth because of the relief of the residual stresses. Here, strain gauges 1 and 5 of the strain rosette employed (cf. Figure 2b) were aligned parallel with the fiber direction (of the top ply), whereas strain gauges 3 and 7 were aligned orthogonal to the fiber. Theoretically, strain values obtained by strain gauges 1 and 5 should be the same. However, a difference is present, which can be explained by local defects or heterogeneity. This phenomenon shows the significance of using the special strain gauge rosette to obtain sufficient strain information in all directions. Figure 9b depicts the strain results of the multidirectional CFRP sample up to a depth of 700 μm, crossing the first three plies with fiber directions of 0°, 45°, and 90°, respectively. For clarity, the positions of the transition zones between the neighboring plies are highlighted in the figure. At the first ply with the fiber direction of 0°, the strain values obtained by strain gauges 1 and 5, i.e., in fiber direction, increase with increasing depth, while strains decrease in other directions. This strain–depth behavior is different from that in the unidirectional CFRP (Figure 9a) and is supposed to result from the more complex stress state induced by the complex stacking sequence. In the second ply with a fiber direction of 45°, it is seen that the strains of strain gauges 1 and 5 start to decrease. Moreover, a change from compressive to tensile strain components can be deduced from strain gauges 3 and 7. Consequently, the strong influence of a change in the fiber direction, i.e., the stacking sequence, on the strain–depth response and, thus, the internal stress state of CFRP laminates is seen.

3.2.4. Effect of the Stacking Sequence on the Residual Stresses

The residual stresses σx and σy of the uni- and multidirectional CFRP samples are shown in Figure 10. Eight different combinations of strain gauges (c.f. Section 2.1) were used for assessment. The residual stresses were evaluated using the experimentally determined strains shown in Figure 9, and the calibration coefficients were calculated based on ply elastic parameters, stacking sequence, and thickness of the samples. As can be seen from the in-depth residual stress σx of the unidirectional CFRP (Figure 10a), at the surface of the sample, a tensile residual stress of around 13 MPa is present. All strain gauge combinations show the same results, except the combinations 2 and 6 (cf. Figure 2b), as those do not contain the strain information in the fiber direction. With increasing depth, the residual stress component continually decreases to about 0 MPa. When the depth reaches 0.7 mm, the stress value starts to diverge strongly as the surface strain response becomes insensitive. In direct comparison to σx, σy features a tensile value of around 4 MPa at the surface (Figure 10b), which is smaller than σx. With increasing depth, however, σy steadily increases to around 8 MPa. Note that the positions of the interfaces between plies in different samples are slightly different. After the residual stress measurement, the position of the interfaces between plies was carefully characterized.
Figure 10c shows the depth profile of the residual stress component σx in the multidirectional CFRP. At the surface, σx is characterized by tensile stress with a value of around 10 MPa. With increasing depth, then, the stress component switches several times from tension to compression and vice versa. This is mainly induced by the variation of the fiber orientation. Reaching the third ply with a fiber direction of 90°, tensile stress is seen, and this value increases with depth. In comparison, Figure 10d shows the residual stress component σy in the multidirectional CFRP sample. Close to the surface, the residual stress features a tensile value of around 25 MPa, decreasing then with depth. At the transition zone between the first and second ply, σy starts to increase. Close to the transition zone between the second and third ply, σy changes from tensile to compressive. A smooth change across the interface is obtained, which can be related to the following reasons: (1) small drilling increments, (2) the measured strains are smoothed with a polynomial of sixth-order, and the approximated strains are used for residual stress evaluation, (3) the step size in the calculation of the coefficients is consistent with the one used in the measurement, (4) an advanced formalism to evaluate the in-depth residual stresses for orthotropic materials, and (5) high-quality manufacturing of the sample with only a few defects near the interfaces.
Comparing the residual stress profiles between the uni- (a,b) and multidirectional (c,d) CFRPs in Figure 10, it is found that the course of σx of the two samples is quite different. Furthermore, absolute values of σy in the multidirectional CFRP sample are higher than in the unidirectional sample. These differences can be explained by the following reasons: (1) the complex stacking sequence in multidirectional CFRP increases the mechanical strength in multiple directions, (2) the complex stacking sequence leads to the increase in internal self-constraint force and, thus, promotes the evolution of higher residual stresses, and (3) the nonuniform distribution of the curing degree results in a more complex stress profile. In particular, the transition zones seem to have a significant influence only on the stress profile in the multidirectional laminate.

3.2.5. Effect of the Laminate Thickness on the Residual Stresses

As will be discussed in the following, the thickness of a CFRP laminate has a significant influence on the formation of residual stresses because of differences in temperature gradient and curing degree. In the present work, CFRP laminate samples with a stacking sequence of [0/90]s and with thicknesses of 1 mm, 2 mm, and 3 mm were investigated. More details of the samples can be found in Section 2.2. Note that all calibration coefficients were calculated based on the actual thickness and stacking sequence. Figure 11 shows the stress components σx and σy experimentally determined for the CFRP samples investigated. Regarding the samples with thicknesses of 2 mm and 3 mm (Figure 11c,d and Figure 11a,b, respectively), the stresses are characterized by similar profiles. At both sample surfaces, a tensile stress with a similar absolute value for σx can be seen. In contrast, for σy it is seen that the stress in the sample with a thickness of 3 mm is larger than in the sample of 2 mm. Possible explanations are (a) complex temperature gradients and degree of cure, which prevail in the thickness direction of the laminate during the curing process; these local differences induce a spatially resolved material response and a viscoelastic stress development, and (b) the effect of chemical shrinkage on residual stress development is increased with an increase in laminate thickness [5]. In the sample with 1 mm thickness, in turn, compressive residual stresses σx with small values (−5 MPa) are found, which can be explained by the sheer force between die and sample and the release of the residual stresses after the sample is removed from the die. Both factors are more apparent in the sample with 1 mm thickness because of the lower stiffness compared with other samples.

3.2.6. Effect of Porosity on the Residual Stresses

As already detailed before, pores can be induced in the manufacturing process. These can affect the residual stress measurement using HDM. To consider the pores in the FEA geometry for the calculation of the calibration coefficients, ideally, the defect population within a sample is to be measured before drilling, using any nondestructive technology, e.g., CT. In practice, however, this procedure is not viable. Because of the need for a high-resolution CT system to resolve pores in CFRP, the sample in question suffers strict limitations regarding its dimensions. Furthermore, strain gauges cannot be attached to the surface of a CT sample for the same reason. Therefore, following the analysis shown in Section 3.2.2 detailing the influence of artificially defined pores on the calibration coefficients, those results are used in the present work to evaluate the effect of pores on the resulting residual stresses as well. We choose the unidirectional CFRP sample for analysis. Figure 12 shows the residual stress profile of σx in the sample using calibration coefficients of defect-free and porous material for evaluation. The results are derived from strain gauges 1, 2, and 3. As mentioned in Section 3.2.2, pores at a depth of 0.06 mm to 0.12 mm were accounted for in the model. As a consequence of these differences, a maximum difference of 46% in stress between the two sample conditions can be observed at a hole depth of 0.65 mm. Eventually, based on the theory used in incremental HDM, any defects present in the upper layers also affect the results in the deeper parts of the sample. Note that the labels in Figure 12, “With pore” and “Without pore”, refer to the consideration of pores in the calculation of calibration coefficients.

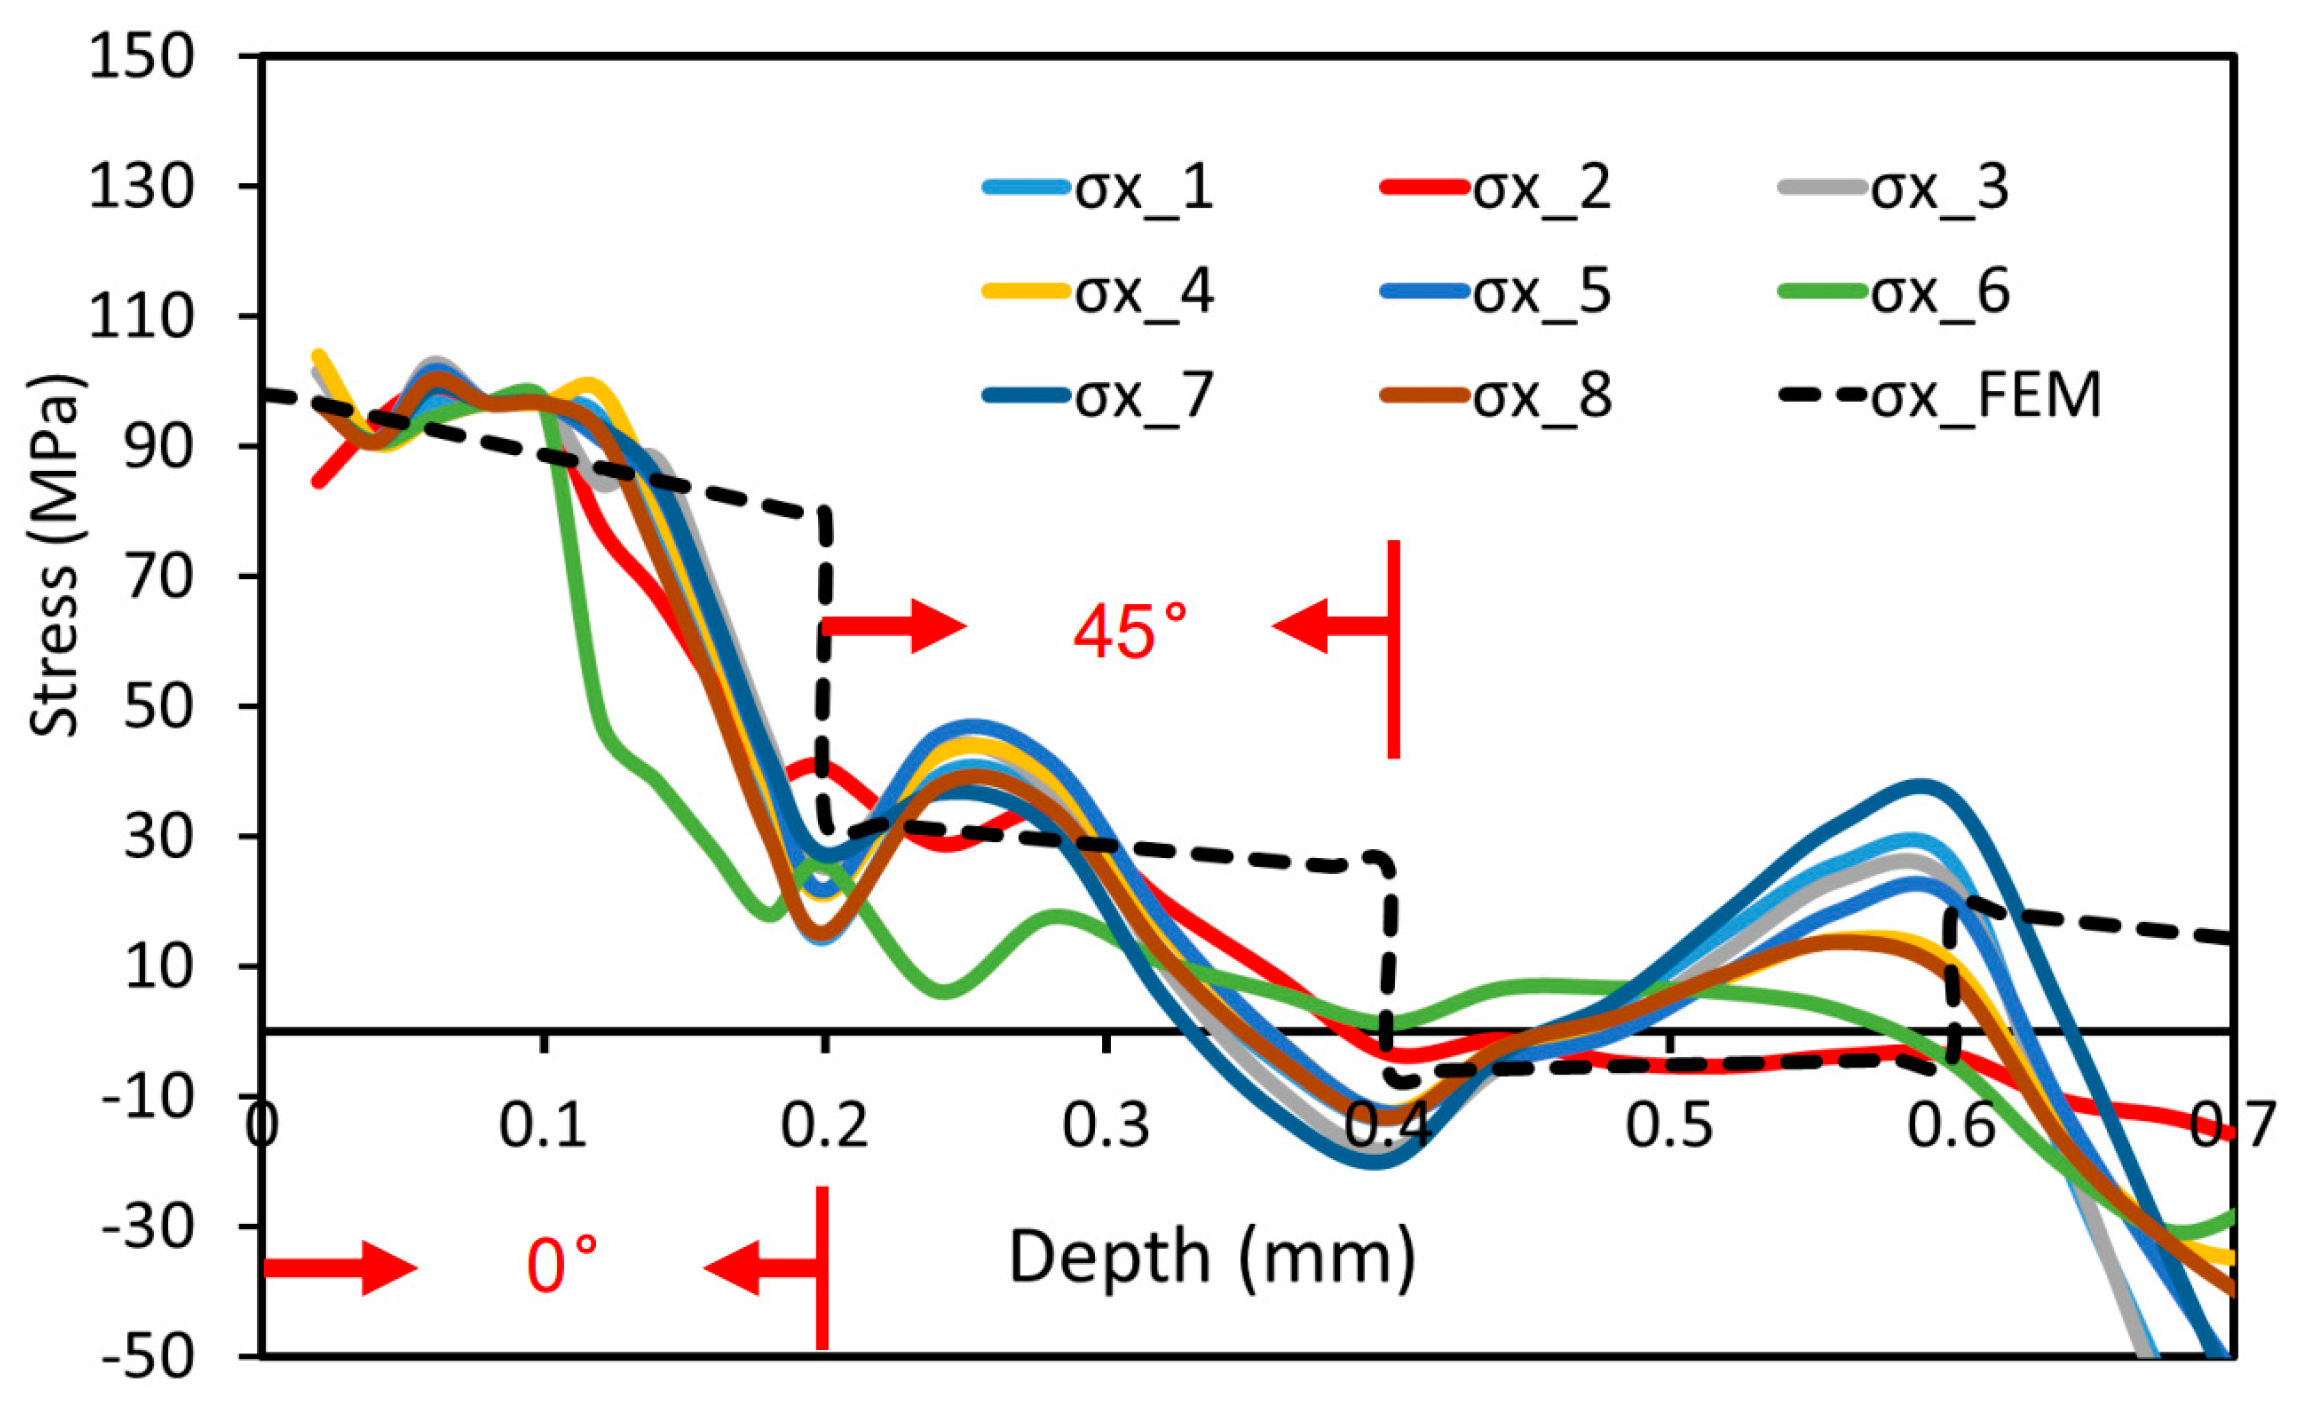
3.3. Validation of Residual Stress Measurement

The objective of this section is the validation of the residual stress measurements (in multidirectional CFRP) using bending tests employing a defined loading condition. The stacking sequence and dimension of the sample can be found in Section 2.2. This procedure was already used successfully for thin metal sheets and polycarbonate material [1,23]. As shown in Figure 13, for validation, a residual stress measurement is initially conducted at a distance of 40 mm from the free edge of the CFRP beam. One side of the sample is clamped, while the other side is loaded (cantilever beam). With the given load, the bending stresses within the whole sample can be calculated via FEA. In the present study, a maximum force of 814 N is applied, leading to the stress of about 100 MPa in the longitudinal direction on the surface at the drilling point. Under constant load, another hole is drilled next to the first one (being drilled without external load) at a distance of 5 mm. Without loading, the residual stresses of two adjacent points are supposed to be very similar. Therefore, the stress induced by loading is obtained as the difference between the measured residual stress values (without external load) and the total stress values (with external load).
In Figure 14, the measured stress values in the longitudinal direction are directly compared to the values from the FEA, where the dashed line corresponds to the FEA results. In general, a good agreement between experimental and numerical results can be seen. With respect to the first ply featuring a fiber orientation of 0°, i.e., being parallel to the longitudinal direction, the discrepancy between simulation and experimental results at a depth of 0.1 mm is around 5.2%. Close to the first interface between the first two plies, an apparent discrepancy can be seen. At the second ply with a fiber orientation of 45° with respect to the longitudinal direction, the stress level is reduced as the mechanical strength in the longitudinal direction is decreased. While a good agreement can still be observed within the second ply, again, a clear difference between numerical and experimental results is present at the second interface. At the third ply with fiber orientation of 90°, i.e., perpendicular to the longitudinal direction, the lowest stresses, which are in good agreement with the simulation, can be observed as the mechanical strength perpendicular to the fiber direction is low. In the following, however, with reaching a depth of 0.55 mm, a clear discrepancy between the numerical and experimental results appears. This tendency results from the increasing insensitivity of the strain measurement on the sample surface with increasing hole depth.
It can be concluded that, in general, a good agreement between numerical and experimental can be achieved, implying that the measurement results through HDM are reliable. The apparent discrepancy at the interface between plies can be attributed to the following reasons: (1) the assumption that the laminate is perfectly bonded in the calculation of the calibration coefficients, (2) the local defect population and heterogeneity of the CFRP samples affect the experimental results; however, they are not considered here (see discussion before), and (3) the experimentally determined strains are approximated with a polynomial of sixth order for residual stress evaluation. Thus, it is capable of providing a smooth residual stress profile but losing some information at the interface.

4. Conclusions

In the present work, residual stress measurements of carbon fiber reinforced plastics (CFRPs) are conducted and analyzed. The residual stresses were measured through the incremental hole-drilling method (HDM), adopting a formalism for nonuniform in-depth stress analysis in orthotropic materials. Special strain gauges with eight grids were employed for recording strains released by drilling in multiple directions to improve the reliability of the analysis. The calibration coefficients (compliance matrix) were calculated by a finite element analysis (FEA) based on single-ply material properties, stacking sequence, and thickness of the sample. In addition, the two- and three-dimensional microstructures of uni- and multidirectional CFRP were characterized.
A comprehensive analysis of the effects of stacking sequence, thickness, and the presence of pores on the residual stresses is presented. The following conclusions can be drawn from the results shown:
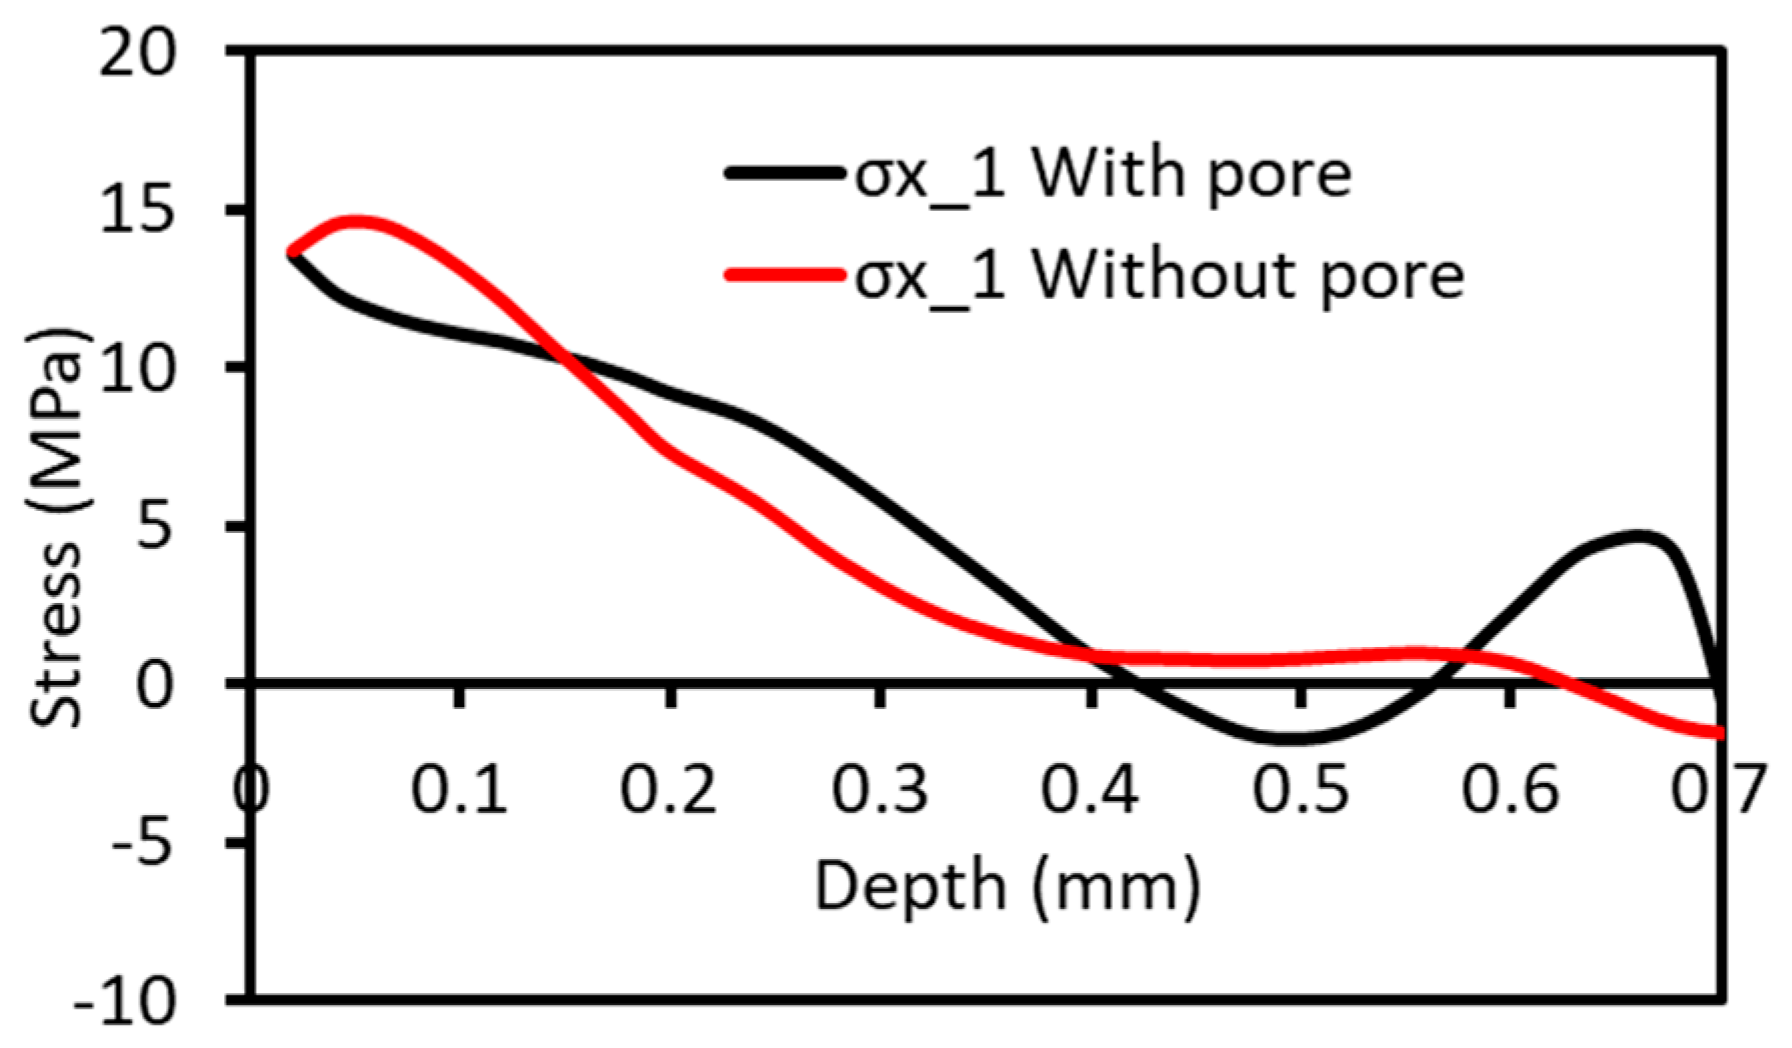
  • The two- and three-dimensional microstructures of unidirectional and multidirectional CFRP samples were characterized by computed tomography (CT). Pores were found in the samples, indicating the significance of taking into account these pores in residual stress analysis. Analysis of the effect of pores was implemented in the calibration procedure. Pores were artificially defined for the calculation of the calibration coefficients in a depth of 0.06 mm to 0.12 mm. Those results were used to evaluate the effect of pores on the resulting residual stresses. A maximum difference of 46% in stress between defect-free and porous material sample conditions can be observed at a hole depth of 0.65 mm;
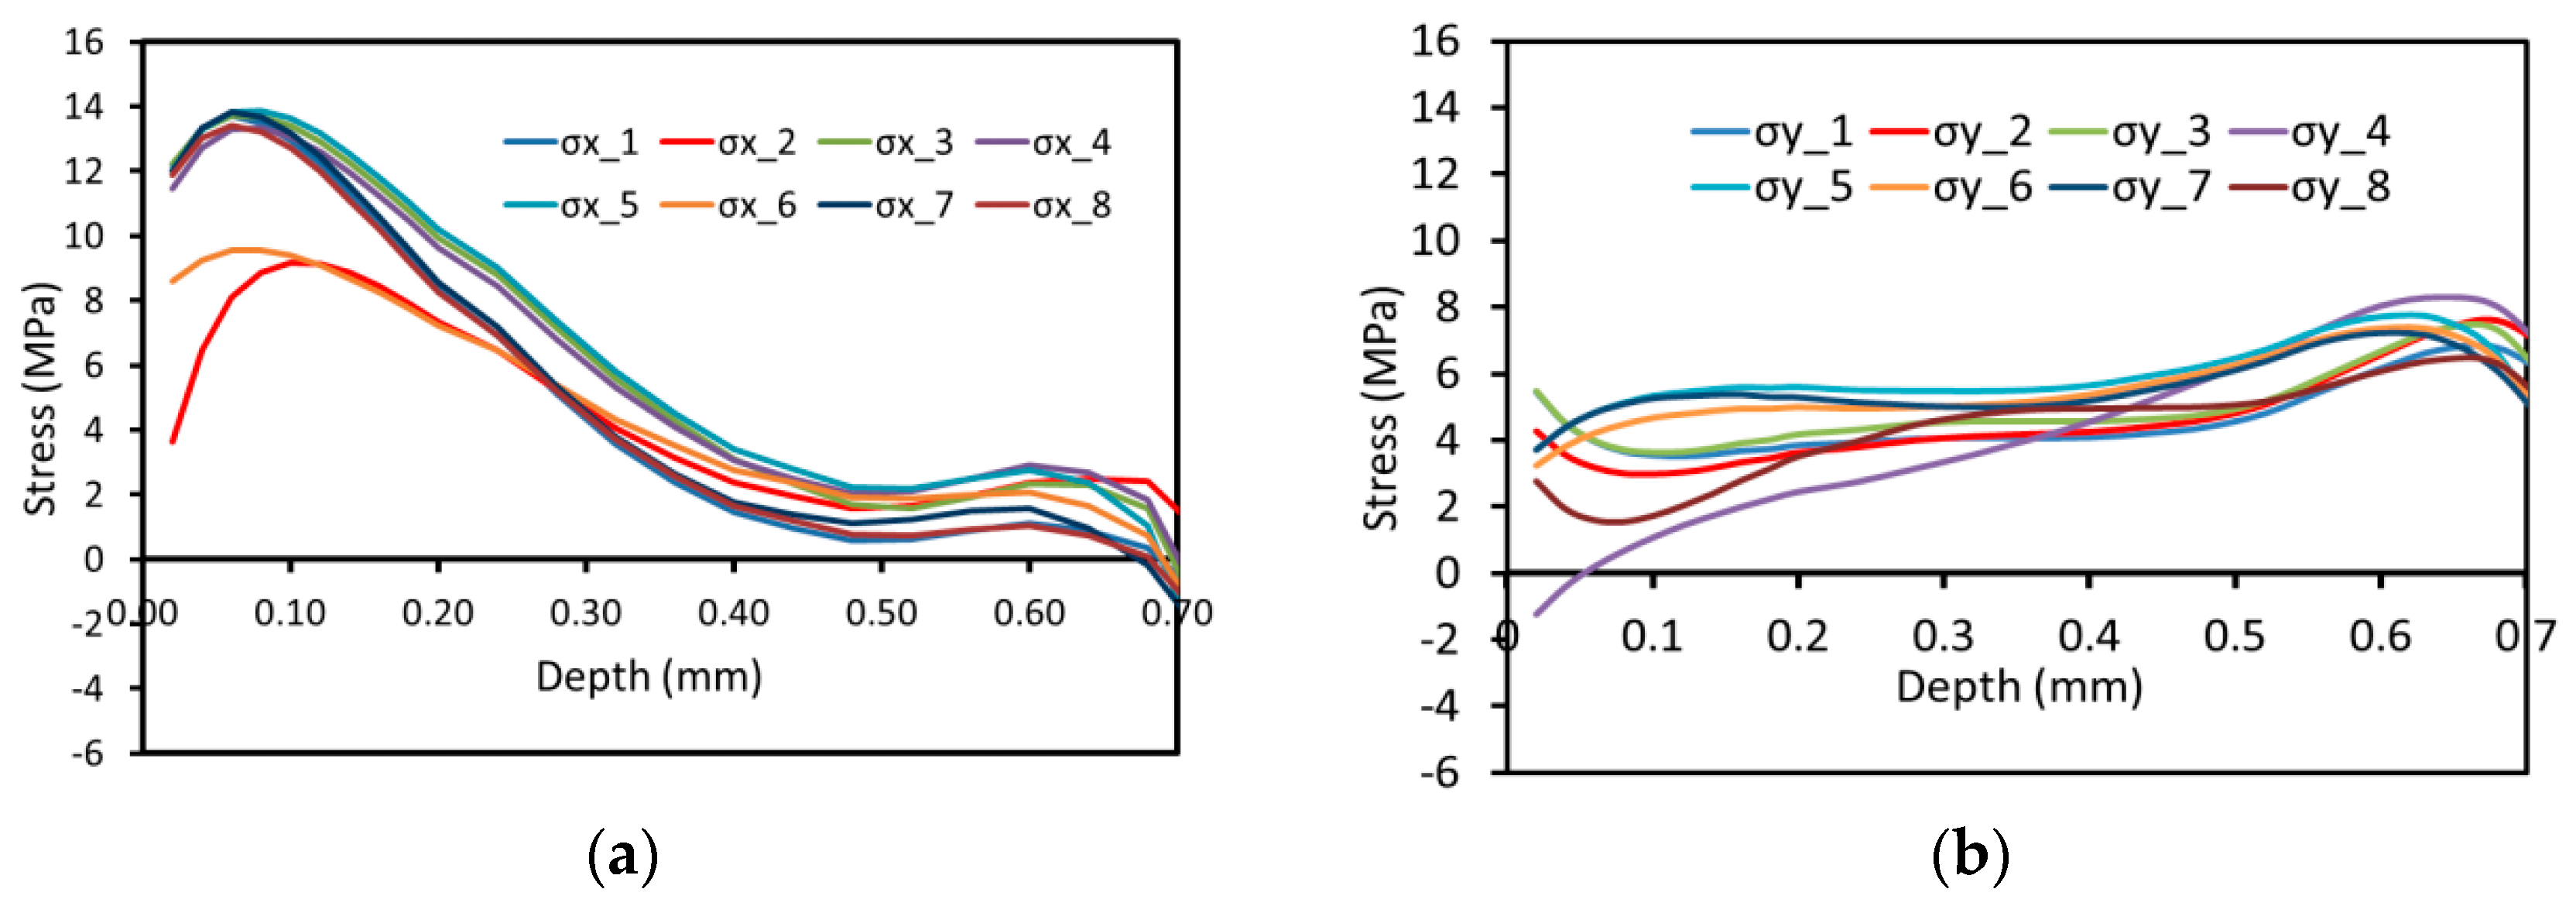
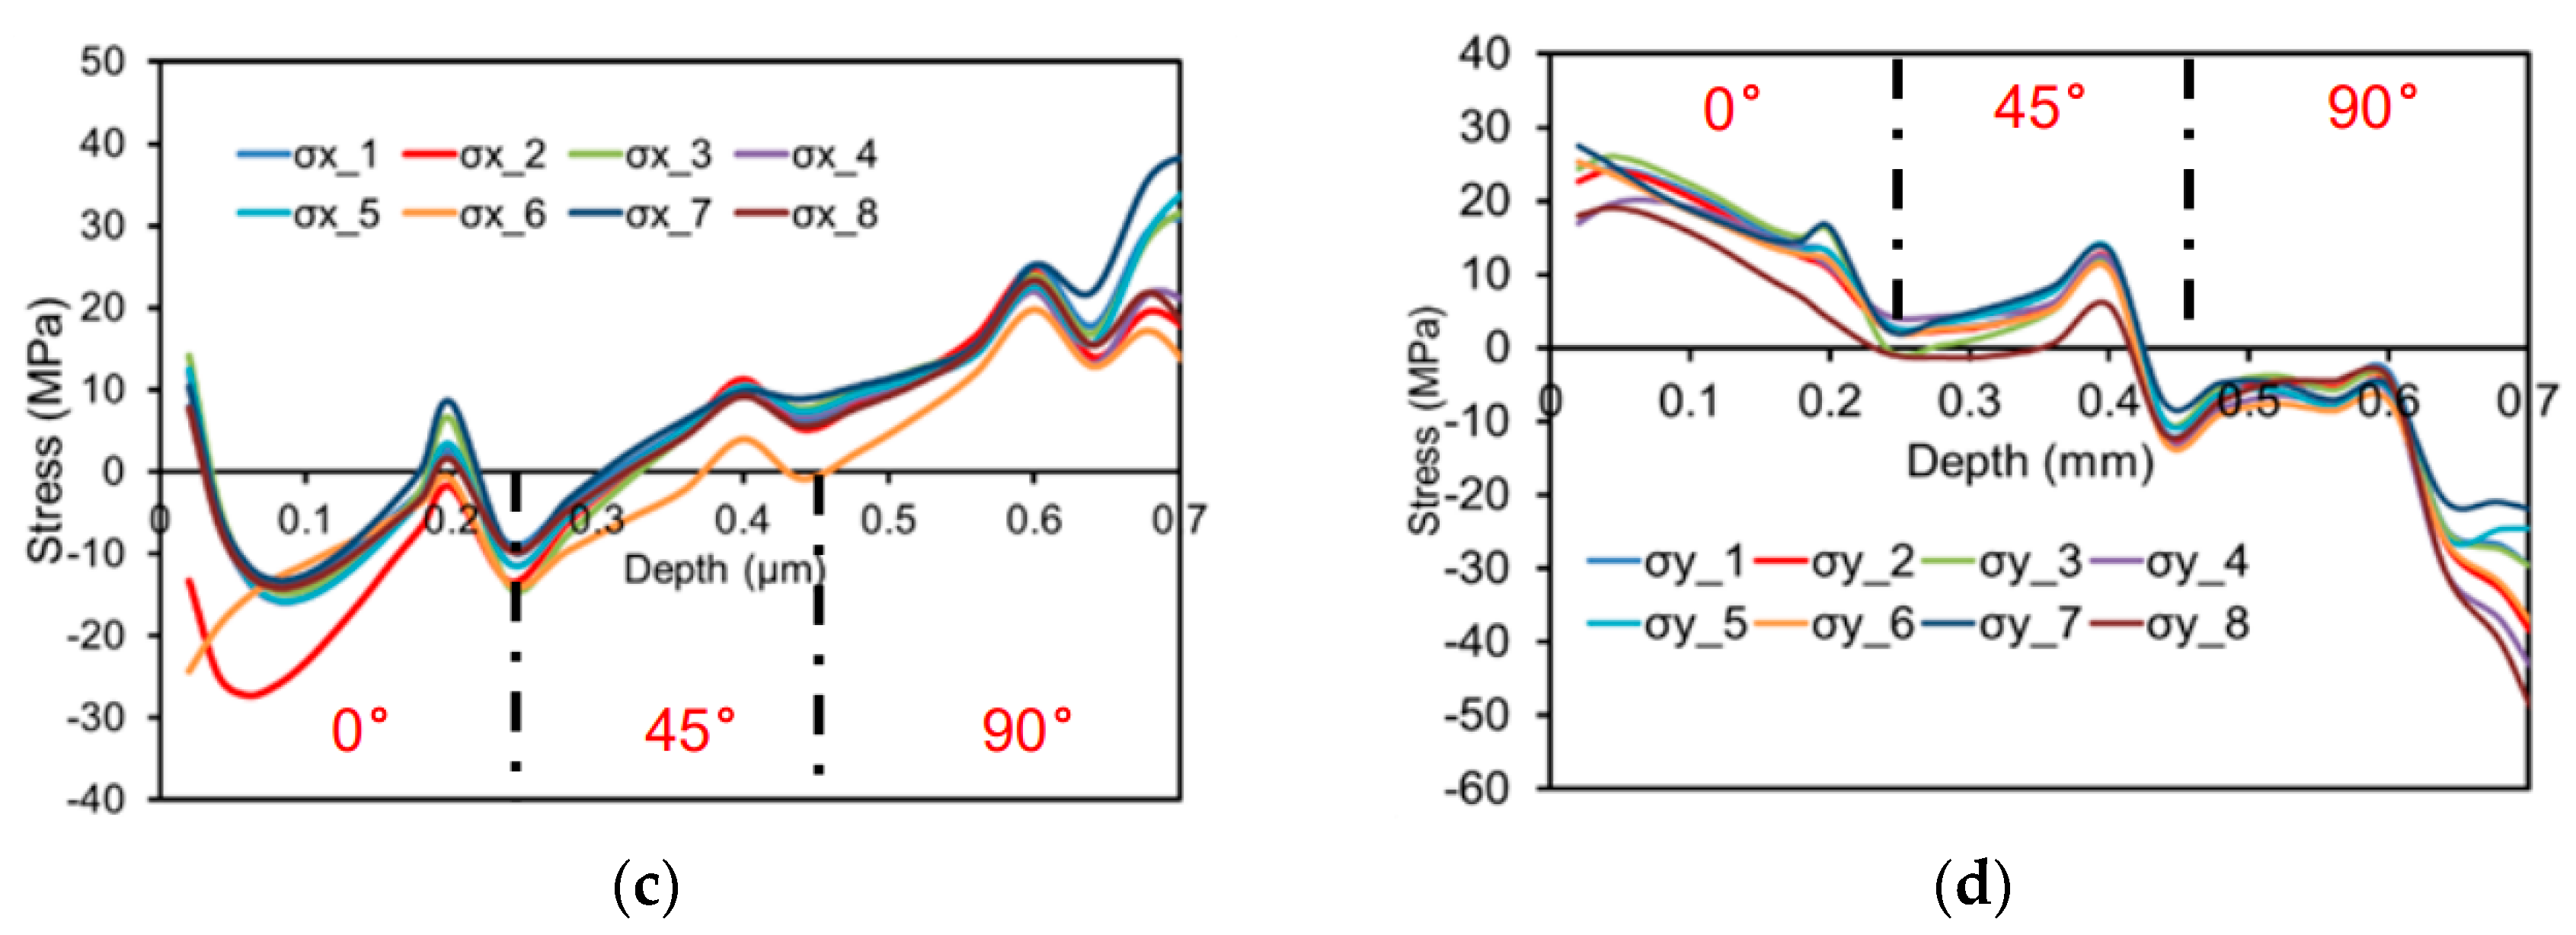
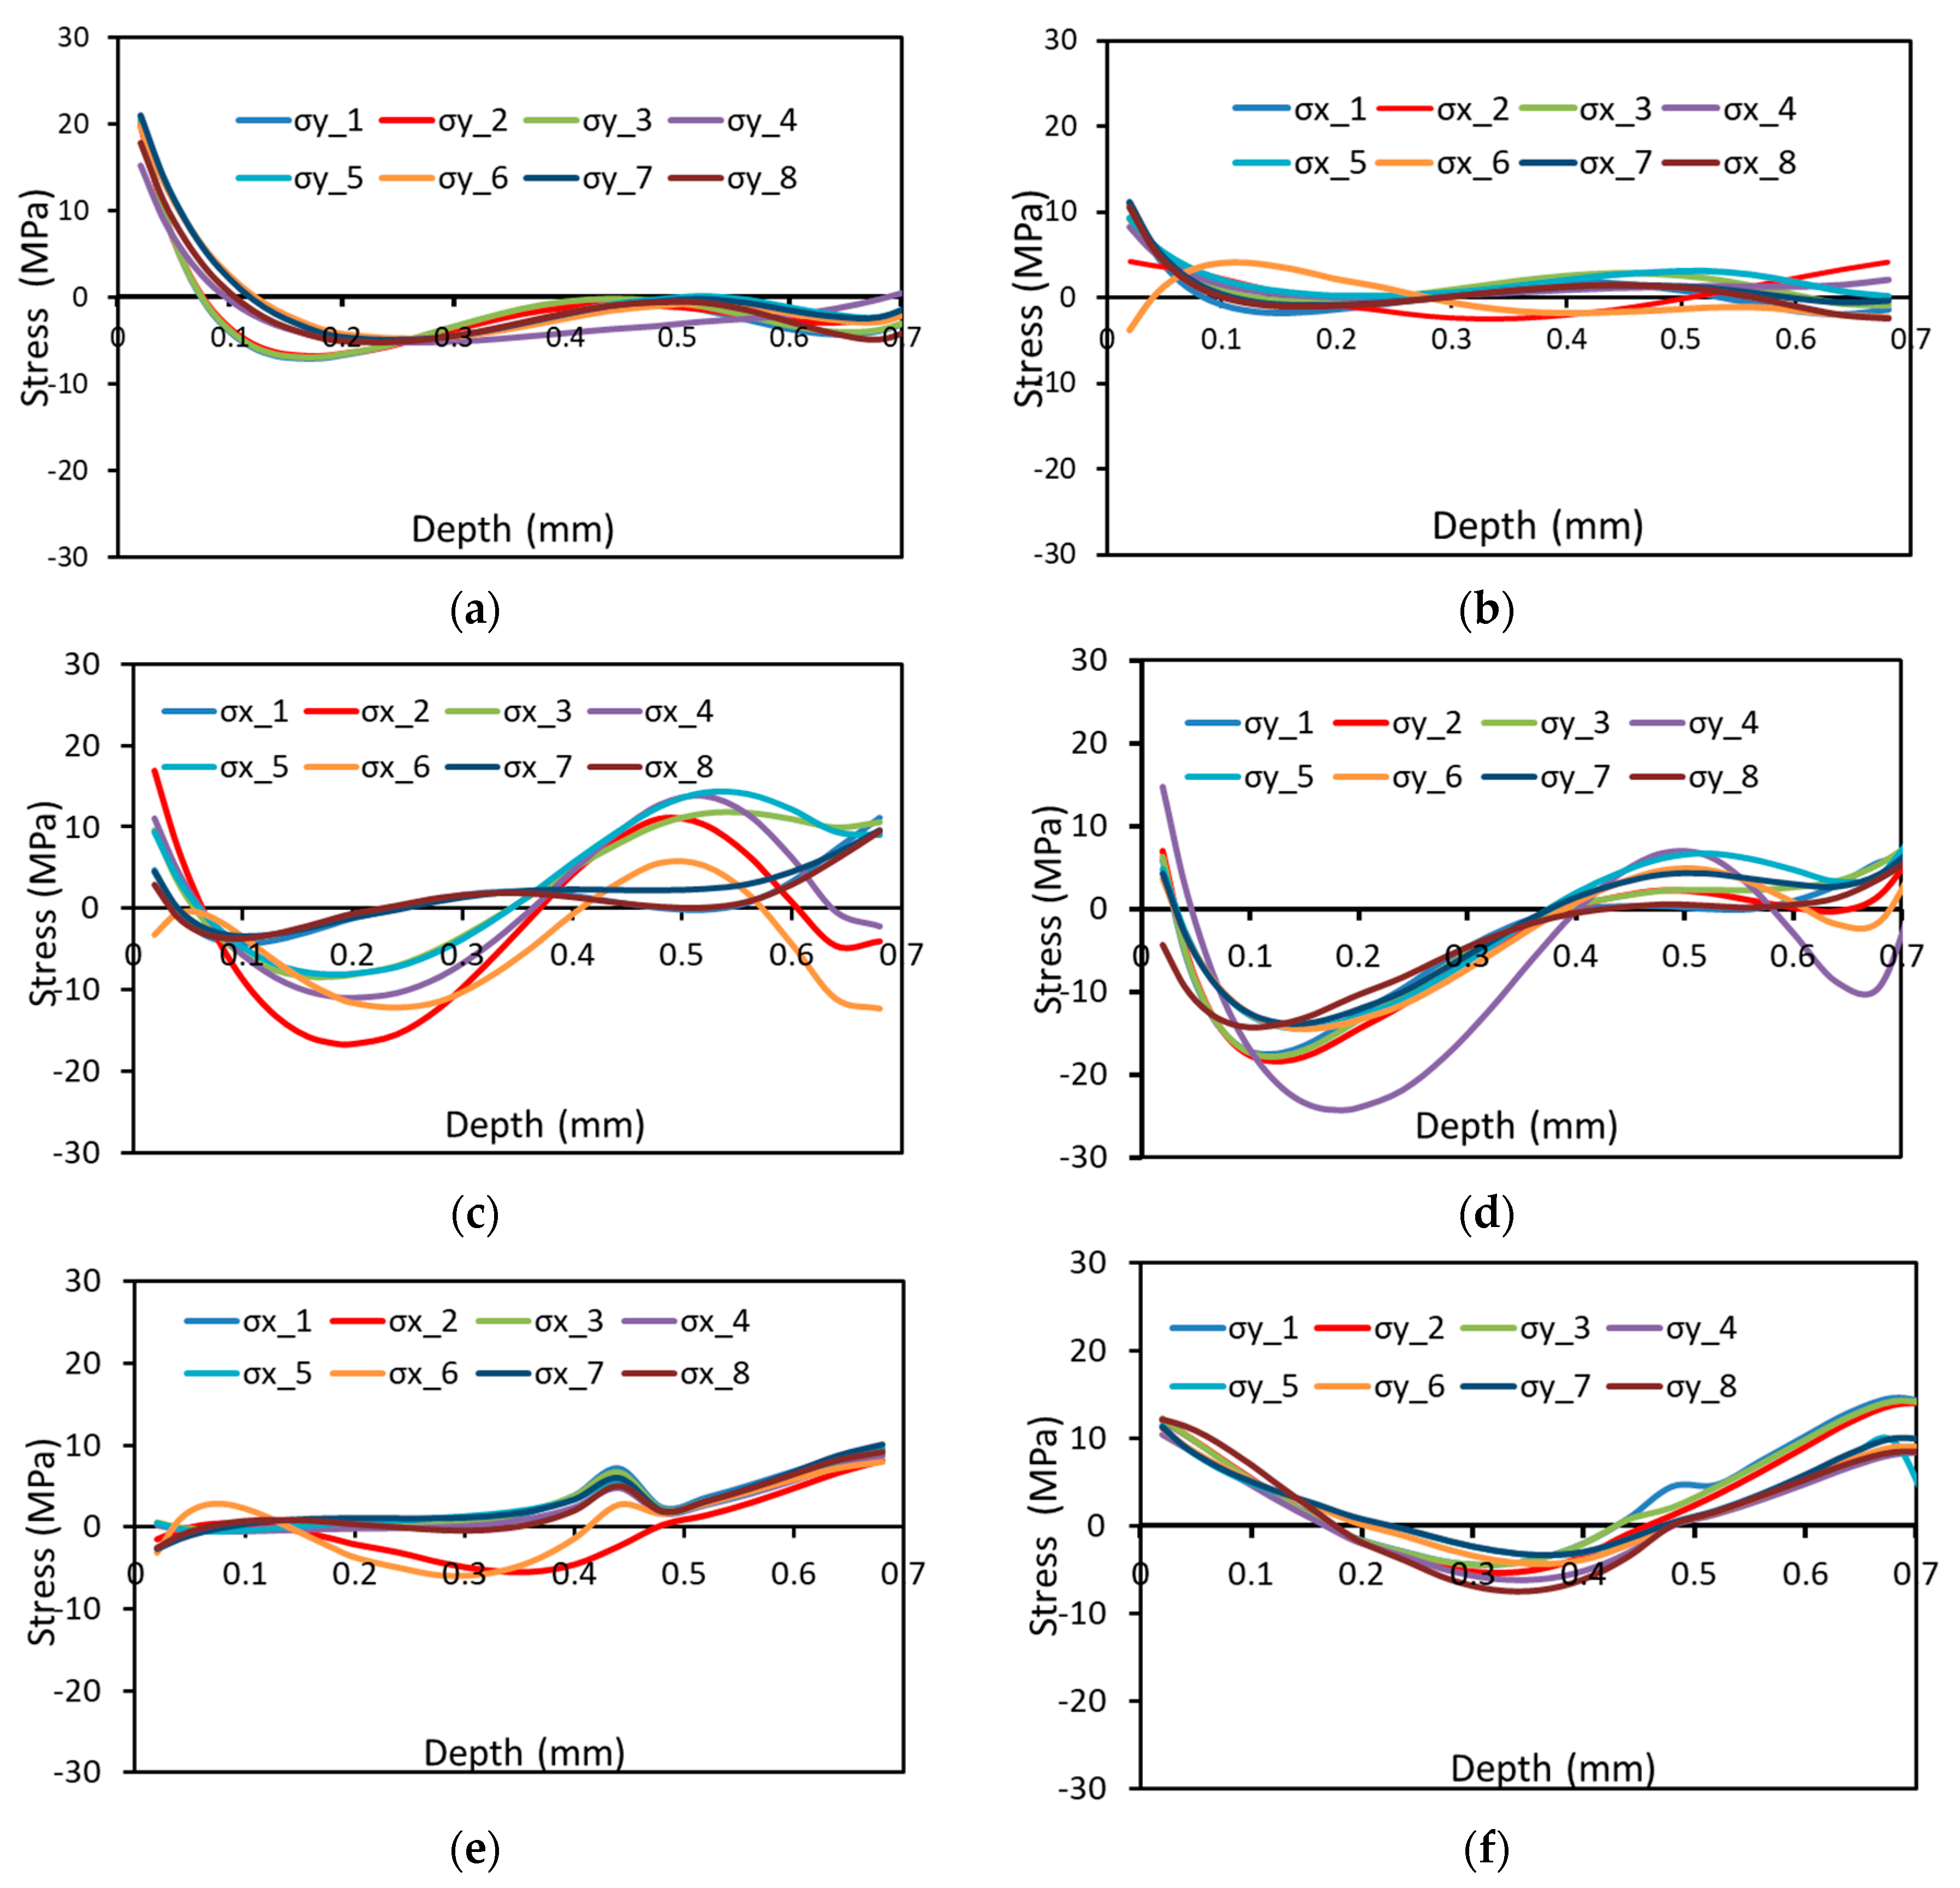
  • Based on FEA, the effect of the stacking sequence and the presence of pores on the calibration coefficients were studied. The stacking sequence and overall dimensions of the CFRP samples have a significant influence on the residual stress state;
  • For validating the reliability of the measured residual stress through incremental HDM, a bending test applying a defined load was carried out. The residual stress measurements were compared with the stress values calculated by FEA (beam theory). A good agreement could be found in individual plies. The present apparent discrepancy at the interface between plies is due to the following reasons: (i) the laminate is assumed to be perfectly bonded, and (ii) the experimentally determined strains are approximated with a polynomial of sixth order for residual stress evaluation, losing some information at the interface.

Author Contributions

Conceptualization, T.N. and T.T.; methodology, T.W.; software, T.W.; validation, T.W., W.Z. and S.T.; formal analysis, T.W.; investigation, T.W. and R.K.; writing—original draft preparation, T.W.; writing—review and editing, T.W., C.L. and T.N.; supervision, T.N. and T.T.; project administration, T.W., W.Z. and S.T.; funding acquisition, T.N. and T.T. All authors have read and agreed to the published version of the manuscript.

Funding

This research was funded by the Deutsche Forschungsgemeinschaft (DFG) with project number 399304816.

Institutional Review Board Statement

Not applicable.

Informed Consent Statement

Not applicable.

Data Availability Statement

Data are available upon reasonable requests.

Conflicts of Interest

The authors declare no conflict of interest.

References

  1. Alam, P.; Mamalis, D.; Robert, C.; Floreani, C.; Brádaigh, C. The fatigue of carbon fibre reinforced plastics-A review. Compos. B. Eng. 2019, 166, 555–579. [Google Scholar] [CrossRef] [Green Version]
  2. Cutolo, A.; Carotenuto, A.R.; Palumbo, S.; Esposito, L.; Minutolo, V.; Fraldi, M.; Ruocco, E. Stacking sequences in composite laminates through design optimization. Meccanica 2021, 56, 1555–1574. [Google Scholar] [CrossRef]
  3. Wang, H.; Duan, Y.; Abulizi, D.; Zhang, X. Design optimization of CFRP stacking sequence using a multi-island genetic algorithms under low-velocity impact loads. J. Wuhan Univ. Technol. Sci. Ed. 2017, 32, 720–725. [Google Scholar] [CrossRef]
  4. Parlevliet, P.P.; Bersee, H.E.N.; Beukers, A. Residual stresses in thermoplastic composites—A study of the literature. Part III: Effects of thermal residual stresses. Compos. Part A Appl. Sci. Manuf. 2007, 38, 1581–1596. [Google Scholar]
  5. Parlevliet, P.P.; Bersee, H.E.N.; Beukers, A. Residual stresses in thermoplastic composites—A study of the literature—Part I: Formation of residual stresses. Compos. Part A Appl. Sci. Manuf. 2006, 37, 1847–1857. [Google Scholar] [CrossRef]
  6. Li, Y.; Li, Q.; Ma, H. The voids formation mechanisms and their effects on the mechanical properties of flax fiber reinforced epoxy composites. Compos. Part A Appl. Sci. Manuf. 2015, 72, 40–48. [Google Scholar] [CrossRef]
  7. Mehdikhani, M.; Gorbatikh, L.; Verpoest, I.; Lomov, S.V. Voids in fiber-reinforced polymer composites: A review on their formation, characteristics, and effects on mechanical performance. J. Compos. Mater. 2019, 53, 1579–1669. [Google Scholar] [CrossRef]
  8. Seers, B.; Tomlinson, R.; Fairclough, P. Residual stress in fiber reinforced thermosetting composites: A review of measurement techniques. Polym. Compos. 2021, 42, 1631–1647. [Google Scholar] [CrossRef]
  9. Cowley, K.D.; Beaumont, P.W. The measurement and prediction of residual stresses in carbon-fibre/polymer composites. Compos. Sci. Technol. 1997, 57, 1445–1455. [Google Scholar] [CrossRef]
  10. Dreier, S.; Benkena, B. Determination of Residual Stresses in Plate Material by Layer Removal with Machine-integrated Measurement. Procedia CIRP 2014, 24, 103–107. [Google Scholar] [CrossRef] [Green Version]
  11. Wu, T.; Tinkloh, S.R.; Tröster, T.; Zinn, W.; Niendorf, T. Residual stress measurements in GFRP/steel hybrid components. In Proceedings of the 4th International Conference Hybrid 2020: Materials and Structures, Web-Conference, 28–29 April 2020; pp. 1–6. [Google Scholar]
  12. Sibisi, P.N.; Popoola, A.P.I.; Arthur, N.K.K.; Pityana, S.L. Review on direct metal laser deposition manufacturing technology for the Ti-6Al-4V alloy. Int. J. Adv. Manuf. Technol. 2020, 107, 1163–1178. [Google Scholar] [CrossRef]
  13. Wu, T.; Tinkloh, S.; Tröster, T.; Zinn, W.; Niendorf, T. Measurement and Analysis of Residual Stresses and Warpage in Fiber Reinforced Plastic and Hybrid Components. Metals 2021, 11, 335. [Google Scholar] [CrossRef]
  14. Nau, A.; von Mirbach, D.; Scholtes, B. Improved Calibration Coefficients for the Hole-DrillingMethod Considering the Influenceof the Poisson Ratio. Exp. Mech. 2013, 53, 1371–1381. [Google Scholar] [CrossRef]
  15. Magnier, A.; Zinn, W.; Niendorf, T.; Scholtes, B. Residual Stress Analysis on Thin Metal Sheets Using the Incremental Hole Drilling Method–Fundamentals and Validation. Exp. Tech. 2019, 43, 65–79. [Google Scholar] [CrossRef]
  16. Nau, A.; Scholtes, B. Evaluation of the High-Speed Drilling Technique for the Incremental Hole-DrillingMethod. Exp. Mech. 2013, 53, 531–542. [Google Scholar] [CrossRef]
  17. ASTM E837-13; Standard Test Method for Determining Residual Stresses by the Hole-Drilling Strain-Gage Method. ASTM: West Conshohocken, PA, USA, 2013.
  18. Blödorn, R.; Bonomo, L.A.; Viotti, M.; Schroeter, R.B.; Albertazzi, A. Calibration Coefficients Determination Through Fem Simulations for the Hole-Drilling Method Considering the Real Hole Geometry. Exp. Tech. 2017, 41, 37–44. [Google Scholar] [CrossRef]
  19. Kümmel, F.; Magnier, A.; Wu, T.; Niendorf, T.; Höppel, H.W. Residual stresses in ultrafine-grained laminated metal composites analyzed by X-ray diffraction and the hole drilling method. Adv. Eng. Mater. 2022, in press. [Google Scholar] [CrossRef]
  20. Sicot, O.; Gong, X.L.; Cherouat, A.; Lu, J. Determination of Residual Stress in Composite Laminates Using the Incremental Hole-drilling Method. J. Compos. Mater. 2003, 37, 831–844. [Google Scholar] [CrossRef]
  21. Magnier, A.; Wu, T.; Tinkloh, S.; Tröster, T.; Scholtes, B.; Niendorf, T. On the reliability of residual stress measurements in unidirectional carbon fibre reinforced epoxy composites. Polym. Test. 2021, 97, 107146. [Google Scholar] [CrossRef]
  22. Schajer, G.S.; Yang, L. Residual-stress measurement in orthotropic materials using the hole-drilling method. Exp. Mech. 1994, 34, 324–333. [Google Scholar] [CrossRef]
  23. Wu, T.; Tinkloh, S.; Tröster, T.; Zinn, W.; Niendorf, T. Determination and Validation of Residual Stresses in CFRP/Metal Hybrid Components Using theIncremental Hole Drilling Method. J. Compos. Sci. 2020, 4, 143. [Google Scholar] [CrossRef]
  24. Feldkamp, L.A.; Davis, L.C.; Krss, J.W. Practical Cone-Beam Algorithm. J. Opt. Soc. Am. A 1984, 1, 612–619. [Google Scholar] [CrossRef] [Green Version]
  25. Howe, C.A.; Paton, R.J.; Goodwin, A.A. A Comparison between Voids in RTM and Prepreg Carbon/Epoxy Laminates. In Proceedings of the Eleventh International Conferenceon Composite Materials (ICCM11), Gold Coast, Australia, 14–18 July 1997. [Google Scholar]
Figure 1. Framework of measuring the residual stresses by the hole-drilling method.
Jcs 06 00138 g001
Figure 2. Schematic of (a) a typical three-element strain gauge with corresponding coordinate system and (b) a special strain gauge rosette with eight grids used for strain measurement in the present work.
Jcs 06 00138 g002
Figure 3. Schematic detailing the stress states and hole depths considered to obtain the calibration coefficients for the three initial drilling increments.
Jcs 06 00138 g003
Figure 4. Finite element analysis model in ABAQUS software for calculating the calibration coefficients in orthotropic materials, displaying local mesh refinement in the direct vicinity of the drilled hole (recompiled from [23]).
Jcs 06 00138 g004
Figure 5. Dimensions and stacking sequence of the multidirectional CFRP [0/45/90/135/180/−135/−90/−45/0] laminate.
Jcs 06 00138 g005
Figure 6. Cross-sectional microstructure characterization of the multidirectional CFRP sample.
Jcs 06 00138 g006
Figure 7. Cross-sectional optical micrographs of a drilled hole in the multidirectional CFRP sample, embedded in resin.
Jcs 06 00138 g007
Figure 8. CT analysis of the CFRP samples: (a) Sketch of the cut planes for two-dimensional microstructure characterization. Two-dimensional microstructure of unidirectional (b) and multidirectional (c) CFRP. Three-dimensional microstructure of unidirectional (d) and multidirectional (e) CFRP with pores shown in color.
Jcs 06 00138 g008aJcs 06 00138 g008bJcs 06 00138 g008c
Figure 9. Measured surface strains in 8 directions as a function of drilling depth for (a) the unidirectional and (b) multidirectional (b) CFRP.
Jcs 06 00138 g009
Figure 10. Depth-dependent residual stresses σx (a,c) and σy (b,d) of uni- (a,b) and multidirectional (c,d) CFRP, respectively, for 8 different combinations of strain gage directions.
Jcs 06 00138 g010aJcs 06 00138 g010b
Figure 11. Depth-dependent residual stresses σx (a,c,e) and σy (b,d,f) of CFRP with thickness of 3 mm (a,b), 2 mm (c,d), and 1 mm (e,f), respectively.
Jcs 06 00138 g011
Figure 12. Residual stress profiles for the material being free of pores and featuring porosity.
Jcs 06 00138 g012
Figure 13. Experimental setup used for validation of the residual stress profiles.
Jcs 06 00138 g013
Figure 14. Validation of the residual stress measurements in the multidirectional CFRP sample based on the assessment of stresses introduced by superimposed load and a direct comparison to FEA. Solid lines show experimentally determined bending stress, while the dashed line illustrates the FEA results. See text for details.
Jcs 06 00138 g014
Table 1. Calculated coefficients C11ij of the unidirectional (a) and multidirectional (b) CFRP sample and (c) the relative difference between both samples in percentage.
Depth (μm)20406080100120140160180200240280320360400
20−2.4200000000000000
40−2.74−2.580000000000000
60−3.02−2.90−2.69000000000000
80−3.29−3.18−3.02−2.7600000000000
100−3.54−3.43−3.29−3.10−2.800000000000
120−3.78−3.67−3.54−3.37−3.15−2.81000000000
140−4.01−3.90−3.77−3.61−3.42−3.17−2.8100000000
160−4.23−4.11−3.98−3.84−3.66−3.44−3.17−2.780000000
180−4.43−4.31−4.18−4.04−3.87−3.67−3.43−3.14−2.74000000
200−4.62−4.50−4.38−4.23−4.07−3.88−3.65−3.40−3.10−2.6800000
240−4.97−4.85−4.73−4.59−4.42−4.24−4.04−3.82−3.57−3.29−5.510000
280−5.27−5.16−5.03−4.89−4.73−4.55−4.36−4.15−3.92−3.68−6.54−5.16000
320−5.55−5.42−5.29−5.15−4.99−4.83−4.64−4.43−4.22−3.98−7.23−6.14−4.7800
360−5.77−5.65−5.53−5.38−5.23−5.05−4.87−4.67−4.46−4.24−7.77−6.78−5.70−4.380
400−5.97−5.85−5.72−5.58−5.43−5.26−5.07−4.87−4.67−4.45−8.23−7.28−6.29−5.24−3.98
(a)
Depth (μm)20406080100120140160180200240280320360400
20−1.3300000000000000
40−1.59−1.470000000000000
60−1.83−1.74−1.57000000000000
80−2.06−1.97−1.84−1.6300000000000
100−2.28−2.2−2.08−1.92−1.690000000000
120−2.5−2.41−2.3−2.16−1.98−1.72000000000
140−2.72−2.63−2.52−2.38−2.23−2.03−1.7600000000
160−2.93−2.83−2.73−2.6−2.45−2.28−2.08−1.80000000
180−3.14−3.05−2.94−2.82−2.68−2.52−2.34−2.14−1.87000000
200−3.38−3.3−3.2−3.08−2.95−2.8−2.64−2.48−2.29−2.0500000
240−3.53−3.44−3.34−3.22−3.08−2.94−2.78−2.62−2.46−2.27−3.690000
280−3.62−3.54−3.43−3.31−3.18−3.03−2.88−2.73−2.57−2.39−4.15−3.16000
320−3.7−3.61−3.51−3.39−3.26−3.11−2.96−2.81−2.65−2.49−4.4−3.62−2.7700
360−3.77−3.68−3.57−3.45−3.32−3.17−3.02−2.87−2.72−2.56−4.57−3.87−3.19−2.450
400−3.82−3.73−3.62−3.5−3.37−3.23−3.08−2.93−2.78−2.62−4.72−4.06−3.45−2.87−2.24
(b)
Depth (μm)20406080100120140160180200240280320360400
200.45000000000000000
400.4190.4300000000000000
600.3940.40.416000000000000
800.3730.3800.3900.40900000000000
1000.3550.3580.3670.3800.3960000000000
1200.3380.3430.3500.3590.3710.387000000000
1400.3210.3250.3310.3400.3470.3590.37300000000
1600.3070.3110.3140.3220.3300.3370.3430.3520000000
1800.2910.2920.2960.3010.3070.3130.3170.3180.317000000
2000.2680.2660.2690.2710.2750.2780.2760.2700.2610.23500000
2400.2890.2900.2930.2980.3030.3060.3110.3140.3100.3100.3300000
2800.3130.3130.3180.3230.3270.3340.3390.3420.3440.3500.3650.387000
3200.3330.3330.3360.3410.3460.3560.3620.3650.3720.3740.3910.4100.42000
3600.3460.3480.3540.3580.3650.3720.3790.3850.3900.3960.4110.4290.4400.4400
4000.3600.3620.3670.3720.3790.3850.3920.3980.4040.4110.4260.4420.4420.4420.437
(c)
Table 2. Calculated coefficients C11ij of unidirectional CFRP under consideration of pores.
Depth (μm)20406080100120140160180200240280320360400
20−1.5100000000000000
40−1.76−1.640000000000000
60−1.98−1.88−1.75000000000000
80−1.98−1.88−1.75−1.5900000000000
100−1.98−1.88−1.75−1.59−1.350000000000
120−1.98−1.88−1.75−1.59−1.35−1.32000000000
140−2.30−2.20−2.08−1.93−1.76−1.55−1.2700000000
160−2.44−2.34−2.22−2.08−1.91−1.72−1.50−1.220000000
180−2.57−2.47−2.34−2.20−2.04−1.86−1.66−1.44−1.16000000
200−2.69−2.58−2.46−2.32−2.16−1.99−1.80−1.59−1.37−1.0900000
240−2.89−2.78−2.66−2.53−2.37−2.20−2.02−1.83−1.63−1.43−2.180000
280−3.06−2.96−2.83−2.69−2.53−2.37−2.19−2.01−1.82−1.64−2.72−1.90000
320−3.21−3.09−2.96−2.82−2.67−2.50−2.33−2.15−1.97−1.79−3.06−2.37−1.6300
360−3.32−3.20−3.08−2.94−2.78−2.61−2.44−2.26−2.08−1.91−3.31−2.66−2.04−1.390
400−3.41−3.29−3.17−3.03−2.87−2.70−2.53−2.35−2.18−2.00−3.51−2.88−2.30−1.75−1.18
Publisher’s Note: MDPI stays neutral with regard to jurisdictional claims in published maps and institutional affiliations.

