
Inhibition of Cyclooxygenase-2 Alters Craniofacial Patterning during Early Embryonic Development of Chick


Abstract
:1. Introduction
2. Methodology
2.1. Animal Maintenance
2.2. Experimental Design
2.3. Histological Study
2.4. Western Blot
2.5. COX-2 Activity Assay
2.6. RNA Isolation and Quantitative RT-PCR
3. Results
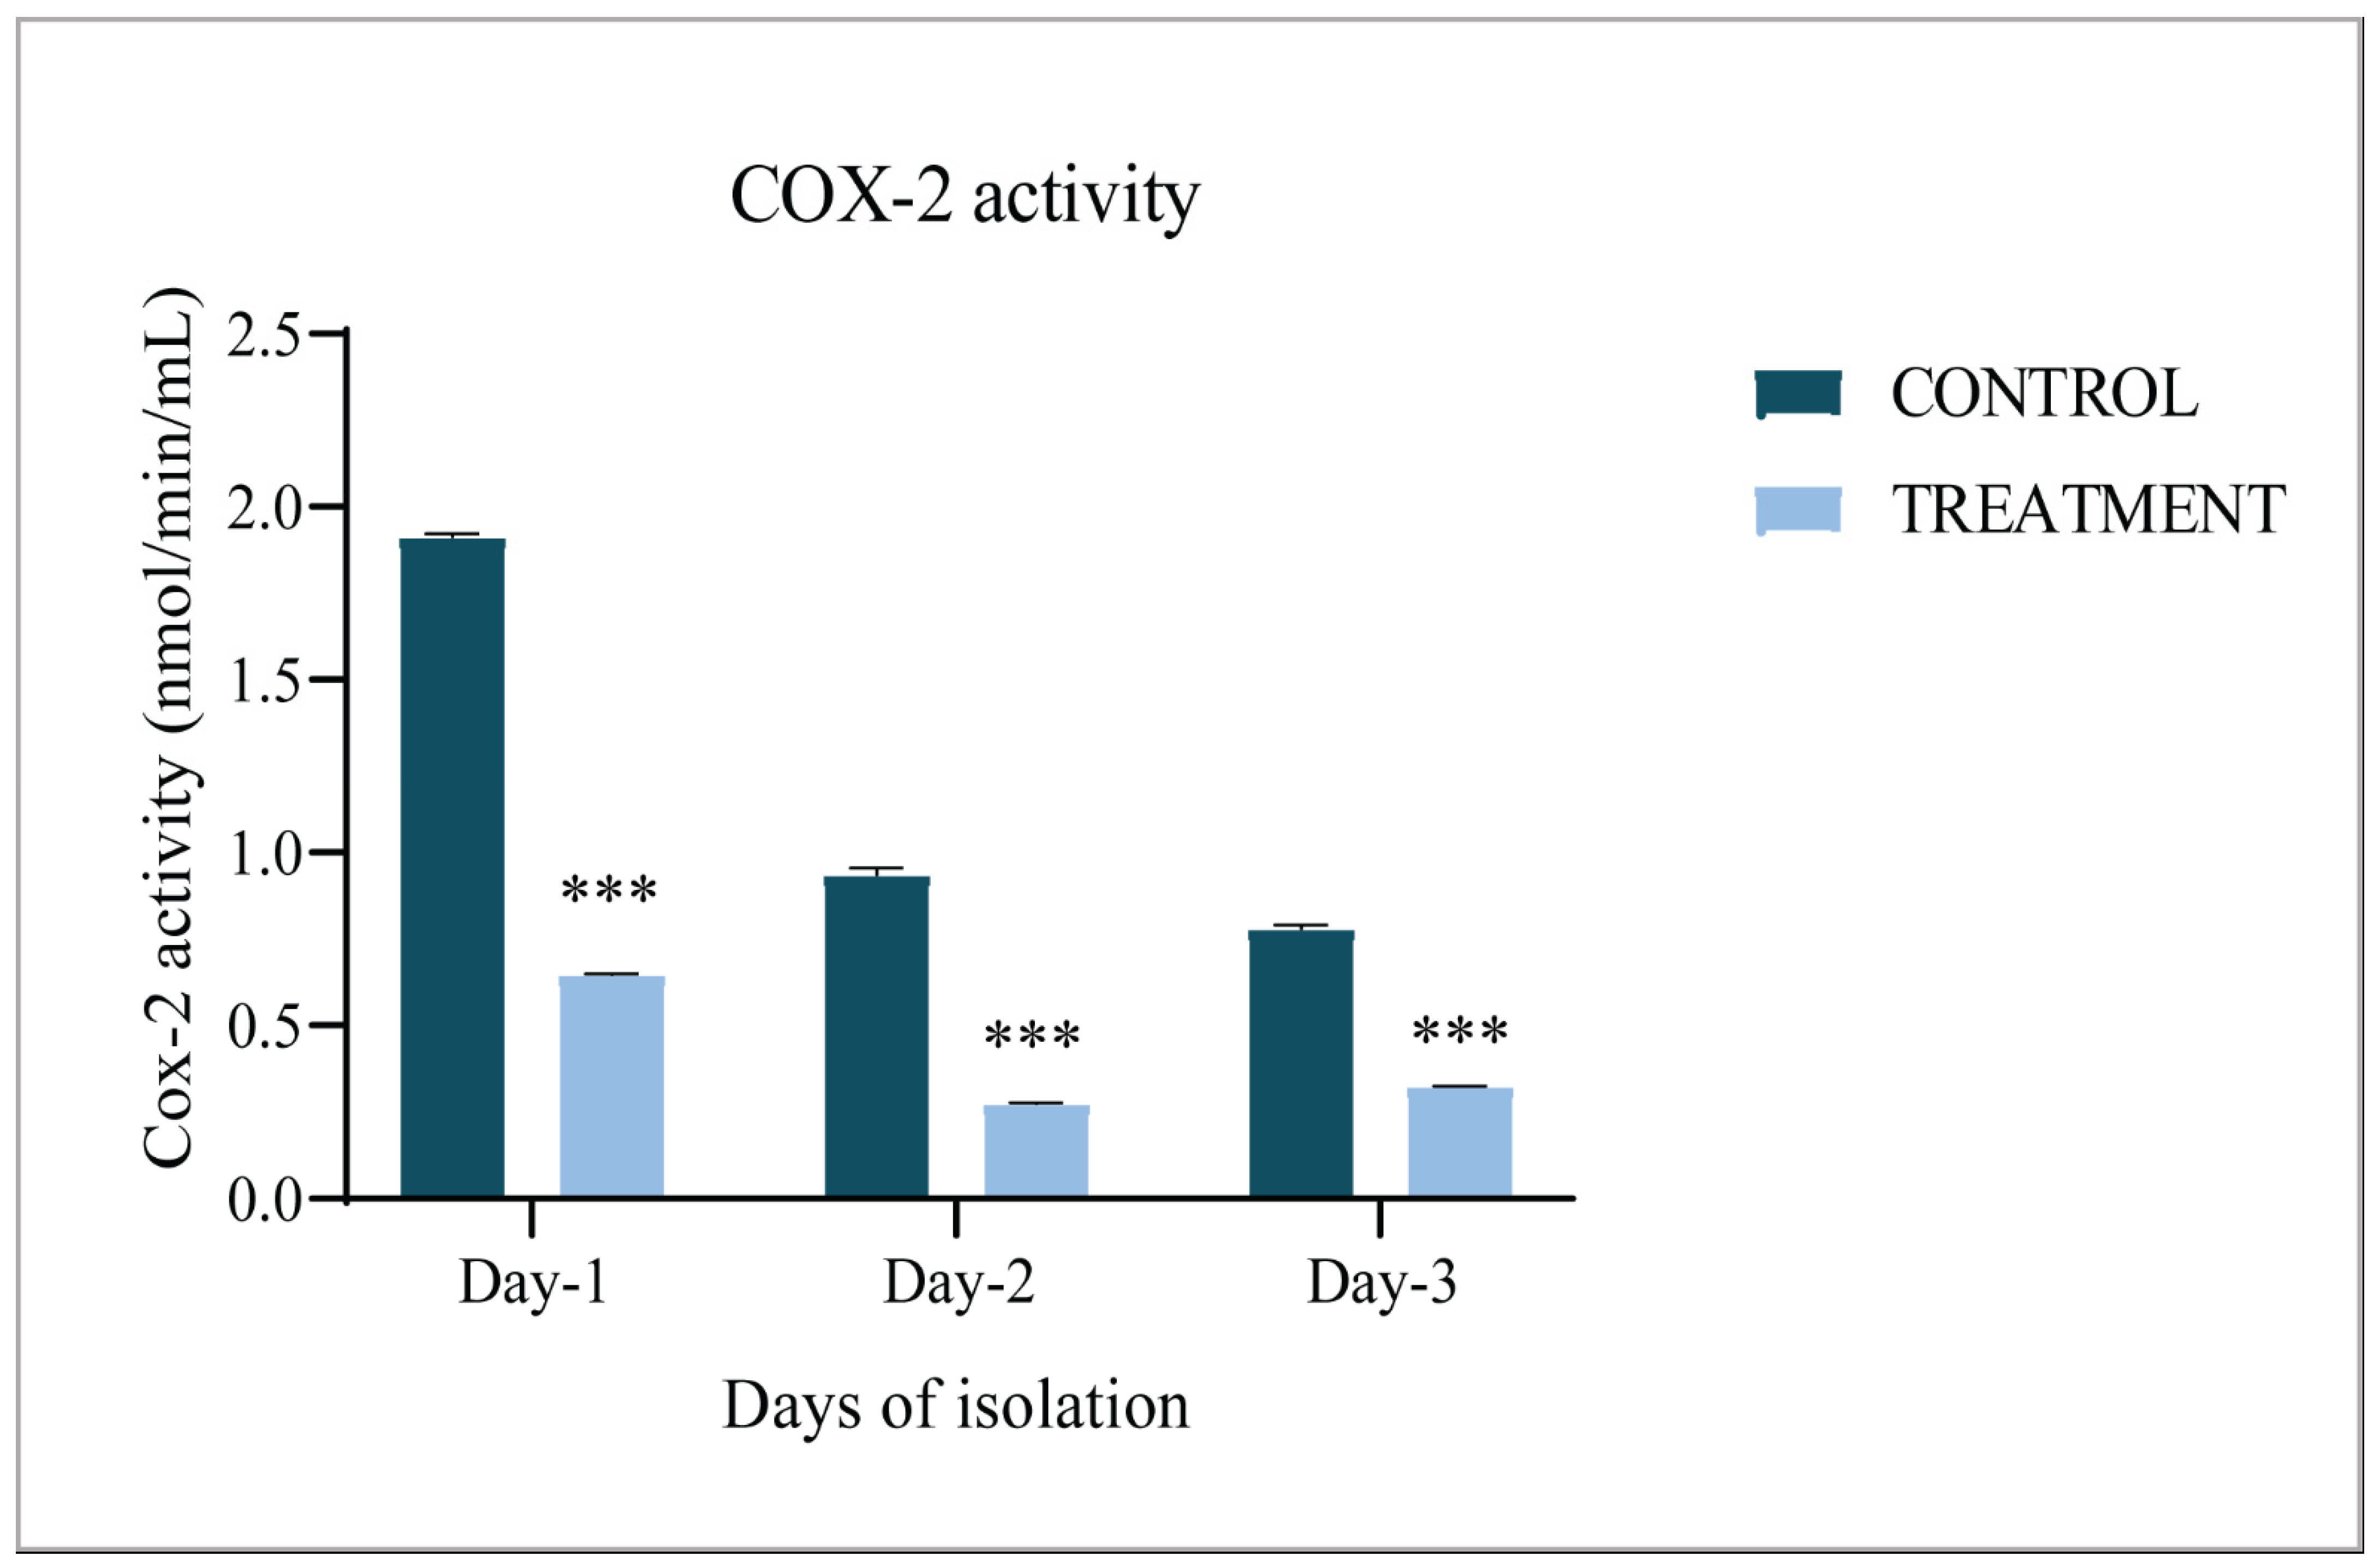
3.1. COX-2 Activity
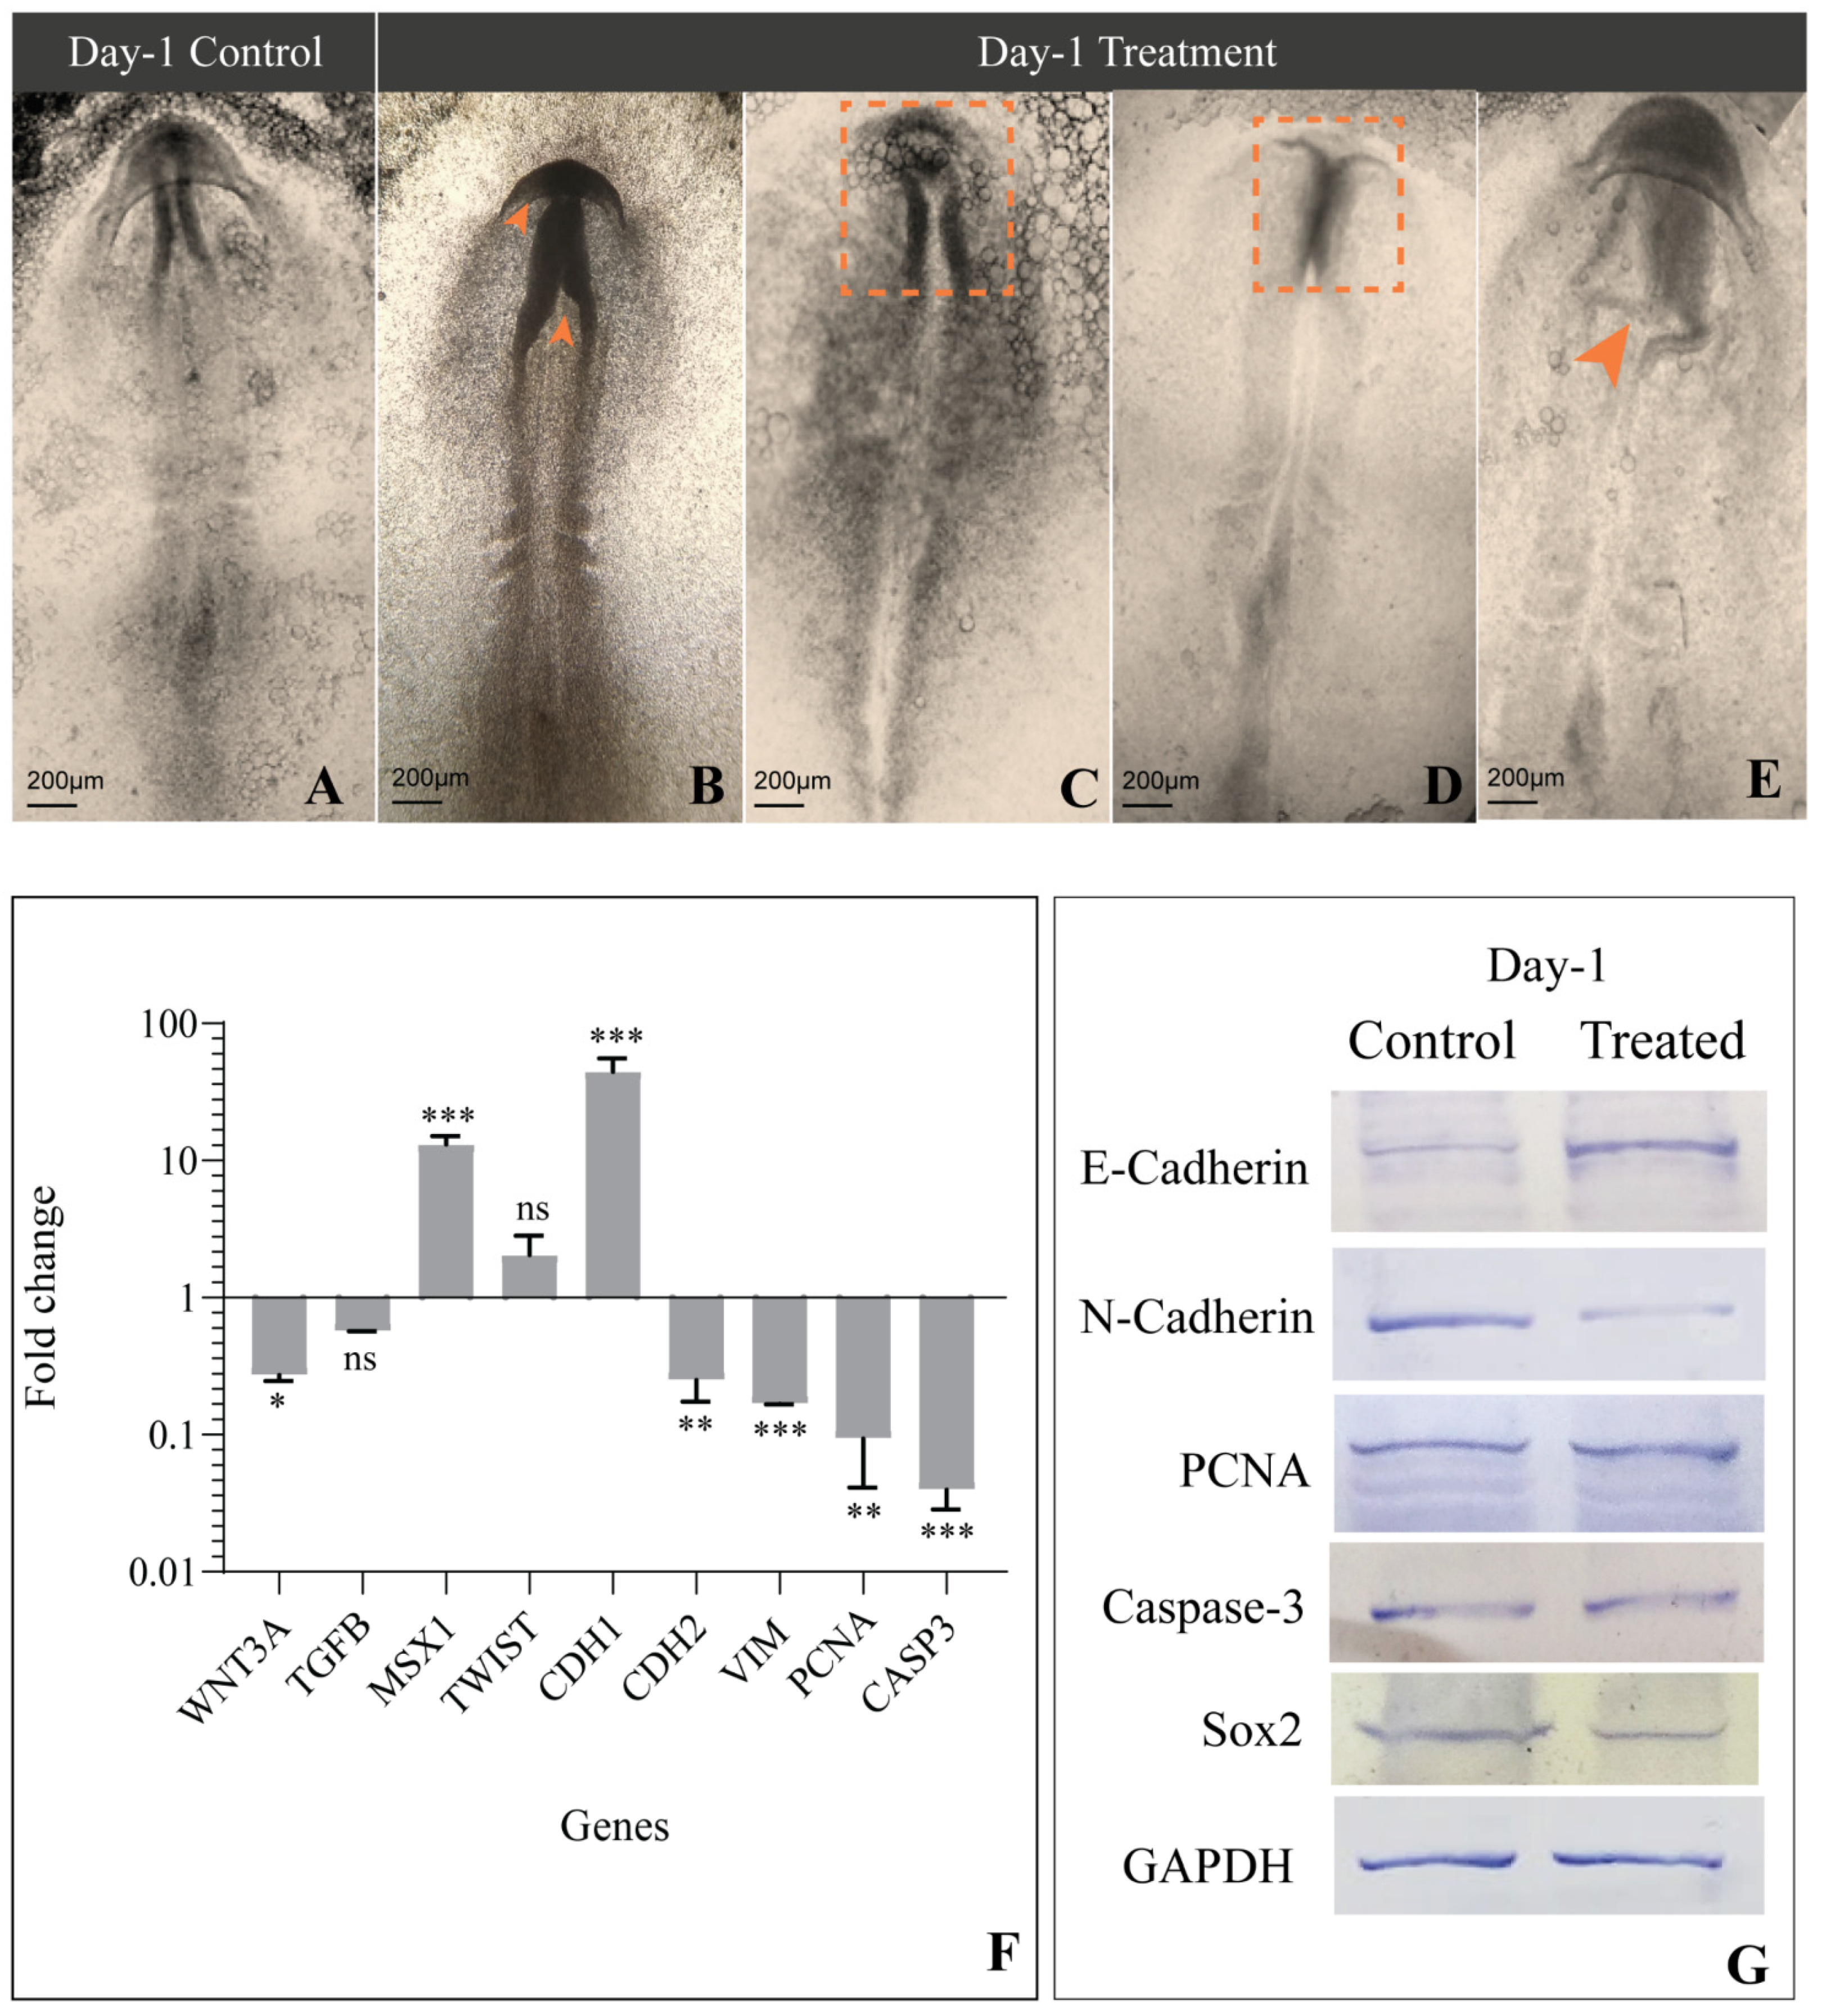
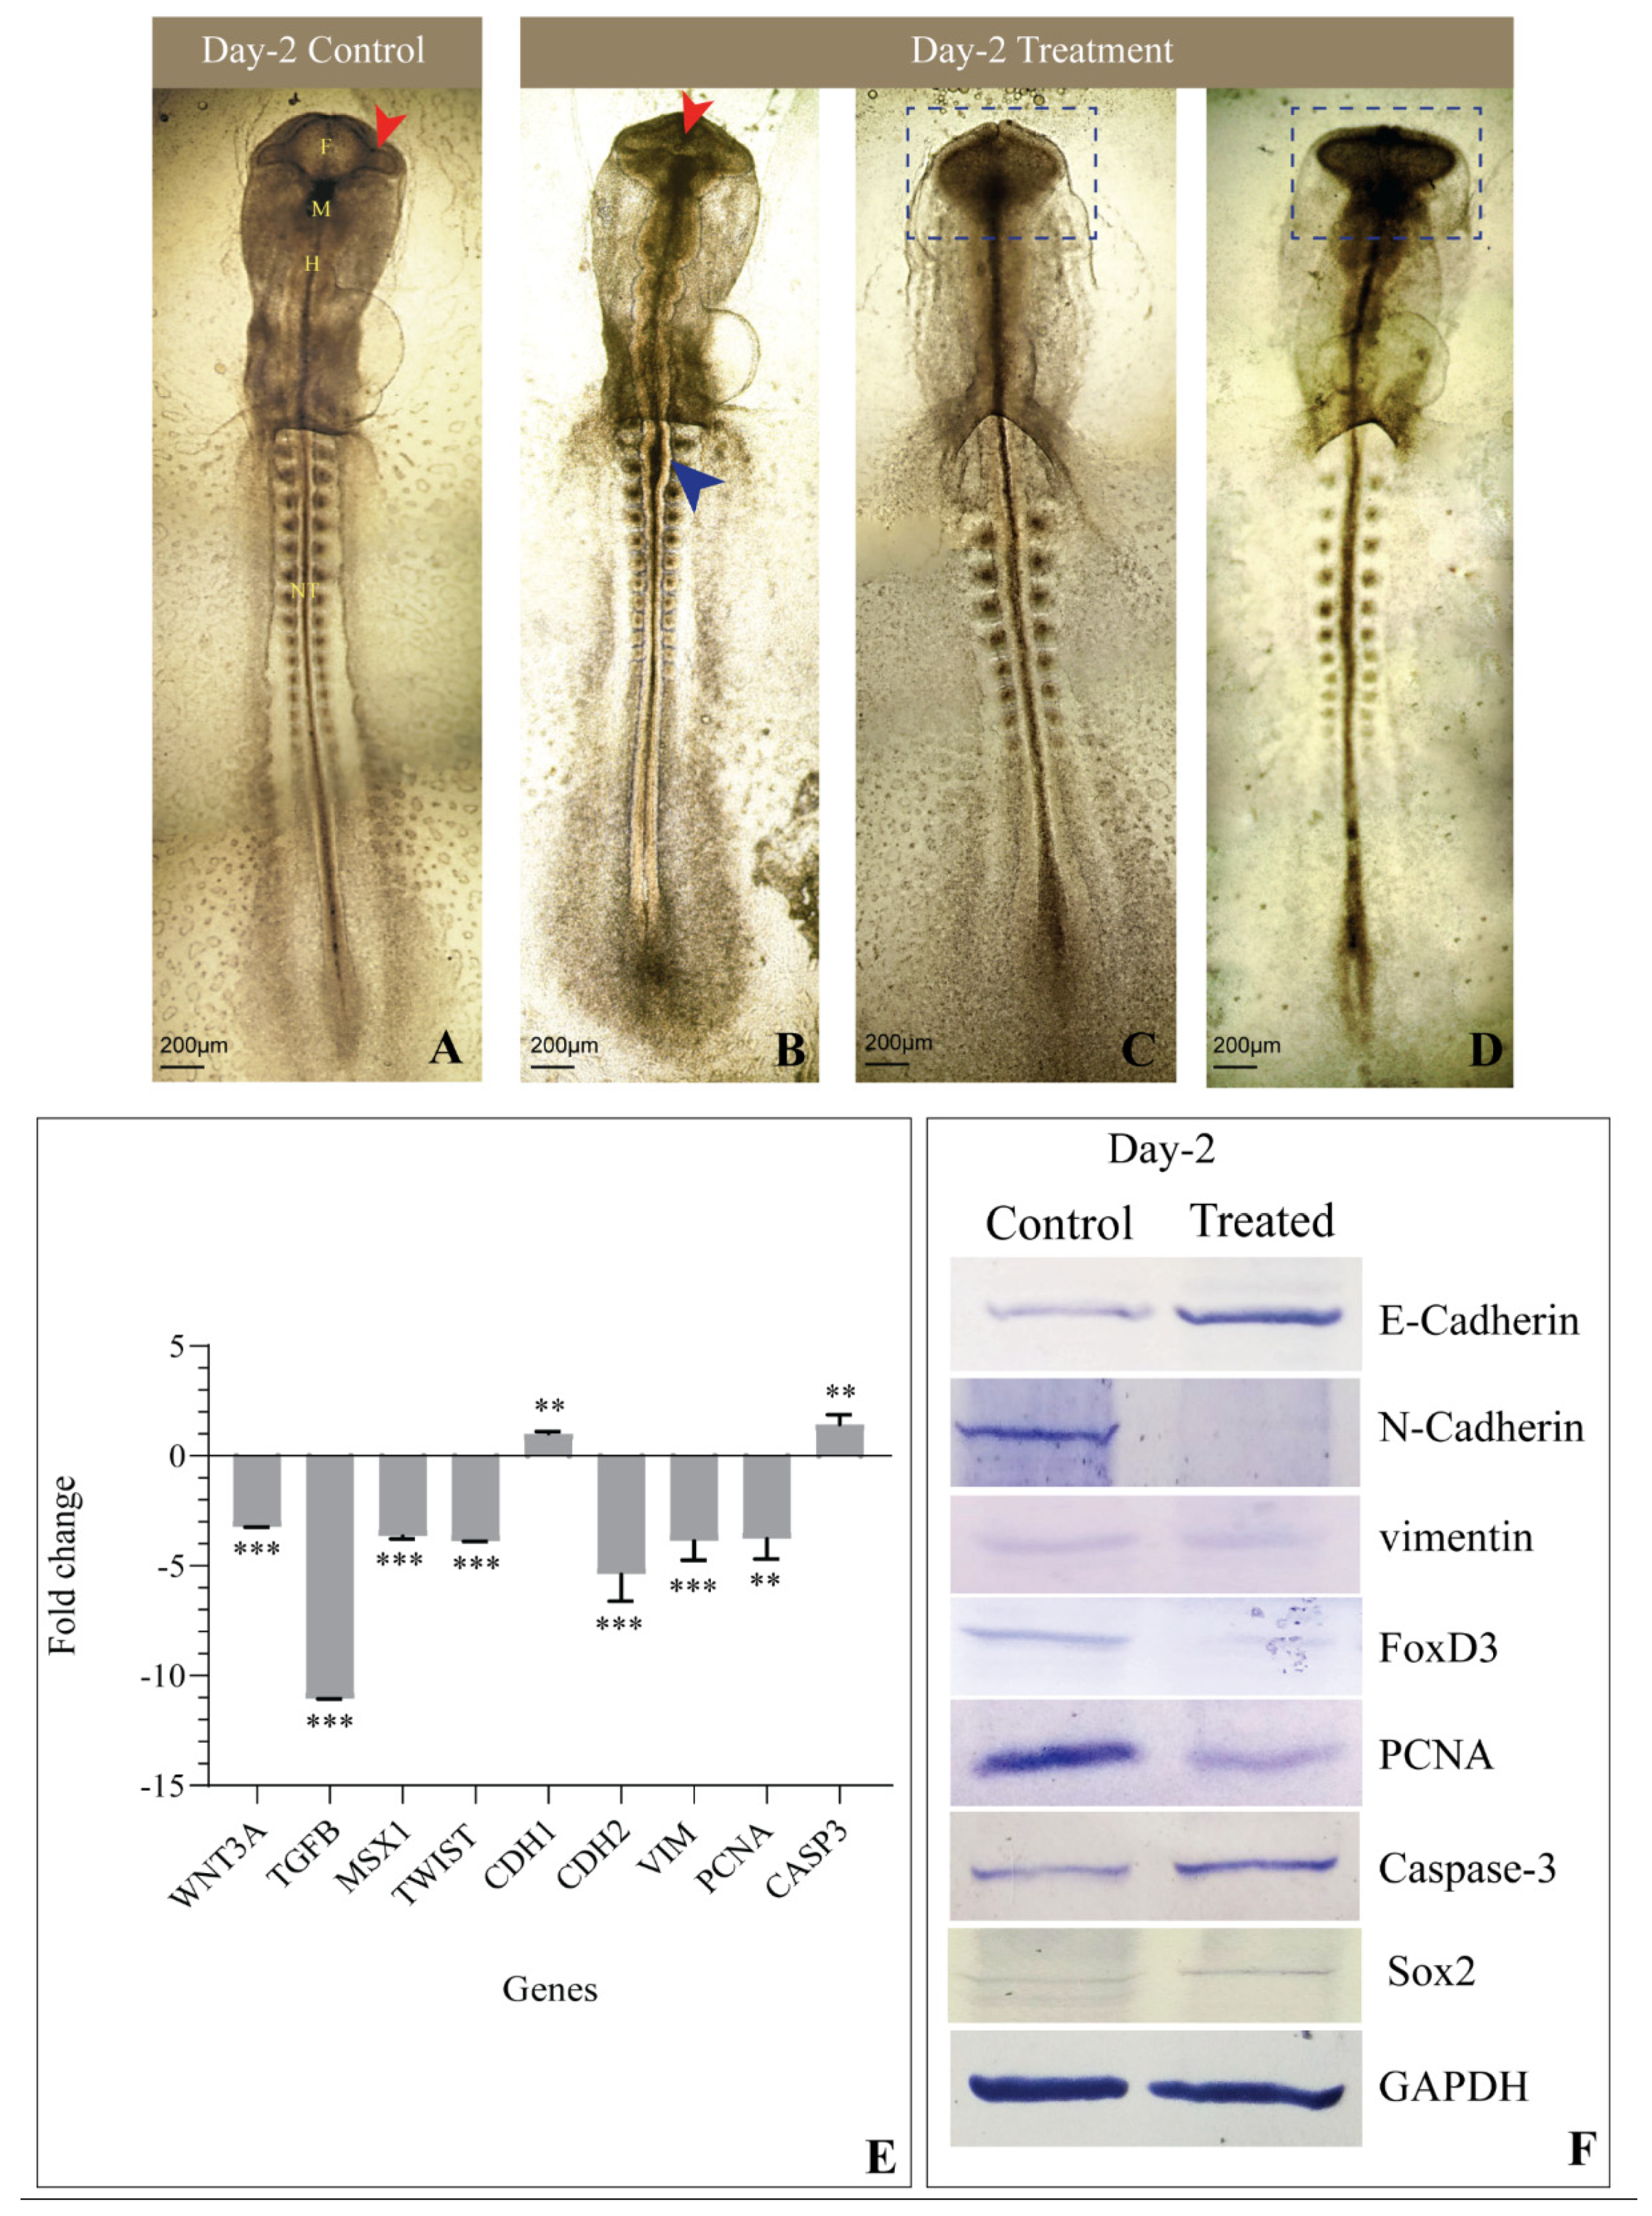
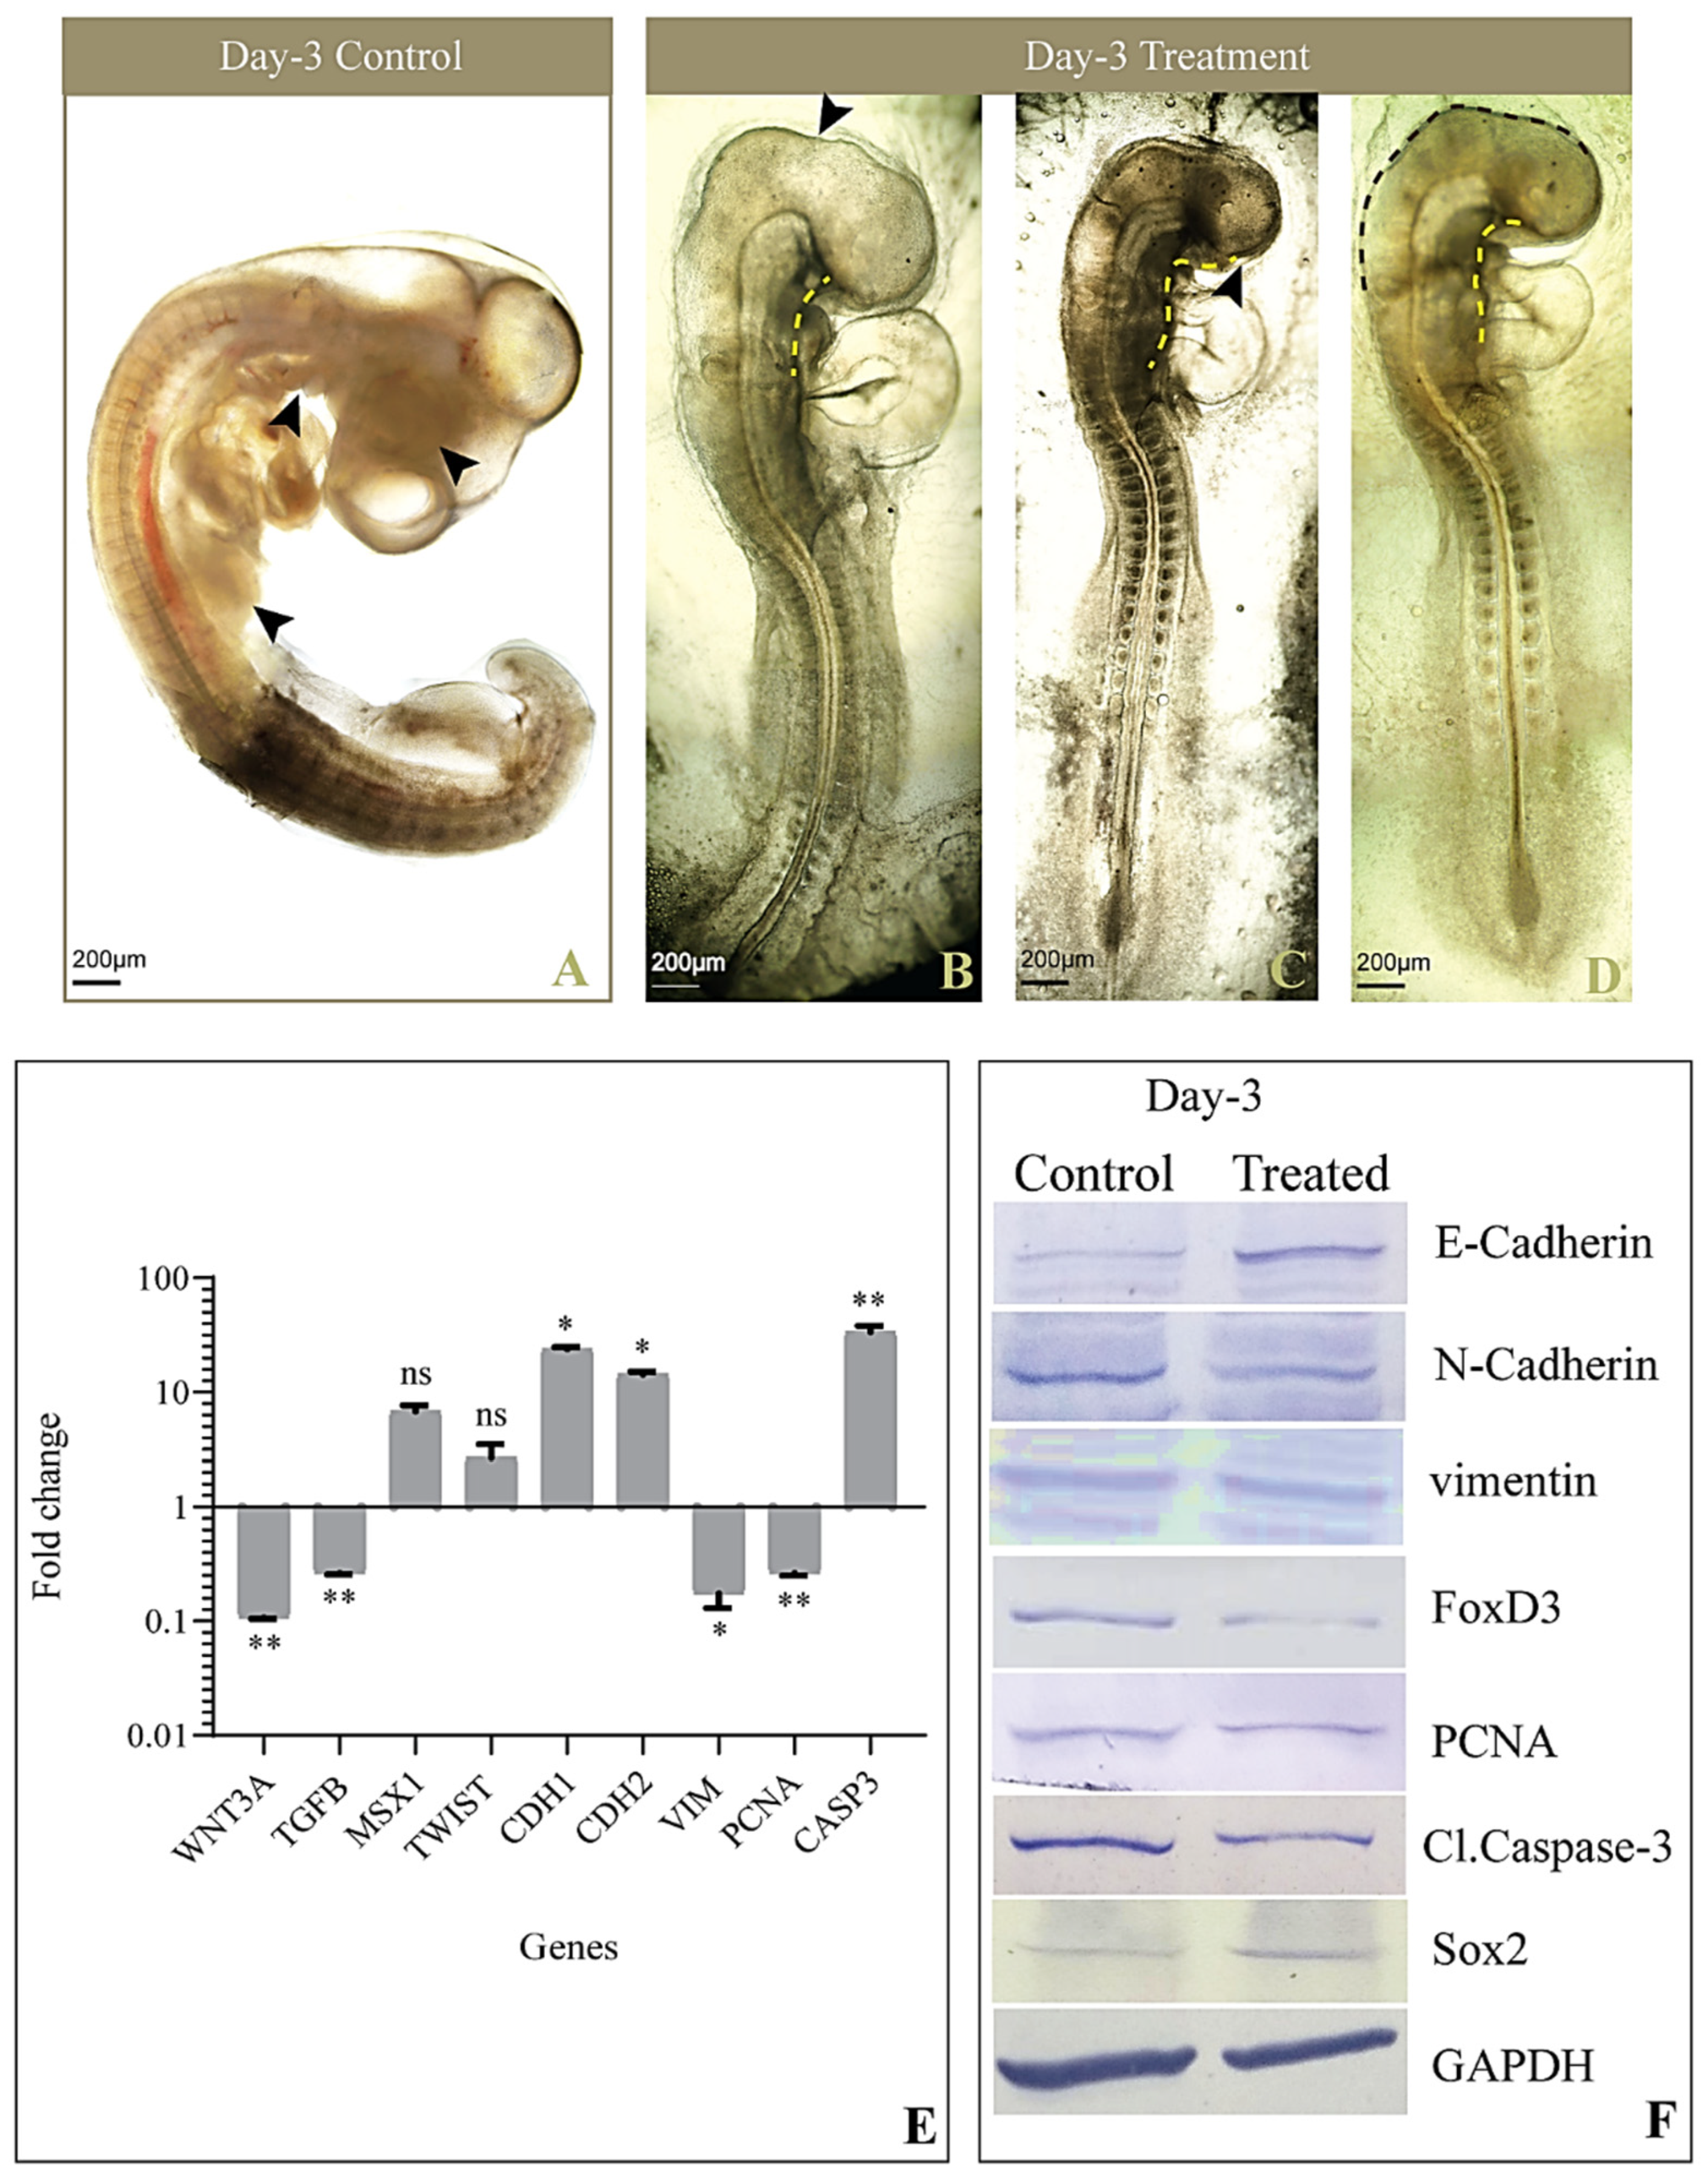
3.2. Gross Morphology
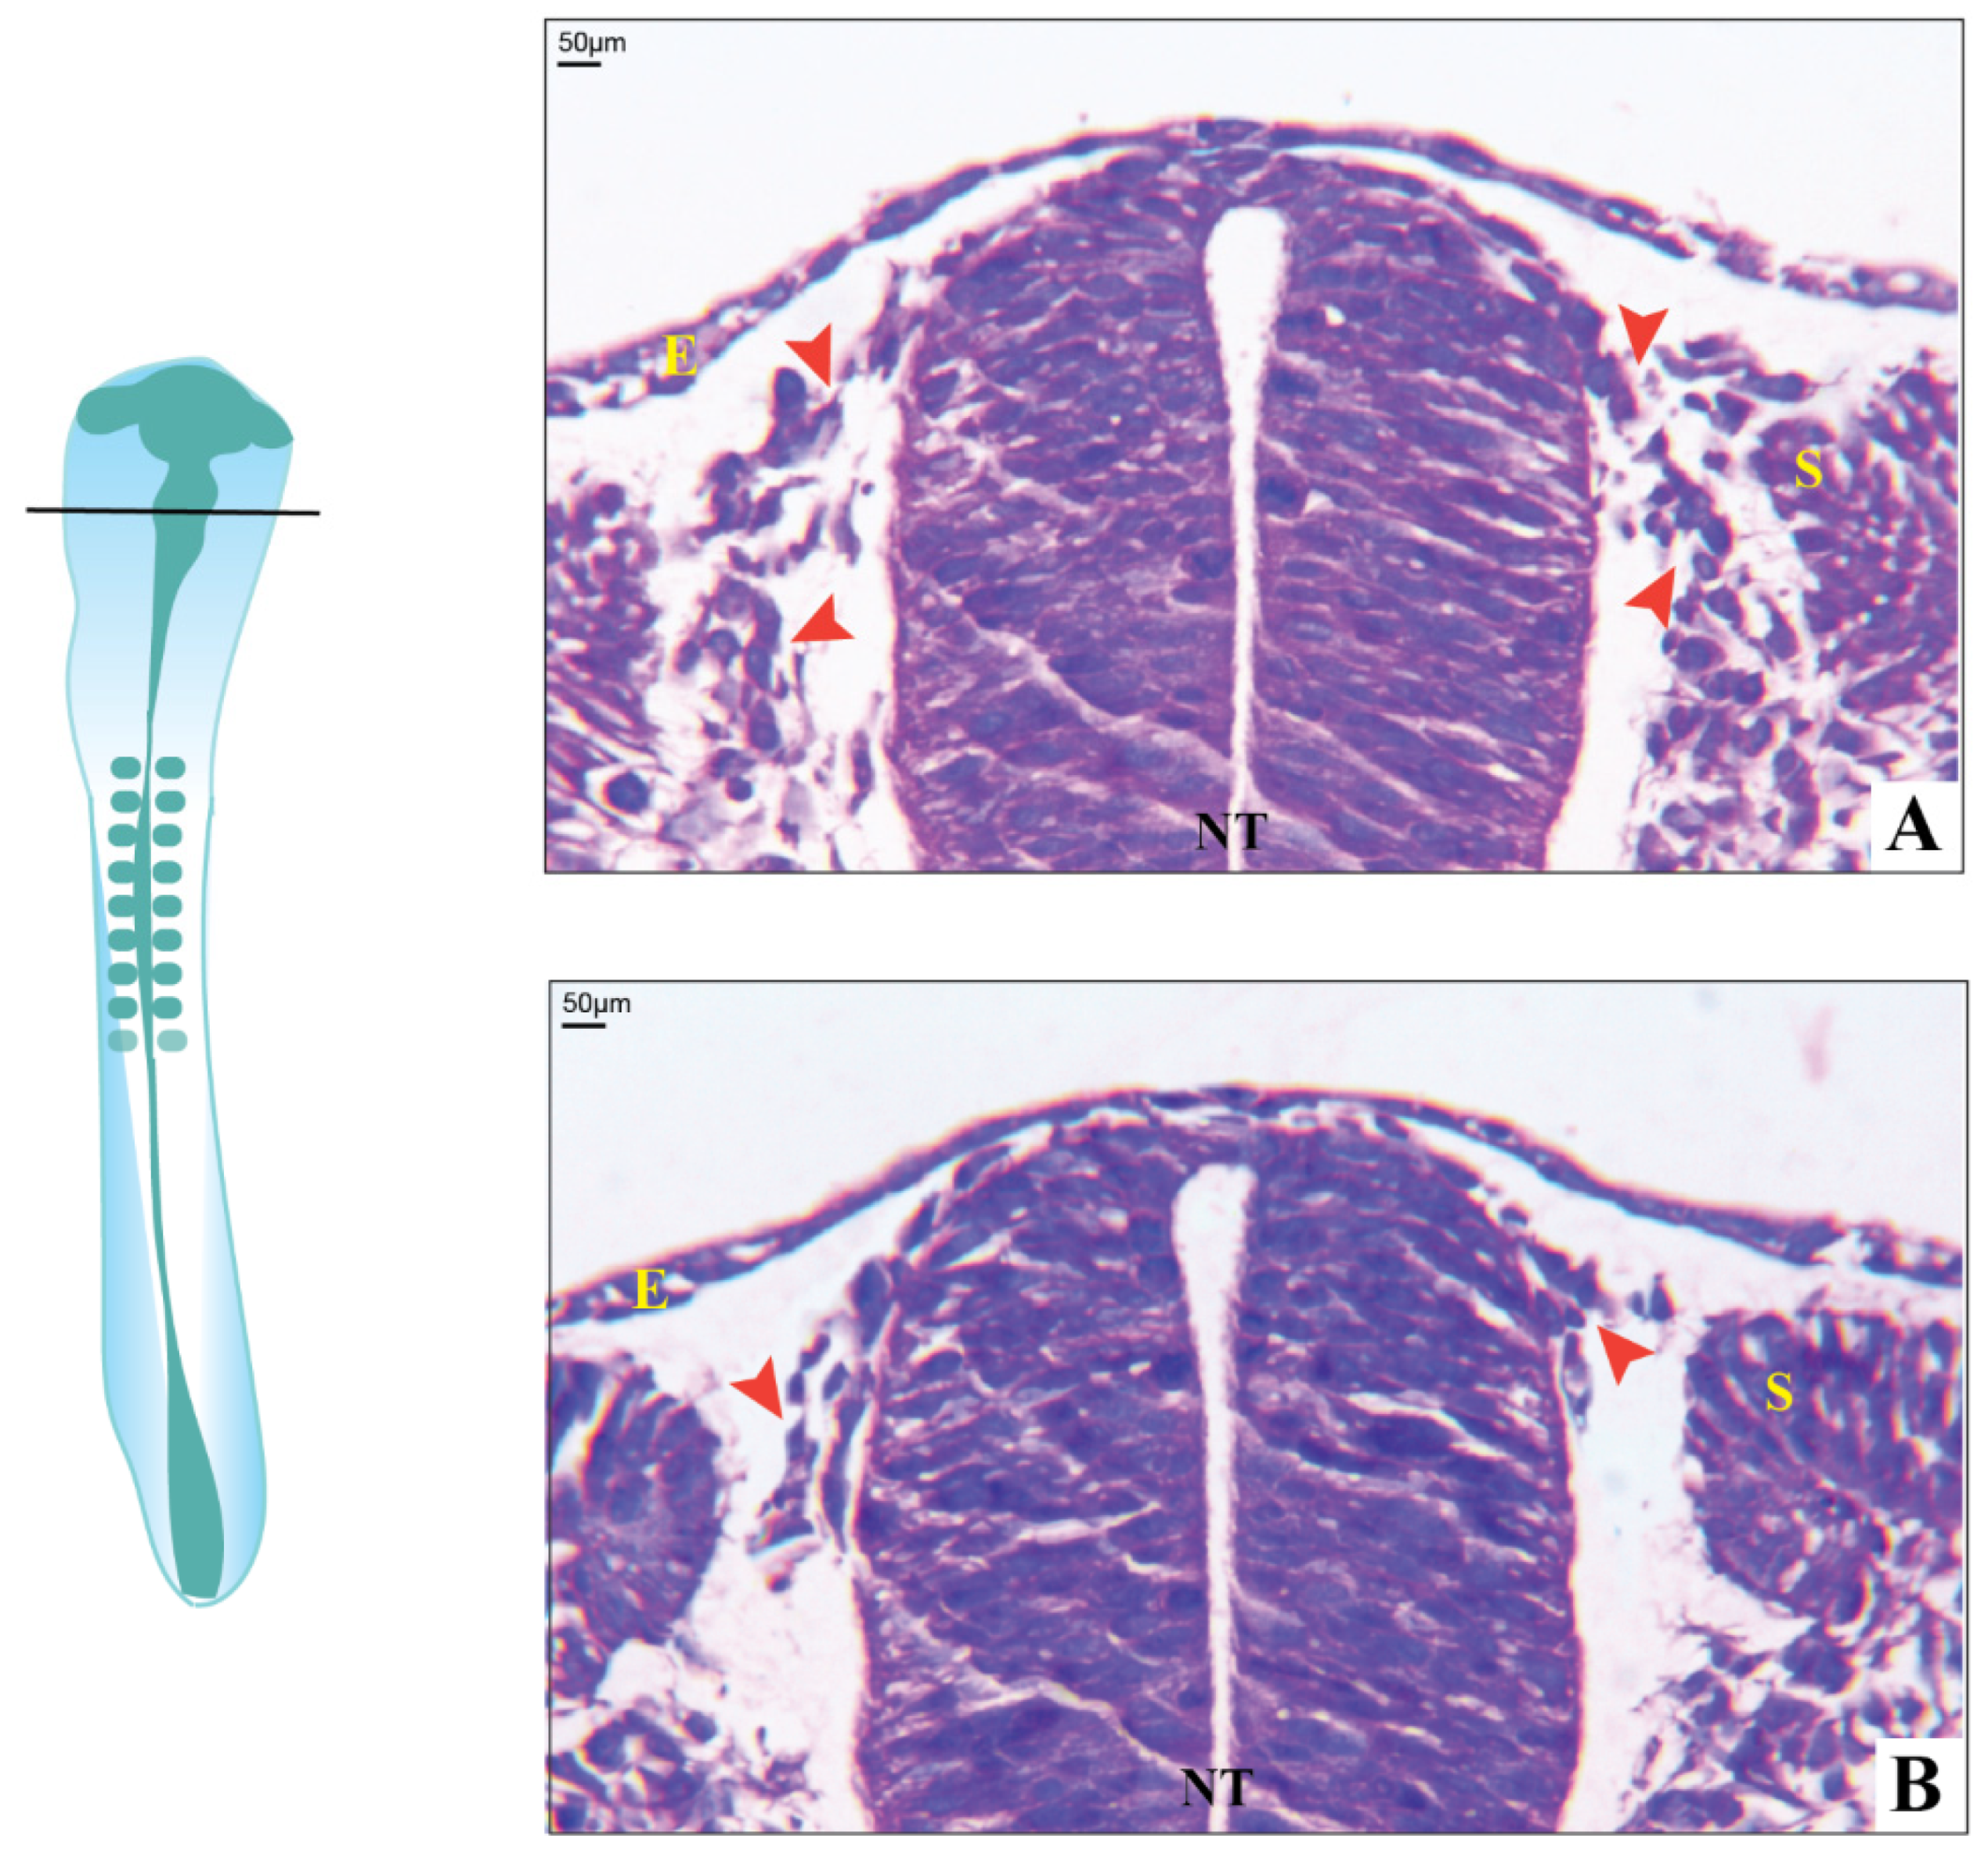
3.3. Histological Observations
3.4. Expression of Genes Involved in EMT and CNCC Migration
3.5. Levels of Proteins Involved in EMT and CNCC Migration
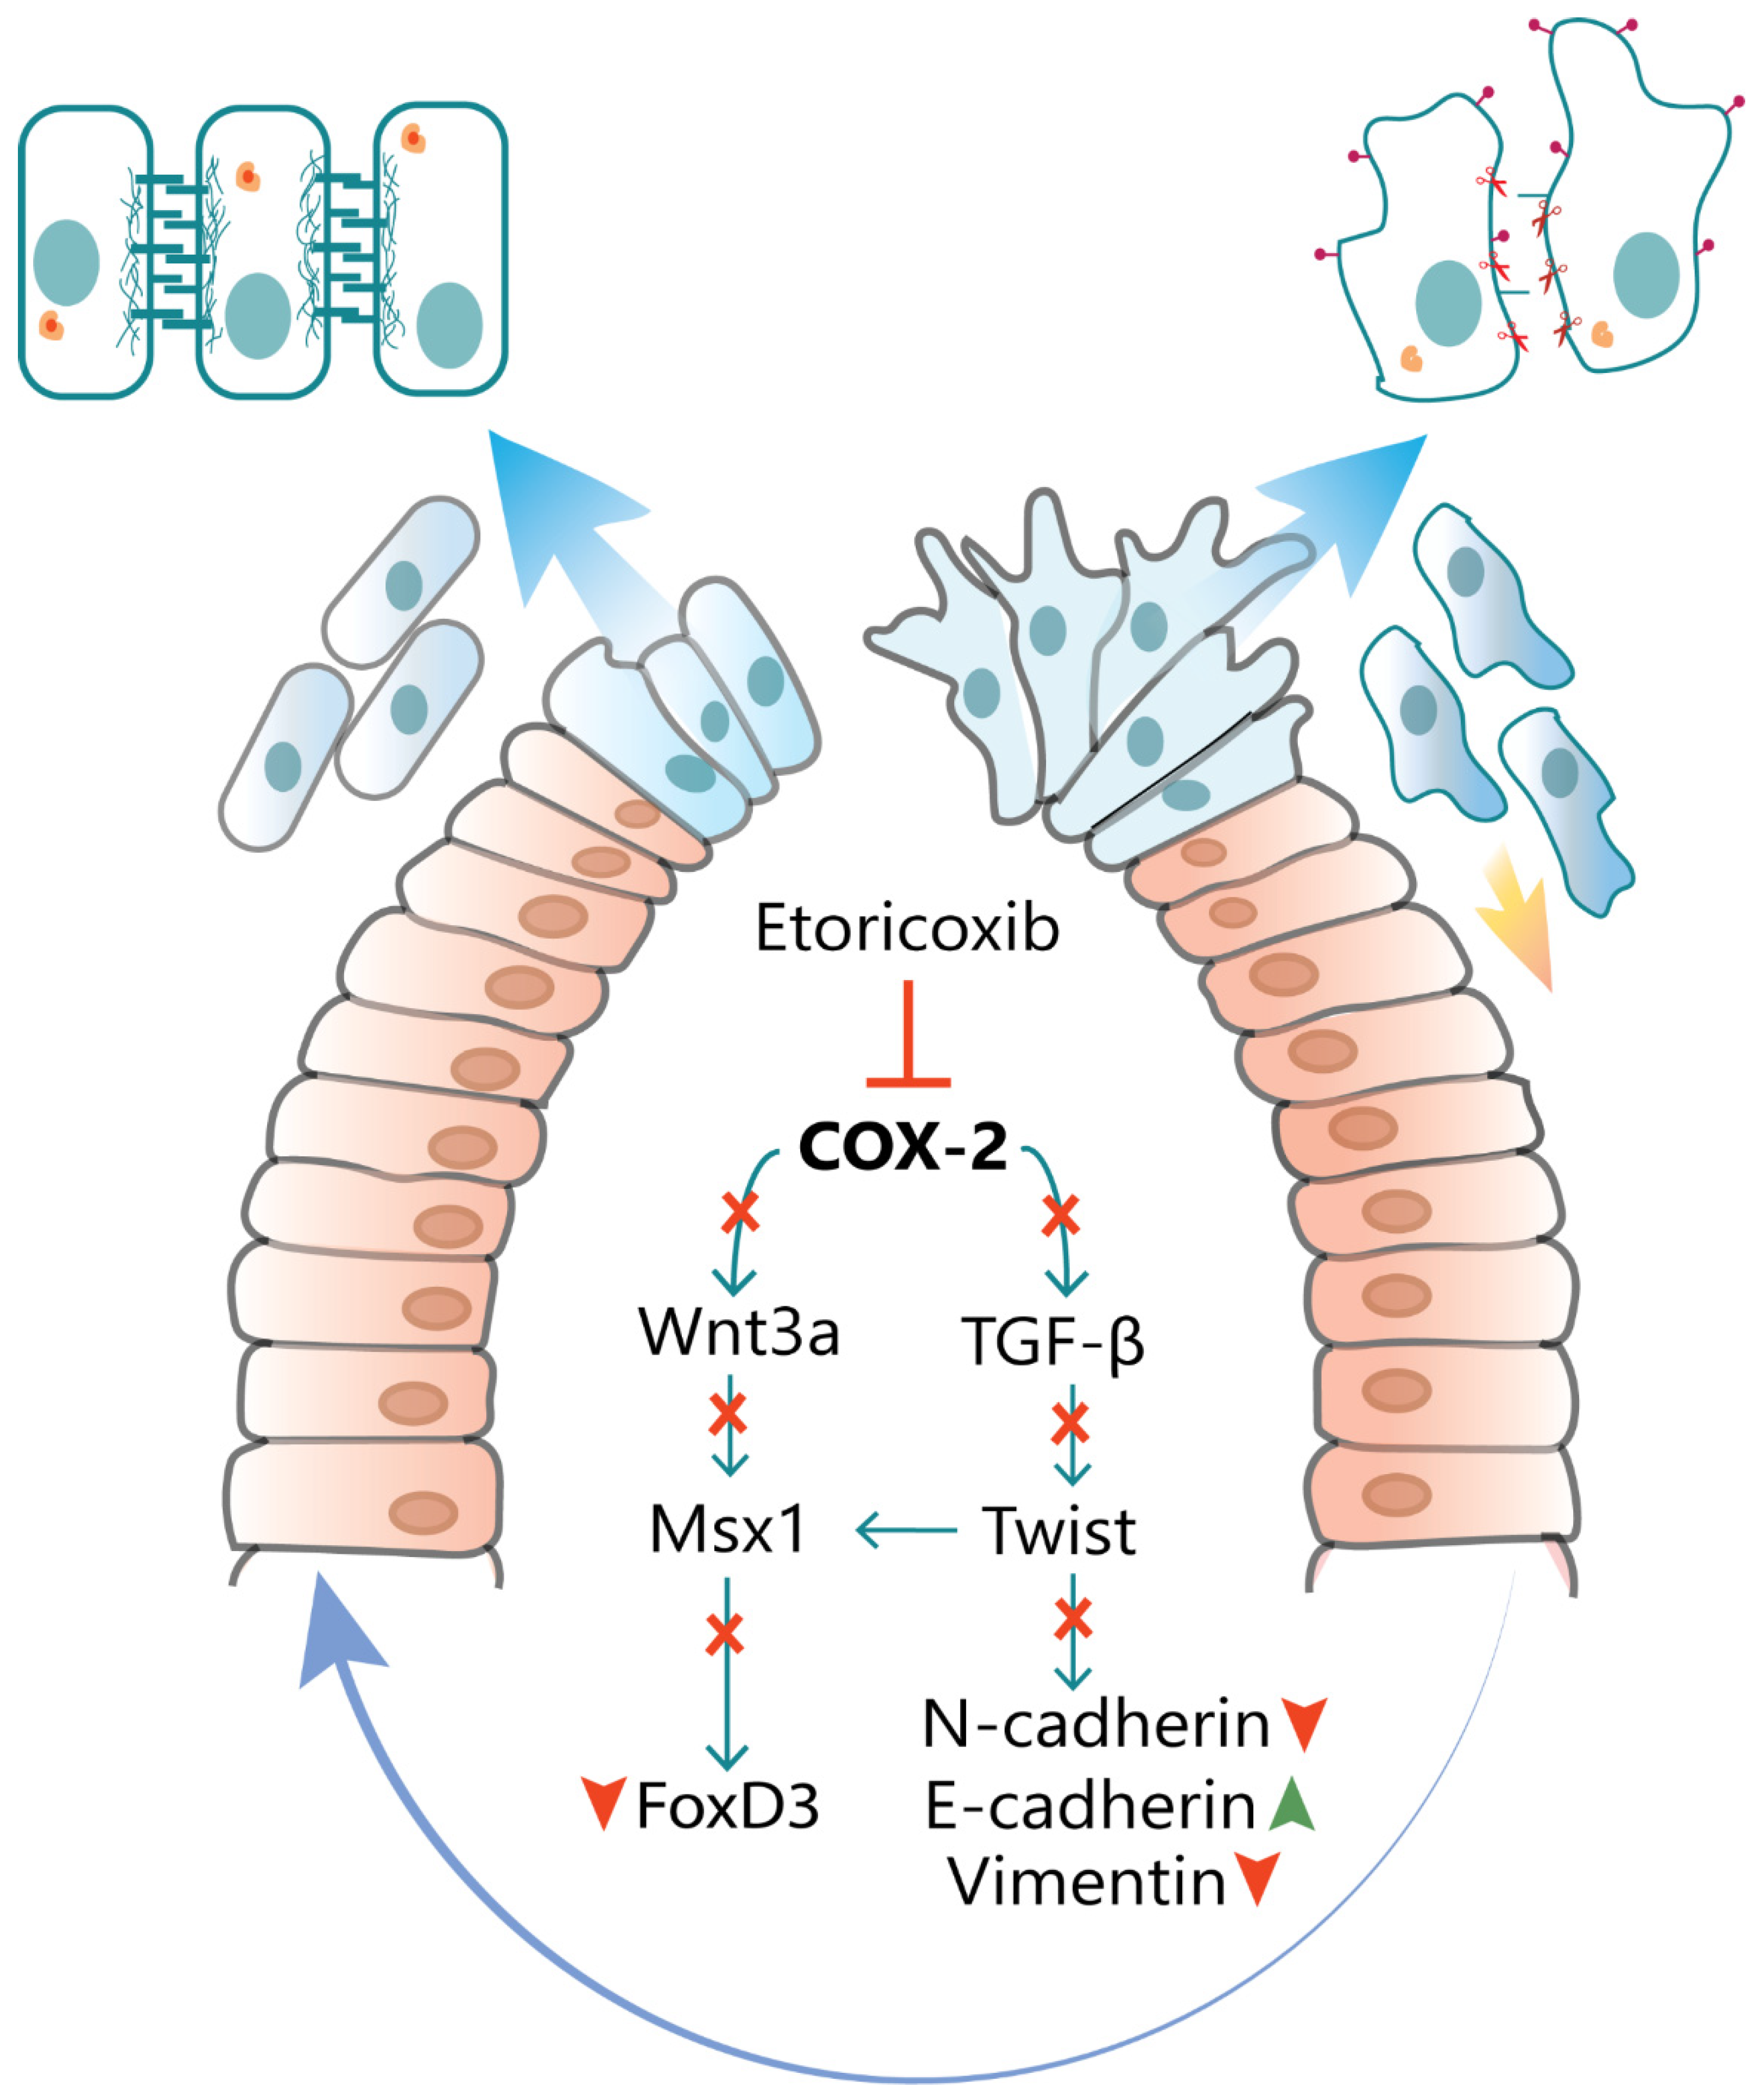
4. Discussion
Author Contributions
Funding
Institutional Review Board Statement
Informed Consent Statement
Data Availability Statement
Conflicts of Interest
References
- Fish, J.L. Developmental mechanisms underlying variation in craniofacial disease and evolution. Dev. Biol. 2016, 415, 188–197. [Google Scholar] [CrossRef] [PubMed]
- Suzuki, A.; Sangani, D.R.; Ansari, A.; Iwata, J. Molecular mechanisms of midfacial developmental defects. Dev. Dyn. 2016, 245, 276–293. [Google Scholar] [CrossRef] [PubMed] [Green Version]
- Snider, T.N.; Mishina, Y. Cranial neural crest cell contribution to craniofacial formation, pathology, and future directions in tissue engineering. Birth Defects Res. Part C Embryo Today Rev. 2014, 102, 324–332. [Google Scholar] [CrossRef] [Green Version]
- Alfandari, D.; Cousin, H.; Marsden, M. Mechanism of Xenopus cranial neural crest cell migration. Cell Adhes. Migr. 2010, 4, 553–560. [Google Scholar] [CrossRef] [PubMed] [Green Version]
- Trainor, P.A. Craniofacial birth defects: The role of neural crest cells in the etiology and pathogenesis of Treacher Collins syndrome and the potential for prevention. Am. J. Med Genet. Part A 2010, 152, 2984–2994. [Google Scholar] [CrossRef] [Green Version]
- Vaglia, J.L.; Hall, B.K. Patterns of migration and regulation of trunk neural crest cells in zebrafish (Danio rerio). Int. J. Dev. Biol. 2002, 44, 867–881. [Google Scholar]
- Kulesa, P.; Ellies, D.L.; Trainor, P.A. Comparative analysis of neural crest cell death, migration, and function during vertebrate embryogenesis. Dev. Dyn. Off. Publ. Am. Assoc. Anat. 2004, 229, 14–29. [Google Scholar] [CrossRef]
- Dorsky, R.I.; Moon, R.T.; Raible, D.W. Environmental signals and cell fate specification in premigratory neural crest. Bioessays 2000, 22, 708–716. [Google Scholar] [CrossRef]
- Wu, J.; Saint-Jeannet, J.P.; Klein, P.S. Wnt–frizzled signaling in neural crest formation. Trends Neurosci. 2003, 26, 40–45. [Google Scholar] [CrossRef]
- Basch, M.L.; Bronner-Fraser, M. Neural crest inducing signals. In Neural Crest Induction and Differentiation; Springer: Boston, MA, USA, 2006; pp. 24–31. [Google Scholar]
- Ezin, A.M.; Fraser, S.E.; Bronner-Fraser, M. Fate map and morphogenesis of presumptive neural crest and dorsal neural tube. Dev. Biol. 2009, 330, 221–236. [Google Scholar] [CrossRef] [Green Version]
- Gilbert, S.F. The morphogenesis of evolutionary developmental biology. Int. J. Dev. Biol. 2003, 47, 467–477. [Google Scholar]
- Yang, J.; Weinberg, R.A. Epithelial-mesenchymal transition: At the crossroads of development and tumor metastasis. Dev. Cell 2008, 14, 818–829. [Google Scholar] [CrossRef] [Green Version]
- Ricciotti, E.; FitzGerald, G.A. Prostaglandins and inflammation. Arterioscler. Thromb. Vasc. Biol. 2011, 31, 986–1000. [Google Scholar] [CrossRef]
- Wu, G.; Luo, J.; Rana, J.S.; Laham, R.; Sellke, F.W.; Li, J. Involvement of COX-2 in VEGF-induced angiogenesis via P38 and JNK pathways in vascular endothelial cells. Cardiovasc. Res. 2006, 69, 512–519. [Google Scholar] [CrossRef] [Green Version]
- Sharma, P.; Suresh, B. Influence of COX-2-Induced PGE2 on the Initiation and Progression of Tail Regeneration in Northern House Gecko, Hemidactylus flaviviridis. Folia Biol. 2008, 54, 193–201. [Google Scholar]
- Jana, S.; Chatterjee, K.; Ray, A.K.; DasMahapatra, P.; Swarnakar, S. Regulation of matrix metalloproteinase-2 activity by COX-2-PGE2-pAKT axis promotes angiogenesis in endometriosis. PLoS ONE 2016, 11, e0163540. [Google Scholar] [CrossRef]
- Jang, T.J.; Jeon, K.H.; Jung, K.H. Cyclooxygenase-2 expression is related to the epithelial-to-mesenchymal transition in human colon cancers. Yonsei Med. J. 2009, 50, 818–824. [Google Scholar] [CrossRef] [PubMed] [Green Version]
- Neil, J.R.; Johnson, K.M.; Nemenoff, R.A.; Schiemann, W.P. COX-2 inactivates Smad signaling and enhances EMT stimulated by TGF-β through a PGE2 dependent mechanisms. Carcinogenesis 2008, 29, 2227–2235. [Google Scholar] [CrossRef] [PubMed] [Green Version]
- Verma, U.; Gautam, M.; Parmar, B.; Khaire, K.; Wishart, D.S.; Balakrishnan, S. New insights into the obligatory nature of cyclooxygenase-2 and PGE2 during early chick embryogenesis. Biochim. Biophys. Acta Mol. Cell Biol. Lipids 2021, 1866, 158889. [Google Scholar]
- Parsad, R. Some Statistical Techniques for Bio-efficacy Trials. Indian J. Agric. Sci. 2010, 16, 62–76. [Google Scholar]
- Livak, K.J.; Schmittgen, T.D. Analysis of relative gene expression data using real-time quantitative PCR and the 2−ΔΔCT method. Methods 2001, 25, 402–408. [Google Scholar] [CrossRef]
- Santagati, F.; Rijli, F.M. Cranial neural crest and the building of the vertebrate head. Nat. Rev. Neurosci. 2003, 4, 806–818. [Google Scholar] [CrossRef]
- Stern, C.D. The chick: A great model system becomes even greater. Dev. Cell 2005, 8, 9–17. [Google Scholar]
- Evans, C.B.; Pillai, S.; Goldyne, M.E. Endogenous prostaglandin E2 modulates calcium-induced differentiation in human skin keratinocytes. Prostaglandins Leukot. Essent. Fat. Acids 1993, 49, 777–781. [Google Scholar] [CrossRef]
- Grosser, T.; Yusuff, S.; Cheskis, E.; Pack, M.A.; FitzGerald, G.A. Developmental expression of functional cyclooxygenases in zebrafish. Proc. Natl. Acad. Sci. USA 2002, 99, 8418–8423. [Google Scholar] [CrossRef] [PubMed] [Green Version]
- Ugwuagbo, K.C.; Maiti, S.; Omar, A.; Hunter, S.; Nault, B.; Northam, C.; Majumder, M. Prostaglandin E2 promotes embryonic vascular development and maturation in zebrafish. Biol. Open 2019, 8, bio039768. [Google Scholar] [CrossRef] [PubMed] [Green Version]
- Grocott, T.; Johnson, S.; Bailey, A.P.; Streit, A. Neural crest cells organize the eye via TGF-β and canonical Wnt signalling. Nat. Commun. 2011, 2, 265. [Google Scholar] [CrossRef] [Green Version]
- Beebe, D.C.; Coats, J.M. The lens organizes the anterior segment: Specification of neural crest cell differentiation in the avian eye. Dev. Biol. 2000, 220, 424–431. [Google Scholar] [CrossRef] [Green Version]
- Le Douarin, N.M.; Brito, J.M.; Creuzet, S. Role of the neural crest in face and brain development. Brain Res. Rev. 2007, 55, 237–247. [Google Scholar] [CrossRef] [Green Version]
- Graham, A.; Begbie, J.; McGonnell, I. Significance of the cranial neural crest. Dev. Dyn. Off. Publ. Am. Assoc. Anat. 2004, 229, 5–13. [Google Scholar] [CrossRef]
- Geliflimine, E.N. The effects of meloxicam on neural tube development in the early stage of chick embryos. Turk. Neurosurg. 2010, 20, 111–116. [Google Scholar]
- Buch, P.R.; Sarkate, P.; Uggini, G.K.; Desai, I.; Balakrishnan, S. Inhibition of cyclooxygenase-2 alters Wnt/β-catenin signaling in the regenerating tail of lizard Hemidactylus flaviviridis. Tissue Eng. Regen. Med. 2017, 14, 171–178. [Google Scholar] [CrossRef] [PubMed]
- Dorsky, R.I.; Moon, R.T.; Raible, D.W. Control of neural crest cell fate by the Wnt signalling pathway. Nature 1998, 396, 370–373. [Google Scholar] [CrossRef] [PubMed]
- Patthey, C.; Gunhaga, L.; Edlund, T. Early development of the central and peripheral nervous systems is coordinated by Wnt and BMP signals. PLoS ONE 2008, 3, e1625. [Google Scholar] [CrossRef]
- Yang, Y.M.; Yang, W.X. Epithelial-to-mesenchymal transition in the development of endometriosis. Oncotarget 2017, 25, 41679–41689. [Google Scholar] [CrossRef] [Green Version]
- Sela-Donenfeld, D.; Kalcheim, C. Regulation of the onset of neural crest migration by coordinated activity of BMP4 and Noggin in the dorsal neural tube. Development 1999, 126, 4749–4762. [Google Scholar]
- Han, J.; Ishii, M.; Bringas, P., Jr.; Maas, R.L.; Maxson, R.E., Jr.; Chai, Y. Concerted action of Msx1 and Msx2 in regulating cranial neural crest cell differentiation during frontal bone development. Mech. Dev. 2007, 124, 729–745. [Google Scholar]
- Satokata, I.; Maas, R. Msx1 deficient mice exhibit cleft palate and abnormalities of craniofacial and tooth development. Nat. Genet. 1994, 6, 348–356. [Google Scholar] [CrossRef]
- Soo, K.; O’Rourke, M.P.; Khoo, P.L.; Steiner, K.A.; Wong, N.; Behringer, R.R.; Tam, P.P. Twist function is required for the morphogenesis of the cephalic neural tube and the differentiation of the cranial neural crest cells in the mouse embryo. Dev. Biol. 2002, 247, 251–270. [Google Scholar] [CrossRef] [Green Version]
- Theveneau, E.; Marchant, L.; Kuriyama, S.; Gull, M.; Moepps, B.; Parsons, M.; Mayor, R. Collective chemotaxis requires contact-dependent cell polarity. Dev. Cell 2010, 19, 39–53. [Google Scholar] [CrossRef] [Green Version]
- Thiery, J.P.; Acloque, H.; Huang, R.Y.; Nieto, M.A. Epithelial-mesenchymal transitions in development and disease. Cell 2009, 139, 871–890. [Google Scholar] [CrossRef] [PubMed]
- Mendez, M.G.; Kojima, S.I.; Goldman, R.D. Vimentin induces changes in cell shape, motility, and adhesion during the epithelial to mesenchymal transition. FASEB J. 2010, 24, 1838–1851. [Google Scholar] [CrossRef] [Green Version]
- Loh, C.Y.; Chai, J.Y.; Tang, T.F.; Wong, W.F.; Sethi, G.; Shanmugam, M.K.; Looi, C.Y. The E-cadherin and N-cadherin switch in epithelial-to-mesenchymal transition: Signaling, therapeutic implications, and challenges. Cells 2019, 8, 1118. [Google Scholar] [CrossRef] [PubMed] [Green Version]
- Scarpa, E.; Szabó, A.; Bibonne, A.; Theveneau, E.; Parsons, M.; Mayor, R. Cadherin switch during EMT in neural crest cells leads to contact inhibition of locomotion via repolarization of forces. Dev. Cell 2015, 34, 421–434. [Google Scholar] [CrossRef] [Green Version]
- Stewart, R.A.; Arduini, B.L.; Berghmans, S.; George, R.E.; Kanki, J.P.; Henion, P.D.; Look, A.T. Zebrafish foxd3 is selectively required for neural crest specification, migration and survival. Dev. Biol. 2006, 292, 174–188. [Google Scholar] [CrossRef] [PubMed] [Green Version]
- Teng, L.; Mundell, N.A.; Frist, A.Y.; Wang, Q.; Labosky, P.A. Requirement for Foxd3 in the maintenance of neural crest progenitors. Development 2008, 135, 1615–1624. [Google Scholar] [CrossRef] [Green Version]
- Cheung, M.; Briscoe, J. Neural crest development is regulated by the transcription factor Sox9. Development 2003, 130, 5681–5693. [Google Scholar] [CrossRef] [Green Version]
- Kos, R.; Reedy, M.V.; Johnson, R.L.; Erickson, C.A. The winged-helix transcription factor FoxD3 is important for establishing the neural crest lineage and repressing melanogenesis in avian embryos. Development 2001, 128, 1467–1479. [Google Scholar]


| Gene Name | Forward Primer (5′-3′) | Reverse Primer (5′-3′) | NCBI Ref ID | Product Length (bp) |
|---|---|---|---|---|
| WNT3A | TCGGAAACTCCCCTTTCAGC | TGCTCATCTTGCCTGGAG | NM_204675.2 | 106 |
| TGFB | TCGACTTCCGCAAGGATC | CCCGGGTTGTGTTGGTT | HE646744.1 | 148 |
| CDH1 | GAAGACAGCCAAGGGCCTG | TCTGGTACCCTACCCTCTTG | NM_001039258.2 | 183 |
| CDH2 | AGCCCAGGAGTTTGTAGTG | TTTGGTCCTTTTCTGAGGCCC | XM_025147080.1 | 114 |
| VIM | GACCAGCTGACCAACGA | GAGGCATTGTCAACATCC | NM_001048076.2 | 158 |
| TWIST | CGAAGCGTTCACGTCGTTAC | TAGCTGCAATTGGTCCCTCG | NM_204739.2 | 156 |
| MSX1 | CTTACATAGGGCCGAGCCG | CAGGCACAGAACAGATCCCA | NM_205488.2 | 66 |
| PCNA | TGTTCCTCTCGTTGTGGAGT | TCCCAGTGCAGTTAAGAGCC | NM_204170.2 | 105 |
| CASP3 | AGTCTTTGGCAGGAAAGCCA | CAAGAGTAATAACCAGGAGCG | XM_015276122.2 | 195 |
| 18S rRNA | GGCCGTTCTTAGTTGGTGGA | TCAATCTCGGGTGGCTGAAC | NR_003278.3 | 144 |
| Group | Day-1 | Day-2 | Day-3 |
|---|---|---|---|
| Control | 2 (1, 4) *** | 2 (1, 6) *** | 3 (2, 7) *** |
| Treatment | 10 (8, 13) | 13 (8, 15) | 13 (9, 15) |
Publisher’s Note: MDPI stays neutral with regard to jurisdictional claims in published maps and institutional affiliations. |
© 2021 by the authors. Licensee MDPI, Basel, Switzerland. This article is an open access article distributed under the terms and conditions of the Creative Commons Attribution (CC BY) license (https://creativecommons.org/licenses/by/4.0/).
Share and Cite
Parmar, B.; Verma, U.; Khaire, K.; Danes, D.; Balakrishnan, S. Inhibition of Cyclooxygenase-2 Alters Craniofacial Patterning during Early Embryonic Development of Chick. J. Dev. Biol. 2021, 9, 16. https://0-doi-org.brum.beds.ac.uk/10.3390/jdb9020016
Parmar B, Verma U, Khaire K, Danes D, Balakrishnan S. Inhibition of Cyclooxygenase-2 Alters Craniofacial Patterning during Early Embryonic Development of Chick. Journal of Developmental Biology. 2021; 9(2):16. https://0-doi-org.brum.beds.ac.uk/10.3390/jdb9020016
Chicago/Turabian StyleParmar, Bhaval, Urja Verma, Kashmira Khaire, Dhanush Danes, and Suresh Balakrishnan. 2021. "Inhibition of Cyclooxygenase-2 Alters Craniofacial Patterning during Early Embryonic Development of Chick" Journal of Developmental Biology 9, no. 2: 16. https://0-doi-org.brum.beds.ac.uk/10.3390/jdb9020016