Changes in Maximal Strength and Home Run Performance in NCAA Division I Baseball Players Across 3 Competitive Seasons: A Descriptive Study

 ,
,  ,
,  , , , and
Abstract
:1. Introduction
2. Methods
3. Testing Procedures
4. Statistics
5. Results
6. Discussion
7. Practical Application
Author Contributions
Funding
Institutional Review Board Statement
Informed Consent Statement
Data Availability Statement
Conflicts of Interest
References
- Suchomel, T.J.; Nimphius, S.; Stone, M.H. The Importance of Muscular Strength in Athletic Performance. Sports Med. 2016, 46, 1419–1449. [Google Scholar] [CrossRef] [PubMed]
- Ebben, W.P.; Hintz, M.J.; Simenz, C.J. Strength and conditioning practices of Major League Baseball strength and conditioning coaches. J. Strength Cond Res. 2005, 19, 538–546. [Google Scholar] [PubMed]
- Crotin, R.L.; Forsythe, C.M.; Bhan, S.; Karakolis, T. Changes in physical size among major league baseball players and its subsequent attribution to elite offensive performance. J. Strength Cond. Res. 2014, 28, 2705–2708. [Google Scholar] [CrossRef] [PubMed]
- DeRenne, C. Implement weight training programs. Natl. Strength Cond. Assoc. J. 1987, 9, 35–37. [Google Scholar] [CrossRef]
- Schwendel, P.J.; Thorland, W. Traditional baseball weight training versus power weight training: Effects on bat velocity. Med. Sci. Sports Exerc. 1992, 24, 137. [Google Scholar] [CrossRef]
- Szymanski, D.J.; McIntyre, J.S.; Szymanski, J.M.; Bradford, T.J.; Schade, R.L.; Madsen, N.H.; Pascoe, D.D. Effect of 12 weeks of torso rotational strength on angular hip, angular shoulder, and linear batswing velocities of high school baseball players. J. Strength Cond. Res. 2007, 21, 1117–1125. [Google Scholar] [PubMed]
- Szymanski, D.J.; DeRenne, C.; Spaniol, F.J. Contributing factors for increased bat swing velocity. J. Strength Cond. Res. 2009, 23, 1338–1352. [Google Scholar] [CrossRef]
- DeRenne, C. Increasing bat velocity. Athl. J. 1982, 28–31. [Google Scholar]
- Sergo, C.; Boatwright, D. Boatwright. Training Methods Using Various Weighted Bats and the Effects on Bat Velocity. J. Strength Cond. Res. 1993, 7, 115–117. [Google Scholar]
- Hoffman, J.; Vazquez, J.; Pichardo, N. Anthropometric and Performance Comparisons in Professional Baseball Players. J. Strength Cond. Res. 2010, 23, 2173–2178. [Google Scholar] [CrossRef]
- Spaniol, F.J.; Bonnette, R.; Melrose, D.; Bohling, M. Physiological predictors of bat speed and batted-ball velocity in NCAA Division I baseball players. J. Strength Cond. Res. 2006, 20, 185. [Google Scholar]
- Szymanski, D.J.; Szymanski, J.M.; Schade, R.L.; Bradford, T.J. Relationship between physiological variables and linear bat swing velocity of high school baseball players. Med. Sci. Sports Exerc. 2008, 24, 2933–2943. [Google Scholar] [CrossRef]
- Szymanski, J.M.; Szymanski, D.J.; Albert, J.M.; Hemperley, D.L.; Hsu, H.S.; Moore, R.M.; Potts, J.D.; Reed, J.G.; Turner, J.E.; Walker, J.P.; et al. Relationship between physiological characteristics and baseball-specific variables of high school baseball players. J. Strength Cond. Res. 2008, 22, 110–111. [Google Scholar]
- Bishop, D.J. An Applied Research Model for the Sport Sciences. Sports Med. 2008, 38, 253–263. [Google Scholar] [CrossRef]
- Maddalozzo, G.F.; Cardinal, B.J.; Snow, C.M. Concurrent validity of the BOD POD and dual energy x-ray absorptiometry techniques for assessing body composition in young women. J. Am. Diet. Assoc. 2002, 102, 1677–1679. [Google Scholar] [CrossRef]
- Merrigan, J.J.; Gallo, S.; Fields, J.B.; Jones, M.T. Foot-to-foot bioelectrical impedance, air displacement plethysmography, and dual energy x-ray absorptiometry in resistance-trained men and women. Int. J. Exerc. Sci. 2018, 11, 1145–1155. [Google Scholar]
- Stone, M.H.; O’Bryant, H.S.; Hornsby, W.G.; Cunanaan, A.J.; Mizuguchi, S.; South, M.A.; Marsh, D.J.; Haff, G.G.; Ramsey, M.W.; Beckham, G.K.; et al. The Use of the Isometric Mid-thigh Pull in the Monitoring of Weightlifters: 25+ Years of Experience. Prof. Strength Cond. 2019, 54, 19–26. [Google Scholar]
- Beckham, G.; Mizuguchi, S.; Carter, C.; Sato, K.; Ramsey, M.; Lamont, H.; Stone, M. Relationships of isometric mid-thigh pull variables to weightlifting performance. J. Sports Med. Phys. Fit. 2013, 53, 573–581. [Google Scholar]
- Stone, M.H.; Sands, W.A.; Pierce, K.C.; Carlock, J.O.N.; Cardinale, M.; Newton, R.U. Relationship of maximum strength to weightlifting performance. Med. Sci. Sports Exerc. 2005, 37, 1037–1043. [Google Scholar]
- Nathan, A.M.; Crisco, J.J.; Greenwald, R.M.; Russell, D.A.; Smith, L.V. A comparative study of baseball bat performance. Sports Eng. 2011, 13, 153. [Google Scholar] [CrossRef]
- Szymanski, D.J.; Szymanski, J.M.; Albert, J.M.; Beam, J.R.; Hsu, H.S.; Reed, J.G.; Spaniol, F.J. Physiological and anthropometric characteristics of college baseball players over an entire year. J. Strength Cond. Res. 2010, 24 (Suppl. 1), 1. [Google Scholar] [CrossRef]
- Bailey, C.; Sato, K.; Alexander, R.; Chiang, C.Y.; Stone, M.H. Isometric force production symmetry and jumping performance in collegiate athletes. J. Trainology 2003, 2, 1–5. [Google Scholar] [CrossRef] [Green Version]
- Bailey, C.A.; Sato, K.; Hornsby, W.G. Predicting offensive performance in collegiate baseball players using isometric force production characteristics. In Proceedings of the International Conference on Biomechanics in Sports (2013), Taipei, Taiwan, 7–11 July 2013; pp. 448–451. [Google Scholar]
- Kraska, J.M.; Ramsey, M.W.; Haff, G.G.; Fethke, N.; Sands, W.A.; Stone, M.E.; Stone, M.H. Relationship between strength characteristics and unweighted and weighted vertical jump height. Int. J. Sports Physiol. Perform. 2009, 4, 461–473. [Google Scholar] [CrossRef] [PubMed] [Green Version]
- McGuigan, M.R.; Winchester, J.B. The relationship between isometric and dynamic strength in college football players. J. Sports Sci. Med. 2008, 7, 101. [Google Scholar]


| Season 1 to 2 | Season 1 to 3 | Season 2 to 3 | |
|---|---|---|---|
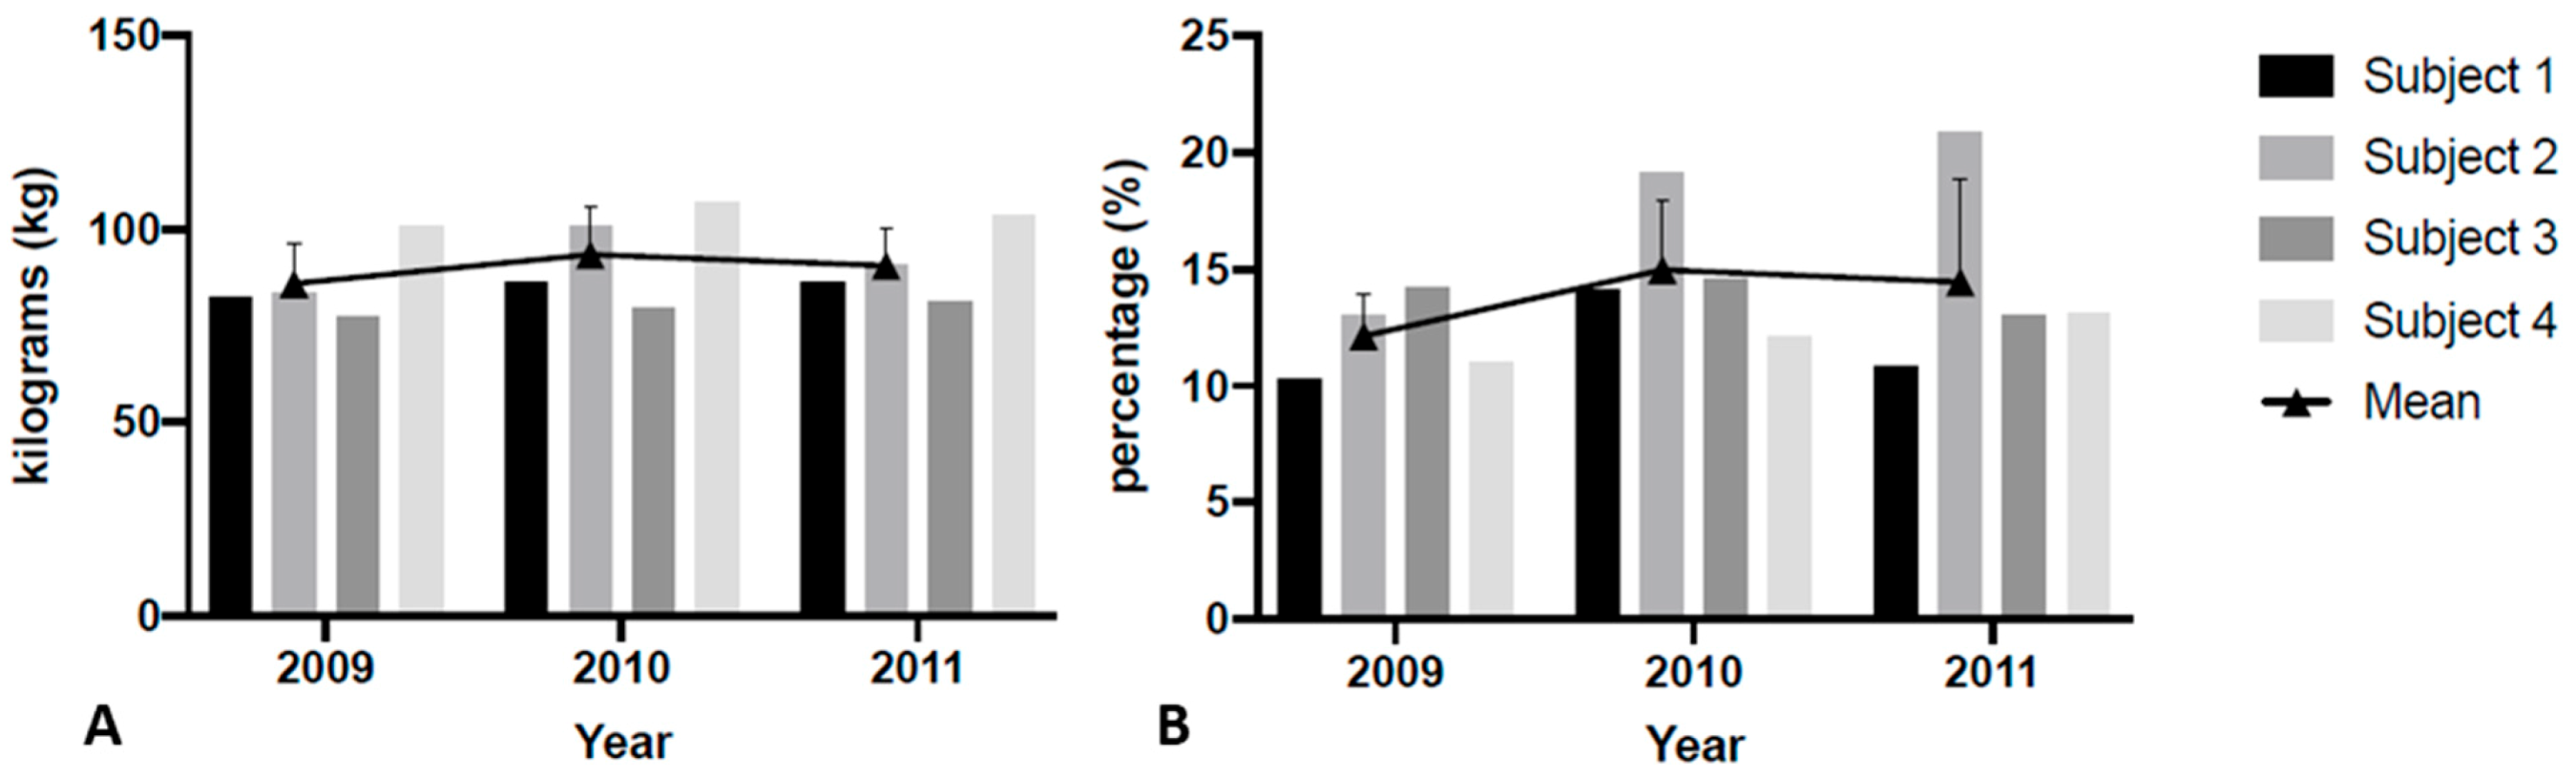
| Body Mass | 0.65 (−0.85, 1.97) | 0.46 (−1.00, 1.80) | −0.25 (−1.61, 1.17) |
| Body Fat Percentage | 1.17 (−0.46, 2.48) | 0.69 (−0.82, 2.01) | −0.14 (−1.51, 1.27) |
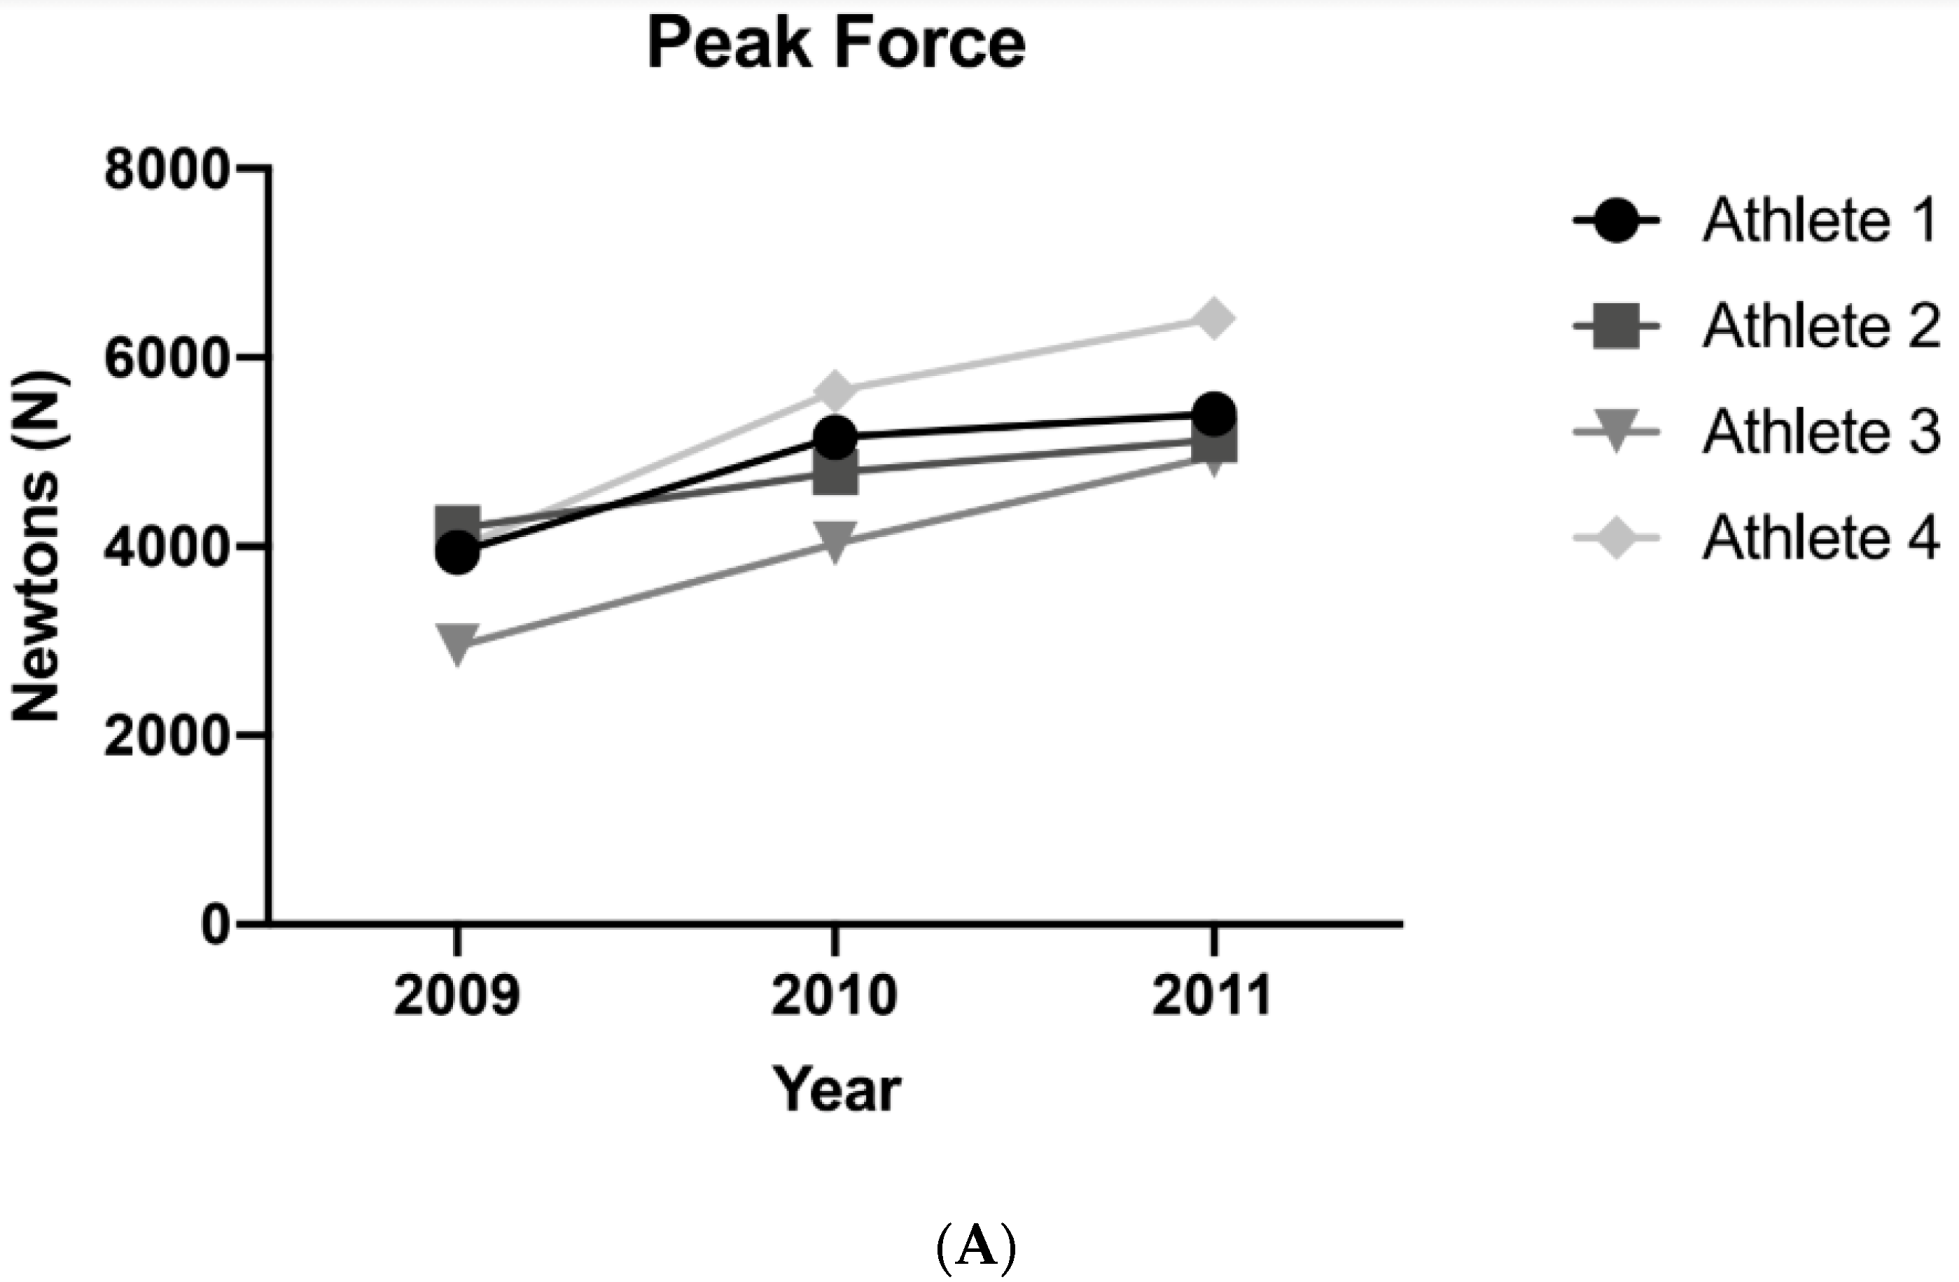
| Isometric Peak Force | 1.83 (0.00, 3.18) | 2.82 (0.62, 4.28) * | 0.86 (−0.69, 2.18) |
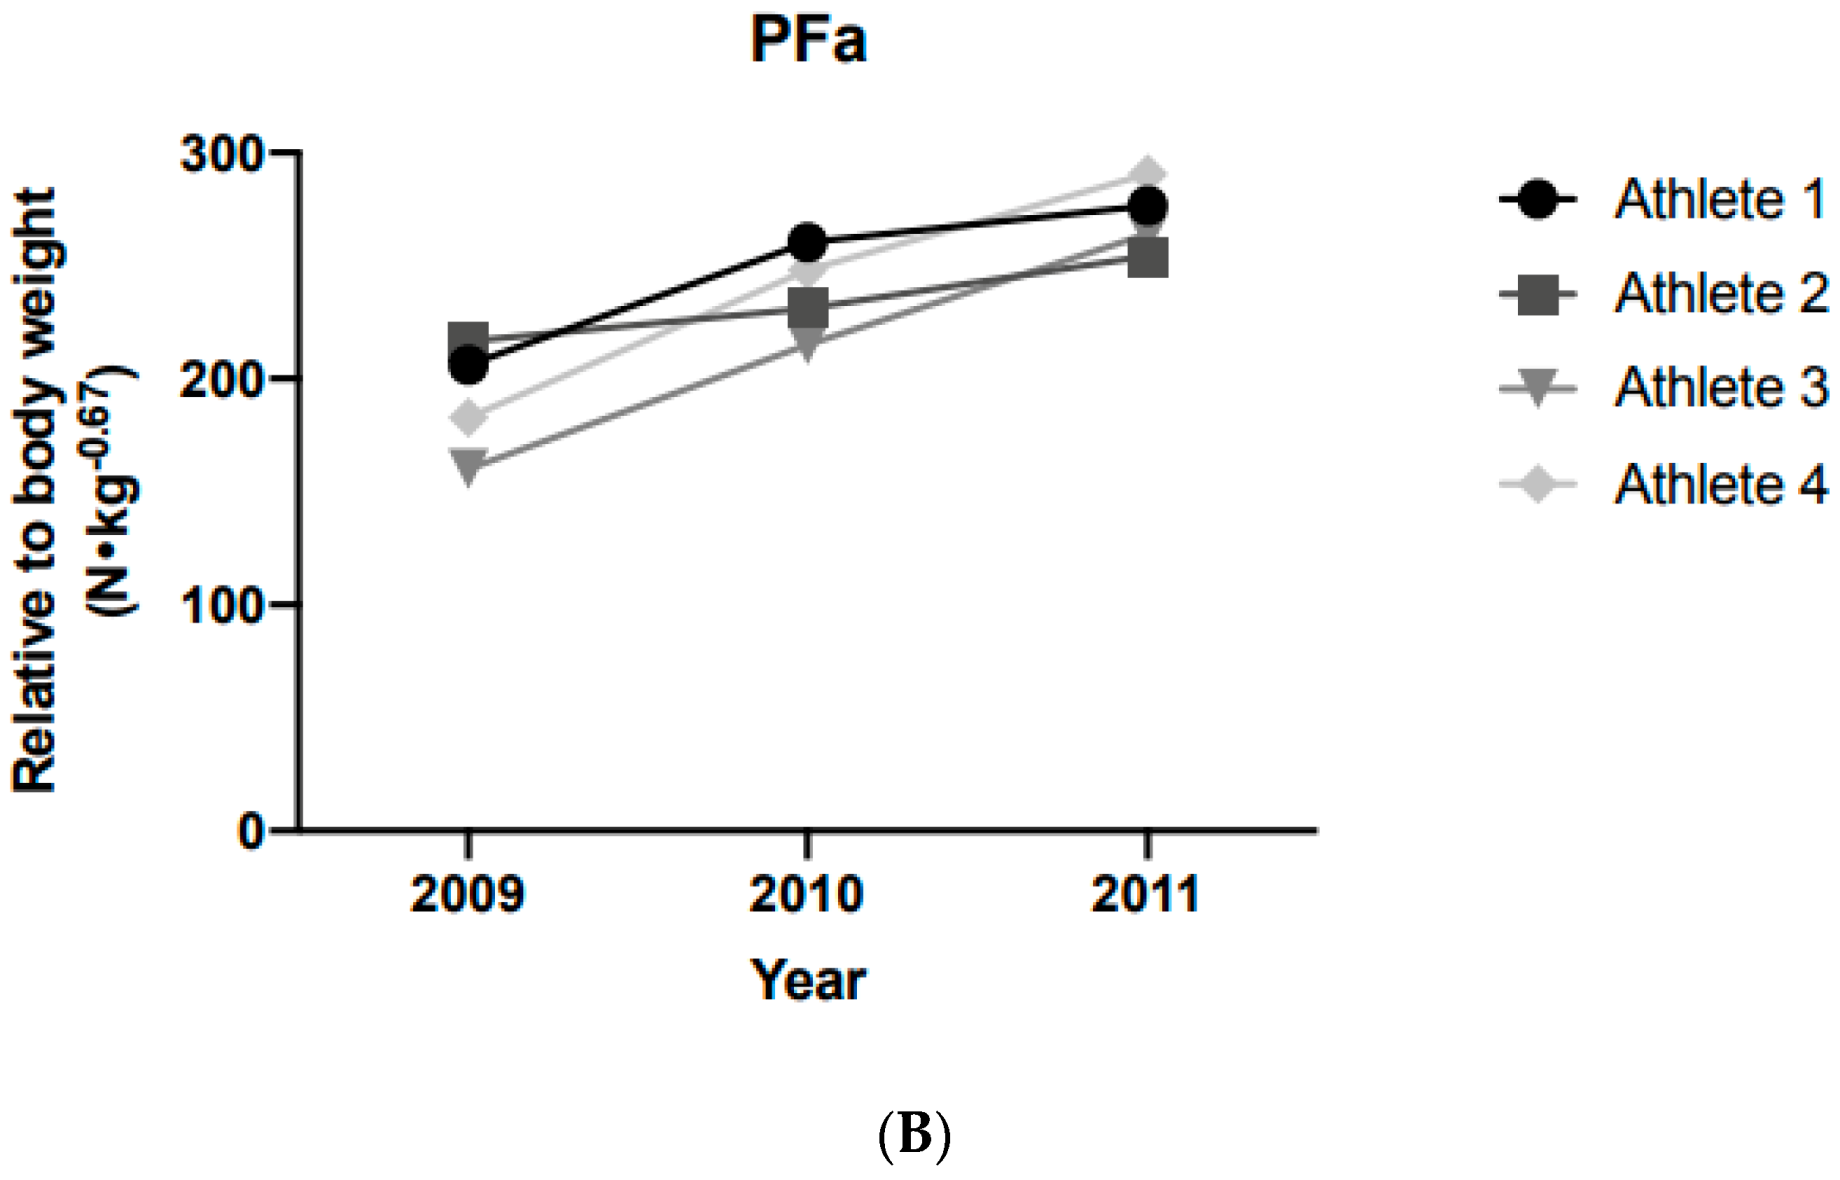
| Allometrically Scaled Peak Force | 2.09 (0.17, 3.46) | 3.81 (1.18, 5.44) * | 1.83 (0.00, 3.18) |
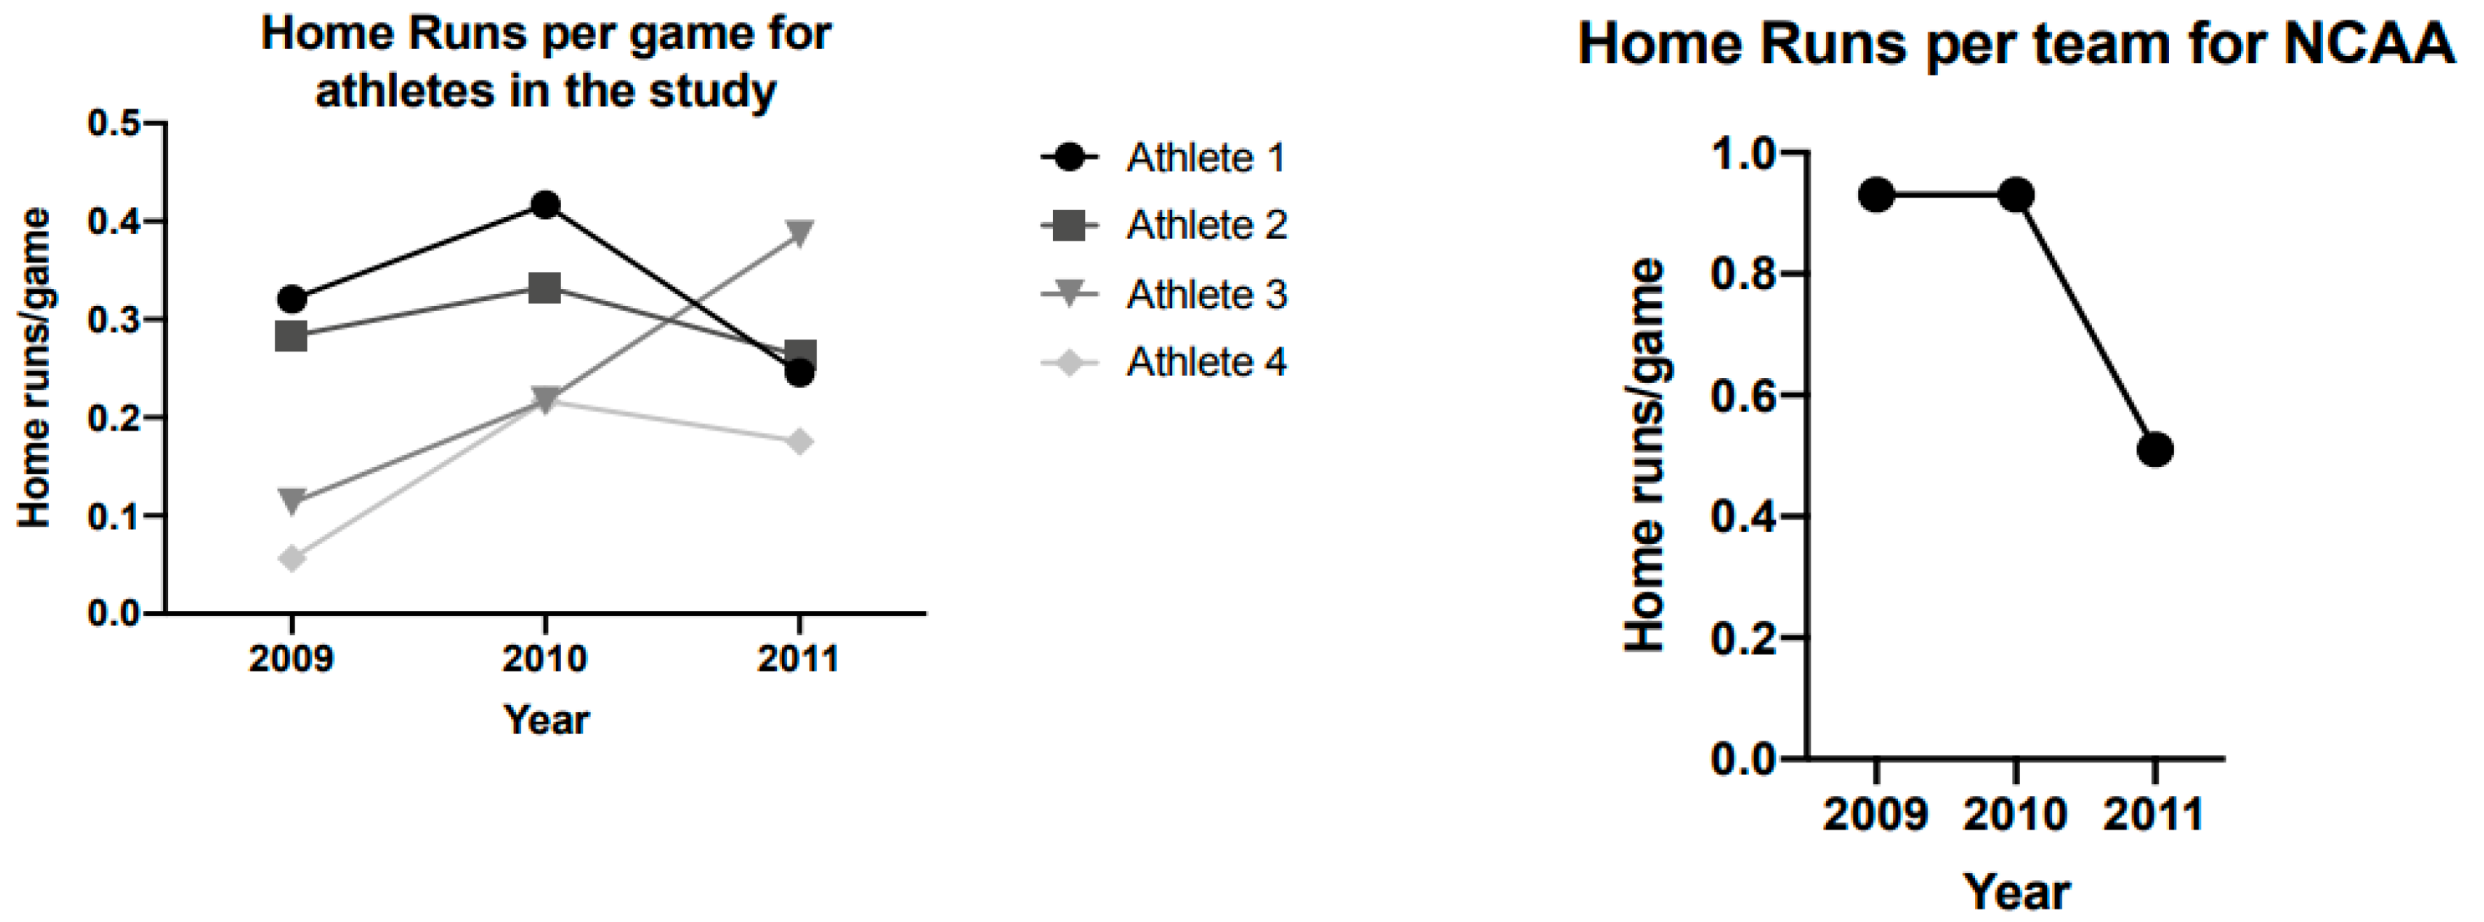
| Player | Season | Home Runs | Percent Change (%) between Seasons |
|---|---|---|---|
| Subject 1 | 2009 | 15 | |
| 2010 | 20 | 33.3 | |
| 2011 | 15 | −25.0 | |
| Subject 2 | 2009 | 6 | |
| 2010 | 13 | 117 | |
| 2011 | 14 | 7.69 | |
| Subject 3 | 2009 | 3 | |
| 2010 | 13 | 333 | |
| 2011 | 10 | −23.1 | |
| Subject 4 | 2009 | 17 | |
| 2010 | 25 | 47.1 | |
| 2011 | 22 | −12.0 |
Publisher’s Note: MDPI stays neutral with regard to jurisdictional claims in published maps and institutional affiliations. |
© 2021 by the authors. Licensee MDPI, Basel, Switzerland. This article is an open access article distributed under the terms and conditions of the Creative Commons Attribution (CC BY) license (http://creativecommons.org/licenses/by/4.0/).
Share and Cite
Hornsby, W.G.; Tice, A.L.; Stone, J.D.; Merrigan, J.J.; Hagen, J.; Wagle, J.P.; Cunanan, A.J.; Stone, M.H. Changes in Maximal Strength and Home Run Performance in NCAA Division I Baseball Players Across 3 Competitive Seasons: A Descriptive Study. J. Funct. Morphol. Kinesiol. 2021, 6, 4. https://0-doi-org.brum.beds.ac.uk/10.3390/jfmk6010004
Hornsby WG, Tice AL, Stone JD, Merrigan JJ, Hagen J, Wagle JP, Cunanan AJ, Stone MH. Changes in Maximal Strength and Home Run Performance in NCAA Division I Baseball Players Across 3 Competitive Seasons: A Descriptive Study. Journal of Functional Morphology and Kinesiology. 2021; 6(1):4. https://0-doi-org.brum.beds.ac.uk/10.3390/jfmk6010004
Chicago/Turabian StyleHornsby, W. Guy, Abigail L. Tice, Jason D. Stone, Justin J. Merrigan, Joshua Hagen, John P. Wagle, Aaron J. Cunanan, and Michael H. Stone. 2021. "Changes in Maximal Strength and Home Run Performance in NCAA Division I Baseball Players Across 3 Competitive Seasons: A Descriptive Study" Journal of Functional Morphology and Kinesiology 6, no. 1: 4. https://0-doi-org.brum.beds.ac.uk/10.3390/jfmk6010004