4D Bragg Edge Tomography of Directional Ice Templated Graphite Electrodes

 , , , , and
Abstract
:1. Introduction
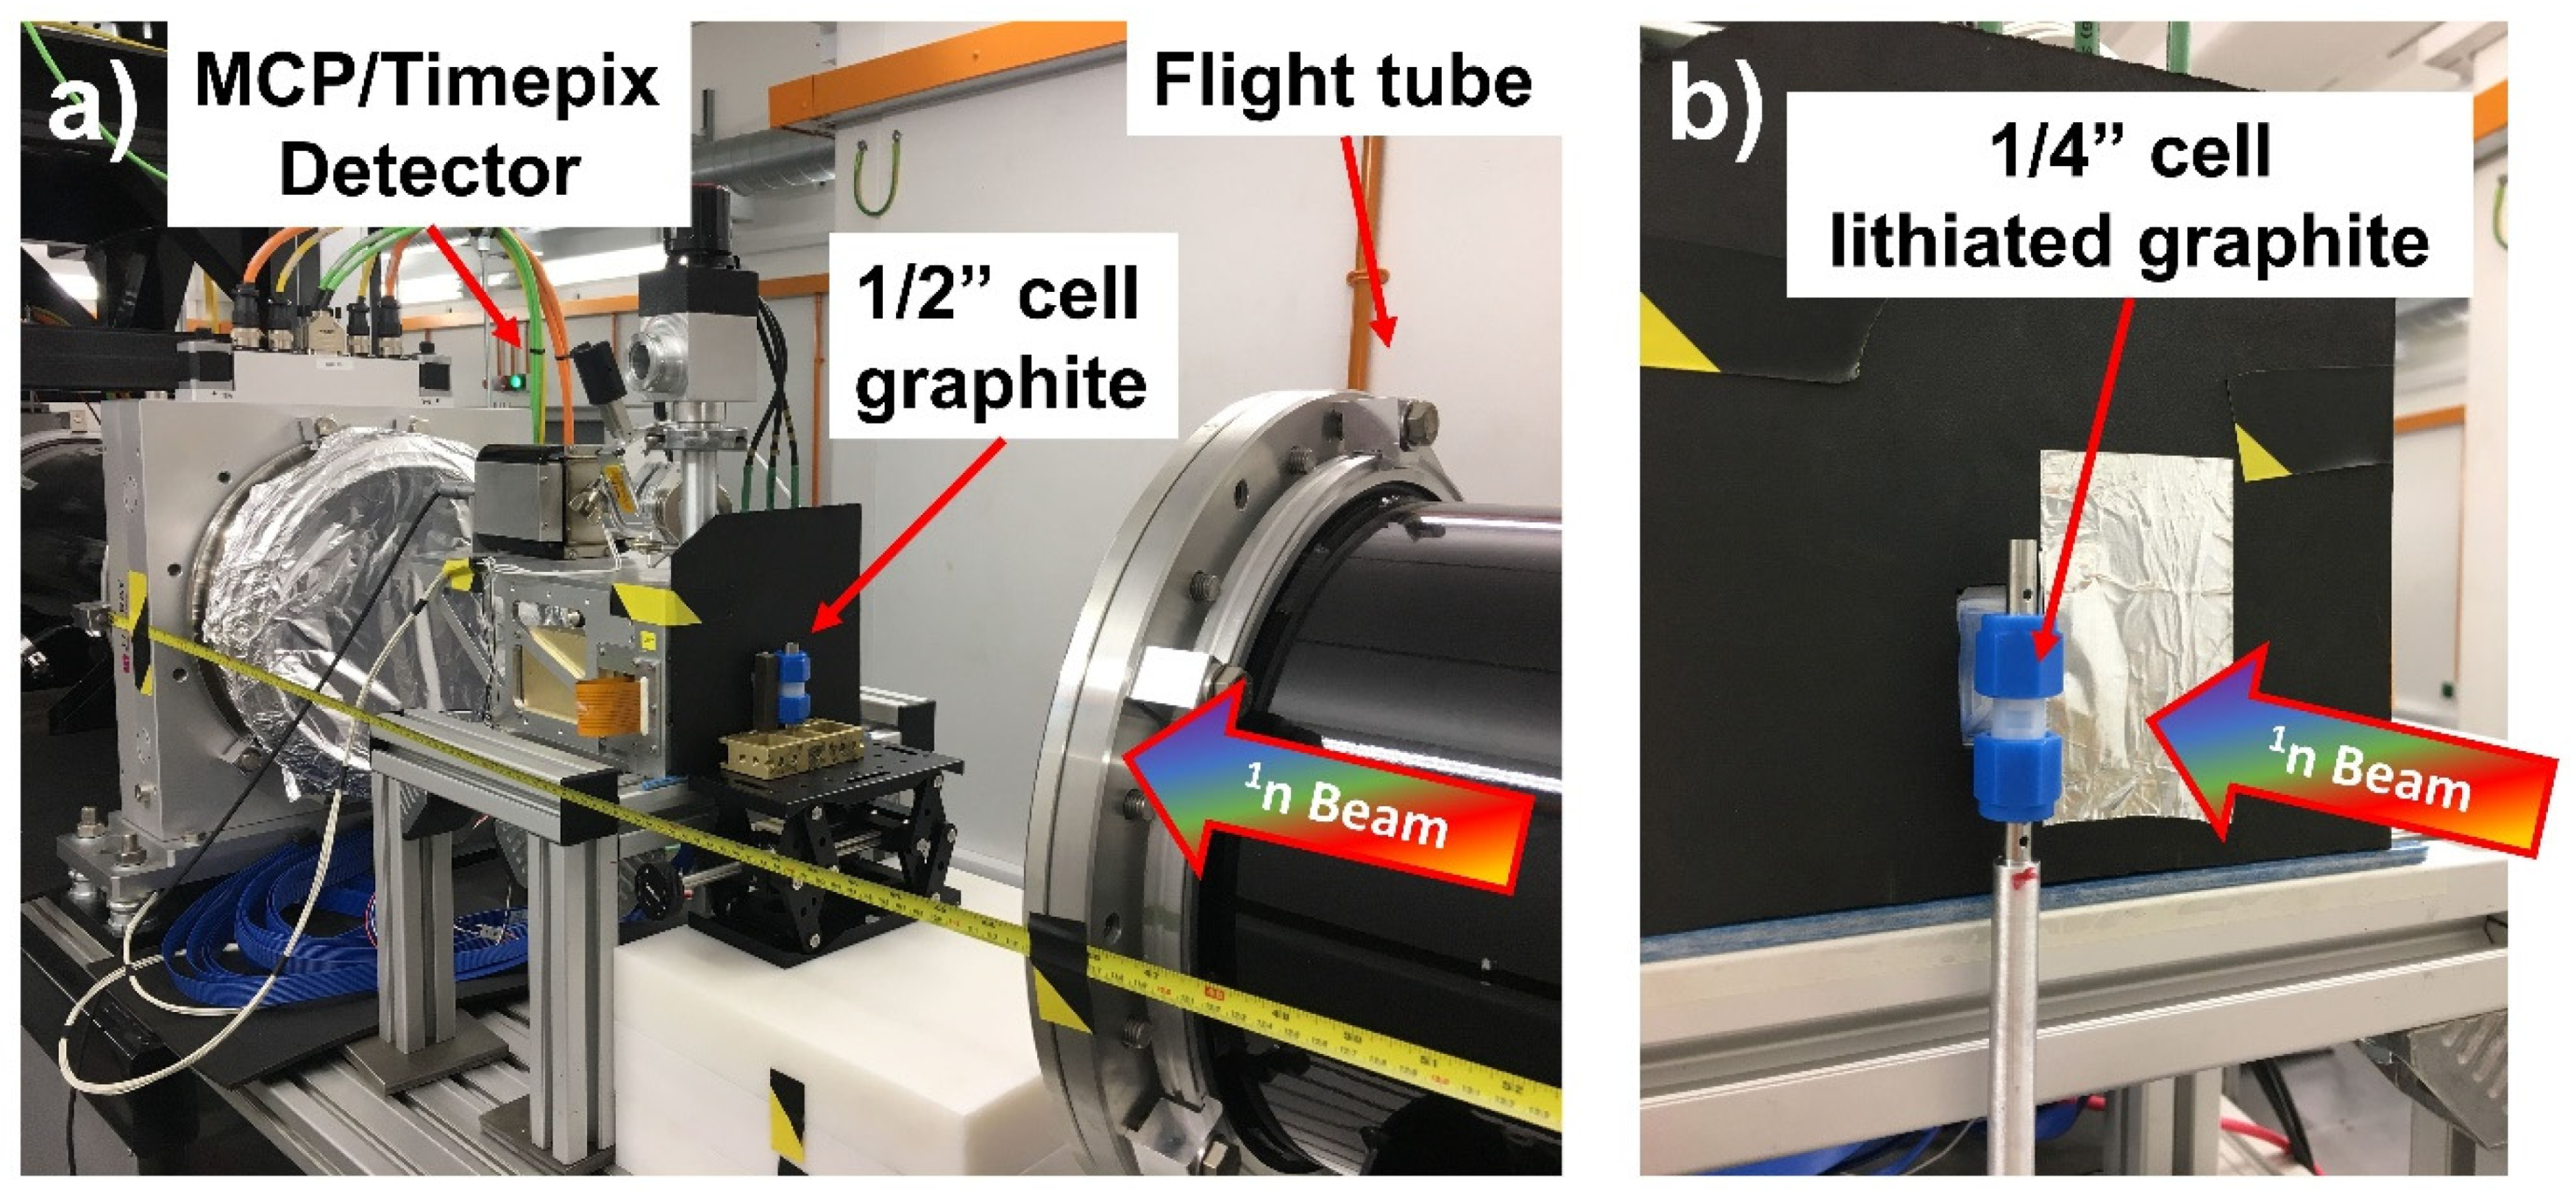
2. Experimental
2.1. Directional Ice Templated Electrodes
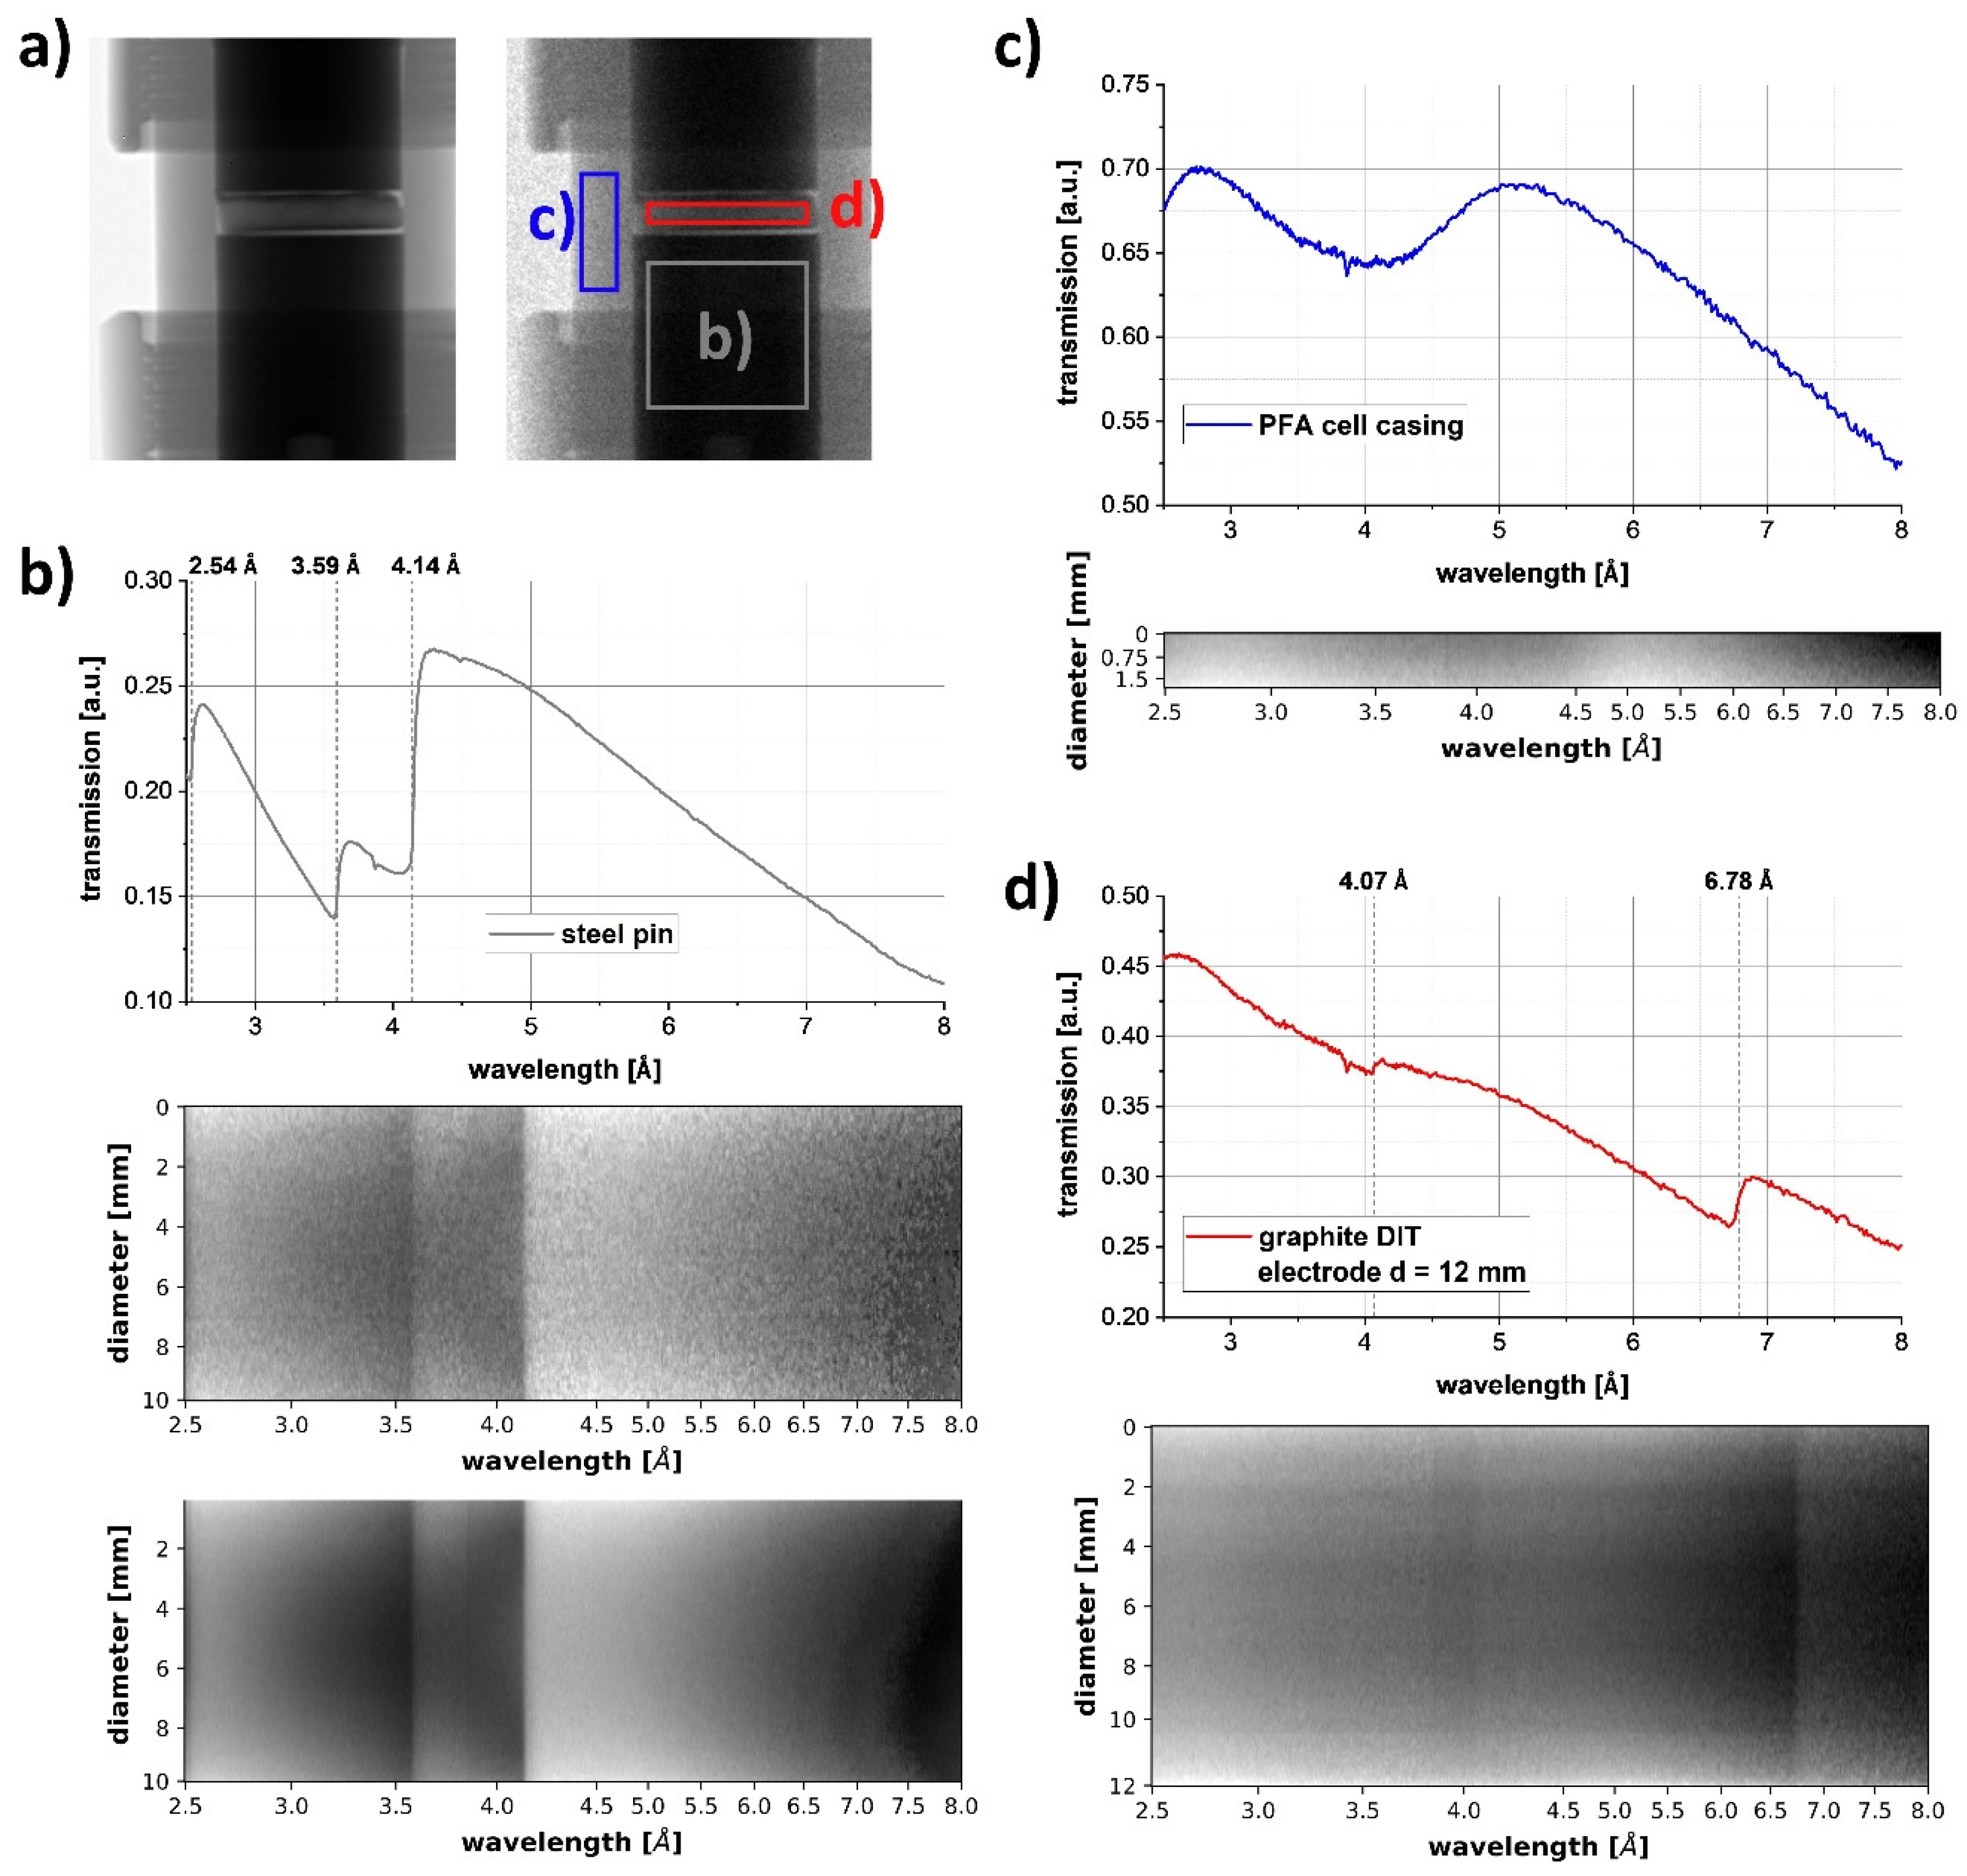
2.2. Bragg Edge Tomography
2.3. X-ray Tomography
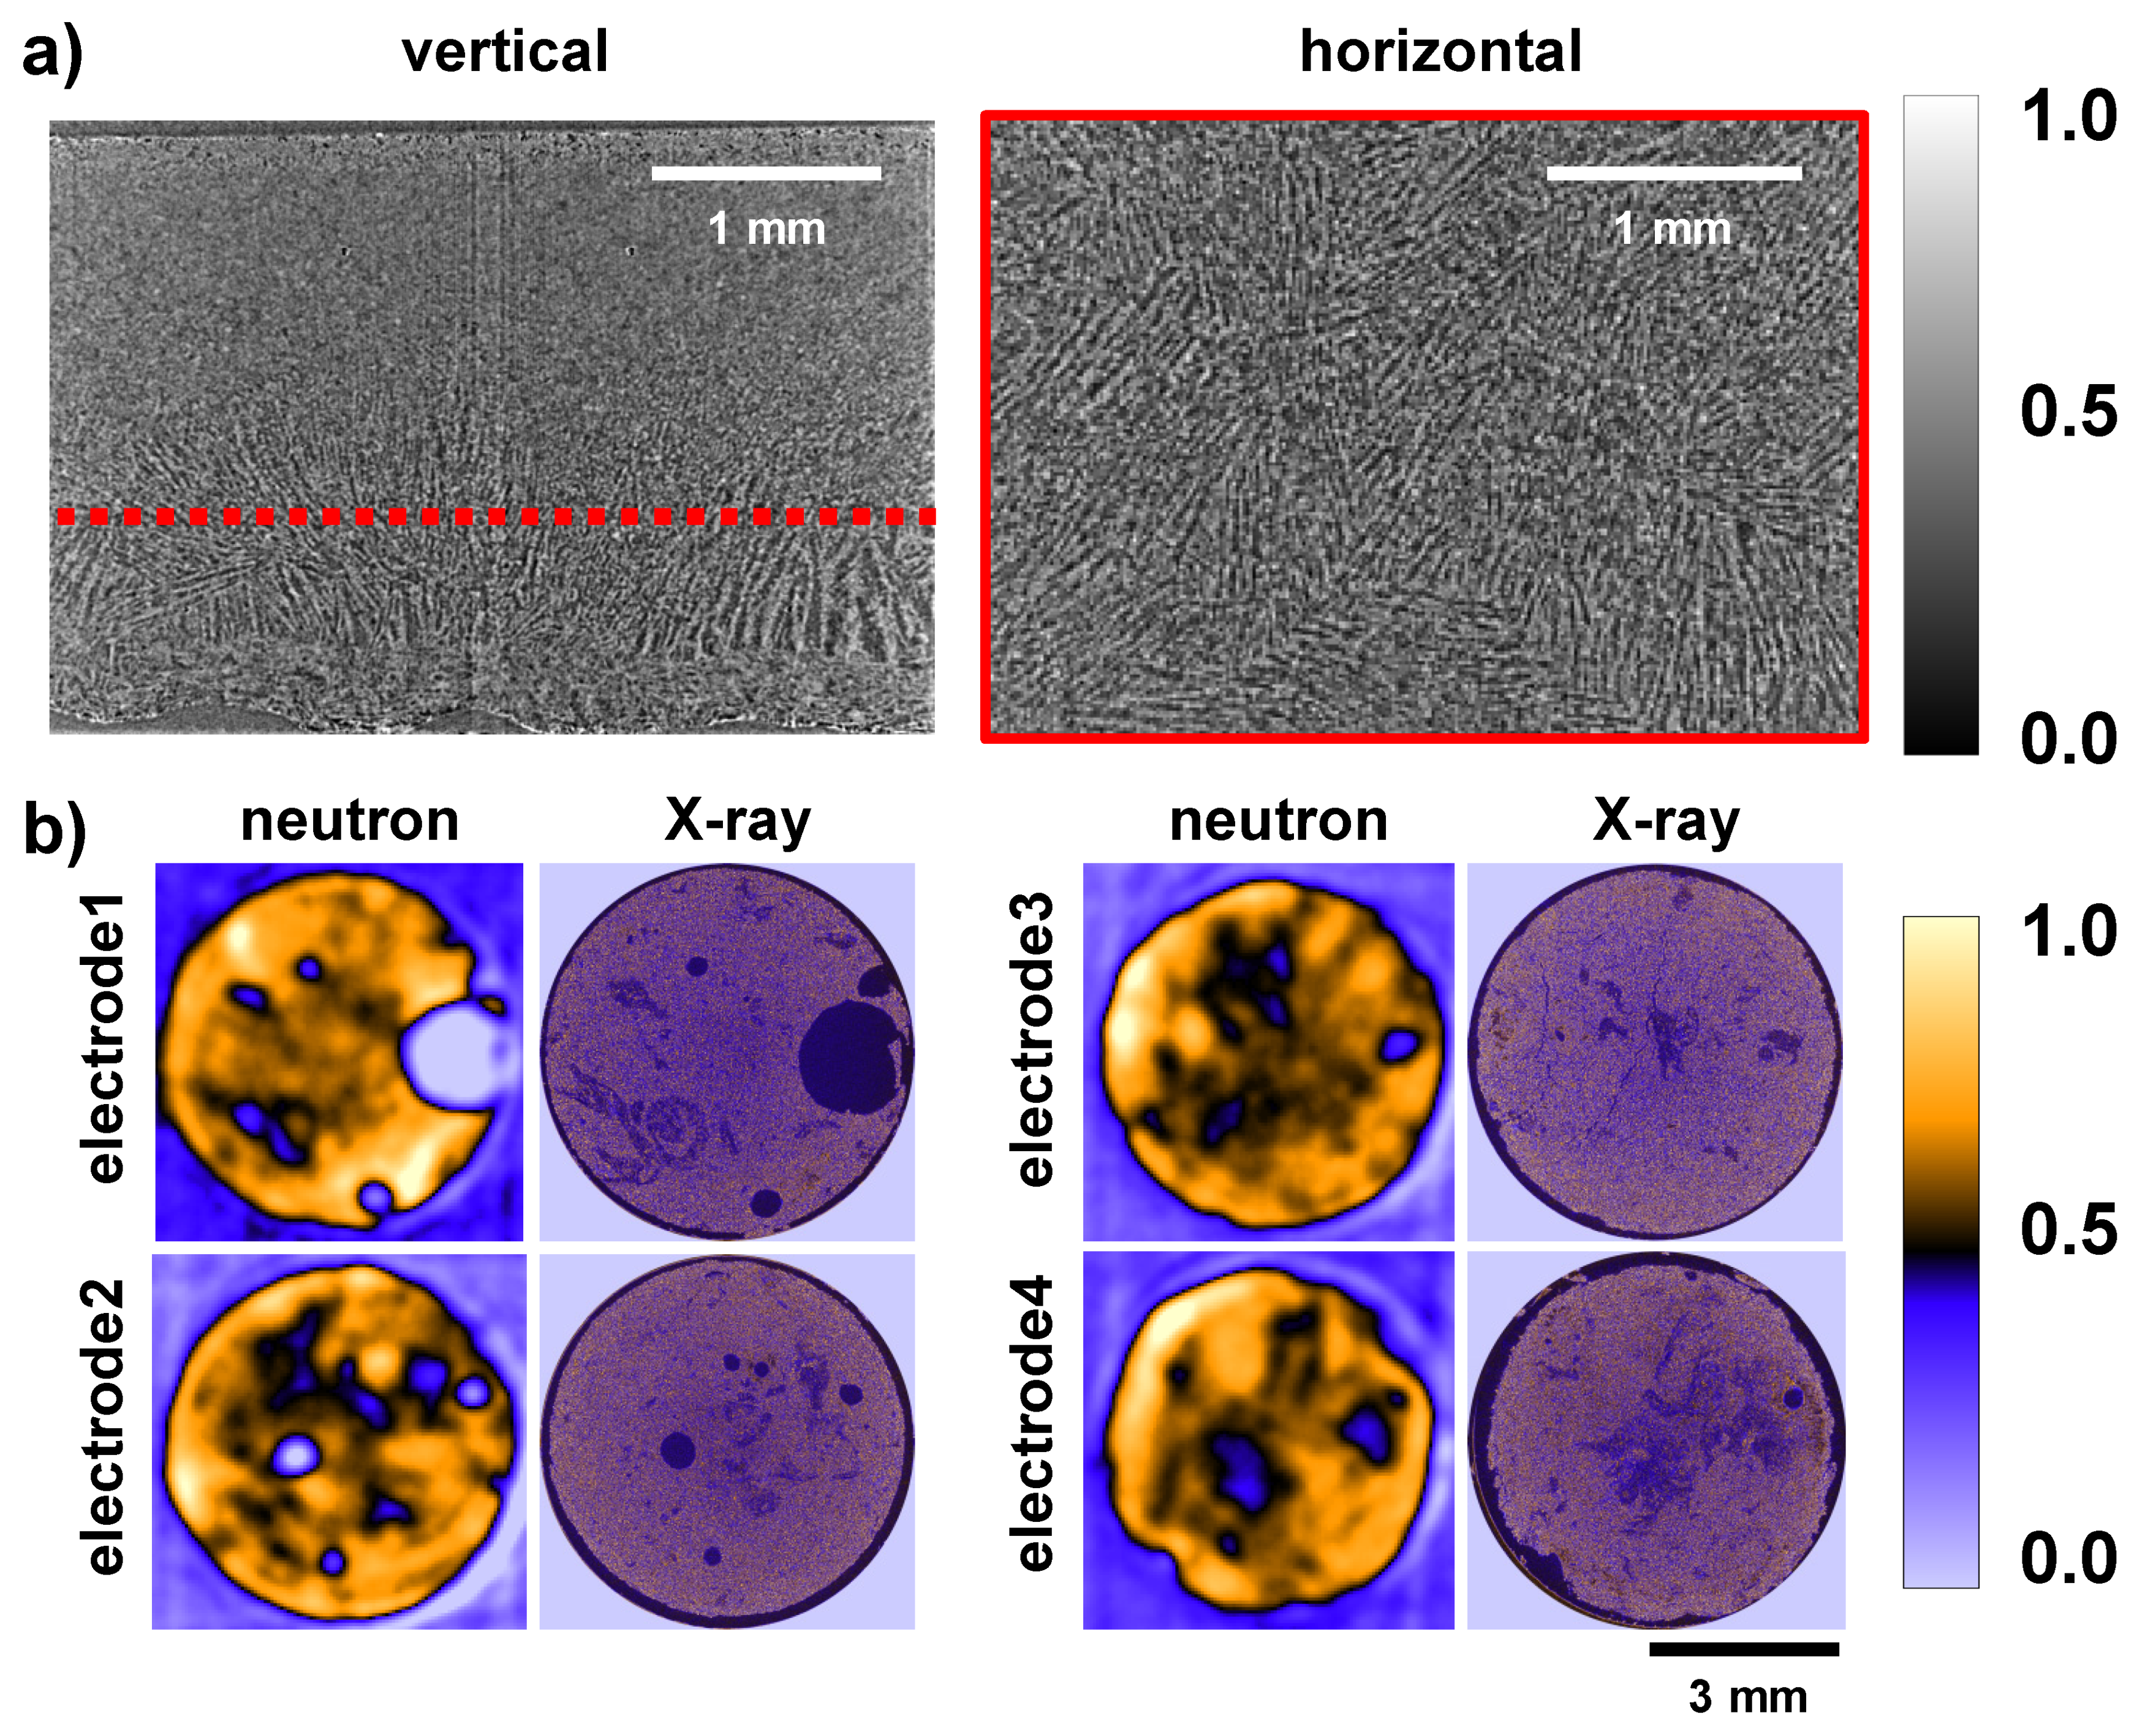
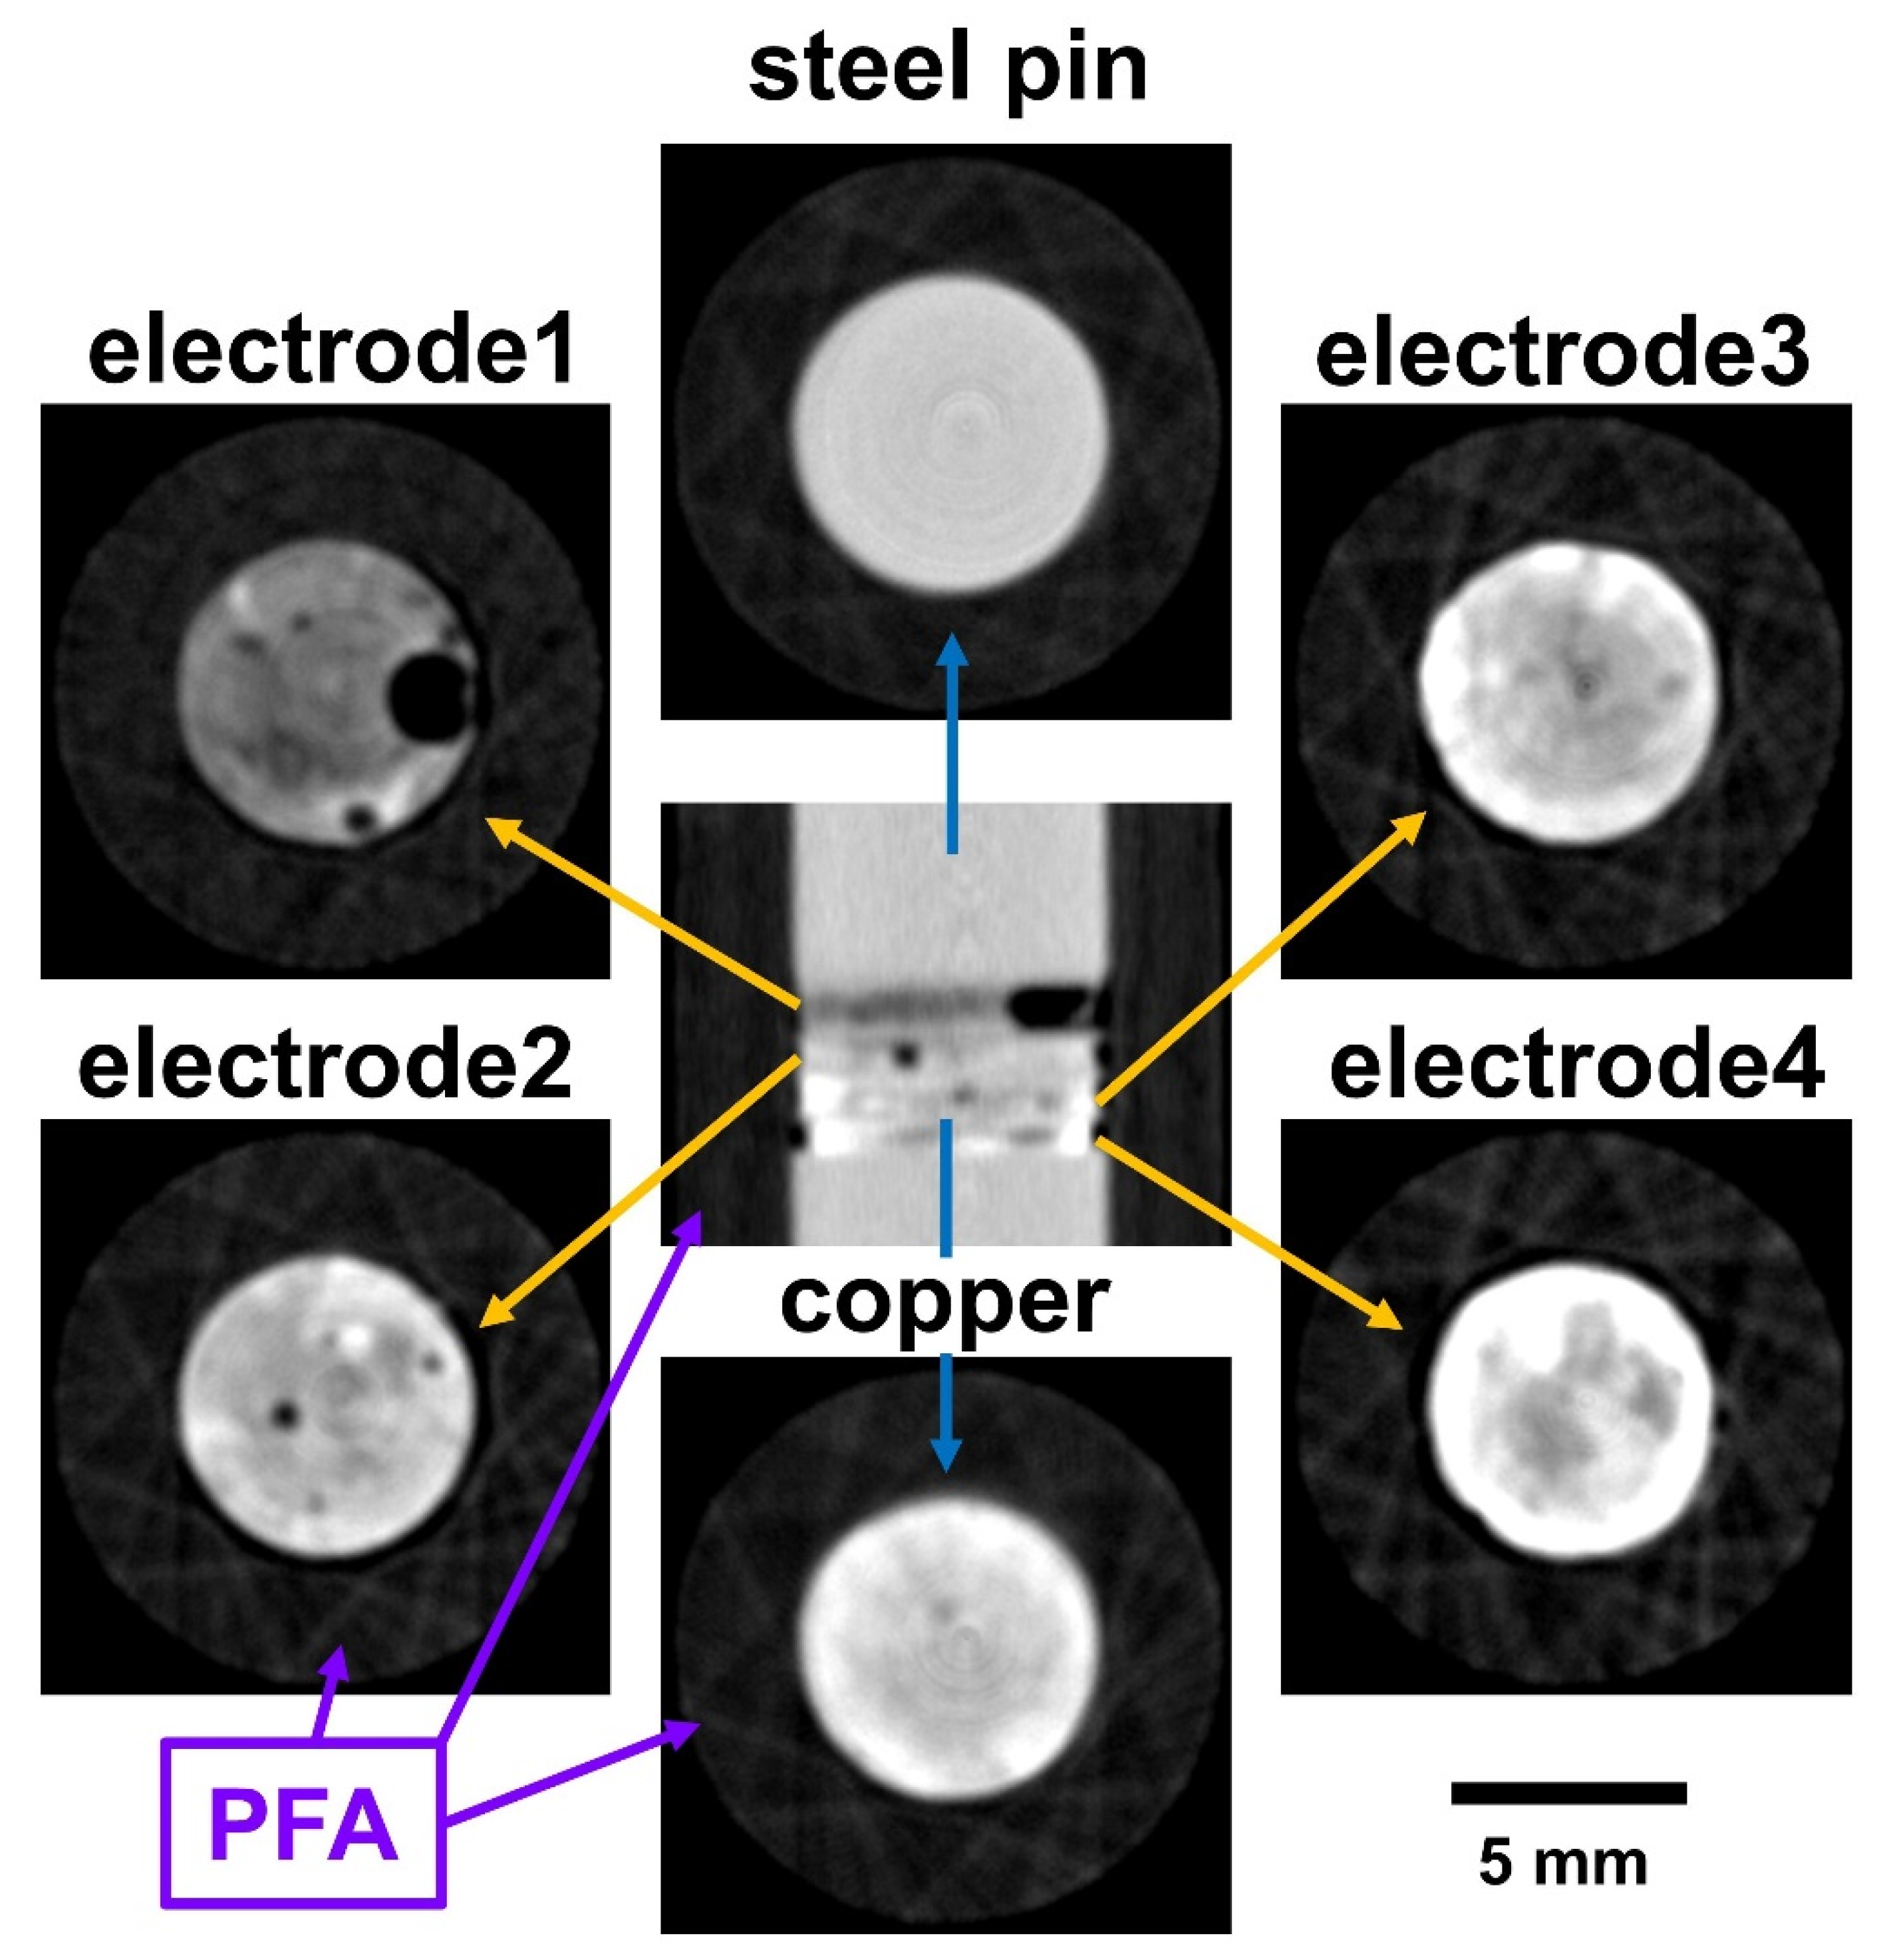
3. Results and Discussion
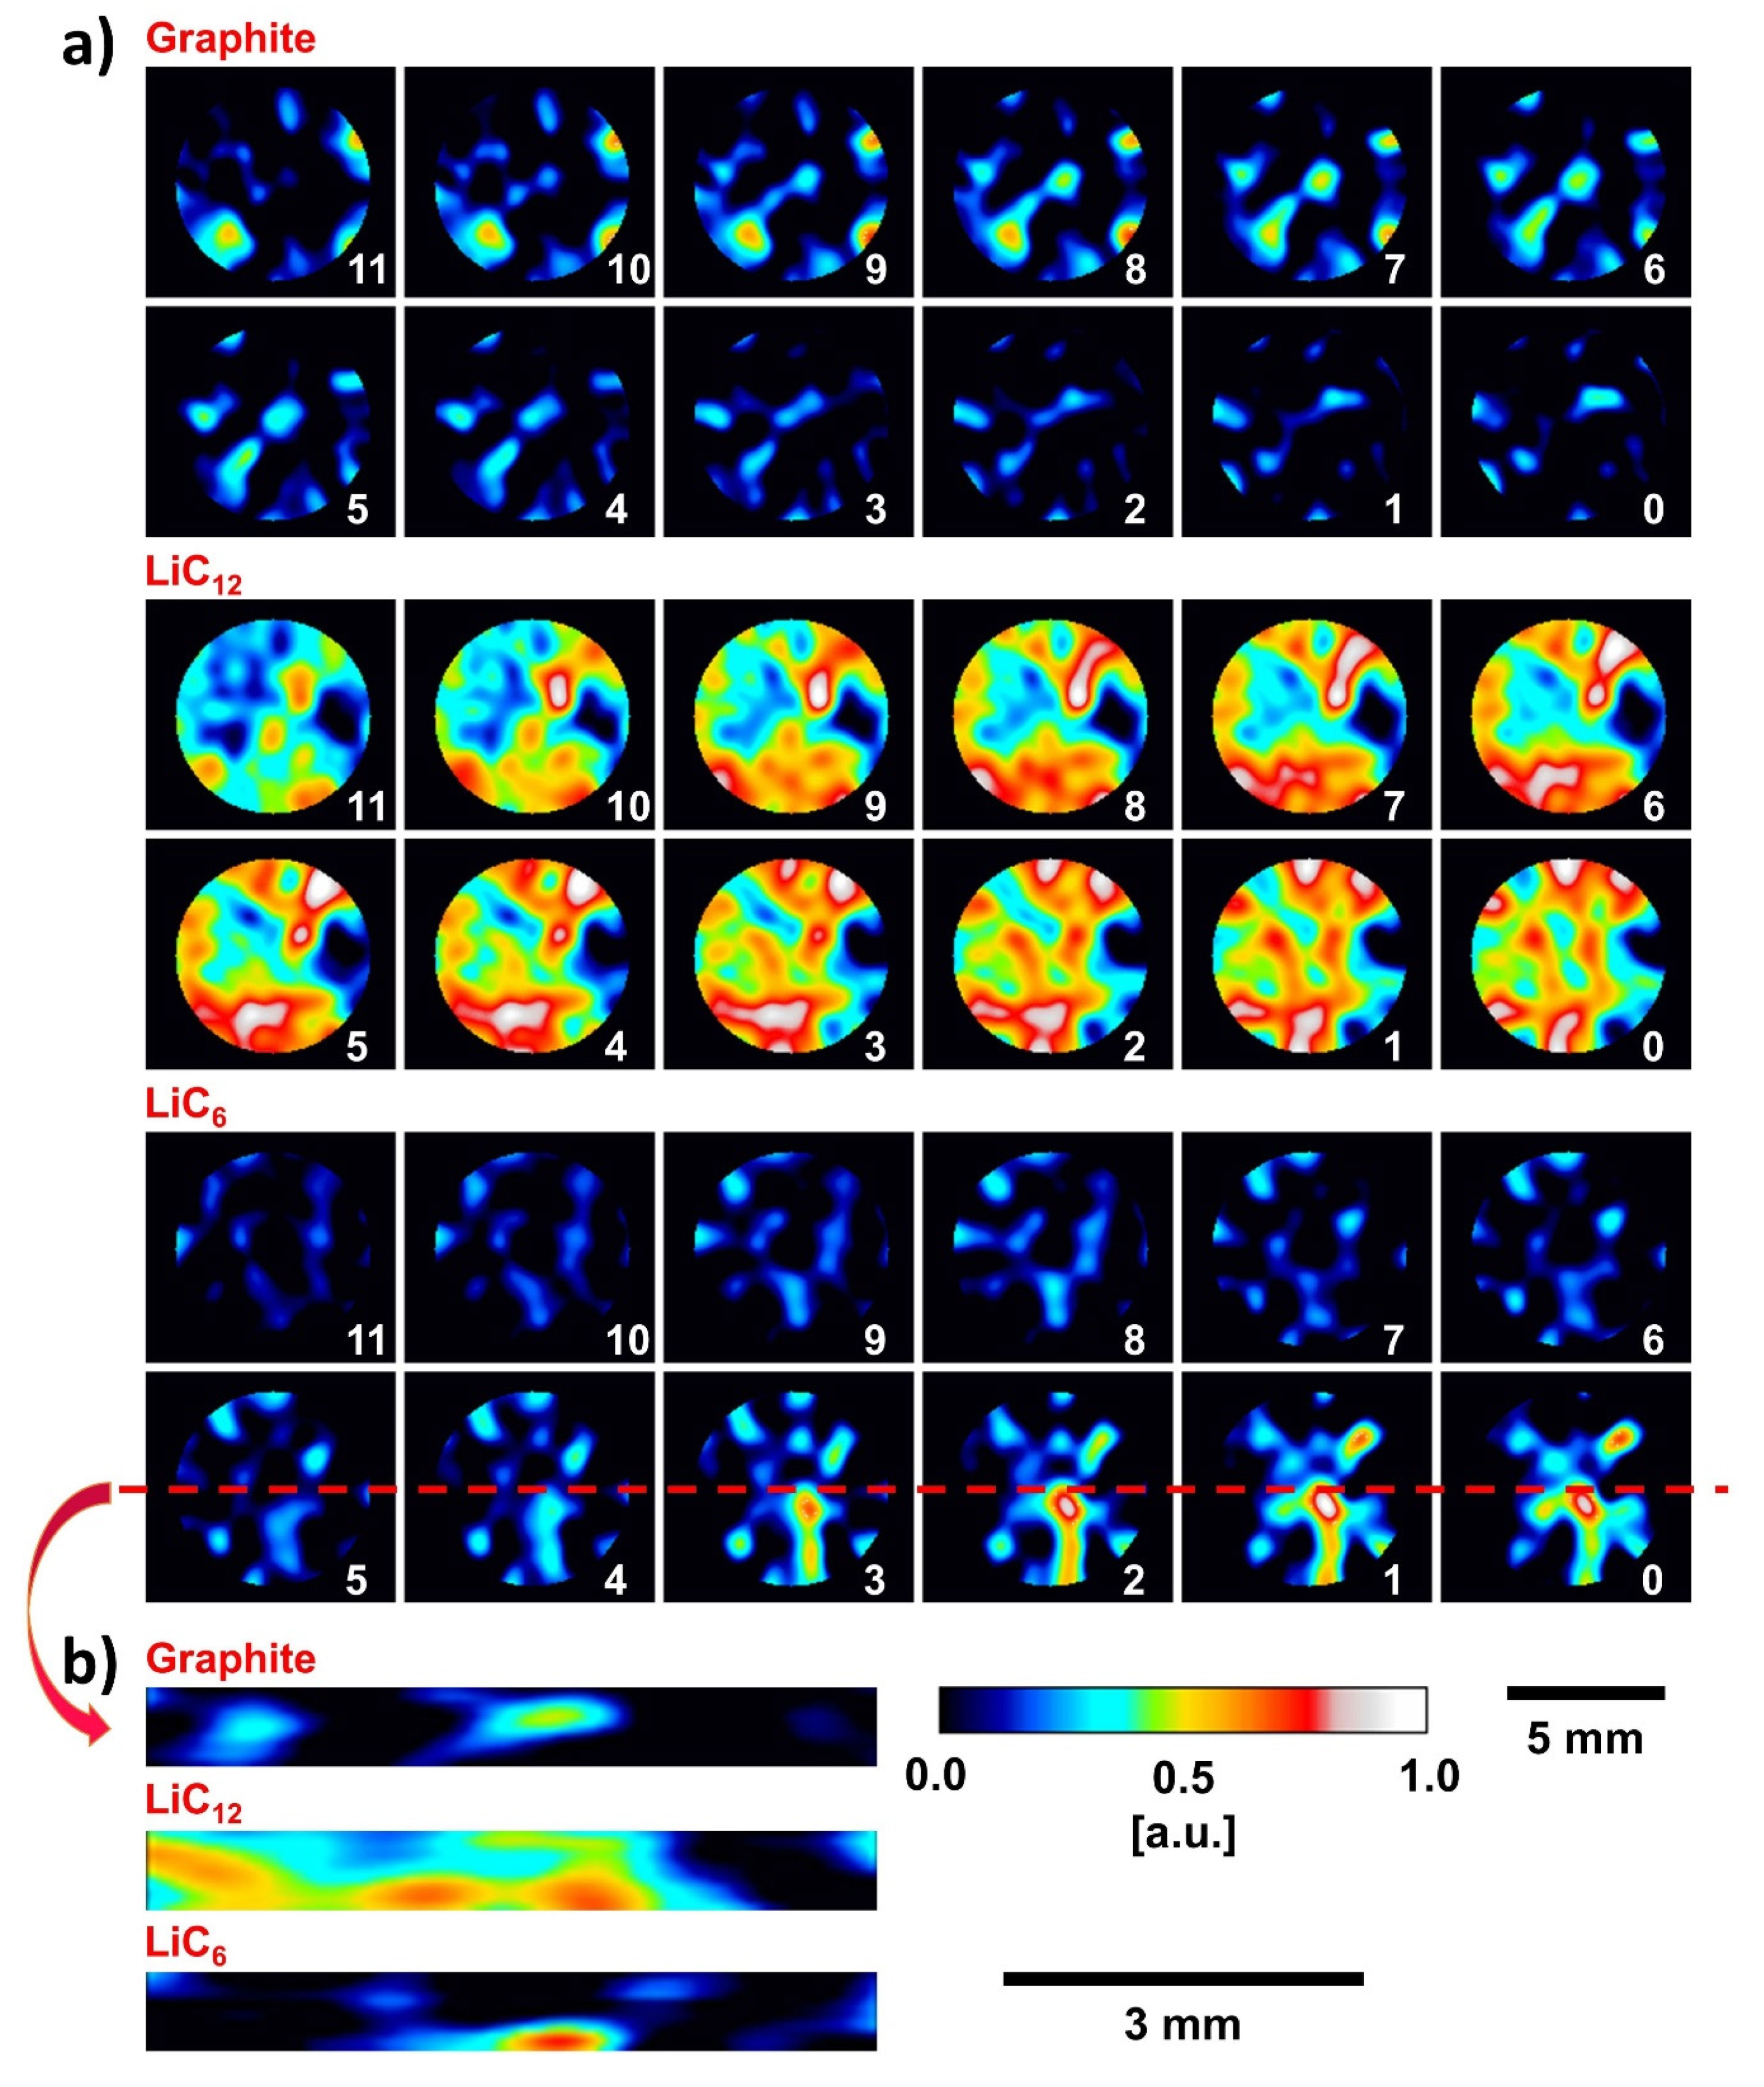
3.1. Coral-Like DIT Electrode Structure
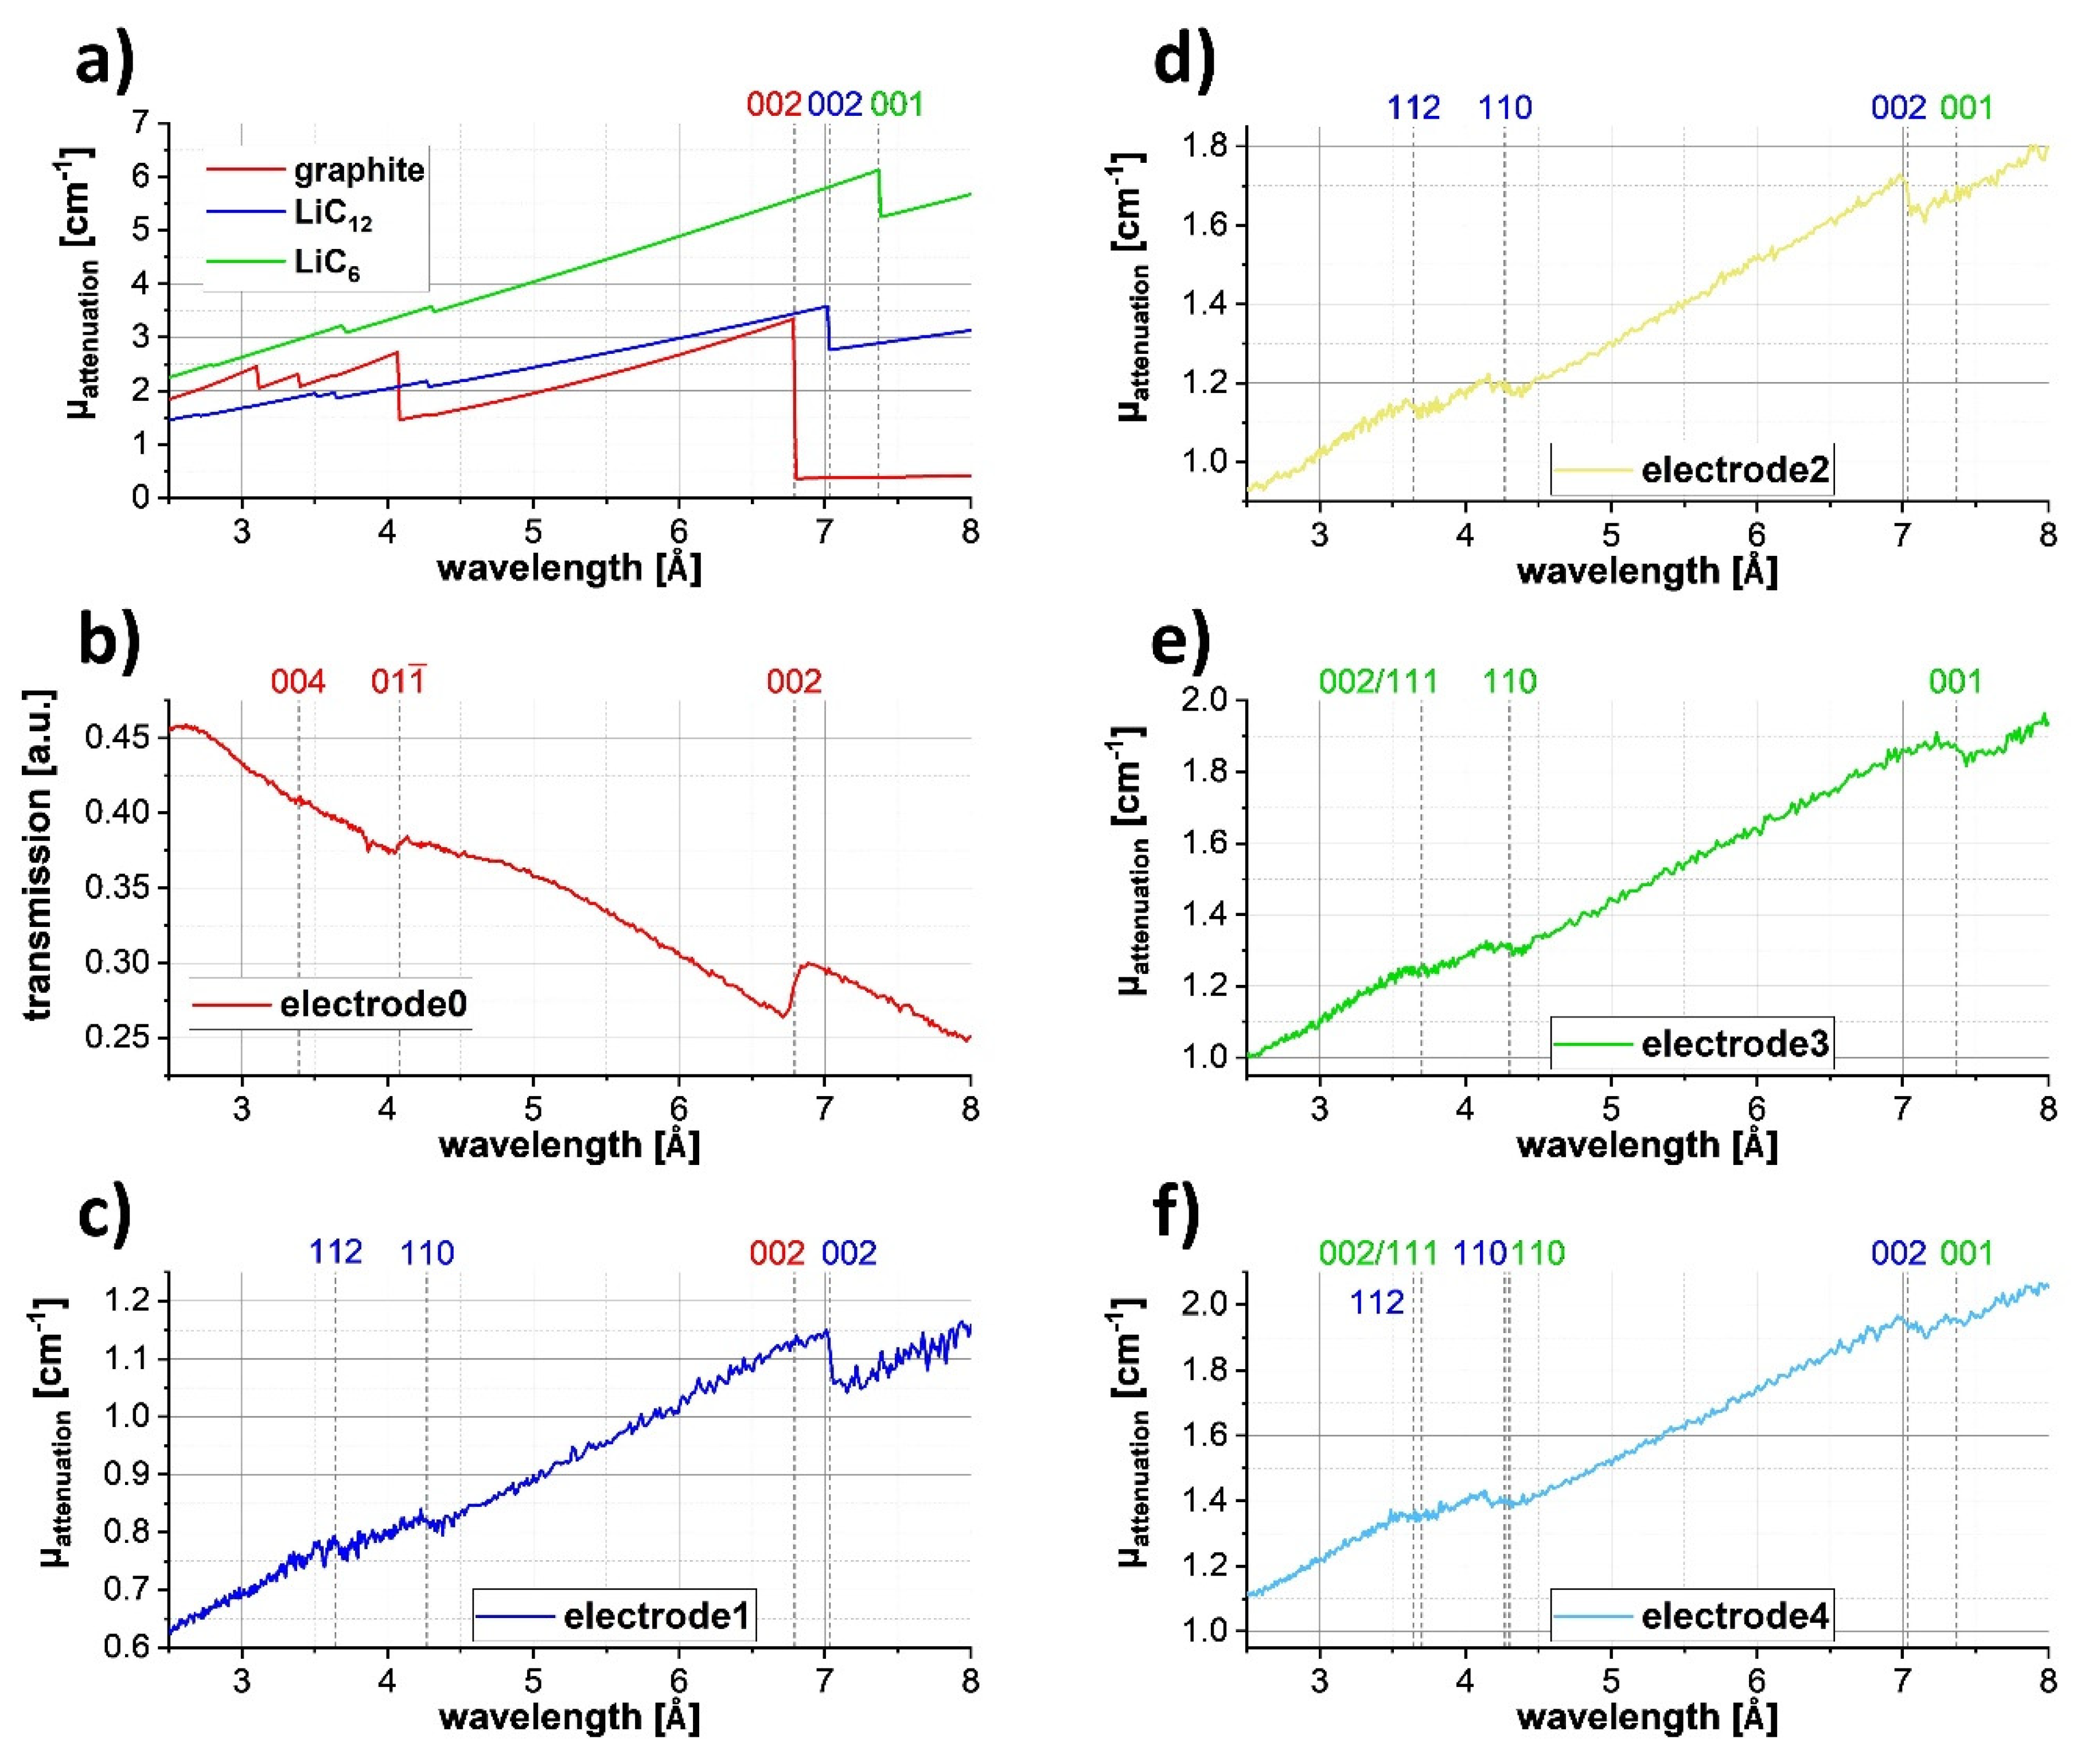
3.2. Bragg Edge Transmission Imaging
4. Conclusions
Author Contributions
Funding
Acknowledgments
Conflicts of Interest
References
- Kockelmann, W.; Frei, G.; Lehmann, E.; Vontobel, P.; Santisteban, J. Energy-selective neutron transmission imaging at a pulsed source. Nucl. Instrum. Methods Phys. Res. Sect. A Accel. Spectrom. Detect. Assoc. Equip. 2007, 578, 421–434. [Google Scholar] [CrossRef]
- Sato, H. Deriving Quantitative Crystallographic Information from the Wavelength-Resolved Neutron Transmission Analysis Performed in Imaging Mode. J. Imaging 2017, 4, 7. [Google Scholar] [CrossRef] [Green Version]
- Woracek, R.; Santisteban, J.; Fedrigo, A.; Strobl, M. Diffraction in neutron imaging—A review. Nucl. Instrum. Methods Phys. Res. Sect. A Accel. Spectrom. Detect. Assoc. Equip. 2018, 878, 141–158. [Google Scholar] [CrossRef]
- Kardjilov, N. Further Developments and Applications of Radiography and Tomography with Thermal and Cold Neutrons. Ph.D. Thesis, Technical University Munich, Munich, Germany, 2003. [Google Scholar]
- Kardjilov, N.; Baechler, S.; Bastürk, M.; Dierick, M.; Jolie, J.; Lehmann, E.; Materna, T.; Schillinger, B.; Vontobel, P. New features in cold neutron radiography and tomography Part II: Applied energy-selective neutron radiography and tomography. Nucl. Instrum. Methods Phys. Res. Sect. A Accel. Spectrom. Detect. Assoc. Equip. 2003, 501, 536–546. [Google Scholar] [CrossRef]
- Vogel, S. A Rietveld-Approach for the Analysis of Neutron Time-Of-Flight Transmission Data. Ph.D. Thesis, University of Kiel, Kiel, Germany, 2000. [Google Scholar]
- Santisteban, J.; Edwards, L.; Steuwer, A.; Withers, P.J. Time-of-flight neutron transmission diffraction. J. Appl. Crystallogr. 2001, 34, 289–297. [Google Scholar] [CrossRef]
- Steuwer, A.; Withers, P.; Santisteban, J.; Edwards, L.; Bruno, G.; Fitzpatrick, M.; Daymond, M.R.; Johnson, M.; Wang, D. Bragg Edge Determination for Accurate Lattice Parameter and Elastic Strain Measurement. Phys. Status Solidi 2001, 185, 221–230. [Google Scholar] [CrossRef]
- Tremsin, A.S.; Feller, W.B.; Downing, R.G. Efficiency optimization of microchannel plate (MCP) neutron imaging detectors. I. Square channels with 10B doping. Nucl. Instrum. Methods Phys. Res. Sect. A Accel. Spectrom. Detect. Assoc. Equip. 2005, 539, 278–311. [Google Scholar] [CrossRef] [Green Version]
- Kabra, S.; Kelleher, J.; Kockelmann, W.; Gutmann, M.; Tremsin, A. Energy-dispersive neutron imaging and diffraction of magnetically driven twins in a Ni2MnGa single crystal magnetic shape memory alloy. J. Physics Conf. Ser. 2016, 746, 012056. [Google Scholar] [CrossRef]
- Sato, H.; Shiota, Y.; Morooka, S.; Todaka, Y.; Adachi, N.; Sadamatsu, S.; Oikawa, K.; Harada, M.; Zhang, S.; Su, Y.; et al. Inverse pole figure mapping of bulk crystalline grains in a polycrystalline steel plate by pulsed neutron Bragg-dip transmission imaging. J. Appl. Crystallogr. 2017, 50, 1601–1610. [Google Scholar] [CrossRef] [Green Version]
- Makowska, M.; Strobl, M.; Lauridsen, E.; Kabra, S.; Kockelmann, W.; Tremsin, A.S.; Frandsen, H.L.; Kuhn, L.T. In situ time-of-flight neutron imaging of NiO–YSZ anode support reduction under influence of stress. J. Appl. Crystallogr. 2016, 49, 1674–1681. [Google Scholar] [CrossRef]
- Woracek, R.; Penumadu, D.; Kardjilov, N.; Hilger, A.; Boin, M.; Banhart, J.; Manke, I. 3D Mapping of Crystallographic Phase Distribution using Energy-Selective Neutron Tomography. Adv. Mater. 2014, 26, 4069–4073. [Google Scholar] [CrossRef] [PubMed]
- Watanabe, K.; Minniti, T.; Sato, H.; Tremsin, A.S.; Kockelmann, W.; Dalgliesh, R.; Kiyanagi, Y. Cross-sectional imaging of quenched region in a steel rod using energy-resolved neutron tomography. Nucl. Instrum. Methods Phys. Res. Sect. A Accel. Spectrom. Detect. Assoc. Equip. 2019, 944, 162532. [Google Scholar] [CrossRef]
- Carminati, M.C.; Strobl, M.; Minniti, T.; Boillat, P.; Hovind, J.; Morgano, M.; Rod, T.H.; Polatidis, E.; Valsecchi, J.; Mannes, D.; et al. Bragg-edge attenuation spectra at voxel level from 4D wavelength-resolved neutron tomography. J. Appl. Crystallogr. 2020, 53, 188–196. [Google Scholar] [CrossRef] [Green Version]
- Butler, L.G.; Schillinger, B.; Ham, K.; Dobbins, T.A.; Liu, P.; Vajo, J.J. Neutron imaging of a commercial Li-ion battery during discharge: Application of monochromatic imaging and polychromatic dynamic tomography. Nucl. Instrum. Methods Phys. Res. Sect. A Accel. Spectrom. Detect. Assoc. Equip. 2011, 651, 320–328. [Google Scholar] [CrossRef]
- Kino, K.; Yonemura, M.; Kiyanagi, Y.; Ishikawa, Y.; Parker, J.D.; Tanimori, T.; Kamiyama, T. First Imaging Experiment of a Lithium Ion Battery by a Pulsed Neutron Beam at J-PARC/MLF/BL09. Phys. Procedia 2015, 69, 612–618. [Google Scholar] [CrossRef] [Green Version]
- Kino, K.; Yonemura, M.; Ishikawa, Y.; Kamiyama, T. Two-dimensional imaging of charge/discharge by Bragg edge analysis of electrode materials for pulsed neutron-beam transmission spectra of a Li-ion battery. Solid State Ion. 2016, 288, 257–261. [Google Scholar] [CrossRef]
- Tremsin, A.S.; Vallerga, J.V.; McPhate, J.B.; Siegmund, O.H.; Raffanti, R. Raffanti, High resolution photon counting with MCP-timepix quad parallel readout operating at > 1 KHz frame rates. IEEE Trans. Nucl. Sci. 2012, 60, 578–585. [Google Scholar] [CrossRef]
- Halloran, J.W. MATERIALS SCIENCE: Making Better Ceramic Composites with Ice. Science 2006, 311, 479–480. [Google Scholar] [CrossRef]
- Behr, S.; Amin, R.; Chiang, Y.M.; Tomsia, A.P. Highly-structured, additive-free lithium-ion cathodes by freeze-casting technology. Process Eng. 2015, DKG 92, E39–E43. [Google Scholar]
- Huang, C.; Grant, P.S. Coral-like directional porosity lithium ion battery cathodes by ice templating. J. Mater. Chem. A 2018, 6, 14689–14699. [Google Scholar] [CrossRef]
- Tan, C.; Daemi, S.R.; Taiwo, O.O.; Shearing, P.R.; Brett, D.J.L.; Shearing, P.R. Evolution of Electrochemical Cell Designs for In-Situ and Operando 3D Characterization. Mater. 2018, 11, 2157. [Google Scholar] [CrossRef] [Green Version]
- Kaskhedikar, N.A.; Maier, J. Lithium Storage in Carbon Nanostructures. Adv. Mater. 2009, 21, 2664–2680. [Google Scholar] [CrossRef]
- Harris, S.J.; Timmons, A.; Baker, D.R.; Monroe, C. Direct in situ measurements of Li transport in Li-ion battery negative electrodes. Chem. Phys. Lett. 2010, 485, 265–274. [Google Scholar] [CrossRef]
- Kockelmann, W.; Minniti, T.; Pooley, D.E.; Burca, G.; Ramadhan, R.; Akeroyd, F.A.; Howells, G.D.; Moreton-Smith, C.; Keymer, D.P.; Kelleher, J.; et al. Time-of-Flight Neutron Imaging on IMAT@ISIS: A New User Facility for Materials Science. J. Imaging 2018, 4, 47. [Google Scholar] [CrossRef] [Green Version]
- Minniti, T.; Kockelmann, W.; Burca, G.; Kelleher, J.; Kabra, S.; Zhang, S.; Pooley, D.; Schooneveld, E.; Mutamba, Q.; Sykora, J.; et al. Materials analysis opportunities on the new neutron imaging facility IMAT@ISIS. J. Instrum. 2016, 11, C03014. [Google Scholar] [CrossRef]
- Minniti, T.; Watanabe, K.; Burca, G.; Pooley, D.E.; Kockelmann, W. Characterization of the new neutron imaging and materials science facility IMAT. Nucl. Instrum. Methods Phys. Res. Sect. A Accel. Spectrom. Detect. Assoc. Equip. 2018, 888, 184–195. [Google Scholar] [CrossRef]
- Tremsin, A.; Vallerga, J.; McPhate, J.; Siegmund, O. Optimization of high count rate event counting detector with Microchannel Plates and quad Timepix readout. Nucl. Instrum. Methods Phys. Res. Sect. A Accel. Spectrom. Detect. Assoc. Equip. 2015, 787, 20–25. [Google Scholar] [CrossRef] [Green Version]
- Kockelmann, W.; Minniti, T.; Ramadhan, R.; Ziesche, R.; Pooley, D.E.; Capelli, S.C.; Glaser, D.; Tremsin, A.S. Wavelength—Resolved neutron imaging on IMAT. Mater. Res. Proc. 2020, 15, 29–345. [Google Scholar]
- Tremsin, A.S.; Vallerga, J.V.; McPhate, J.B.; Siegmund, O.H.W. Optimization of Timepix count rate capabilities for the applications with a periodic input signal. J. Instrum. 2014, 9, C05026. [Google Scholar] [CrossRef]
- Kohler, T. A projection access scheme for iterative reconstruction based on the golden section. Proceedings of IEEE Symposium Conference Record Nuclear Science 2004, Florence, Italy, 16–22 October 2004; pp. 3961–3965. [Google Scholar] [CrossRef]
- Münch, B.; Kaestner, A.; Trtik, P.; Butler, L. Spatiotemporal computed tomography of dynamic processes. Opt. Eng. 2011, 50, 123201. [Google Scholar] [CrossRef]
- Ziesche, R.F.; Robinson, J.B.; Kok, M.D.R.; Markötter, H.; Kockelmann, W.; Kardjilov, N.; Manke, I.; Brett, D.; Shearing, P.R. Editors’ Choice—4D Neutron and X-ray Tomography Studies of High Energy Density Primary Batteries: Part I. Dynamic Studies of LiSOCl2 during Discharge. J. Electrochem. Soc. 2020, 167, 130545. [Google Scholar] [CrossRef]
- Ramadhan, R.; Kockelmann, W.; Minniti, T.; Chen, B.; Parfitt, D.; Fitzpatrick, M.; Tremsin, A.S. Characterization and application of Bragg-edge transmission imaging for strain measurement and crystallographic analysis on the IMAT beamline. J. Appl. Crystallogr. 2019, 52, 351–368. [Google Scholar] [CrossRef] [Green Version]
- Van Aarle, W.; Palenstijn, W.J.; Cant, J.; Janssens, E.; Bleichrodt, F.; Dabravolski, A.; De Beenhouwer, J.; Batenburg, K.J.; Sijbers, J. Fast and flexible X-ray tomography using the ASTRA toolbox. Opt. Express 2016, 24, 25129–25147. [Google Scholar] [CrossRef] [PubMed]
- Van Aarle, W.; Palenstijn, W.J.; De Beenhouwer, J.; Altantzis, T.; Bals, S.; Batenburg, K.J.; Sijbers, J. The ASTRA Toolbox: A platform for advanced algorithm development in electron tomography. Ultramicroscopy 2015, 157, 35–47. [Google Scholar] [CrossRef] [PubMed] [Green Version]
- Rau, C.; Storm, M.; Marathe, S.; Bodey, A.J.; Zdora, M.-C.; Cipiccia, S.; Batey, D.; Shi, X.; Schroeder, S.M.; Das, G.; et al. Fast Multi-scale imaging using the Beamline I13L at the Diamond Light Source. In Proceedings of the Developments in X-ray Tomography XII, San Diego, CA, USA, 11–15 August 2019; Volume 11113. [Google Scholar] [CrossRef] [Green Version]
- Pelt, D.M.; Gürsoy, D.; Palenstijn, W.J.; Sijbers, J.; De Carlo, F.; Batenburg, K.J. Integration of TomoPy and the ASTRA toolbox for advanced processing and reconstruction of tomographic synchrotron data. J. Synchrotron Radiat. 2016, 23, 842–849. [Google Scholar] [CrossRef]
- Boin, M. nxs: A program library for neutron cross section calculations. J. Appl. Crystallogr. 2012, 45, 603–607. [Google Scholar] [CrossRef]
- Trucano, P.; Chen, R. Structure of graphite by neutron diffraction. Nat. Cell Biol. 1975, 258, 136–137. [Google Scholar] [CrossRef]
- Vadlamani, B.; An, K.; Jagannathan, M.; Chandran, K.S.R. An In-Situ Electrochemical Cell for Neutron Diffraction Studies of Phase Transitions in Small Volume Electrodes of Li-Ion Batteries. J. Electrochem. Soc. 2014, 161, A1731–A1741. [Google Scholar] [CrossRef]
- Didier, C.; Pang, W.K.; Guo, Z.; Schmid, S.; Peterson, V.K. Phase Evolution and Intermittent Disorder in Electrochemically Lithiated Graphite Determined Using in Operando Neutron Diffraction. Chem. Mater. 2020, 32, 2518–2531. [Google Scholar] [CrossRef]
- Tremsin, A.S.; Yau, T.Y.; Kockelmann, W. Non-destructive Examination of Loads in Regular and Self-locking Spiralock® Threads through Energy-resolved Neutron Imaging. Strain 2016, 52, 548–558. [Google Scholar] [CrossRef]
- Tremsin, A.S.; Vallerga, J. Unique capabilities and applications of Microchannel Plate (MCP) detectors with Medipix/Timepix readout. Radiat. Meas. 2020, 130, 106228. [Google Scholar] [CrossRef]
- Andersen, K.H.; Argyriou, D.; Jackson, A.; Houston, J.; Henry, P.; Deen, P.; Toft-Petersen, R.; Beran, P.; Strobl, M.; Arnold, T.; et al. The instrument suite of the European Spallation Source. Nucl. Instrum. Methods Phys. Res. Sect. A Accel. Spectrom. Detect. Assoc. Equip. 2020, 957, 163402. [Google Scholar] [CrossRef]
- Finegan, D.P.; Vamvakeros, A.; Cao, L.; Tan, C.; Heenan, T.M.M.; Daemi, S.R.; Jacques, S.D.M.; Beale, A.M.; Di Michiel, M.; Smith, K.; et al. Spatially Resolving Lithiation in Silicon–Graphite Composite Electrodes via in Situ High-Energy X-ray Diffraction Computed Tomography. Nano Lett. 2019, 19, 3811–3820. [Google Scholar] [CrossRef] [PubMed]
- Finegan, D.P.; Quinn, A.; Wragg, D.S.; Colclasure, A.M.; Lu, X.; Tan, C.; Heenan, T.M.M.; Jervis, R.; Brett, D.J.L.; Das, S.; et al. Spatial dynamics of lithiation and lithium plating during high-rate operation of graphite electrodes. Energy Environ. Sci. 2020, 13, 2570–2584. [Google Scholar] [CrossRef]
- Li, T.; Yuan, X.-Z.; Zhang, L.; Song, D.; Shi, K.; Bock, C. Degradation Mechanisms and Mitigation Strategies of Nickel-Rich NMC-Based Lithium-Ion Batteries. Electrochem. Energy Rev. 2020, 3, 43–80. [Google Scholar] [CrossRef] [Green Version]


| Electrode N | Thickness (mm) | Diameter (mm) | Mass (mg) | Theoretical Capacity (mAh) | Discharge Capacity (mAh) | Lithiation State *) | Dominant Phase |
|---|---|---|---|---|---|---|---|
| Electrode-0 | 2.57 | ca. 12 | 159.8 | 59.13 | 0.00 | 0% | Graphite |
| Electrode-1 | 0.81 | 6.1 | 12.33 | 4.56 | 1.52 | 33% | LiC12 |
| Electrode-2 | 0.48 | 6.0 | 8.61 | 3.19 | 1.90 | 66% | LiC12 |
| Electrode-3 | 0.53 | 6.1 | 8.36 | 3.09 | 2.81 | 100% | LiC6 |
| Electrode-4 | 0.49 | 5.9 | 8.20 | 3.03 | 2.136 | 70% | LiC12, LiC6 |
Publisher’s Note: MDPI stays neutral with regard to jurisdictional claims in published maps and institutional affiliations. |
© 2020 by the authors. Licensee MDPI, Basel, Switzerland. This article is an open access article distributed under the terms and conditions of the Creative Commons Attribution (CC BY) license (http://creativecommons.org/licenses/by/4.0/).
Share and Cite
Ziesche, R.F.; Tremsin, A.S.; Huang, C.; Tan, C.; Grant, P.S.; Storm, M.; Brett, D.J.L.; Shearing, P.R.; Kockelmann, W. 4D Bragg Edge Tomography of Directional Ice Templated Graphite Electrodes. J. Imaging 2020, 6, 136. https://0-doi-org.brum.beds.ac.uk/10.3390/jimaging6120136
Ziesche RF, Tremsin AS, Huang C, Tan C, Grant PS, Storm M, Brett DJL, Shearing PR, Kockelmann W. 4D Bragg Edge Tomography of Directional Ice Templated Graphite Electrodes. Journal of Imaging. 2020; 6(12):136. https://0-doi-org.brum.beds.ac.uk/10.3390/jimaging6120136
Chicago/Turabian StyleZiesche, Ralf F., Anton S. Tremsin, Chun Huang, Chun Tan, Patrick S. Grant, Malte Storm, Dan J. L. Brett, Paul R. Shearing, and Winfried Kockelmann. 2020. "4D Bragg Edge Tomography of Directional Ice Templated Graphite Electrodes" Journal of Imaging 6, no. 12: 136. https://0-doi-org.brum.beds.ac.uk/10.3390/jimaging6120136