1. Introduction
An aging society and a growing share of sedentary work have led to a rapid rise in the prevalence of degenerative spinal disorders. Exemplary indications causing spine instability, which, in turn, can lead to bone deformation or nerve damage are disc degeneration, spondylolisthesis or scoliosis [
1]. Among different surgical approaches, spinal fusion is identified as a cost-effective and good-quality treatment strategy for spine degenerative diseases and is also being used for a wider range of indications [
2], making it one of the most frequently performed procedures worldwide [
3].
In this type of surgery, an artificial reconstruction of the spine’s stability is performed by introducing a transpedicular screw–rod system into the spine [
4]. The precise placement of the pedicle screws is one of the most intricate tasks because deviations from the targeted trajectory can result in injuries of the spinal cord, nerve roots or blood vessels [
5].
So-called navigation systems are used for enhanced localization and precise placement of surgical instruments to maximize the precision of pedicle screw insertion [
6]. An improved outcome and reduced radiation exposure are prevailing reasons to use these systems [
7]. In recent years, robotic systems for spine surgery, such as ExcelsiusGPS [
8] and Mazor X [
9], have become commercially available. These solutions are likely to improve the precision and predictability of patient treatment even more.
However, the complexity of use and the disruption of the surgical workflow are predominant factors for the conservative percentage of navigated spine surgeries [
10]. According to Härtl et al., only 11 percent of spine surgeons use navigation systems on a regular basis [
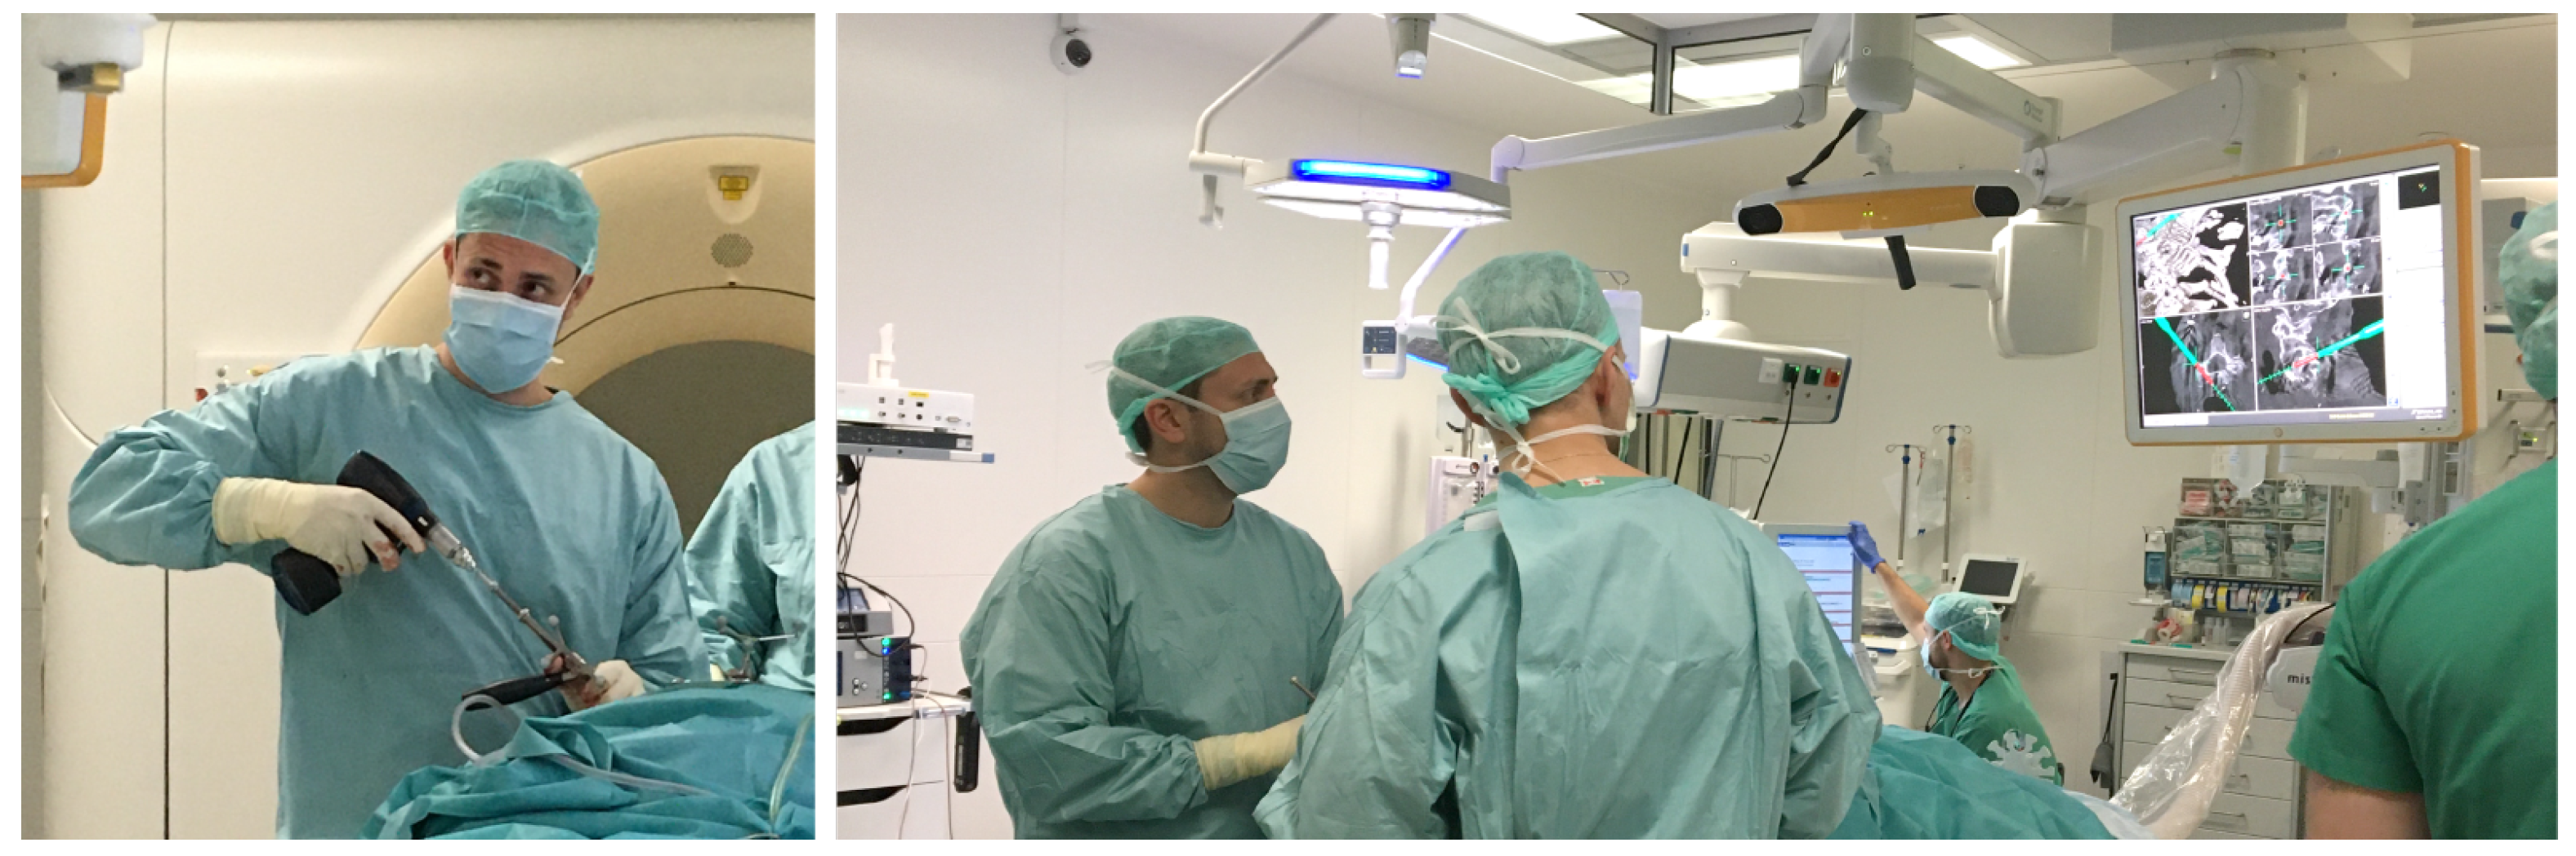
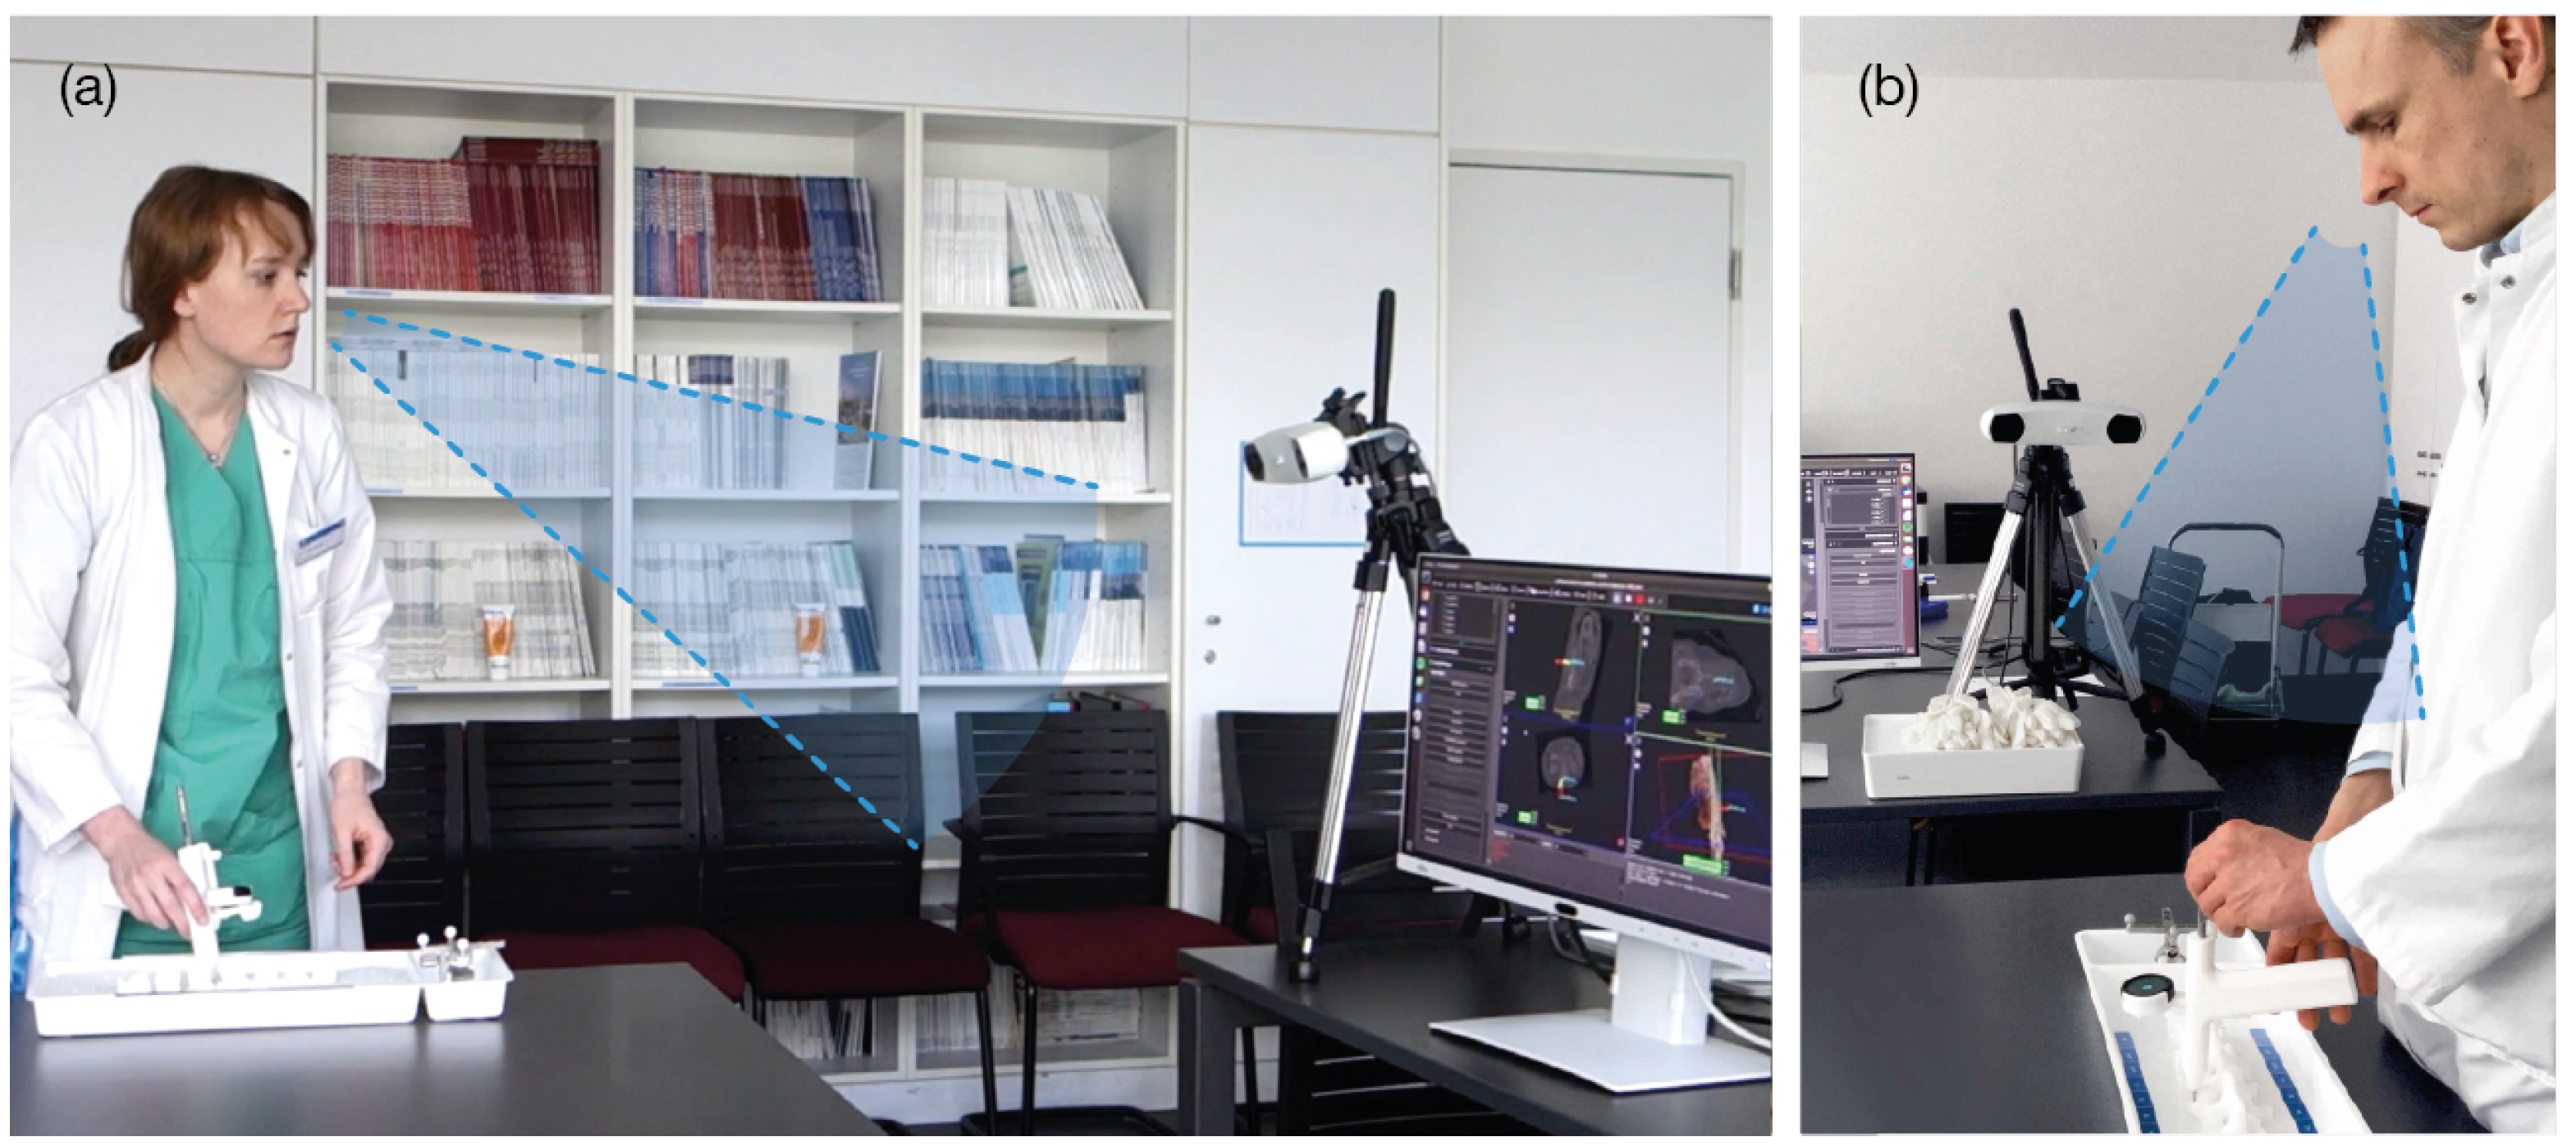
10]. When using navigation, the operators must split their attention between the navigation information, displayed on an external screen, and the surgical site (situs) [
11], adding to the complexity of use (
Figure 1).
Shifting the surgeons’ attention from an external screen back to the patient is a widely-researched topic in the scientific community. The application of augmented (AR) and mixed reality (MR) in the medical context aroused interest several decades ago [
12].
Half-mirror displays and projectors have been used to superimpose pre-operative images onto the patient for anatomic navigation.
Navab et al. developed a surgical AR technology enabling video-augmented X-ray images by extending a mobile C-arm with a video camera called CAMC [
13]. In their work, as in our study, instrument axis alignment was evaluated. However, AR images are displayed using a mirror attached to the C-arm and no external navigation is used, while we propose localization of the visualization unit on the surgical instrument. Habert et al. [
14] provided a new variation of the original CAMC, using an attached RGBD camera to the X-ray detector. These concepts were later used by Philips Medical to offer an advanced visualization solution for spine surgery [
15]. Similar to the CAMC solutions, the Philips system provides monitor-based visualization, requiring the surgeon to move their attention from the surgical scene onto the external monitor.
Other works that have focused on approaches using projectors are from Gavaghan et al. [
16,
17], who presented a portable projection system for the projection of navigational information onto the patient’s skin. This system assists in targeting incision points for percutaneous needle placement and also displays navigation guidance onto anatomical structures, such as the surface of a liver phantom.
Besides half-mirrors and projectors, technological advancements have enabled optical see-through head-mounted displays (OST-HMD); several surgical navigation systems with head-mounted tracking and displays have been proposed [
18,
19,
20].
Liebmann et al. evaluate the precision of a novel navigation method that is characterized by the additional in-situ visualization. The focus of this work is the investigation of the accuracy of a lumbar pedicle screw insertion combined with the visualization information provided by the Microsoft HoloLens in contrast to state-of-the-art navigation systems [
21]. The study examined 3D augmented views using a Microsoft HoloLense, whereas we propose visualizations on a 2D display.
As an alternative to the work mentioned above, some developments focus on fixing displays or mobile devices onto the surgical instrument itself.
The potential of adding a smartphone as a man–machine interaction device is shown by Gael et al. [
22]. Several combinations of displays and anatomical information are explored in different experiments of needle placement. Benefits, such as local exploration around the current tool position or an easier and safer access to the target, are reported.
The efficacy of a novel navigation system with an iPod-display for total knee arthroplasty (TKA) is presented and discussed by Mullaji et al. [
23]. Additional anatomical information, such as the resection level or slope, is presented on the iPod screen that is held by hand. Despite a negligible expenditure of time, compared to conventional TKA, the precision of this navigation solution is reported to be comparable to conventional navigation systems. In contrast to both studies, our work presents visually reduced information independent of an external monitor as also explored by the following works.
Kassil et al. investigated an approach of a tool-mounted guidance display. The performed study proves that the tool-mounted guidance display yields more accurate tool placement than the conventional interface on an external monitor [
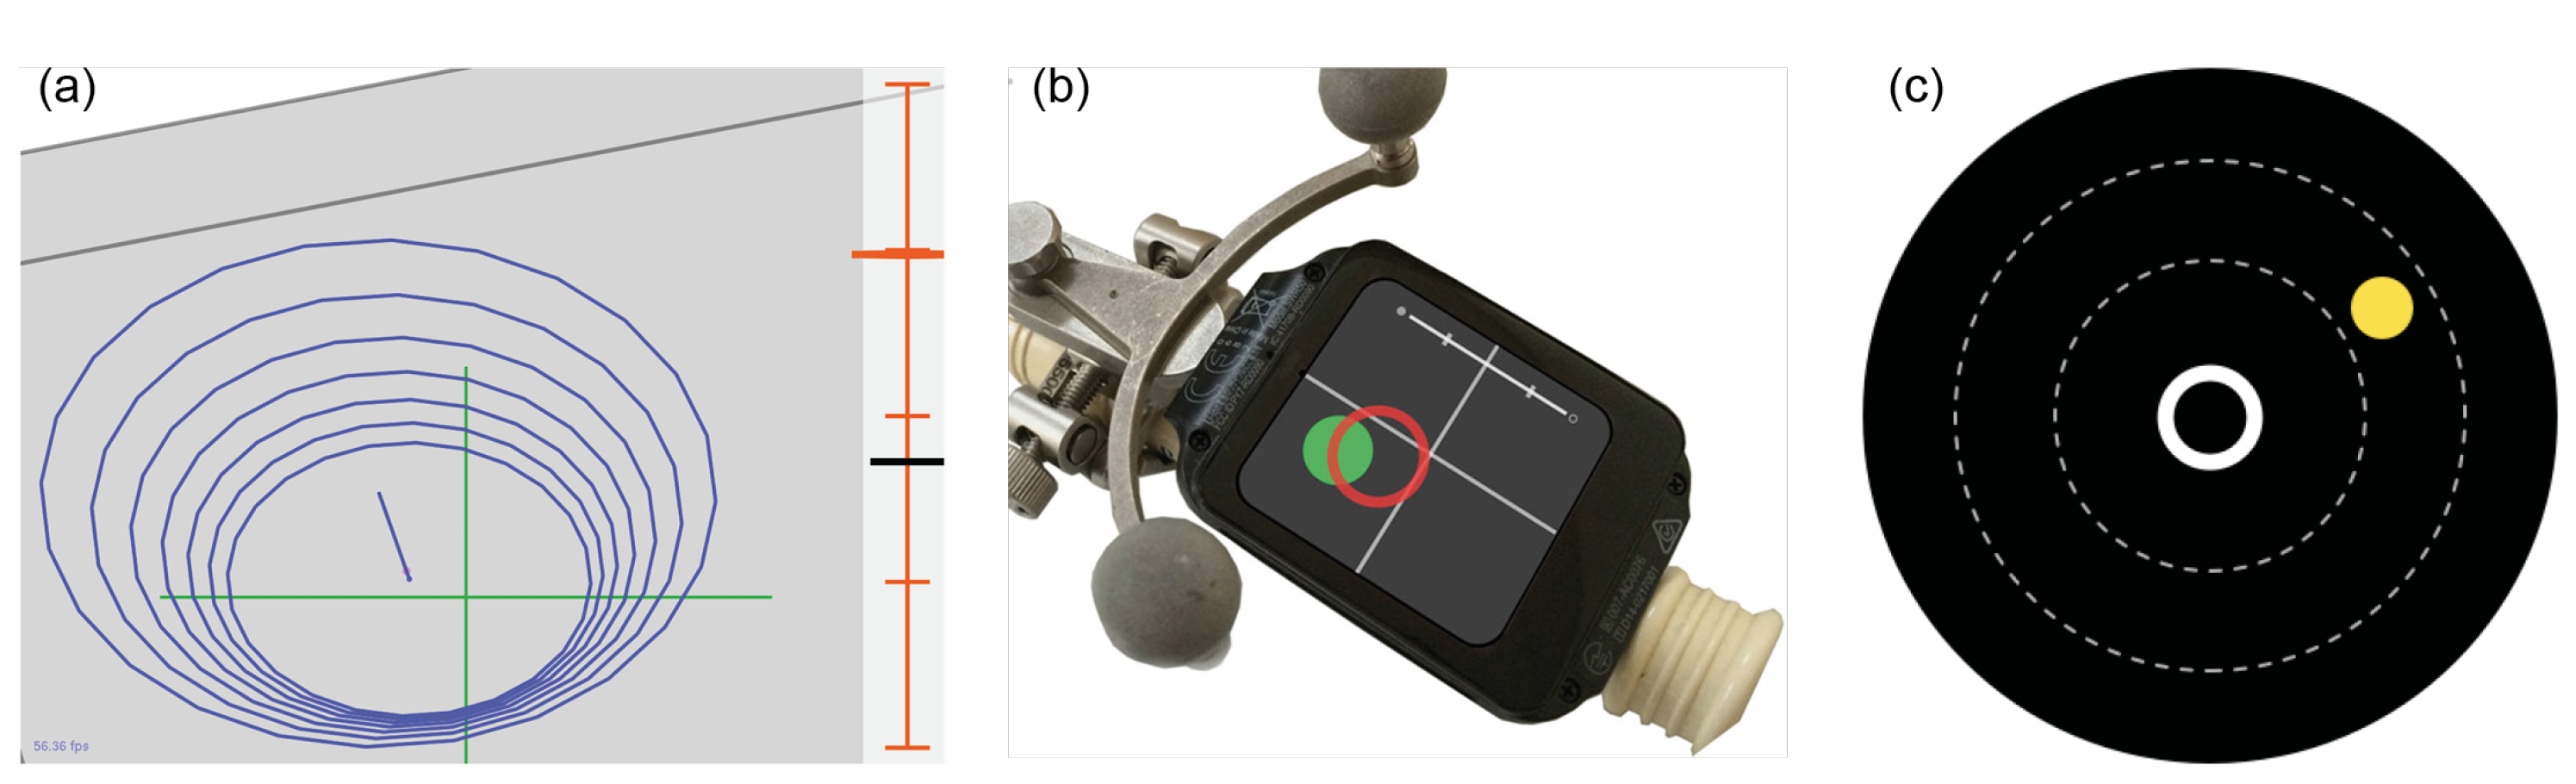
24]. They compared two tool-mounted interfaces: one uses a graphical navigation interface with a target line and concentric rings, and the other, in addition to the graphical elements, augments the image of a camera installed on the tool as a background. (
Figure 2) Their results showed that the camera view had no significant improvement for the application. Our approach builds on this work, as we also use graphical interfaces for orthopedic tool alignment. However, we present a visualization where the target point is always fixed in the center of the screen, and no target line nor depth scale is shown. Our work is an attempt to reduce the complexity of navigational interfaces even further. We hope to show that such improvements allow the surgeon to better focus on the execution of the guided action and, therefore, increase their accuracy, while improving the usability.
Additional work that introduced an approach for measuring cognitive load, user preference, and general usability is presented by Herrlich et al. [
11]. A navigation approach for needle placement that mounts a smartwatch display directly onto the instrument is presented. During an empirical study with non-clinical experts, the benefits of the system in terms of reduced cognitive load and improved general usability while achieving the same performance as the external monitor were reported. They proposed a 2D guidance that maps the shaft and the tip of the needle onto two colored circles on the smartwatch display. Other than this work, our interface only contains one moving object: the tool’s position in respect to the centered target trajectory.
Unlike Kassil et al. and Herrlich et al., we conducted an extensive user study with medical experts from the field to evaluate both performance, as targeted by Kassil et al., and usability, as focused by Herrlich et al. To the best of our knowledge, the performance, cognitive load and usability have not been evaluated for a graphically-reduced tool-mounted interface for the task of drill-guide alignment with surgeons.
Against this background, the main objective of this work is to present a navigation approach comprising intra-operative digitization and intuitive graphical guidance for a computer-assisted screw placement procedure. Maximizing the amount of navigated spinal procedures, thus minimizing complication rates for patients, presents prevailing factors for the clinical motivation of this work.
In this paper, we propose a user-centered navigation interface for spinal surgery. The approach consists of a tool-mounted interface (TMI), attached to a shaft for surgical tool guidance. This way, the TMI enables the display of navigation information in the surgeon’s field of view.
A proof-of-concept study to show the usability advances of this user-centered navigation system is the primary focus. The concept of the TMI could be comprehensively evaluated by two experiments for the task of angle alignment. Two different visualizations for angle orientation of the surgical tool were tested with 18 physicians against the visualizations used in the clinical routine. In contrast to the early findings published by Brendle et al. [
25], the usability advances of the proposed concept are evaluated in depth and discussed in detail. In addition, an updated angle visualization and a preliminary usability study for a proposed depth control visualization during drilling holes into vertebrae were added to this article.
2. Materials and Methods
To prevent the physical separation of navigation information and the surgical site, we propose the use of a tool-mounted interface (TMI). The concept of the TMI is an outcome of user-centered design [
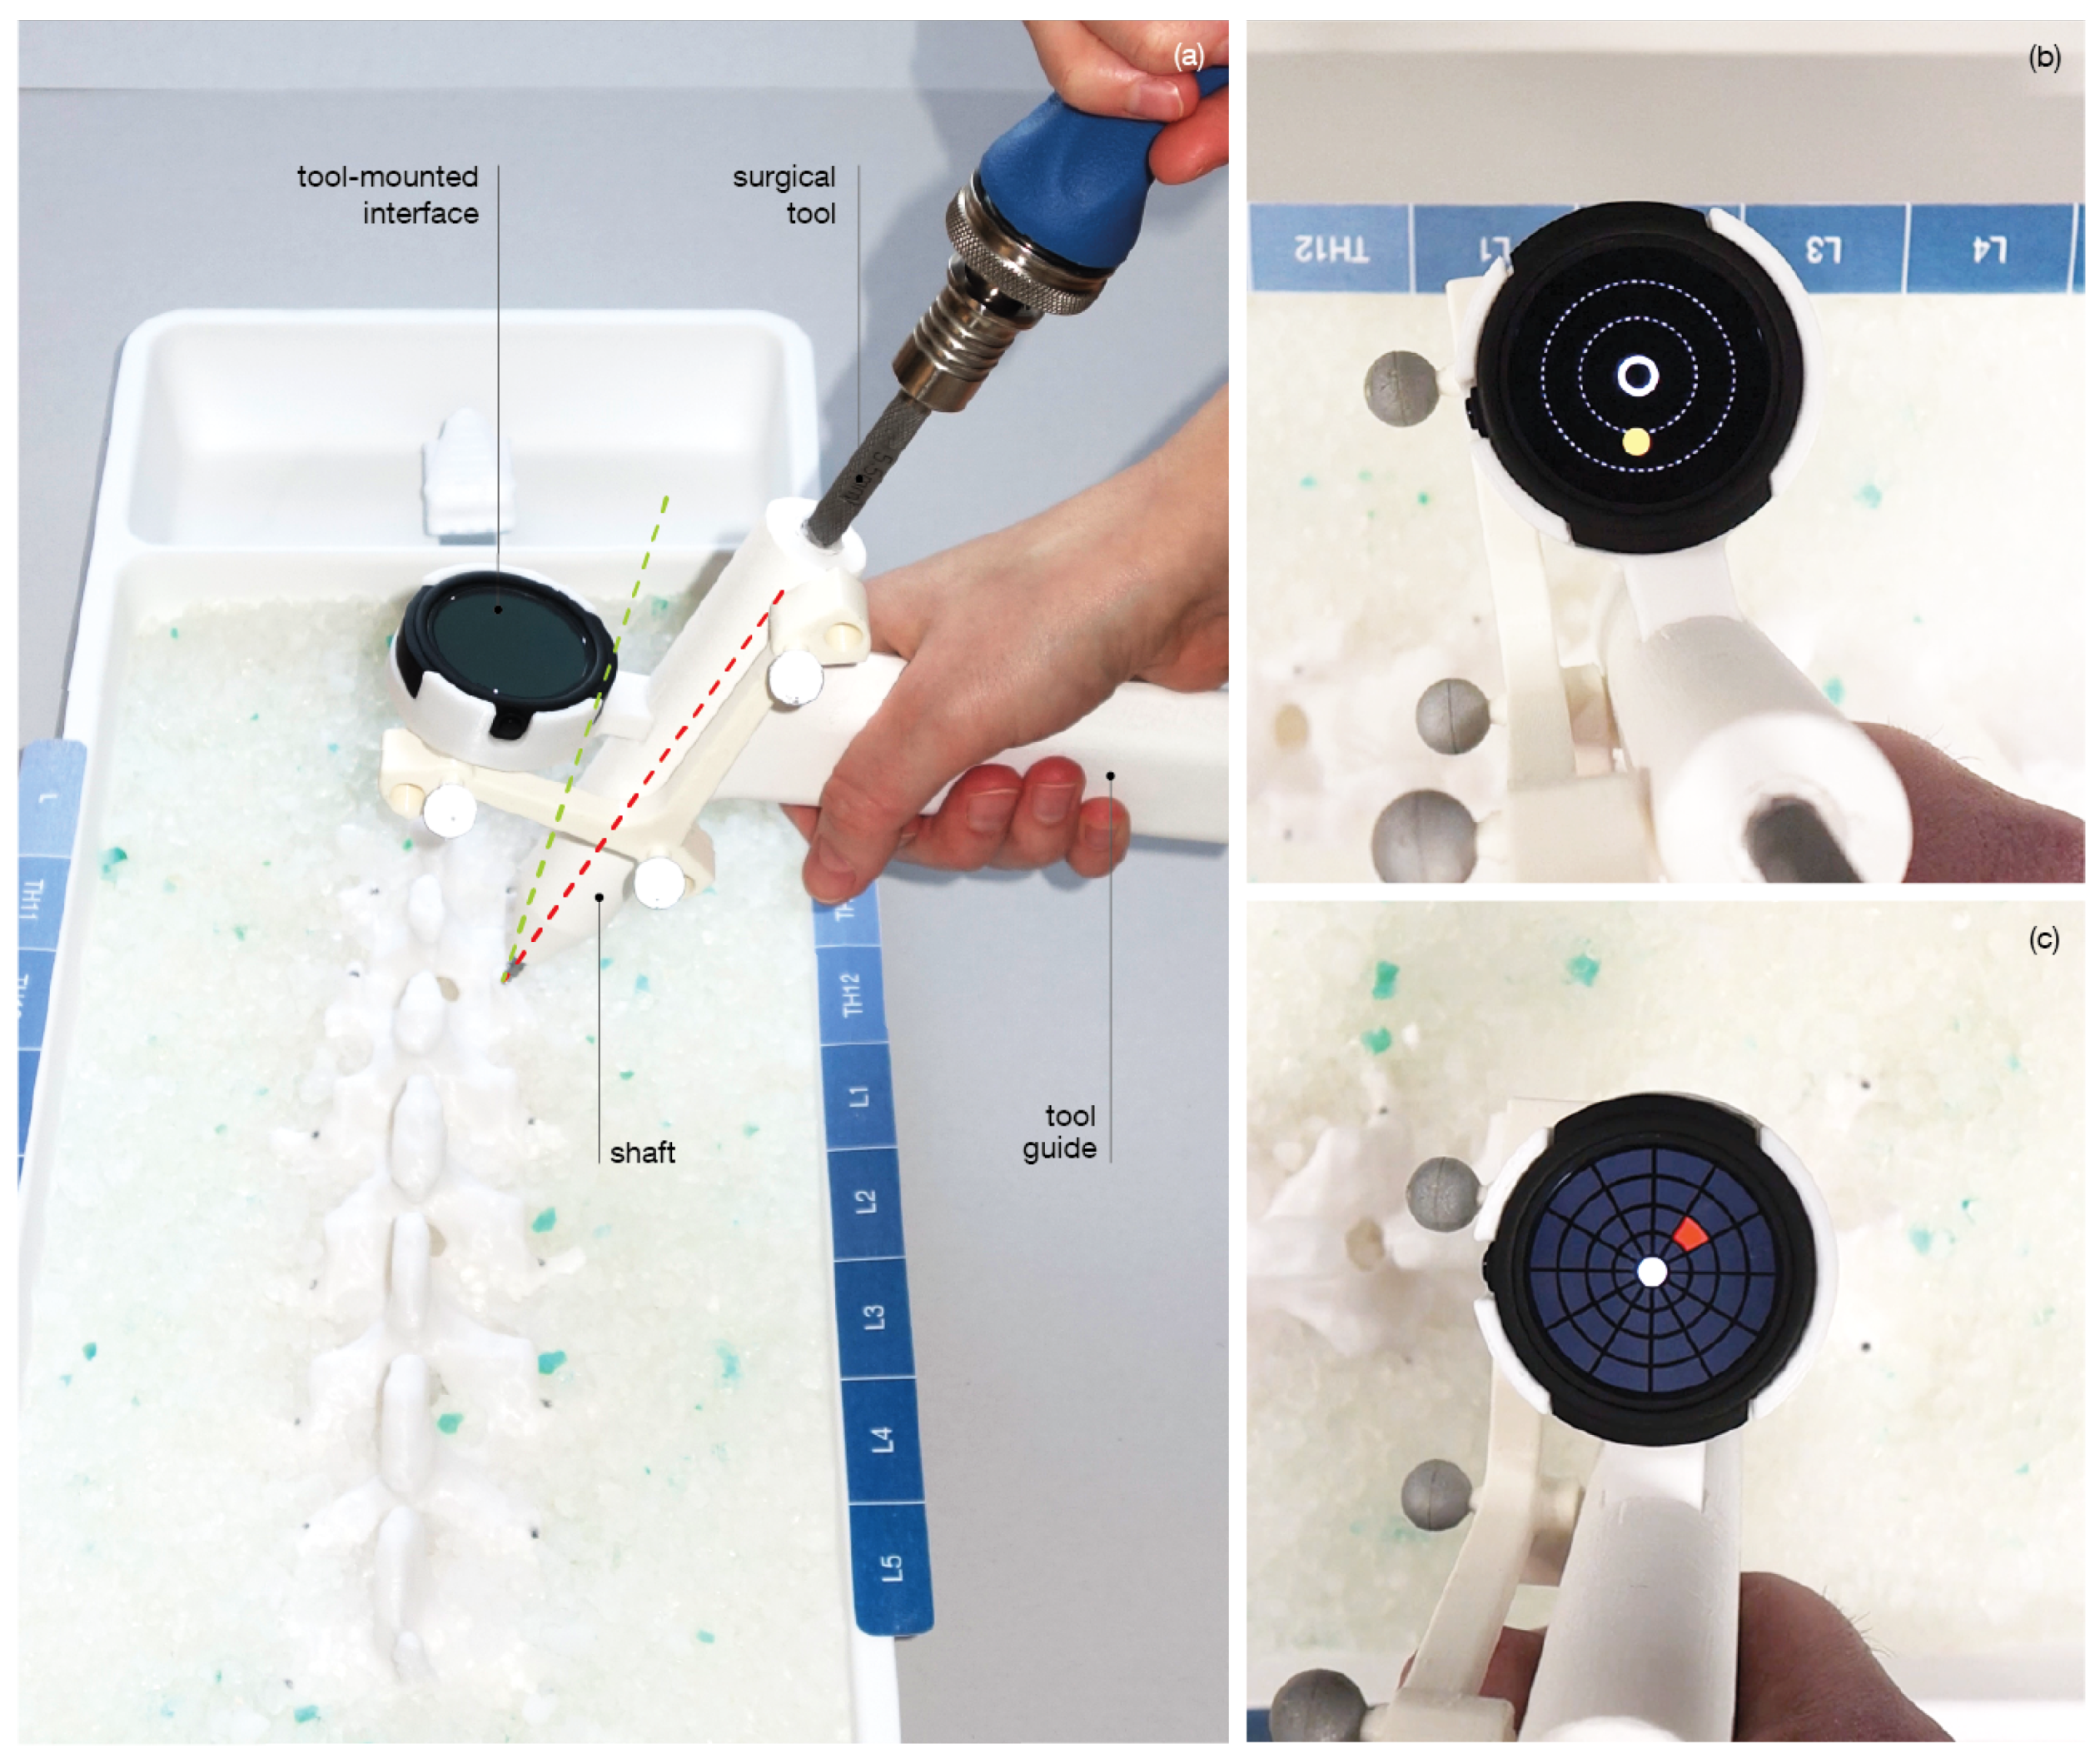
26]. The navigation concept comprises a handle, a shaft for tool guidance, a tracking array and a mount for the visualization unit (
Figure 3). The custom-made handler is designed to be used in combination with a surgical instrument, allowing a visualization unit, such as the TMI to be mounted on it. This idea introduces a shift in perspective that is distinct from the solutions used in the routine clinical practice. This approach keeps the user’s attention on the surgical site rather than directing it away from the patient to an external monitor. At the same time, it does not force the user to wear a head-mounted display and, therefore, is easily integrated into the surgical environment and workflow.
2.1. Hardware and Software Setup
The system is made up of a workstation, a Polaris Vicra (NDI, Ontario, Canada), the TMI and a Ticwatch E (Mobvoi, Beijing, China). The Ticwatch is clipped to the visualization unit mount to display the instrument-integrated visualizations. A Polaris Vicra infrared tracking system tracks the arrays affixed to both the phantom and the instrument. The calibration between the marker and the tool is known by construction and is verified using a pivot calibration. The software utilizes a client-server architecture running between the Ticwatch E and the workstation. The server is executed as a plugin on the ImFusion Suite (ImFusion GmbH, Munich, Germany (
https://www.imfusion.de)), which processes the tracking data and transmits them to the Ticwatch to generate the visualization. The frame rate is 50 Hz on the workstation and 40 Hz on the Ticwatch visualizations.
With the intention of enhancing the usability of spinal navigation user interfaces (UI), a reduction in cognitive load is targeted. To be compliant with this requirement, a graphically reduced approach to interface design is chosen. In contrast to traditional navigation UI, a view at the situs and the visualization unit is provided. This view favors the employment of a subjective perspective and not an objective view of the instrument trajectory in relation to the patient anatomy on an external screen (as is used in traditional navigation). Providing a subjective view of the instrument position in relation to the ideal trajectory on an integrated display is pursued by the TMI.
The visualization under evaluation is designed for the task of instrument angle alignment. This sub-task of the pedicle screw placement procedure is chosen, as it defines the angle at which the hole is drilled into the vertebra and directly influences the accuracy of the pedicle screw position. During angle alignment, the instrument tip is already positioned on the bony anatomy of the vertebra. Thus, the instrument’s movement is limited to rotations within three dimensions inside the space of a hemisphere. A top view of the hemisphere allows for an overview of the trajectory, without losing sense of the current localization. Thus, this perspective was chosen and abstracted from 3D to 2D during the UI design. Since a top view of a hemisphere is a circle, the display shape was chosen accordingly to match the UI.
The proposed visualization strategy aims at reducing the complexity of the navigation information during pedicle screw placement for the operating surgeon. Two visually reduced interfaces displaying abstract 2D guidance were designed (
Figure 4). The two visualizations Circle Display and Grid Display essentially map the real-time 3D Cartesian orientation of the TMI to a polar coordinate system centered at the pre-planned insertion trajectory. In such a manner, the relative angular distance between the planned and the actual trajectory is intuitively displayed on the tool-mounted 2D screen.
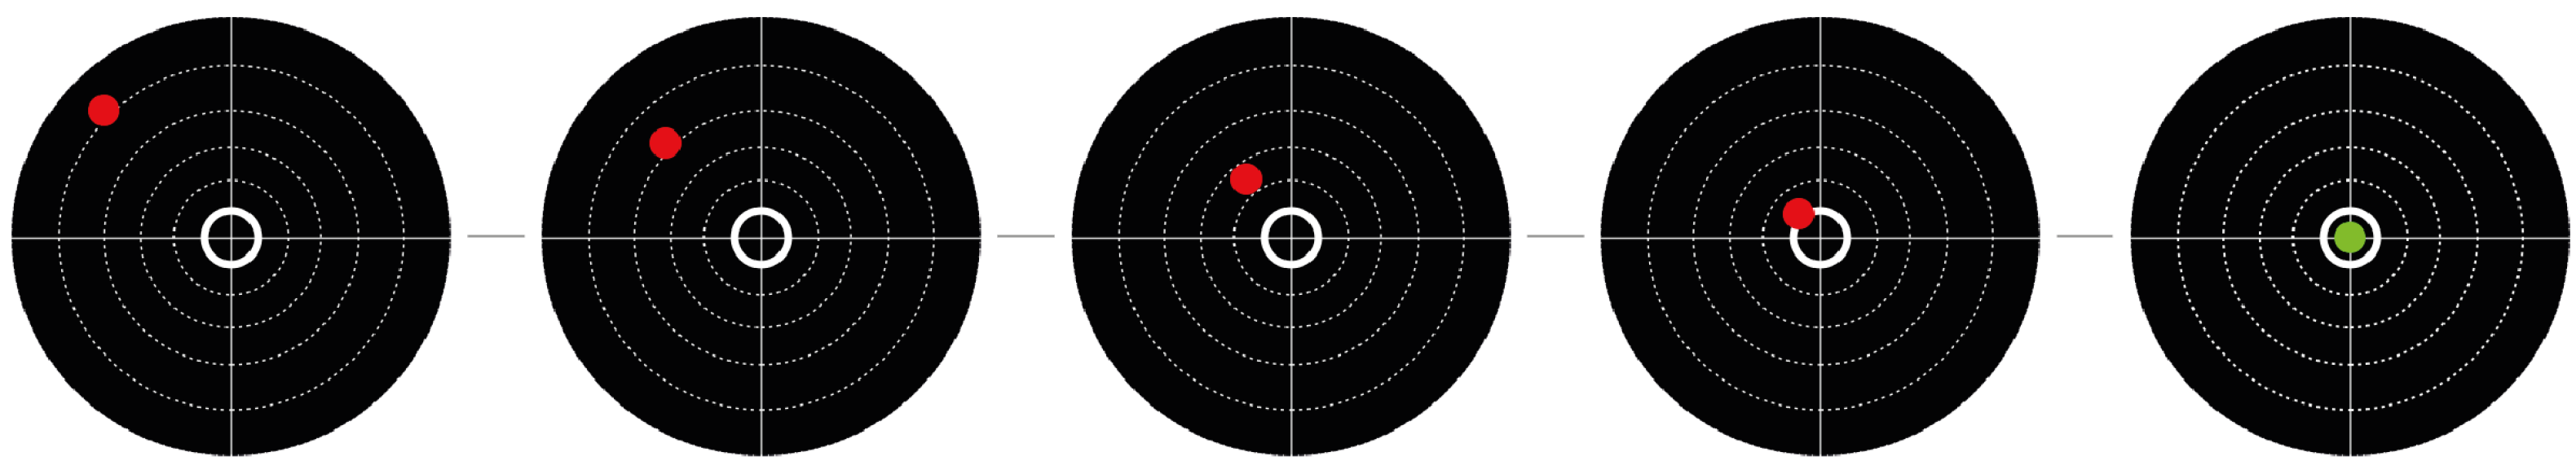
Circle Display The Circle Display UI comprises a circle element that dynamically moves across the underlying background in accordance with the live pose of the TMI, which is computed as outlined in the preceding section. By orienting the TMI such that the circle-shaped element enters the center ring of the UI, the user attains the desired trajectory. The correct positioning is indicated to the user by providing complementary visual feedback: the circular element changes from a yellow to a blue color, and an additional highlighting element is superimposed around the central ring.
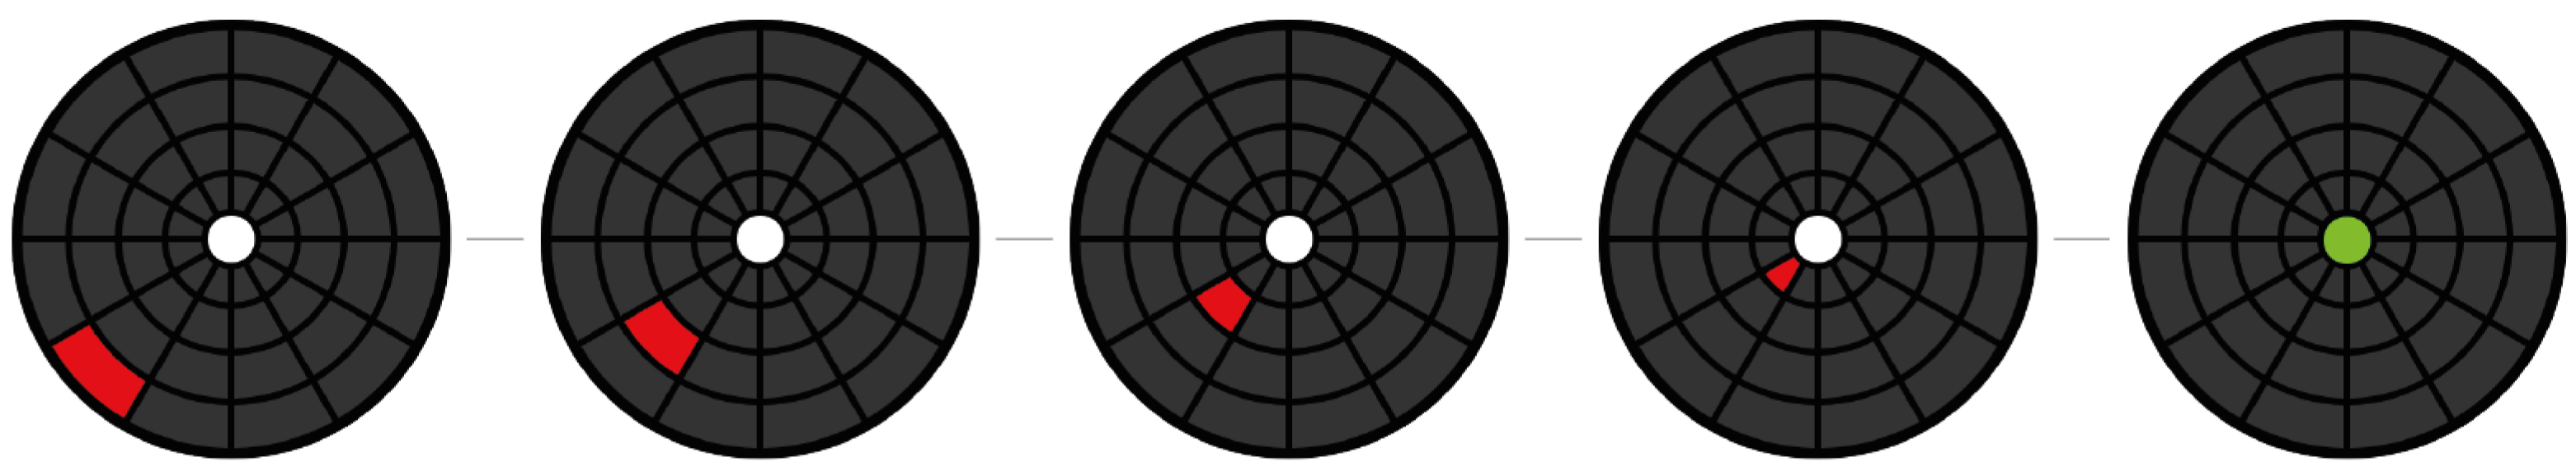
Grid Display The second UI design is characterized by a grid structure that divides the surface of the display into 12 segments of a circle. In addition, four concentric rings of varying radii are arranged in a regular pattern. Depending on the relative position of the TMI with respect to the planned path, one of the respective grid patches is colored red. (
Figure 4) By moving the TMI in the denoted direction of the red-flagged field, the system guides the user in the direction of the desired angular orientation. As soon as the user has reached the pre-planned target alignment, the middle circle is illuminated in green.
Traditional External The navigation interface used in state-of-the-art spinal navigation systems displays three slices with normal directions and application point . The Traditional External UI used in our study emulated the state-of-the-art visualization. It was generated using the ImFusion Suite. The pre-planned pedicle screw insertion path is superimposed on all three planes (axial, coronal, sagittal) of the patient CT scan as a red line. The TMI’s position is represented using a green line. The pre-planned, optimal orientation is attained when both the red and the green line intersect on all three individual planes.
2.2. Validation Setup and Experiments
The primary focus of this usability study is the evaluation of the TMI for the task of tool angle alignment within the pedicle screw placement procedure. To compare the proposed approach with the traditional visualization approach, two sets of controlled experiments were conducted. The study was executed in a closed environment inside the university hospital Klinikum rechts der Isar, Munich, Germany (
https://www.mri.tum.de/) to evaluate the potential benefits of the proposed approach. A controlled scenario for task execution was generated. This controlled setup allowed for the collection of reliable data on the user’s performance in regard to the task time, Euclidean distance, overall task load, system usability and UI design. The aim of the study is the yielding of information on the following two research questions:
Does the proposed user-centered navigation concept enhance the usability and performance of the medical task for the surgeon, compared to the state-of-the-art navigation? (Experiment 1)
Is the execution of the alignment task easier with a tool-mounted interface or with an external screen? (Experiment 2)
Experiment 1 was focused on the examination of the medical procedure and the yielding of clinical results. The participant group consisted of eighteen experienced surgeons. It investigated the performance and usability of the TMI, compared to the state-of-the-art navigation on a realistic spine phantom.
Experiment 2 was employed to evaluate the two main distinctions of the proposed over the traditional approach in an isolated manner—the two main aspects being the in situ visualization offered by the TMI on one hand, and the developed UI on the other hand. To evaluate whether the location of the proposed visualizations affects the system performance and usability, the user was presented with an alignment task using the same pair of visualizations (Circle and Grid), both on the TMI and the external screen. The distribution of the participants in both experiments followed a block randomization. The following hypotheses were framed. Each assumption is compared to the respective visualization presented on the external screen.
Compared to the state-of-the-art navigation system: (Experiment 1)
H1. Participants using the TMI for angle alignment experience reduced cognitive load and improved usability.
H2. Participants using the TMI for angle alignment achieve the planned trajectory faster and with a shorter Euclidean path.
Compared to the same visualizations on an external screen: (Experiment 2)
H3. Participants using the TMI for angle alignment experience reduced cognitive load and improved usability.
H4. Participants using the TMI for angle alignment achieve the planned trajectory faster and with a shorter Euclidean path
A complementary experiment was conducted to gather preliminary results of the TMI for the task of drilling. In addition to the evaluation of the angle alignment task in Experiments 1 and 2, this small experiment with non-significant results looked at the usability and design of one proposed depth control visualization. The complementary experiment was supposed to give insights into the potential of the TMI for sub tasks outside the angle alignment task. The choice to additionally investigate depth feedback was based on the surgical workflow wherein the surgical tool is first aligned, and once correct alignment is achieved, the drilling process begins, thus presenting a logical subsequent guidance visualization to investigate.
2.2.1. Experiment 1
Participants. A total of 18 surgeons (8 females and 10 males) volunteered in the study (
Figure 5). All of the practicing doctors were experienced in using traditional techniques for the visualization of 3D data (i.e., CT, MRI). Their mean age was 30 ± 3.7 std. The participants could be grouped into two levels of experience:
Attending physicians (senior surgeons) from the Department of Neurosurgery at Klinikum rechts der Isar: skilled users regarding pedicle screw placement and spinal navigation systems.
Residents (junior surgeons) and medical student interns from the Department of Neurosurgery at Klinikum rechts der Isar: familiar with spine anatomy and the surgical procedure, but with little to no experience in executing pedicle screw placement and operating spinal navigation systems themselves.
None of the participants had previous experience using the proposed navigation system. However, 14 participants indicated to be familiar with using surgical navigation systems, and 15 participants reported to have executed pedicle screw placement before. At the end of two weeks of experiments, 4 attending physicians, 11 residents, and 2 medical student interns participated in the experiment.
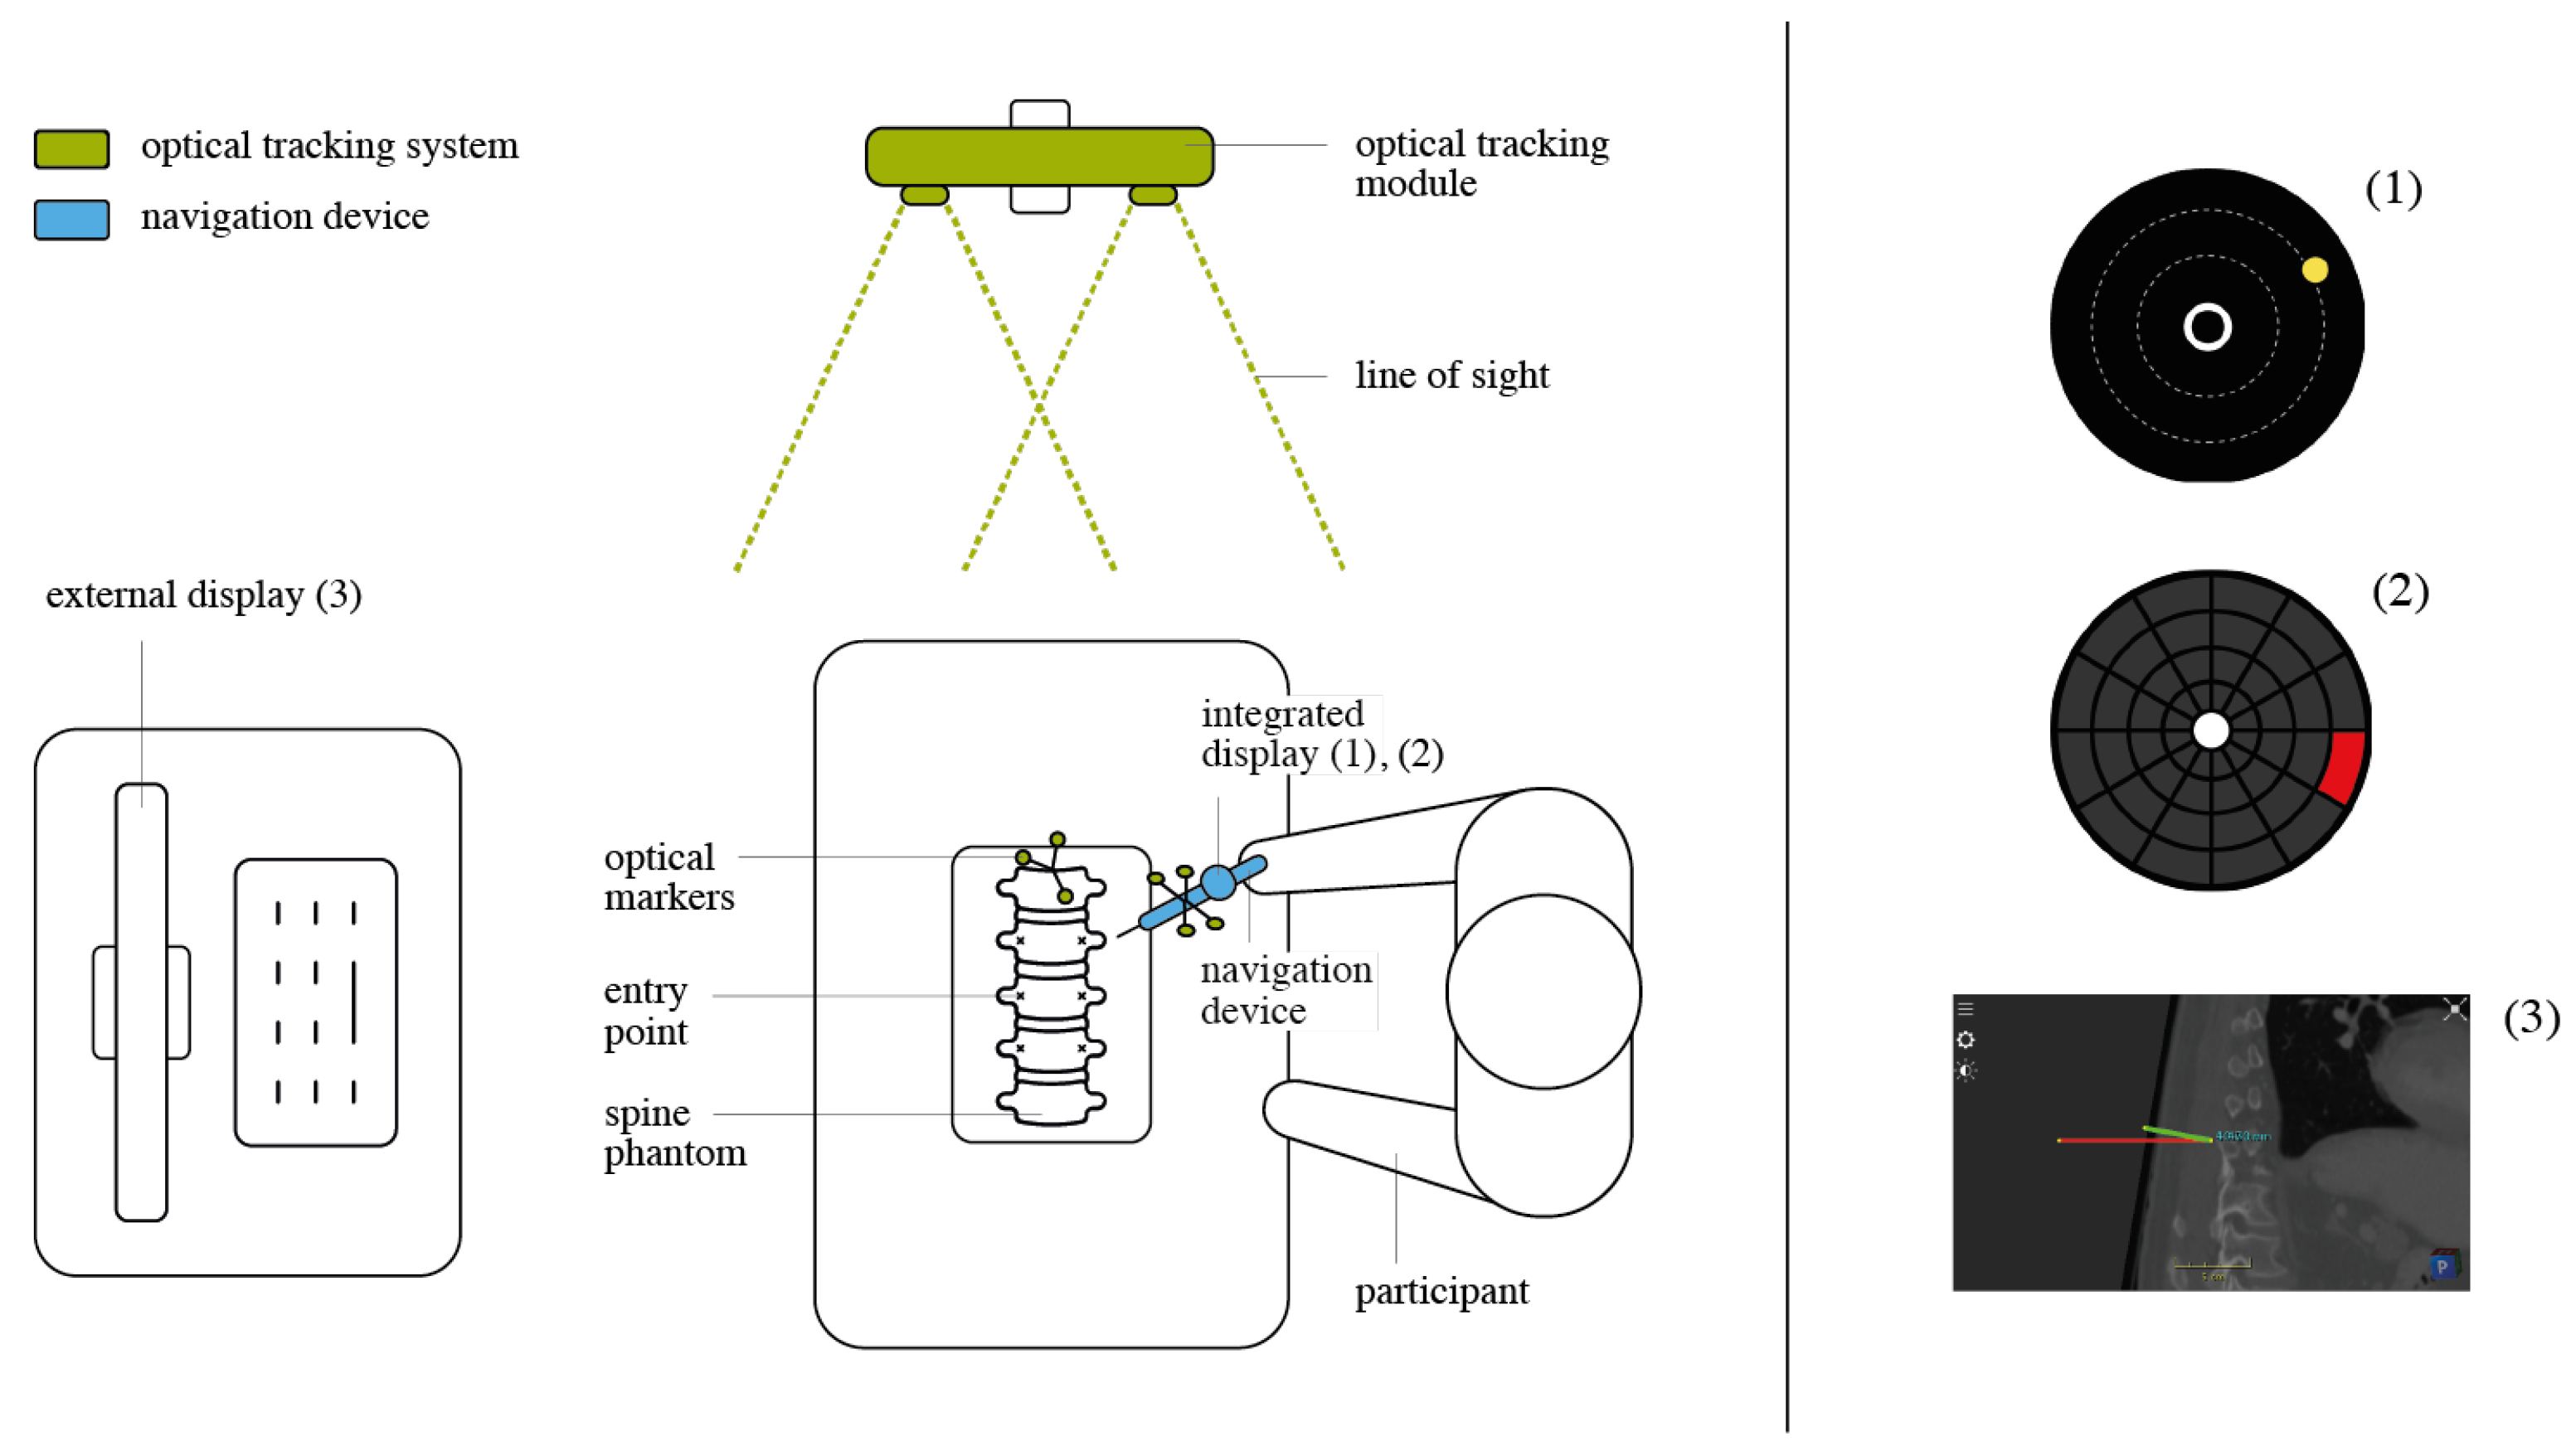
Experiment Setup A moderated usability study was employed. The experiment was executed as a physical session including a moderator, a software operator and one participant at a time. The moderator instructed the participant on the task performed with the product under evaluation, accompanied by a questionnaire referring to the task and the product. Experiment 1 evaluated the traditional approach to navigation presented on an external display versus the proposed TMI approach. A total of three visualizations (Circle Display, Grid Display, Traditional External) were evaluated on a model of the lower lumbar spine (levels Th11 to L5) (
Figure 6).
The model was 3D printed from a CT scan of a human spine and calibrated to the optical tracking system. To guarantee anatomical conformity, realistic pedicle screw insertion paths were defined by a senior neurosurgeon on the CT of the printed spine phantom prior to the study execution. The trajectories represented the anatomically correct path of insertion for each right and left pedicle screw at the levels Th11 to L5 of the spine and amounted to 14 distinct trajectories that were equally spread on both sides of the spine. The entry point of each screw trajectory was physically marked on the phantom.
In addition, scales were added on both sides of the spine model to indicate the levels and sides. During the experiment, these scales helped the participants to find the entry points that were communicated verbally, e.g., “Next trajectory Th12 left side”. First, the user was instructed to place the tip of the TMI onto one of the predefined entry points on the spine phantom. Then, the physician was asked to align it in the right anatomical, pre-planned trajectory, using one of the visualization techniques. This alignment was repeated four times on two randomized trajectories for each side of the spine. The same task was repeated for all three visualizations (Circle Display and Grid Display on the TMI, Traditional External on the external screen). To avoid data distortion, the order of visualizations was randomized.
2.2.2. Experiment 2
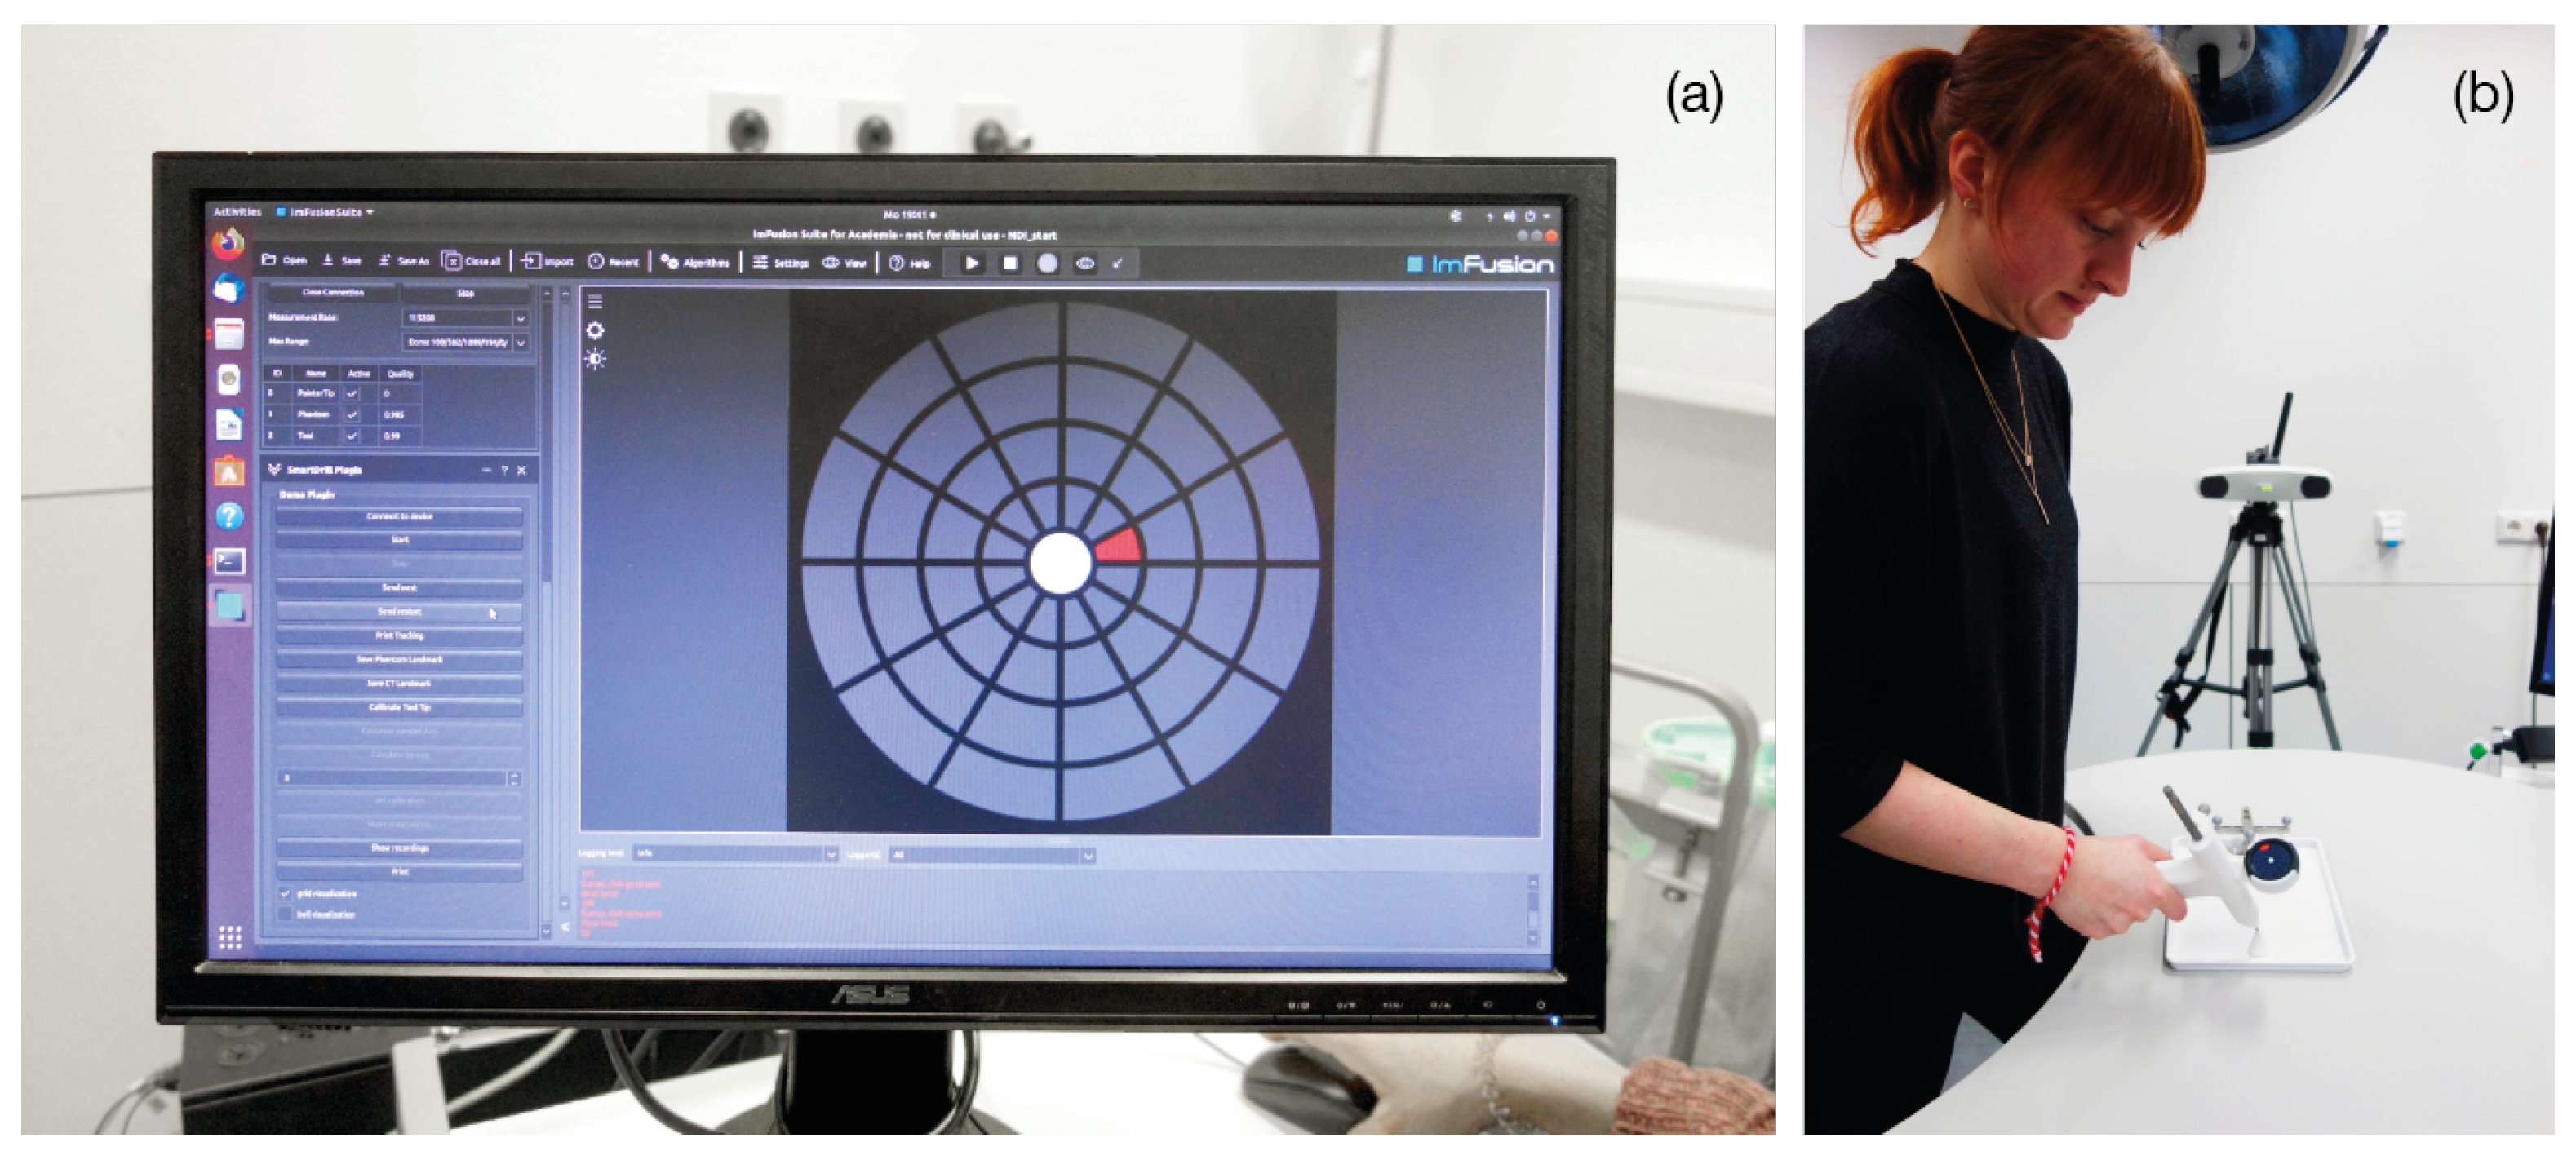
Participants A total of 42 volunteers (15 females and 27 males) participated in the second experiment at a research laboratory at Klinikum rechts der Isar (
Figure 7). The mean age was 26.8 ± 3.3. None of them had clinical experience, while 31 stated to having experience using augmented or virtual reality. However, none of the participants had any previous experience using the TMI system or the visualizations under evaluation.
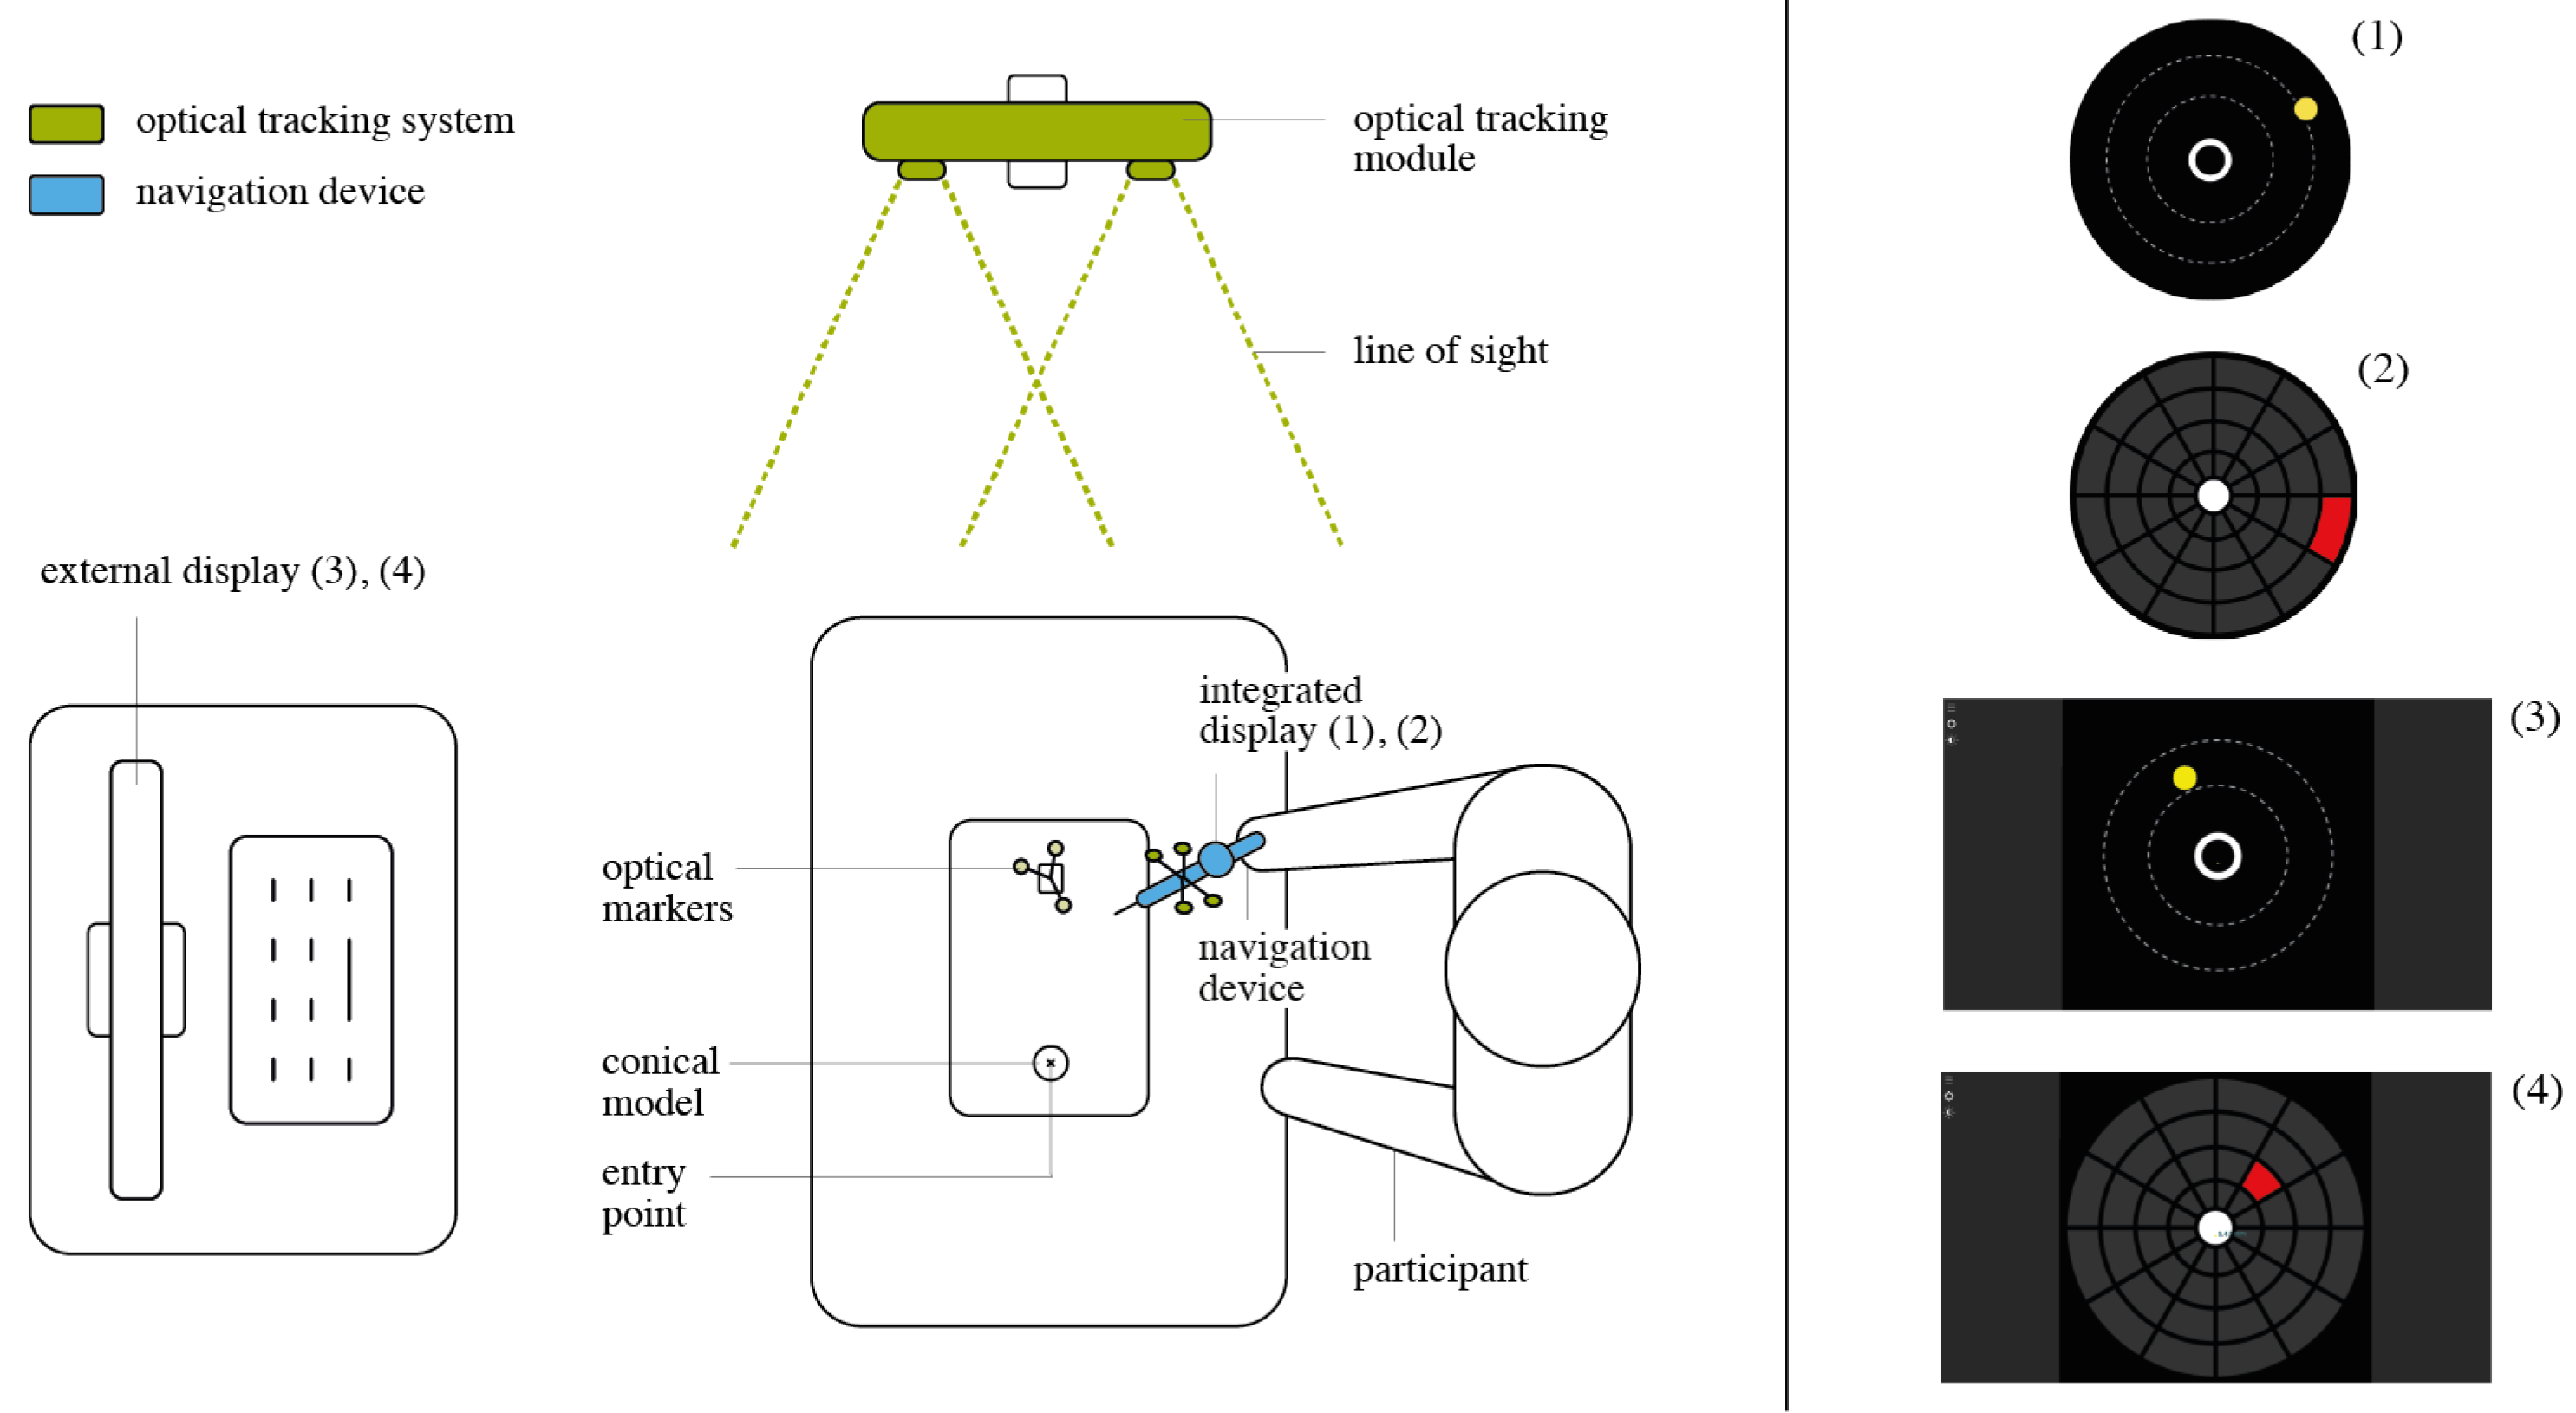
Experiment Setup We performed a second experiment to isolate the two main aspects of our solution: the in situ localization of the visualizations and the visualizations themselves. As a combination of the two UI designs (Circle and Grid), and the two displaying locations (integrated and external) four distinct setups were evaluated (
Figure 8).
An abstracted use-case scenario was built. A pyramidal 3D model with a single entry point was employed instead of the spine phantom. As another part of the task abstraction, random realistic trajectories were created with a fixed entry point on top of the conical model, contrasting the anatomically right insertion paths in Experiment 1. The participant was asked to position the tip of the TMI onto the given entry point on top of the physical 3D model. Then, the user was asked to align the TMI in the pre-planned trajectory, using the visualization. This alignment task was repeated five times per visualization for each of the four mentioned setup combinations. The order in which the participant used the four visualizations was randomized. The experiment was accompanied by a questionnaire referring to the task and the product.
2.2.3. Complementary Experiment
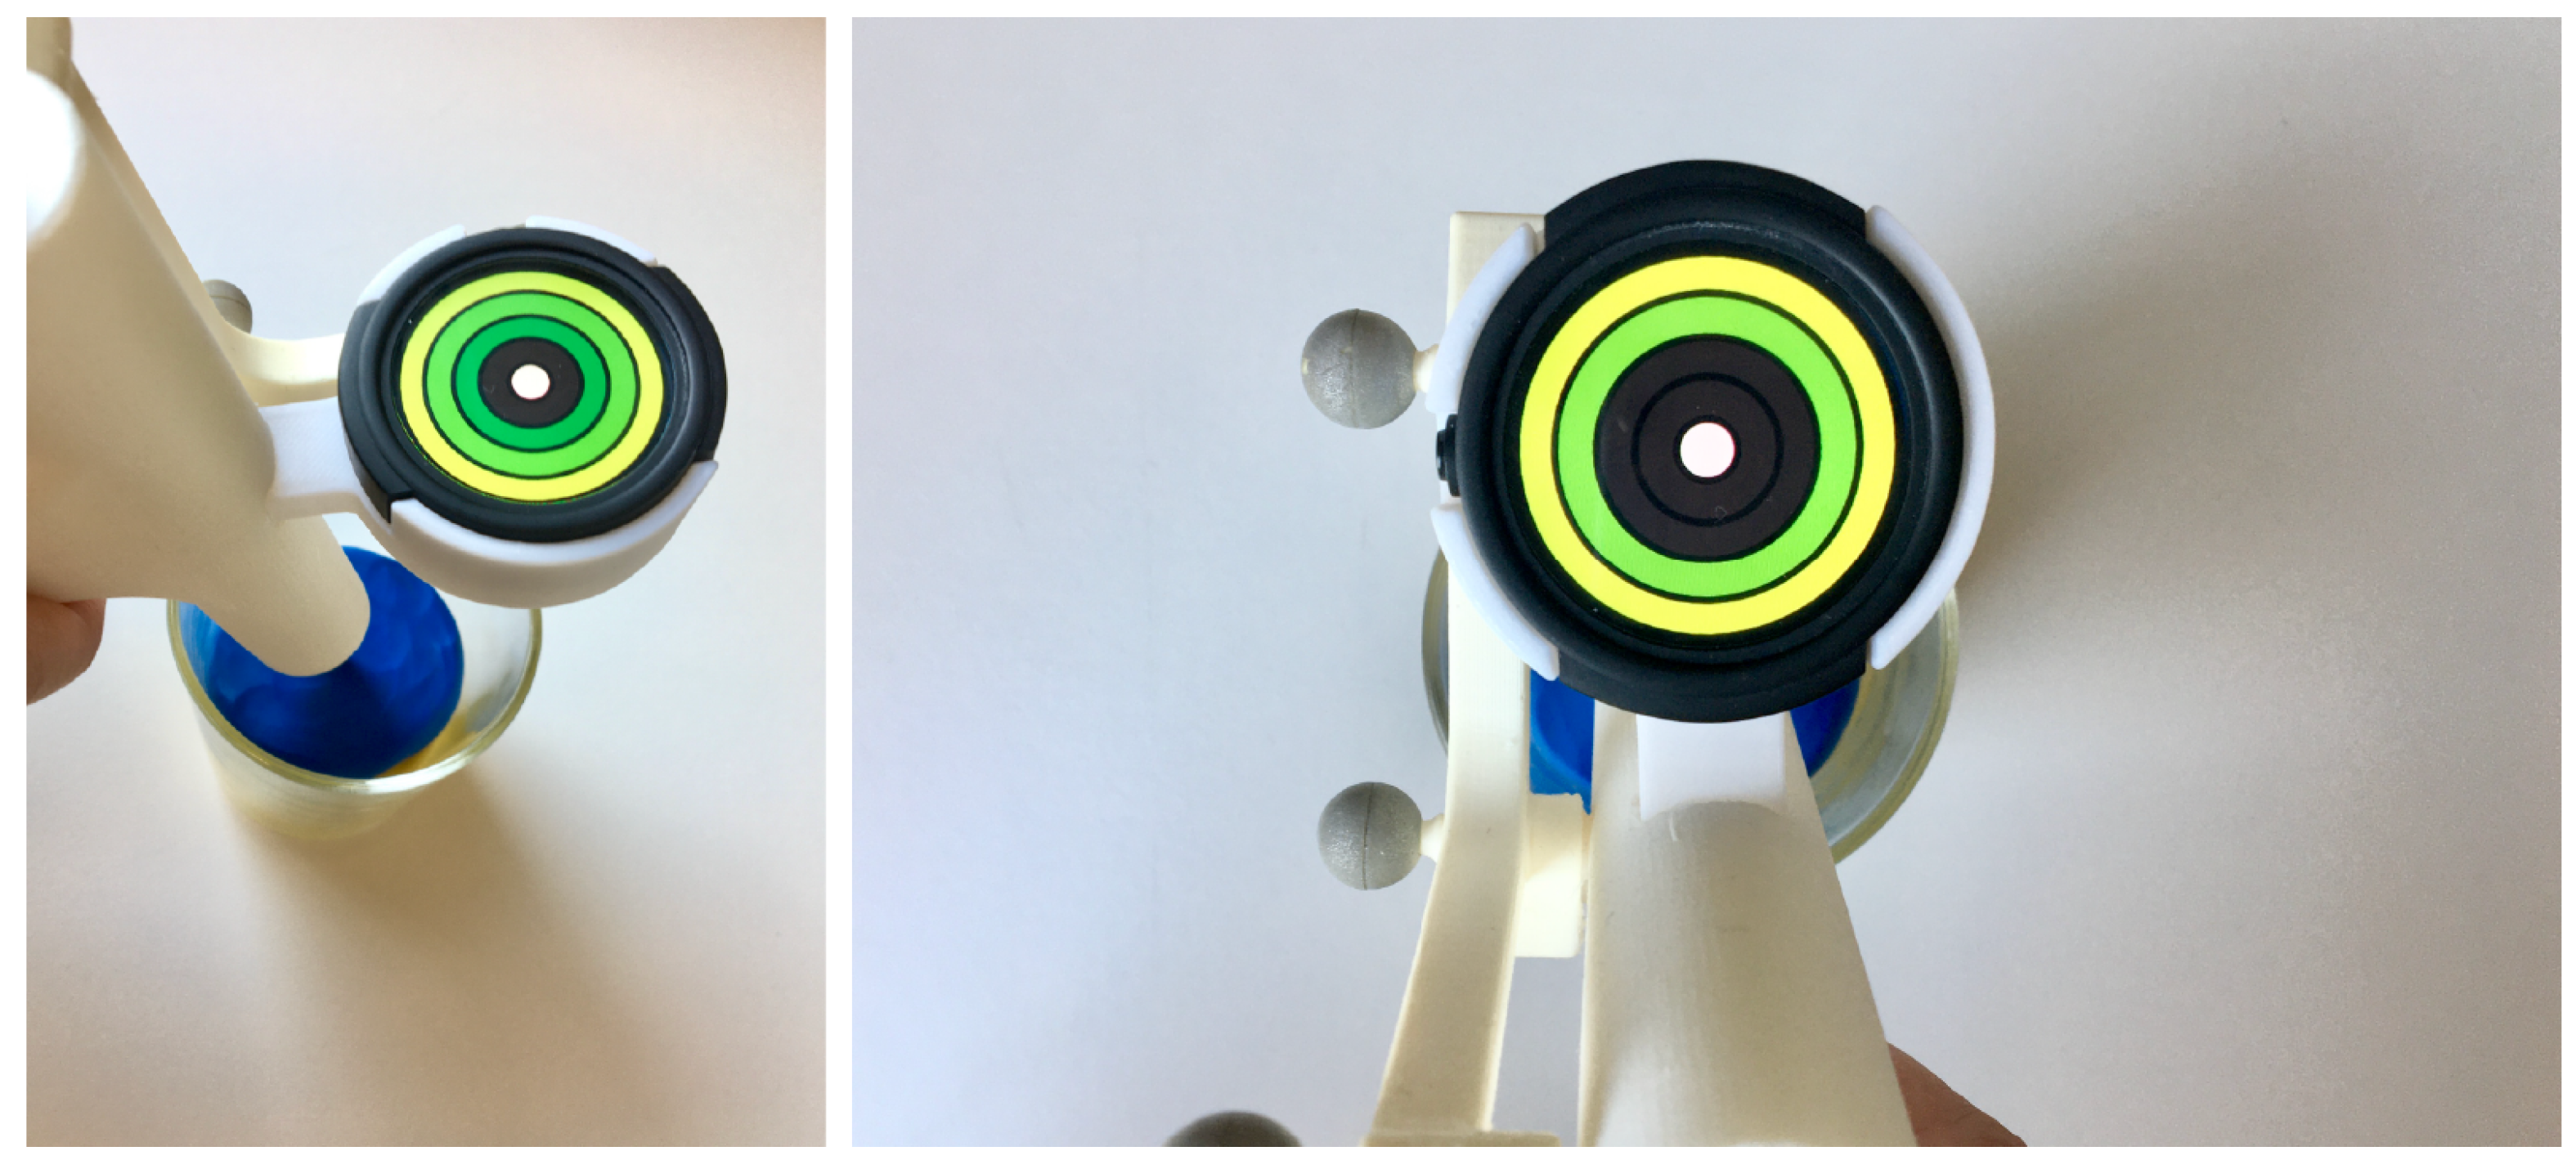
Participants and Experiment Setup. A moderated usability study was employed to investigate a proposed visualization for tool depth control on the TMI (
Figure 9). The guidance was used during drilling into the vertebra to receive live feedback on the depth of the tool with respect to the planned hole depth. A total of 9 male participants with a mean age of 28 ± 3.5 were asked to position the tip of the TMI into a glass containing modeling clay and to insert the TMI into the mass according to the guidance on the Ticwatch screen. The clay was used to simulate the consistency and resistance of bone marrow during the procedure. The depth control visualization showed green rings that lit up one by one the further the tool was inserted into the clay until the innermost circle element turned from white to green, indicating that the ideal depth of the hole had been reached. The task was repeated three times. An accompanying questionnaire referring to the task’s usability, overall task load and the visualization’s design was filled out right after the experiment.
2.2.4. Experimental Variables
Based on the posed hypotheses, the experimental variables were defined. These variables determined the type of measurements performed during the experiment. Their values were examined using statistical analysis, and they enabled the hypotheses validation.
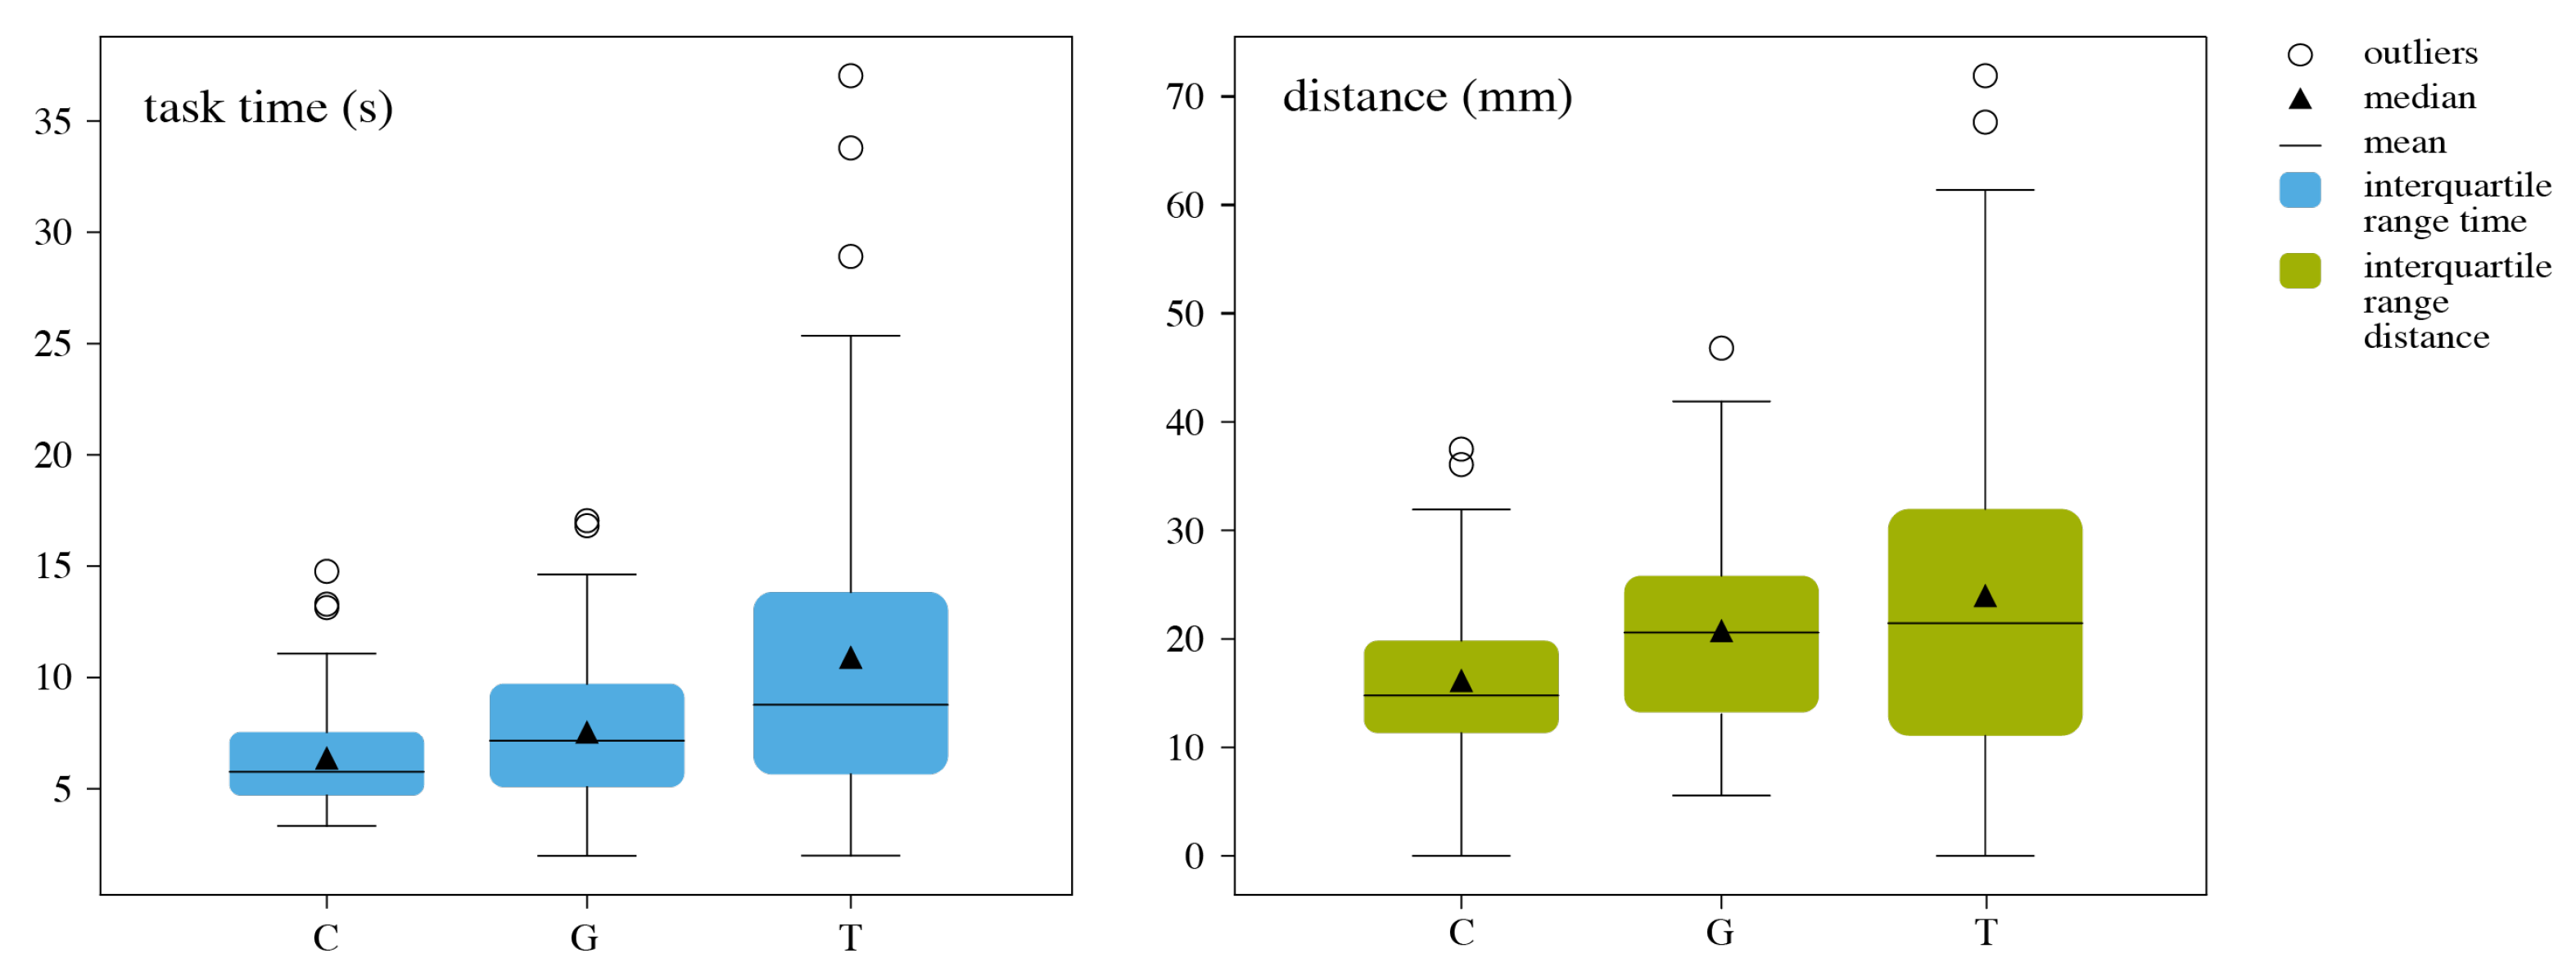
Euclidean Path and Time During Experiments 1 and 2, time-stamped poses of the TMI handler were recorded. Time measurement was one of the chosen performance metrics used during the simulation trials. Measuring the task completion time provides information about the efficiency of a product. In the case of navigation usage, the faster the task is completed, the better the experience is for the user. On average, the surgeon executes the task between 4 and 12 times during one procedure and usually has two surgeries a day, resulting in a highly repetitive task, where efficiency becomes predominant according to Albert and Tullis [
27]. The task time is measured for each trajectory individually. The time measurement starts when the navigation visualization appears on the screen and ends after the instrument is perfectly aligned for a duration of 2 s. The start and end times are accompanied by the moderator’s verbal cues, “start” and “success”. The time-stamped poses of the TMI also allowed the collection of the Euclidean path traveled by the TMI during task execution. Analyzing the total Euclidean distance traveled provides information on how well the visualizations’ logic was understood by revealing how directly or indirectly the tool was guided toward the final position.
Cognitive Load and Usability Additionally, the participants of all three experiments were asked to fill out a questionnaire comprising a NASA-TLX, a System Usability Scale (SUS) and three Design-related Likert scales for measuring the cognitive load, overall usability and perceived user experience (UX) and user interface design. The NASA-TLX (Task Load Index) is a self-reported workload assessment of the executed task. This standard method from the field of human factors engineering provides quantitative data on the cognitive load, allowing an objective comparison between visualizations. Cognitive load refers to the overall task load calculated, using the NASA-TLX questionnaire, for six defined variables (mental demand, physical demand, temporal demand, performance, effort, and frustration) [
28]. Usability was calculated using the System Usability Scale (SUS) questionnaire [
29]. SUS is a simple, ten item questionnaire that records a user’s subjective assessment of usability. For each item, a five-point Likert scale collects data on the perceived usability of the product. The scales are numbered from 1 (anchored with “Strongly disagree”) to 5 (anchored with “Strongly agree”). SUS yields a single value representing a composite measure of the overall usability of the system under evaluation, yielding results in a range of 0 to 100 in 2.5 increments, wherein 0 represents a very bad usability, and 100 a very good usability [
30].
Design In addition to the hypothesis-related measures, the design aspects were evaluated. The questionnaire included further questions gathering subjective assessments of the interfaces’ design. The aspects of visual appeal, intuitiveness and interaction were evaluated, using three five-point Likert scales, numbered analogously to the ones used in the SUS questionnaire. In addition, open questions were employed, collecting qualitative data on the visualizations’ design, such as positive and negative aspects during usage.
4. Discussion
A tool-mounted interface (TMI) for spinal fusion surgery was presented. Preliminary tests demonstrated significant improvements in favor of the proposed approach in terms of cognitive load, mental demand, and usability (H1). Enhanced user ergonomics resulted in a significant reduction in task time (H2) as well as an increase in performance, measured as the total Euclidean distance and time for the group of novice surgeons. Experiment 2 revealed no significant findings for H3, while H4 was proven to be false, as the results on the external display were significantly better. Among the possible factors influencing this result are the latency added to the visualizations on the TMI, the lower resolution, and the comparatively small size of the smart watch display. This is an interesting result, which contrasts the results of Experiment 1 that show a reduction in cognitive load, improved usability, and superiority in comparison to the traditional approach. This could guide one to improve the resolution and the performance of the attached display. Nevertheless, the principal idea to reduce the number of external displays and to introduce in situ guidance to minimize the user’s cognitive load is still valid.
An additional usability experiment introducing a depth control visualization on the TMI has shown that the TMI solution does not only promise potential for the task of angle alignment, but also for depth feedback during surgical tool insertion.
The grouping of time data by surgeon experience level in Experiment 1 showed that the proposed approach is understood faster and is thus more intuitive. It can be assumed that traditional visualizations have to be learned to achieve the same performance as the proposed approach. This identified benefit makes a strong case for the application of graphical visualizations in surgeon training. The reduced cognitive load of the TMI can help beginners focus on the perception of haptic feedback during instrumentation usage, thereby training their fundamental surgical skills while allowing them to still achieve precise pedicle screw placement by employing surgical navigation.
Despite the known variance in the level of difficulty for pedicle screw placement, depending on the level of the vertebrae, the grouping of time and Euclidean distance by vertebrae for Experiment 1 has not shown significance. Even though the study setup was designed to replicate the real-use scenario, the spine phantom was not comparable to a human body in regard to spine mobility. The high mobility between vertebrae has a major influence on the difficulty of screw placement in clinical practice. The results are not surprising when considering this distinction between the study setup and real clinical application.
When looking at the introduction of the TMI in real clinical application, questions on calibration and system performance may be raised. We propose checking the system’s accuracy intra-operatively with a simple pivot calibration before each operation. Such verification procedures are a common part of the routine workflow of existing navigated solutions, and are done prior to the procedure, usually taking a few seconds. The performance of the tracking system depends on the system used; in our case, we used a common Polaris Vicra. Such systems are already employed in clinical routine, and they offer sub-millimeter precision if used under optimal conditions.
Despite some questions that the initial testing has left open, the TMI has proved its high potential. The decision to focus the presented study on a graphically reduced approach to surgical navigation visualization on a tool-mounted interface allowed for an exploration of possibilities within medical user interface (UI) design and was rewarded with enthusiastic responses from both engineers and clinicians. The presented work has proven that minimalist interfaces, when positioned intelligently to integrate well into the surgical workflow, can achieve the same precision as traditional interfaces for tool alignment tasks while improving the overall usability.
This work opens a path for the research community to further regard user-centered approaches to surgical interfaces and to hopefully contribute to usability advancements in surgical visualizations.


 ,
, 


