1. Introduction
This study addresses the relationship between item response time and item accuracy (i.e., the response time accuracy correlation, RTAC) in figural matrices tests. In the first section of the manuscript, we provide an overview of the relationship of item response time with item accuracy and methodological strategies that are used in this context. The theoretical framework of our study is the dual processing account of response time effects, which was recently proposed by Goldhammer et al. [
1]. The basic ideas of the dual processing account are described in the second section. The central assumptions are that negative RTACs occur when tasks are solved in the automatic processing mode, and positive RTACs occur when tasks are solved in the controlled processing mode. In the third section, we consider figural matrices tests and models of the solution process. Furthermore, we present findings concerning RTACs for figural matrices that apparently contradict the assumptions of the dual processing account of response time effects. Although the solution process of figural matrices is expected to run primarily in the mode of controlled processing, most of the studies found negative RTACs. The fourth section deals with the inconsistency hypothesis through which Goldhammer, Naumann, and Greiff [
2] try to reconcile these unexpected findings. The central notion of the inconsistency hypothesis is that respondents who are not able to find the correct answer spend additional time inspecting the response options and therefore show longer response times. In the last section, we address the goals and hypotheses of the current study: we wanted to provide an empirical test of the assumption that the direction of the RTAC (positive vs. negative) can change substantially within one task paradigm depending on the interaction of item difficulty and person ability (i.e., task complexity).
1.1. Item Response Time and Item Success
Item response time is the time interval between the onset of the item presentation and the completion of the item. The interpretation of item response time is equivocal [
3,
4]: (1) On the one hand, fast response times can indicate efficiency of processing (i.e., mental speed [
5,
6]). In that vein, fast responses are expected to be associated with accurate responding, as both tap individual differences in ability. On the other hand, response times may reflect the time participants choose to invest into item processing. Thereby, increased accuracy of responding slows down the response [
7]. RTACs
1 describe the relationship between item response time and accuracy of responding (e.g., [
1,
2]), or the relationship between speed and ability, respectively [
3]. A positive RTAC indicates that the probability of giving an accurate response increases with long response times, whereas a negative RTAC indicates that correct responses are associated with short response times.
Previous research suggests that the relationship of response time with accuracy depends on the level of analysis. In this respect, van der Linden [
3] points out that three levels should be distinguished: (1) At the
within-person level, the value of the person parameters is allowed to change across conditions and as a function of applied strategy; (2) In contrast, at the
fixed-person level, parameters are conceptualized as constant; (3) Finally, a distribution of person parameters constitutes the
between-person level, where parameters are assumed to be constant within each person.
Positive RTACs are frequently observed at the within-person level. They can indicate a
speed-accuracy tradeoff when respondents change their processing style (e.g., [
8,
9]) across items with comparable difficulty: Fast response times are associated with incorrect responses, whereas slow response times are associated with correct responses. In contrast, response time and accuracy can be negatively related across persons at the between-person level. This would result in case individual differences in processing efficiency (that jointly contributes to speed as well as accuracy of responding) exceed those in the setting of the speed-accuracy trade-off. However, previous results obtained for the between-person level are mixed, possibly depending as well on analysis method and task content. In fact, positive RTACs were found for reasoning [
6,
10] and problem solving [
1], null RTACs for arithmetic tasks [
11], and negative RTACs for basic computer operation skills [
12] and reading tasks [
1].
1.2. Dual Processing Theory of Response Time Effects
Goldhammer et al. [
1] suggest a theoretical framework that aims at explaining the observed differences in RTACs on the between-person level by referring to the ideas of
dual processing theory [
13,
14]. Dual processing theory distinguishes between automatic and controlled mental processes. Automatic processes are spontaneously activated in response to a specific input, run fast and require no control or attention. In contrast, controlled processes need to be activated on purpose. They run slowly and require control and attention. Goldhammer et al. [
1] applied these considerations to RTACs in the following way: For items that allow for
automatic processing they expected a negative RTAC because test takers with higher ability (i.e., higher probability of solving an item correctly) show a higher degree of automatization and are therefore faster in their responses. For items that require
controlled processing they expected a positive RTAC because taking more time to solve an item carefully increases the probability to solve it correctly. Goldhammer et al. [
1] tested these assumptions by comparing RTACs in task paradigms that due to theoretical considerations and empirical results predominantly either require automatized or controlled processing. As reading is already well automatized during primary school [
15] negative RTACs were expected. Conversely, as problem solving tasks by definition require controlled processing [
16,
17] positive RTACs were expected. Results based on data from over 1000 participants from the
Programme for the International Assessment of Adult Competencies (PIAAC [
18]) confirmed these predictions. Interestingly, the RTAC in both task paradigms was moderated by item and person characteristics. This was demonstrated separately for item difficulty and for person ability. The RTAC was more negative for easy items compared with more difficult items. Analogous effects were observed for more able respondents compared to less able respondents.
1.3. Figural Matrices: Concept, Solution Process and RTACs
In the current study, we were interested in RTACs in figural matrices. Therefore, we will provide a short description of the concept of the item format and discuss findings concerning the solution process and RTACs in figural matrices.
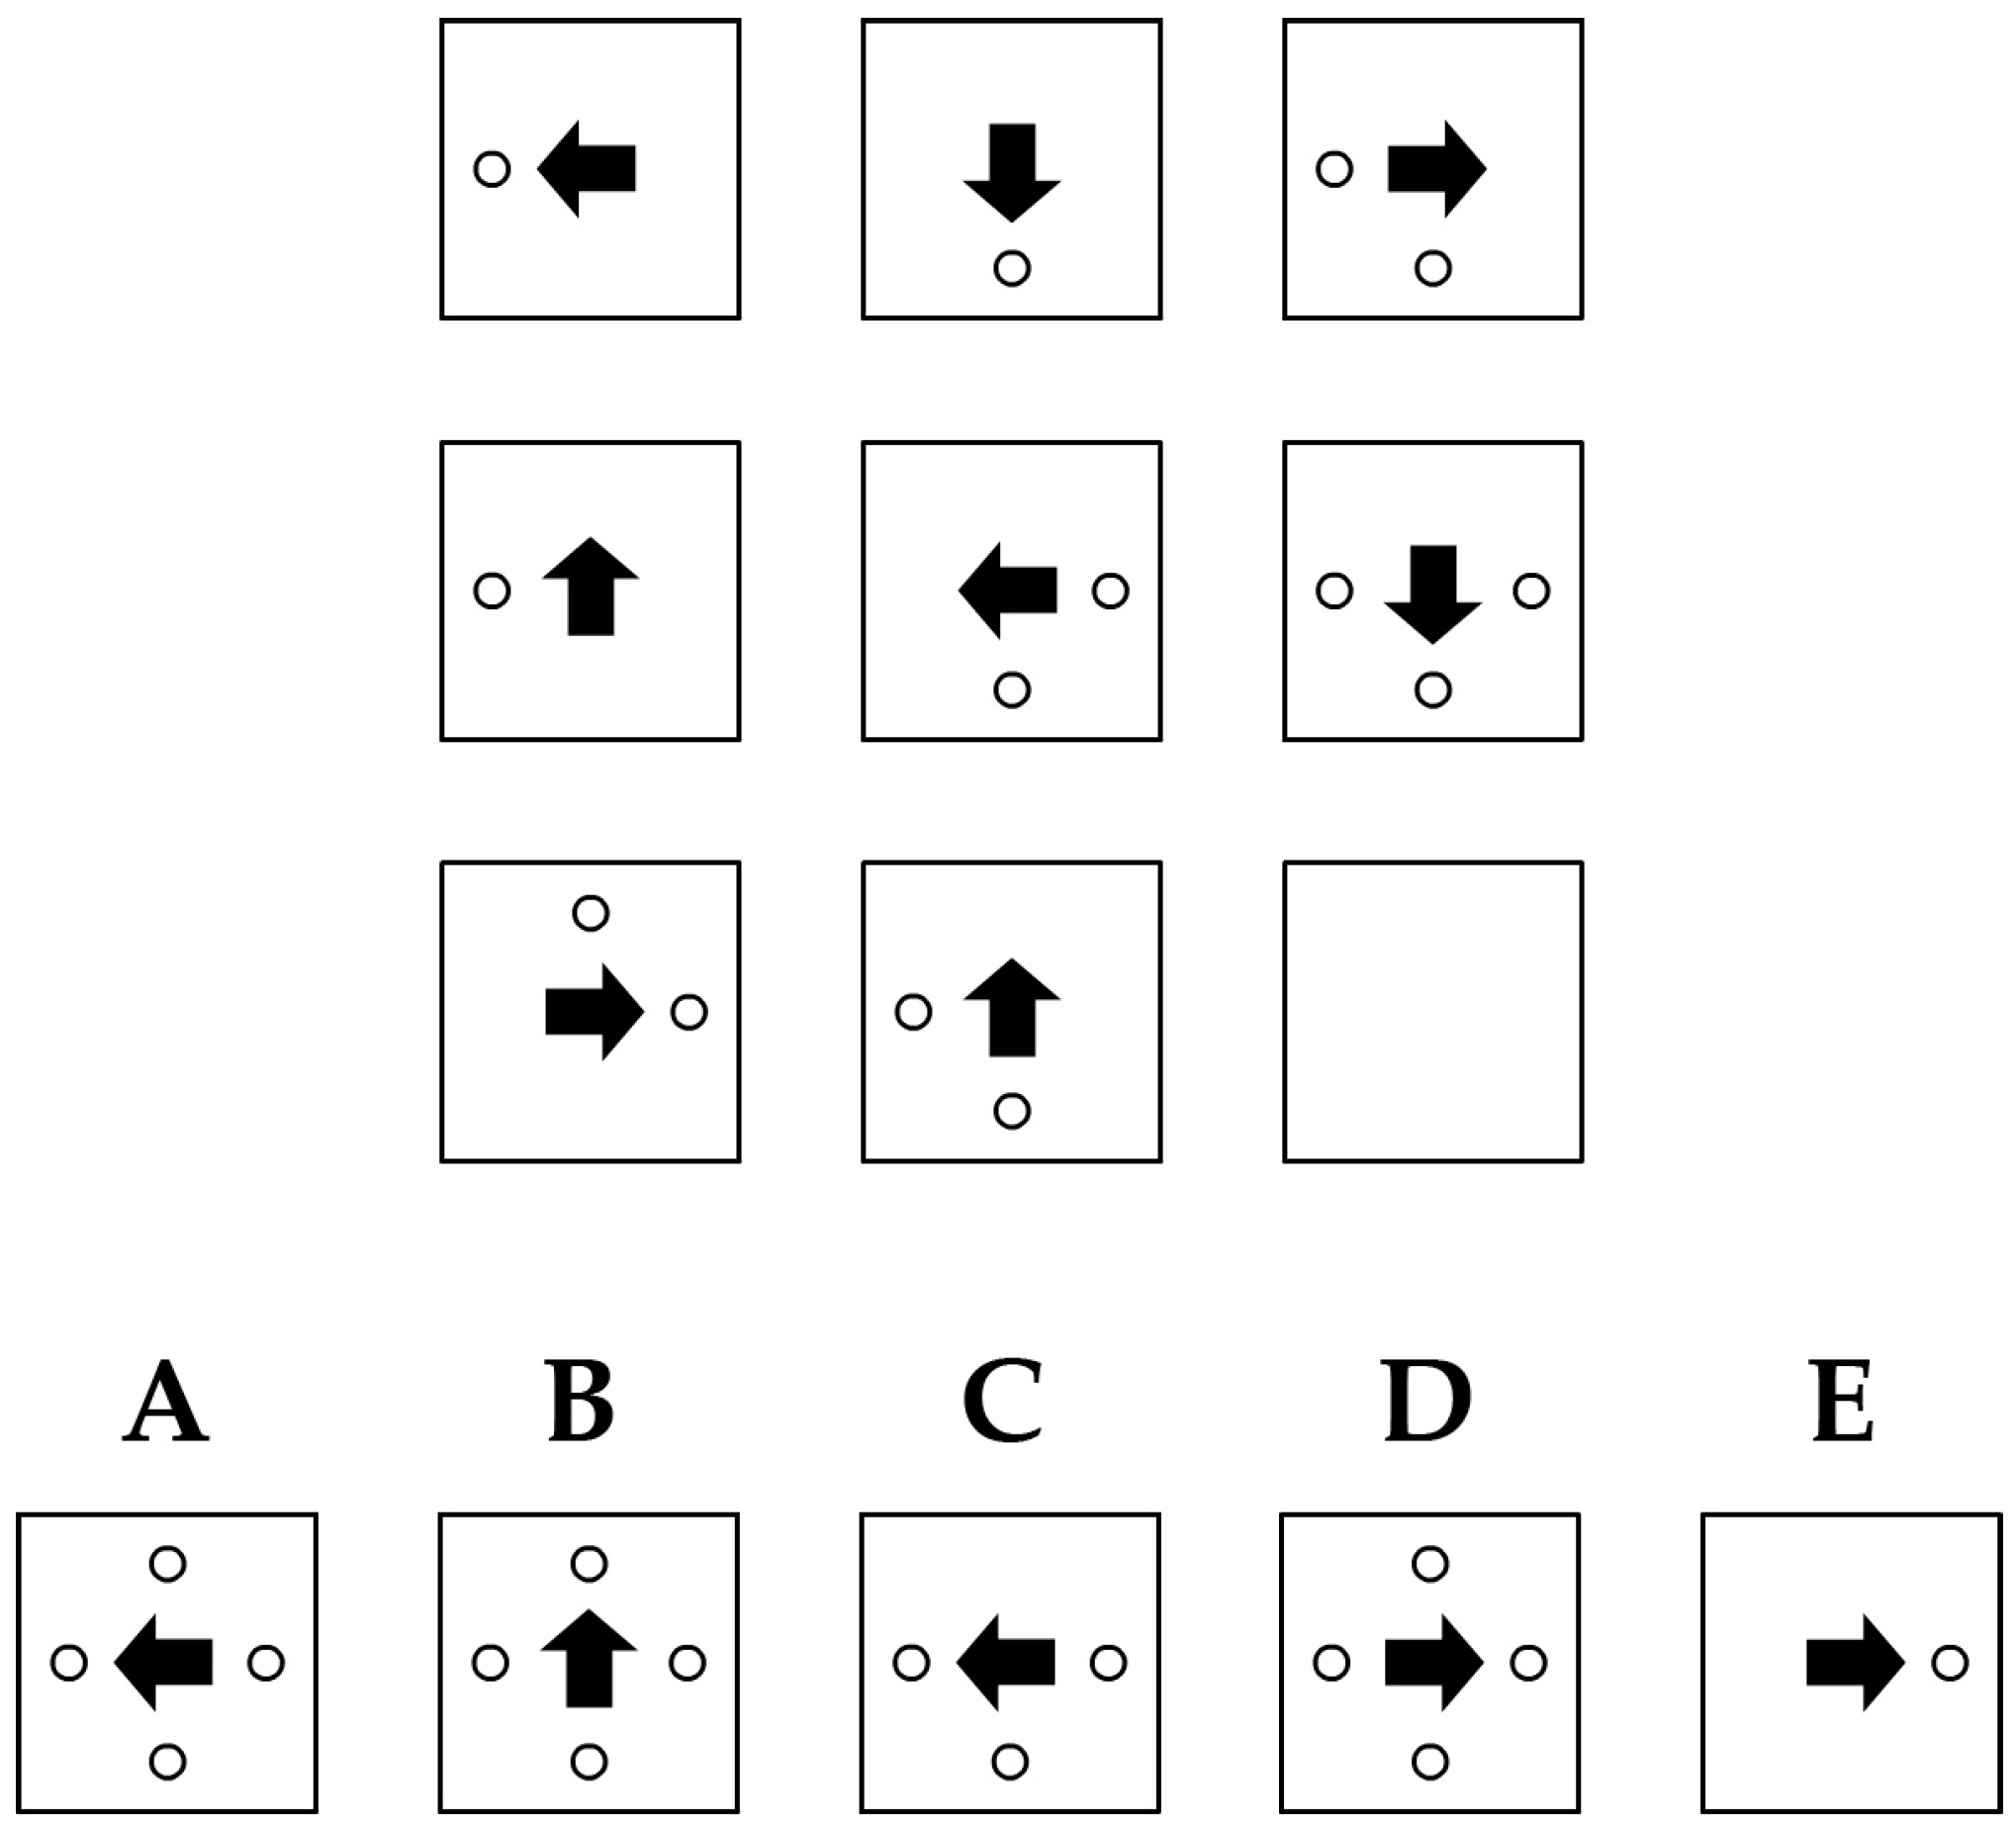
Figure 1 shows an example of a classic figural matrix item. The
item stem is found in the upper part of the figure. It consists of a 3 × 3 matrix of cells with geometric symbols (i.e., figural elements). These elements follow certain design rules. In the example, the arrow is rotated by 90° in a counterclockwise direction across each row of the matrix. The circles follow an addition rule across the rows (i.e., the circles that appear in the first and second cell of a row are summed up in the third cell). The last cell (solution cell) of the item stem is left empty. In the lower part of
Figure 1, the
response format is found. It consists of the correct solution (
attractor), which logically completes the matrix according to the rules in the item stem. In
Figure 1, the attractor is response option A. The other response options are called
distractors and do not complete the item stem according to the rules employed in the item stem. The task of the respondent is to determine which of the response options represents the attractor.
The most influential model of the
solution process for figural matrices was developed by Carpenter, Just, and Shell [
19] on the basis of eye-tracking analyses, verbal reports, and computer simulations. The model considers three consecutive steps that make up the solution process: (1)
Perceptual analysis: Perceptual elements of the item stem are encoded and checked for correspondence; (2)
Conceptual analysis: The logical principles (i.e., rules) that affect corresponding elements are analyzed; (3)
Generalization and response generation: The identified rules are applied to the entire matrix in order to generate the response. The response option that matches the generated response (best) is selected. Two aspects are regarded as crucial for respondents’ success in solving the items.
General mental ability (
g) enables respondents to infer the rules employed in the matrices.
Working memory capacity enables the respondents to monitor goals, to store intermediate steps of the solution, and to keep track of the solution process. Based on these considerations, the solution process of figural matrices can be expected to run primarily in the mode of controlled processing.
Contrary to predictions derived from the dual processing account, several studies found negative RTACs for figural matrices tests ([
2,
20,
21,
22,
23,
24,
25], but see [
26] for an exception). Beckmann et al. [
22,
23,
24] refer to this finding as the incorrect > correct phenomenon (I > C phenomenon). It is worthy to note that these studies used different methodological approaches (e.g., relating accuracy to response time by using different measurement models, explanatory item response models on the within-person level, comparison of mean response times for correct or incorrect responses). Therefore, it is unlikely that the negative RTAC can be explained merely as a methodological artifact. The study by Goldhammer et al. [
2] is of particular interest as their results suggested a negative RTAC also on the between-person level, contrary to their initial assumption. Furthermore, the RTAC was moderated by person ability, by the item difficulty, and by the number of rules used to construct the item. For able test takers and easy items that employed only few rules the RTAC was strongly negative. For respondents with low ability and difficult items that employed more rules the RTAC approached zero or was even slightly positive. Interestingly, Neubauer [
26] who found a null correlation between response time and accuracy, reported a similar moderating effect of item difficulty. For items with low difficulty, the RTAC was significantly negative. For items with moderate or high difficulty it did not differ significantly from zero.
1.4. Inconsistency Hypothesis
As summarized in the previous section, the negative RTAC for figural matrices contradicts the dual processing account. Therefore, Goldhammer et al. [
2] developed the
inconsistency hypothesis, which states that it takes “more time to give an incorrect response because the (incorrect) response alternative did not appear to be clearly a correct or incorrect one” (p. 36). This means, if the correct solution has weaker memory representation [
27], and if test takers do not know the correct response instantly, they ruminate between response options [
28]. They are in a hybrid conceptual state, not knowing whether the preferred response is correct or incorrect (preventing automatic processing [
29]). Thereby, long response times emerge, and the responses are likely to be inaccurate, leading to a negative RTAC. As inconsistency between response options can only emerge when response options are being presented, Goldhammer et al. [
2] argue that the negative RTAC should vanish if a constructed response format (see
Section 2.2) is used in which respondents are required to generate their own response.
1.5. Goals and Hypotheses of the Present Study
The goal of the present study was to provide an empirical test of the assumption that the direction of the RTAC (positive vs. negative) can change substantially within a single task paradigm. Goldhammer et al. [
1] expected that “tasks
within and between domains (…) differ with respect to the composition of demands that necessarily require controlled processing and those that can pass into automatic processing” (p. 610; emphasis by the authors). Except for two studies [
22,
24], the current literature predominantly only provides support for differences of the direction of RTACs between task paradigms. As demonstrated by moderator analyses, the question whether controlled or automatic processing takes place is a function of person ability and item difficulty and their interaction (i.e., task complexity). The same item might require controlled processing by an individual with low ability while it could allow automatic processing by another individual with higher ability. Likewise, an individual who is able to solve an item with lower difficulty through automatic processing might have to change to controlled processing when solving another item with higher difficulty. Although Goldhammer et al. [
2] were able to demonstrate that a reversion of RTACs within a single task paradigm can occur as a function of person ability and item difficulty, the reversion was observable only to a very weak extent. It has to be noted that the study is based on data from respondents with above-average ability (high-school and university students) who worked on Raven’s Advanced Progressive Matrices (RAPM; [
30]) a test with a rather low mean item difficulty that uses predefined response options. Therefore, it is possible that the RTACs found in the study are biased in a negative direction as task complexity was rather low. Going beyond previous research, we used a sample that was more heterogeneous concerning ability. Furthermore, we employed a test that shows a broad range of item difficulties and uses a constructed response format (see
Section 2.2) that reduces the potential influence of inconsistency between response options because respondents have to generate the response themselves. The following hypotheses were tested:
H1: Average RTAC across items and persons: Given that reasoning tests predominantly require controlled processing and that inconsistency between response options is less relevant when using a constructed response format (see
Section 1.4), we predicted a positive RTAC at the between-person level. This means, longer response times are associated with higher accuracy, on average.
H2: Person ability moderates the RTAC: Based on the ideas of the dual processing account of response time effects and the results of previous studies [
1,
2], we predicted that person ability moderates the RTAC. Less able persons are expected to show a higher demand for controlled processing. In this group longer response times should therefore be associated with a more thorough way of solving an item, which should lead to a higher probability of solving the item correctly. Therefore, we expected positive RTACs for persons with lower ability. By contrast, more able persons are expected to show a lower demand for controlled processing. Therefore, we expected negative RTACs for persons with higher ability.
H3: Item difficulty moderates the RTAC: Based on the results of previous studies [
1,
2,
26], we predicted that item difficulty moderates the RTAC. Items with higher difficulty were expected to elicit controlled processing. For difficult items, longer response times should be associated with a more thorough way of solving an item, which leads to a higher probability of solving the item correctly. Consequently, positive RTACs are predicted for difficult items. By contrast, easy items can be solved in the mode of automatic processing. Consequently, negative RTACs were predicted for easy items.
H4a and H4b: Effects of number of rules: The amount of cognitive load rises when more rules apply [
19,
31,
32]. Therefore, number of rules was predicted to be a major determinant of item difficulty (
H4a). Additionally and in line with
H3, we predicted that number of rules moderates the RTAC: The more difficult an item (i.e., the more rules apply), the more positive the RTAC (
H4b).
H5: RTAC as a function of item difficulty and person ability: It was predicted that the RTAC depends on task complexity. This means, the previously demonstrated main effects of person ability and item easiness were hypothesized to interact. Specifically, the negative interaction of ability with response time (i.e., accuracy decreases for able participants with increasing RT) is reduced as item difficulty increases (i.e., able participants profit as well from more processing time in case of difficult items). Finally, the direction of the RTAC would flip from negative to positive as item difficulty further increases, but sooner for less able and later for more able participants.
The interplay of the hypotheses of the current study is summarized in
Figure 2. We expected a positive average RTAC across items and persons (
H1). This correlation was expected to be moderated by person ability (
H2) and item difficulty (
H3). Item difficulty itself was expected to be determined by the number of rules employed in the items (
H4a). Given that and the moderating effect of item difficulty, number of rules should also moderate the RTAC (
H4b). Finally, we expected that the moderating effect of person ability and item difficulty interact and jointly determine the RTAC (
H5).
2. Experimental Section
2.1. Data Acquisition and Sample
We used the reference sample of version A of the Design a Matrix Test (DESIGMA; [
33]; see
Section 2.2) for our analyses. This sample was acquired via the WiSoPanel [
34]—a German online-panel [
35]. Participants were invited by e-mail and informed that we wanted to try out a new form of “brainteaser”. The term “intelligence test” was avoided to reduce possible reservations. As an incentive for participation we offered feedback concerning different aspects of performance in the study (e.g., number of correct responses, number of correct responses in a row, processing time). Participants could take part in the study by clicking on a personalized link which could only be used once and became invalid afterwards. If the test was interrupted before it was finished (e.g., due to connection problems), participants could resume with the next item by clicking the link again. At the beginning, participants saw an introduction in which they were instructed how to complete the test. After that they worked on the items. Last, they received the promised feedback. Information on gender, age and educational background of the participants was already available in the panel master data and was therefore not assessed in this study.
As the testing was not supervised, we decided to use a strict inclusion criterion and only used data from participants who did not show any missing values in the items. In total, 846 persons started the test. From this group, 51 (6.0%) showed missing values in 1–10 of the 38 items, 37 (4.4%) in 11–20 items, 110 (13%) in 21–30 items, and 170 (20.1%) in 31–37 items. These 368 participants (43.5%) were excluded from the analyses. The remaining 478 participants (56.5%) had an average age of 40.6 years (
SD = 13.7) and 307 (64.2%) were female. According to the International Standard Classification of Education (ISCED; [
36]) 4 participants (0.8%) had ISCED level 0 (no formal education), 38 (7.9%) ISCED level 1 (German Hauptschulabschluss), 106 (22.2%) ISCED level 2 (German Realschulabschluss), 158 (33.1%) ISCED level 3 (German Abitur), 156 (32.6%) ISCED level 7 (university degree), and 16 (3.3%) ISCED level 8 (doctorate).
2.2. Instrumentation
The DESIGMA [
33] employs the construction task—a constructed response item format for the presentation of figural matrices [
37,
38]. This format is presented in
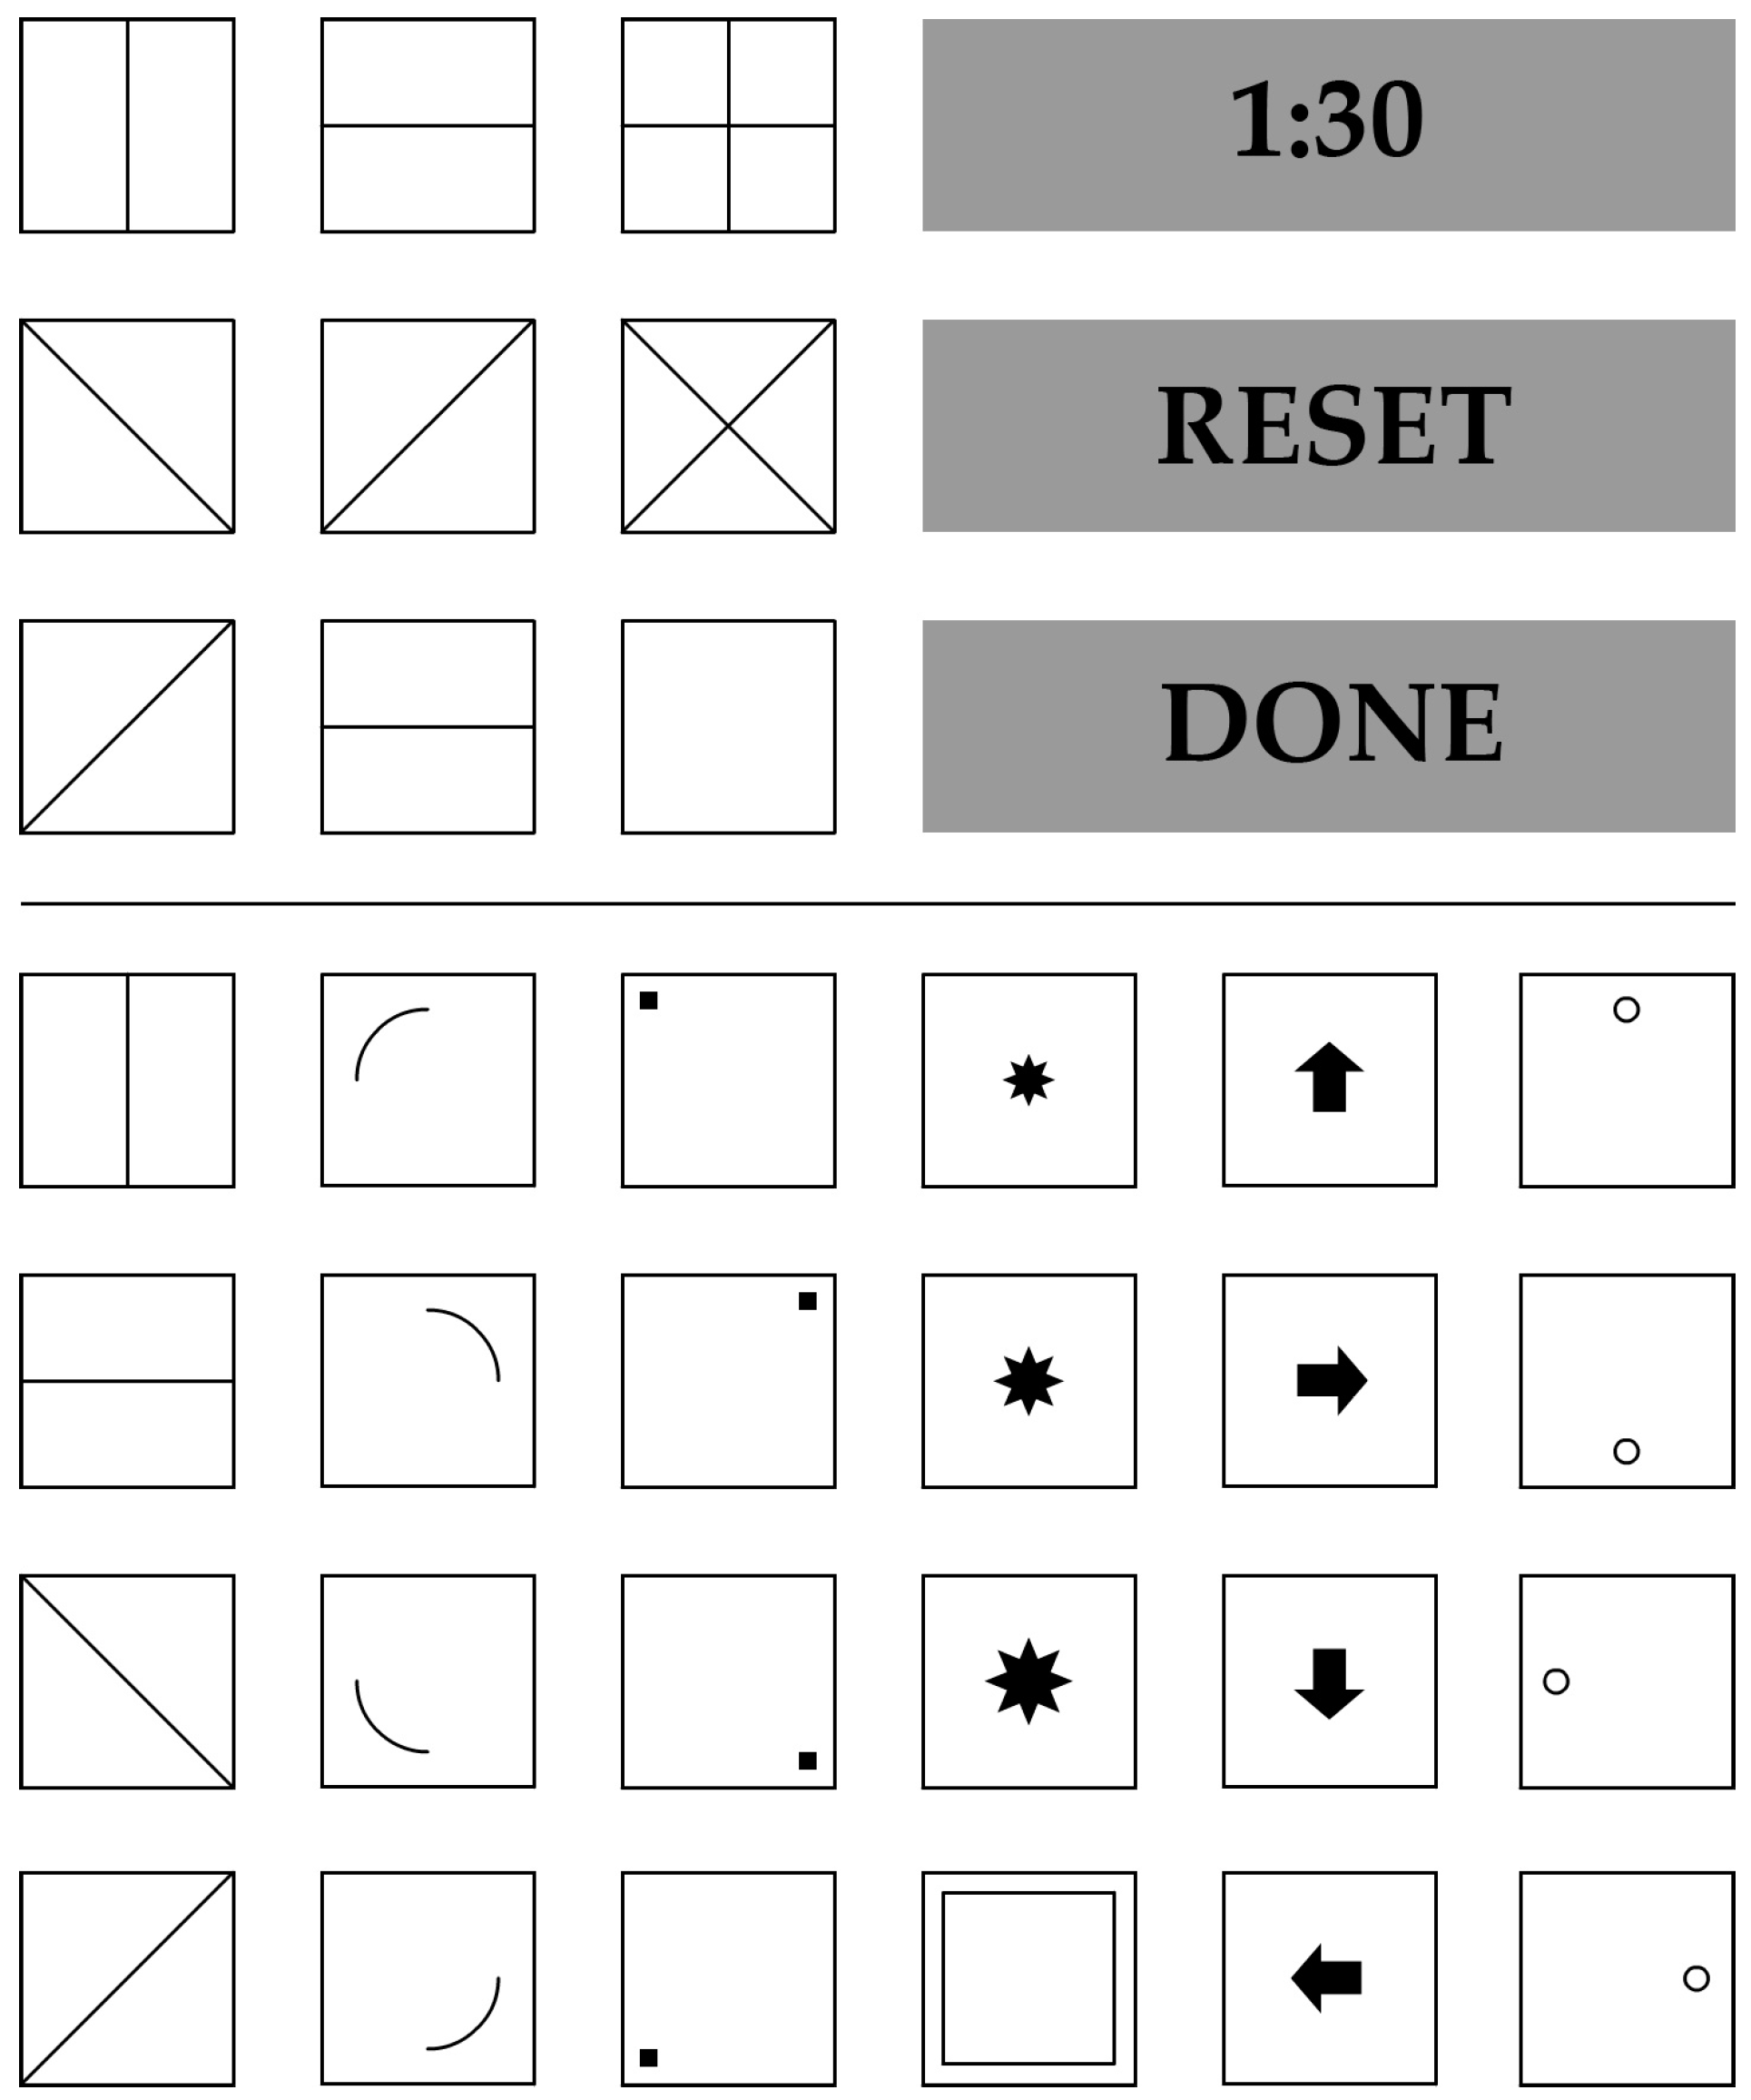
Figure 3. The item stem can be found above the horizontal line in the figure. The last cell is left empty and needs to be filled in by the respondent. The response format can be found below the horizontal line. It consists of 24 cells with geometric symbols that were used to construct the item stems. When the respondent clicks on one of the cells in the response format, the corresponding symbol appears in the solution cell of the item stem. When the cell is clicked again, the symbol disappears. Consequently, respondents can build all possible solutions to the matrix problems by clicking on the appropriate cells. The three grey buttons above the horizontal line indicate the remaining time and the two operations to be applied to the test (all labels in the figure were translated into English). Pushing the “RESET” button clears the solution cell. Pushing the “DONE” button confirms the current solution. At the moment when the time elapses, the solution currently contained in the solution cell is stored as the solution to the matrix.
We used the 38 items of version A of the DESIGMA [
33]. The items were constructed by applying six different rules: (1)
Addition: Elements in the first and second cell are summed in the third cell; (2)
Subtraction: The elements in the second cell are subtracted from the elements in the first cell. The remaining elements are presented in the third cell; (3)
Single element addition: Only elements that appear in either the first or second cell are presented in the third cell. Elements that appear in both the first and second cells are not presented; (4)
Intersection: Only elements that appear in both the first and second cell are presented in the third cell; (5)
Rotation: Elements are rotated across the cells; (6)
Completeness: The same set of elements is presented in every row of the matrix. Combinations of one to five rules were realized in the items (1 rule: items 1–6; 2 rules: items 7–21; 3 rules: items 22–31; 4 rules: items 32–36; 5 rules: items 37–38). The items showed a broad range of difficulty (0.10 ≤
p ≤ 0.96;
M(
p) = 0.39;
SD(
p) = 0.19). Reliability and validity of the test proved to be good (α = 0.96, factorial validity was based on the results of confirmatory factor analyses, criterion validity was based on substantial correlations with age, educational achievement, other measures of intelligence, and measures of working memory capacity). The DESIGMA is conceived as a power test. Nevertheless, a time limit of 90 s per item was implemented (each person had 90 s to work on every item no matter how long she/he had worked on the previous items) to ensure time economy and to guarantee that every respondent had the opportunity to work on every item. The time limit was determined on the basis of the response times observed in one of our previous studies [
37]. In that study, the vast majority of participants responded in well below 90 s, even when no time limit was given.
2.3. Statistical Analyses
Following Goldhammer, et al. [
2] (see also [
1]), we tested a
random item response time model within the generalized linear mixed model (GLMM) framework [
39] (see also [
40,
41]). Conceptually, this modeling approach is based on the 1-parameter logistic (1PL) item response model with fixed and random effects, as given in Model (1). Following conventions (e.g., [
42]), fixed effects are denoted in Greek characters, whereas random effects are denoted in Latin characters. The logit of the probability of a correct response (
ηpi) for a particular person and item is decomposed into a fixed general intercept (β
0) that corresponds to the logit of the probability of success in an average item completed by an average person. Additionally, random intercepts of person ability (
b0p) and item easiness (
b0i) are specified.
This model is extended by the RTAC, that is, the slope that describes to what extent the probability of successful completion is determined by the time taken by a person for the item (
tpi). Following Roskam [
7], log-transformed response times were entered as predictors, that is,
tpi = log(
RTpi). Again, a general fixed effect (β
0) is specified as well as random effects for persons (
b0p) and items (
b0i) in Model (2). The fixed effect of slope (β
1) is used to test whether the RTAC is positive on average (
H1). Note, however, that the interpretation of β
1 is equivocal, as its magnitude is determined both by person and by item characteristics [
4]. In order to test their specific contributions (
H2 and
H3), random effects of persons and of items are modeled simultaneously. This allows computing the RTAC by person (β
1 +
b1p) and the RTAC by item (β
1 +
b1i) as respective response time covariates [
2].
Finally, the number of task rules in the item (ri) is investigated as an explanatory variable of item difficulty (H4a). A possible effect of rule number as an item-level covariate would be reflected in a reduction of the random variance in item easiness. Additionally, rule number was tested as a possible moderator of the RTAC by introducing a fixed effect of task rule (β2ri) and a fixed interaction effect of number of task rules with response time (β3ritpi) in Model (3). The first captures the main effect of rule number on the probability to solve an item correctly, whereas the latter interaction term with item-time reflects the predicted moderation of the RTAC by rule number (H4b).
As we predicted that effects of item difficulty are affected by person ability (H5), we tested the three-way interaction of person ability (θp), of item easiness (σi), and of response time (tpi) on accuracy using a fixed-effects model with respective interaction terms. To this end, the partial-credit test score was used as a proxy of person ability (θp), and the observed frequency of solving an item was entered as a proxy of item easiness (σi). In a first step, we introduced both scores as covariates in Model (1), showing that they, indeed, accounted perfectly for the entire random variance in the random effects of person and item, respectively. Additionally, we tested that the scores were substantially correlated with the respective random intercepts in all other Models (1)–(3). Then, Model (4) was tested that additionally comprised interaction effects of the predictors.
All models were tested using the lme4 package [
43] for the statistical programming environment R [
44]. Unidimensionality of the DESIGMA items was tested with the supplementary item response theory (sirt) models package [
45], and the response time functions were plotted with the ggplot2 package [
46].
2.4. Preliminary Checks and Data Preparation
Local independence of the DESIGMA items was tested using Yen’s Q
3 statistic [
47]. The latter tests the absence of meaningful pair-wise correlations of item residuals after controlling for person ability and item difficulty. If the 1PL Rasch Model (1) holds, the Q
3 statistic is expected to be −1/(
n − 1), with
n = number of items in the test. In the present data, the empirical value of −0.029 (
SD = 0.070) perfectly matched the expected value of −0.029. Therefore, Rasch homogeneity can be assumed for the DESIGMA items.
Extreme response times were removed before running the GLMM analyses. Due to technical reasons in this online study, it could not be distinguished whether long response times corresponding with the maximum possible value indicated that participants responded in the last second of the response time window or whether they did not finish solution construction in time. As the latter appears to be more plausible in most of the cases, these items were considered invalid and discarded (6.01%). Additionally, values that were more extreme than the M ± 3SD of the log-transformed response times were removed from the remaining trials (0.86%).
DESIGMA items are constituted by differing numbers of rules: 6 items have one rule, 15 items have two rules, 10 items have three rules, 5 items have four rules, but only 2 items have five rules (see
Section 2.2). The probability of completing an item correctly decreased with increasing number of rules (i.e.,
p = 0.56,
p = 0.40,
p = 0.38,
p = 0.23, and
p = 0.19, for the 1–5 rules, respectively). Items with five rules were removed from the current analyses because of their low number and low solving probability to allow a more robust test of possible interaction effects of rule number (
H4b).
Log-transformed response times and the number of rules were grand-mean centered for the GLMM analyses. This transformation has the advantage that the estimated effects can be interpreted as the effect of the respective predictor when the other variables have an average value (i.e., zero).
3. Results
3.1. Average RTAC across Items and Persons (H1)
We predicted the RTAC to be positive on average: As reasoning items require effortful processing, the probability of success should increase with time. Contrary to predictions, Model (2) yielded no significant RTAC at the between-person level (β1 = −0.31, p = 0.13).
3.2. Moderation of the RTAC by Person Ability (H2)
Next, we inspected the random effects of Model (2) to test a possible moderation of the RTAC by person ability. There was a random effect of person in the intercept (Var(
b0p) = 6.94), indicating individual differences in ability. Additionally, there was a random effect of person in the slope (Var(
b1p) = 1.04), implying individual differences in the RTAC. Finally, both random effects across persons (intercept
b0p and slope
b1p) were negatively related (
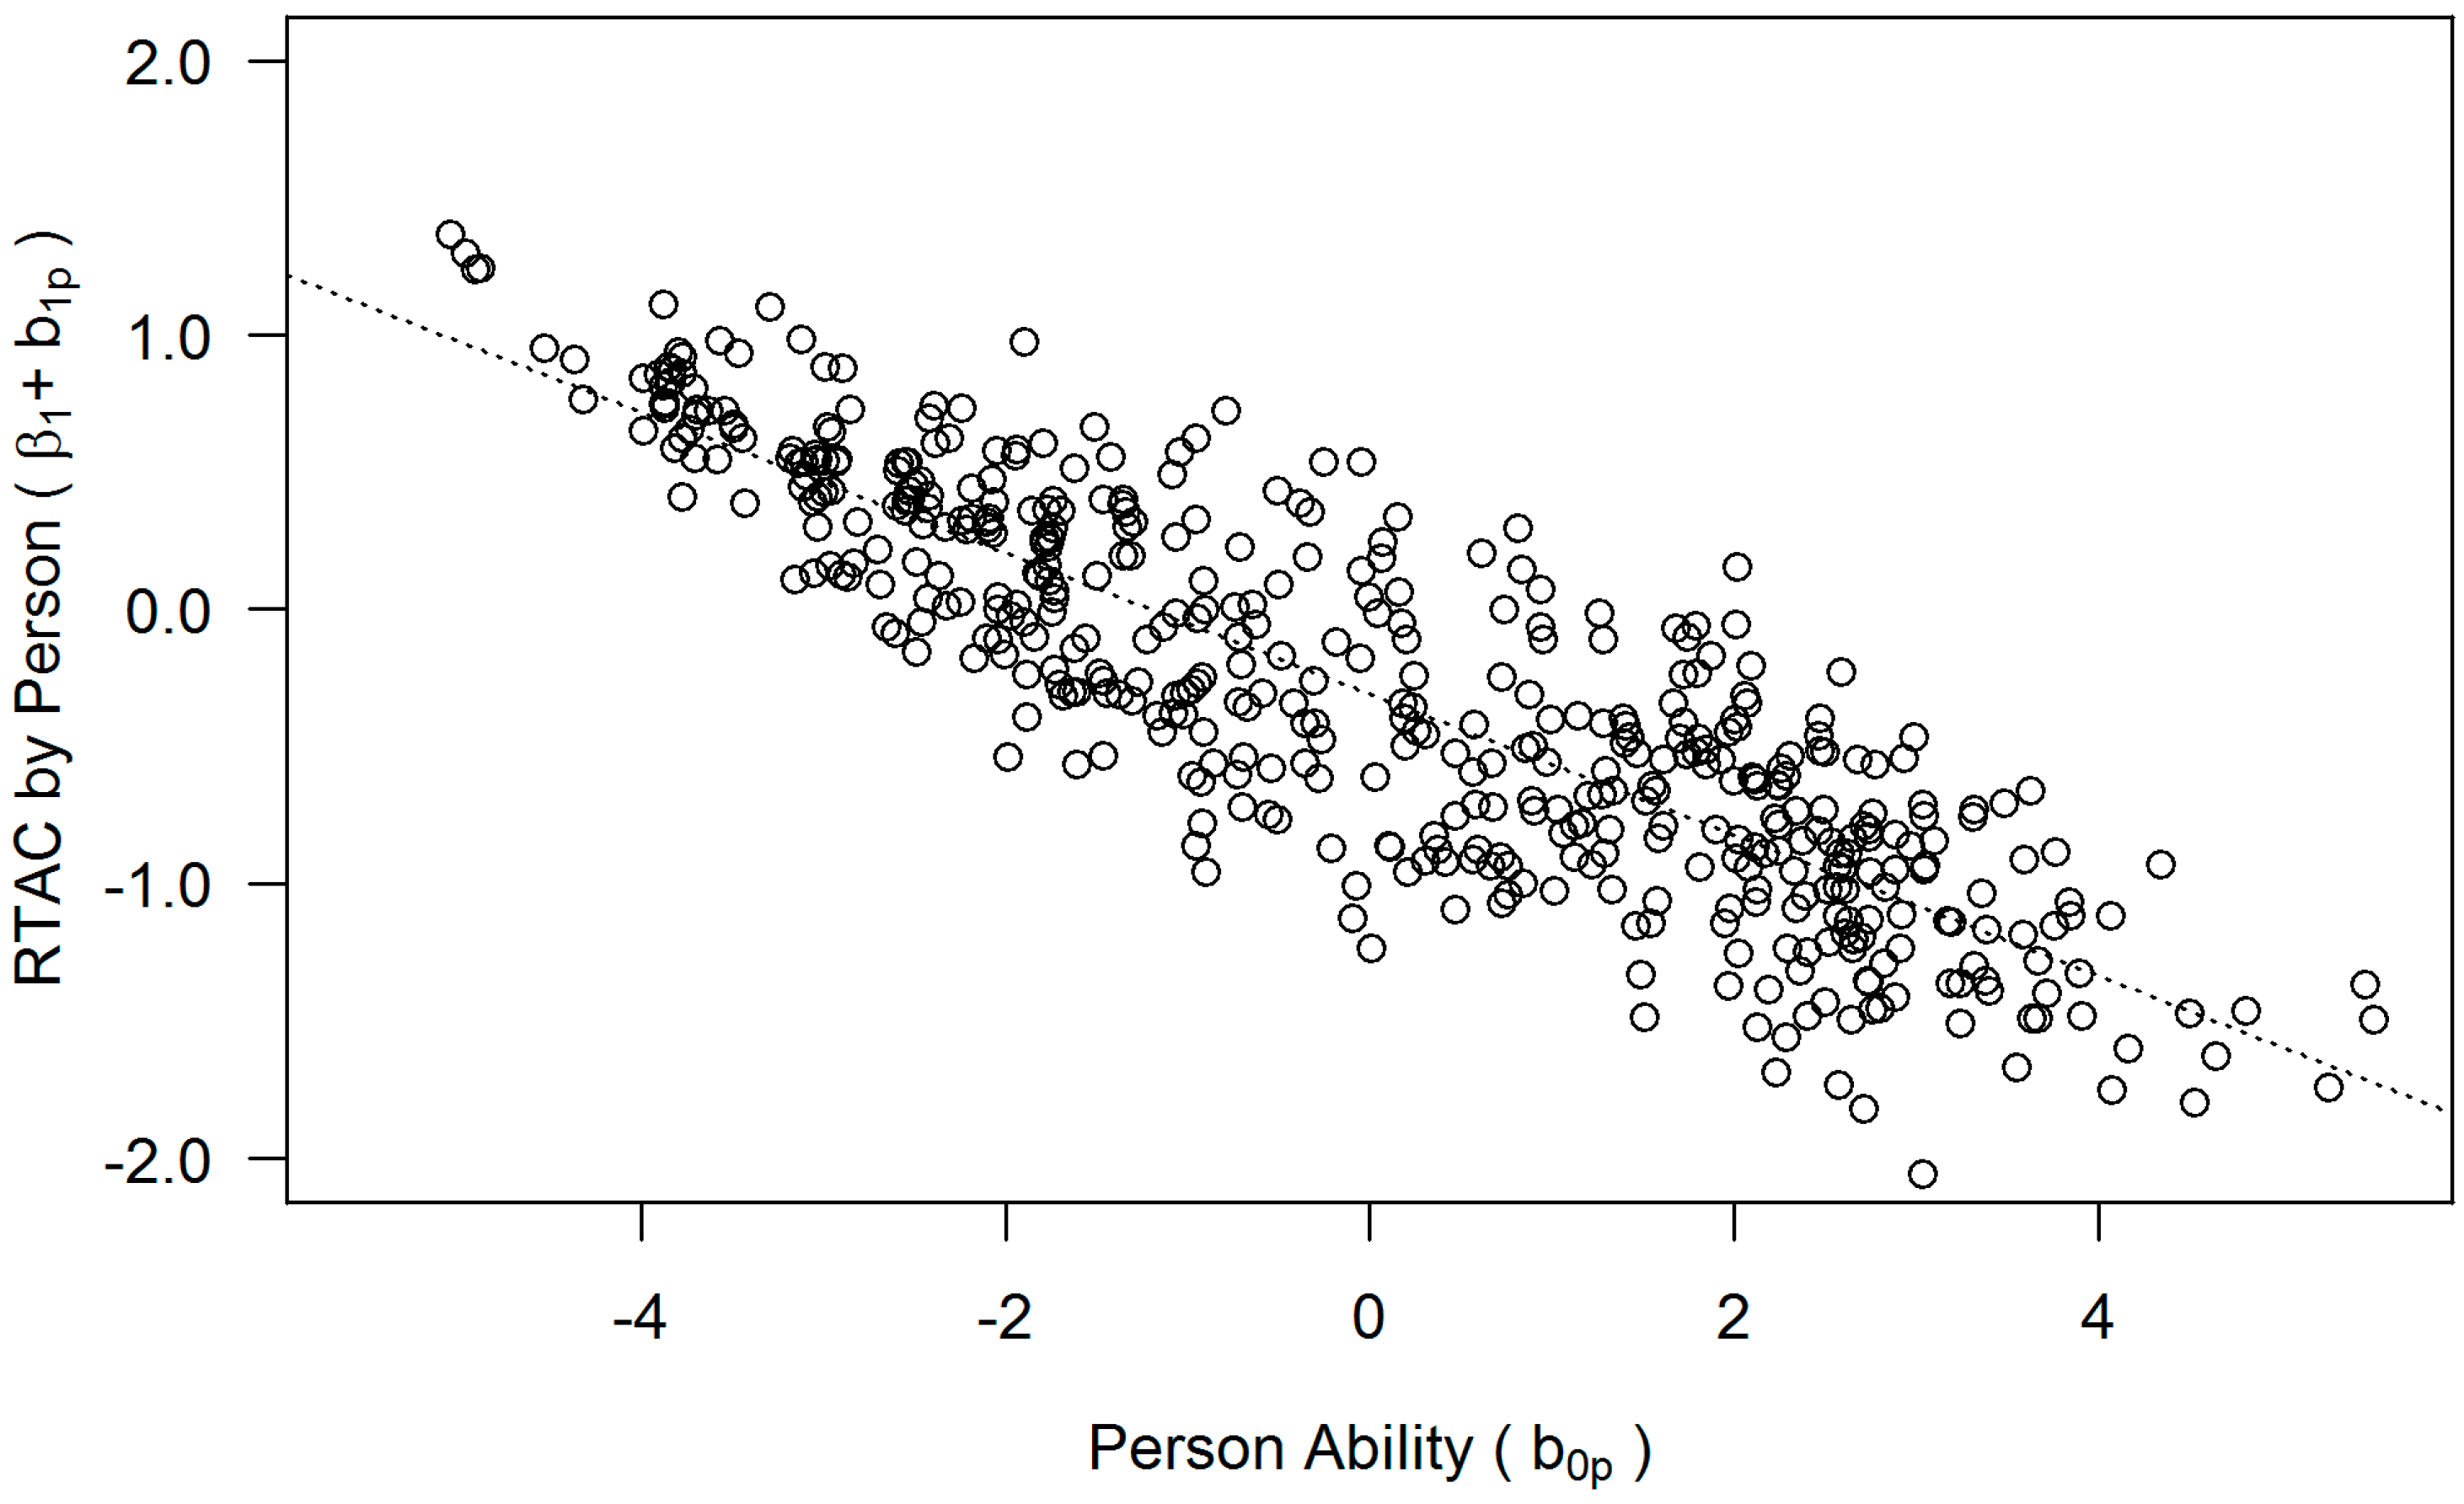
r = −.69), indicating that more able persons had more negative RTACs. This pattern is reflected in
Figure 4. While RTACs were around zero on average, the direction of the correlation linearly depended on person ability: More able persons showed a negative RTAC (i.e., they were more likely to give wrong responses at long RTs), whereas less able persons showed a positive RTAC (i.e., they were more likely to give correct responses at long RTs).
These effects were confirmed in a number of model comparisons. A restricted model without random slope across persons fit the data significantly worse: χ2(2) = 63.84, p < .001. In line with this, preferred lower information criteria were obtained for the full random effects model (AIC = 12,154, BIC = 12,216) compared with the restricted model without random person slope (AIC = 12,215, BIC = 12,261). Additionally, a model with both random effects across persons, but without a correlation between random intercept and random slope fit significantly worse: χ2(1) = 43.64, p < .001; AIC = 12,197, BIC = 12,250. This confirms the observed negative relationship of person ability with the RTAC.
3.3. Moderation of the RTAC by Item Difficulty (H3)
Similarly, we tested for a possible moderation of the RTAC by the random effect of item. There was a random effect of item in the intercept (Var(
b0i) = 2.58), indicating differential item easiness. There was a random effect of item in the slope (Var(
b1i) = 1.22), indicating differential RTACs across items. Finally, there was a negative relationship between these two random effects (
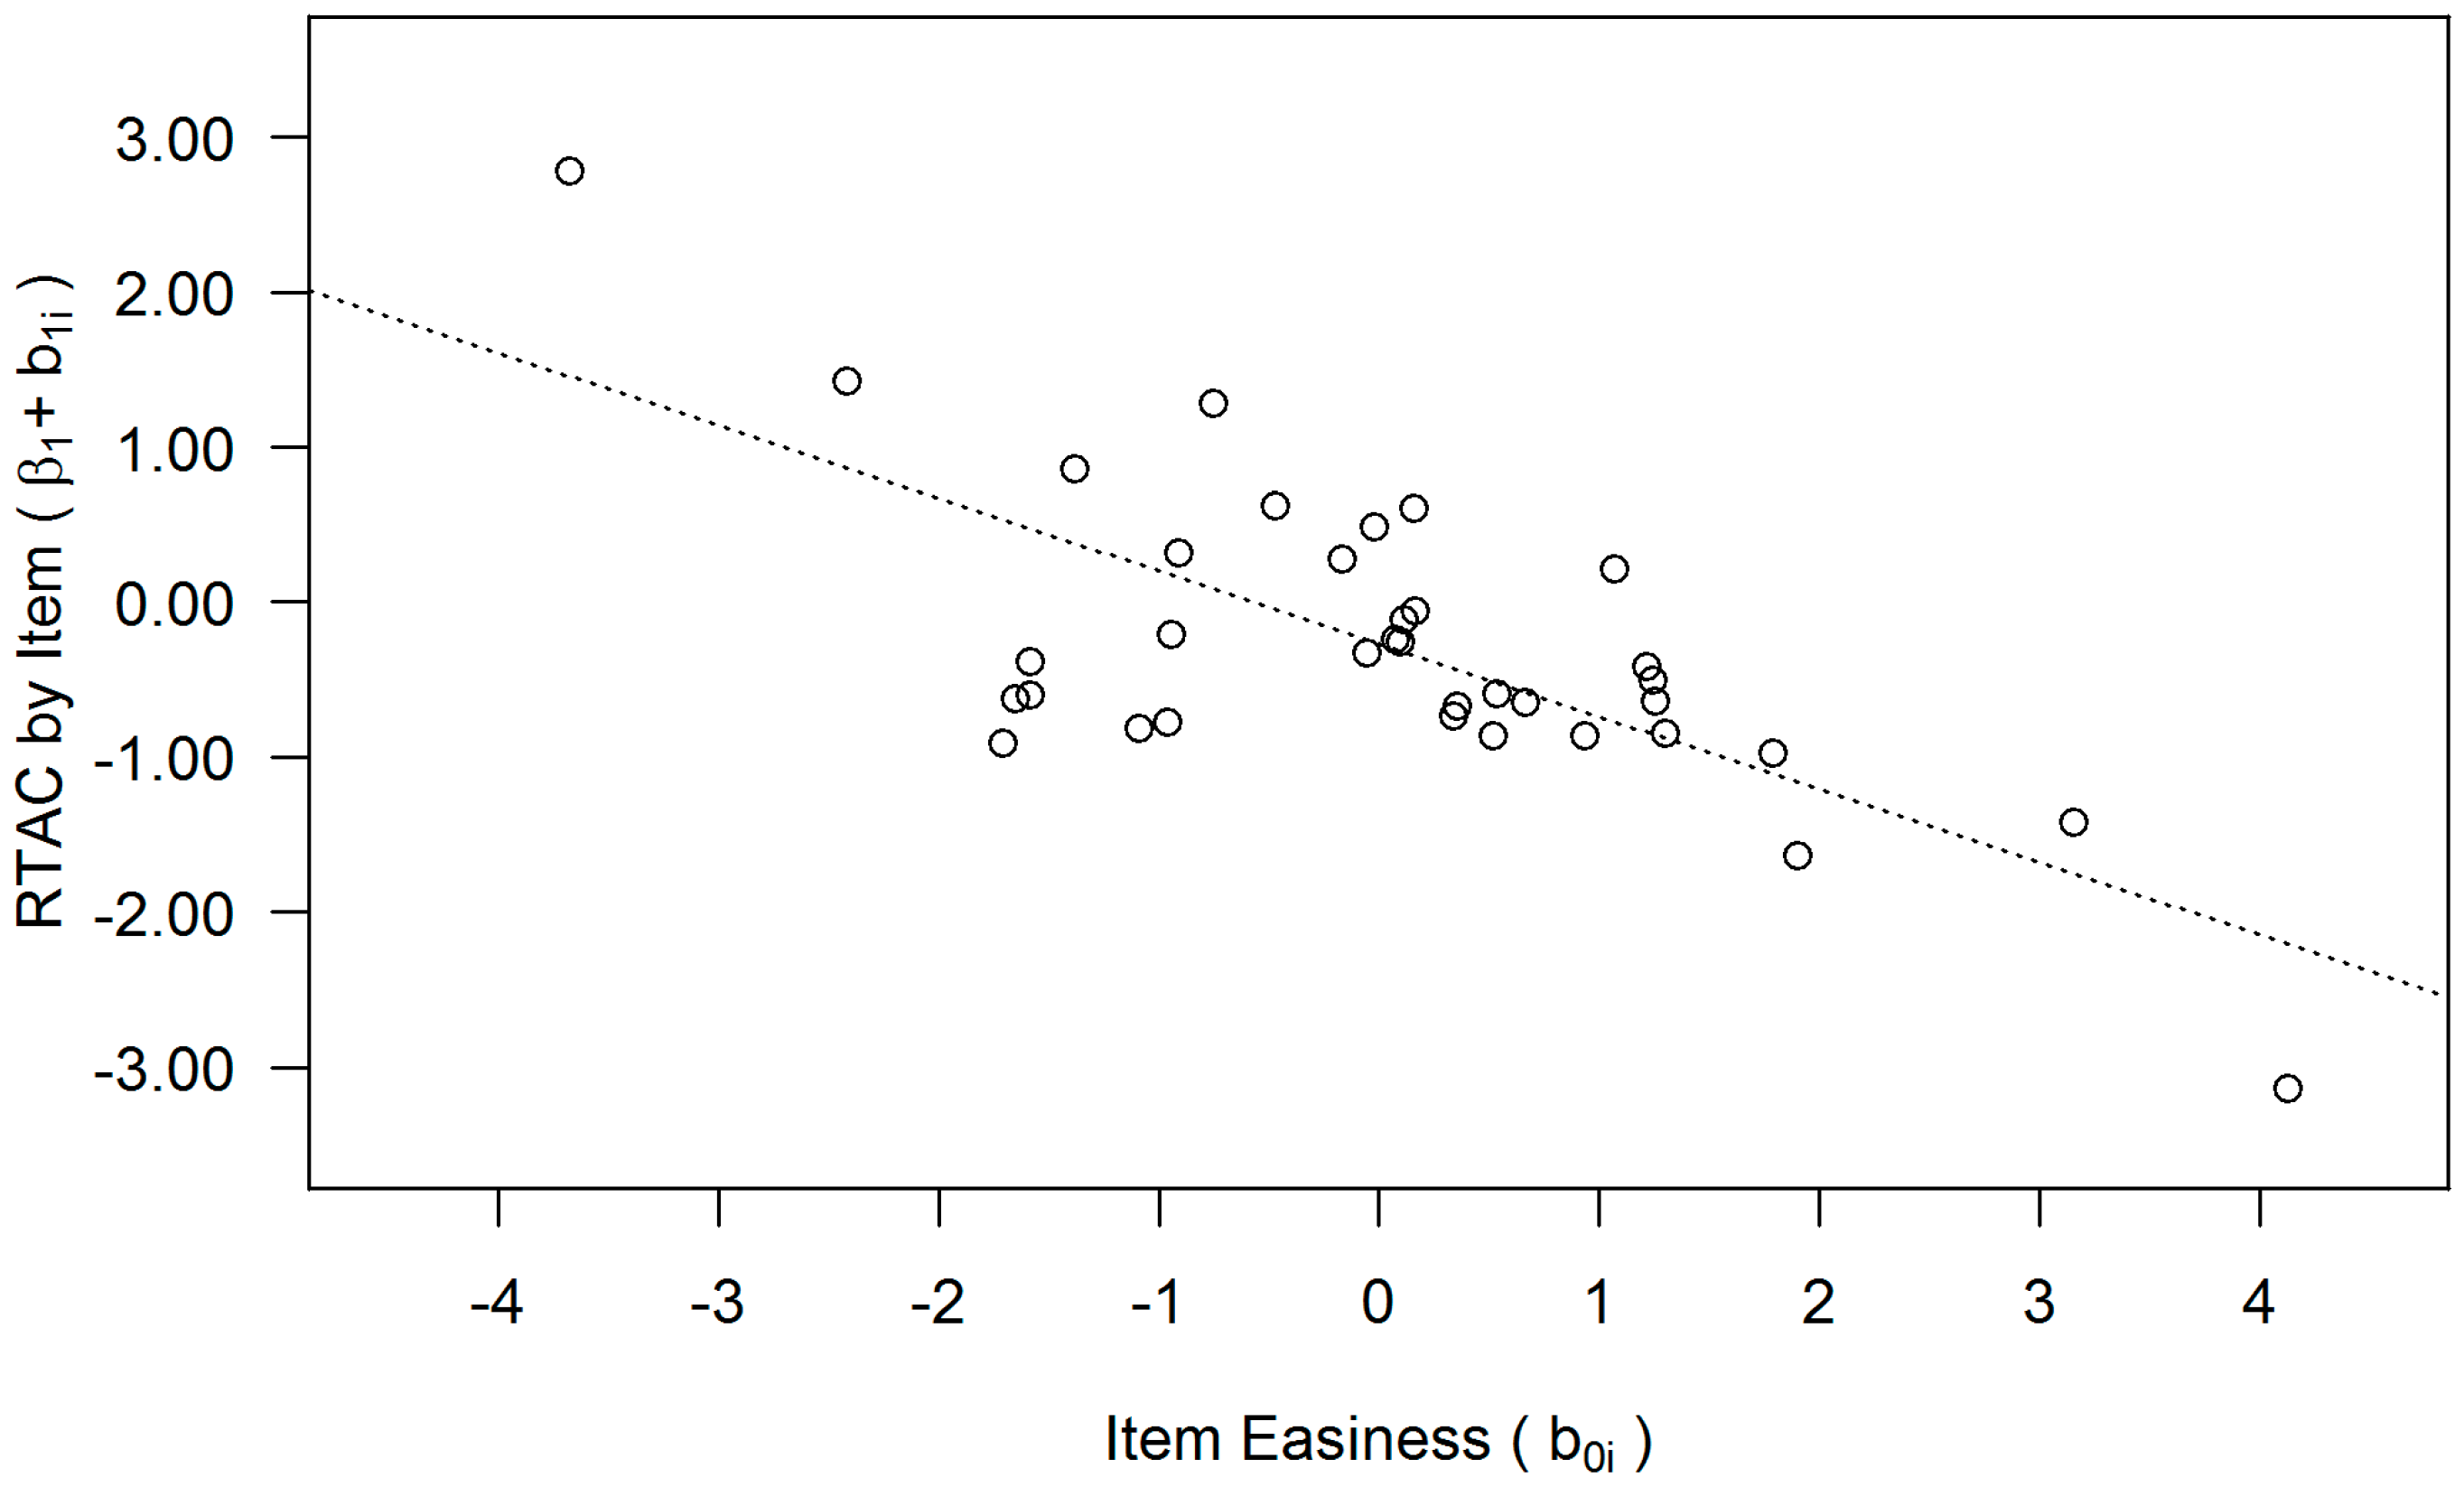
r = −.71), which indicates that the RTAC is more negative the easier the item.
Figure 5 illustrates this pattern. For easier items there is a negative RTAC (i.e., they are more likely to be answered wrong at long RTs). Conversely, for difficult items there is a positive RTAC (i.e., they are more likely to be answered correctly at long RTs).
These effects were confirmed for the item factor in a series of model comparisons. A restricted model without random slope across items fit significantly worse: χ2(2) = 160.84, p < .001. In line with this, preferred lower information criteria were obtained for the full random effects model (AIC = 12,155, BIC = 12,216) compared with the restricted model without random item slope (AIC = 12,312, BIC = 12,358). Furthermore, a model allowing both random effects across items but no correlation of random intercept and slope fit significantly worse compared to the full model: χ2(1) = 21.59, p < .001; AIC = 12,174, BIC = 12,228. This supports the notion that item difficulty moderates the RTAC.
3.4. Effect of Number of Rules (H4a and H4b)
As all items were derived from a reasoning test, we conceived item difficulty as primarily determined by the number of rules that constitute the correct response. First, we tested the prediction that item difficulty is (partly) determined by the rule number. To this end, the 1PL Rasch Model (1) was extended by the explanatory item-level covariate rule number. If rule number explains item difficulty, a reduction in the variance of the random intercept across items (Var(b0i)) will result as a testable prediction. In fact, the introduction of rule number as an item-level covariate reduced the variance of the random intercept across items from Var(b0i) = 3.07 to Var(b0i) = 2.38, which implies that rule number accounts for 22% percent of the item difficulty. Similarly, the variance in the random intercept in the response time of Model (2) dropped by 29% from Var(b0i) = 2.58 to Var(b0i) = 1.82 when rule number was introduced as a covariate in Model (3).
Second, we tested whether rule number moderates the RTAC. Model (3) yielded comparable results for those effects previously tested in Model (2). However, the negative fixed-effect of RTAC reached significance in this model (β1 = −0.30, p < 0.05). There were random intercept (Var(b0p) = 6.90) and slope (Var(b1p) = 1.05) effects across persons, and both were negatively related (r = −0.68). Additionally, there were random intercept (Var(b0i) = 1.82) and random slope (Var(b1i) = 0.29) effects across items, and both were negatively related (r = −0.55).
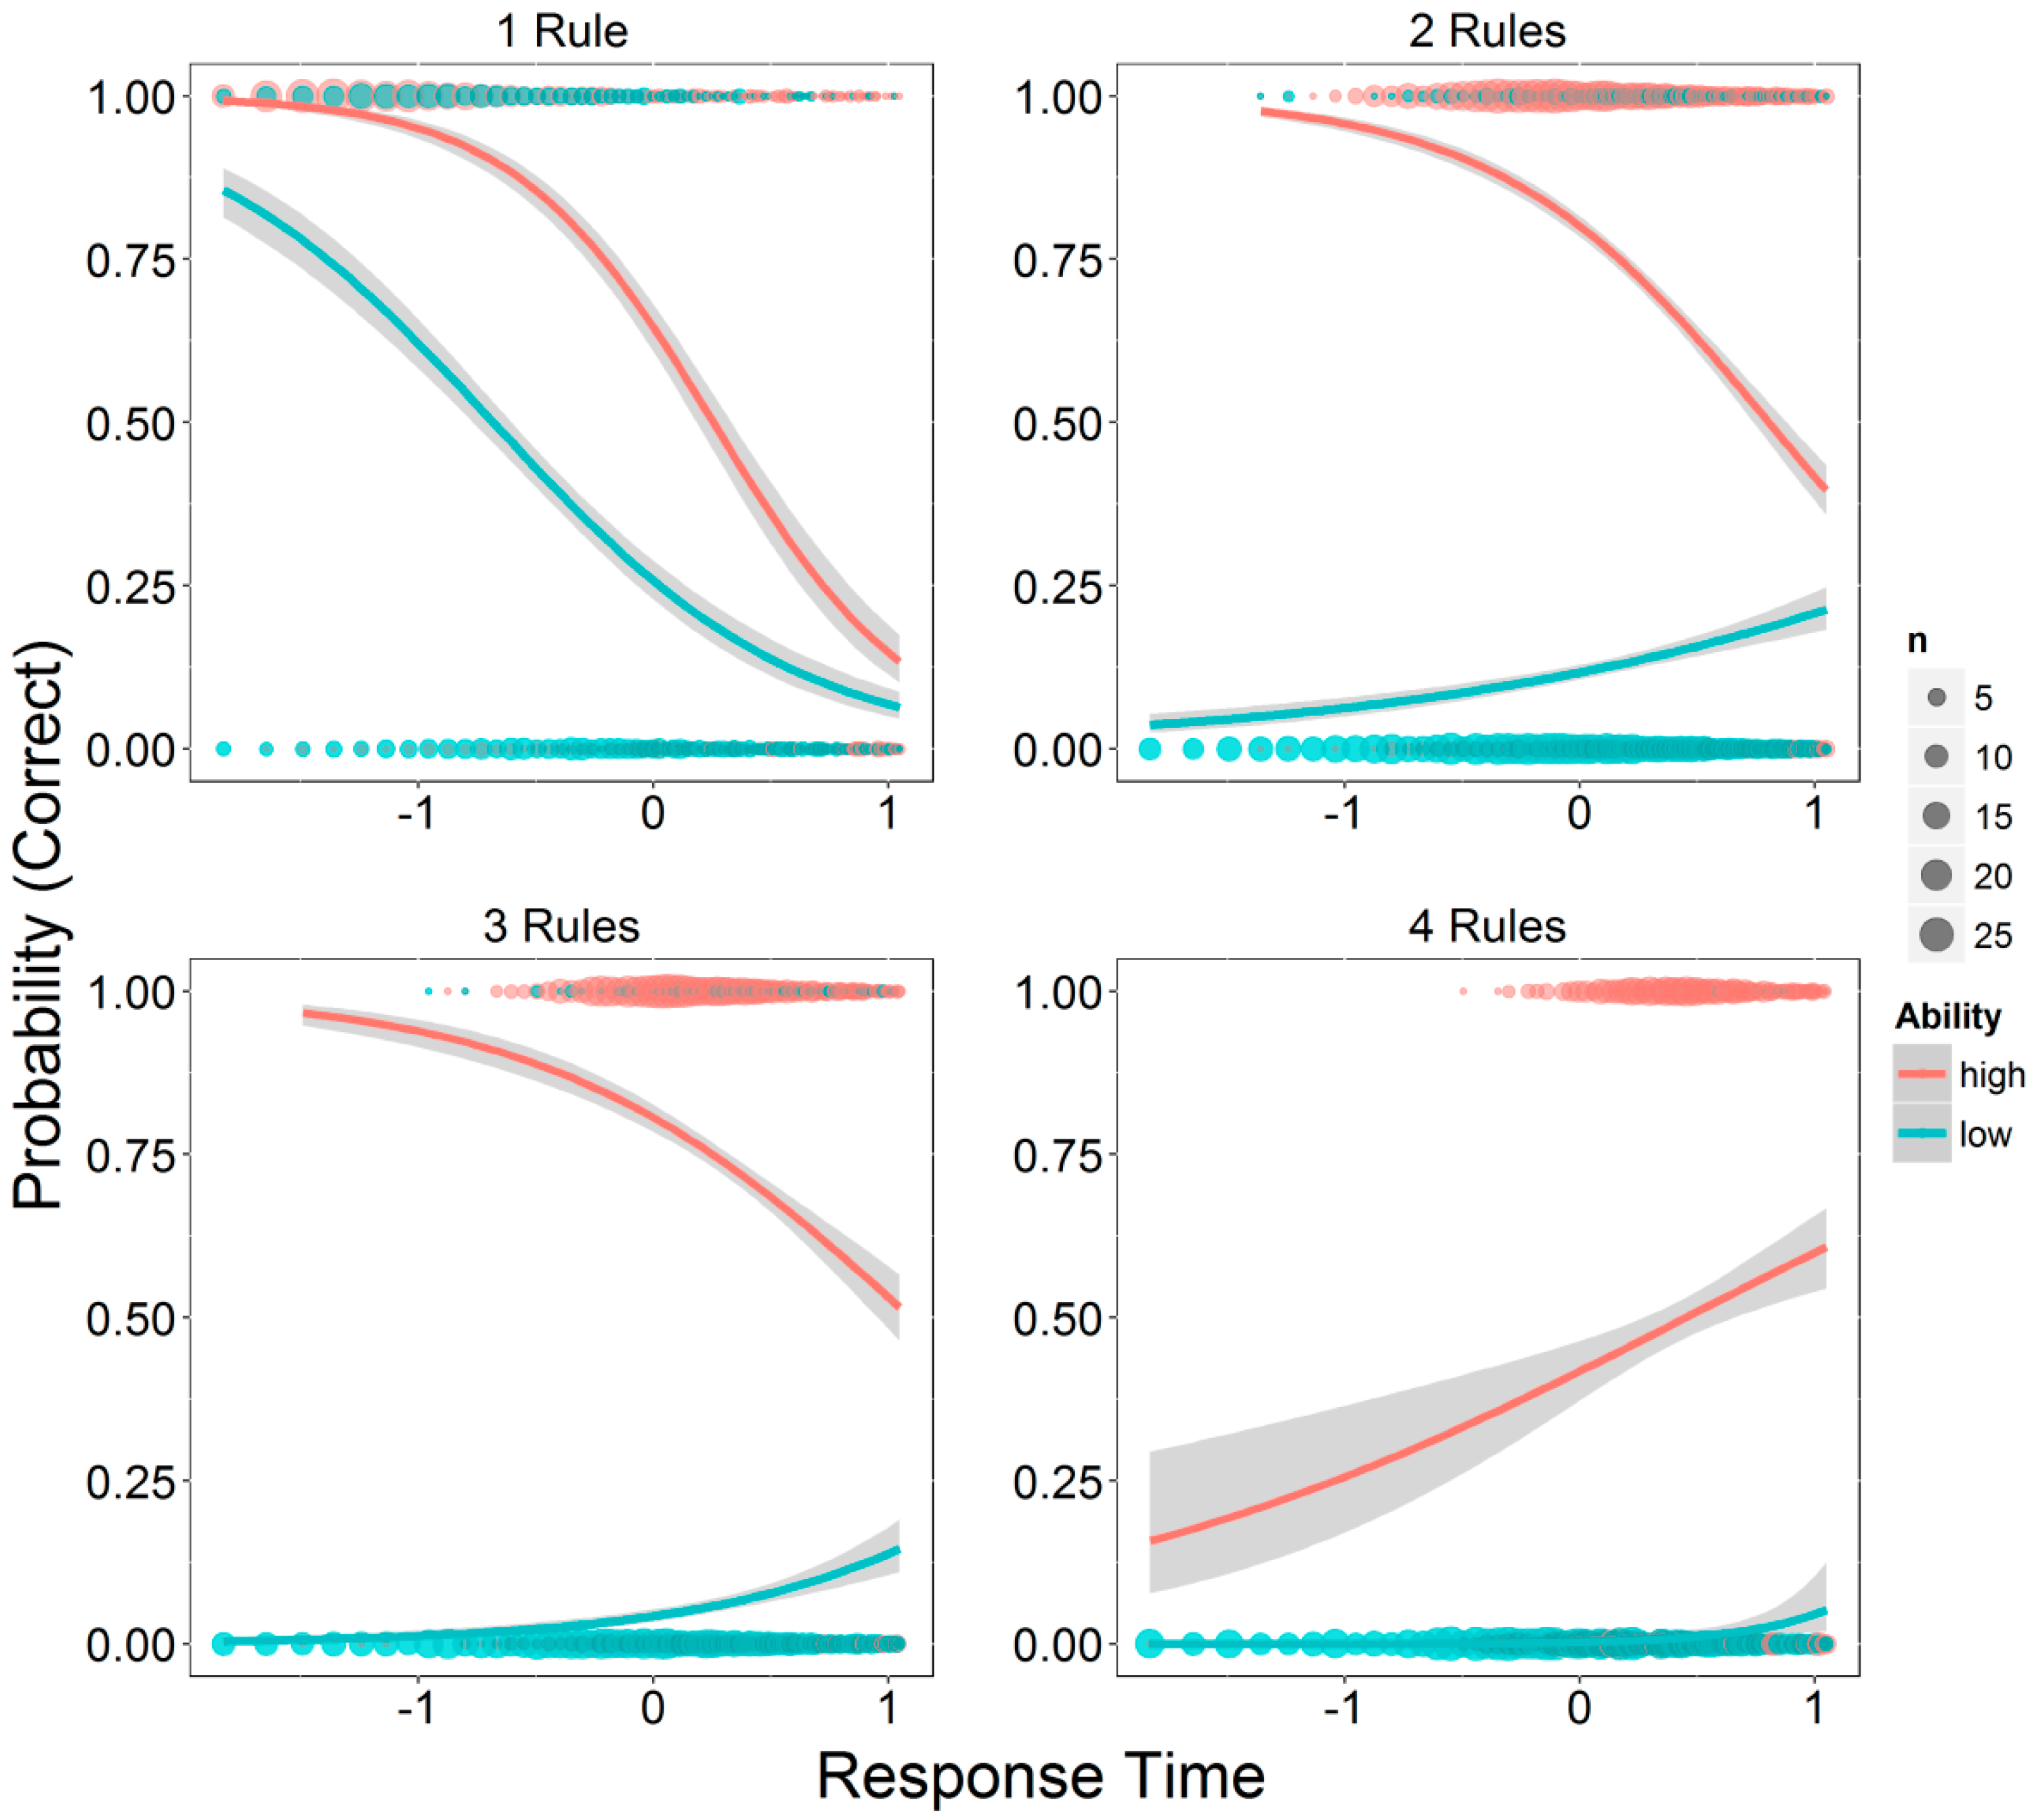
Importantly, Model (3) showed a negative fixed effect of rule number (β2 = −0.98, p < 0.001), indicating that by adding one more rule the logit of a correct response is decreased by −0.98. Additionally, there was an interaction effect of rule number with response time (β3 = 1.00, p < .001), which implies that item difficulty moderates the RTAC. At an average value (i.e., zero) of the by-person and the by-item adjustments, the RTAC would be −0.29, −0.09, 0.13, 0.33 for one to four rules, respectively (i.e., when entering the corresponding values of the centered rule number variable), indicating a negative RTAC for items with low difficulty and a positive RTAC for items with high difficulty. This means, for simple items (with just one rule), fast response times were associated with correct responses. In contrast, for very complex items (with four rules), slow response times were associated with correct responses.
3.5. RTAC as a Function of Item Difficulty and Person Ability (H5)
The last hypothesis specifies an interaction effect of item difficulty and person ability as determinants of the RTAC. The predicted three-way interaction effect was tested using manifest proxy variables of person ability and of item easiness in a fixed-effects model. The DESIGMA total score (i.e., the number of correctly solved items) was entered as a proxy of person ability, whereas the observed probability of solving the item was entered as an index of item easiness.
To make sure both observed scores could be used as close proxy variables of the corresponding latent person and item effects, we introduced both scores as covariates into the mixed effects IRT Model (1). As would be expected in the case of Rasch homogeneity, the observed scores perfectly accounted for the random effects in person and item intercepts, reducing their variances virtually to zero. Consequently, a model with only the fixed effects but without random effects (AIC = 10,566, BIC = 10,589) was preferred to the full model with random effects and covariates (AIC = 10,570, BIC = 10,609). Additionally, the manifest total score was substantially related to the latent ability parameters (i.e., random intercept across persons) in Models (1)–(3) (r = 0.98, in all models). Similarly, the manifest frequencies of solving the items correctly were substantially related with the random intercept of the items (r = 0.99, 0.97, and 0.83, in Models (1)–(3), respectively).
Next, we tested the predicted interaction effects of these fixed factors by fitting Model 4. The observed effects confirmed previous findings. There was no general RTAC (β1 = −0.09, p = 0.14). There were (trivial) main effects of item easiness (β2 = 8.89, p < .001) and of person ability (β3 = 7.69, p < .001). There were negative interaction effects of item response time with item easiness (β4 = −1.847, p < 0.001) and with person ability (β5 = −1.84, p < 0.001). The interaction of item easiness and person ability was positive (β6 = 0.67, p < .001). Finally, there was the predicted three-way interaction of person ability, response time, and item easiness (β7 = 2.00, p < 0.05).
This higher-order interaction effect is illustrated in
Figure 6: If item difficulty is very low (1 rule), negative RTACs are observed that are comparable for more able and for less able participants. This means, fast responses generally tend to be accurate, whereas error-probability increases with longer response times. At an intermediate level of item difficulty (2 and 3 rules), there is still a negative RTAC for more able persons. By contrast, less able persons appear to profit from more processing time, as indicated by positive RTACs in the latter group. Finally, if item difficulty is very high (4 rules), the RTAC also flips for more able persons, and they also appear to profit from additional processing time.
4. Discussion
This study provided an empirical test of the assumption that the direction of the RTAC (positive vs. negative) can change substantially within a single task paradigm. Task complexity, which represents the interaction of item difficulty and person ability, was assumed to be the major determinant of the direction of the RTAC. Going beyond previous research, we used a sample that showed considerable variance concerning educational background. Furthermore, we employed a figural matrices test that shows a broad range of item difficulties and uses a constructed response format, which reduces the potential influence of inconsistency between response options.
Specifically, we tested the hypotheses that (H1) the RTAC is positive on average, (H2) that person ability moderates the RTAC, (H3) that item difficulty moderates the RTAC, (H4a) that the number of rules contributes to item difficulty, and (H4b) that the number of rules moderates the RTAC. Finally, it was tested (H5) that item difficulty and person ability interact, and jointly determine the RTAC.
Disconfirming H1, our results indicate the absence of a significant RTAC across items and persons. All other hypotheses were confirmed by the present results. Able respondents showed a negative RTAC, whereas less able respondents revealed a positive RTAC. Analogously, the RTAC was negative for easy items with only a few rules, whereas a positive RTAC was obtained for difficult items with more rules. Most importantly, the moderating effect of number of rules interacted with person ability. For simple items, negative RTACs were observed for participants with high and with low ability. With increasing item difficulty, the RTAC flipped to the positive direction. However, its direction was reversed earlier for less able than for highly able participants. For very difficult items, persons with high ability showed a positive RTAC as well. This predicted interaction confirms that the direction of the RTAC is a function of task complexity. In turn, task complexity is determined by the interaction of item difficulty and person ability.
4.1. Discussion of the Dual Processing Account of Response Time Effects
The results obtained in this study support the dual processing theory of response time effects. Going beyond previous findings [
1,
2,
26], we were able to show that task complexity substantially moderates the
direction of the RTAC. The theoretical implication of this finding is that reasoning assessed by figural matrices tests seems to be a task paradigm in which both automatic as well as controlled processing occurs. Therefore, the processing mode is not determined by the task paradigm itself but by task complexity: If task complexity is low (easy item, able respondent) processing runs in an automatic mode, whereas if task complexity is high (difficult item, respondent with low ability) processing runs in a controlled mode. In
H1 we expected the overall RTAC to be positive as figural matrices are assumed to be solved predominantly by controlled processing but interestingly the correlation did not differ significantly from zero. This result even strengthens our assumptions since within the paradigm of figural matrices there is no RTAC if task complexity is held constant. Therefore, it is likely that previously observed dissociations among different task paradigms actually reflect differences in task complexity. The analyses of Goldhammer et al. [
1] indeed showed that the reading items were substantially easier than the problem solving items. Given the fact that the difficulties were estimated in the same sample (i.e., with the same average ability) task complexity for the reading test was lower than for the problem solving test. As already mentioned, Goldhammer et al. [
2] used a test with a low mean item difficulty and a sample that can be assumed to have an above-average ability. Therefore, differences of RTACs found in these studies might be explained by differences in task complexity.
4.2. Task Complexity and Cognitive Load
Hitherto, we have not discussed how task complexity actually emerges at task level.
Cognitive load as a function of relevant task rules in conjunction with individual differences in cognitive resources is a plausible account. According to cognitive load theory [
48,
49,
50], the intrinsic cognitive load of an item results from the elements that need to be considered when solving it. Items with many elements and a high degree of interactivity possess high intrinsic cognitive load. If there are only a few elements with no interactivity, there is less intrinsic cognitive load. In the context of figural matrices, the number of elements equals the number of geometric symbols used in the matrix. The degree of interactivity is constituted by the number of rules. If a matrix item employs two or more rules they overlap, and the respondent constantly needs to inhibit figural elements of the rules that are currently not processed.
According to Paas and van Merriënboer [
51] (see also [
52,
53]), three empirical indicators of cognitive load can be distinguished:
Mental load represents the cognitive load a particular item poses for a particular respondent.
Mental effort is the amount of cognitive capacity the respondent invests into solving the item.
Performance is an outcome measure and reflects if the item was solved correctly. The amount of intrinsic cognitive load that a respondent is able to process is determined by the respondent’s working memory capacity and general mental ability. An item with given cognitive load therefore generates higher mental load for a low ability respondent and lower cognitive load for a high ability respondent. Thus, a low ability respondent has to invest a higher amount of mental effort to show the same performance as a high ability respondent. If the mental load an item generates for a low ability respondent cannot be compensated by mental effort his/her performance will be worse than the performance of a high ability respondent for whom the mental load generated by the item is lower.
According to the Time-Based Resource-Sharing Model (TBRS; [
54,
55]), cognitive load is also a function of the time during which a given element captures attention. The main assumptions of the TBRS are that (1) processing and maintenance of information rely on the same limited resource; (2) many of the elementary operations involved in processing and maintenance can only take place one at a time; (3) information that receives attention is activated, but as soon as attention is switched away the activation decreases; and (4) the sharing of attention is achieved through rapidly and constantly switching the focus of attention. Figural matrices are tasks that permit switching between information (i.e., elements and rules). If a respondent is able to deal with the cognitive load of an item (i.e., low mental load) the solution can be inferred in a holistic fashion. In this case the respondent would switch between all elements of the matrix. If the cognitive load of an item overextends the respondent’s ability (i.e., high mental load), mental load can be reduced by changing from a holistic to a stepwise strategy. In this case, the respondent would only switch between elements of one rule until an appropriate solution is found and then move on to the next rule.
4.3. An Illustrative Example of Cognitive Load
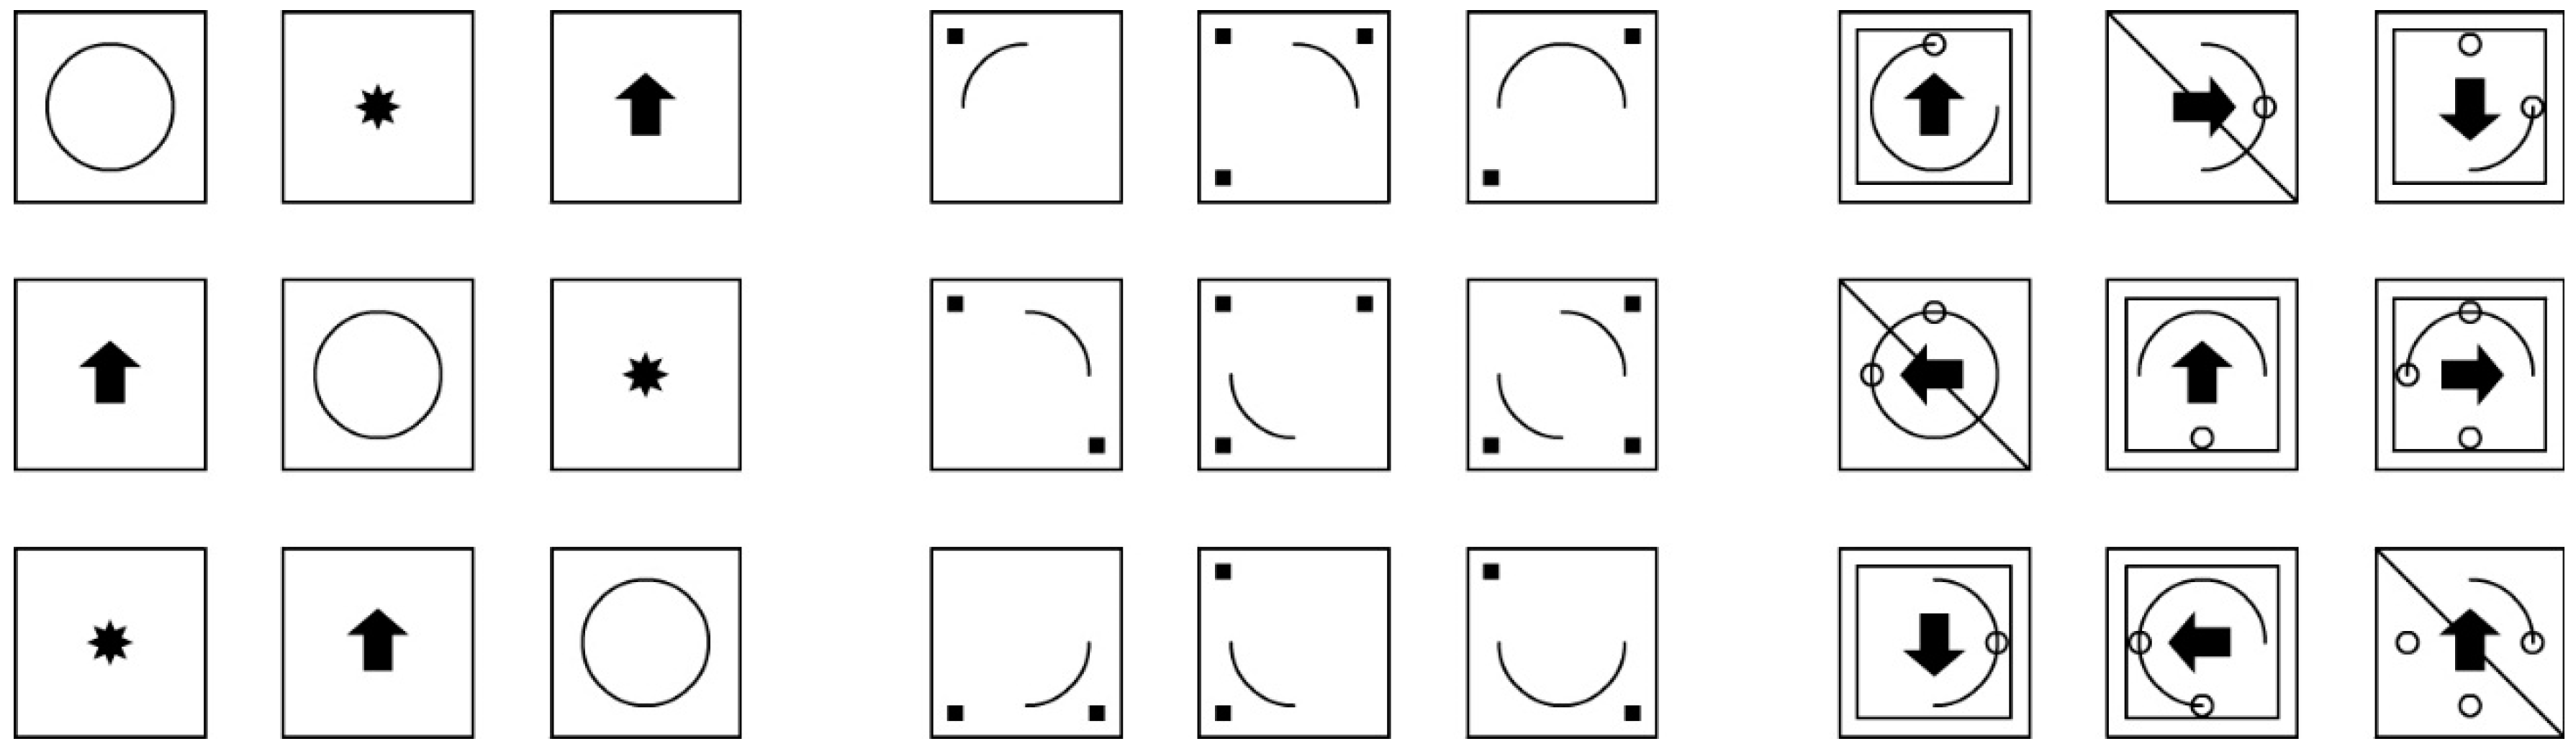
We will illustrate the idea of cognitive load with three items as displayed in
Figure 7. Item 3 was the easiest item in the test (
p = 0.96). It employs only the completeness rule (a circle, a star, and an arrow are displayed in each row/column of the matrix). As interactivity between the figural elements of different rules does not emerge and switching between rules is not necessary (nor possible) the intrinsic cognitive load of the item is rather low and it will generate low mental load even for low ability respondents. The difficulty of Item 18 (
p = 0.41) resembles the mean difficulty of the test:
M(
p) = 0.39. Two rules were realized in the item: the addition rule (circle segments that appear in the first and second cell of a row are summed up in the third cell) and the single component addition rule (squares that either appear in the first or second cell of a row but not in both are displayed in the third cell of the row). As the respondent needs to inhibit the figural elements of one of the rules while processing the other one, the degree of interactivity and therefore the intrinsic cognitive load is higher than in Item 3. As the item generates low mental load for high ability respondents they may be able to infer both rules in a holistic fashion. To show the same performance, low ability respondents for whom the item generates higher mental load will most likely need to infer both rules consecutively what is associated with higher mental effort and longer response times. Item 32 had the highest difficulty in the test (
p = 0.10). In the item the four rules completeness (two squares and a diagonal line are presented in every row/column of the matrix), rotation (arrows are rotated by 90° throughout the rows), addition (small circles in the first and second cell of a row sum up in the third cell), and intersection (circle segments that appear both in the first and second cell of a row are presented in the third cell of the row) were realized. While processing one of the rules, the figural elements employed in the other three rules need to be inhibited. Therefore, the degree of interactivity for Item 32 is higher than for both Item 3 and 18. Also, switching between the rules is harder than in Item 18 because only some of the inhibited figural elements need to be activated while others need to remain inhibited. As the item can be expected to cause high mental load even for respondents with high ability they (as well as low ability respondents) will have to break the solution process down into a number of time-consuming sequential steps.
4.4. Cognitive Load Theory as an Extension of the Dual Processing Account
Taking these lines of reasoning together, the notion of cognitive load can be considered a valuable extension of the dual processing theory of response time effects as it provides a notion of the cognitive mechanisms that lead to automatic and controlled processing. Items with
low cognitive load, that is, items that contain only few elements without any interactivity (e.g., Item 3 in
Figure 7 and the reading items employed by Goldhammer et al. [
1]) do not require excessive cognitive resources and generate a low amount of mental load even for low ability respondents. These items can be expected to be solved in an automated fashion by all participants. Occasionally slow response times may indicate lapses of attention or a misunderstanding of the item. Consequently, negative RTACs would result for items that cause low cognitive load. Items with
high cognitive load, that is, items that contain many elements with a high degree of interactivity (e.g., Item 32 in
Figure 7 and the problem solving items employed by Goldhammer et al. [
1]), likely exceed cognitive resources of all respondents and have to be solved in a controlled and sequential fashion as mental load is high. In fact, a reduction of mental load can be achieved by a controlled processing strategy that consists of switching between elements in order to identify groups of elements that follow the same rule (i.e., perceptual analysis [
19]) and analyzing the rules employed in the different element groups (i.e., conceptual analysis [
19]) in a stepwise fashion with frequent pauses. As switching between elements and pauses are time-consuming but also increase the probability to solve the item correctly a positive RTAC would result for items that cause high mental load. Finally, items with
intermediate cognitive load can be expected to exceed the cognitive resources of respondents who are low in ability causing high mental load for them but not of respondents who are high in ability causing low mental load for them. Consequently, a positive RTAC would result for the first and a negative RTAC for the latter group. In sum, we suggest that the RTAC reverses its direction when the mental load generated by the item exceeds available cognitive resources of the respondent.
5. Limitations and Outlook
It needs to be discussed that we used a test with a constructed response format and did not find a significant overall RTAC, whereas Goldhammer et al. [
2] who used a matrices test with predefined response options found a negative RTAC. On the one hand, the degree to which inconsistency between conclusion (distractor/response option) and evidence (stimulus) can occur obviously differs between both of these tests. Nevertheless, we would not argue that the difference between the RTACs in both studies is a proof of the inconsistency hypothesis because the range of item difficulty and the range of person ability differed between the two studies, as well. As task complexity was shown to be a major determinant of the RTAC, the difference in outcomes of the two studies may be solely due to differences in task complexity. On the other hand, it might be the case that respondents resort to guessing when their ability does not suffice to solve the items analytically (in this case, guessing which figural elements might be correct). It has to be noted that this is not problematic with regard to the other results of our study because, if anything, our results would be just as distorted due to inconsistency as the results by Goldhammer et al. [
2]. A direct test of the inconsistency hypothesis would involve at least two tests that differ in response format (one with a constructed response format and one using predefined response options) that show a comparable range of item difficulties and that are presented to the same sample of respondents (or at least two samples with a comparable range of person abilities).
One limitation of the current study is that the data were collected online in an unsupervised setting. Therefore, we cannot ensure that objectivity was given for all of the participants (e.g., there might have been occasional disturbances from the surroundings or technical problems). Nevertheless, some substantial arguments speak to the validity of our data. First, we applied a strict inclusion criterion and used only participants who did not produce missing values. Given that disturbances lead to missing values, it is most likely that problematic cases were discarded. Furthermore, the test showed good psychometric properties (see
Section 2.2) that were comparable to results of the same test obtained in a laboratory setting [
37,
38]. Likewise, our results closely resemble those obtained by Goldhammer et al. [
2] who gathered their data in a laboratory setting. Therefore, we conclude that the setting did not substantially affect the validity. This assumption is strengthened by Preckel and Thiemann [
56] who demonstrated that the results of the same matrices test obtained in a laboratory and an online setting were highly comparable.
Another limitation pertains to the absence of a direct indicator of processing mode in the present study (as well as in Goldhammer et al. [
1,
2]). Therefore, the assumed switch in processing mode could not be tested directly. Employing a strategy that allows a direct dissociation between automatic and controlled processing is an important research endeavor for the future. A promising approach would be to measure
changes in pupil dilation while solving the items. Changes in pupil dilation have been demonstrated to indicate cognitive effort and can be used for the dissociation between controlled and automatic processing (e.g., [
57,
58,
59,
60]). A possible design would be to present items with low, medium, and high difficulty (respectively cognitive load) to groups of high and low ability respondents. It can be predicted that (1) changes in pupil dilatation increase with item difficulty; (2) low ability respondents show higher changes in dilatation than high ability respondents; and (3) there is an interaction between item difficulty and respondent ability, whereby differences between ability groups attenuate with increasing item difficulty.
It needs to be discussed that H5 was tested indirectly by introducing the number of rules as an item-level covariate and the task score as a person-level covariate. Both were validated as explanatory or substantially related variables in a first step. Additionally, the obtained pattern of the interaction of all factors fully confirmed our hypothesis. However, the modeling of explanatory variables rather than random effects did not allow testing if variances and correlations of effects possibly vary across persons.
Another limitation in the current study pertains to the use of the test score as a proxy for person ability. Thereby, the moderator variable used in the analyses is not independent of the probability of accurately responding. While some overlap between both can be expected on logical grounds, a replication of core findings with an independent ability measure is highly desirable.
Finally, we could not determine the effect of task commitment on response times. On the one hand, persons who are less motivated might spend less time solving the items because they want to finish the test as fast as possible. On the other hand, persons who are less motivated might also work more slowly because they do not put their maximum effort into solving the tasks. It might also be the case that some persons spend more time and some less time solving the items if motivation is low so that these effects might cancel each other out. We are not able to address this question with the current data. A perspective for future research may involve assessing participants’ test motivation with a questionnaire at the end of the test and comparing the RTACs in groups of participants with higher vs. lower motivation or to compare the RTACs in high- vs. low-stakes testing.
6. Conclusions
The present results can be reconciled with the dual processing account of response time effects. Importantly, the direction of the RTAC was shown to depend jointly on item difficulty and respondent ability. Thereby, the dissociation is not necessarily driven by the task paradigm. In line with the dual processing perspective, we suggest that respondents switch from a more automatic to a more controlled processing style if item-generated cognitive load exceeds their cognitive resources. In that case, the solution cannot be inferred in an integrated fashion. Conversely, load has to be reduced by breaking the solution process into steps that need to be executed in a sequential fashion. In turn, these time-consuming processes can be finished only when allowing sufficient time on task, thereby, constituting the positive RTAC observed with complex items. We believe this notion is a valuable extension of the dual processing account of response time effects, as it suggests an explanatory mechanism and as it allows predictions of RTACs along the whole continua of item difficulty and of cognitive ability.


