The Relation of Personality and Intelligence—What Can the Brunswik Symmetry Principle Tell Us?

 , ,
, ,
Abstract
:1. Introduction
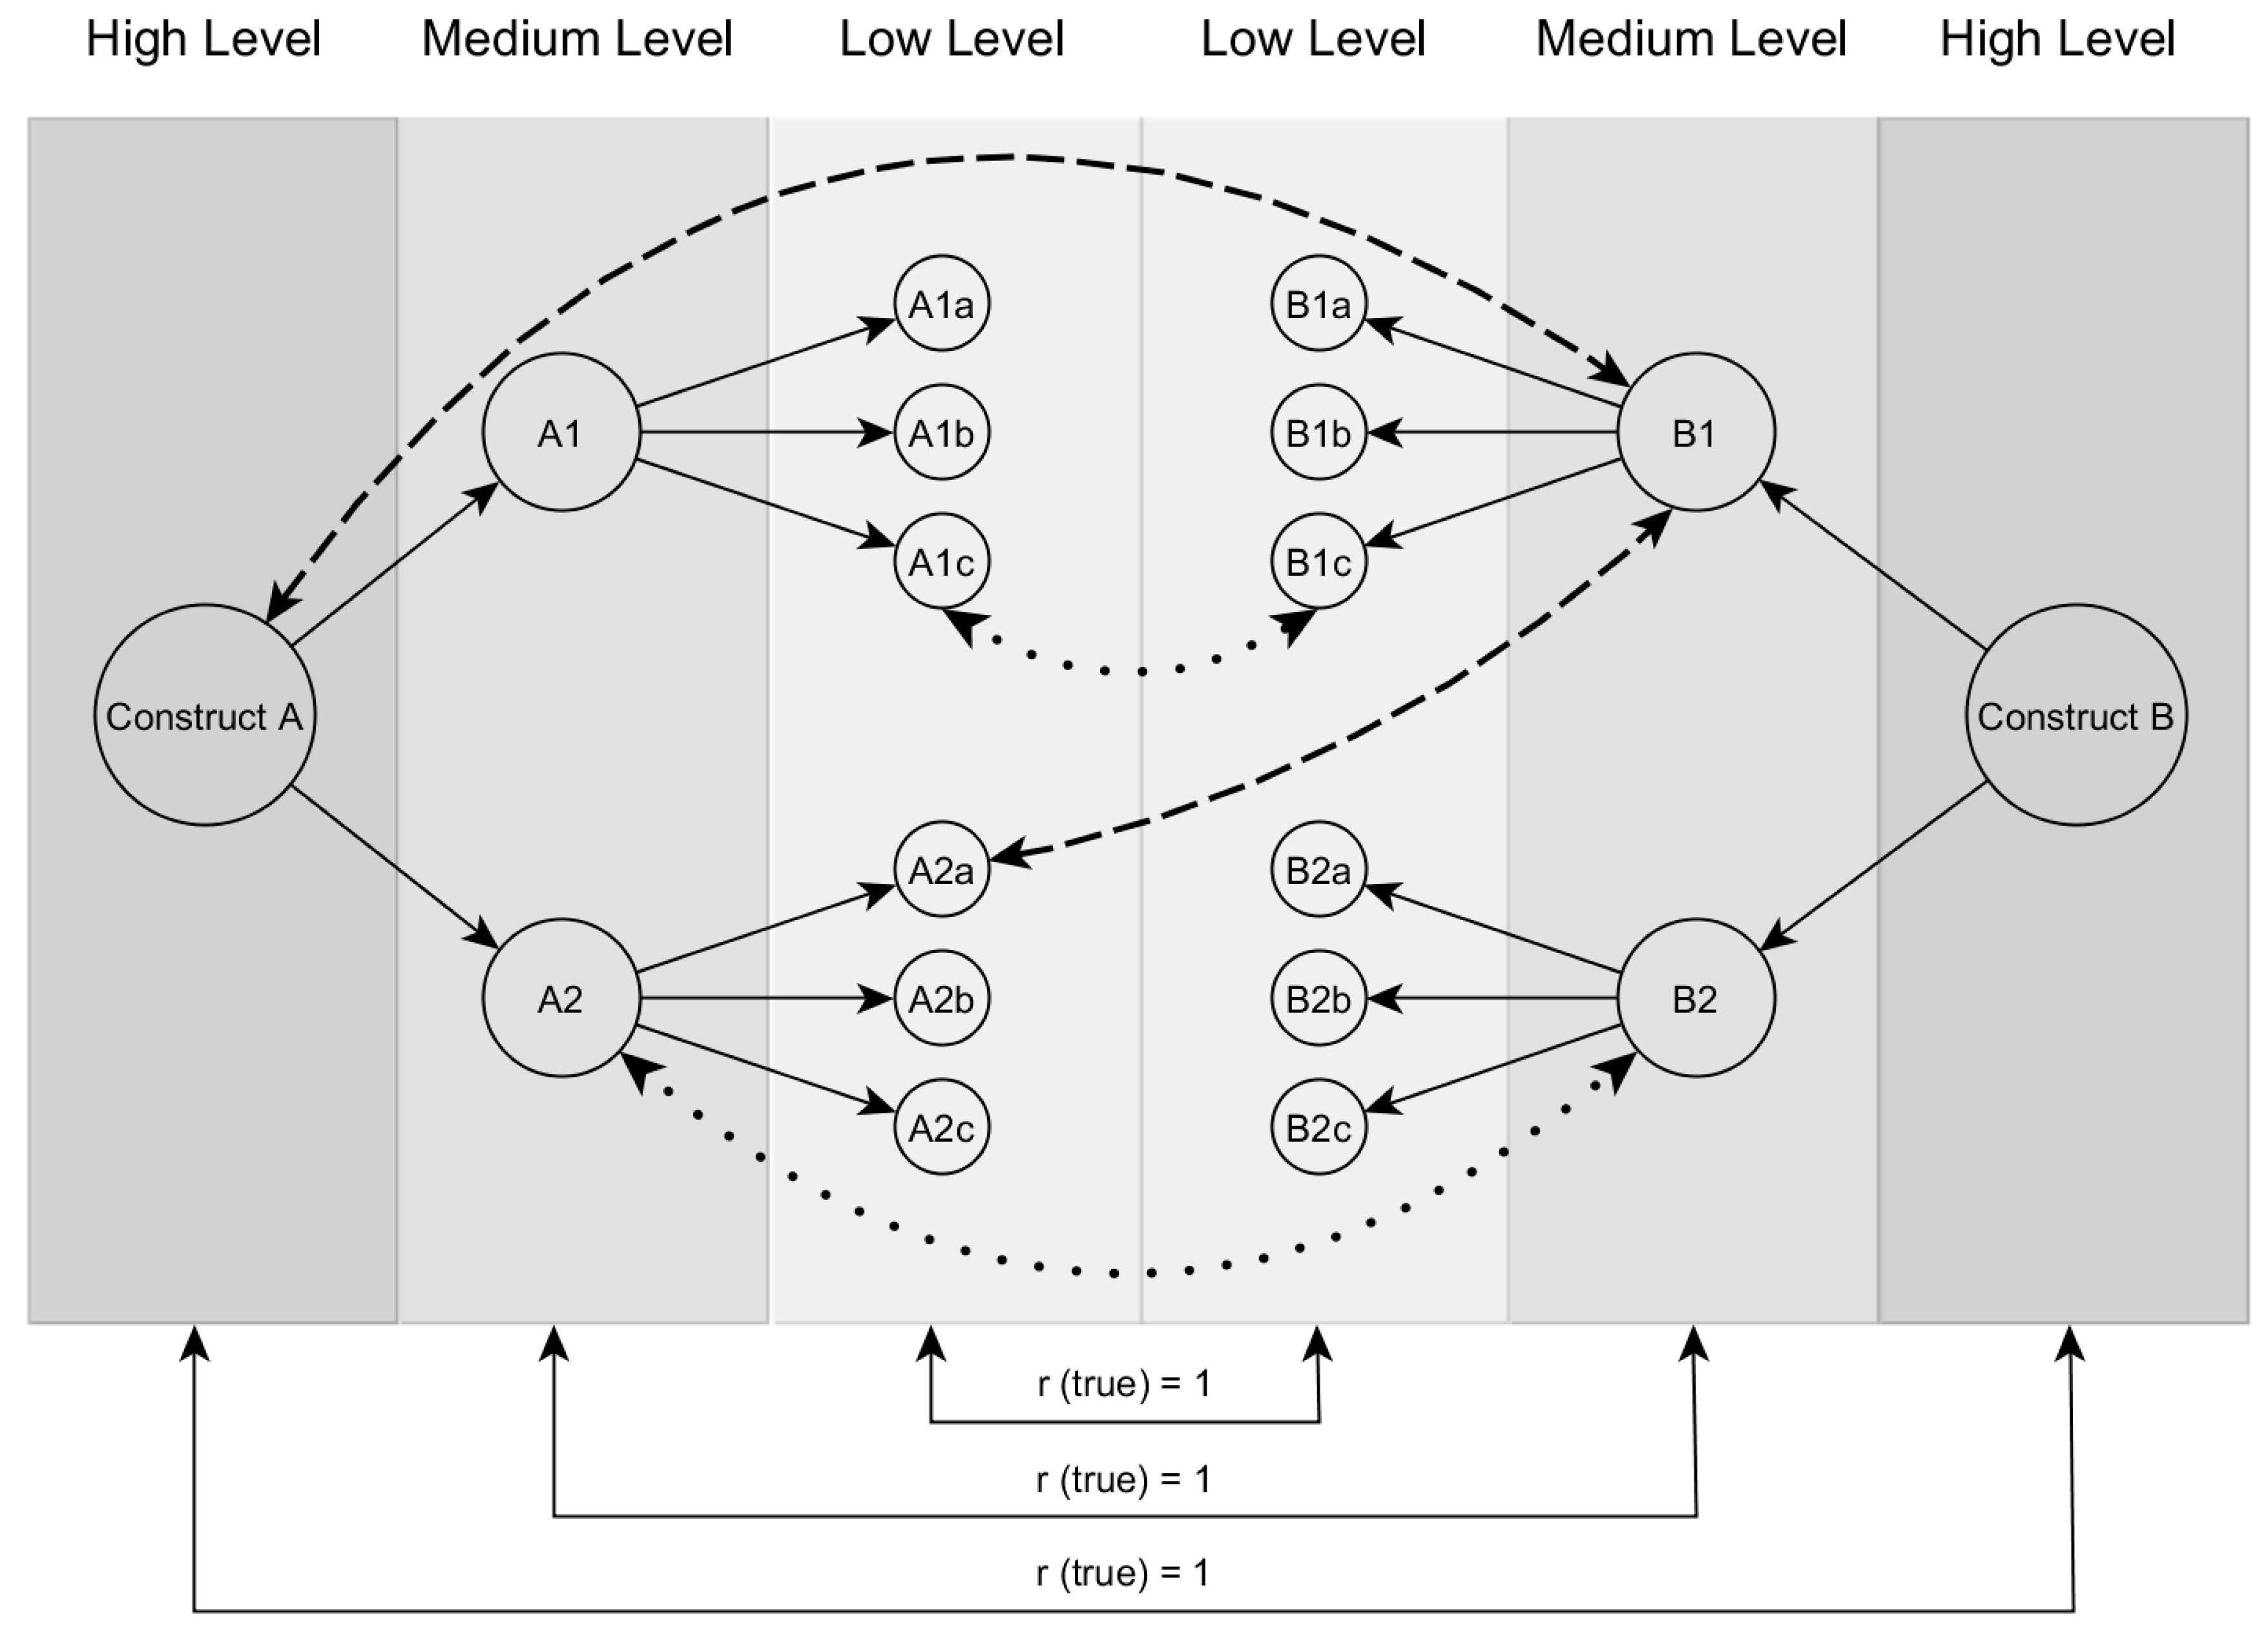
1.1. The Brunswik Symmetry Principle
1.2. Empirical Studies on Personality-Intelligence Relations
1.3. The Present Study
2. Study 1
2.1. Materials and Methods
2.1.1. Participants
2.1.2. Materials
2.1.3. Statistical Analysis
2.2. Results
2.2.1. General Factor of Personality and the Big Two: Stability and Plasticity (High Level)
2.2.2. FFM Dimensions (Medium Level)
2.2.3. FFM Facets (Low Level)
2.2.4. The Brunswik Symmetry Principle
2.3. Summary
3. Study 2
3.1. Method
3.1.1. Participants
3.1.2. Materials
3.1.3. Statistical Analysis
3.2. Results
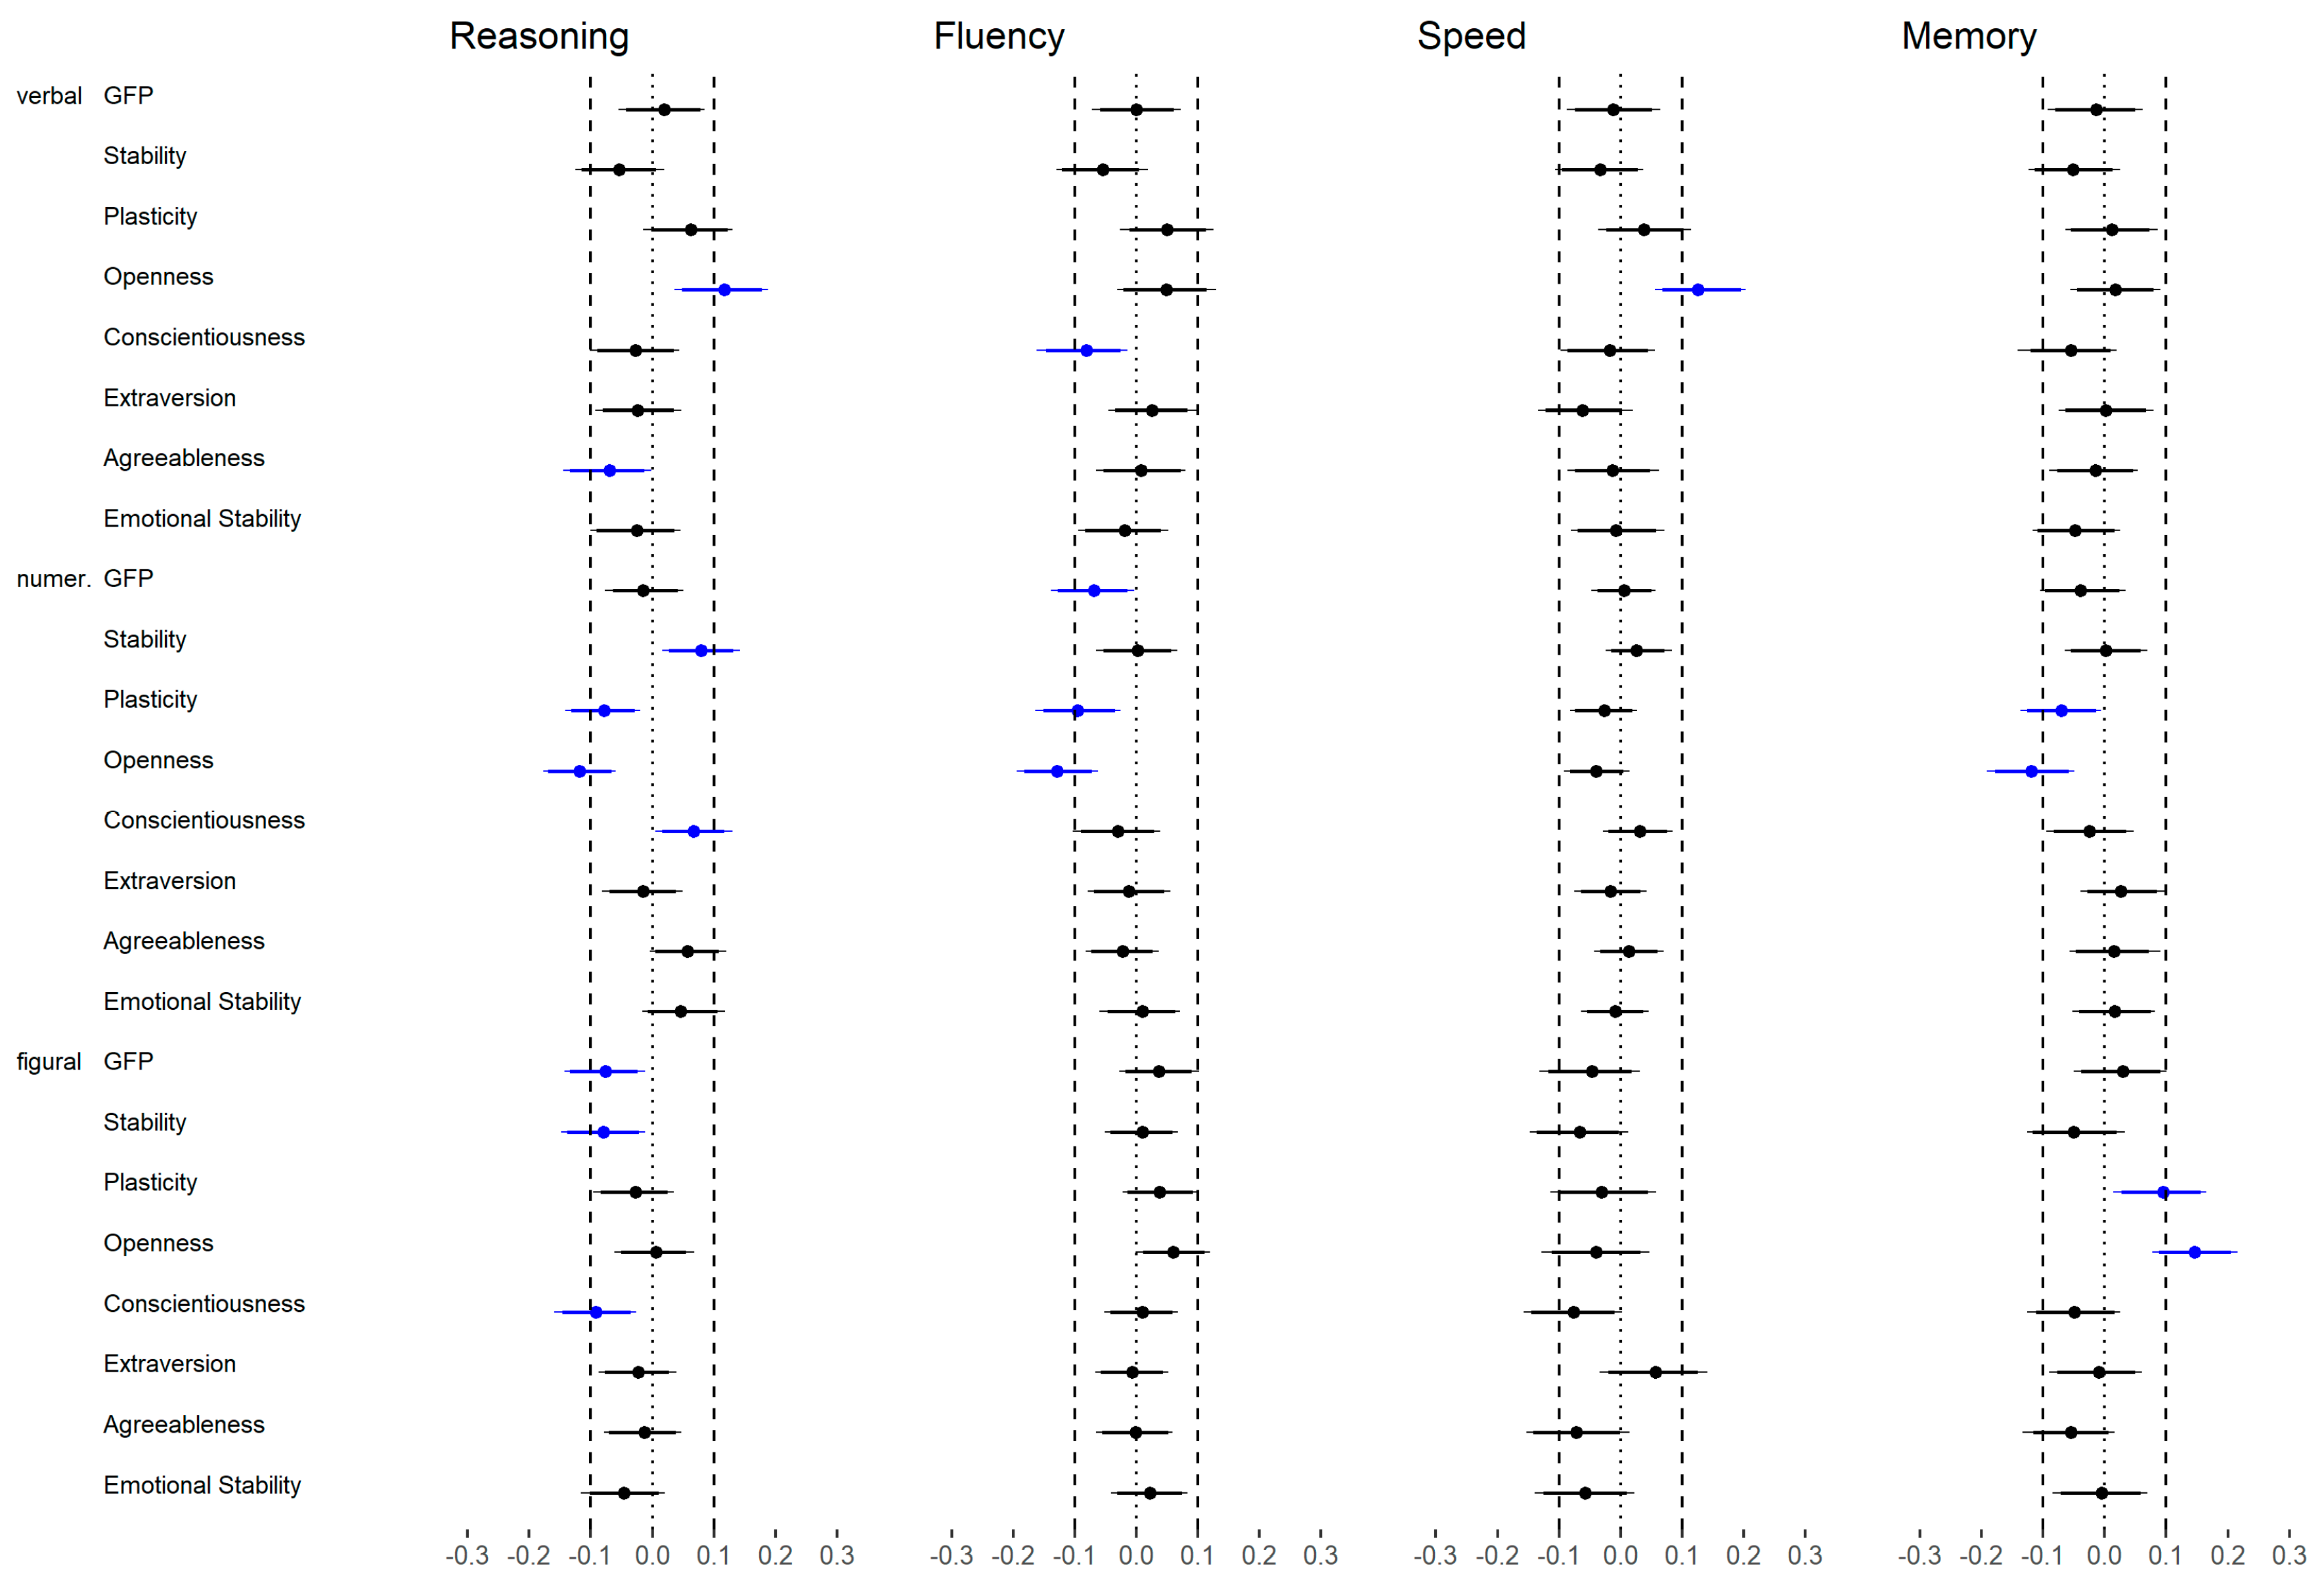
3.2.1. General Factor of Personality and the Big Two: Stability and Plasticity (High Level)
3.2.2. FFM Dimensions (Medium Level)
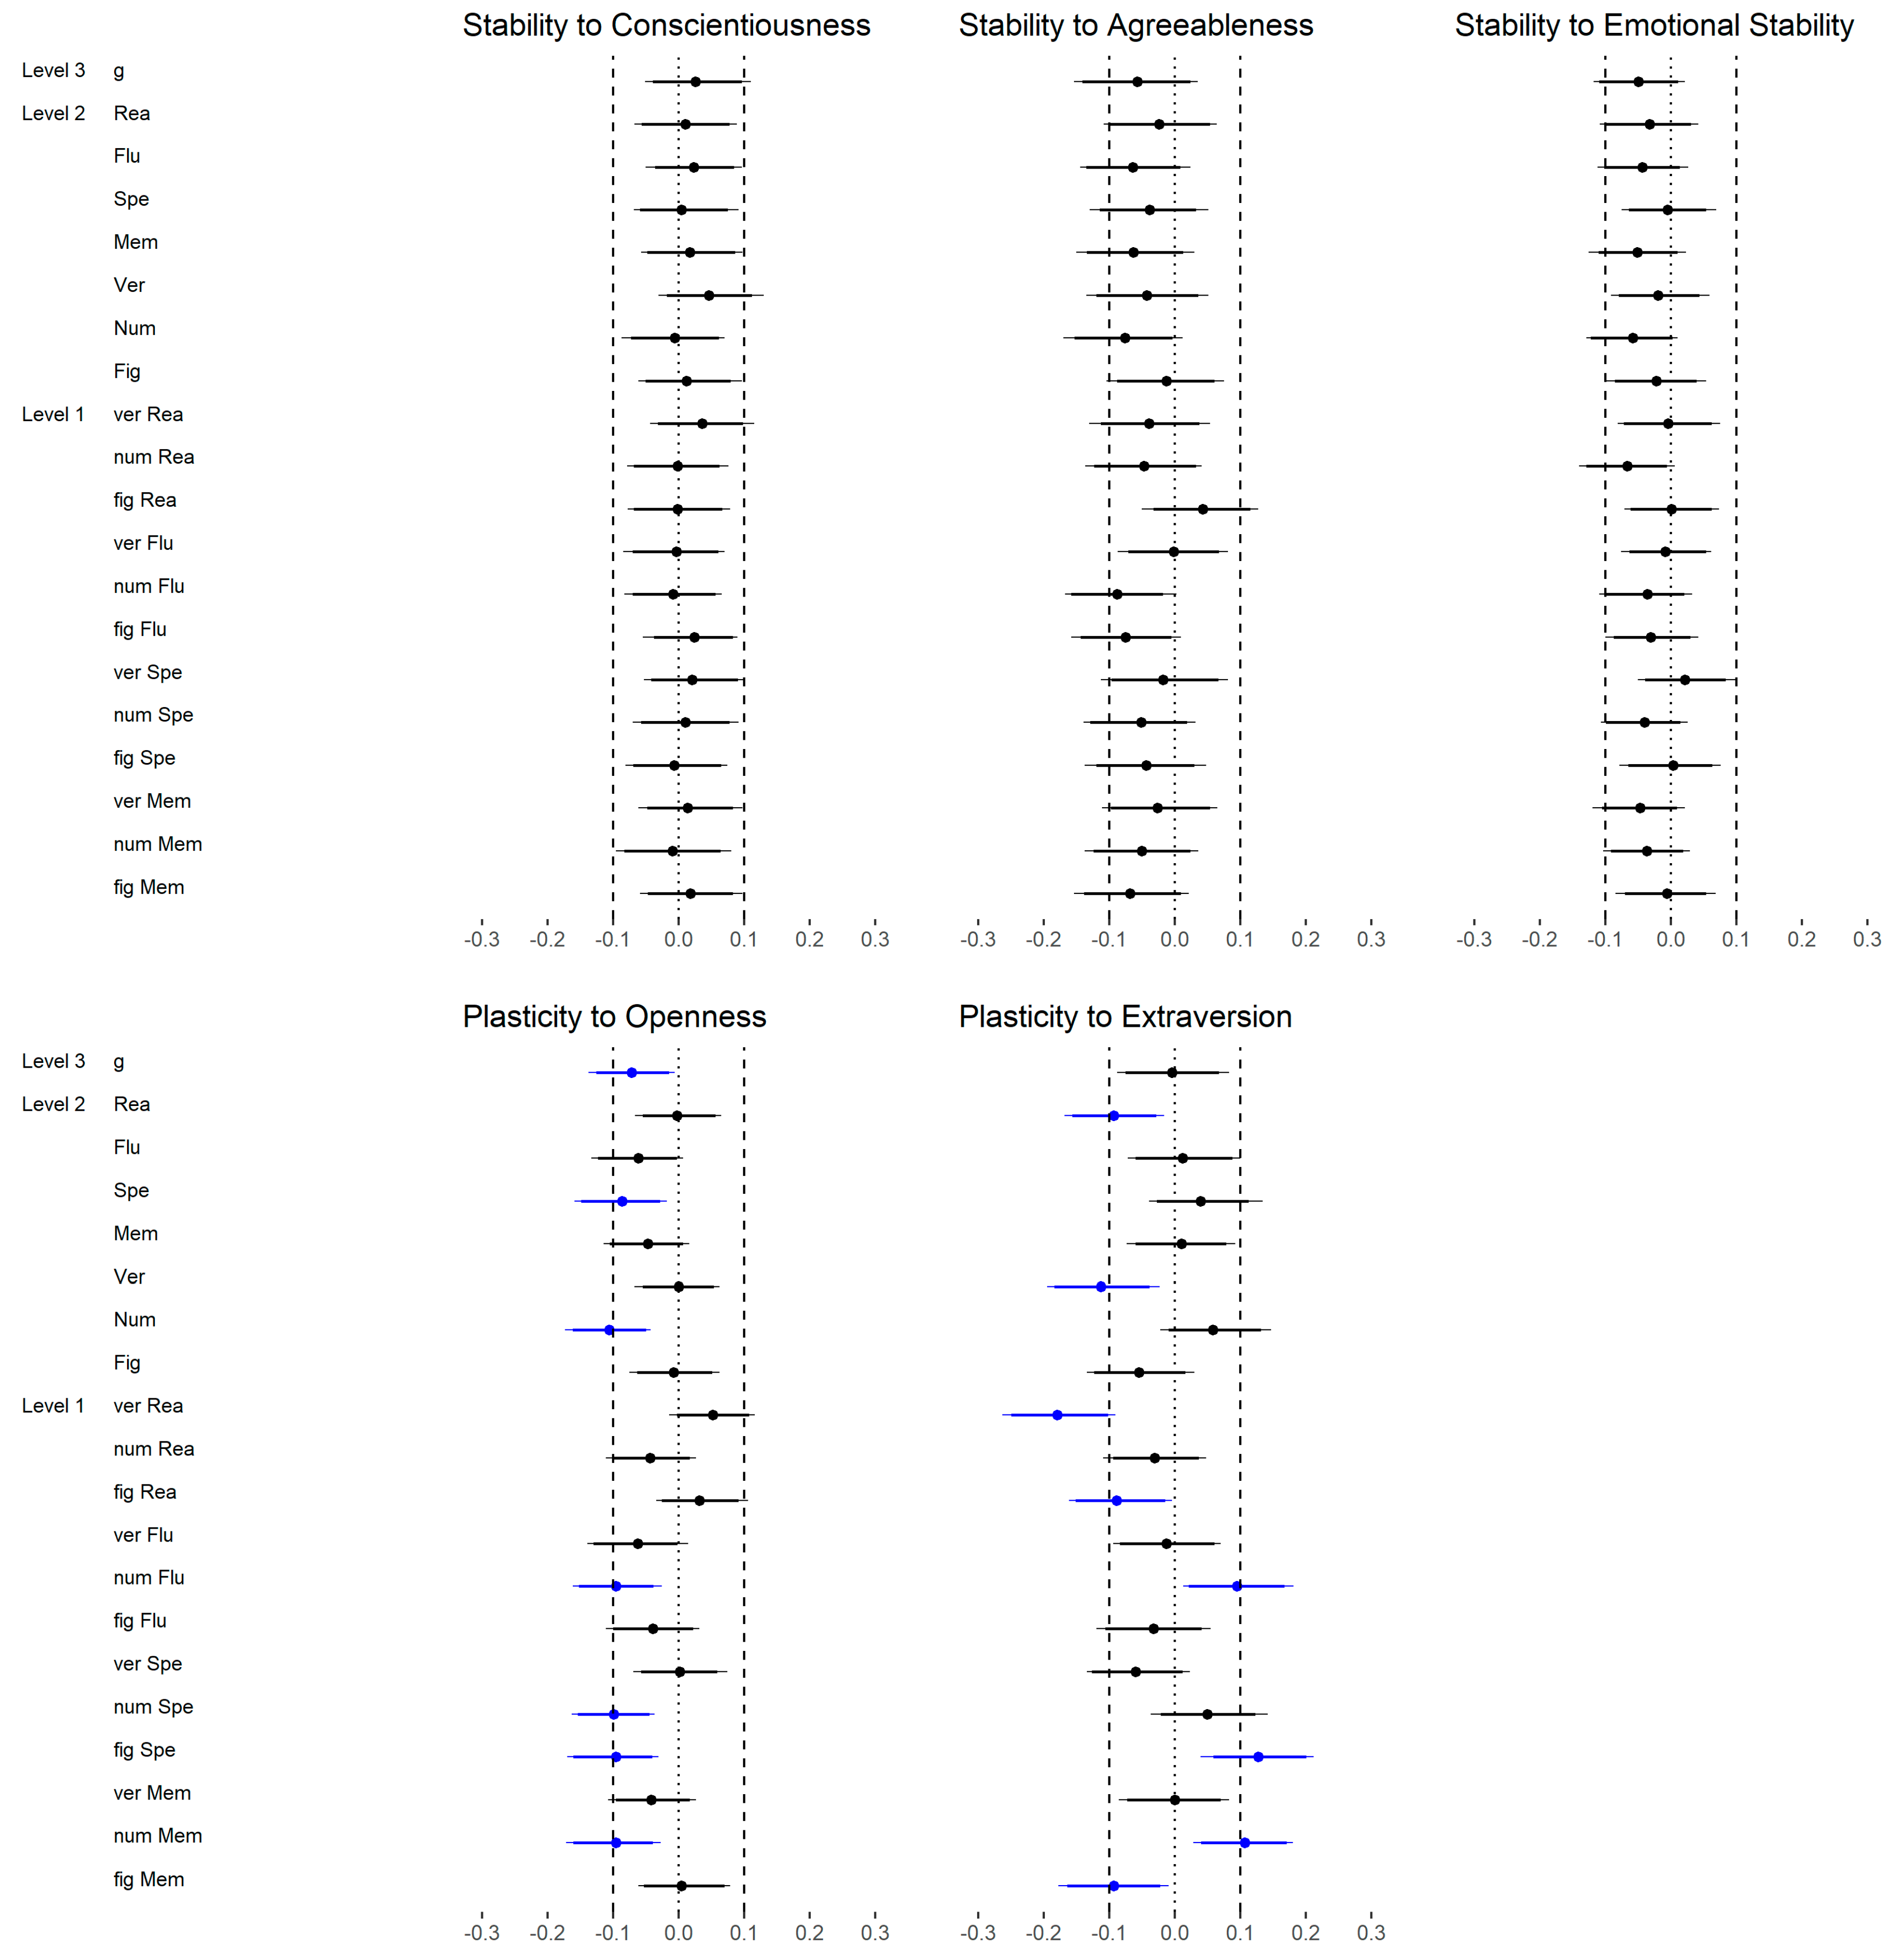
3.2.3. The Brunswik Symmetry Principle
3.3. Summary
4. Discussion
4.1. Recommendations to Observe Large(r) Personality-Intelligence Relations
4.2. Limitations and Future Directions
5. Conclusions
Author Contributions
Acknowledgments
Conflicts of Interest
Appendix A

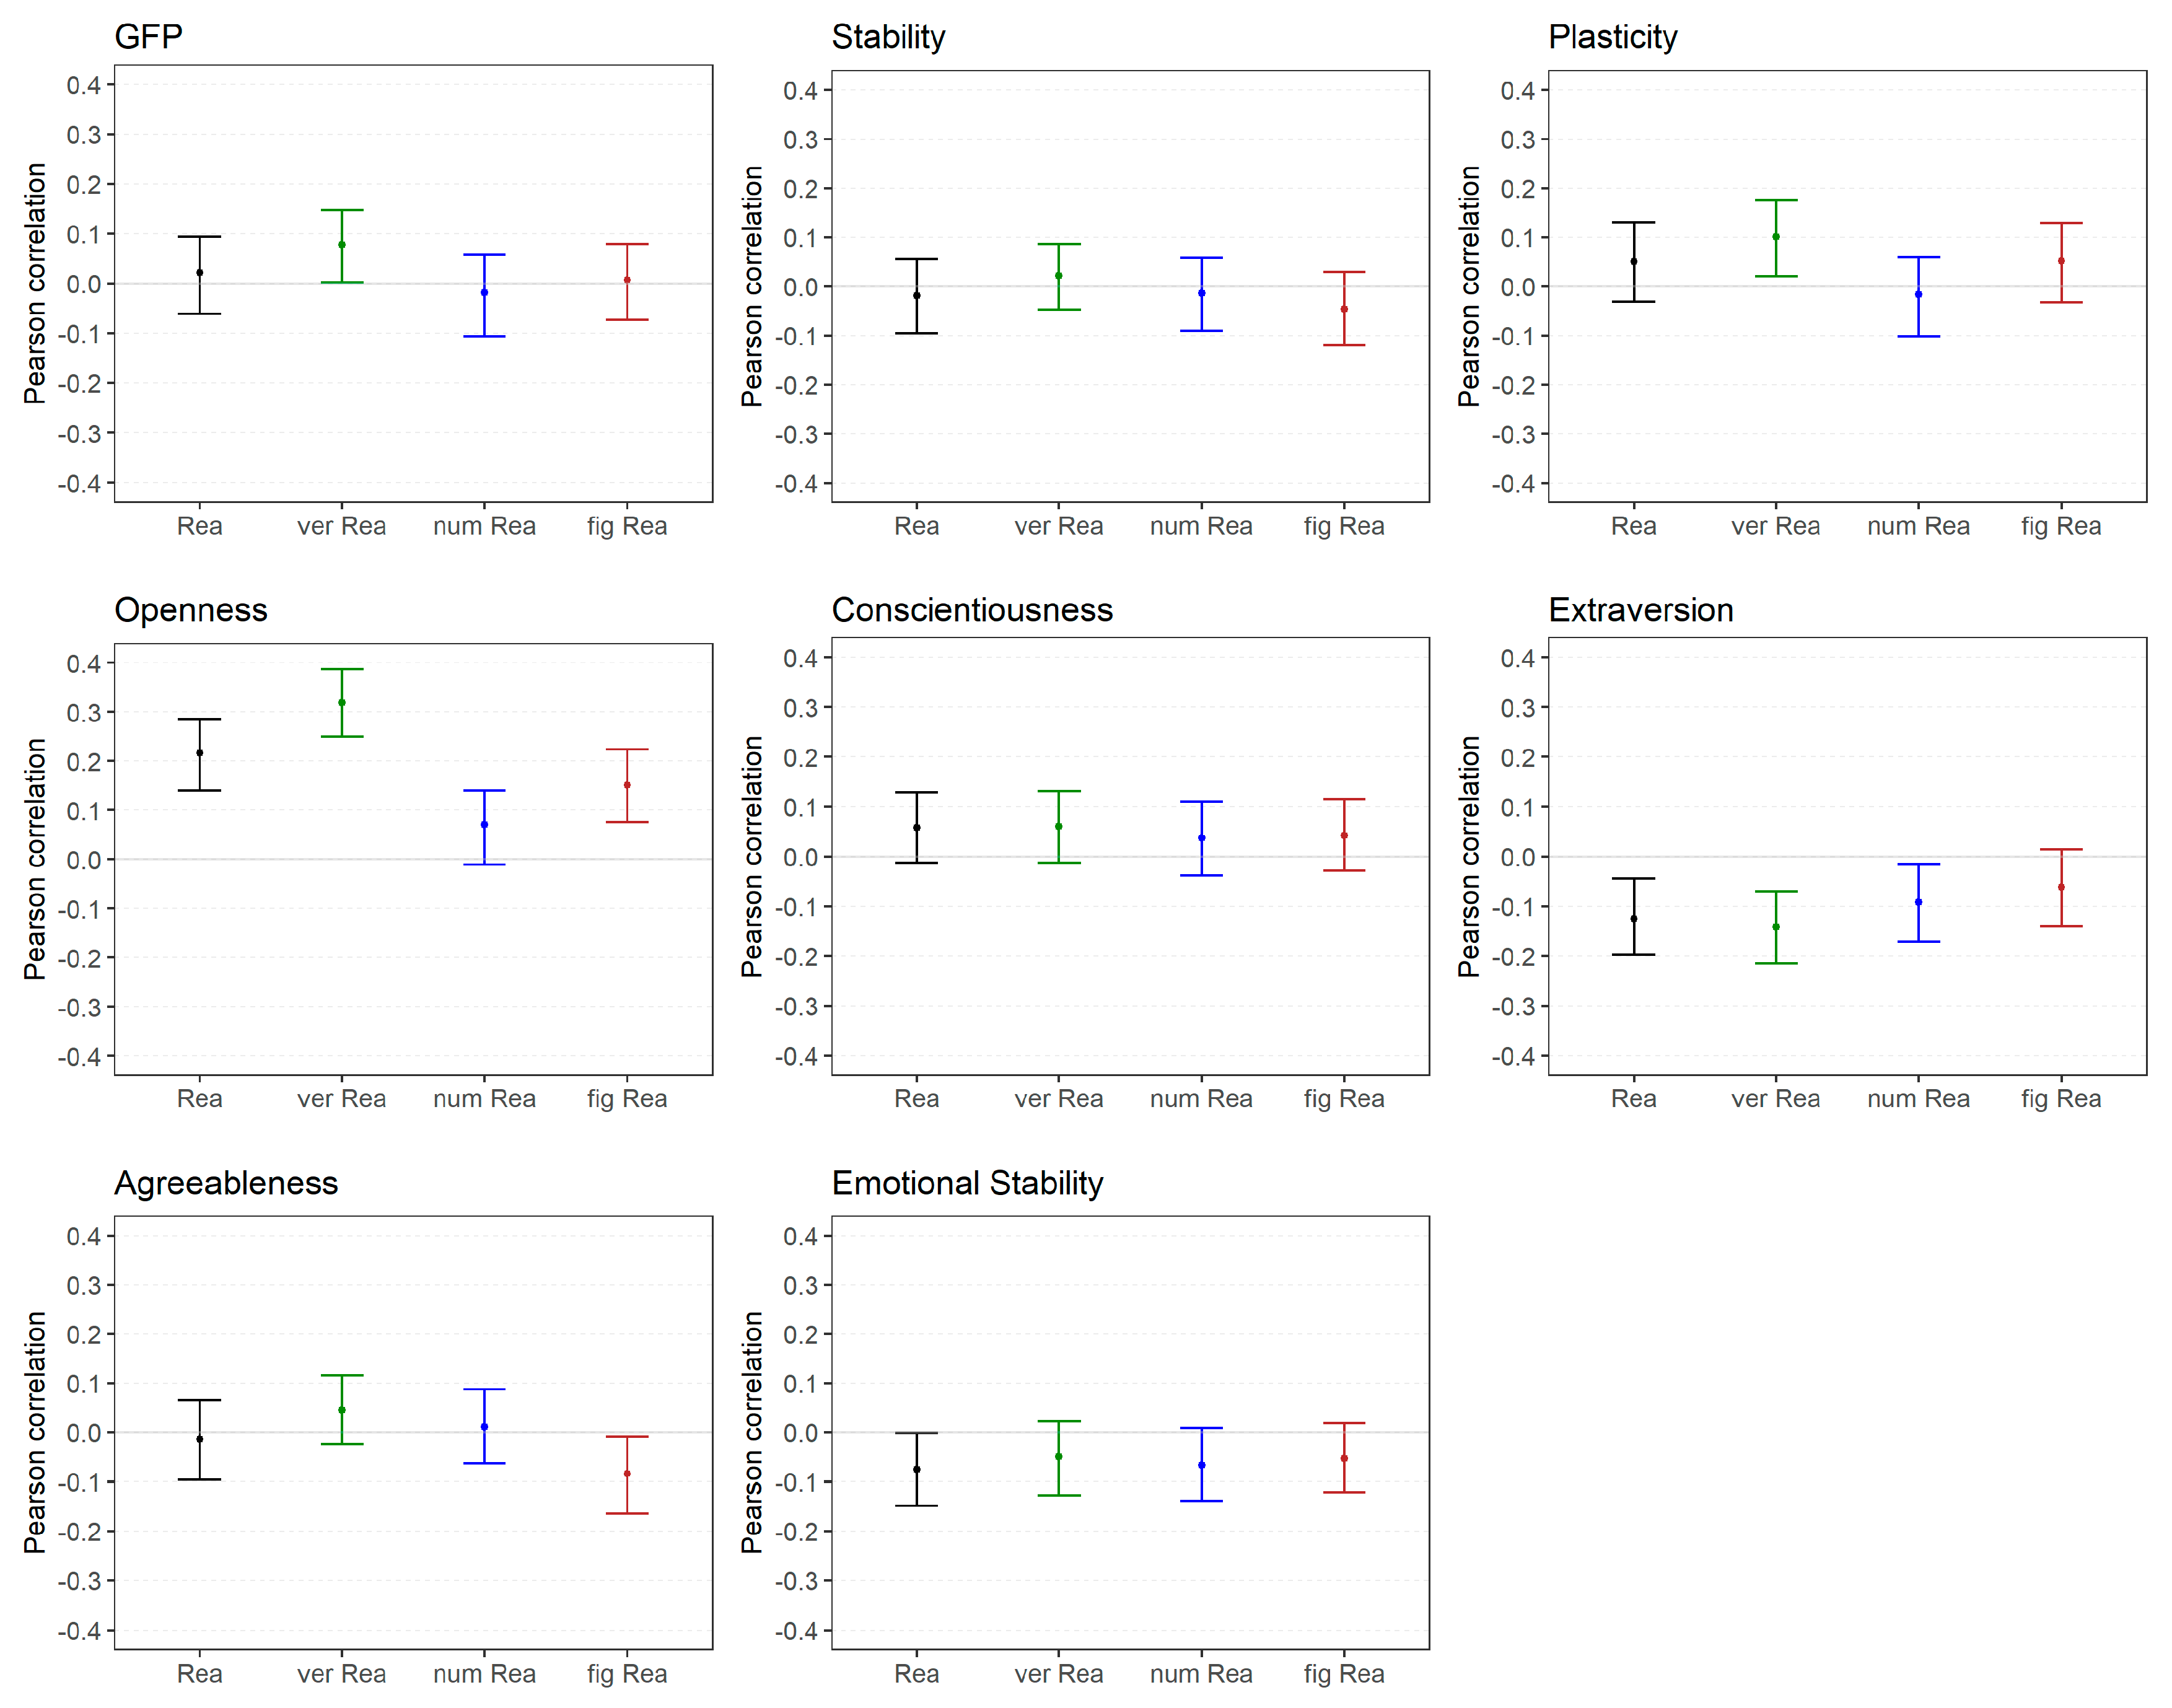
| Reasoning | Verbal Reasoning | Numerical Reasoning | Figural Reasoning | |||||
|---|---|---|---|---|---|---|---|---|
| GFP | 0.02 | [−0.06, 0.11] | 0.09 | [0.01, 0.18] | −0.02 | [−0.11, 0.06] | 0.01 | [−0.08, 0.10] |
| Stability | −0.02 | [−0.10, 0.06] | 0.03 | [−0.06, 0.11] | −0.02 | [−0.10, 0.07] | −0.05 | [−0.14, 0.03] |
| Plasticity | 0.06 | [−0.03, 0.14] | 0.12 | [0.03, 0.21] | −0.02 | [−0.10, 0.07] | 0.06 | [−0.03, 0.15] |
| Openness | 0.24 | [0.15, 0.32] | 0.39 | [0.30, 0.47] | 0.08 | [−0.01, 0.16] | 0.18 | [0.09, 0.27] |
| Conscientiousness | 0.06 | [−0.01, 0.14] | 0.07 | [−0.01, 0.16] | 0.04 | [−0.04, 0.12] | 0.05 | [−0.04, 0.13] |
| Extraversion | −0.14 | [−0.22, −0.06] | −0.17 | [−0.26, −0.08] | −0.10 | [−0.19, −0.02] | −0.07 | [−0.16, 0.01] |
| Agreeableness | −0.02 | [−0.11, 0.07] | 0.06 | [−0.03, 0.14] | 0.01 | [−0.07, 0.10] | −0.10 | [−0.20, −0.01] |
| Emotional Stability | −0.08 | [−0.17, 0.00] | −0.06 | [−0.15, 0.03] | −0.07 | [−0.15, 0.01] | −0.06 | [−0.15, 0.03] |
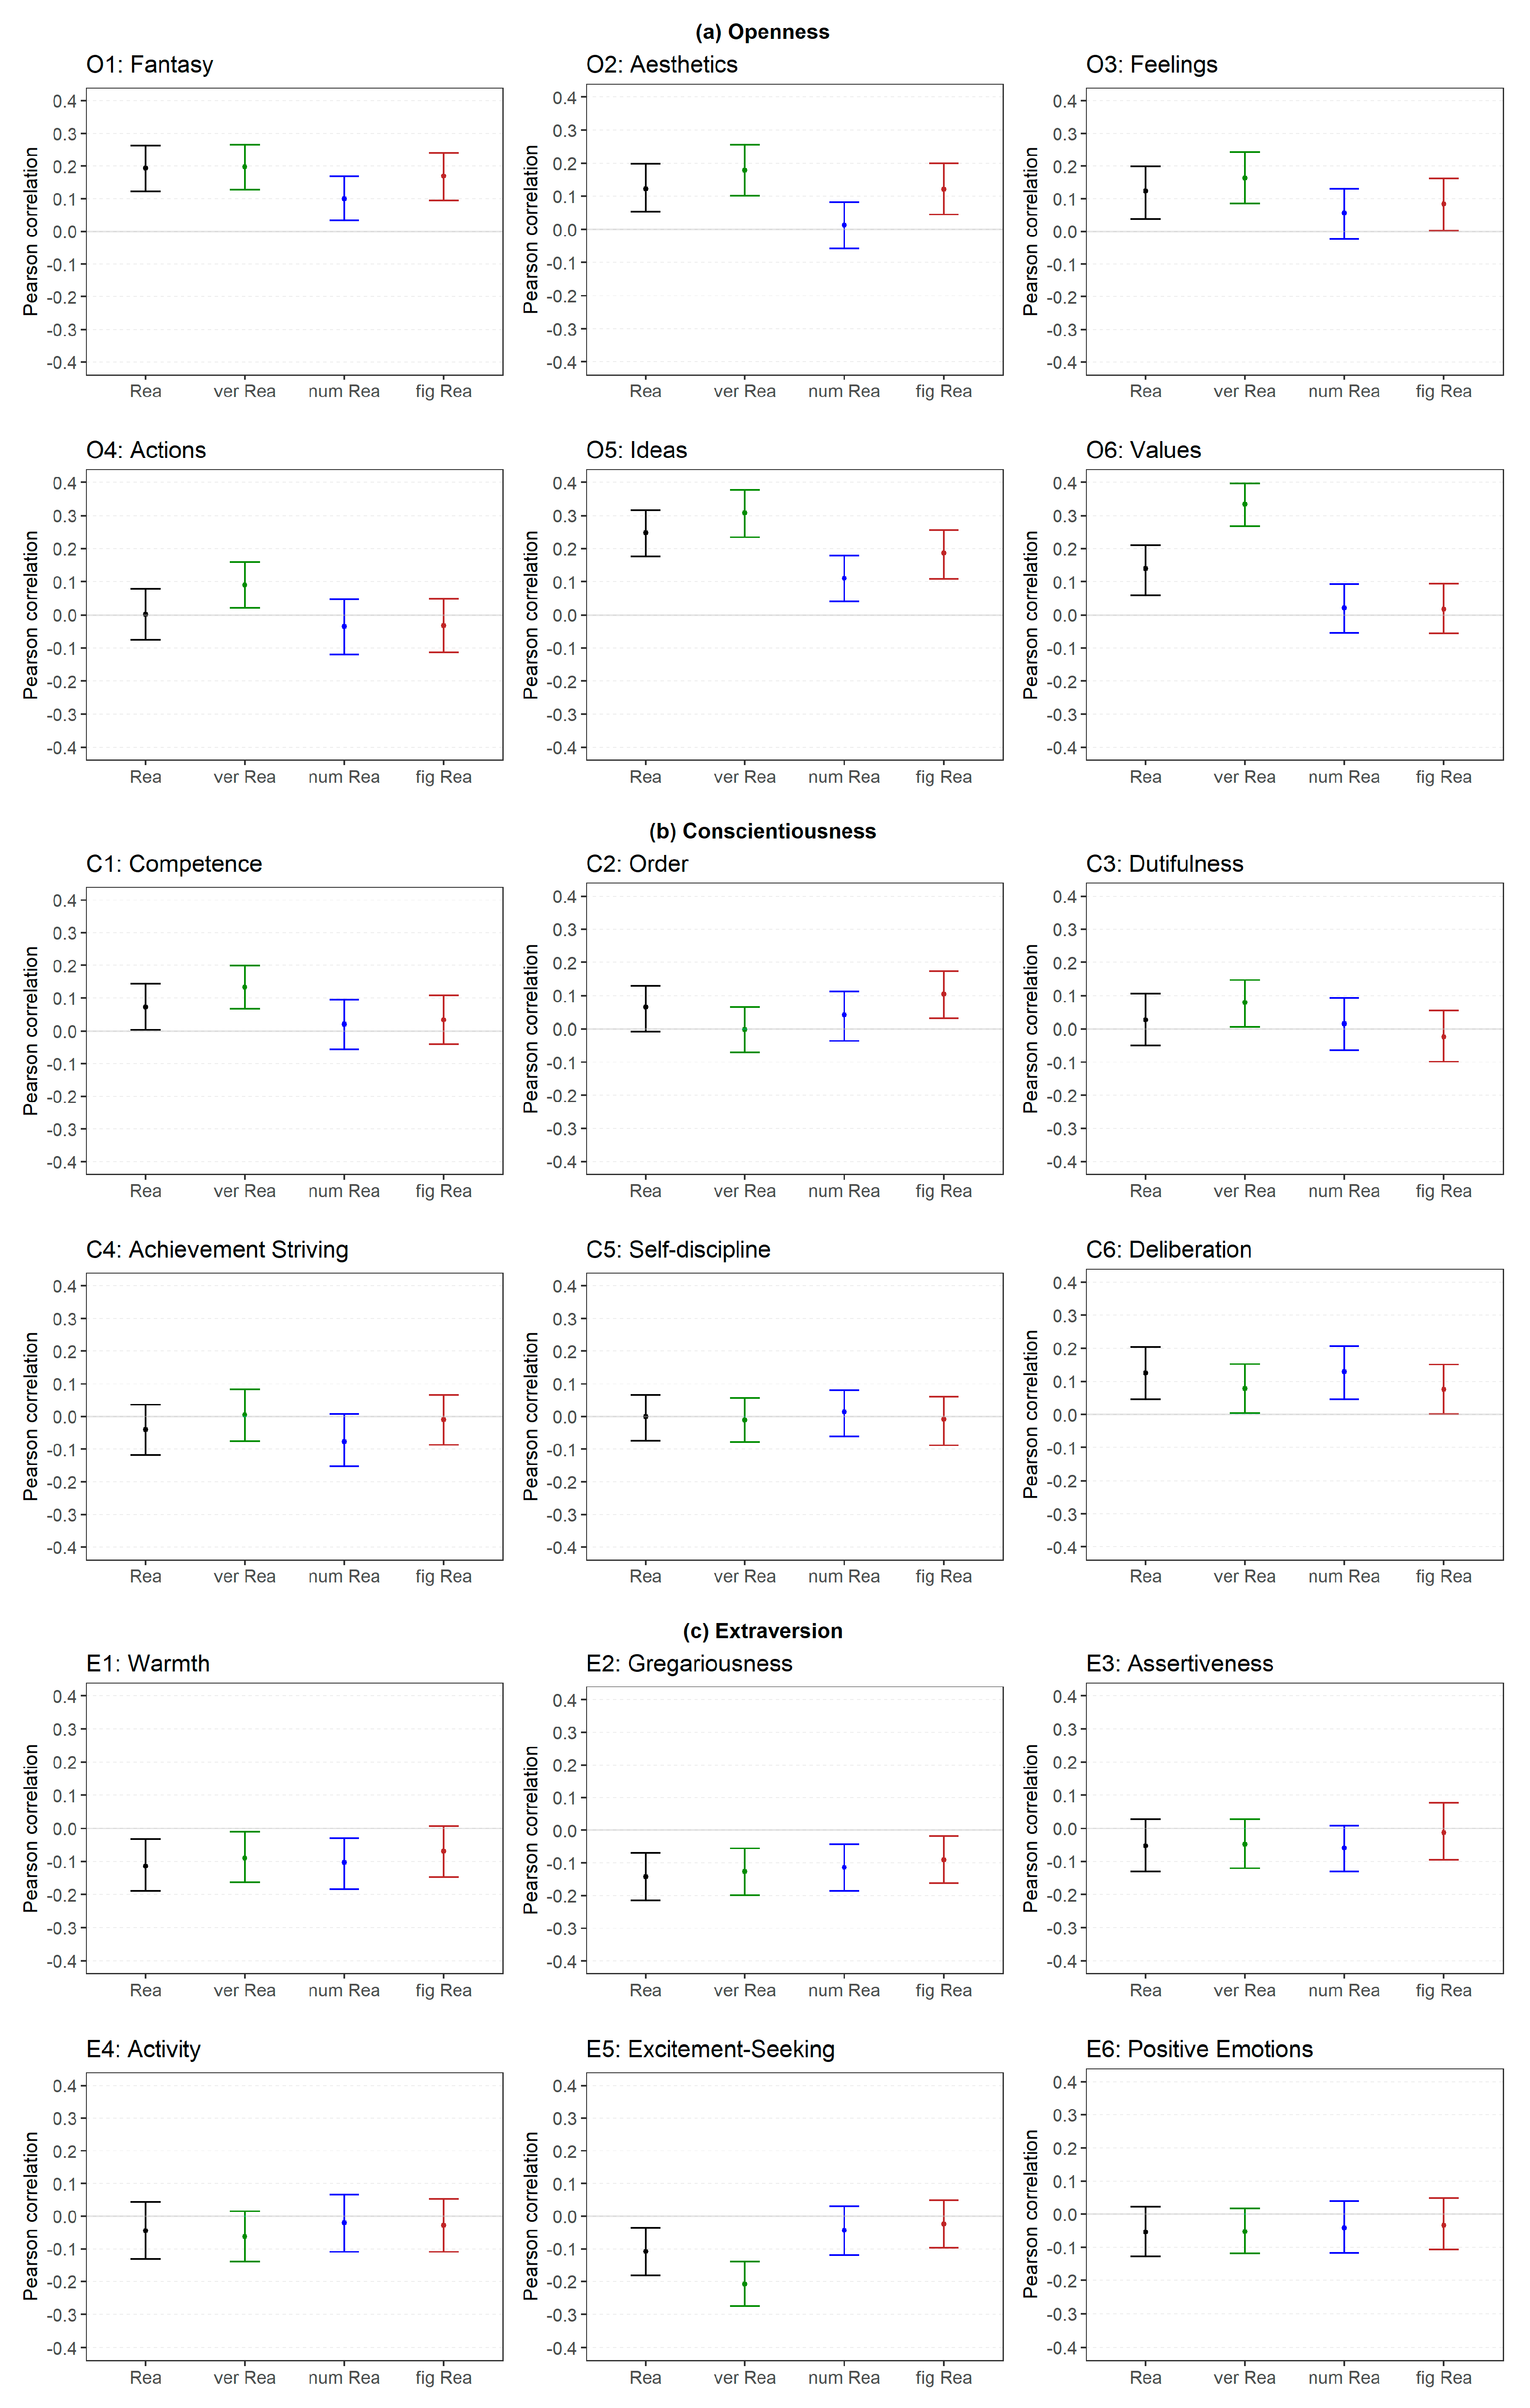
| O1: Fantasy | 0.23 | [0.15, 0.31] | 0.26 | [0.17, 0.35] | 0.12 | [0.04, 0.20] | 0.21 | [0.12, 0.31] |
| O2: Aesthetics | 0.14 | [0.06, 0.23] | 0.23 | [0.13, 0.32] | 0.01 | [−0.07, 0.09] | 0.15 | [0.05, 0.24] |
| O3: Feelings | 0.14 | [0.05, 0.24] | 0.21 | [0.11, 0.30] | 0.07 | [−0.03, 0.15] | 0.10 | [0.01, 0.20] |
| O4: Actions | 0.00 | [−0.11, 0.11] | 0.13 | [0.03, 0.23] | −0.05 | [−0.16, 0.06] | −0.05 | [−0.16, 0.07] |
| O5: Ideas | 0.29 | [0.20, 0.37] | 0.39 | [0.30, 0.48] | 0.13 | [0.04, 0.22] | 0.23 | [0.14, 0.32] |
| O6: Values | 0.20 | [0.09, 0.31] | 0.52 | [0.42, 0.62] | 0.03 | [−0.08, 0.14] | 0.03 | [−0.09, 0.14] |
| C1: Competence | 0.09 | [−0.00, 0.18] | 0.18 | [0.09, 0.27] | 0.02 | [−0.07, 0.12] | 0.04 | [−0.06, 0.14] |
| C2: Order | 0.08 | [−0.01, 0.17] | −0.00 | [−0.10, 0.09] | 0.05 | [−0.04, 0.14] | 0.14 | [0.04, 0.23] |
| C3: Dutifulness | 0.03 | [−0.06, 0.13] | 0.11 | [0.01, 0.19] | 0.02 | [−0.08, 0.12] | −0.03 | [−0.13, 0.07] |
| C4: Achievement Striving | −0.05 | [−0.15, 0.05] | 0.01 | [−0.10, 0.12] | −0.10 | [−0.19, 0.00] | −0.01 | [−0.12, 0.09] |
| C5: Self-discipline | −0.00 | [−0.08, 0.08] | −0.01 | [−0.10, 0.08] | 0.02 | [−0.07, 0.10] | −0.01 | [−0.10, 0.08] |
| C6: Deliberation | 0.15 | [0.06, 0.23] | 0.10 | [0.01, 0.20] | 0.15 | [0.06, 0.24] | 0.09 | [−0.00, 0.18] |
| E1: Warmth | −0.14 | [−0.23, −0.04] | −0.12 | [−0.21, −0.02] | −0.12 | [−0.22, −0.03] | −0.09 | [−0.19, 0.01] |
| E2: Gregariousness | −0.17 | [−0.25, −0.08] | −0.16 | [−0.26, −0.06] | −0.13 | [−0.22, −0.05] | −0.11 | [−0.20, −0.03] |
| E3: Assertiveness | −0.06 | [−0.15, 0.03] | −0.06 | [−0.15, 0.03] | −0.07 | [−0.15, 0.01] | −0.02 | [−0.12, 0.08] |
| E4: Activity | −0.06 | [−0.16, 0.04] | −0.09 | [−0.19, 0.02] | −0.02 | [−0.12, 0.08] | −0.04 | [−0.14, 0.07] |
| E5: Excitement-Seeking | −0.14 | [−0.25, −0.05] | −0.30 | [−0.41, −0.20] | −0.06 | [−0.16, 0.04] | −0.03 | [−0.14, 0.07] |
| E6: Positive Emotions | −0.06 | [−0.16, 0.03] | −0.07 | [−0.16, 0.03] | −0.05 | [−0.14, 0.04] | −0.04 | [−0.14, 0.05] |
| A1: Trust | 0.02 | [−0.08, 0.11] | 0.16 | [0.07, 0.25] | −0.02 | [−0.11, 0.08] | −0.07 | [−0.16, 0.03] |
| A2: Straightforwardness | 0.09 | [−0.01, 0.18] | 0.09 | [−0.01, 0.19] | 0.12 | [0.02, 0.20] | −0.01 | [−0.11, 0.09] |
| A3: Altruism | −0.04 | [−0.14, 0.06] | 0.00 | [−0.10, 0.11] | −0.05 | [−0.14, 0.05] | −0.05 | [−0.15, 0.05] |
| A4: Compliance | −0.03 | [−0.13, 0.08] | 0.05 | [−0.06, 0.17] | 0.01 | [−0.09, 0.11] | −0.12 | [−0.22, −0.01] |
| A5: Modesty | −0.11 | [−0.20, −0.02] | −0.11 | [−0.21, −0.01] | −0.03 | [−0.12, 0.06] | −0.15 | [−0.25, −0.06] |
| A6: Tender-Mindedness | 0.01 | [−0.09, 0.12] | 0.06 | [−0.05, 0.17] | 0.02 | [−0.08, 0.12] | −0.05 | [−0.16, 0.06] |
| -N1: Anxiety | −0.04 | [−0.13, 0.05] | −0.02 | [−0.12, 0.07] | −0.03 | [−0.12, 0.05] | −0.04 | [−0.13, 0.06] |
| -N2: Angry Hostility | −0.02 | [−0.11, 0.08] | 0.06 | [−0.04, 0.15] | −0.02 | [−0.11, 0.08] | −0.07 | [−0.17, 0.04] |
| -N3: Depression | −0.11 | [−0.19, −0.02] | −0.07 | [−0.16, 0.02] | −0.11 | [−0.19, −0.03] | −0.07 | [−0.16, 0.02] |
| -N4: Self-Consciousness | −0.14 | [−0.23, −0.05] | −0.15 | [−0.25, −0.04] | −0.14 | [−0.22, −0.06] | −0.05 | [−0.15, 0.05] |
| -N5: Impulsiveness | −0.01 | [−0.12, 0.09] | −0.04 | [−0.15, 0.07] | 0.01 | [−0.09, 0.11] | −0.01 | [−0.12, 0.09] |
| -N6: Vulnerability | −0.07 | [−0.16, 0.02] | −0.07 | [−0.16, 0.02] | −0.05 | [−0.14, 0.03] | −0.05 | [−0.14, 0.04] |
| GFP | Stability | Plasticity | Openness | Conscientiousness | Extraversion | Agreeableness | Emotional Stability | |||||||||
|---|---|---|---|---|---|---|---|---|---|---|---|---|---|---|---|---|
| g | 0.17 | [0.05, 0.28] | 0.16 | [0.05, 0.27] | 0.12 | [0.00, 0.24] | 0.07 | [−0.05, 0.18] | 0.15 | [0.05, 0.25] | 0.10 | [−0.02, 0.21] | 0.07 | [−0.05, 0.19] | 0.11 | [−0.00, 0.21] |
| Reasoning | 0.18 | [0.05, 0.30] | 0.10 | [−0.01, 0.22] | 0.20 | [0.07, 0.32] | 0.26 | [0.15, 0.37] | 0.08 | [−0.03, 0.20] | −0.00 | [−0.11, 0.12] | 0.08 | [−0.05, 0.21] | 0.06 | [−0.07, 0.16] |
| Fluency | 0.15 | [0.04, 0.25] | 0.14 | [0.03, 0.24] | 0.10 | [−0.01, 0.23] | 0.01 | [−0.11, 0.14] | 0.13 | [0.03, 0.24] | 0.14 | [0.03, 0.25] | 0.02 | [−0.09, 0.14] | 0.12 | [0.01, 0.22] |
| Speed | 0.06 | [−0.05, 0.18] | 0.11 | [0.00, 0.24] | −0.02 | [−0.12, 0.10] | −0.11 | [−0.23, 0.01] | 0.13 | [0.03, 0.24] | 0.10 | [−0.02, 0.23] | 0.00 | [−0.11, 0.12] | 0.09 | [−0.03, 0.20] |
| Memory | 0.14 | [0.02, 0.27] | 0.18 | [0.07, 0.30] | 0.05 | [−0.07, 0.19] | −0.03 | [−0.16, 0.11] | 0.16 | [0.05, 0.27] | 0.11 | [−0.01, 0.25] | 0.11 | [−0.02, 0.25] | 0.11 | [−0.00, 0.22] |
| verbal Intelligence | 0.18 | [0.05, 0.29] | 0.07 | [−0.03, 0.19] | 0.23 | [0.11, 0.35] | 0.26 | [0.14, 0.37] | 0.08 | [−0.04, 0.20] | 0.05 | [−0.06, 0.18] | 0.02 | [−0.10, 0.14] | 0.04 | [−0.08, 0.15] |
| numerical Intelligence | 0.13 | [0.00, 0.25] | 0.22 | [0.10, 0.34] | −0.02 | [−0.14, 0.12] | −0.08 | [−0.21, 0.04] | 0.21 | [0.10, 0.32] | 0.07 | [−0.04, 0.19] | 0.11 | [−0.02, 0.25] | 0.14 | [0.02, 0.25] |
| figural Intelligence | 0.18 | [0.05, 0.30] | 0.10 | [−0.02, 0.21] | 0.20 | [0.08, 0.31] | 0.18 | [0.05, 0.30] | 0.06 | [−0.04, 0.18] | 0.10 | [−0.02, 0.24] | 0.06 | [−0.06, 0.18] | 0.08 | [−0.03, 0.19] |
| verbal Reasoning | 0.19 | [0.06, 0.30] | 0.03 | [−0.10, 0.16] | 0.28 | [0.16, 0.42] | 0.40 | [0.27, 0.52] | 0.04 | [−0.09, 0.16] | −0.02 | [−0.14, 0.10] | 0.02 | [−0.12, 0.15] | 0.01 | [−0.12, 0.14] |
| numerical Reasoning | 0.17 | [0.04, 0.30] | 0.21 | [0.09, 0.33] | 0.07 | [−0.07, 0.21] | 0.09 | [−0.05, 0.22] | 0.19 | [0.08, 0.30] | 0.00 | [−0.11, 0.12] | 0.14 | [0.01, 0.28] | 0.11 | [−0.02, 0.24] |
| figural Reasoning | 0.11 | [−0.01, 0.24] | 0.01 | [−0.11, 0.13] | 0.18 | [0.05, 0.32] | 0.24 | [0.10, 0.37] | −0.03 | [−0.16, 0.08] | 0.01 | [−0.11, 0.13] | 0.06 | [−0.07, 0.19] | 0.01 | [−0.12, 0.14] |
| verbal Fluency | 0.12 | [0.03, 0.21] | 0.04 | [−0.06, 0.14] | 0.16 | [0.05, 0.26] | 0.06 | [−0.06, 0.17] | 0.04 | [−0.07, 0.14] | 0.18 | [0.08, 0.28] | 0.01 | [−0.11, 0.14] | 0.04 | [−0.07, 0.14] |
| numerical Fluency | 0.06 | [−0.07, 0.19] | 0.16 | [0.01, 0.29] | −0.07 | [−0.21, 0.08] | −0.15 | [−0.28, −0.00] | 0.16 | [0.04, 0.28] | 0.07 | [−0.06, 0.20] | 0.01 | [−0.13, 0.15] | 0.14 | [−0.00, 0.27] |
| figural Fluency | 0.23 | [0.11, 0.35] | 0.17 | [0.05, 0.29] | 0.21 | [0.08, 0.34] | 0.15 | [0.01, 0.29] | 0.16 | [0.05, 0.29] | 0.15 | [0.02, 0.28] | 0.04 | [−0.08, 0.15] | 0.14 | [0.02, 0.26] |
| verbal Speed | 0.07 | [−0.05, 0.19] | 0.06 | [−0.07, 0.18] | 0.05 | [−0.08, 0.18] | 0.06 | [−0.06, 0.19] | 0.08 | [−0.05, 0.20] | 0.02 | [−0.11, 0.14] | −0.03 | [−0.17, 0.11] | 0.06 | [−0.06, 0.18] |
| numerical Speed | 0.06 | [−0.05, 0.19] | 0.14 | [0.02, 0.26] | −0.04 | [−0.17, 0.09] | −0.13 | [−0.25, −0.00] | 0.16 | [0.04, 0.28] | 0.08 | [−0.04, 0.20] | 0.05 | [−0.07, 0.18] | 0.08 | [−0.05, 0.20] |
| figural Speed | 0.01 | [−0.11, 0.13] | 0.07 | [−0.06, 0.19] | −0.05 | [−0.19, 0.08] | −0.23 | [−0.34, −0.11] | 0.07 | [−0.04, 0.19] | 0.18 | [0.05, 0.30] | −0.03 | [−0.16, 0.10] | 0.09 | [−0.03, 0.20] |
| verbal Memory | 0.11 | [−0.02, 0.26] | 0.12 | [−0.01, 0.26] | 0.06 | [−0.08, 0.22] | 0.02 | [−0.13, 0.17] | 0.14 | [0.00, 0.26] | 0.07 | [−0.05, 0.21] | 0.08 | [−0.07, 0.23] | 0.05 | [−0.09, 0.18] |
| numerical Memory | 0.07 | [−0.07, 0.22] | 0.20 | [0.06, 0.34] | −0.09 | [−0.24, 0.06] | −0.23 | [−0.36, −0.10] | 0.16 | [0.04, 0.27] | 0.13 | [−0.03, 0.28] | 0.12 | [−0.04, 0.28] | 0.14 | [0.01, 0.26] |
| figural Memory | 0.19 | [0.05, 0.35] | 0.13 | [−0.02, 0.26] | 0.20 | [0.05, 0.34] | 0.20 | [0.06, 0.35] | 0.11 | [−0.03, 0.24] | 0.07 | [−0.07, 0.21] | 0.08 | [−0.08, 0.23] | 0.08 | [−0.06, 0.20] |
References
- Jäger, A.O. Mehrmodale Klassifikation von Intelligenzleistungen: Experimentell kontrollierte Weiterentwicklung eines deskriptiven Intelligenzstrukturmodells [Multimodal classifications of intelligence performance: Experimentally controlled development of a descriptive model of intelligence]. Diagnostica 1982, 28, 195–225. [Google Scholar]
- Süß, H.-M.; Beauducel, A. Modeling the construct validity of the Berlin Intelligence Structure Model. Estud. Psicol. (Campinas) 2015, 32, 13–25. [Google Scholar] [CrossRef] [Green Version]
- Goldberg, L.R. The structure of phenotypic personality traits. Am. Psychol. 1993, 48, 26–34. [Google Scholar] [CrossRef] [PubMed]
- Musek, J. A general factor of personality: Evidence for the Big One in the five-factor model. J. Res. Personal. 2007, 41, 1213–1233. [Google Scholar] [CrossRef]
- Musek, J. The General Factor of Personality: Ten Years After. Psihol. Teme 2017, 26, 61–87. [Google Scholar]
- Digman, J.M. Higher-order factors of the Big Five. J. Personal. Soc. Psychol. 1997, 73, 1246–1256. [Google Scholar] [CrossRef]
- DeYoung, C.G.; Peterson, J.B.; Higgins, D.M. Higher-order factors of the Big Five predict conformity: Are there neuroses of health? Personal. Individ. Differ. 2002, 33, 533–552. [Google Scholar] [CrossRef] [Green Version]
- Bäckström, M.; Björklund, F.; Larsson, M.R. Five-factor inventories have a major general factor related to social desirability which can be reduced by framing items neutrally. J. Res. Personal. 2009, 43, 335–344. [Google Scholar] [CrossRef]
- Just, C. A review of literature on the general factor of personality. Personal. Individ. Differ. 2011, 50, 765–771. [Google Scholar] [CrossRef]
- Pettersson, E.; Turkheimer, E.; Horn, E.E.; Menatti, A.R. The General Factor of Personality and Evaluation: General factor of personality and evaluation. Eur. J. Personal. 2012, 26, 292–302. [Google Scholar] [CrossRef]
- Revelle, W.; Wilt, J. The general factor of personality: A general critique. J. Res. Personal. 2013, 47, 493–504. [Google Scholar] [CrossRef] [PubMed] [Green Version]
- Danay, E.; Ziegler, M. Is there really a single factor of personality? A multirater approach to the apex of personality. J. Res. Personal. 2011, 45, 560–567. [Google Scholar] [CrossRef]
- Ziegler, M.; Bühner, M. Modeling Socially Desirable Responding and Its Effects. Educ. Psychol. Meas. 2009, 69, 548–565. [Google Scholar] [CrossRef] [Green Version]
- Beauducel, A.; Liepmann, D.; Felfe, J.; Nettelnstroth, W. The Impact of Different Measurement Models for Fluid and Crystallized Intelligence on the Correlation with Personality Traits. Eur. J. Psychol. Assess. 2007, 23, 71–78. [Google Scholar] [CrossRef]
- Raven, J. Advanced Progressive Matrices; Lewis: London, UK, 1958. [Google Scholar]
- Gignac, G.E. Raven’s is not a pure measure of general intelligence: Implications for g factor theory and the brief measurement of g. Intelligence 2015, 52, 71–79. [Google Scholar] [CrossRef]
- Costa, P.T.; McCrae, R.R. Revised NEO Personality Inventory (NEO PI-R) and NEO Five-Factor Inventory (NEO-FFI): Professional Manual; Psychological Assessment Resources, Inc.: Lutz, FL, USA, 1992. [Google Scholar]
- Rammstedt, B.; John, O.P. Measuring personality in one minute or less: A 10-item short version of the Big Five Inventory in English and German. J. Res. Personal. 2007, 41, 203–212. [Google Scholar] [CrossRef]
- Schneider, R.J.; Hough, L.M.; Dunnette, M.D. Broadsided by broad traits: How to sink science in five dimensions or less. J. Organ. Behav. 1996, 17, 639–655. [Google Scholar] [CrossRef]
- Schneider, W.J.; Newman, D.A. Intelligence is multidimensional: Theoretical review and implications of specific cognitive abilities. Hum. Resour. Manag. Rev. 2015, 25, 12–27. [Google Scholar] [CrossRef]
- Stankov, L. Overemphasized “g”. J. Intell. 2017, 5, 33. [Google Scholar] [CrossRef]
- Ackerman, P.L. The Search for Personality–Intelligence Relations: Methodological and Conceptual Issues. J. Intell. 2018, 6, 2. [Google Scholar] [CrossRef]
- Wittmann, W.W. Multivariate reliability theory: Principles of symmetry and successful validation strategies. In Handbook of Multivariate Experimental Psychology; Nesselroade, J.R., Cattell, R.B., Eds.; Plenum Press: New York, NY, USA, 1988; pp. 505–560. [Google Scholar]
- Wittmann, W.W.; Süß, H.-M. Investigating the paths between working memory, intelligence, knowledge, and complex problem-solving performances via Brunswik symmetry. In Learning and Individual Differences: Process, Trait and Content Determinants; Ackerman, P.L., Kyllonen, P.C., Roberts, R.D., Eds.; APA: Washington, DC, USA, 1999; pp. 77–104. [Google Scholar]
- Brunswik, E. Representative design and probabilistic theory in a functional psychology. Psychol. Rev. 1955, 62, 193–217. [Google Scholar] [CrossRef] [PubMed]
- Nesselroade, J.R.; McArdle, J.J. On the mismatching of levels of abstraction in mathematical-statistical model fitting. In Biological and Neuropsychological Mechanisms: Life-Span Developmental Psychology; Reese, H.W., Franzen, M.D., Eds.; Lawrence Erlbaum Associates, Inc.: Hillsdale, NJ, USA, 1997; pp. 23–49. [Google Scholar]
- Ashton, M.C.; Lee, K.; Vernon, P.A.; Jang, K.L. Fluid Intelligence, Crystallized Intelligence, and the Openness/Intellect Factor. J. Res. Personal. 2000, 34, 198–207. [Google Scholar] [CrossRef]
- Kretzschmar, A. Konstruktvalidität des komplexen Problemlösens unter besonderer Berücksichtigung moderner diagnostischer Ansätze [Construct Validity of Complex Problem Solving with Particular Focus on Modern Assessment Approaches]. Ph.D. Thesis, University of Luxembourg, Luxembourg, 2015. [Google Scholar]
- Kretzschmar, A.; Hacatrjana, L.; Rascevska, M. Re-evaluating the psychometric properties of MicroFIN: A multidimensional measurement of complex problem solving or a unidimensional reasoning test? Psychol. Test Assess. Model. 2017, 59, 157–182. [Google Scholar]
- Wittmann, W.W.; Hattrup, K. The relationship between performance in dynamic systems and intelligence. Syst. Res. Behav. Sci. 2004, 21, 393–409. [Google Scholar] [CrossRef]
- Zech, A.; Bühner, M.; Kröner, S.; Heene, M.; Hilbert, S. The Impact of Symmetry: Explaining Contradictory Results Concerning Working Memory, Reasoning, and Complex Problem Solving. J. Intell. 2017, 5, 22. [Google Scholar] [CrossRef]
- Coyle, T.R.; Snyder, A.C.; Richmond, M.C.; Little, M. SAT non-g residuals predict course specific GPAs: Support for investment theory. Intelligence 2015, 51, 57–66. [Google Scholar] [CrossRef]
- Kretzschmar, A.; Neubert, J.C.; Wüstenberg, S.; Greiff, S. Construct validity of complex problem solving: A comprehensive view on different facets of intelligence and school grades. Intelligence 2016, 54, 55–69. [Google Scholar] [CrossRef]
- Spengler, M.; Lüdtke, O.; Martin, R.; Brunner, M. Personality is related to educational outcomes in late adolescence: Evidence from two large-scale achievement studies. J. Res. Personal. 2013, 47, 613–625. [Google Scholar] [CrossRef]
- Wittmann, W.W.; Matt, G.E. Aggregation und Symmetrie. Grundlagen einer multivariaten Reliabilitäts- und Validitätstheorie, dargestellt am Beispiel der differentiellen Validität des Berliner Intelligenzstrukturmodells [Aggregation and symmetry: Foundations of a multivariate reliability and validity theory demonstrated via the differential validity of the Berlin model of intelligence]. Diagnostica 1986, 32, 309–329. [Google Scholar]
- Wittmann, W.W.; Süß, H.-M. Vorhersage und Erklärung von Schulnoten durch das Berliner Intelligenzstrukturmodell [Prediction and Explanation of School Grades using the Berlin Intelligence Structure model (BIS)]. In Theorie und Praxis der Beratung. Beratung in Schule, Familie, Beruf und Betrieb. Beiträge zur Arbeitsmarkt- und Berufsforschung; Ertelt, B.-J., Hofer, M., Eds.; Institut für Arbeitsmarkt- und Berufsforschung der Bundesanstalt für Arbeit: Nürnberg, Germany, 1996; pp. 161–183. [Google Scholar]
- Paunonen, S.V.; Ashton, M.C. Big Five factors and facets and the prediction of behavior. J. Personal. Soc. Psychol. 2001, 81, 524–539. [Google Scholar] [CrossRef]
- Salgado, J.F.; Moscoso, S.; Sanchez, J.I.; Alonso, P.; Choragwicka, B.; Berges, A. Validity of the five-factor model and their facets: The impact of performance measure and facet residualization on the bandwidth-fidelity dilemma. Eur. J. Work. Organ. Psychol. 2015, 24, 325–349. [Google Scholar] [CrossRef]
- Ziegler, M.; Bensch, D.; Maaß, U.; Schult, V.; Vogel, M.; Bühner, M. Big Five facets as predictor of job training performance: The role of specific job demands. Learn. Individ. Differ. 2014, 29, 1–7. [Google Scholar] [CrossRef]
- Cronbach, L.J.; Gleser, G.C. Psychological Tests and Personnel Decisions; University of Illinois Press: Oxford, UK, 1965. [Google Scholar]
- Ackerman, P.L.; Heggestad, E.D. Intelligence, personality, and interests: Evidence for overlapping traits. Psychol. Bull. 1997, 121, 219–245. [Google Scholar] [CrossRef] [PubMed]
- Chamorro-Premuzic, T.; Furnham, A. Personality and Intellectual Competence; Lawrence Erlbaum Associates Publishers: Mahwah, NJ, USA, 2005; ISBN 978-1-4106-1264-9. [Google Scholar]
- Collis, J.M.; Messick, S.J. Intelligence and Personality: Bridging the Gap in Theory and Measurement; Taylor and Francis: Hove, UK, 2001; ISBN 978-1-4106-0441-5. [Google Scholar]
- Moutafi, J.; Furnham, A.; Crump, J. What facets of openness and conscientiousness predict fluid intelligence score? Learn. Individ. Differ. 2006, 16, 31–42. [Google Scholar] [CrossRef]
- Rammstedt, B.; Lechner, C.; Danner, D. Relationships between Personality and Cognitive Ability: A Facet-Level Analysis. J. Intell. 2018, 6, 28. [Google Scholar] [CrossRef]
- Ackerman, P.L.; Goff, M. Typical intellectual engagement and personality: Reply to Rocklin (1994). J. Educ. Psychol. 1994, 86, 150–153. [Google Scholar] [CrossRef]
- Goff, M.; Ackerman, P.L. Personality-intelligence relations: Assessment of typical intellectual engagement. J. Educ. Psychol. 1992, 84, 537–552. [Google Scholar] [CrossRef]
- Reeve, C.L.; Meyer, R.D.; Bonaccio, S. Intelligence–personality associations reconsidered: The importance of distinguishing between general and narrow dimensions of intelligence. Intelligence 2006, 34, 387–402. [Google Scholar] [CrossRef]
- Rikoon, S.H.; Brenneman, M.; Kim, L.E.; Khorramdel, L.; MacCann, C.; Burrus, J.; Roberts, R.D. Facets of conscientiousness and their differential relationships with cognitive ability factors. J. Res. Personal. 2016, 61, 22–34. [Google Scholar] [CrossRef] [Green Version]
- Graham, E.K.; Lachman, M.E. Personality traits, facets and cognitive performance: Age differences in their relations. Personal. Individ. Differ. 2014, 59, 89–95. [Google Scholar] [CrossRef] [PubMed] [Green Version]
- Osmon, D.C.; Santos, O.; Kazakov, D.; Kassel, M.T.; Mano, Q.R.; Morth, A. Big Five personality relationships with general intelligence and specific Cattell-Horn-Carroll factors of intelligence. Personal. Individ. Differ. 2018, 131, 51–56. [Google Scholar] [CrossRef]
- Ziegler, M.; Danay, E.; Heene, M.; Asendorpf, J.; Bühner, M. Openness, fluid intelligence, and crystallized intelligence: Toward an integrative model. J. Res. Personal. 2012, 46, 173–183. [Google Scholar] [CrossRef]
- Loehlin, J.C.; Bartels, M.; Boomsma, D.I.; Bratko, D.; Martin, N.G.; Nichols, R.C.; Wright, M.J. Is There a Genetic Correlation Between General Factors of Intelligence and Personality? Twin Res. Hum. Genet. 2015, 18, 234–242. [Google Scholar] [CrossRef] [PubMed] [Green Version]
- Woodley, M.A. The cognitive differentiation-integration effort hypothesis: A synthesis between the fitness indicator and life history models of human intelligence. Rev. Gen. Psychol. 2011, 15, 228–245. [Google Scholar] [CrossRef]
- De Groot, A.D. The meaning of “significance” for different types of research [translated and annotated by Eric-Jan Wagenmakers, Denny Borsboom, Josine Verhagen, Rogier Kievit, Marjan Bakker, Angelique Cramer, Dora Matzke, Don Mellenbergh, and Han L. J. van der Maas]. Acta Psychol. 2014, 148, 188–194. [Google Scholar] [CrossRef] [PubMed]
- Curran, P.J.; Hussong, A.M. Integrative data analysis: The simultaneous analysis of multiple data sets. Psychol. Methods 2009, 14, 81–100. [Google Scholar] [CrossRef] [PubMed]
- Schubert, A.-L.; Hagemann, D.; Frischkorn, G.T. Is General Intelligence Little More Than the Speed of Higher-Order Processing? J. Exp. Psychol. Gen. 2017, 146, 1498. [Google Scholar] [CrossRef] [PubMed]
- Kessels, U.; Steinmayr, R. Macho-man in school: Toward the role of gender role self-concepts and help seeking in school performance. Learn. Individ. Differ. 2013, 23, 234–240. [Google Scholar] [CrossRef]
- Bergold, S.; Wirthwein, L.; Rost, D.H.; Steinmayr, R. What happens if the same curriculum is taught in five instead of six years? A quasi-experimental investigation of the effect of schooling on intelligence. Cogn. Dev. 2017, 44, 98–109. [Google Scholar] [CrossRef]
- Ziegler, M.; Knogler, M.; Bühner, M. Conscientiousness, achievement striving, and intelligence as performance predictors in a sample of German psychology students: Always a linear relationship? Learn. Individ. Differ. 2009, 19, 288–292. [Google Scholar] [CrossRef]
- Bergold, S.; Steinmayr, R. Personality and Intelligence Interact in the Prediction of Academic Achievement. J. Intell. 2018, 6, 27. [Google Scholar] [CrossRef]
- Ostendorf, F.; Angleitner, A. NEO-Persönlichkeitsinventar nach Costa und McCrae, Revidierte Fassung (NEO-PI-R) [Revised NEO Personality Inventory by Costa and McCrae (NEO-PI-R)]; Hogrefe: Göttingen, Germany, 2003. [Google Scholar]
- Gignac, G.E. Partial Confirmatory Factor Analysis: Described and Illustrated on the NEO–PI–R. J. Personal. Assess. 2009, 91, 40–47. [Google Scholar] [CrossRef] [PubMed]
- Vassend, O.; Skrondal, A. The NEO personality inventory revised (NEO-PI-R): Exploring the measurement structure and variants of the five-factor model. Personal. Individ. Differ. 2011, 50, 1300–1304. [Google Scholar] [CrossRef]
- Amthauer, R.; Brocke, B.; Liepmann, D.; Beauducel, A. I-S-T 2000 R—Intelligenz-Struktur-Test 2000 R [Intelligence Structure Test 2000 (revised)]; Hogrefe: Göttingen, Germany, 2001. [Google Scholar]
- Gignac, G.E.; Szodorai, E.T. Effect size guidelines for individual differences researchers. Personal. Individ. Differ. 2016, 102, 74–78. [Google Scholar] [CrossRef]
- Cooper, H.; Patall, E.A. The relative benefits of meta-analysis conducted with individual participant data versus aggregated data. Psychol. Methods 2009, 14, 165–176. [Google Scholar] [CrossRef] [PubMed]
- Cumming, G. The New Statistics: Why and How. Psychol. Sci. 2013, 25, 7–29. [Google Scholar] [CrossRef] [PubMed]
- Cohen, J.W. Statistical Power Analysis for the Behavioral Sciences; Erlbaum: Hillsdale, NJ, USA, 1988. [Google Scholar]
- Wilcox, R.R. Comparing dependent robust correlations. Br. J. Math. Stat. Psychol. 2016, 69, 215–224. [Google Scholar] [CrossRef] [PubMed]
- Goertzen, J.R.; Cribbie, R.A. Detecting a lack of association: An equivalence testing approach. Br. J. Math. Stat. Psychol. 2010, 63, 527–537. [Google Scholar] [CrossRef] [PubMed]
- Lakens, D. Equivalence Tests: A Practical Primer for tTests, Correlations, and Meta-Analyses. Soc. Psychol. Personal. Sci. 2017, 8, 355–362. [Google Scholar] [CrossRef] [PubMed]
- Kajonius, P.J.; Johnson, J. Sex differences in 30 facets of the five factor model of personality in the large public (N = 320, 128). Personal. Individ. Differ. 2018, 129, 126–130. [Google Scholar] [CrossRef]
- Daseking, M.; Petermann, F.; Waldmann, H.-C. Sex differences in cognitive abilities: Analyses for the German WAIS-IV. Personal. Individ. Differ. 2017, 114, 145–150. [Google Scholar] [CrossRef]
- Lynn, R.; Irwing, P. Sex differences on the progressive matrices: A meta-analysis. Intelligence 2004, 32, 481–498. [Google Scholar] [CrossRef]
- Schönbrodt, F.D.; Perugini, M. At what sample size do correlations stabilize? J. Res. Personal. 2013, 47, 609–612. [Google Scholar] [CrossRef] [Green Version]
- Hirschfeld, G.; von Brachel, R.; Thielsch, M. Selecting items for Big Five questionnaires: At what sample size do factor loadings stabilize? J. Res. Personal. 2014, 53, 54–63. [Google Scholar] [CrossRef]
- Spearman, C. The Proof and Measurement of Association between Two Things. Am. J. Psychol. 1904, 15, 72–101. [Google Scholar] [CrossRef]
- Padilla, M.A.; Veprinsky, A. Correlation Attenuation Due to Measurement Error: A New Approach Using the Bootstrap Procedure. Educ. Psychol. Meas. 2012, 72, 827–846. [Google Scholar] [CrossRef]
- R Core Team. R: A Language and Environment for Statistical Computing; R Foundation for Statistical Computing: Vienna, Austria, 2017. [Google Scholar]
- Stanley, D. apaTables: Create American Psychological Association (APA) Style Tables (Version 2.0.2). 2018. Available online: https://CRAN.R-project.org/package=apaTables (accessed on 3 July 2018).
- Microsoft Corporation; Weston, S. Foreach: Provides Foreach Looping Construct for R (Version 1.4.4). 2017. Available online: https://CRAN.R-project.org/package=foreach (accessed on 3 July 2018).
- Microsoft Corporation; Weston, S. doParallel: Foreach Parallel Adaptor for the “Parallel” Package (Version 1.0.11). 2017. Available online: https://CRAN.R-project.org/package=doParallel (accessed on 3 July 2018).
- Wickham, H. ggplot2: Elegant Graphics for Data Analysis; Springer: New York, NY, USA, 2009; ISBN 978-0-387-98140-6. [Google Scholar]
- Auguie, B. gridExtra: Miscellaneous Functions for “Grid” Graphics (Version 2.3). 2017. Available online: https://CRAN.R-project.org/package=gridExtra (accessed on 3 July 2018).
- Rosseel, Y. lavaan: An R Package for Structural Equation Modeling. J. Stat. Softw. 2012, 48, 1–36. [Google Scholar] [CrossRef]
- Revelle, W. Psych: Procedures for Psychological, Psychometric, and Personality Research (Version 1.8.4); Northwestern University: Evanston, IL, USA, 2017. [Google Scholar]
- Wilcox, R.R.; Schönbrodt, F.D. The WRS Package for Robust Statistics in R (Version 0.30.1). 2017. Available online: https://github.com/nicebread/WRS (accessed on 3 July 2018).
- Dahl, D.B. xtable: Export Tables to LaTeX or HTML (Version 1.8-.2). 2016. Available online: https://CRAN.R-project.org/package=xtable (accessed on 3 July 2018).
- Borkenau, P.; Ostendorf, F. NEO-Fünf-Faktoren-Inventar (NEO-FFI); Hogrefe: Göttingen, Germany, 1993. [Google Scholar]
- Gignac, G.E. Multi-factor modeling in individual differences research: Some recommendations and suggestions. Personal. Individ. Differ. 2007, 42, 37–48. [Google Scholar] [CrossRef]
- Jäger, A.O.; Süß, H.-M.; Beauducel, A. Berliner Intelligenzstruktur-Test. Form 4 [Berlin Intelligence-Structure Test. Version 4]; Hogrefe: Göttingen, Germany, 1997. [Google Scholar]
- Jäger, A.O. Intelligenzstrukturforschung: Konkurrierende Modelle, neue Entwicklungen, Perspektiven. [Structural research on intelligence: Competing models, new developments, perspectives]. Psychol. Rundsch. 1984, 35, 21–35. [Google Scholar]
- McGrew, K.S. CHC theory and the human cognitive abilities project: Standing on the shoulders of the giants of psychometric intelligence research. Intelligence 2009, 37, 1–10. [Google Scholar] [CrossRef]
- Süß, H.-M.; Beauducel, A. Intelligenztests und ihre Bezüge zu Intelligenztheorien. [Intelligence tests and their relationships to theories of intelligence]. In Enzyklopädie der Psychologie, Band. 3: Serie Psychologische Diagnostik: Leistungs-, Intelligenz- und Verhaltensdiagnostik; Hornke, L.F., Amelang, M., Kersting, M., Eds.; Hogrefe: Göttingen, Germany, 2011; pp. 97–234. ISBN 978-3-8017-1526-7. [Google Scholar]
- Cohen, P.; Cohen, J.; Aiken, L.S.; West, S.G. The Problem of Units and the Circumstance for POMP. Multivar. Behav. Res. 1999, 34, 315–346. [Google Scholar] [CrossRef]
- Furnham, A.; Treglown, L. High potential personality and intelligence. Personal. Individ. Differ. 2018, 128, 81–87. [Google Scholar] [CrossRef]
- Dunkel, C.S. The general factor of personality and general intelligence: Evidence for substantial association. Intelligence 2013, 41, 423–427. [Google Scholar] [CrossRef]
- Schermer, J.A.; Vernon, P.A. The correlation between general intelligence (g), a general factor of personality (GFP), and social desirability. Personal. Individ. Differ. 2010, 48, 187–189. [Google Scholar] [CrossRef]
- Dunkel, C.S.; de Baca, T.C. Replication of the association between general intelligence and the general factor of personality using the California Child Q-set. Intelligence 2016, 56, 35–37. [Google Scholar] [CrossRef]
- Dunkel, C.S.; Cabeza De Baca, T.; Woodley, M.A.; Fernandes, H.B.F. The General Factor of Personality and general intelligence: Testing hypotheses from Differential-K, Life History Theory, and strategic differentiation–integration effort. Personal. Individ. Differ. 2014, 61–62, 13–17. [Google Scholar] [CrossRef]
- Jensen, A.R.; Wang, L.-J. What is a good g? Intelligence 1994, 18, 231–258. [Google Scholar] [CrossRef]
- Ackerman, P.L. A theory of adult intellectual development: Process, personality, interests, and knowledge. Intelligence 1996, 22, 227–257. [Google Scholar] [CrossRef]
- Ziegler, M.; Cengia, A.; Mussel, P.; Gerstorf, D. Openness as a buffer against cognitive decline: The Openness-Fluid-Crystallized-Intelligence (OFCI) model applied to late adulthood. Psychol. Aging 2015, 30, 573–588. [Google Scholar] [CrossRef] [PubMed]
- Von Stumm, S.; Ackerman, P.L. Investment and intellect: A review and meta-analysis. Psychol. Bull. 2013, 139, 841–869. [Google Scholar] [CrossRef] [PubMed]
- Lechner, C.; Danner, D.; Rammstedt, B. How is personality related to intelligence and achievement? A replication and extension of Borghans et al. and Salkever. Personal. Individ. Differ. 2017, 111, 86–91. [Google Scholar] [CrossRef]
- Moutafi, J.; Furnham, A.; Crump, J. Demographic and personality predictors of intelligence: A study using the Neo Personality Inventory and the Myers-Briggs Type Indicator. Eur. J. Personal. 2003, 17, 79–94. [Google Scholar] [CrossRef]
- Moutafi, J.; Furnham, A.; Tsaousis, I. Is the relationship between intelligence and trait Neuroticism mediated by test anxiety? Personal. Individ. Differ. 2006, 40, 587–597. [Google Scholar] [CrossRef]
- Brown, T.A. Confirmatory Factor Analysis for Applied Research, 2nd ed.; Methodology in the Social Sciences; The Guilford Press: New York, NY, USA; London, UK, 2015; ISBN 1-4625-1779-X. [Google Scholar]
- Gignac, G.E.; Kretzschmar, A. Evaluating dimensional distinctness with correlated-factor models: Limitations and suggestions. Intelligence 2017, 62, 138–147. [Google Scholar] [CrossRef]
- Johnson, W.; te Nijenhuis, J.; Bouchard, T.J. Still just 1 g: Consistent results from five test batteries. Intelligence 2008, 36, 81–95. [Google Scholar] [CrossRef]
- Valerius, S.; Sparfeldt, J.R. Consistent g- as well as consistent verbal-, numerical- and figural-factors in nested factor models? Confirmatory factor analyses using three test batteries. Intelligence 2014, 44, 120–133. [Google Scholar] [CrossRef]
- Costa, P.T.; McCrae, R.R. Bibliography for the Revised NEO Personality Inventory (NEO PI-R) and NEO Five-Factor Inventory (NEO-FFI); Psychological Assessment Resources, Inc.: Lutz, FL, USA, 2003. [Google Scholar]
- John, O.P.; Srivastava, S. The Big Five trait taxonomy: History, measurement, and theoretical perspectives. In Handbook of Personality: Theory and Research; Pervin, L.A., John, O.P., Eds.; Guilford Press: New York, NY, USA, 1999; pp. 102–138. [Google Scholar]
- Mõttus, R.; Kandler, C.; Bleidorn, W.; Riemann, R.; McCrae, R.R. Personality traits below facets: The consensual validity, longitudinal stability, heritability, and utility of personality nuances. J. Personal. Soc. Psychol. 2017, 112, 474–490. [Google Scholar] [CrossRef] [PubMed]
- Beauducel, A.; Kersting, M. Fluid and Crystallized Intelligence and the Berlin Model of Intelligence Structure (BIS). Eur. J. Psychol. Assess. 2002, 18, 97–112. [Google Scholar] [CrossRef]
- Beauducel, A.; Brocke, B.; Liepmann, D. Perspectives on fluid and crystallized intelligence: Facets for verbal, numerical, and figural intelligence. Personal. Individ. Differ. 2001, 30, 977–994. [Google Scholar] [CrossRef]
- Wrzus, C.; Mehl, M.R. Lab and/or Field? Measuring Personality Processes and Their Social Consequences: Lab and/or field? Eur. J. Personal. 2015, 29, 250–271. [Google Scholar] [CrossRef]
- Greiff, S.; Wüstenberg, S.; Avvisati, F. Computer-generated log-file analyses as a window into students’ minds? A showcase study based on the PISA 2012 assessment of problem solving. Comput. Educ. 2015, 91, 92–105. [Google Scholar] [CrossRef]
- Müller, J.C.; Kretzschmar, A.; Greiff, S. Exploring exploration: Inquiries into exploration behavior in complex problem solving assessment. In Proceedings of the 6th International Conference on Educational Data Mining, Memphis, TN, USA, 6–9 July 2013; D’Mello, S.K., Calvo, R.A., Olney, A., Eds.; International Educational Data Mining Society, 2013; pp. 336–337, ISBN 978-0-9839525-2-7. [Google Scholar]
- Wagener, D. Psychologische Diagnostik mit komplexen Szenarios—Taxonomie, Entwicklung, Evaluation [Psychological Assessment with Complex Scenarios—Taxonomy, Development, Evaluation]; Pabst Science Publishers: Lengerich, Germany, 2001. [Google Scholar]
- Dörner, D.; Funke, J. Complex Problem Solving: What It Is and What It Is Not. Front. Psychol. 2017, 8, 1153. [Google Scholar] [CrossRef] [PubMed]
- Funke, J.; Buchner, A.; Dörner, D.; Süß, H.-M.; Vollmeyer, R. Disskusionsrunde zum Themenheft “Komplexes Problemlösen” [Discussion of the topic: Complex problem-solving]. Psychol. Rundsch. 1999, 50, 229–233. [Google Scholar] [CrossRef]
- Dörner, D.; Kreuzig, H.W.; Reither, F.; Stäudel, T. Lohhausen: Vom Umgang mit Unbestimmtheit und Komplexität [Lohhausen: Dealing with Uncertainty and Complexity]; Huber: Bern, Switzerland, 1983. [Google Scholar]
- Fischer, A.; Holt, D.; Funke, J. Promoting the growing field of Dynamic Decision Making. J. Dyn. Decis. Mak. 2015, 1, 1–3. [Google Scholar] [CrossRef]
- Gonzalez, C.; Vanyukov, P.; Martin, M.K. The use of microworlds to study dynamic decision making. Comput. Hum. Behav. 2005, 21, 273–286. [Google Scholar] [CrossRef] [Green Version]
- Kröner, S.; Plass, J.L.; Leutner, D. Intelligence assessment with computer simulations. Intelligence 2005, 33, 347–368. [Google Scholar] [CrossRef]
- Süß, H.-M.; Kretzschmar, A. Impact of Cognitive Abilities and Prior Knowledge on Complex Problem Solving Performance—Empirical Results and a Plea for Ecologically Valid Microworlds. Front. Psychol. 2018, 9, 626. [Google Scholar] [CrossRef] [PubMed]
- Nickel, L.B.; Roberts, B.W.; Chernyshenko, O.S. No evidence of a curvilinear relation between conscientiousness and relationship, work, and health outcomes. J. Personal. Soc. Psychol. 2018. [Google Scholar] [CrossRef] [PubMed]
- Austin, E.J.; Deary, I.J.; Gibson, G.J. Relationships between ability and personality: Three hypotheses tested. Intelligence 1997, 25, 49–70. [Google Scholar] [CrossRef]
- Wicherts, J.M.; Borsboom, D.; Kats, J.; Molenaar, D. The poor availability of psychological research data for reanalysis. Am. Psychol. 2006, 61, 726–728. [Google Scholar] [CrossRef] [PubMed]
- Vanpaemel, W.; Vermorgen, M.; Deriemaecker, L.; Storms, G. Are We Wasting a Good Crisis? The Availability of Psychological Research Data after the Storm. Collabra 2015, 1, 1–5. [Google Scholar] [CrossRef] [Green Version]
- Wicherts, J.M. Science revolves around the data. J. Open Psychol. Data 2013, 1, e1. [Google Scholar] [CrossRef]
- Navarro-González, D.; Ferrando, P.J.; Vigil-Colet, A. Is general intelligence responsible for differences in individual reliability in personality measures? Personal. Individ. Differ. 2018, 130, 1–5. [Google Scholar] [CrossRef]
- Rammstedt, B.; Farmer, R.F. The impact of acquiescence on the evaluation of personality structure. Psychol. Assess. 2013, 25, 1137–1145. [Google Scholar] [CrossRef] [PubMed]
- Toomela, A. Relationships between personality structure, structure of word meaning, and cognitive ability: A study of cultural mechanisms of personality. J. Personal. Soc. Psychol. 2003, 85, 723–735. [Google Scholar] [CrossRef] [PubMed]
- Ziegler, M.; Toomela, A.; Bühner, M. A Reanalysis of Toomela (2003): Spurious measurement error as cause for common variance between personality factors. Psychol. Sci. Q. 2009, 51, 65–75. [Google Scholar]
| 1 | From here on abbreviated as reasoning. |
| 2 | Sometimes the connection to the Brunswik symmetry principle [23] is not made explicitly in the literature. In addition, research considering the bandwidth-fidelity dilemma [40] is closely related to the Brunswik symmetry principle. In fact, the Brunswik symmetry principle as part of Wittmann’s [23] multivariate reliability theory can be considered as a formalization of the bandwidth-fidelity dilemma. |
| 3 | In [61] the same data set was used. In the original publication [58], only a subsample was used for the analysis as at one school testing time was more limited and students filled in a shortened testing battery not including the questionnaire on help-seeking. In the present study, we used the complete data set. Thus, the reported sample sizes differ. |
| 4 | |
| 5 | Please note that Wilcox’ [70] approach is based on Winsorized correlations (i.e., Pearson’s correlations with a correction for outliers). |
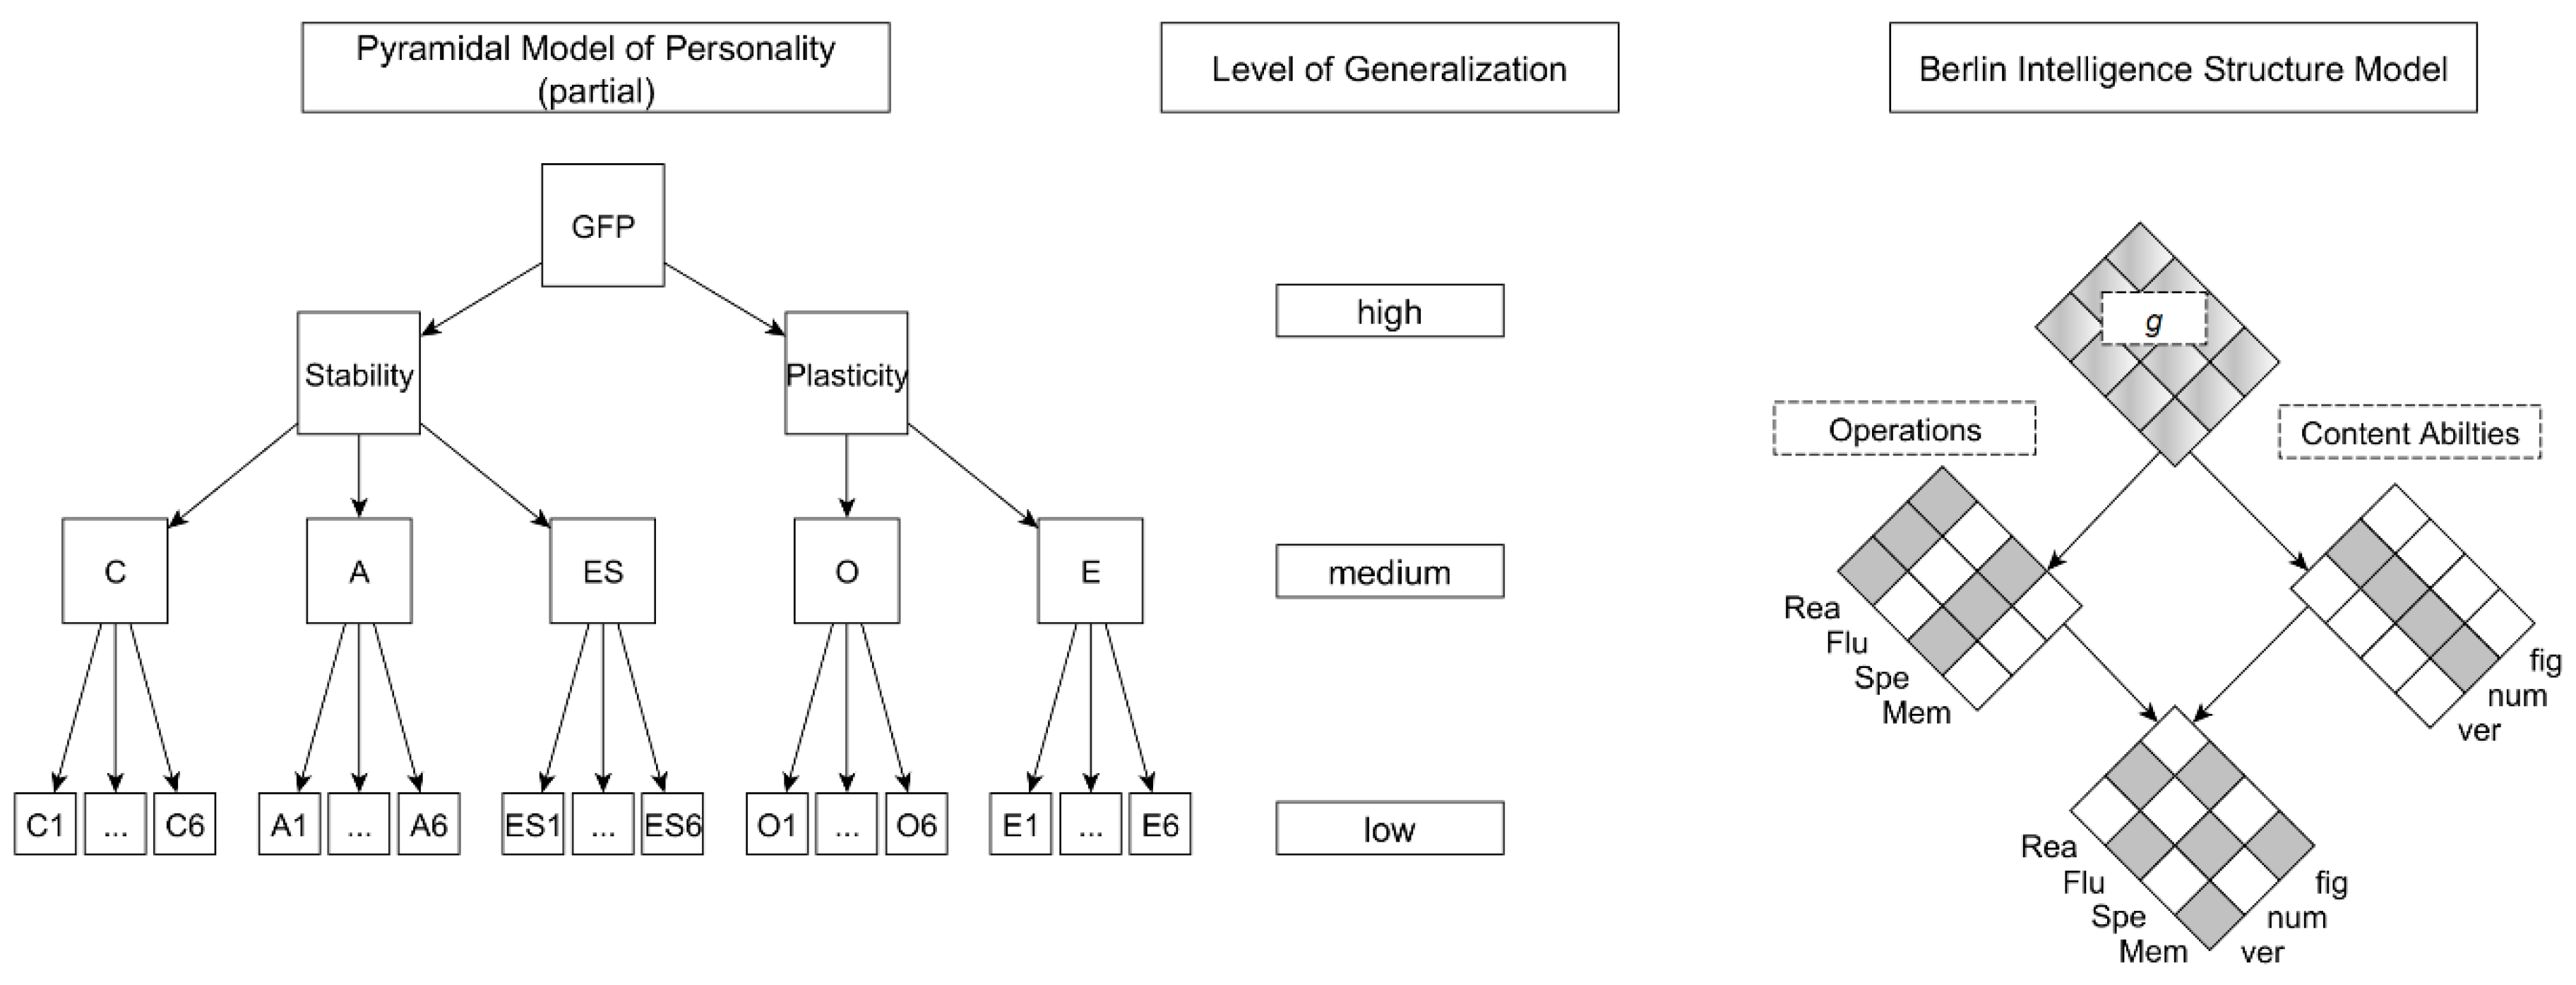
| 6 | Please note that the original conceptualization of the BIS model does not consider abilities at the lowest level as specific abilities but as performances based on a combination of second level abilities [1,93]. However, integrating commonly accepted and contemporary theories such as the Cattell-Horn-Carroll (CHC) theory [94] into the BIS model demonstrates that these performances are considered as specific abilities in other theories [95]. For the sake of compatibility between the different intelligence theories, we consider these performances as specific abilities in the present study. |
| 7 | Please note that we transformed the 45 test scores into POMP scores [96] instead of z-standardized scores as originally recommended in the test manual. |
| 8 | It should be emphasized that the IDA approach is dependent on the availability of data sets. During the preparation of the present study, we made similar experiences as, for example, Wicherts et al. [131] and Vanpaemel et al. [132] regarding the lack of available data from previously published studies. Therefore, we encourage researchers to follow the suggestions regarding reproducible science so that open data will be much more common for psychological research (e.g., [133]). |


| M | SD | Min | Max | ω | |
|---|---|---|---|---|---|
| Reasoning | 63.72 | 9.98 | 28.33 | 88.89 | 0.90 |
| Verbal Reasoning | 63.94 | 10.99 | 27.12 | 89.83 | 0.75 |
| Numerical Reasoning | 69.84 | 15.62 | 23.33 | 100.00 | 0.90 |
| Figural Reasoning | 58.45 | 12.59 | 23.33 | 91.67 | 0.80 |
| GFP | 2.42 | 0.24 | 1.64 | 3.16 | 0.95 |
| Stability | 2.30 | 0.28 | 1.50 | 3.11 | 0.93 |
| Plasticity | 2.53 | 0.32 | 1.55 | 3.64 | 0.92 |
| Openness | 2.58 | 0.39 | 1.42 | 3.71 | 0.89 |
| Conscientiousness | 2.44 | 0.41 | 1.15 | 3.77 | 0.92 |
| Extraversion | 2.49 | 0.41 | 0.81 | 3.56 | 0.91 |
| Agreeableness | 2.40 | 0.37 | 0.98 | 3.38 | 0.89 |
| Emotional Stability | 2.07 | 0.48 | 0.67 | 3.42 | 0.93 |
| O1: Fantasy | 2.62 | 0.60 | 0.88 | 4.00 | 0.78 |
| O2: Aesthetics | 2.72 | 0.75 | 0.50 | 4.00 | 0.82 |
| O3: Feelings | 2.91 | 0.56 | 0.50 | 4.00 | 0.82 |
| O4: Actions | 2.19 | 0.49 | 0.88 | 3.62 | 0.60 |
| O5: Ideas | 2.55 | 0.67 | 0.50 | 4.00 | 0.82 |
| O6: Values | 2.46 | 0.45 | 1.25 | 3.88 | 0.54 |
| C1: Competence | 2.68 | 0.47 | 1.12 | 3.88 | 0.72 |
| C2: Order | 2.31 | 0.60 | 0.38 | 3.88 | 0.73 |
| C3: Dutifulness | 2.67 | 0.53 | 0.88 | 4.00 | 0.74 |
| C4: Achievement Striving | 2.50 | 0.52 | 1.12 | 3.88 | 0.71 |
| C5: Self-Discipline | 2.31 | 0.62 | 0.12 | 3.75 | 0.81 |
| C6: Deliberation | 2.14 | 0.62 | 0.25 | 3.88 | 0.80 |
| E1: Warmth | 2.91 | 0.51 | 0.50 | 4.00 | 0.77 |
| E2: Gregariousness | 2.56 | 0.64 | 0.25 | 4.00 | 0.80 |
| E3: Assertiveness | 2.11 | 0.66 | 0.25 | 3.75 | 0.82 |
| E4: Activity | 2.25 | 0.51 | 0.88 | 3.75 | 0.67 |
| E5: Excitement-Seeking | 2.30 | 0.62 | 0.50 | 3.88 | 0.62 |
| E6: Positive Emotions | 2.83 | 0.64 | 0.38 | 4.00 | 0.83 |
| A1: Trust | 2.41 | 0.56 | 0.38 | 3.88 | 0.77 |
| A2: Straightforwardness | 2.25 | 0.59 | 0.50 | 3.88 | 0.70 |
| A3: Altruism | 2.89 | 0.49 | 1.12 | 4.00 | 0.74 |
| A4: Compliance | 2.02 | 0.54 | 0.25 | 3.50 | 0.66 |
| A5: Modesty | 2.13 | 0.59 | 0.25 | 3.75 | 0.76 |
| A6: Tender-Mindedness | 2.67 | 0.44 | 1.00 | 3.75 | 0.64 |
| -N1: Anxiety | 1.91 | 0.70 | 0.00 | 3.75 | 0.82 |
| -N2: Angry Hostility | 2.20 | 0.60 | 0.25 | 3.75 | 0.74 |
| -N3: Depression | 2.30 | 0.76 | 0.25 | 4.00 | 0.86 |
| -N4: Self-Consciousness | 1.93 | 0.60 | 0.25 | 3.75 | 0.72 |
| -N5: Impulsiveness | 1.75 | 0.53 | 0.38 | 3.25 | 0.61 |
| -N6: Vulnerability | 2.32 | 0.61 | 0.12 | 3.75 | 0.81 |
| Reasoning | Verbal Reasoning | Numerical Reasoning | Figural Reasoning | |||||
|---|---|---|---|---|---|---|---|---|
| GFP | 0.02 | [−0.06, 0.10] | 0.08 | [0.01, 0.15] | −0.02 | [−0.10, 0.06] | 0.01 | [−0.07, 0.08] |
| Stability | −0.02 | [−0.09, 0.06] | 0.02 | [−0.05, 0.09] | −0.01 | [−0.09, 0.06] | −0.05 | [−0.12, 0.03] |
| Plasticity | 0.05 | [−0.03, 0.13] | 0.10 | [0.02, 0.18] | −0.02 | [−0.09, 0.06] | 0.05 | [−0.03, 0.13] |
| Openness | 0.22 | [0.14, 0.29] | 0.32 | [0.25, 0.38] | 0.07 | [−0.01, 0.14] | 0.15 | [0.07, 0.23] |
| Conscientiousness | 0.06 | [−0.01, 0.13] | 0.06 | [−0.01, 0.13] | 0.04 | [−0.04, 0.11] | 0.04 | [−0.03, 0.11] |
| Extraversion | −0.12 | [−0.20, −0.05] | −0.14 | [−0.21, −0.07] | −0.09 | [−0.17, −0.02] | −0.06 | [−0.14, 0.01] |
| Agreeableness | −0.01 | [−0.10, 0.07] | 0.05 | [−0.03, 0.12] | 0.01 | [−0.07, 0.09] | −0.08 | [−0.17, −0.01] |
| Emotional Stability | −0.07 | [−0.15, 0.00] | −0.05 | [−0.12, 0.03] | −0.07 | [−0.14, 0.01] | −0.05 | [−0.13, 0.02] |
| O1: Fantasy | 0.19 | [0.12, 0.26] | 0.20 | [0.13, 0.27] | 0.10 | [0.03, 0.17] | 0.17 | [0.09, 0.24] |
| O2: Aesthetics | 0.12 | [0.05, 0.19] | 0.18 | [0.10, 0.25] | 0.01 | [−0.06, 0.08] | 0.12 | [0.04, 0.20] |
| O3: Feelings | 0.12 | [0.04, 0.20] | 0.16 | [0.08, 0.24] | 0.06 | [−0.02, 0.13] | 0.08 | [0.01, 0.17] |
| O4: Actions | 0.00 | [−0.08, 0.08] | 0.09 | [0.02, 0.16] | −0.03 | [−0.11, 0.05] | −0.03 | [−0.11, 0.05] |
| O5: Ideas | 0.25 | [0.17, 0.32] | 0.31 | [0.24, 0.38] | 0.11 | [0.04, 0.19] | 0.19 | [0.11, 0.26] |
| O6: Values | 0.14 | [0.06, 0.21] | 0.33 | [0.27, 0.40] | 0.02 | [−0.05, 0.10] | 0.02 | [−0.06, 0.09] |
| C1: Competence | 0.07 | [−0.00, 0.15] | 0.13 | [0.06, 0.20] | 0.02 | [−0.06, 0.10] | 0.03 | [−0.04, 0.11] |
| C2: Order | 0.07 | [−0.01, 0.14] | −0.00 | [−0.07, 0.07] | 0.04 | [−0.03, 0.12] | 0.10 | [0.03, 0.18] |
| C3: Dutifulness | 0.03 | [−0.05, 0.10] | 0.08 | [0.01, 0.14] | 0.01 | [−0.06, 0.09] | −0.02 | [−0.10, 0.06] |
| C4: Achievement Striving | −0.04 | [−0.12, 0.04] | 0.01 | [−0.07, 0.08] | −0.08 | [−0.15, 0.00] | −0.01 | [−0.09, 0.07] |
| C5: Self-discipline | −0.00 | [−0.07, 0.07] | −0.01 | [−0.08, 0.06] | 0.01 | [−0.06, 0.08] | −0.01 | [−0.08, 0.06] |
| C6: Deliberation | 0.13 | [0.05, 0.20] | 0.08 | [0.01, 0.15] | 0.13 | [0.05, 0.21] | 0.08 | [−0.00, 0.15] |
| E1: Warmth | −0.11 | [−0.19, −0.03] | −0.09 | [−0.16, −0.02] | −0.10 | [−0.18, −0.02] | −0.07 | [−0.15, 0.01] |
| E2: Gregariousness | −0.14 | [−0.21, −0.07] | −0.13 | [−0.20, −0.05] | −0.11 | [−0.19, −0.04] | −0.09 | [−0.16, −0.02] |
| E3: Assertiveness | −0.05 | [−0.13, 0.02] | −0.05 | [−0.12, 0.03] | −0.06 | [−0.13, 0.01] | −0.01 | [−0.09, 0.07] |
| E4: Activity | −0.04 | [−0.12, 0.03] | −0.06 | [−0.14, 0.01] | −0.02 | [−0.10, 0.06] | −0.03 | [−0.10, 0.05] |
| E5: Excitement-Seeking | −0.11 | [−0.18, −0.03] | −0.21 | [−0.28, −0.14] | −0.04 | [−0.12, 0.03] | −0.02 | [−0.10, 0.05] |
| E6: Positive Emotions | −0.05 | [−0.13, 0.02] | −0.05 | [−0.12, 0.02] | −0.04 | [−0.12, 0.04] | −0.03 | [−0.11, 0.04] |
| A1: Trust | 0.02 | [−0.06, 0.09] | 0.12 | [0.05, 0.19] | −0.01 | [−0.09, 0.07] | −0.05 | [−0.13, 0.02] |
| A2: Straightforwardness | 0.07 | [−0.01, 0.14] | 0.07 | [−0.00, 0.14] | 0.09 | [0.02, 0.16] | −0.01 | [−0.08, 0.07] |
| A3: Altruism | −0.03 | [−0.12, 0.05] | 0.00 | [−0.08, 0.08] | −0.04 | [−0.12, 0.04] | −0.04 | [−0.12, 0.04] |
| A4: Compliance | −0.02 | [−0.10, 0.06] | 0.04 | [−0.04, 0.12] | 0.01 | [−0.07, 0.09] | −0.09 | [−0.16, −0.01] |
| A5: Modesty | −0.09 | [−0.17, −0.02] | −0.08 | [−0.16, −0.01] | −0.02 | [−0.10, 0.05] | −0.12 | [−0.19, −0.04] |
| A6: Tender-Mindedness | 0.01 | [−0.07, 0.09] | 0.04 | [−0.03, 0.12] | 0.02 | [−0.06, 0.09] | −0.03 | [−0.11, 0.05] |
| -N1: Anxiety | −0.03 | [−0.11, 0.04] | −0.02 | [−0.10, 0.05] | −0.03 | [−0.10, 0.04] | −0.03 | [−0.11, 0.05] |
| -N2: Angry Hostility | −0.01 | [−0.09, 0.07] | 0.04 | [−0.03, 0.11] | −0.01 | [−0.09, 0.07] | −0.05 | [−0.13, 0.03] |
| -N3: Depression | −0.09 | [−0.17, −0.02] | −0.06 | [−0.13, 0.02] | −0.09 | [−0.17, −0.02] | −0.06 | [−0.13, 0.01] |
| -N4: Self-Consciousness | −0.11 | [−0.19, −0.04] | −0.11 | [−0.18, −0.03] | −0.12 | [−0.18, −0.05] | −0.04 | [−0.11, 0.04] |
| -N5: Impulsiveness | −0.01 | [−0.09, 0.07] | −0.03 | [−0.10, 0.05] | 0.01 | [−0.07, 0.08] | −0.01 | [−0.08, 0.06] |
| -N6: Vulnerability | −0.06 | [−0.13, 0.02] | −0.05 | [−0.12, 0.02] | −0.04 | [−0.12, 0.03] | −0.04 | [−0.12, 0.03] |
| M | SD | Min | Max | ω | |
|---|---|---|---|---|---|
| g | 47.24 | 7.88 | 16.59 | 72.47 | 0.90 |
| Reasoning | 49.50 | 13.67 | 10.97 | 90.68 | 0.86 |
| Fluency | 31.55 | 7.51 | 11.47 | 64.14 | 0.85 |
| Speed | 53.89 | 10.18 | 16.66 | 86.62 | 0.79 |
| Memory | 54.02 | 10.17 | 27.27 | 99.18 | 0.71 |
| Verbal Intelligence | 46.17 | 8.67 | 12.08 | 69.15 | 0.80 |
| Numerical Intelligence | 47.18 | 11.09 | 15.12 | 76.85 | 0.84 |
| Figural Intelligence | 46.37 | 8.94 | 19.42 | 73.59 | 0.77 |
| Verbal Reasoning | 52.99 | 15.21 | 11.94 | 96.11 | 0.74 |
| Numerical Reasoning | 53.28 | 17.30 | 9.17 | 95.56 | 0.75 |
| Figural Reasoning | 42.96 | 17.03 | 2.50 | 93.50 | 0.72 |
| Verbal Fluency | 25.74 | 8.25 | 3.85 | 58.01 | 0.79 |
| Numerical Fluency | 33.79 | 10.07 | 10.95 | 79.01 | 0.66 |
| Figural Fluency | 35.11 | 9.01 | 11.98 | 64.27 | 0.70 |
| Verbal Speed | 56.47 | 12.88 | 15.04 | 96.18 | 0.72 |
| Numerical Speed | 51.37 | 15.54 | 8.85 | 96.00 | 0.72 |
| Figural Speed | 53.85 | 10.83 | 26.09 | 100.00 | 0.69 |
| Verbal Memory | 51.75 | 11.82 | 16.21 | 100.00 | 0.53 |
| Numerical Memory | 50.68 | 15.15 | 12.73 | 100.00 | 0.62 |
| Figural Memory | 59.62 | 12.63 | 27.72 | 97.53 | 0.55 |
| GFP | 2.49 | 0.32 | 1.11 | 3.42 | 0.87 |
| Stability | 2.57 | 0.39 | 1.06 | 3.64 | 0.85 |
| Plasticity | 2.40 | 0.40 | 1.17 | 3.50 | 0.77 |
| Openness | 2.33 | 0.58 | 0.92 | 3.92 | 0.78 |
| Conscientiousness | 2.65 | 0.62 | 0.00 | 4.00 | 0.87 |
| Extraversion | 2.48 | 0.51 | 0.17 | 3.67 | 0.79 |
| Agreeableness | 2.63 | 0.47 | 0.75 | 3.92 | 0.74 |
| Emotional Stability | 2.43 | 0.60 | 0.25 | 3.82 | 0.84 |
| GFP | Stability | Plasticity | Openness | Conscientiousness | Extraversion | Agreeableness | Emotional Stability | |||||||||
|---|---|---|---|---|---|---|---|---|---|---|---|---|---|---|---|---|
| g | 0.15 | [0.05, 0.25] | 0.14 | [0.05, 0.24] | 0.10 | [0.00, 0.20] | 0.06 | [−0.04, 0.15] | 0.13 | [0.05, 0.22] | 0.08 | [−0.01, 0.18] | 0.06 | [−0.04, 0.15] | 0.09 | [−0.00, 0.18] |
| Reasoning | 0.15 | [0.04, 0.26] | 0.09 | [−0.01, 0.19] | 0.16 | [0.05, 0.26] | 0.22 | [0.12, 0.31] | 0.07 | [−0.02, 0.17] | −0.00 | [−0.09, 0.10] | 0.07 | [−0.04, 0.17] | 0.05 | [−0.06, 0.14] |
| Fluency | 0.13 | [0.04, 0.22] | 0.12 | [0.02, 0.21] | 0.08 | [−0.01, 0.18] | 0.01 | [−0.09, 0.12] | 0.12 | [0.03, 0.20] | 0.12 | [0.03, 0.21] | 0.02 | [−0.07, 0.11] | 0.10 | [0.01, 0.18] |
| Speed | 0.05 | [−0.04, 0.15] | 0.09 | [0.00, 0.19] | −0.01 | [−0.10, 0.08] | −0.09 | [−0.18, 0.01] | 0.11 | [0.02, 0.20] | 0.08 | [−0.02, 0.18] | 0.00 | [−0.09, 0.09] | 0.07 | [−0.03, 0.16] |
| Memory | 0.11 | [0.02, 0.21] | 0.14 | [0.05, 0.24] | 0.04 | [−0.05, 0.14] | −0.02 | [−0.12, 0.08] | 0.12 | [0.04, 0.21] | 0.08 | [−0.01, 0.19] | 0.08 | [−0.02, 0.18] | 0.09 | [−0.00, 0.17] |
| verbal Intelligence | 0.15 | [0.04, 0.24] | 0.06 | [−0.03, 0.16] | 0.18 | [0.09, 0.27] | 0.21 | [0.11, 0.29] | 0.07 | [−0.03, 0.16] | 0.04 | [−0.05, 0.14] | 0.01 | [−0.08, 0.11] | 0.03 | [−0.06, 0.12] |
| numerical Intelligence | 0.11 | [0.00, 0.22] | 0.19 | [0.09, 0.29] | −0.01 | [−0.11, 0.10] | −0.07 | [−0.17, 0.03] | 0.18 | [0.09, 0.27] | 0.06 | [−0.04, 0.16] | 0.09 | [−0.02, 0.20] | 0.12 | [0.02, 0.21] |
| figural Intelligence | 0.14 | [0.04, 0.24] | 0.08 | [−0.02, 0.17] | 0.15 | [0.06, 0.24] | 0.14 | [0.04, 0.24] | 0.05 | [−0.04, 0.14] | 0.08 | [−0.02, 0.18] | 0.04 | [−0.05, 0.14] | 0.07 | [−0.03, 0.15] |
| verbal Reasoning | 0.15 | [0.05, 0.24] | 0.03 | [−0.08, 0.13] | 0.21 | [0.12, 0.31] | 0.31 | [0.21, 0.39] | 0.03 | [−0.07, 0.13] | −0.02 | [−0.10, 0.08] | 0.01 | [−0.09, 0.11] | 0.01 | [−0.09, 0.11] |
| numerical Reasoning | 0.14 | [0.04, 0.24] | 0.17 | [0.07, 0.26] | 0.05 | [−0.06, 0.16] | 0.07 | [−0.04, 0.17] | 0.16 | [0.07, 0.24] | 0.00 | [−0.09, 0.09] | 0.11 | [0.01, 0.21] | 0.09 | [−0.02, 0.19] |
| figural Reasoning | 0.09 | [−0.01, 0.19] | 0.01 | [−0.09, 0.10] | 0.14 | [0.03, 0.24] | 0.18 | [0.08, 0.28] | −0.03 | [−0.13, 0.06] | 0.01 | [−0.08, 0.10] | 0.04 | [−0.05, 0.14] | 0.01 | [−0.09, 0.11] |
| verbal Fluency | 0.10 | [0.02, 0.17] | 0.03 | [−0.05, 0.11] | 0.12 | [0.04, 0.20] | 0.04 | [−0.05, 0.13] | 0.03 | [−0.06, 0.12] | 0.14 | [0.06, 0.22] | 0.01 | [−0.08, 0.10] | 0.03 | [−0.05, 0.11] |
| numerical Fluency | 0.04 | [−0.05, 0.14] | 0.12 | [0.01, 0.22] | −0.05 | [−0.15, 0.05] | −0.11 | [−0.20, −0.00] | 0.12 | [0.03, 0.21] | 0.05 | [−0.04, 0.15] | 0.01 | [−0.09, 0.11] | 0.10 | [−0.00, 0.20] |
| figural Fluency | 0.18 | [0.08, 0.27] | 0.13 | [0.04, 0.22] | 0.16 | [0.06, 0.25] | 0.11 | [0.01, 0.22] | 0.13 | [0.04, 0.22] | 0.11 | [0.02, 0.21] | 0.03 | [−0.06, 0.11] | 0.11 | [0.02, 0.20] |
| verbal Speed | 0.05 | [−0.04, 0.15] | 0.04 | [−0.06, 0.14] | 0.04 | [−0.06, 0.14] | 0.04 | [−0.05, 0.14] | 0.06 | [−0.04, 0.16] | 0.01 | [−0.08, 0.10] | −0.02 | [−0.12, 0.08] | 0.04 | [−0.05, 0.14] |
| numerical Speed | 0.05 | [−0.04, 0.15] | 0.11 | [0.02, 0.21] | −0.03 | [−0.13, 0.06] | −0.10 | [−0.19, −0.00] | 0.13 | [0.03, 0.22] | 0.06 | [−0.03, 0.15] | 0.04 | [−0.05, 0.13] | 0.06 | [−0.04, 0.16] |
| figural Speed | 0.01 | [−0.08, 0.10] | 0.05 | [−0.04, 0.14] | −0.04 | [−0.13, 0.06] | −0.17 | [−0.25, −0.08] | 0.06 | [−0.03, 0.14] | 0.13 | [0.04, 0.22] | −0.02 | [−0.11, 0.07] | 0.07 | [−0.03, 0.15] |
| verbal Memory | 0.08 | [−0.01, 0.17] | 0.08 | [−0.01, 0.17] | 0.04 | [−0.05, 0.14] | 0.01 | [−0.09, 0.11] | 0.09 | [0.00, 0.18] | 0.05 | [−0.03, 0.13] | 0.05 | [−0.05, 0.14] | 0.03 | [−0.06, 0.12] |
| numerical Memory | 0.05 | [−0.06, 0.16] | 0.15 | [0.04, 0.25] | −0.06 | [−0.17, 0.04] | −0.16 | [−0.25, −0.07] | 0.12 | [0.03, 0.20] | 0.09 | [−0.02, 0.20] | 0.08 | [−0.03, 0.19] | 0.10 | [0.01, 0.19] |
| figural Memory | 0.13 | [0.04, 0.24] | 0.09 | [−0.01, 0.18] | 0.13 | [0.03, 0.22] | 0.13 | [0.04, 0.23] | 0.08 | [−0.02, 0.16] | 0.05 | [−0.05, 0.14] | 0.05 | [−0.05, 0.15] | 0.05 | [−0.04, 0.14] |
© 2018 by the authors. Licensee MDPI, Basel, Switzerland. This article is an open access article distributed under the terms and conditions of the Creative Commons Attribution (CC BY) license (http://creativecommons.org/licenses/by/4.0/).
Share and Cite
Kretzschmar, A.; Spengler, M.; Schubert, A.-L.; Steinmayr, R.; Ziegler, M. The Relation of Personality and Intelligence—What Can the Brunswik Symmetry Principle Tell Us? J. Intell. 2018, 6, 30. https://0-doi-org.brum.beds.ac.uk/10.3390/jintelligence6030030
Kretzschmar A, Spengler M, Schubert A-L, Steinmayr R, Ziegler M. The Relation of Personality and Intelligence—What Can the Brunswik Symmetry Principle Tell Us? Journal of Intelligence. 2018; 6(3):30. https://0-doi-org.brum.beds.ac.uk/10.3390/jintelligence6030030
Chicago/Turabian StyleKretzschmar, André, Marion Spengler, Anna-Lena Schubert, Ricarda Steinmayr, and Matthias Ziegler. 2018. "The Relation of Personality and Intelligence—What Can the Brunswik Symmetry Principle Tell Us?" Journal of Intelligence 6, no. 3: 30. https://0-doi-org.brum.beds.ac.uk/10.3390/jintelligence6030030