Article

Effect of the Addition of Nitrogen through Shielding Gas on TIG Welds Made Homogenously and Heterogeneously on 300 Series Austenitic Stainless Steels

1
Brunel Innovation Centre, Brunel University, London CB21 6AL, UK
2
Nuclear Advanced Manufacturing Research Centre, University of Sheffield, Rotherham S60 5WG, UK
3
Institute for Future Transport and Cities, Coventry University, Coventry CV1 5FB, UK
*
Author to whom correspondence should be addressed.
J. Manuf. Mater. Process. 2021, 5(3), 72; https://0-doi-org.brum.beds.ac.uk/10.3390/jmmp5030072
Submission received: 29 May 2021 / Revised: 22 June 2021 / Accepted: 26 June 2021 / Published: 2 July 2021

Abstract

:
Tungsten inert gas (TIG) welding of austenitic stainless steels is a critical process used in industries. Several properties of the welds must be controlled depending on the application. These properties, which include the geometrical, mechanical and microstructural features, can be modified through an appropriate composition of shielding gas. Researchers have studied the effects of the addition of nitrogen through the shielding gas; however, due to limited amount of experimental data, many of the interaction effects are not yet reported. In this study, welds were made homogeneously as well as heterogeneously with various concentrations of nitrogen added through the shielding gas. The gas compositions used were 99.99%Ar (pure), 2.5% N2 + Ar, 5% N2 + Ar and 10% N2 + Ar. Additionally, the welding process parameters were varied to understand different interaction effects between the shielding gas chemistry and the process variables such as filler wire feed rate, welding current, etc. Strong interactions were observed in the case of heterogeneous welds between the gas composition and the filler wire feed rate, with the penetration depth increasing by nearly 30% with the addition of 10% nitrogen in the shielding gas. The interactions were found to influence the bead geometry, which, in turn, had an effect on the mechanical properties as well as the fatigue life of the welds. A nearly 15% increase in the tensile strength of the samples was observed when using 10% nitrogen in the shielding gas, which also translated to a similar increase in the fatigue life.

1. Introduction

The 300 series austenitic stainless steels are commonly used across many industries that include aerospace, automotive, food, pharmaceuticals and nuclear, to name but a few. Welding is a commonly used fabrication technique for this material in all these sectors. The 300 series austenitic stainless steels can be welded using several processes, including tungsten inert gas (TIG), metal active gas (MAG), LASER, etc., with arguably the most common process used for high-integrity joining of this group of materials being TIG welding.
TIG welding has several process-specific parameters that can influence the output properties (geometry, microstructure and mechanical properties of the welds). These include the heat input parameters such as the welding current, voltage, and torch travel speed; the filler material-related parameters such as the filler wire diameter, feed rate, and chemistry; and shielding gas-related parameters such as the gas composition, flow rate, etc. All these parameters can influence the output impact of the process to different extents on the material’s performance. For example, welding currents were found to influence the bead geometry more substantially than the other parameters by [1]. The pulsing frequency in the range used by these authors was found to have negligible effect on the geometrical features. Apart from such heat input parameters, the composition of the shielding gas is known to play a significant role in defining the outputs of the welding process. For TIG welding, the most commonly used shielding gas is argon (Ar) due to its inertness and suitable ionization potential. However, several researchers have used mixtures of different gases. Rodrigues and Loureiro [2] investigated the effect of using mixtures with different ratios of Ar, hydrogen (H2) and helium (He) on the microstructures of low-sulphur austenitic stainless-steel welds. They reported that for currents lower than 200 A, welds made using pure Ar had lower penetration depth than those made using Ar+H2 mixtures. This tendency was not observed when the current was over 200 A. They also reported that the Ar+He shielding gas mixtures produced minimum penetration depth. A possible reason for this is that the arc pressure produced by helium-rich shielding gases is significantly lower than that compared to pure Ar, as reported by Lin and Eagar [3]. Durgutlu [4] also studied the effect of additions of 1.5% and 5% H2 in pure Ar shielding gas on various output features of the welds. He found that the mean grain size in the weld metal continues increasing with an increase in the H2 content. His findings were further supported by [5], who attributed the increase in grain size to the increased heat input on using H2.
Effects of the addition of nitrogen (N2) through the shielding gas to the weld pool were studied by several researchers. Zorc [6] studied the effect of using N2 and N2-based mixtures for shielding austenitic stainless steels during welding. He reported that the addition of 20% N2 to the shielding gas can reduce the current required to obtain complete penetration by up to 40% when compared to welding using pure Ar. Over-alloying of N2 can lead to significant porosity in the welds, as reported by Toit and Pistorius [7] and Wiktorowicz and Crouch [8]. Zorc, however, reported that porosity can be avoided through using adequate welding parameters. Tseng and Chou [9] found that the addition of N2 through the shielding gas increased the peak temperature in the welds made in type-304 and -310 steels. The angular distortion of the welds increased with an increase in the N2 content. They also found the retained δ-ferrite content of the welds to significantly drop with an increase in N2 in the shielding gas, which is consistent with the findings of [10,11,12,13], etc., through their experiments and models for predicting the retained δ-ferrite in the welds. Kshirsagar et al. [14] reported that the addition of N2 through the shielding gas only decreases the density of retained δ-ferrite and not the total amount which is retained. Consequently, measurements using a FeritScope were found to depend on the cross-sectional area of the welds and may not be a true representation of the effect of N2 in welds. Shankar et al. [15] studied the effects of the addition of nitrogen on the microstructure and fusion zone cracking in type 316 L steels. They concluded that the sensitivity of nitrogen on solidification cracking depends on the level of impurity elements (sulphur and phosphorous) in the steel. In the presence of high sulphur levels (>0.012 wt.%), the tendency of solidification cracking significantly increased. At low sulphur levels (0.001 wt.%), nitrogen had a negligible effect on the solidification cracking. The cracking tendency was measured using the longitudinal varestraint test. The nitrogen-added weld metal showed a tendency of coarsening and side branching in the solidified microstructure. Huang [
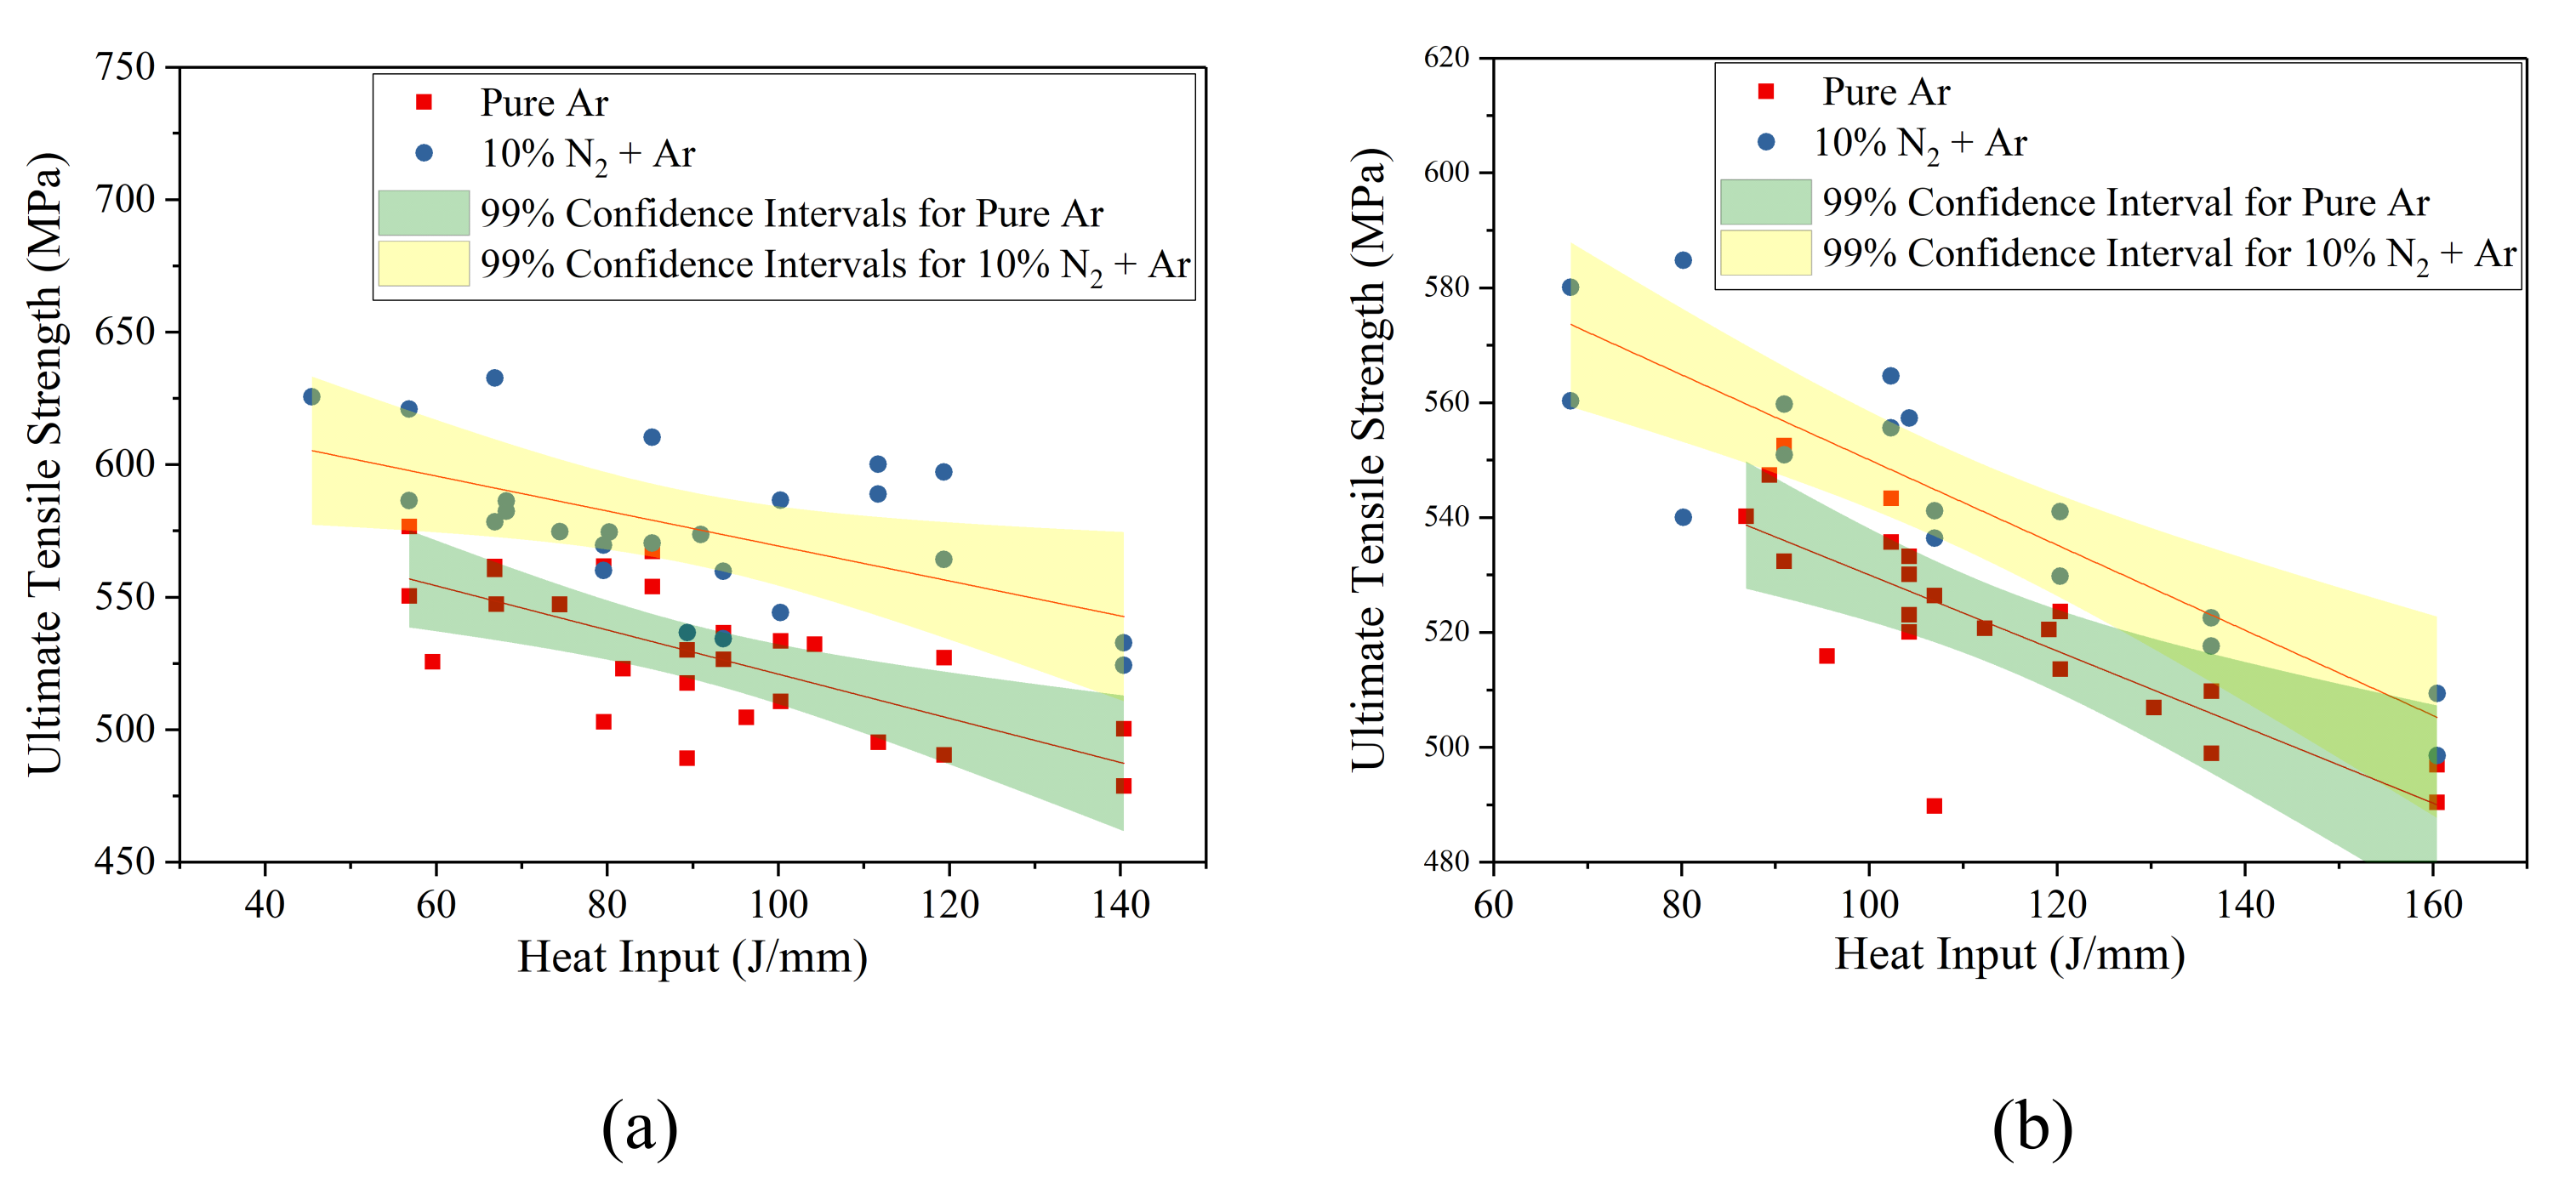
10] reported an increase in the mechanical strength of the welds on adding nitrogen through the shielding gas. He also reported an increase in Vickers hardness (Hv) on the addition of nitrogen. This was also confirmed by [16] through their experiments on 317 L and 904 L steels.
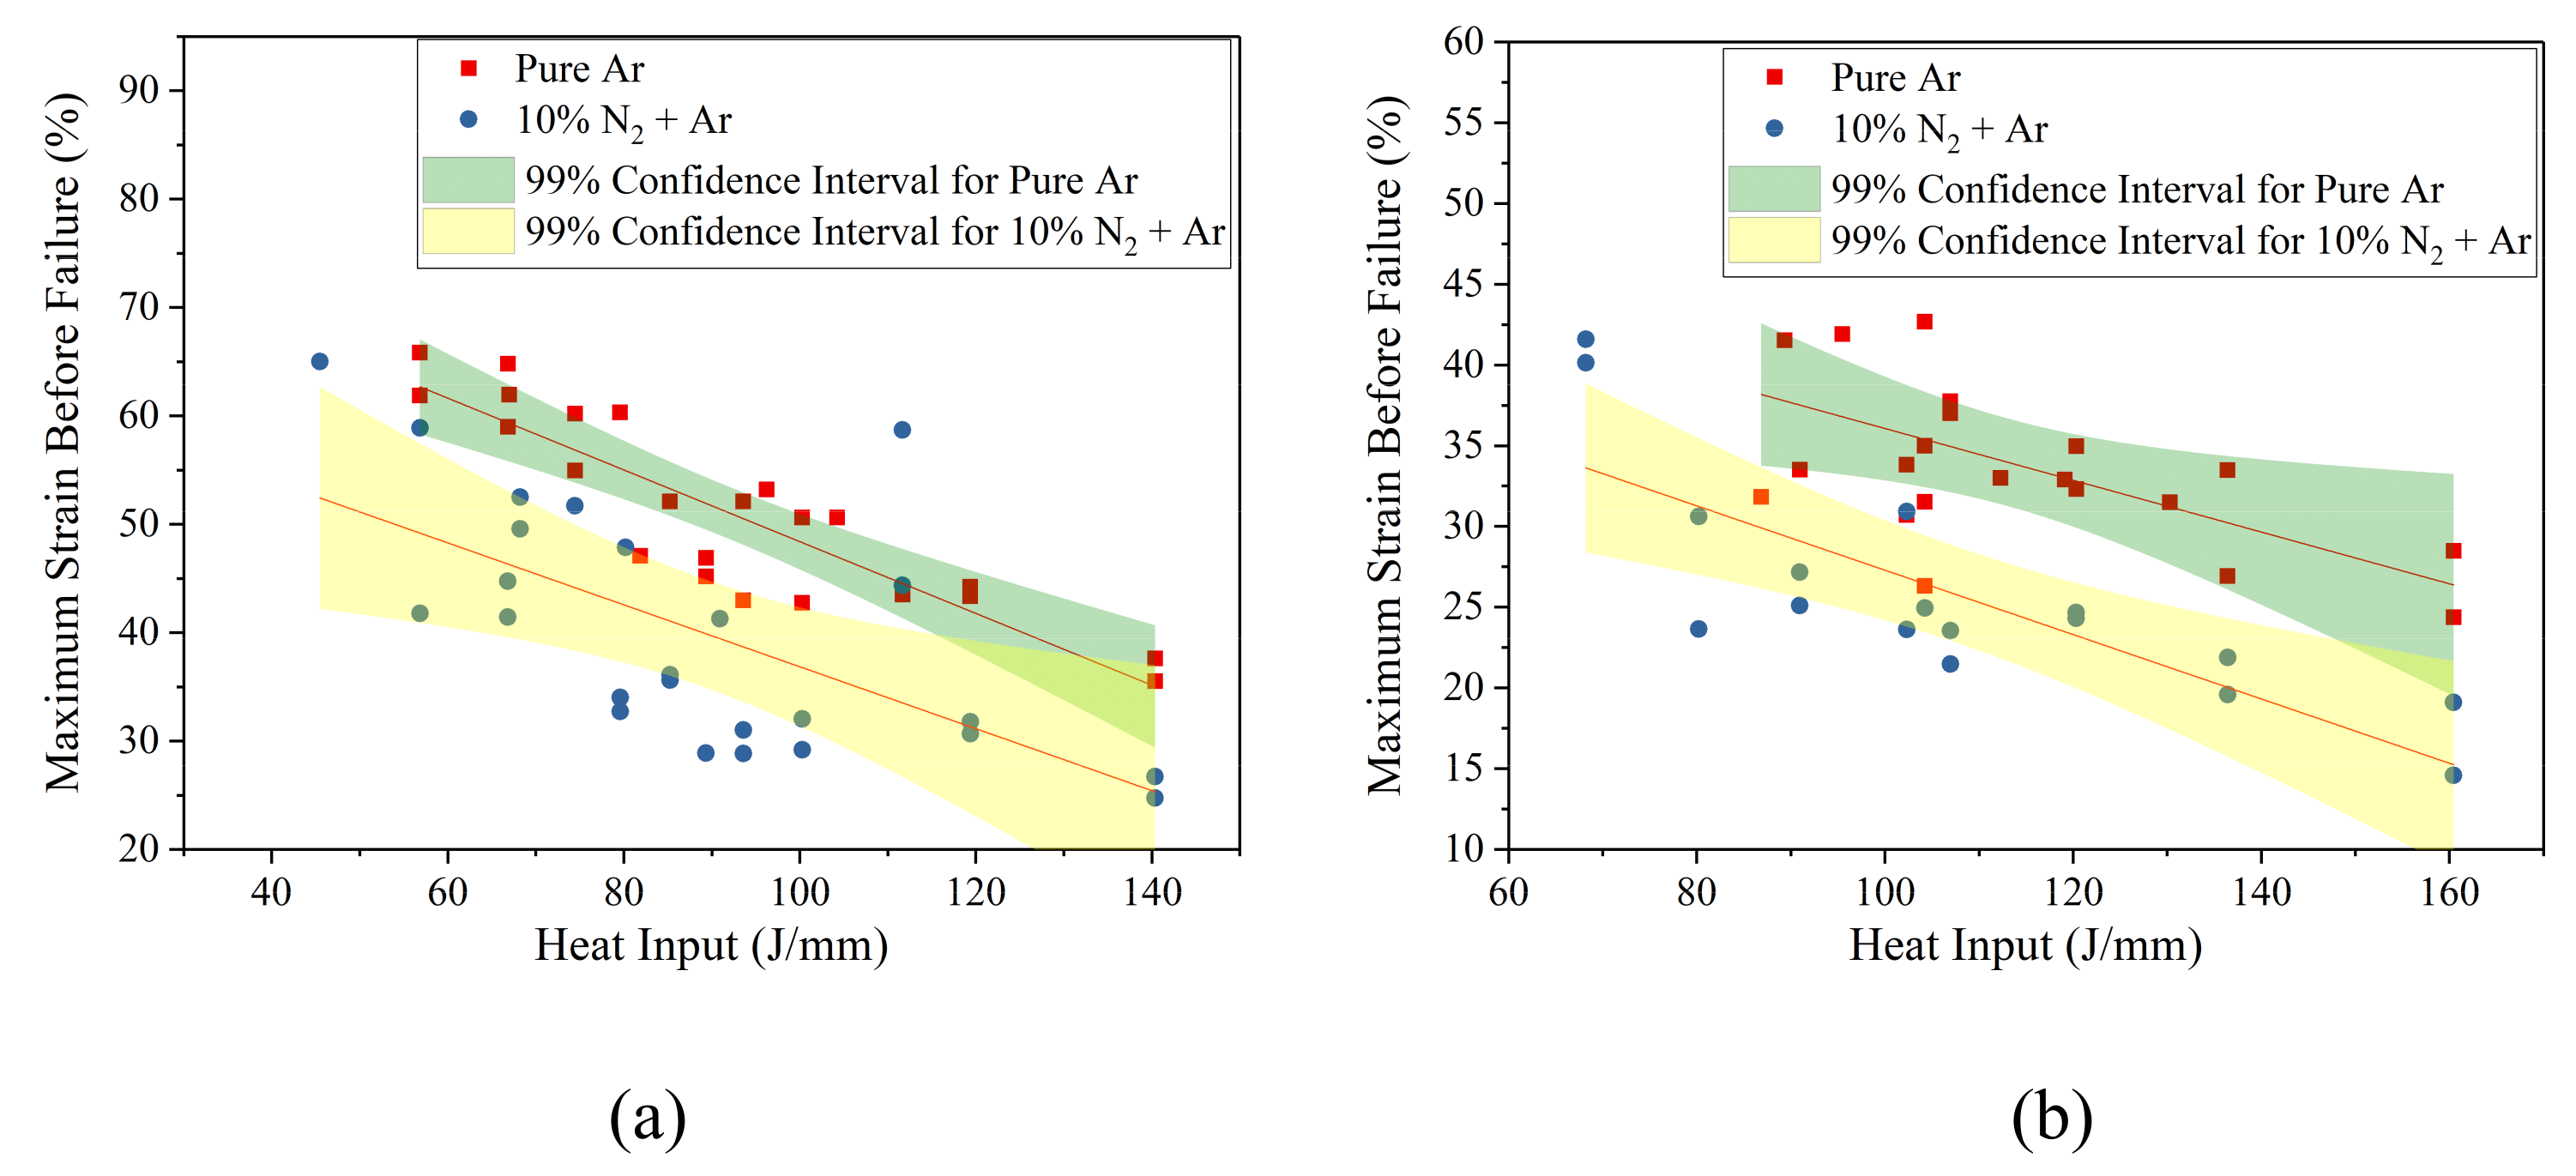
It is evident from the above research that the addition of N2 to welds through the shielding gas or any other method has a significant effect on the weld properties. This study focusses on understanding these effects and the interactions between the welding parameters and the amount of N2 added via the shielding gas. It was found that the N2 addition has an interaction effect with the filler wire feed rate and the wire diameter, which produces results that contradict the expectations. Further tests also confirmed the effects of additional N2 on the mechanical, fatigue and microstructural features of the welds.

2. Materials and Methods

In this study, welds were made homogenously and heterogeneously to investigate the effect adding nitrogen through the shielding gas. Homogeneous welds were made by joining 304 L austenitic stainless-steel sheets with thicknesses of 0.7 mm and 0.9 mm using a TIG welding process. Heterogeneous welds involved joining 1.5 mm thick 304 L stainless-steel sheets using a 308 LSi filler wire. Two filler wires with diameters of 0.8 mm and 1.0 mm with the same chemical composition were used for different trials. The chemical compositions of all the materials used in this study are shown in Table 1. These values were taken from the material certificates provided by the supplier and complete traceability was ensured throughout the experiments.
A pulsed current waveform with a DC negative polarity was used for all the experiments. Several process parameters, including the peak current (Ip), background current (Ib), duty cycle (δ), torch travel speed (S), pulsing frequency (f), filler wire feed rate (WFR), filler wire diameter (WD) and the nitrogen content in the shielding gas (N2) were varied between the experiments. Due to the limitations of the material and equipment available, WD and N2 were considered discrete during designing the experiments, whereas all the other parameters were considered continuous.
Firstly, the homogeneous welds were made by varying Ip, Ib, δ, S, f and N2 for different experiments. The Ib was maintained at 33% of the Ip, as commonly used in industry. Through initial trial and error, the parameter ranges which could be used for welding the sheets under consideration were established. The parameter ranges for these thicknesses welded homogeneously are shown in Table 2.
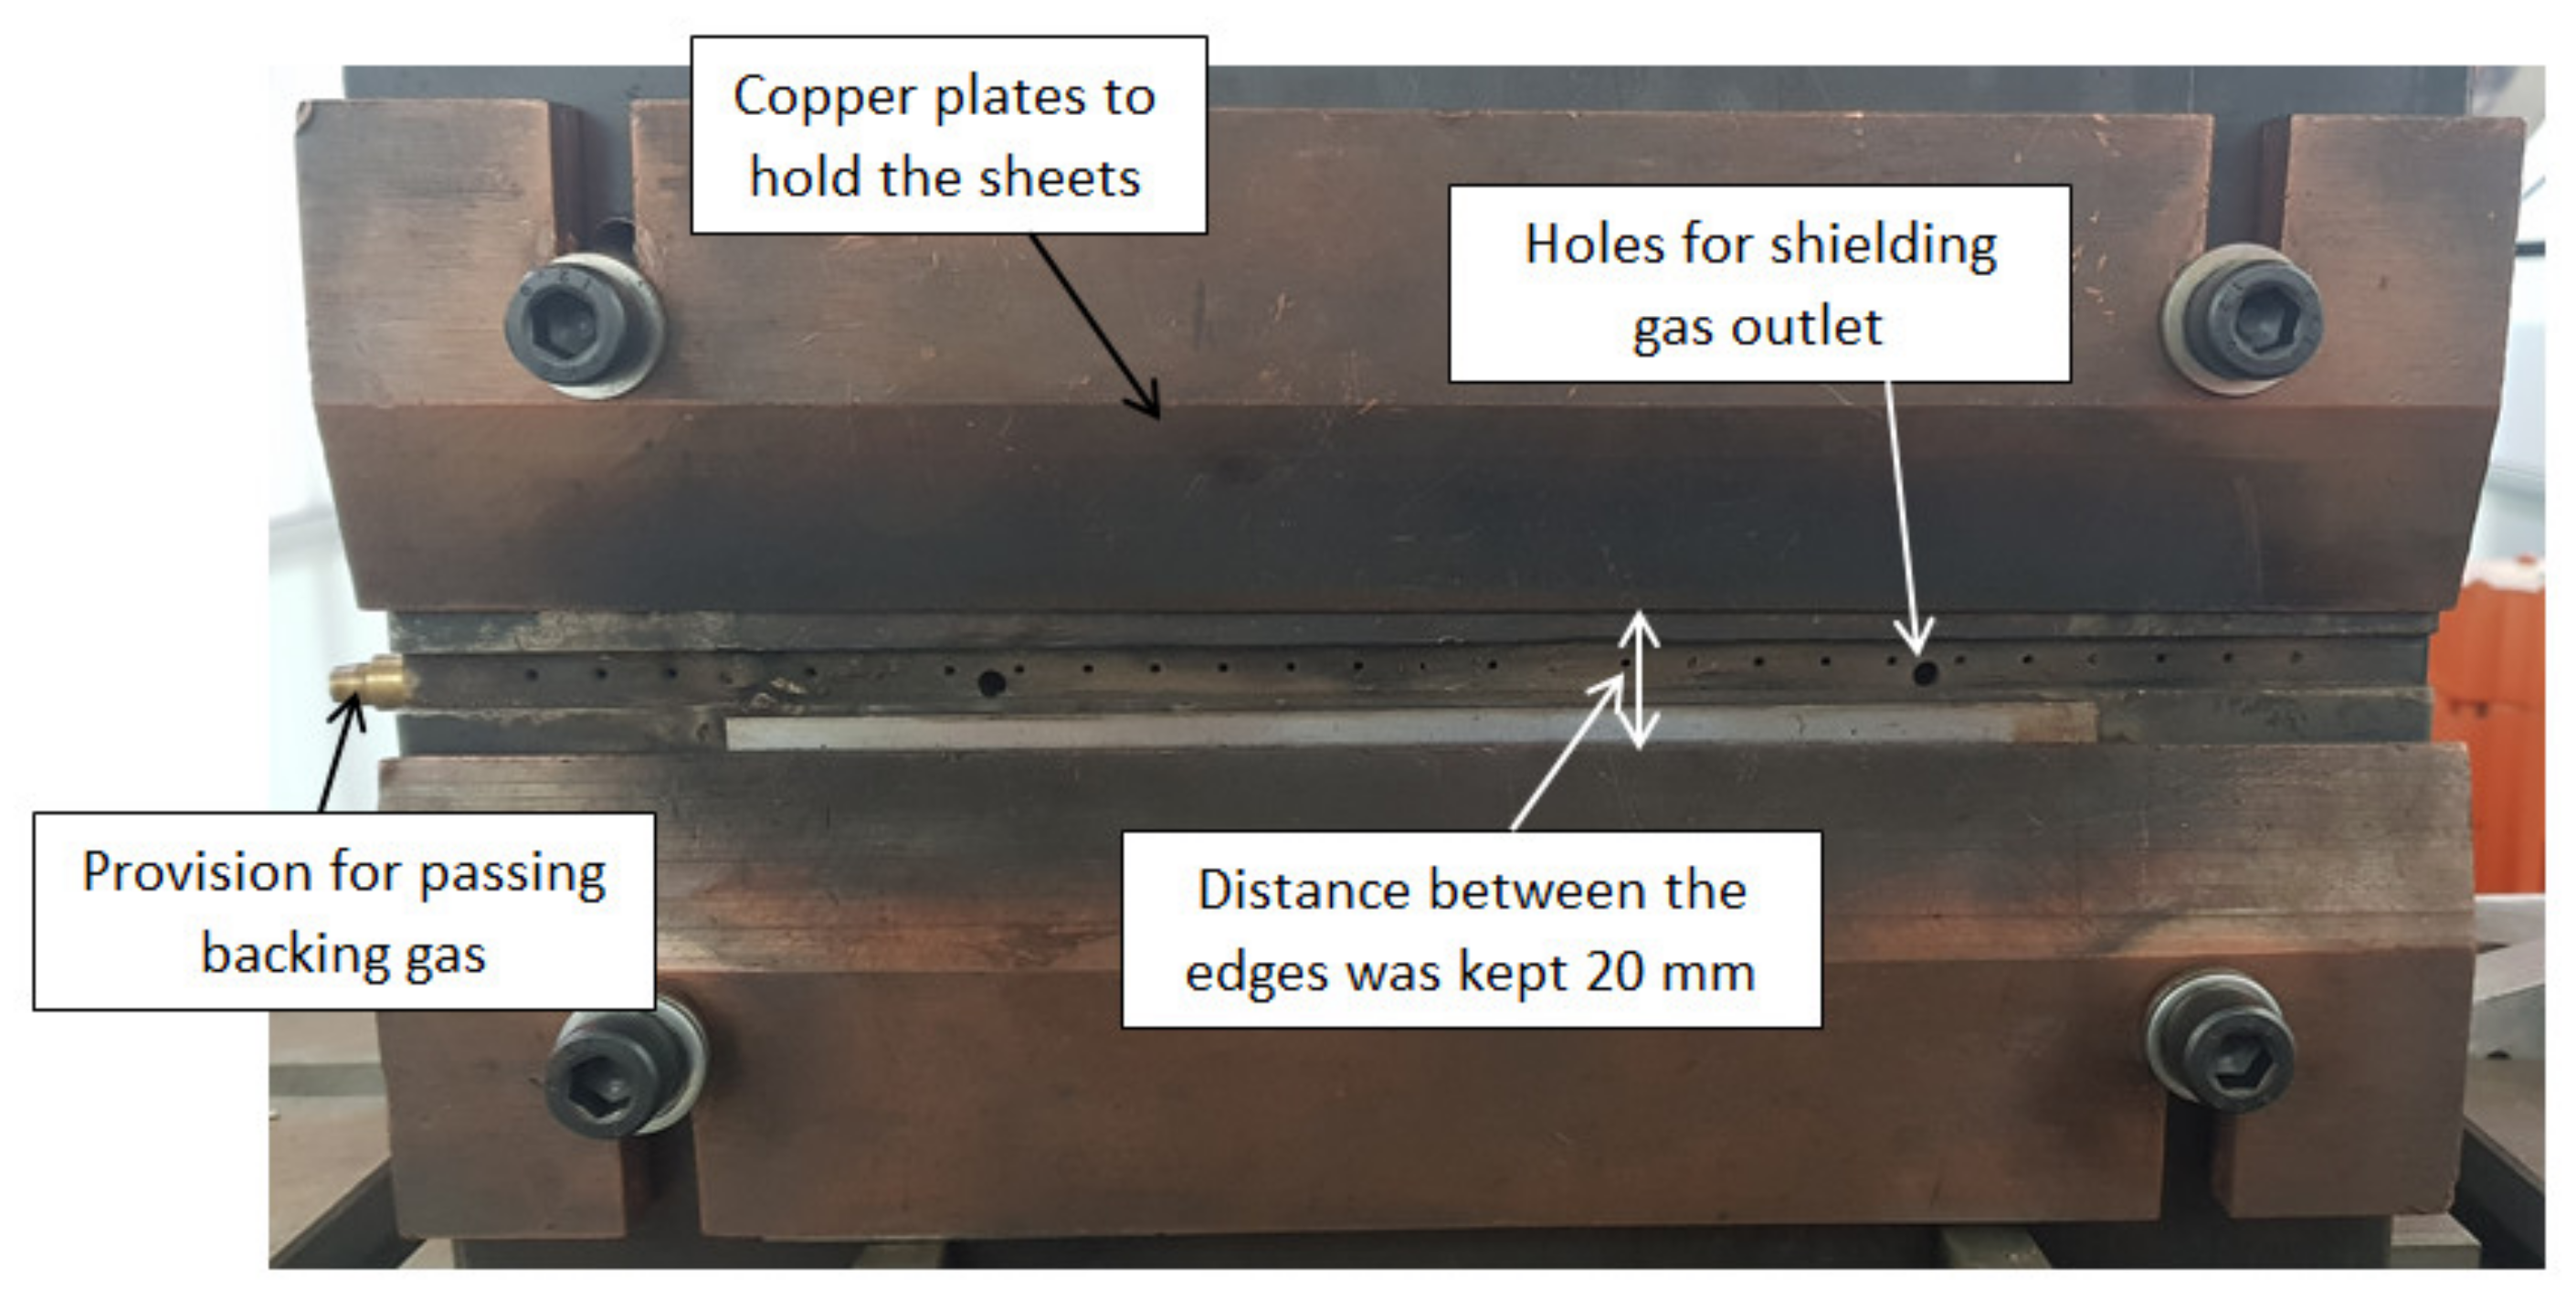
The arc length was maintained at 2.5 mm for all the welds. No root gap was allowed between the sheets during welding. Specially designed fixtures were used to hold the plates in position, as shown in Figure 1. A shielding gas flow rate of 8 L/min and a backing gas flow rate of 5 L/min was used for all the welds. Irrespective of the composition of the gas used for shielding, high-purity argon (Ar, 99.995% pure) was used as the backing gas.
A central composite design (CCD) of the experiment scheme was used for data acquisition. Using this scheme ensured that adequate amounts of data to capture all the interactions between different variables were available for the analysis. With five continuous and one discrete parameter, the CCD scheme required 51 trials to be completed at every level of the discrete parameters. Preparing such a large number of welds for the metallographic analysis is an expensive and time-consuming process; consequently, only some of those welds made using pure Ar were repeated at the other values of 
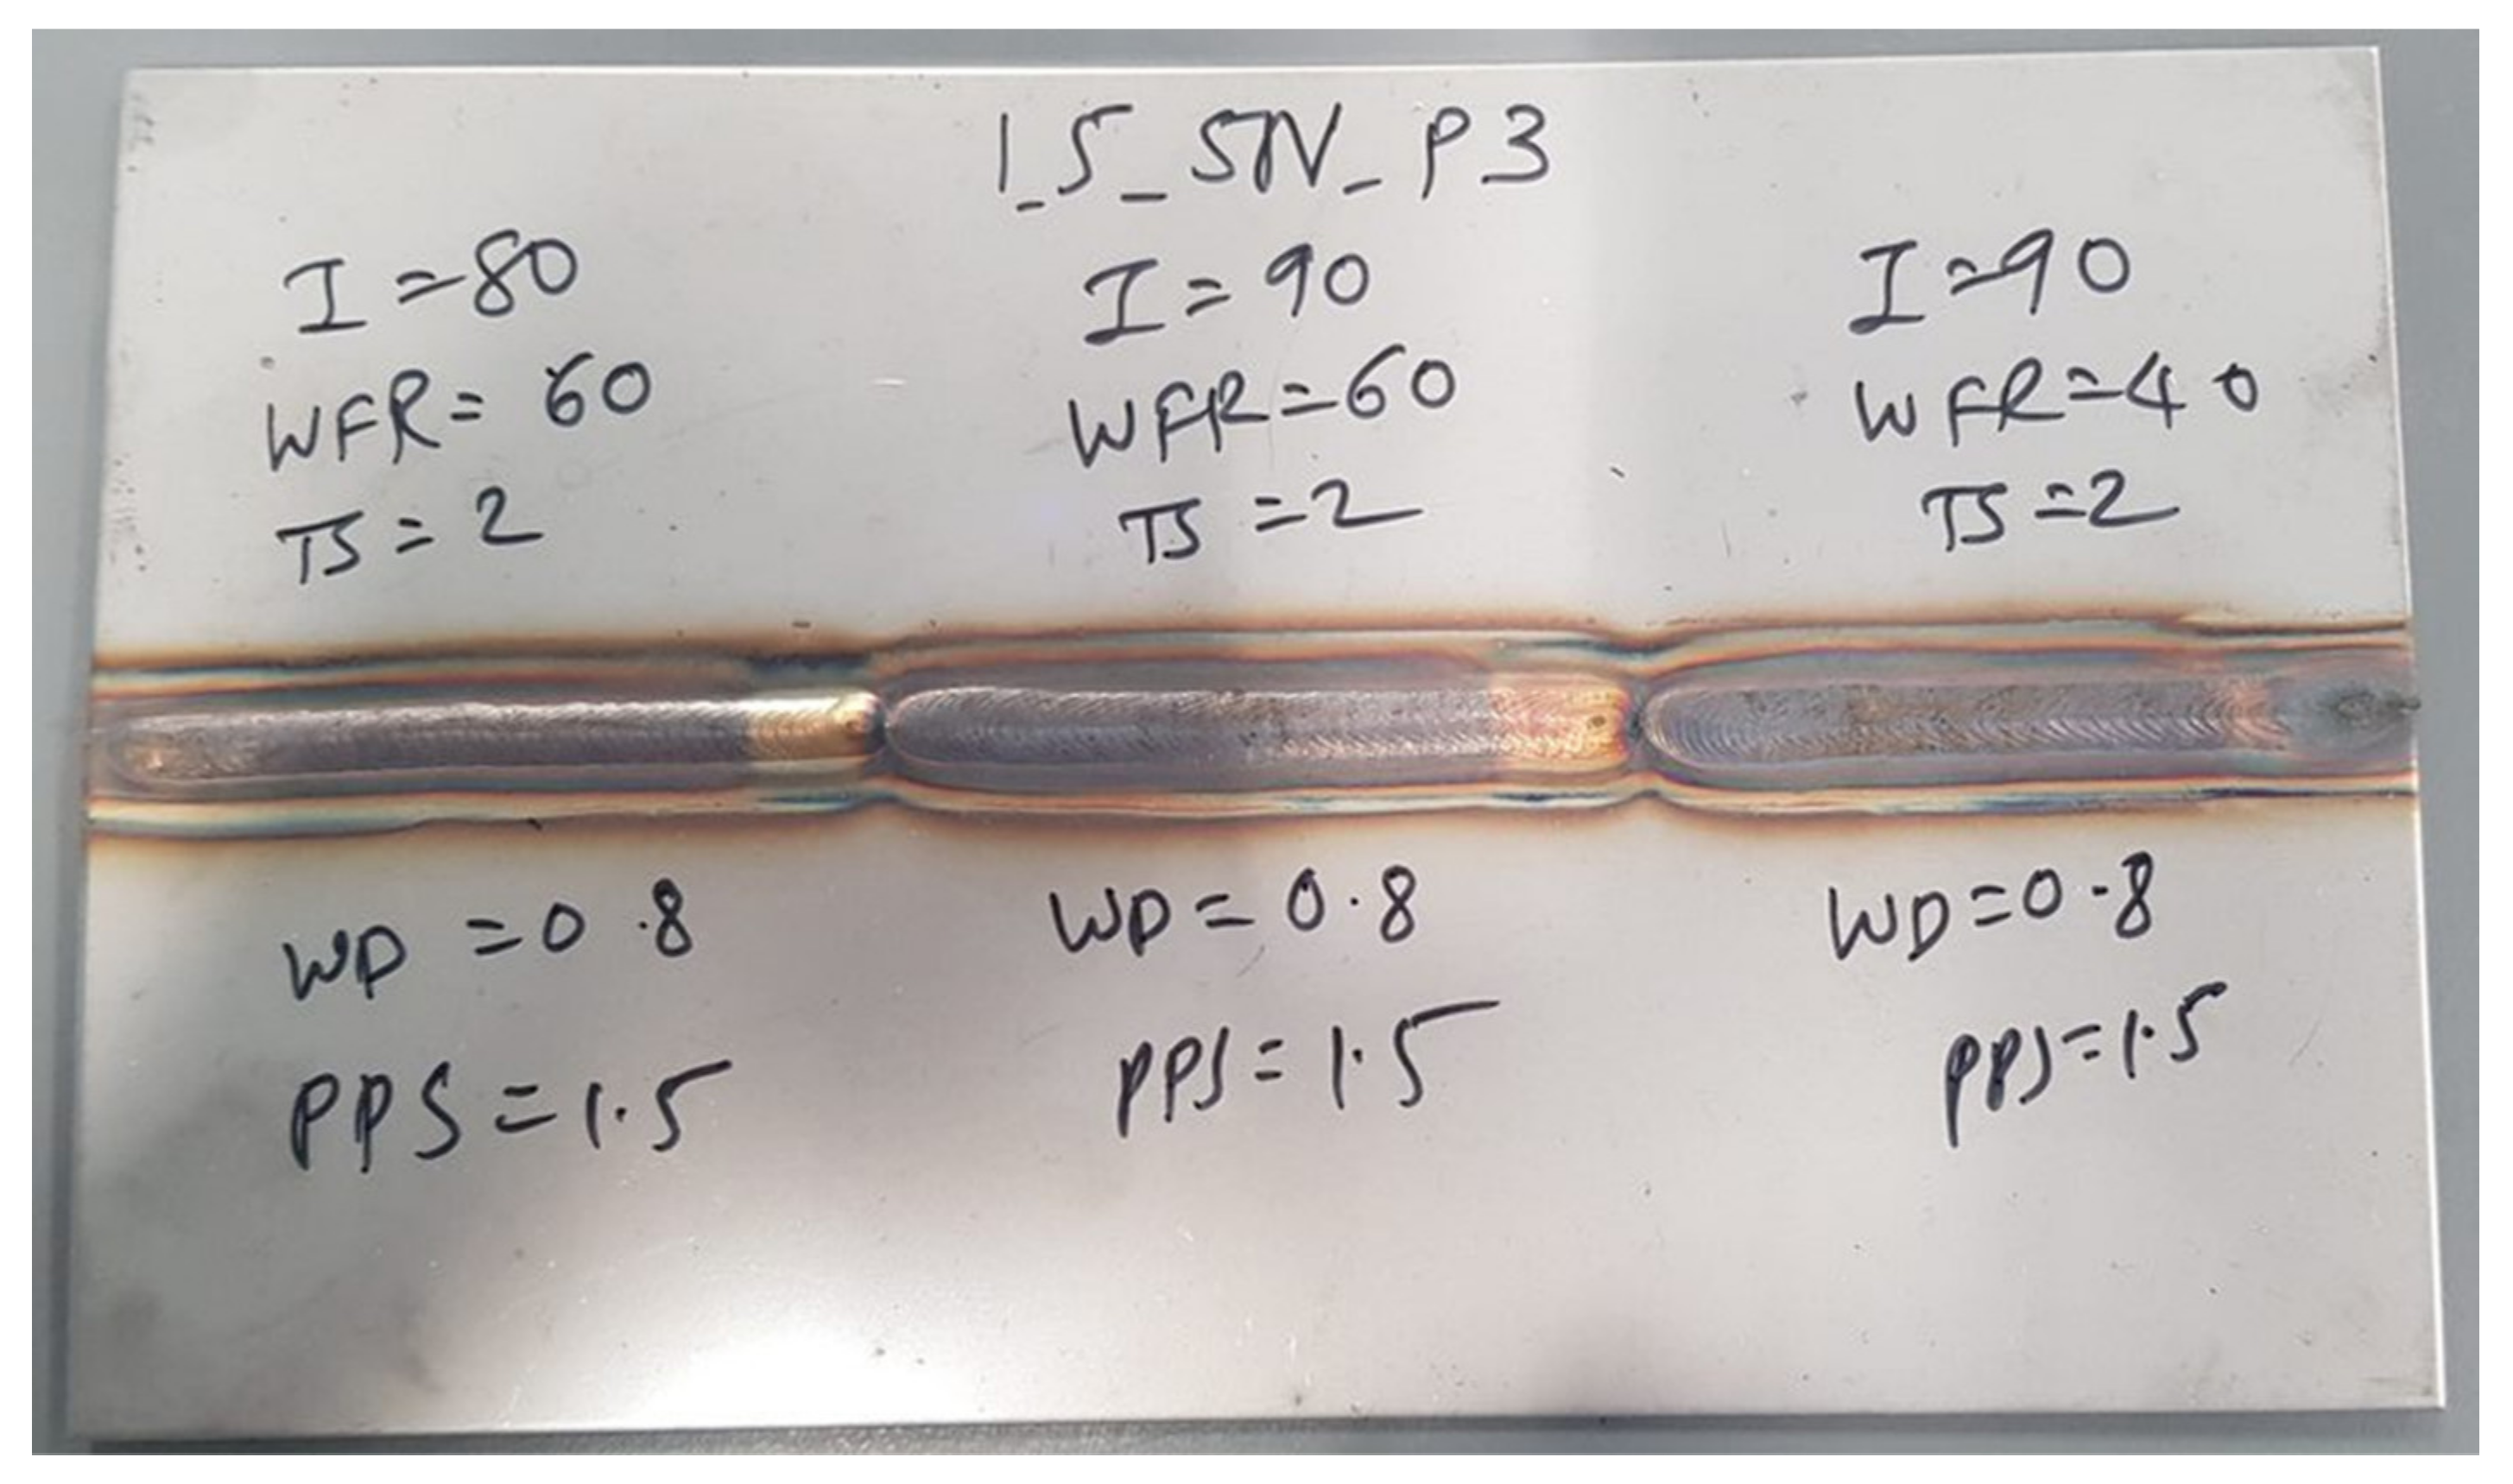
N2. A total of 80 welds were made on 0.7 mm thick sheets and 66 on the 0.9 mm thick sheets. The sheets used for the experiments were 200 mm × 60 mm and were welded along the 200 mm length. Three different welds were made on every pair of the sheets, as shown in Figure 2.
On analyzing the results, as detailed later in this section, it was observed that some of the continuous parameters could be combined into a single parameter to study their effect. For example, any combination of Ip, Ib and δ within the ranges mentioned in Table 2 gave the same output as long as the effective current (Ie) calculated using Equation (1) was the same. Such correlations can help in reducing the number of variables for the design of experiments and consequently reduce the number of required trials.
I e = ( I 2 p × δ ) + I 2 b × 1 δ
Following the results of the homogeneous welds, for the heterogeneous welds, the duty-cycle (δ) was kept constant because its effect on the welds could be studied by only varying the Ip. The δ was maintained at 50% for all the trials. The WD was switched between 0.8 mm and 1 mm during the experiments, and N2 was switched between 0%, 2.5%, 5% and 10%, as in the case of homogenous welds. All the other constant parameters were the same as those used for homogenous welds. The minimum and maximum values of the variable parameters for welding 1.5 mm thick sheets are displayed in Table 3 along with their type.
Similarly to the homogenous welds, a CCD scheme of experiments was used for obtaining the data. It was found through initial trials that some combinations of parameters that formed a part of the CCD scheme produced too little or too much heat, which led to incomplete penetration or burn-through in the welds, respectively. Consequently, the experiments were divided in two sets, as shown in Table 4, based on Ip and S. Division based on other parameters was not required because this did not directly influence the heat input.
Using the CCD scheme with four continuous parameters, every level of the discrete parameter required 31 experiments for each set. In order to reduce the total number of experiments, only some of these experiments were repeated with other compositions of shielding gas. A total of 72 welds were made using 2.5%, 5% and 10% N2 + Ar mixtures. These included welds made using 0.8 mm as well as 1.0 mm filler wire diameter.
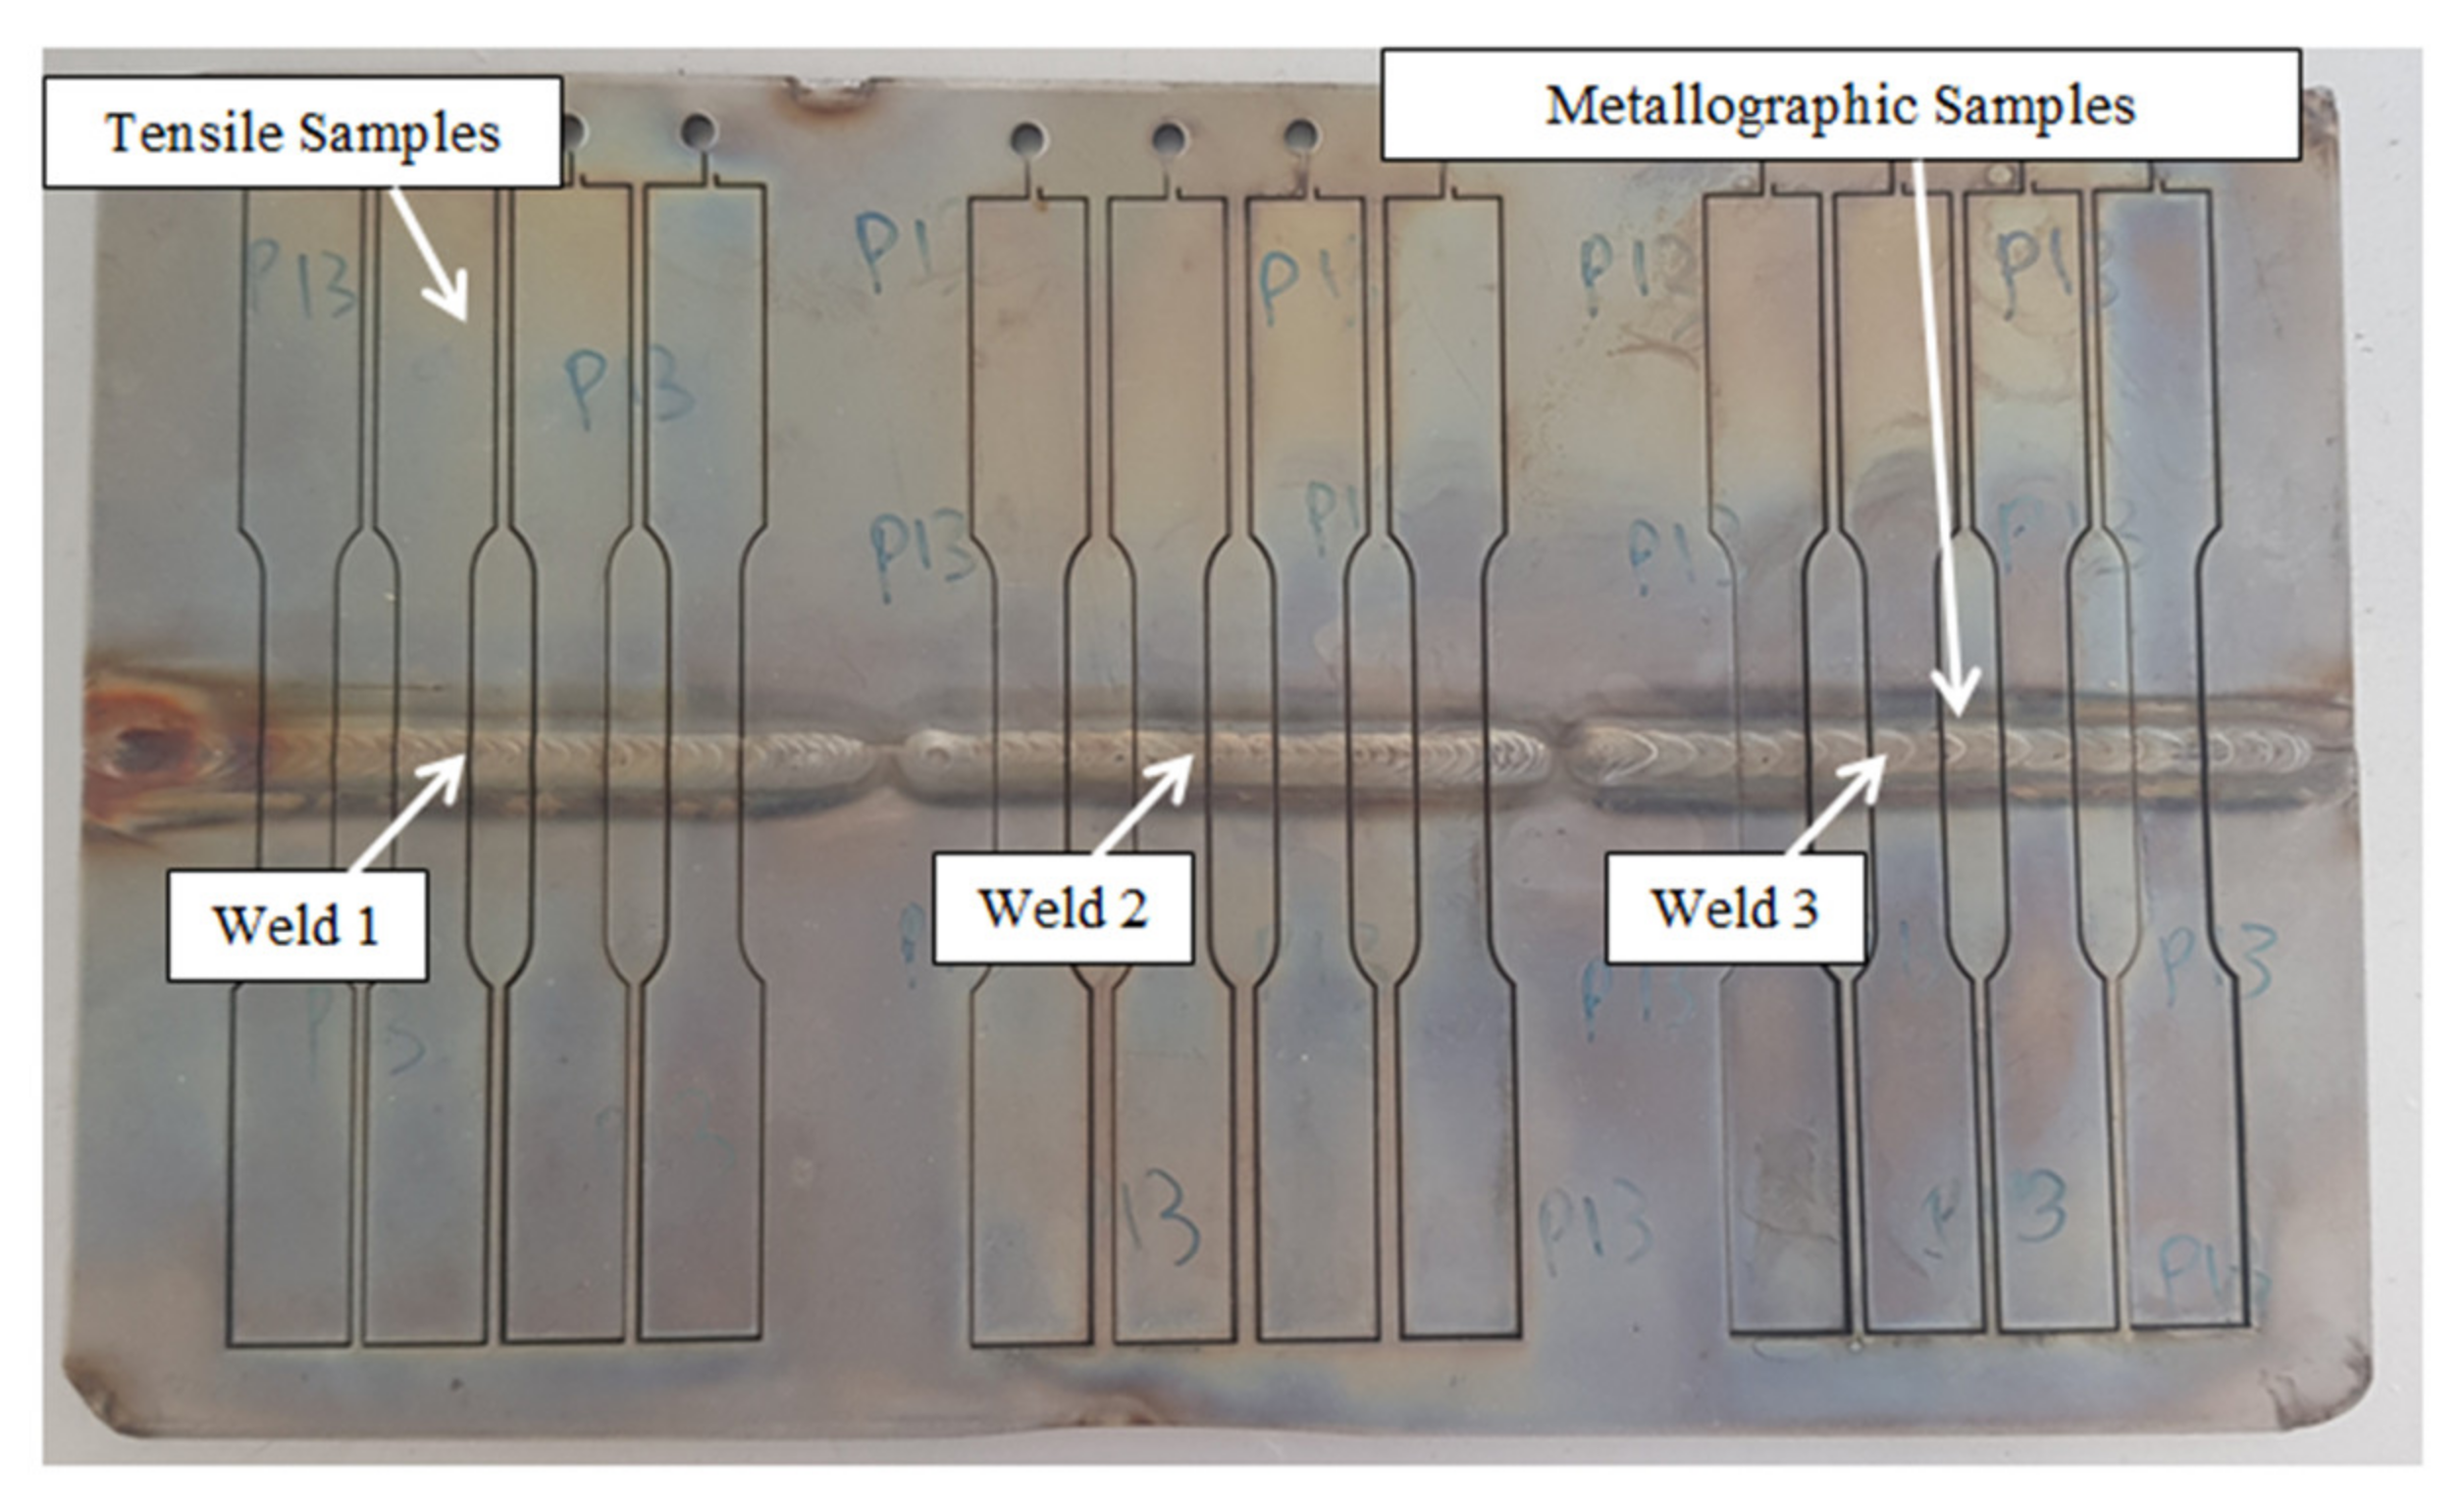
On completing the homogenous as well as heterogeneous welds, samples were extracted for metallographic analysis. As mentioned previously, every pair of sheets contained three different welds. Firstly, the tensile samples were extracted using wire electro-discharge machining (EDM). The sub-size specimen dimensions mentioned in the ASTM E8 standard were chosen for tensile testing. Four samples were extracted from every welded sheet, as shown in Figure 3. Tensile tests were carried out following the procedure mentioned in the ASTM E8 standard. Metallographic samples were extracted from in between these tensile samples, as shown in Figure 3.
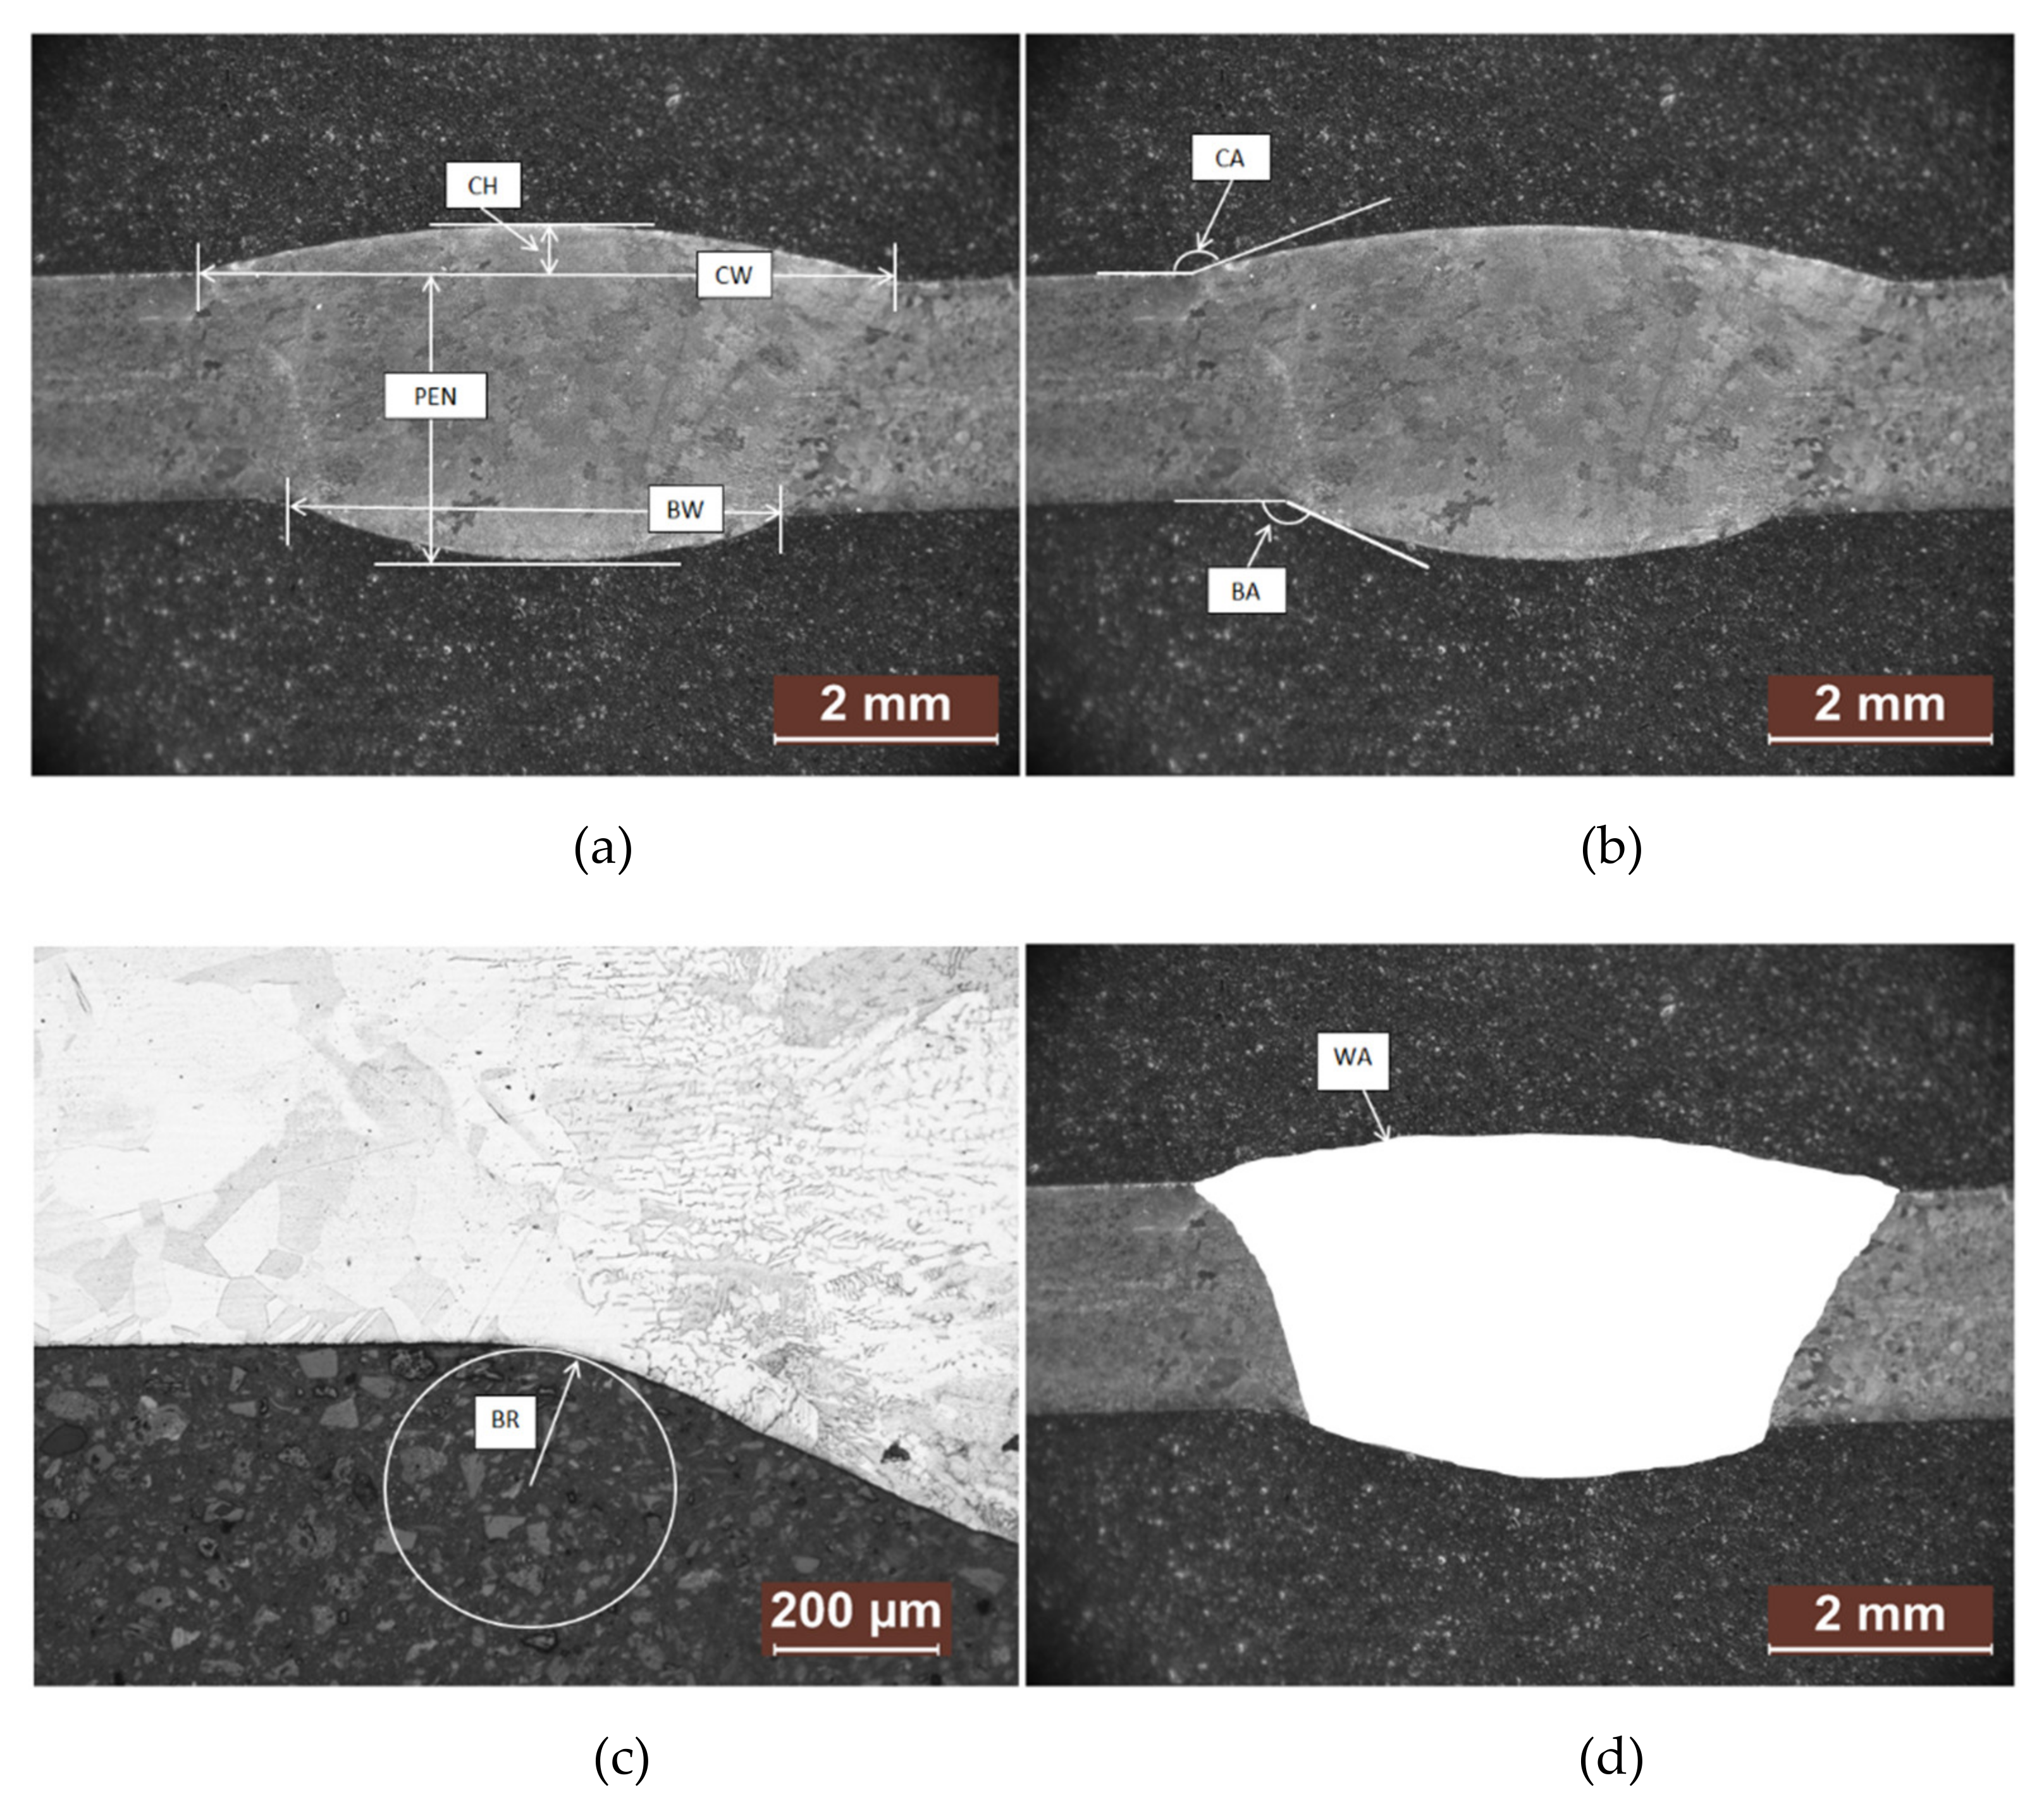
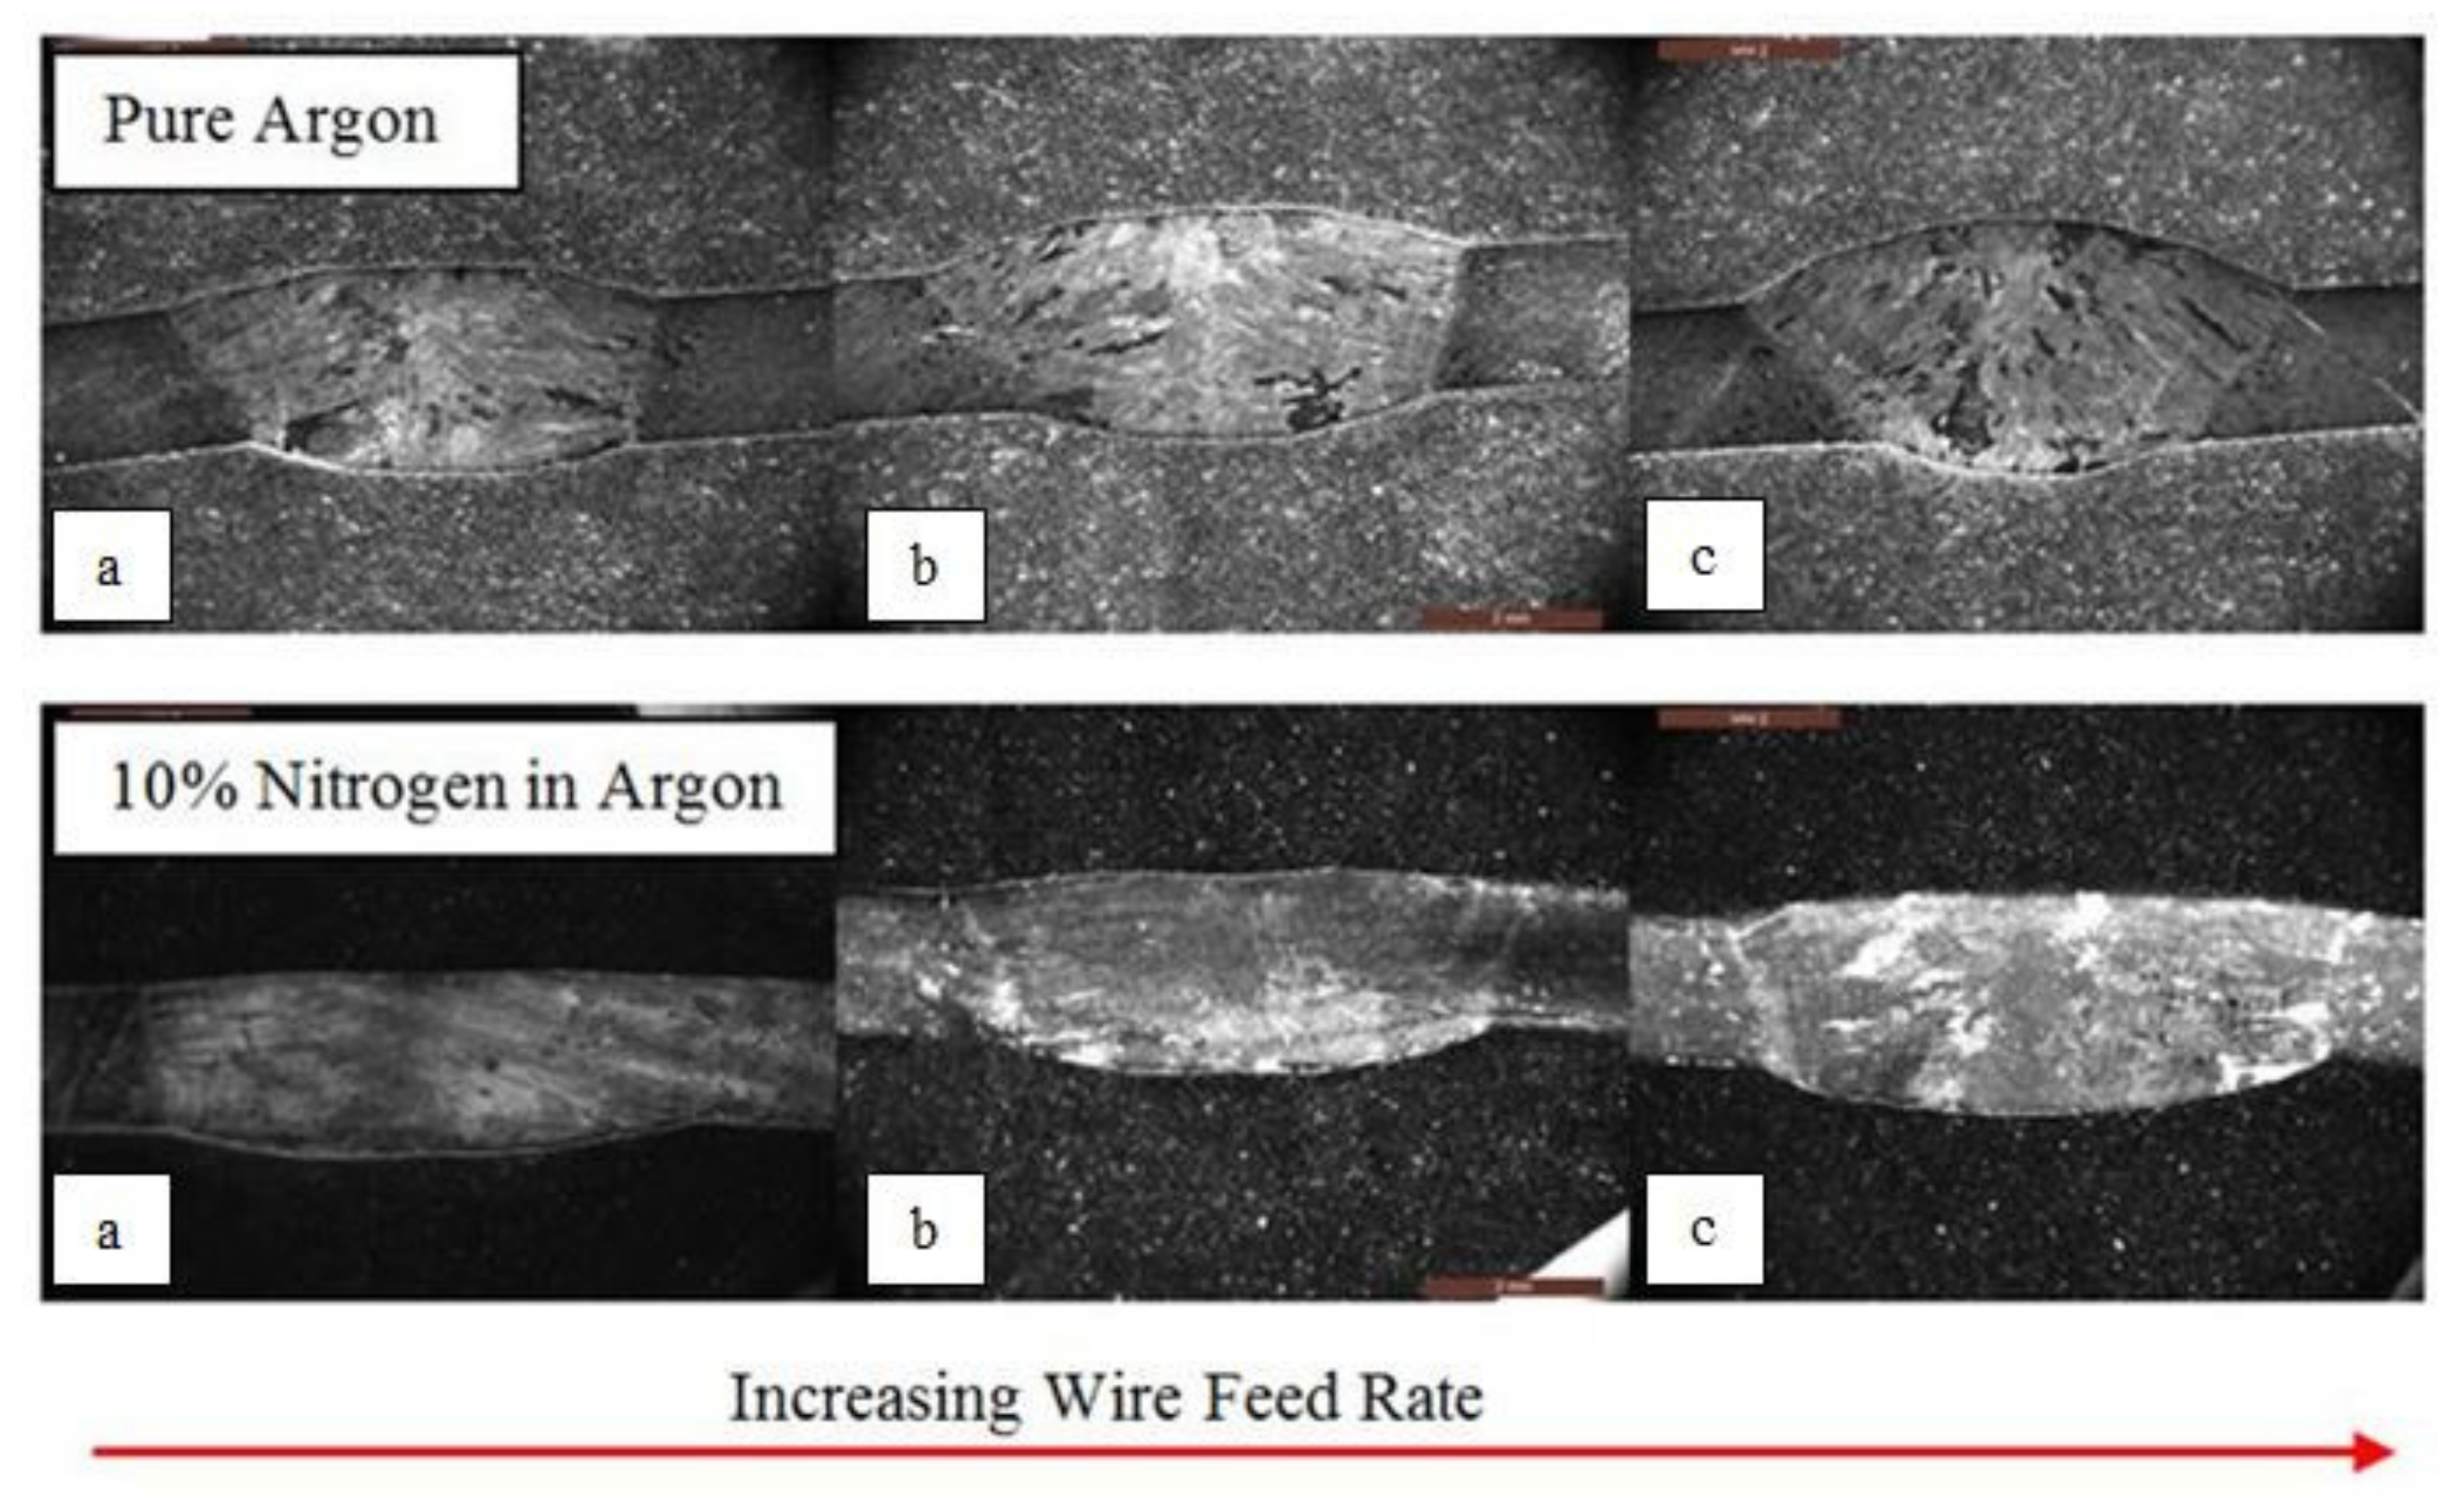
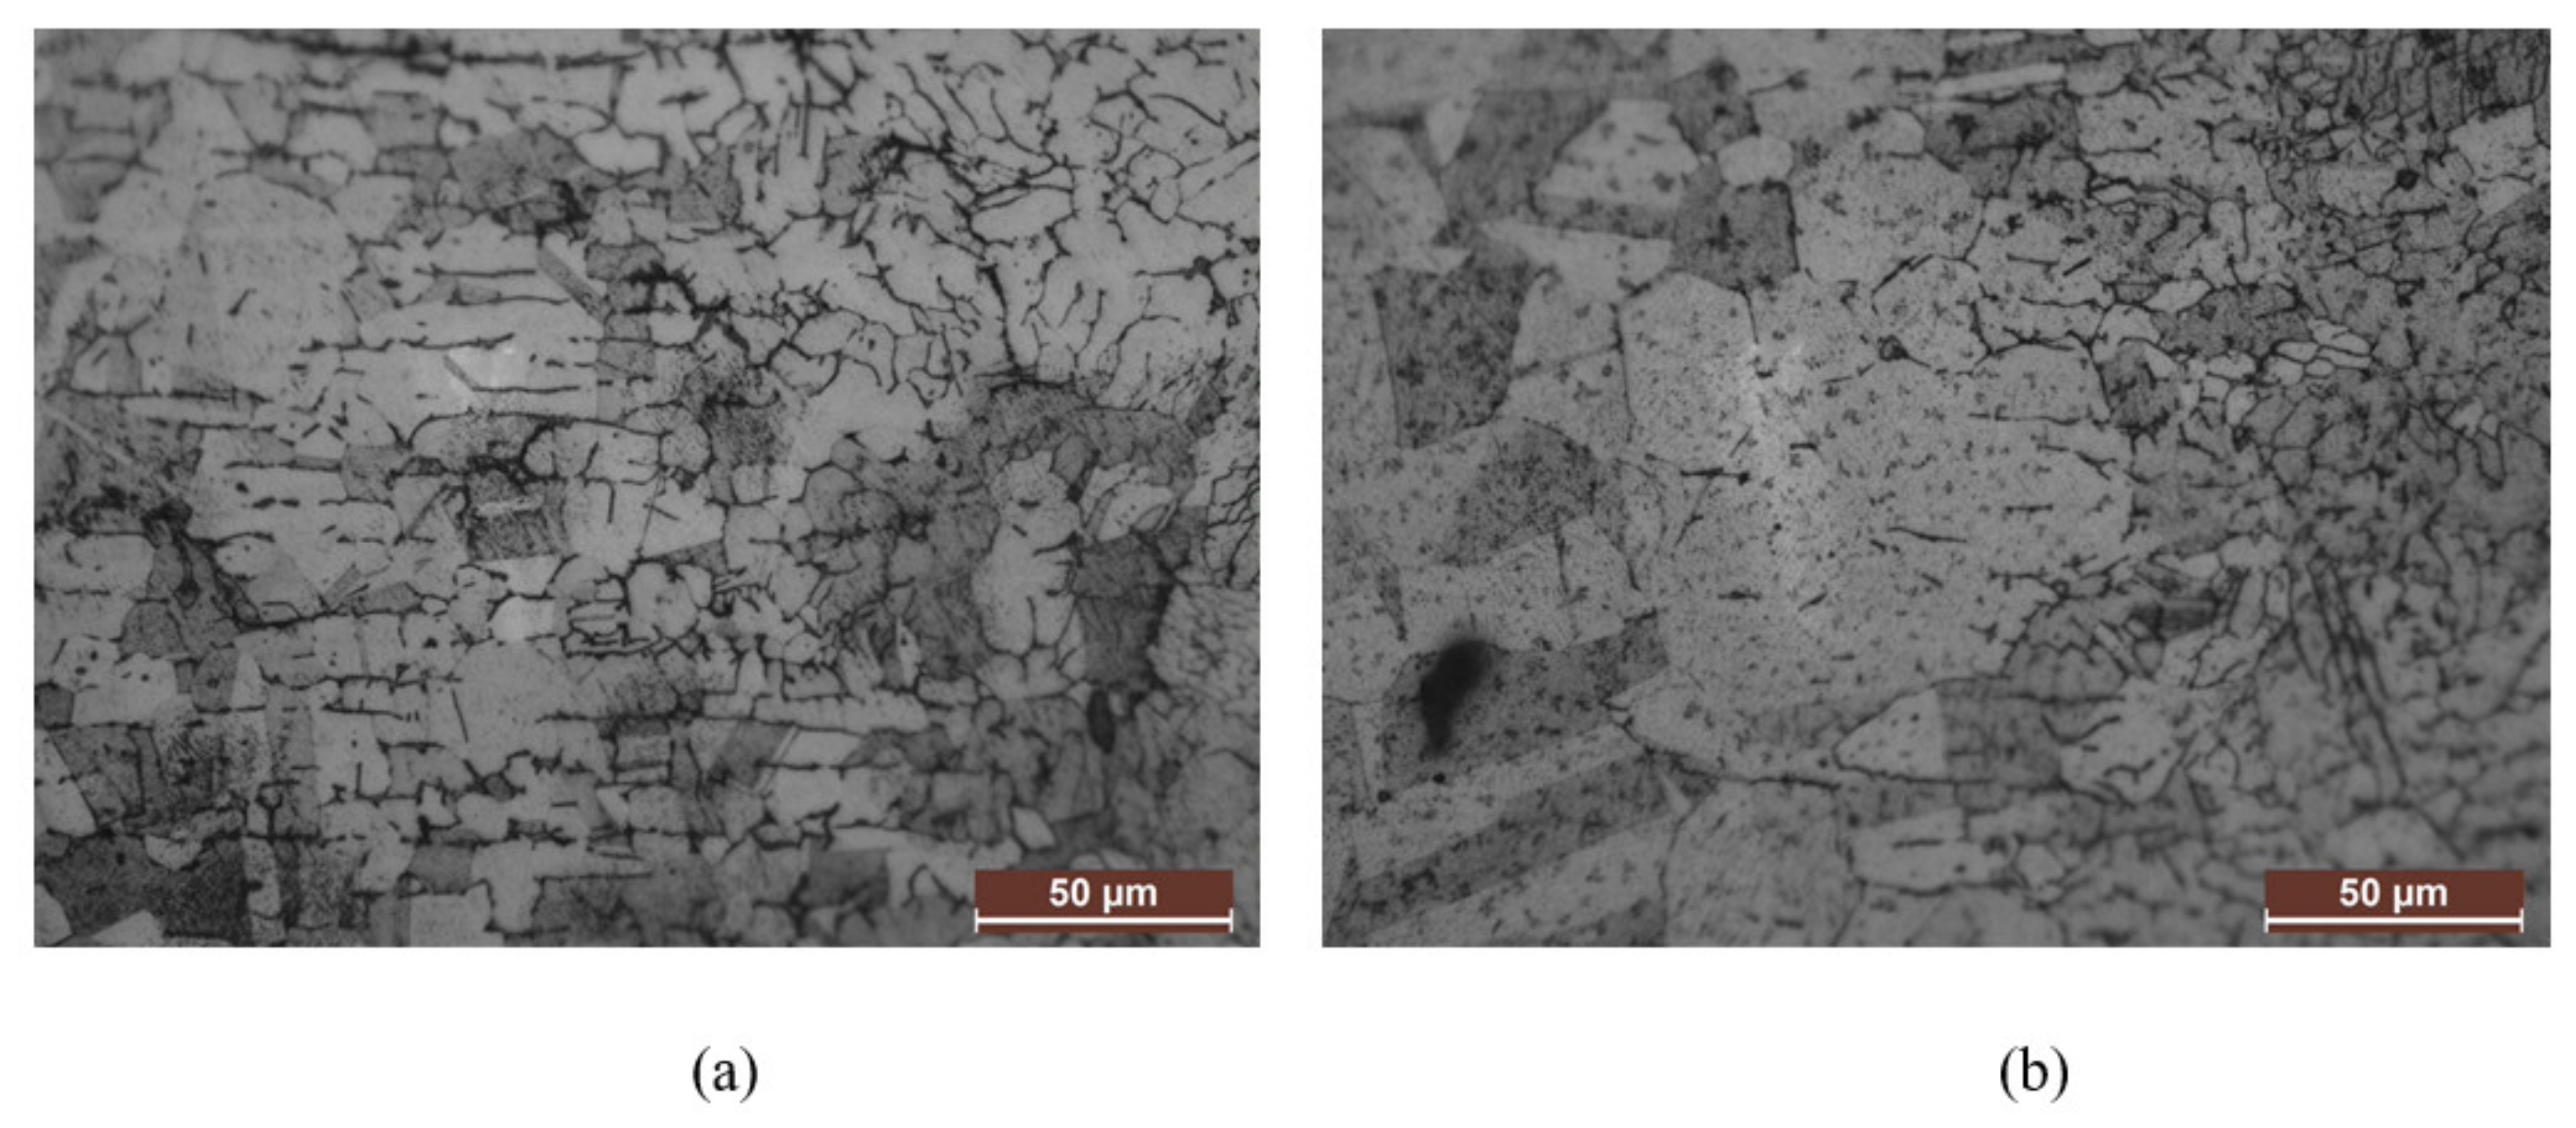
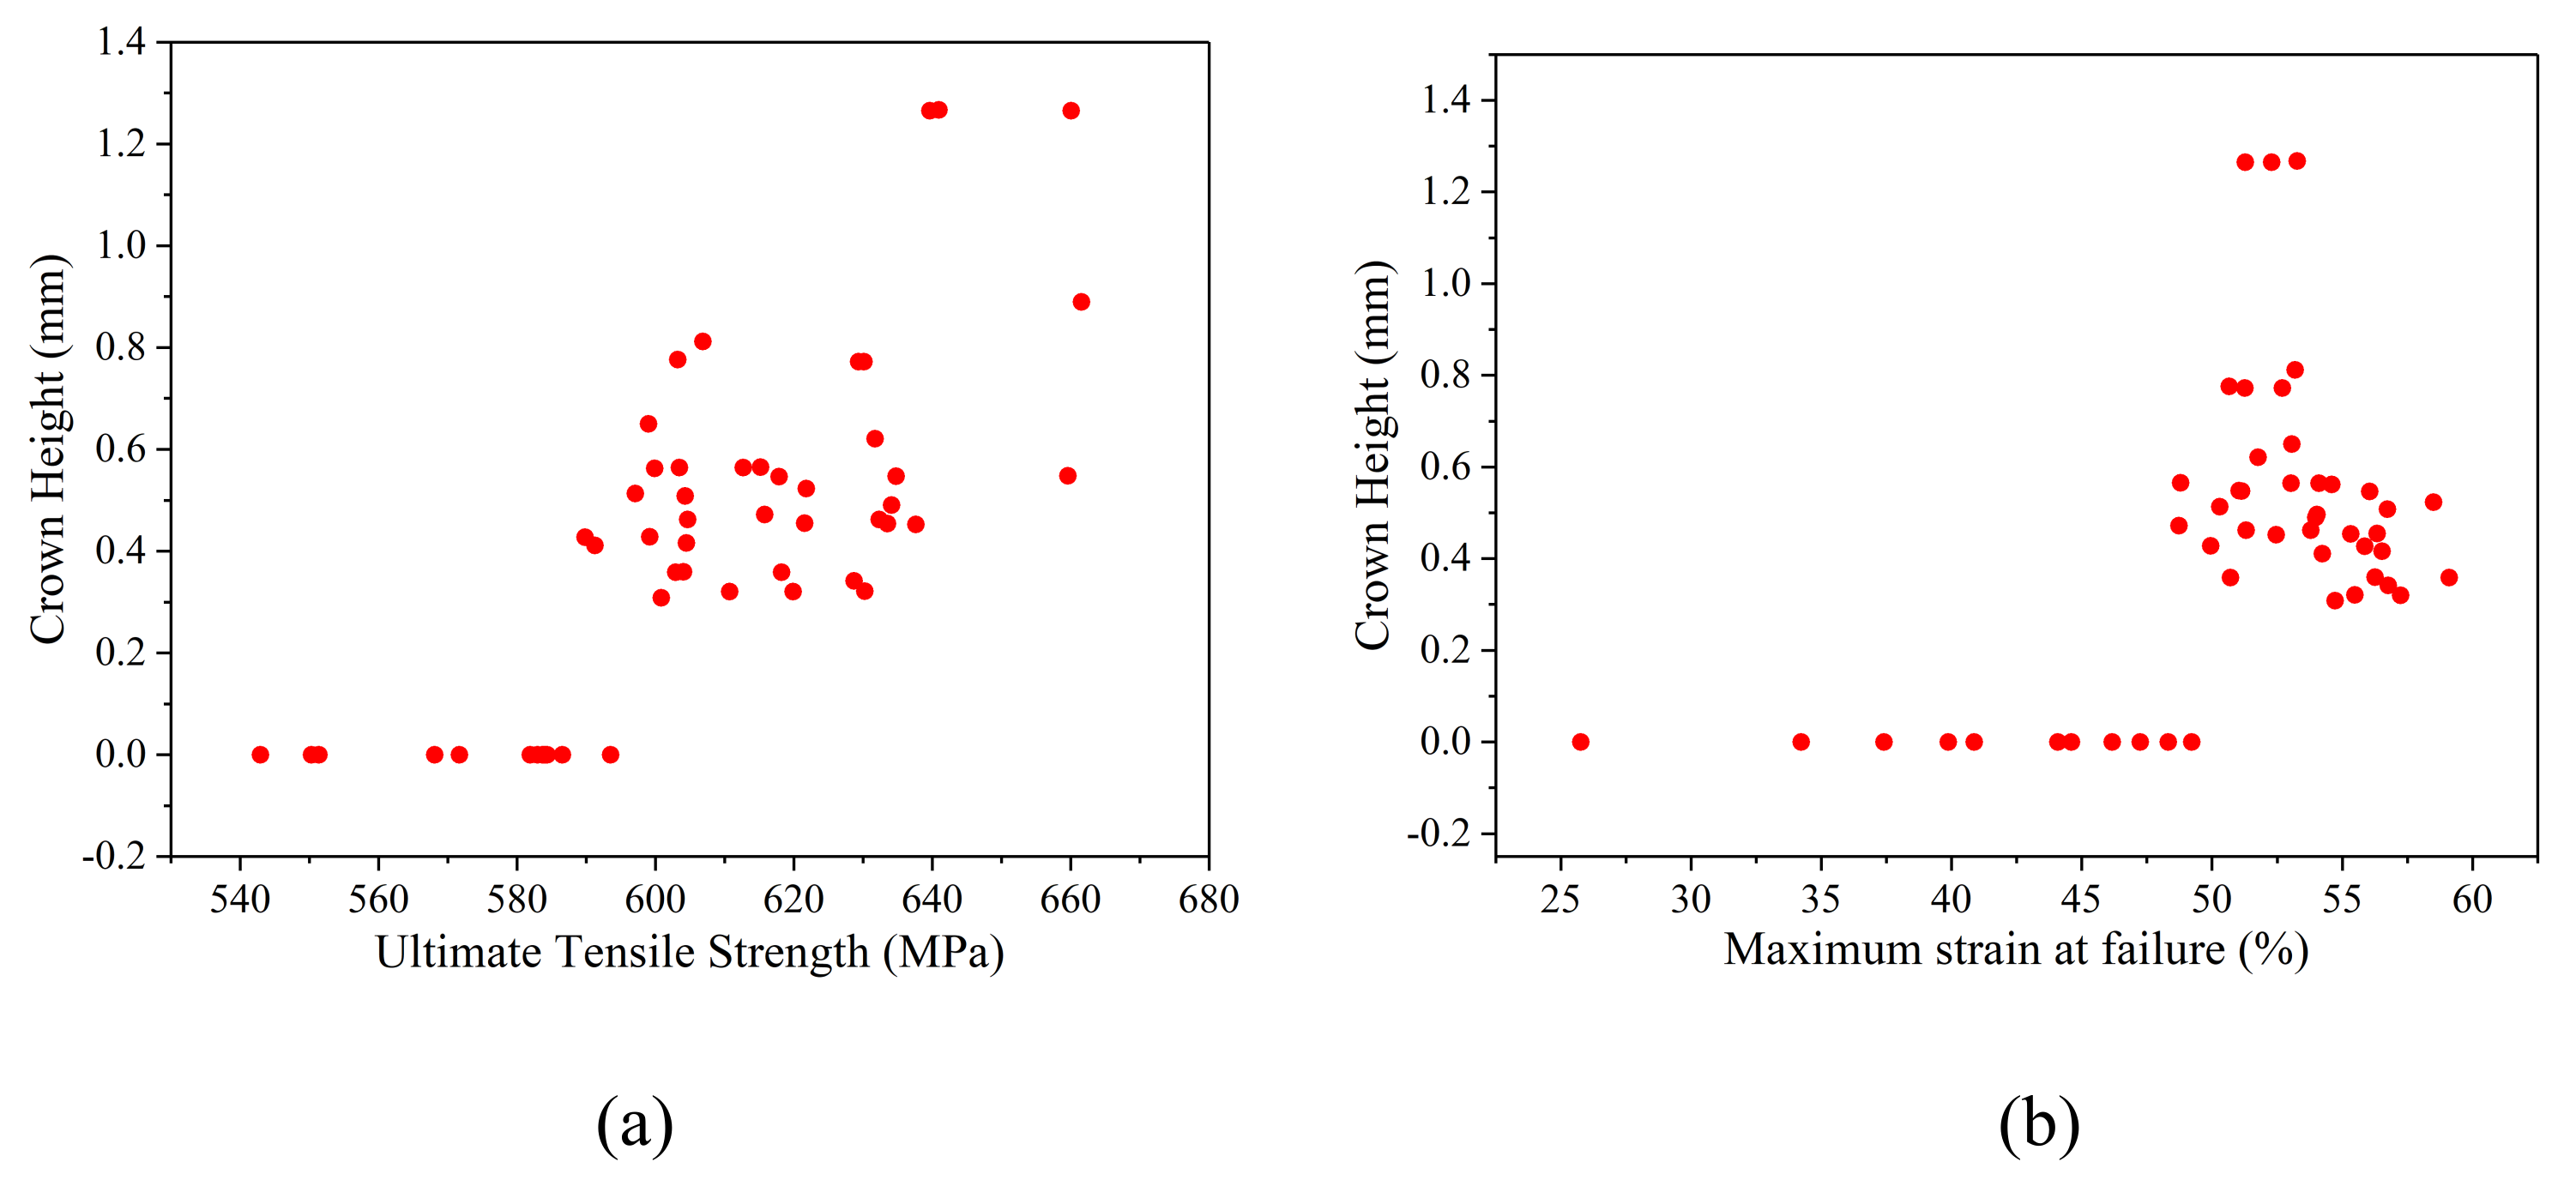
The extracted metallographic samples were mounted in conductive Bakelite in batches of five for the homogenous welds and in batches of three for heterogeneous welds. On mounting the samples, the molds were grinded using silicon carbide papers of different grits, including 120, 240, 600, 900, 1200 and 2500, followed by polishing using 9 µm, 3 µm and 0.04 µm gels. The samples were later etched using acetic glycergia solution, which revealed the microstructure within the fusion zone (FZ) as well as the heat-affected zone (HAZ). Acetic glycergia is a solution of 5 mL glycerol, 15 mL hydrochloric acid, 10 mL nitric acid and 10 mL acetic acid. The samples were etched in this solution for approximately 5 s. All the geometrical features including the crown height (
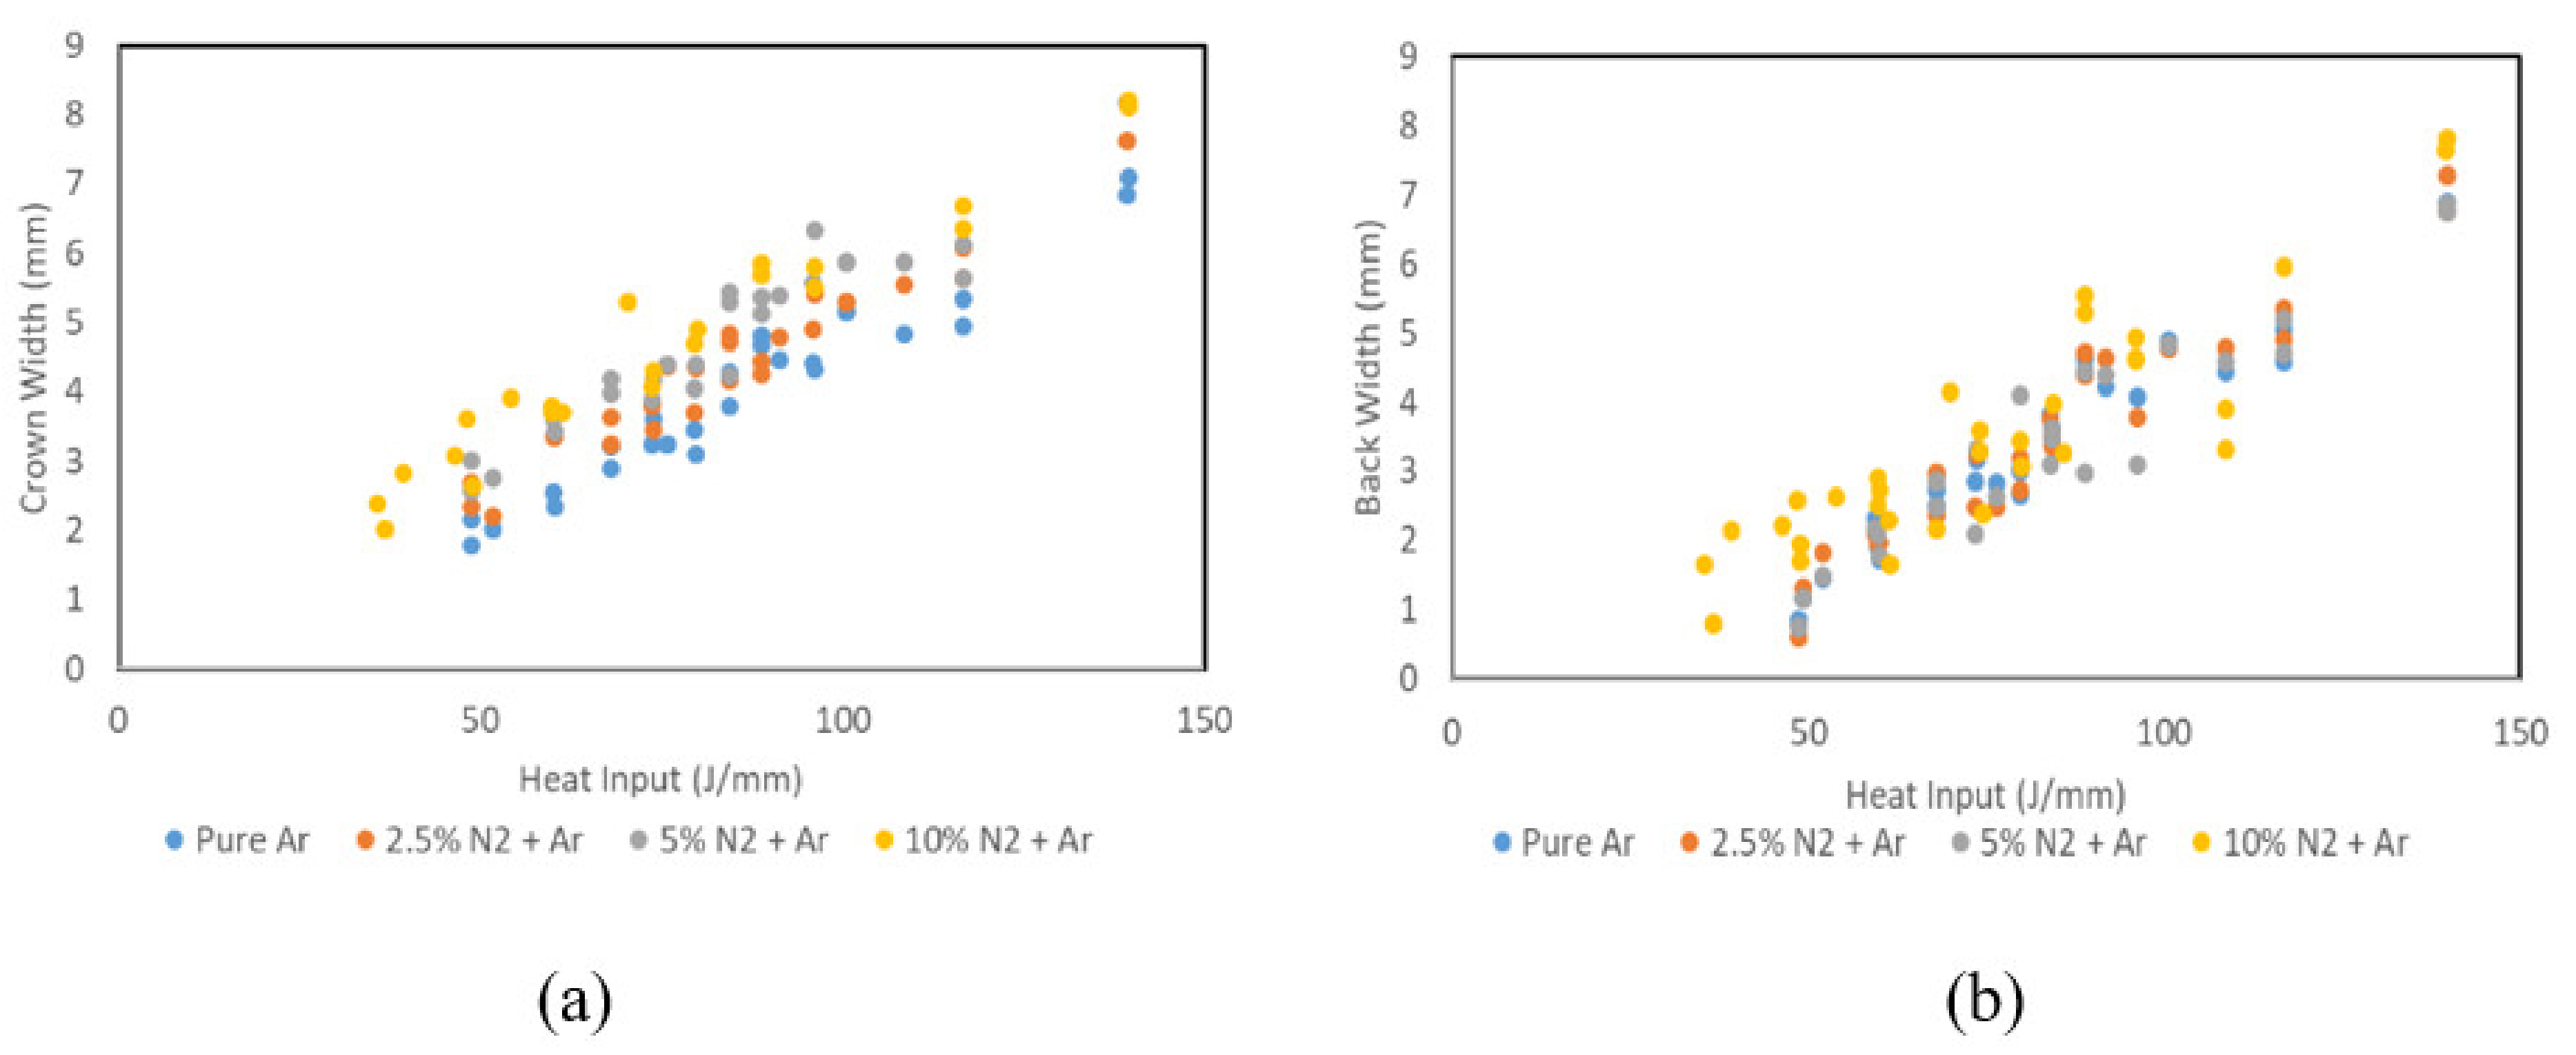
CH), crown width (CW), penetration (PEN), back width (BW), crown angle (CA), back angle (BA), crown radius (CR), back radius (BR) and cross-sectional area (WA) were measured using a Leica DM2700 microscope, as shown in Figure 4.
These same mounted samples were used for microstructure analyses. These included qualitatively analyzing the grain size within the FZ and the HAZ. In addition, the ferrite number (FN) of the welds was measured using a FeritScope®. FN was measured at six different locations along the welds and averaged. Half of these measurements were taken from the crown side of the welds, while the others were taken from the root (back) to ensure minimum discrepancies in data due to measurement location.
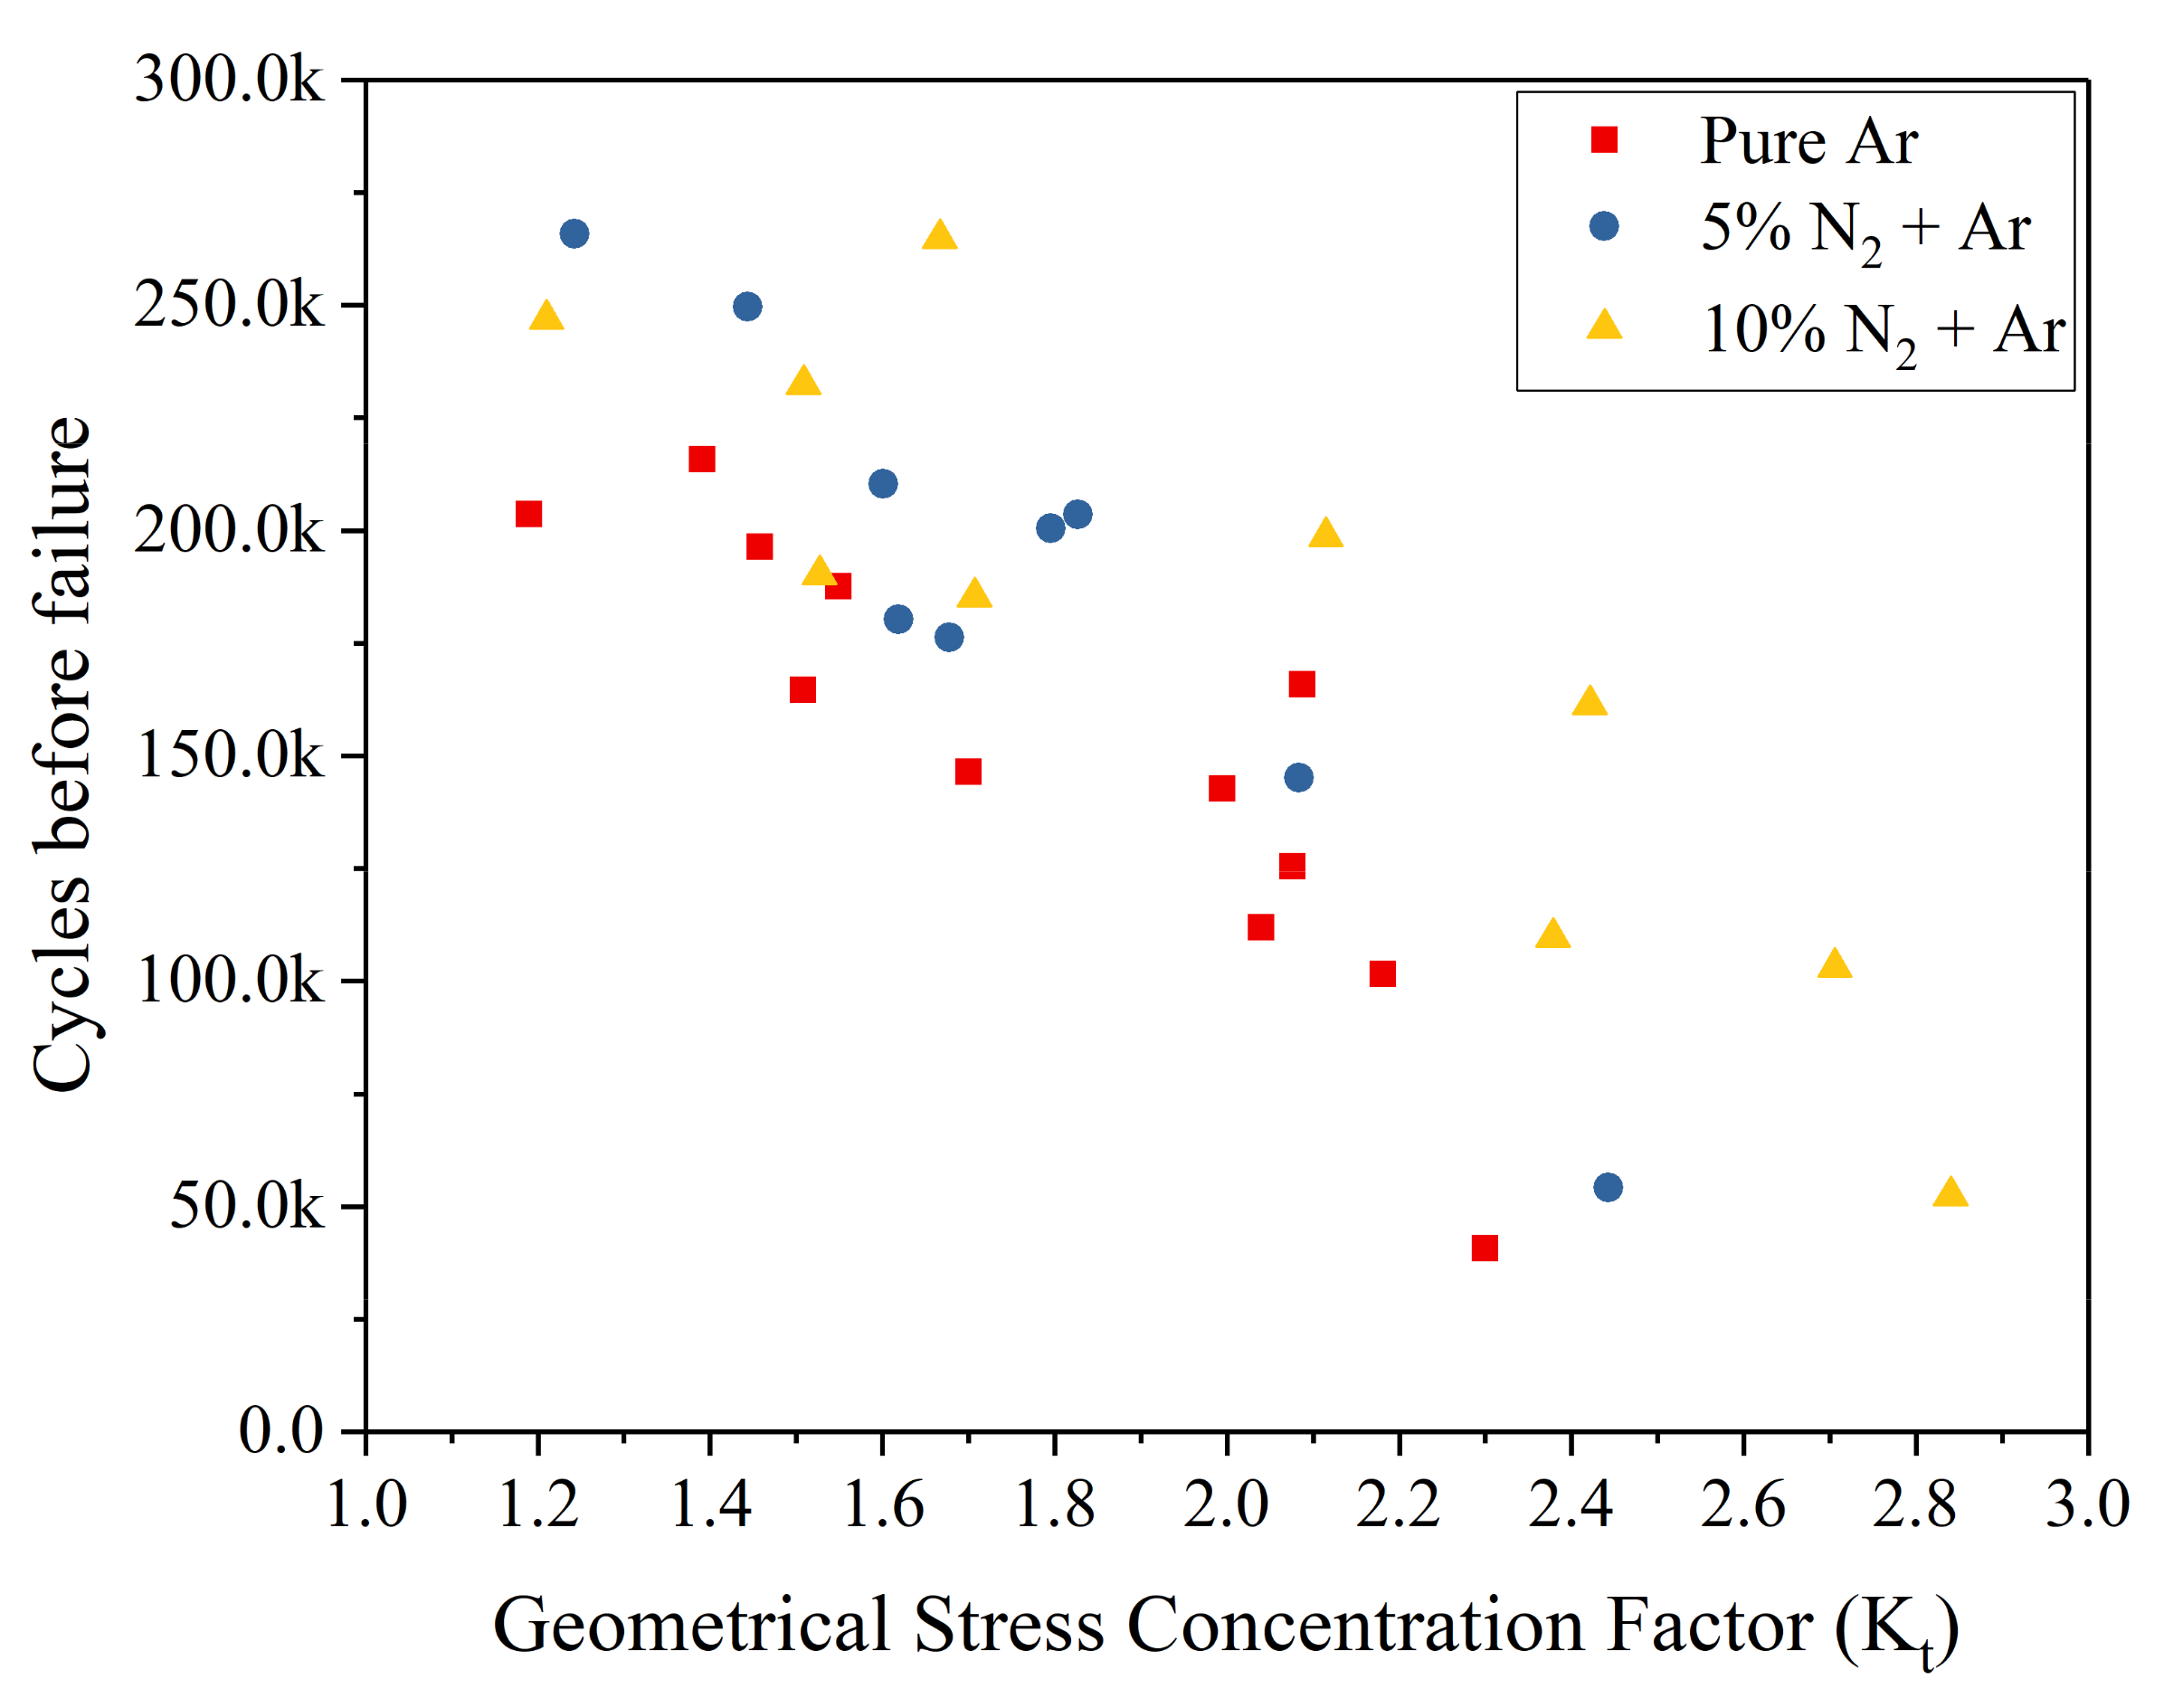
Finally, some additional welds were made to estimate the changes in the fatigue life on the addition of nitrogen through the shielding gas. Welds were only made heterogeneously using a 1 mm filler wire for testing in fatigue. For every combination of the heat input parameter that gave a measurable crown and penetration, welds were made using 0%, 2.5%, 5% and 10% N2 in the shielding gas. For analysis purposes, the welds having similar geometrical stress concentration factors (kt) were compared to understand the effect of the addition of nitrogen. The kt was estimated using finite element analysis (FEA) as well as the Lawrence equation, as shown in Equation (2).
k t = 1 + 0.27 × t a n θ 1 4 × t ρ 1 2
where θ is 180°-CA or BA, depending on the region of the welds being analyzed, t is the thickness of the sheets, and ρ is the CR or BR, again depending on the region being analyzed.
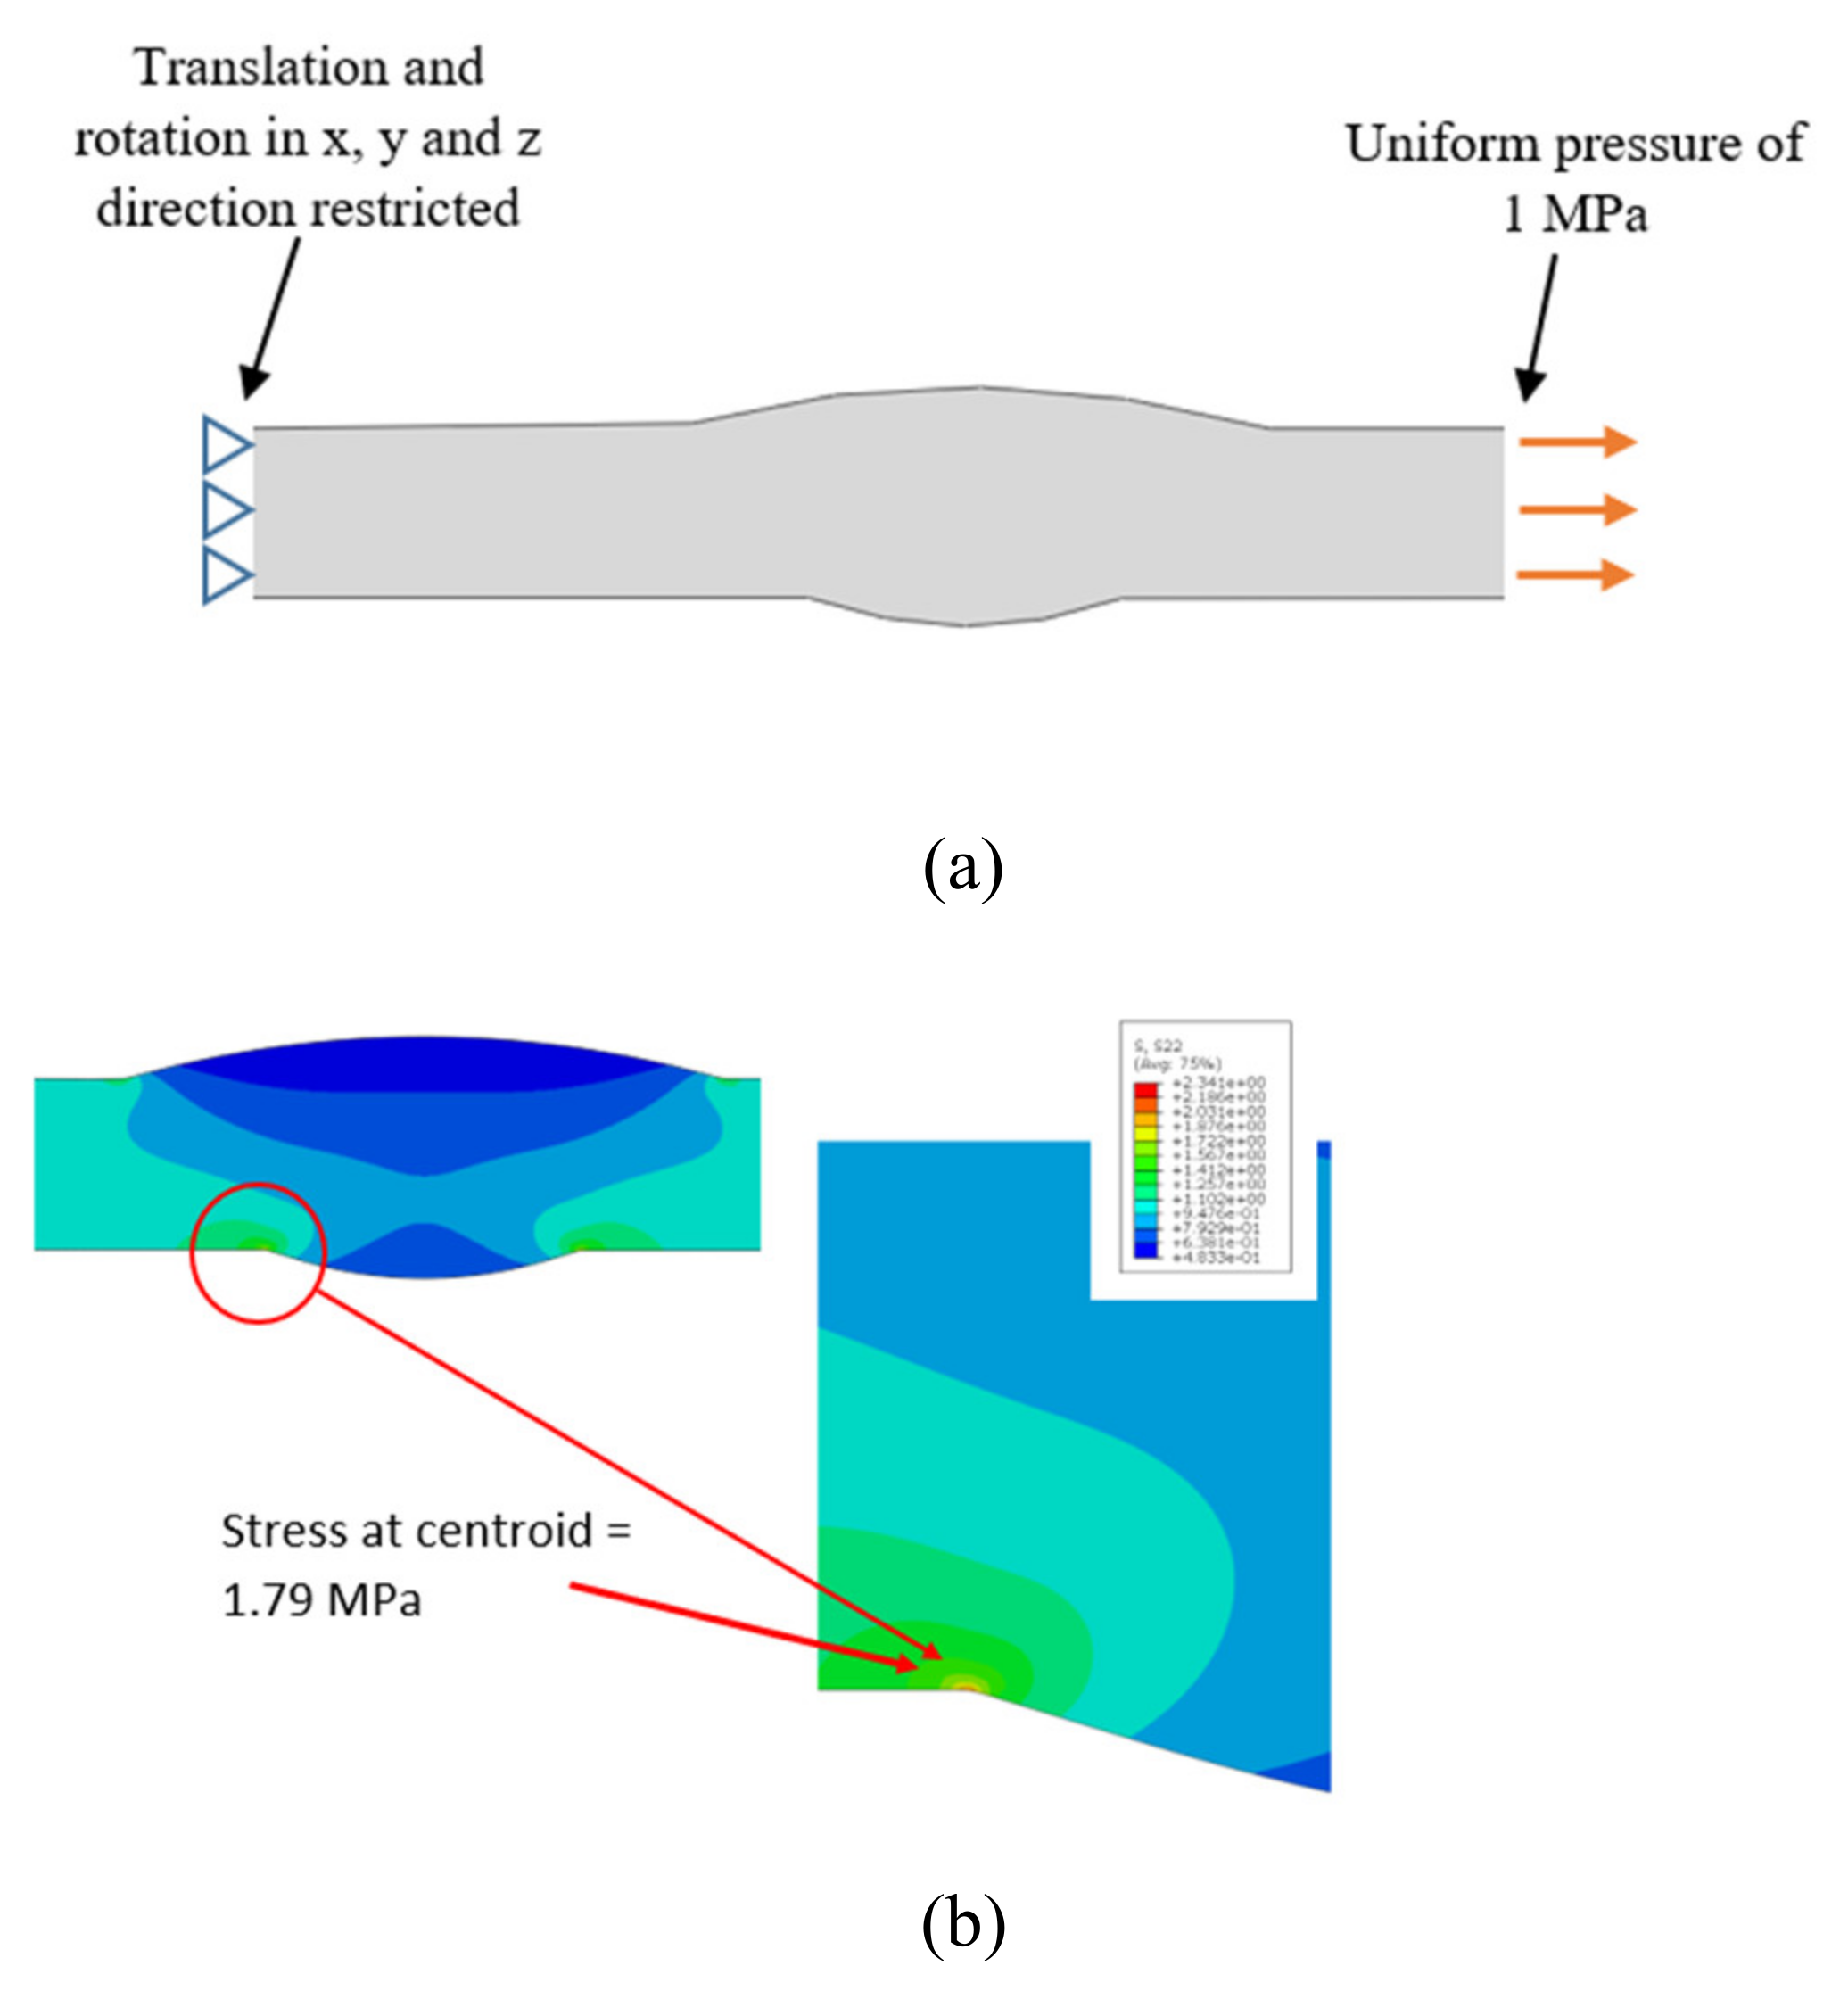
For FEA, the samples were modelled in Catia V6R15 and analyzed using Abaqus software for obtaining the kt, as shown in Figure 5. Localized fine meshing was performed near the boundary of the base material and the fusion zone while the other areas were coarsely meshed. It was ensured that the mesh size was converged before the results were recorded. Additionally, stress at the centroid of the element in the mesh was considered to calculate the kt instead of at the edge node in order to eliminate over-estimation. The boundary conditions used for the estimation of kt are also shown in Figure 5.
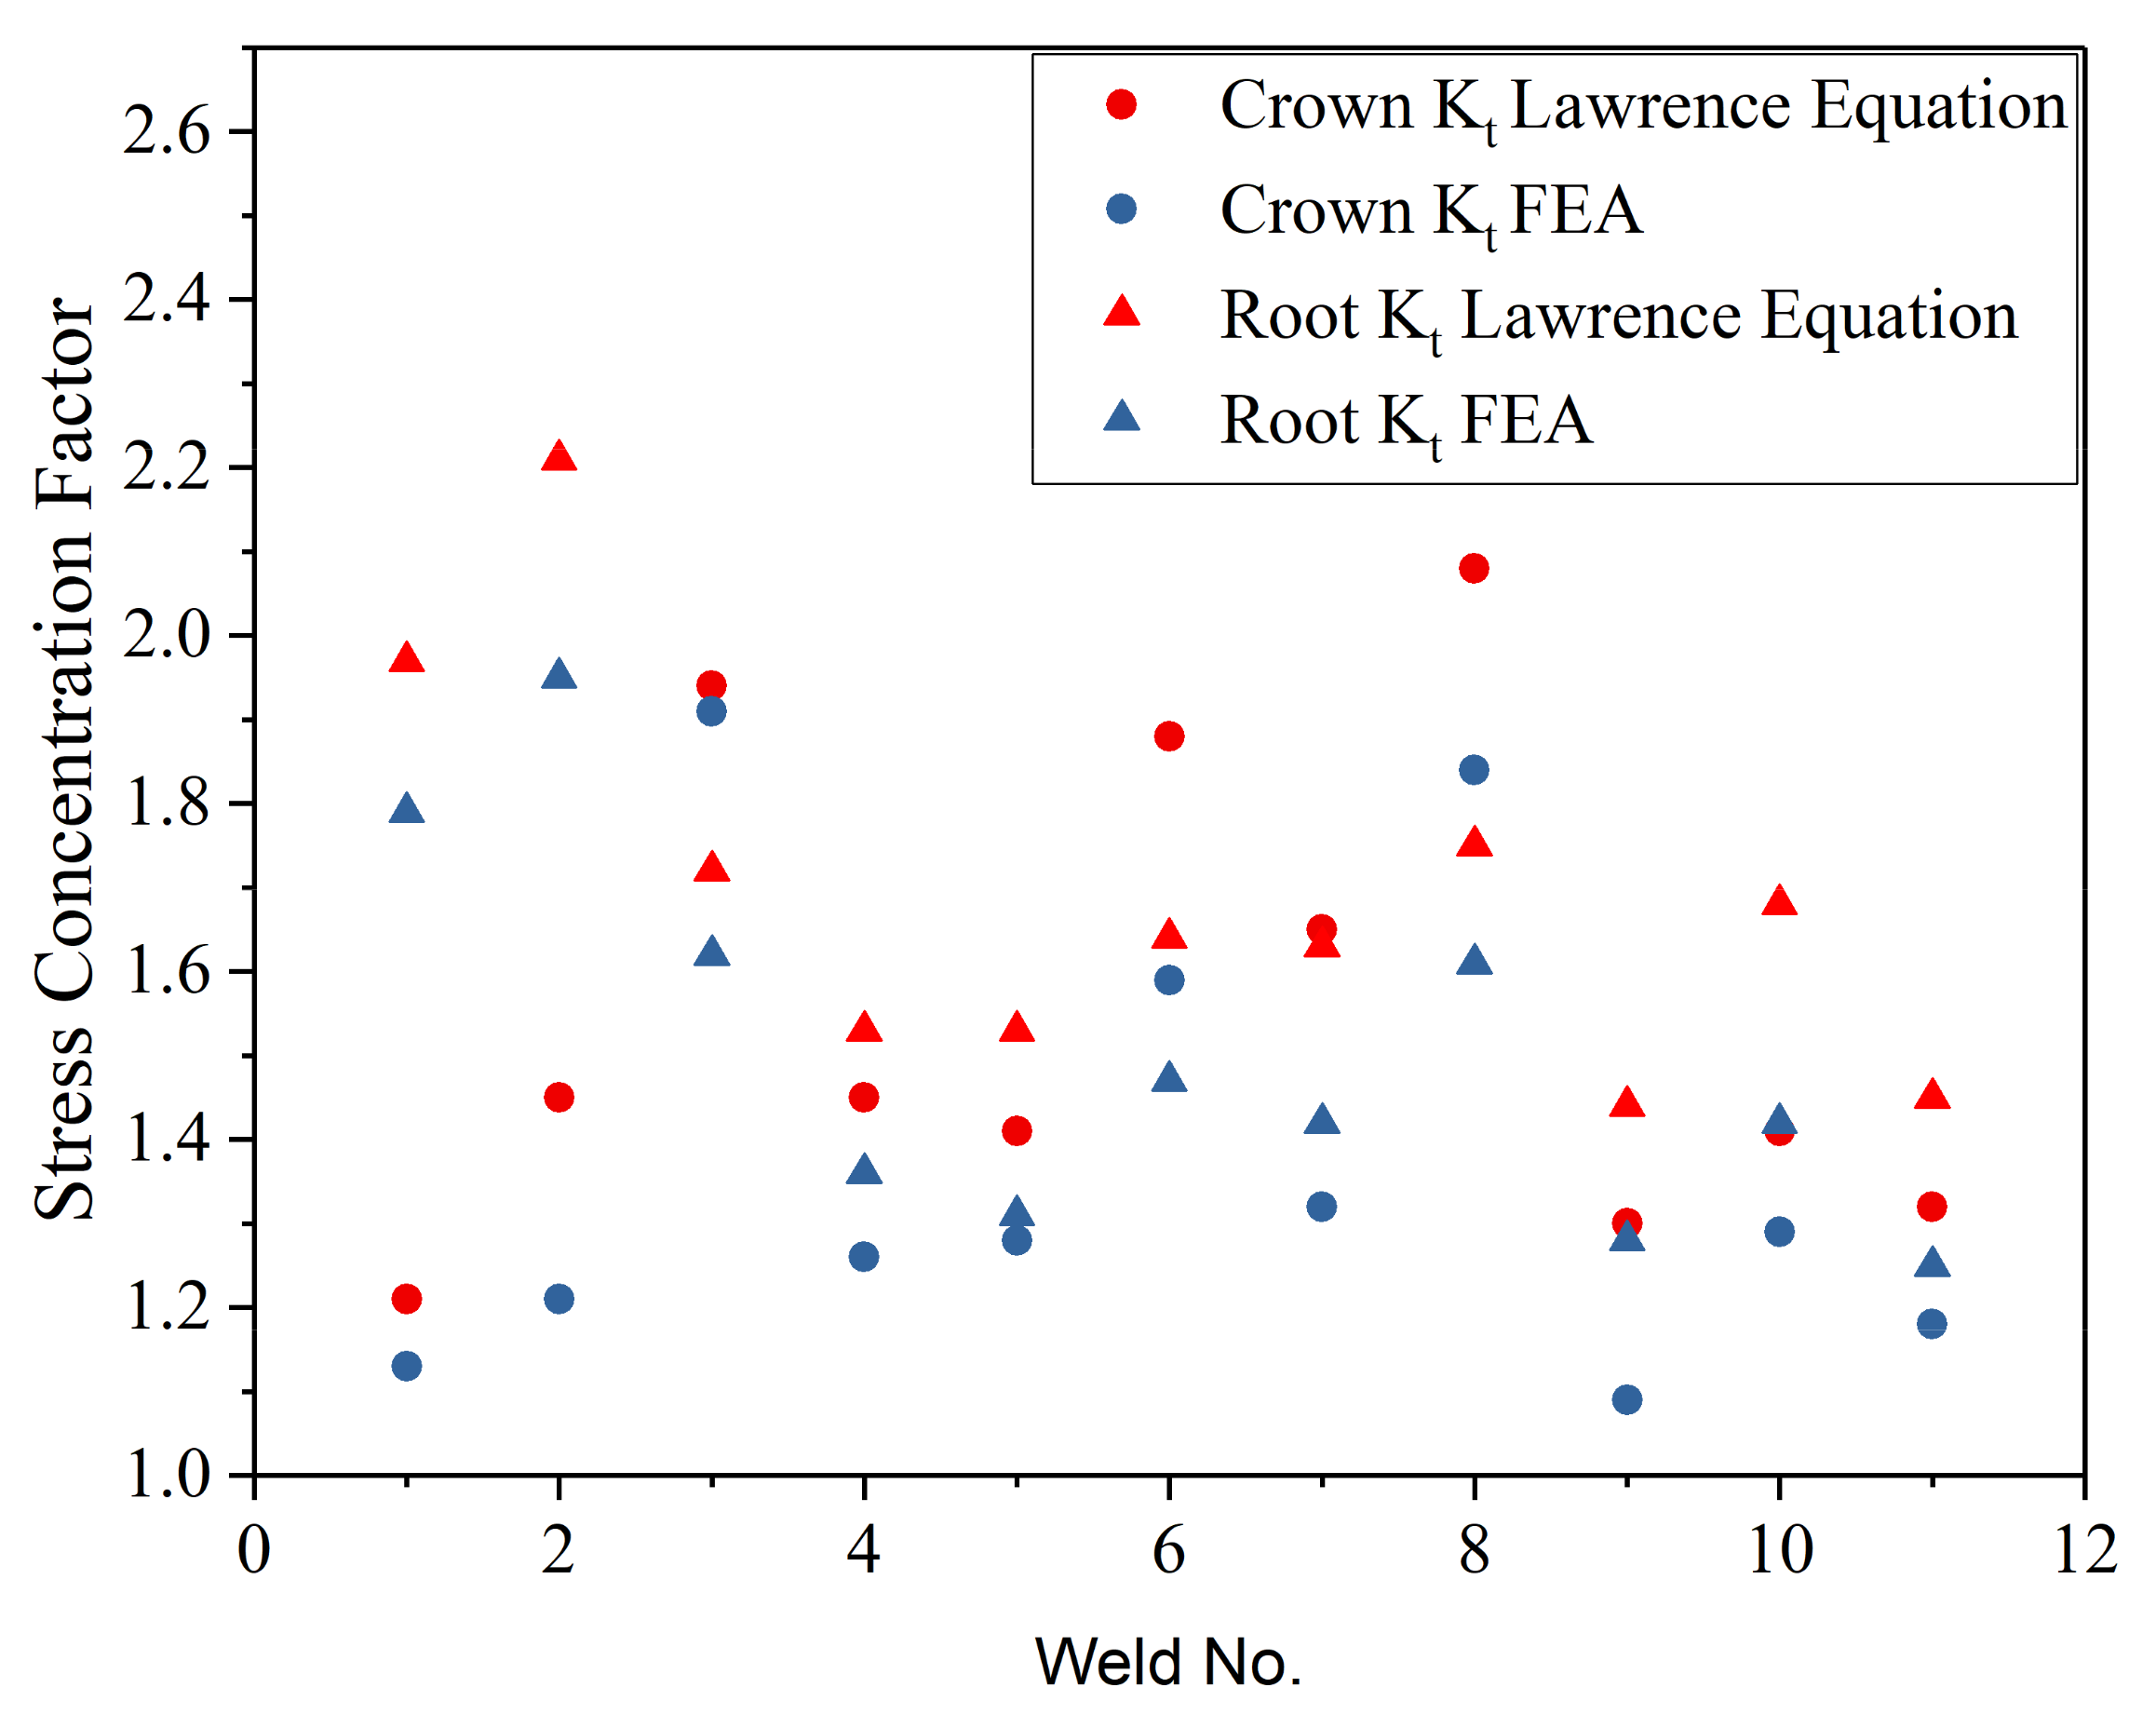
The samples were then tested in fatigue at different load ranges varying between 60% and 80% of the ultimate tensile strength (UTS) of the base material to obtain the S–N curves. An R ratio of 0.1 was used for all the tests at a frequency of 20 Hz. The failure location of the samples was noted and compared with the location of the highest kt obtained through FEA and the Lawrence equation. It was found that all the samples failed at the location predicted by both the methods. It is important to note here that in all the cases, the kt obtained using FEA was found to be slightly lower than that obtained using Lawrence’s equation, as shown in Figure 6. The parameters used for those welds are mentioned in Table 5.

3. Results and Discussion

This section is divided by subheadings. It should provide a concise and precise description of the experimental results, their interpretation, as well as the experimental conclusions that can be drawn.

3.1. Effect on Geometrical Features

From the experiments, it was observed that for welds made using pure Ar as the shielding gas, an increase in heat input increased the weld penetration depth as expected. The welds made using various values of N2 in the shielding gas showed deeper penetration than those made using pure Ar. This was valid for the homogenous as well as heterogeneous welds. The results are consistent with those reported by [10,11]. Welds made using N2 in the shielding gas were also found to have wider CWs as compared to those made using pure Ar; however, the difference in the BW was not evident. This is illustrated in Figure 7, which compares the CWs and BWs of those welds made on 0.7 mm thick sheets using pure Ar to those made using other concentrations of N2 in Ar shielding gas mixtures. Figure 8 compares the same outputs for welds made heterogeneously on 1.5 mm thick sheets.
The head input was calculated using Equation (3), as suggested by [17].
H e a t   I n p u t = C u r r e n t   ×   V o l t a g e T r a v e l   S p e e d
The ANOVA results for the CW and BW for the 0.7 mm thick are shown in Table 6 and Table 7 below. The Fcrit values less than the F values for CW suggest that the series are not from the same group. However, differences in the BWs of the samples are not evident, as can be seen in Table 7. The value of Fcrit is significantly lower than that of F.
Similar conclusions can be drawn for the 1.5 mm thick sheets based on the ANOVA results shown in Table 8 and Table 9.
Figure 7 and Figure 8 suggest that when using N2 in the shielding gas, the difference in the CW is larger than the difference in the BW of the welds. Some welds made using 10% N2 + Ar mixture were in fact found to have lower BWs that those made using pure Ar. This indicates that the N2 through the shielding gas can modify the shape of the welds, which, in turn, can modify several properties associated with the weld ‘shape-factor’. When using N2 in the shielding gas, the crown of the weld widens, but narrows the penetration profile, making them more ‘triangular’.
Analysis of the data acquired from the experiments also revealed an interaction between the WFR and the composition of the shielding gas. It was observed that when the welds were shielded using pure Ar, an increase in the WFR decreased the PEN. This was expected because an increase in the WFR increased the total volume of the material to melt using the same heat, leading to a reduced penetration depth. However, when the welds were made with various values of N2 in the shielding gas, an increase in the WFR increased the PEN. This was observed for all the levels of N2 in the shielding gas considered in this study. This effect of N2 in the shielding gas is illustrated in Figure 9.
The potential reasons for the increase in PEN with an increase in the WFR in the presence on nitrogen can be attributed to one or both of the following reasons:
  • The addition of N2 is known to increase the temperature of the weld pool as reported by [18,19,20]. The surface tension-driven Marangoni convection depends on the maximum temperature reached in the molten state. The increase in temperature due to the addition of N2 must have exceeded threshold that changes the direction of flow from radially outward to radially inward, as illustrated in Figure 10. In such cases, the penetration depth of the welds can increase with a reduction in BW, as seen in the figures produced by [21,22,23], etc., during their study on activated flux–TIG (A-TIG) welds;
  • It has been reported by [3,24,25] that the composition of the shielding gas can significantly change the arc pressure as well as its distribution over the materials being joined. In the axial direction, under a large potential difference, the plasma flow rate in the cathode region rises rapidly, and the arc plasma reaches the maximum velocity after it leaves the tungsten. The arc plasma impinges on the anode, creating the arc pressure; at the same time, the speed of the plasma drops rapidly. The addition of nitrogen may increase the free-species velocity within the plasma column resulting from both dissociation and ionization energy increases. The possible increase in the arc pressure on using N2 in the shielding gas must have increased the weld width and penetration depth. It was also observed that the CH of the welds decreased with an increase in N2 in the shielding gas which further indicates the potential increase in the arc pressure.
Considering this interaction effect between the WFR and N2 in the shielding gas is critical in order to predict the geometry of the welds and develop the welding process specifications (WPS). This analysis could be extended to welding with different filler wire diameters. When welding using pure Ar as the shielding gas, an increase in the WD decreased the PEN; however, in the presence of N2, an increase in the WD increased the PEN. Consequently, the WFR and WD could be combined as a single parameter called the filler wire volume feed rate (VFR). Equation (4) can be used to calculate the VFR when using the WD and WFR.
V F R = π × W D 2 4 × W F R    

3.2. Effect on Microstructural Features

The microstructures of the welds made using pure Ar and the 10% N2 + Ar mixture for shielding are shown in Figure 11.
The retained δ-ferrite within the fusion zone of the welds was significantly reduced by the addition of nitrogen. These results are in agreement with those reported by several researchers previously, including [10,11], etc. The weld in Figure 11a shows a lathy δ-ferrite morphology, whereas the weld in Figure 11b exhibits a skeletal/vermicular morphology. It has been reported by Lippold and Kotecki in [26,27] that both these morphologies are obtained in the ferrite–austenite (FA) type of solidification. For the weld pool cooling rates obtained in TIG welding, when the chromium equivalent (Creq) to nickel equivalent (Nieq) ratio is high but still within the FA mode of solidification, a lathy morphology is exhibited by the distributed δ-ferrite in the fusion zone, whereas on reducing the Creq/Nieq the morphology exhibited is vermicular. Further reductions in Creq/Nieq can change the solidification mode to austenite–ferrite (AF), but the microstructure in Figure 11b suggests that even with the addition of 10% N2 in the shielding gas, the fusion zone retained the FA solidification mode. It is normally preferred when welding austenitic stainless steels that the FA solidification mode is maintained because the welds are least susceptible to solidification cracking in this mode. However, nitrogen being a strong austenite-promoting element must have significantly reduced the Creq/Nieq ratio of the welds, changing its morphology.
Figure 12 compares the FNs of welds measured using a FeritScope made using pure Ar and 10% N2 + Ar as the shielding gas.
The x-axis of the plots in Figure 12 is the cooling rate of the welds, because the amount of retained δ-ferrite is known to strongly depend on it. The cooling rates were calculated using Adam’s equations, as mentioned in [12]. It can be seen that the difference in the FNs is negligibly small, contradicting the literature. However, Kshirsagar et al. [14] have shown that the FNs measured using the FeritScope largely depend on the WA. This dependence is prominent in the welds having a cross-sectional area less than 13 mm2, which was the case for most of the welds in this study. Consequently, the FN of the welds with such a small WA is not a true representation of the phase ratio and distribution within the fusion zone. A comparison was therefore made using the ferrite density number (FDN), as suggested in [14]. Calculation of the FDN is beyond the scope of this paper and readers are advised to refer to [14] for further details. Figure 13a compares the FDN of the welds made on 0.7 mm thick sheets using pure Ar and 10% N2 + Ar as the shielding gas, while Figure 13b compares the welds made on 0.9 mm thick sheets. It is evident from Figure 12 and Figure 13 that the addition of N2 through the shielding gas significantly reduced the ferrite density within the weld pool, but the total amount of ferrite could still increased due to the larger size of the welds.
The heat-affected zone (HAZ) of the welds made using N2 in the shielding gas was found to have larger grains than those welded using pure Ar. Figure 14 illustrates the difference in the grain size within the HAZ when the welds were made with different compositions of the shielding gas. In addition, the amount of retained δ-ferrite in the HAZ was lower when the welds were made using various concentrations of N2 in the shielding gas, as shown in Figure 14b. This confirms that the addition of N2 through the shielding gas also influences the retained δ-ferrite in the HAZ, which could be due to lower cooling rates.

3.3. Effect on Mechanical Properties

As mentioned previously, tensile tests were performed on all the welds to understand the effect of the addition of N2 through the shielding gas on the mechanical strength of the welds. For homogenous welds made using the same shielding gas, an increase in the heat input decreased the ultimate tensile strength (UTS) as shown in Figure 14. On using 10% N2 + Ar for shielding, a similar trend was observed, but with a significant increase in the UTS when compared with welding using pure Ar. All the welds were found to fail in the HAZ. In Figure 15, 99% confidence intervals are plotted on the acquired data, illustrating the increase in UTS on adding nitrogen through the shielding gas.
With an increase in the UTS, the elongation before failure (ε) was found to considerably decrease for welds made with N2 in the shielding gas, as shown in Figure 16. The trend lines for the welds made using pure Ar and 10% N2 + Ar were nearly parallel, indicating no interaction effect was present between the added nitrogen and heat input that would lead to unexpected changes in these properties.
The welds made heterogeneously could be classified into two types based on the mechanical strength obtained, which had a strong correlation with the bead geometry. Those welds that had a nearly flat crown (CH = 0) were found to have a significantly lower strength than those that had a non-zero CH. Welds with zero CH were also found to exhibit a much lower ε. This is illustrated in Figure 17 for all the heterogeneous welds for the UTS, as well as the ε.
Moreover, the welds that had a positive CH were found to fail in the base material, away from the fusion zone and the HAZ. This indicates that there is a shape factor of the bead geometry that adds reinforcement to the weakest sections of the weld (boundary between the HAZ and fusion zone) through increasing the thickness at those locations. Due to this reinforcement, the stress in the region must have been significantly reduced and the failure shifted to the higher stressed locations in the base material. Consequently, the effect of the addition of N2 through the shielding gas could not be established, because the failure occurred mainly in the base material which is unaffected by its addition.

3.4. Effect on Fatigue Life

As mentioned previously, the fatigue lifespans with different concentrations of N2 in the shielding gas were compared based on the kt of the welds. The results obtained are plotted in Figure 18.
For any particular kt, the samples welded using 10% N2 + Ar gave the best fatigue life, whereas those welded using pure Ar underwent the least number of cycles before failure. This can be attributed to the increase in mechanical strength of the samples welded in the presence of nitrogen. The percentage of UTS reached in this case could not be established because all the welds were found to fail in the base material and not at the FZ–HAZ boundary, as mentioned previously. However, only considering the stress concentration factors, it can be concluded that the addition of nitrogen changes the microstructure of the welds, consequently leading to a higher fatigue life.

4. Conclusions

From all the above experiments and analysis, the following conclusions can be made:
  • The addition of nitrogen through the shielding gas has a significant effect on the weld properties. This includes the geometrical, mechanical, fatigue as well as the microstructural features;
  • An interaction effect between the filler wire volume feed rate and the nitrogen content in the shielding gas was found to have a significant effect on the bead geometry. When welded in the presence of pure Ar, an increase in the volume feed rate was found to decrease the weld penetration, but in the presence of nitrogen, it was found to increase the penetration. This effect can be attributed to a possible change in the direction of Marangoni flow and an increase in arc pressure and temperature when adding nitrogen.
  • The addition of nitrogen through the shielding gas was only found to decrease the density of retained δ-ferrite and not the total amount which is retained. This can be attributed to the increase in the cross-sectional area of the welds when different compositions of shielding gas containing nitrogen are used for welding;
  • A ferrite–austenite (FA) solidification mode was retained even after using 10% N2 + Ar for shielding. A reduction in the Creq/Nieq ratio was evident from the microstructure of the welds changing from lathy to vermicular δ-ferrite. Within the HAZ, larger grains were observed when adding nitrogen through the shielding gas;
  • The mechanical strength for homogenous welds with added nitrogen was found to increase along with a reduction in the elongation before failure. The same could not be concluded in the case of heterogeneous welds because the strength was found to depend on the failure location, which, in turn, depended largely on the shape of the weld crown. Welds having a negligible crown height were found to fail within the HAZ, but those having a positive crown height failed in the base material, away from the HAZ. Welds that failed in the HAZ were found to have a lower strength than those which failed in the base material. However, an increase in the fatigue life mentioned in the next point indicates an increase in mechanical strength in the case of heterogeneous welds too;
  • In fatigue tests, the weld location could be predicted accurately using either finite element analysis (FEA) or the Lawrence equation. The stress concentration factor (kt) calculated using FEA was found to be slightly lower than that calculated using the Lawrence equation. For the welds having similar kt, those welded using 10% N2 + Ar shielding gas were found to have better fatigue life than those welded using pure Ar.

Author Contributions

Conceptualization, R.K.; Data curation, S.J.; Formal analysis, R.K., J.K.; Methodology, R.K. and S.J.; Supervision, S.J. and J.L.; Validation, S.J. and J.L.; Writing—original draft, R.K. and J.K.; Writing—review & editing, J.K. All authors have read and agreed to the published version of the manuscript.

Funding

This research received no external funding.

Institutional Review Board Statement

Not applicable.

Informed Consent Statement

Not applicable.

Data Availability Statement

The data cannot currently be made available because this is an ongoing research project.

Conflicts of Interest

The authors declare no conflict of interest.

References

  1. Kshirsagar, R.; Jones, S.; Lawrence, J.; Tabor, J. Prediction of Bead Geometry Using a Two-Stage SVM–ANN Algorithm for Automated Tungsten Inert Gas (TIG) Welds. J. Manuf. Mater. Process. 2019, 3, 39. [Google Scholar] [CrossRef] [Green Version]
  2. Rodrigues, A.; Loureiro, A. Effect of shielding gas and activating flux on weld bead geometry in tungsten inert gas welding of austenitic stainless steels. Sci. Technol. Weld. Join. 2005, 10, 760–765. [Google Scholar] [CrossRef]
  3. Lin, M.L.; Eagar, T.W. Pressures produced by gas tungsten arcs. Metall. Trans. B 1986, 17, 601–607. [Google Scholar] [CrossRef]
  4. Durgutlu, A. Experimental investigation of the effect of hydrogen in argon as a shielding gas on TIG welding of austenitic stainless steel. Mater. Des. 2004, 25, 19–23. [Google Scholar] [CrossRef]
  5. Gülenç, B.; Develi, K.; Kahraman, N.; Durgutlu, A. Experimental study of the effect of hydrogen in argon as a shielding gas in MIG welding of austenitic stainless steel. Int. J. Hydrogen Energy 2005, 30, 1475–1481. [Google Scholar] [CrossRef]
  6. Zorc, B. Automatic TIG welding of austenitic stainless steels in nitrogen and nitrogen-based gas mixtures. Rev. Metal. 2011, 4, 29–37. [Google Scholar] [CrossRef] [Green Version]
  7. Toit, M.D.; Pistorius, P. Nitrogen control during the autogenous arc welding of stainless steel. Part 2: A kinetic model for nitrogen absorption and desorption. Weld. J. 2003, 82, 231S–237S. [Google Scholar]
  8. Wiktorowicz, R.; Crouch, J. Shielding gas developments for TIG welding of duplex and super duplex stainless steels. Weld. J. 1994, 62, 379. [Google Scholar]
  9. Tseng, K.H.; Chou, C.P. The study of nitrogen in argon gas on the angular distortion of austenitic stainless steel weldments. J. Mater. Process. Technol. 2003, 142, 139–144. [Google Scholar] [CrossRef]
  10. Huang, H.-Y. Effects of shielding gas composition and activating flux on GTAW weldments. Mater. Des. 2009, 30, 2404–2409. [Google Scholar] [CrossRef]
  11. Lin, Y.C.; Chen, P.Y. Effect of nitrogen content and retained ferrite on the residual stress in austenitic stainless steel weldments. Mater. Sci. Eng. A 2001, 307, 165–171. [Google Scholar] [CrossRef]
  12. Vitek, J.M.; David, S.; Hinman, C.R. Improved Ferrite Number Prediction Model that Accounts for Cooling Rate Effects Part 1: Model Development. Weld. J. 2003, 82, 10. [Google Scholar]
  13. Vitek, J.M.; David, S.; Hinman, C.R. Improved ferrite number prediction model that accounts for cooling rate effects-Part 2: Model results. Weld. J. 2003, 82, 43. [Google Scholar]
  14. Kshirsagar, R.; Jones, S.; Lawrence, J.; Tabor, J. Measurement of ferrite content of stainless steel sheet welds using a new Ferrite Density Number scale. J. Mater. Proc. Technol. 2019, 274, 116278. [Google Scholar] [CrossRef]
  15. Shankar, V.; Gill, T.; Mannan, S.L.; Sundaresan, S. Effect of nitrogen addition on microstructure and fusion zone cracking in type 316L stainless steel weld metals. Mater. Sci. Eng. A 2003, 343, 170–181. [Google Scholar] [CrossRef]
  16. Nage, D.D.; Raja, V.S.; Raman, R. Effect of nitrogen addition on the microstructure and mechanical behavior of 317L and 904L austenitic stainless steel welds. J. Mater. Sci. 2006, 41, 2097–2112. [Google Scholar] [CrossRef]
  17. Faraji, A.; Moradi, M.; Goodarzi, M.; Colucci, P.; Maletta, C. An investigation on capability of hybrid Nd: YAG laser-TIG welding technology for AA2198 Al-Li alloy. Opt. Lasers Eng. 2017, 96, 1–6. [Google Scholar] [CrossRef]
  18. Tanaka, M.; Tashiro, S.; Satoh, T.; Murphy, A.B.; Lowke, J.J. Influence of shielding gas composition on arc properties in TIG welding. Sci. Technol. Weld. Join. 2008, 13, 225–231. [Google Scholar] [CrossRef]
  19. Murphy, A.B.; Tanaka, M.; Tashiro, S.; Sato, T.; Lowke, J.J. A computational investigation of the effectiveness of different shielding gas mixtures for arc welding. J. Phys. D Appl. Phys. 2009, 42, 115205. [Google Scholar] [CrossRef]
  20. Mucsi, C.S.; Gomes, M.P.; Orlando, M.T.D.; Luz, T.d.S.; Avettand-Fènoël, M.-N.; Rossi, J.L. Effect of Nitrogen Addition to Shielding Gas on Cooling Rates and in the Microstructure of Thin Sheets of Duplex Stainless Steel Welded by Pulsed Gas Tungsten Arc Welding Process. Mater. Res. 2019, 22. [Google Scholar] [CrossRef]
  21. Fujii, H.; Sato, T.; Lu, S.; Nogi, K. Development of an advanced A-TIG (AA-TIG) weldingmethod by control of Marangoni convection. Mater. Sci. Eng. A 2008, 495, 296–303. [Google Scholar] [CrossRef]
  22. Vasudevan, M.; Bhaduri, A.K.; Raj, B.; Rao, K.P. Genetic-Algorithm-Based Computational Models for Optimizing the Process Parameters of A-TIG Welding to Achieve Target Bead Geometry in Type 304 L(N) and 316 L(N) Stainless Steels. Mater. Manuf. Process. 2007, 22, 641–649. [Google Scholar] [CrossRef]
  23. Berthier, A.; Paillard, P.; Carin, M.; Valensi, F.; Pellerin, S. TIG and A-TIG welding experimental investigations and comparison to simulation. Sci. Technol. Weld. Join. 2012, 17, 609–615. [Google Scholar] [CrossRef]
  24. Savas, A.; Ceyhun, V. Finite element analysis of GTAW arc under different shielding gases. Comput. Mater. Sci. 2012, 51, 53–71. [Google Scholar] [CrossRef]
  25. Campbell, S.W.; Galloway, A.M.; McPherson, N.A. Arc pressure and weld metal fluid flow while using alternating shielding gases. Part 1: Arc pressure measurement. Sci. Technol. Weld. Join. 2013, 18, 591–596. [Google Scholar] [CrossRef]
  26. Lippold, J.C.; Kotecki, D.J. Welding Metallurgy and Weldability of Stainless Steels; John Wiley & Sons: Hoboken, NJ, USA, 2005. [Google Scholar]
  27. Inoue, H.; Koseki, T.; Ohkita, S.; Fuji, M. Formation mechanism of vermicular and lacy ferrite in austenitic stainless steel weld metals. Sci. Technol. Weld. Join. 2013, 5, 385–396. [Google Scholar] [CrossRef]
Figure 1. Fixture designed for holding the sheets in position during welding.
Jmmp 05 00072 g001
Figure 2. Three welds made on every pair of sheets using different parameters.
Jmmp 05 00072 g002
Figure 3. Locations of the tensile and metallographic samples extracted from the welded sheets.
Jmmp 05 00072 g003
Figure 4. Geometrical measurements of the welds taken using a Leica DM2700 optical microscope (a) CH, CW, PEN and BW; (b) CA and BA; (c) BR; (d) WA.
Jmmp 05 00072 g004
Figure 5. (a) Boundary conditions applied for the estimation of the kt; (b) estimation of the geometrical kt of the samples using FEA.
Jmmp 05 00072 g005
Figure 6. Comparison of stress concentration factors at the crown and root of the welds calculated using different methods.
Jmmp 05 00072 g006
Figure 7. Comparison of (a) CW and (b) BW for welds made homogenously using pure Ar and different values of N2 as the shielding gas on 0.7 mm thick sheets.
Jmmp 05 00072 g007
Figure 8. Comparison of (a) CW and (b) BW for welds made heterogeneously using pure Ar and different values of N2 as the shielding gas on 1.5 mm thick sheets.
Jmmp 05 00072 g008
Figure 9. Illustration of the interaction effect between WFR and N2 in the shielding gas. In the absence of nitrogen, an increase in the WFR decreases the PEN, but in the presence of nitrogen, an increase in WFR increases the PEN.
Jmmp 05 00072 g009
Figure 10. Potential change in the Marangoni convection from radially outward to radially inward in the presence of N2 in the shielding gas.
Jmmp 05 00072 g010
Figure 11. Microstructure within the fusion zone when the welds were made using (a) pure Ar and (b) 10% N2 + Ar as the shielding gas.
Jmmp 05 00072 g011
Figure 12. The ferrite number measured using a FeritScope of the welds made on (a) 0.7 mm thick sheets; (b) 0.9 mm thick sheets.
Jmmp 05 00072 g012
Figure 13. Calculated ferrite density number (FDN) of the welds made on (a) 0.7 mm thick sheets; (b) 0.9 mm thick sheets.
Jmmp 05 00072 g013
Figure 14. Difference in grain size within the heat-affected zone (HAZ) on welding using (a) pure Ar; (b) 10% N2 + Ar for shielding.
Jmmp 05 00072 g014
Figure 15. Effect of the addition of nitrogen through the shielding gas on the ultimate tensile strength (UTS) of welds made homogenously on (a) 0.7 mm thick sheets; (b) 0.9 mm thick sheets.
Jmmp 05 00072 g015
Figure 16. Effect of the addition of nitrogen through the shielding gas on the elongation before failure (ε) of welds made homogenously on (a) 0.7 mm thick sheets; (b) 0.9 mm thick sheets.
Jmmp 05 00072 g016
Figure 17. Effect of CH for the welds made heterogeneously on the (a) UTS and (b) ε. Welds having CH = 0 were found to have a significantly lower UTS and ε than those that had a positive CH.
Jmmp 05 00072 g017
Figure 18. Fatigue life comparison of the welds made using different compositions of shielding gas plotted against the kt obtained using FEA.
Jmmp 05 00072 g018
Table 1. Chemical composition of the materials used in the experiments.
MaterialCCrMnNNiPSSi
304 L 0.7 mm0.01918.2901.1300.0648.2500.0350.0010.310
304 L 0.9 mm0.02318.1401.7500.0908.1200.0250.0010.497
304 L 1.5 mm 0.02617.7952.0000.1008.1200.0250.0010.497
308 L Si filler0.01020.0001.8000.00010.0000.0150.0150.800
All quantities are wt.% of the elements in the alloy.
Table 2. Parameter ranges used for homogeneous welds made on 0.7 mm and 0.9 mm thick sheets.
Sheet Thickness 0.7 mm0.9 mm
ParameterParameter TypeMinimumMaximumMinimumMaximum
Ip (A)Continuous50706080
S (mm/s)Continuous4646
δ (%)Continuous40604060
f (Hz)Continuous4848
N2 (%)DiscreteSwitched between 0, 2.5, 5 and 10
Table 3. Minimum and maximum values of the parameters used for welding 1.5 mm thick sheets.
ParameterTypeMinimumMaximum
Peak Current (Ip, A)Continuous60120
Torch travel speed (S, mm/s)Continuous14
Pulsing frequency (f, Hz)Continuous16
Filler wire feed rate (WFR, mm/min)Continuous100800
Filler wire diameter (WD, mm)Discrete0.8 and 1.0
Nitrogen in shielding gas (N2, %)Discrete0, 2.5, 5 and 10
Table 4. Welding parameters divided based on the peak current (Ip) and travel speed (S).
Set 1MinimumMaximum
Peak Current (Ip, A)6090
Travel Speed (S, mm/s)12
Set 2MinimumMaximum
Peak Current (Ip, A)90120
Travel Speed (S, mm/s)34
Table 5. Parameters used for the welds made in Figure 6.
Sr. No.(Ip, A)(S, mm/s)(f, Hz)(WFR, mm/min)(WD, mm)(N2, %)
19021.550010
2701130010
38021.520012.5
49021.520015
5100364000.810
670225000.810
78021300110
810021.560012.5
91003140010
108021.520012.5
11100314000.810
Table 6. ANOVA for CW for the 0.7 mm thick samples welded with and without nitrogen in the shielding gas.
Source of VariationSSdfMSFp-ValueFcrit
Between Groups16.303.005.432.820.042.70
Within Groups185.3196.001.93
Total201.6199.00
Table 7. ANOVA for BW for the 0.7 mm thick samples welded with and without nitrogen in the shielding gas.
Source of VariationSSdfMSFp-ValueFcrit
Between Groups3.843.001.280.590.622.70
Within Groups217.20100.002.17
Total221.04103.00
Table 8. ANOVA for CW for the 1.5 mm thick samples welded with and without nitrogen in the shielding gas.
Source of VariationSSdfMSFp-ValueFcrit
Between Groups15.123.005.043.350.022.71
Within Groups132.5088.001.51
Total147.6391.00
Table 9. ANOVA for BW for the 1.5 mm thick samples welded with and without nitrogen in the shielding gas.
Source of VariationSSdfMSFp-ValueFcrit
Between Groups4.613.001.540.700.552.70
Within Groups219.49100.002.19
Total224.11103.00
Publisher’s Note: MDPI stays neutral with regard to jurisdictional claims in published maps and institutional affiliations.

