
Evaluation Simulator Platform for Extended Collision Risk of Autonomous Surface Vehicles


Cyber-Physical Systems Laboratory, Department of ICT and Natural Sciences, Norwegian University of Science and Technology, 6025 Aalesund, Norway
J. Mar. Sci. Eng. 2022, 10(5), 705; https://0-doi-org.brum.beds.ac.uk/10.3390/jmse10050705
Submission received: 1 April 2022
/
Revised: 12 May 2022
/
Accepted: 17 May 2022
/
Published: 21 May 2022
(This article belongs to the Special Issue Explainable AI and Evaluation of Algorithms for Autonomous Marine Vehicles)
Abstract
:Autonomous surface vehicles need to be at least as safe as conventional vessels, if not safer, when navigating on waters. With a great deal of navigation algorithms for surface vessels out there, the safety of their produced paths is questionable, and, in most cases, complicated to assess and compare. Hence, this paper proposes a method for extended collision risk assessment for paths generated by autonomous navigation algorithms as follows: (1) static, dynamic, and historic risk factors are calculated; (2) individual risk value is determined using a fuzzy inference system; (3) the extended collision risk assessment (ECRA) score is acquired using a root-mean-square method. Finally, a comparison of the ECRA score of each path determines the path with the lowest risk. The validation results show that the proposed method is able to detect lower/higher risk scenarios and assign an adequate risk value in most cases. Risk reduction for cautious paths varies up to 8.43%, while risk increases for incautious paths—up to 57.98%. The results indicate that the method could be used for navigation algorithm evaluation and comparison with some improvements. This research also reveals several promising future directions and applications of the method.
1. Introduction
In the shipping sector, a great emphasis has recently been placed on the green shift. Two main focus areas for driving this change are energy-efficient shipping and alternative energy (fuels). While the latter is a whole different field, the former can be improved by optimising various factors in both ships’ electronics and mechanics (hardware part), and by efficient path planning (software part). Introducing autonomy in shipping goes along well with efficient path planning and optimisation of the navigation. Furthermore, the importance of safety and risk assessment in shipping has been confirmed by the Norwegian Maritime Authority, who has set safety culture and risk understanding as their main focus in 2022 [1]:
“We often see that either a risk assessment of the operations on board is missing, or the risk assessments that have been done are inadequate.”
While a number of navigation algorithms for autonomous surface vehicles (ASVs) and unmanned surface vehicles (USVs) exists, each one of them has its own advantages and drawbacks. A previous study by the author [2] endeavoured to compare several path planning and collision avoidance algorithms of ASVs. The review leads to a conclusion that there is a vast number of developed algorithms out there and, currently, no unified way of comparing them. To tackle this issue, an evaluation simulator platform (ESP) for comparing paths generated by path planning and collision avoidance algorithms for autonomous surface vehicles was proposed by the authors in Vagale et al. [3]. ESP suggests finding an algorithm performance evaluation (APE) score for paths based on three aspects: (i) efficiency, (ii) safety, and (iii) good seamanship practice. In this article, the author assumes that the evaluation of paths generated by these algorithms in different scenarios presents an opportunity to compare and improve the understanding of these navigation algorithms. The benefit of using simulation-based testing is that it provides a way to test a vast number of different navigation scenarios under varying and realistic conditions in a safe and cost/time efficient manner.
When evaluating the safety of the vessel traversing a pre-planned path on the water, collision risk assessment (CRA) plays an important role. Although several methods to evaluate collision risk for ASV and USV exist, most of them are incorporated as a part of a collision avoidance or path planning algorithm that seeks a safe path or trajectory. To date, the author has not found an existing tool that evaluates and compares paths generated by different navigation algorithms from the safety perspective using these CRA methods.
The focus of this article is on establishment and implementation of the safety assessment component of the ESP prototype. Several various risk and safety components are combined into an extended collision risk assessment (ECRA) method. A fuzzy inference system (FIS) based on an expert rule base is used for combining (i) static, (ii) dynamic, and (iii) historic risk factors into the individual risk value for each timestep along the vessel’s path. Afterwards, a root-mean-square function calculates the total ECRA score for the whole path. The obtained ECRA score for different paths allows comparing performance of different navigation algorithms. The fuzzy system benefits from incorporating nautical expert domain knowledge linguistically for an improved and more complete view on the risk assessment issue. Here, static risk factor estimates the danger level in terms of grounding/stranding of the vessel. Dynamic risk factor is the result of collision risk index (CRI) calculation. Finally, historic risk factor is derived from the near-miss collision detection from the historic automatic identification system (AIS) data. Some applications for this type of evaluation are in:
- verification/benchmarking of existing path planning algorithms,
- automatic evaluation of paths (instead of manual evaluation),
- algorithm development with improved safety considerations.
1.1. Contributions
This article focuses on implementing the “safety and risk assessment” component of the ESP when comparing paths from autonomous navigation algorithms, as presented in the previous paper by the author [3]. In this paper, CRI is used in combination with other risk assessment methods to evaluate paths generated by different autonomous navigation algorithms in order to determine the safest and the most efficient path in different scenarios. The novelty of this research is:
- Application—the use of risk measures in a simulator for evaluating path planning or collision avoidance algorithms for autonomous vessels.
- Extended collision risk calculation method—the method of combining different risk measures to obtain a total risk assessment of the path.
- Incorporating expert knowledge—the rule base of the fuzzy inference system is based on the knowledge of a group of nautical experts.
A risk assessment method proposed in this article in future could be implemented in the maritime training simulators for autonomous navigation algorithm testing as proposed in Vagale et al. [4].
1.2. Organization
The remainder of this article is organised as follows: Section 2 lays out previous research in the field. Section 3 proposes a method for extended collision risk score and individual risk value calculation. Implementation of the method is described in Section 4, including architecture of the developed simulation framework, AIS data processing, and using fuzzy inference system for combining risk factors. Simulation setups and results of the validation are laid out in Section 5. Finally, Section 6 presents a discussion, whilst some concluding remarks are drawn in Section 7.
2. Related Work
An ever-increasing body of literature shows that developing a trustworthy collision risk assessment method is a vital part of advancement in the autonomous shipping technology field. Previous literature reviews by Ozturk and Cicek [5] and Čorić et al. [6] provide a fine overview of the latest developments in the ship collision risk assessment methods. Both quantitative and qualitative methods are used for collision risk assessment. Some studies applying quantitative methods for risk assessment are [7,8,9]. Furthermore, Goerlandt and Montewka [10] address the fact that most of the risk assessment approaches are strongly tied to probabilities, although alternative methods also exist. Qualitative methods, including expert knowledge, although possibly more subjective, provide a different view on the risk assessment.
Several studies have combined various risk and safety components to obtain a more complete view on navigation system performance evaluation. The approach proposed in the current article follows a similar idea. One such approach by Stankiewicz and Mullins [11] evaluates the overall performance of the autonomous ship by combining different sub-scores and assessing mission accomplishment, safety and International Regulations for Preventing Collisions at Sea (COLREGs) compliance. These sub-scores are combined into the final score using a weighted sum method. Similarly, Gug et al. [12] propose a quantitative collision risk analysis that is based on several factors, such as ship–ship collision risk, ship–structure collision risk and grounding risk (from bathymetry data). Finally, Yu et al. [8] use a rule-based Bayesian reasoning to assess the geometrical collision risk between the offshore installations and passing ships. The risk factors assessed and combined within this method are (i) navigational conditions (ship speed, passing distance, relative bearing, ship type) and (ii) natural environment (sea state, wind, visibility, and day/night time).
Although the range of various methods in this field is vast, the following sections review in detail the collision risk index measure and relative ship motion parameters it might include, fuzzy methods for risk assessment and historic near-miss collision detection.
2.1. Collision Risk Index
According to Zhou et al. [13], “CRI is a commonly used parameter in the research on collision avoidance and decision support of ships, which can reflect the degree of collision risk quantitatively.” In this article, the author considers CRI to be a degree of collision risk for a ship–ship pair that is based on relative motion parameters between these ships.
The recent state-of-the-art of existing CRI calculation methods is outlined in detail in Huang et al. [14]. Two commonly used types of quantitative CRI are the ship domain and closest point of approach (CPA) methods [15]. In contrast, Gang et al. [16] mention three main types of CRI methods: (i) based on CPA, (ii) fuzzy evaluation, (iii) artificial neural networks, additionally to other new methods. This shows that there is no unity concerning whether relative motion parameters should be included in the CRI calculation and how to combine them together.
The CRI concept was first proposed by Kearon [17], where it is calculated purely based on the two CPA parameters. CRI has been a vital part of the collision risk assessment since then. The literature review reveals that even the latest methods are partially based on the CPA parameters [18,19]. However, “such approaches only provide one-dimensional information on the traffic situation” [20]. For this reason, in most cases, they have been complemented and combined with additional motion parameters. The hybrid methods combining both CPA and ship domain are given in Zhou et al. [13], Ha et al. [15], Lisowski [21], Namgung and Kim [22]. Other less frequently used parameters include distance between vessels, ratio of speeds, relative bearing, ship length, visibility sea state, encounter type, heading [5,14], security vector [23], and others.
2.2. Fuzzy Methods for Risk Assessment
In the field of marine navigation, incorporating experts’ knowledge in the ship decision support systems (DSS) and collision risk assessment systems is of high importance in developing a reliable system. Using a fuzzy inference system for CRA provides a solution for this issue.
A fuzzy approach defining the individual ship risk index is proposed in Balmat et al. [24]. Using this approach, researchers have been able to combine static (ships’ characteristics) and dynamic risk factors (the weather conditions). On the other hand, later literature shows that researchers have been focusing on including the closest point of the approach method, both in terms of distance and time, as a fuzzy system input to assess the collision risk. One of such studies is provided by Ren et al. [25], who utilised time to CPA (TCPA) and distance to CPA (DCPA) parameters in combination with encounter angle for the dynamic risk assessment. Similarly, Ahn et al. [26] also combine TCPA and DCPA parameters using a FIS to model the degree of collision risk. In this approach, membership functions are first defined based on simulation results and are later tuned using the neural network ANFIS (adaptive network-based FIS) approach. Likewise, Bukhari et al. [27] propose using FIS in a vehicle traffic service (VTC) centre to assess the degree of collision risk in real time among multiple vessels in the vicinity. The proposed method fuses such navigational parameters as TCPA, DCPA, ship’s bearing and variance of compass degree (VCD) calculated from the conventional VTS equipment. Finally, an extensive risk informed ship collision alert system has been introduced by Goerlandt et al. [28]. In the approach, a zero-order Sugeno-type fuzzy inference system combines not only the typical CPA values but also numerous other navigation parameters, such as bow cross range (BCR), speed difference, distance between vessels, relative bearing and heading.
2.3. Near-Miss Collision Detection
Near-miss collision (NMC) also called near collision, is a type of unplanned vessel interaction that has a potential to lead to a collision between vessels. In reality, this means that vessels passed each other at a close distance, but no collision occurred [22]. Detection of these high density NMC zones in waters based on historic traffic data (AIS) could give more information of potentially dangerous/more risky areas that ships should avoid, mainly, because these situations are rarely or never documented.
The most commonly used type of NMC detection examines if the ships’ safety domains overlap each other [29]. In such cases, the shape of the ship domain can vary from quite simple to more complex structures among different methods. For example, authors in Namgung and Kim [22] use elliptical shape ship domain with two different radii based on the vessel’s length and the ship’s velocity. Another work, by Mestl et al. [30], emphasises the interest in the rate-of-turn (ROT) of the vessel in the AIS data and suggests combining it with speed over ground (SOG) to find occurrences of non-normal manoeuvres. Research by Grossmann [31], in turn, combines the above-mentioned ship domain and rate-of-turn in a new approach to detect NMC. In a different approach, Zhang et al. [32] propose introducing a vessel conflict ranking operator (VCRO) that includes distance between ships, relative speed and difference between the headings of the two ships. It is important to note that the main motivator of this research is the enormous volume of AIS data and an attempt to reduce the number of possible near-miss collision cases needing further investigation by experts. A review of other quantitative ship collision frequency estimation methods is given in [6].
The following section proposes a method for assessing the extended collision risk on the autonomous ships’ path that includes calculating (i) ship-static structure collision risk, (ii) ship–ship collision risk (including CRI) and (iii) risk connected with higher risk (based on near-miss collisions) traffic areas from the historic AIS data.
3. Extended Collision Risk Assessment
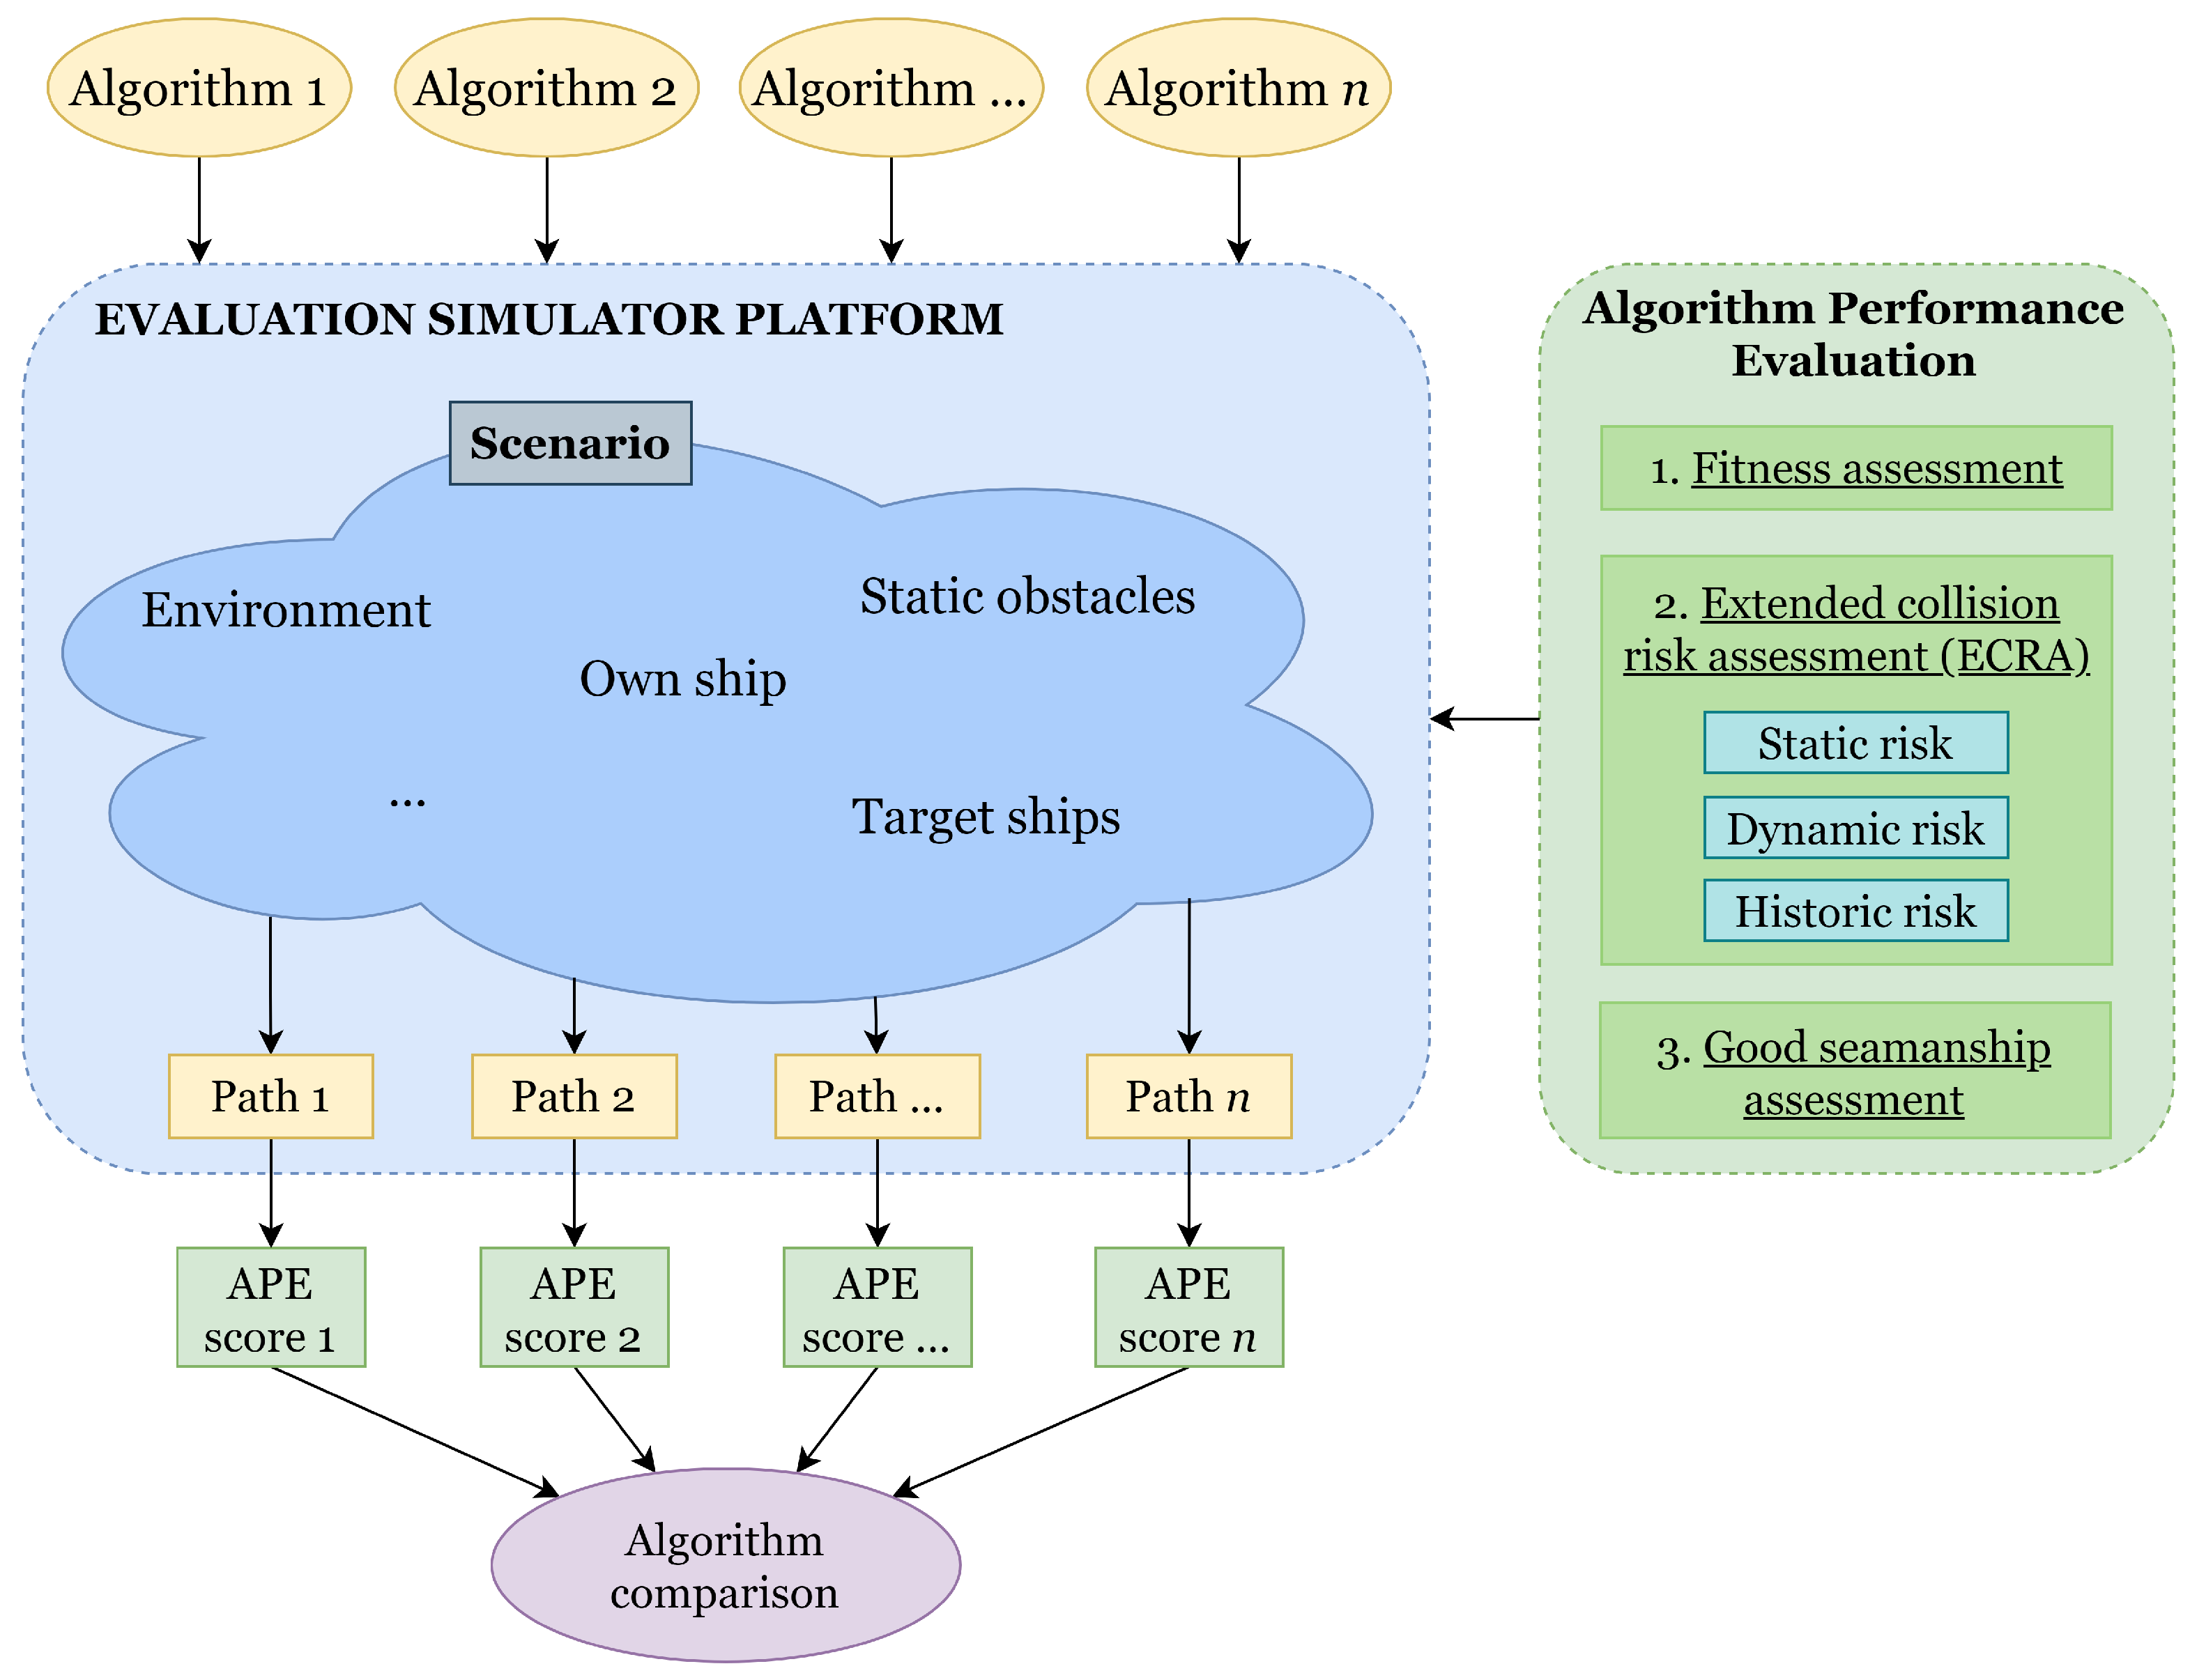
The proposed algorithm performance evaluation (APE) comprises three main factors: (1) fitness assessment, (2) extended collision risk assessment (ECRA) and (3) good seamanship practice assessment. The result of this evaluation is the APE score (more on that in Section 4). Fitness, in this context, considers the efficiency of the path that the algorithm has generated. Efficiency can be viewed from different perspectives, such as path length, travel time, fuel consumption, costs. As for the ECRA, here, the author looks at risk of collision at all points of the traversed path. Good seamanship practice, in turn, should consider evaluation of whether navigating the generated path would correspond to behaviour expected from an average officer on waters.
The focus of this article and section is narrowed down to implementing solely the second measure—calculating ECRA score to evaluate safety and assess collision risk of the planned path. The implementation of the first and third factors and combining them is left for future work.
3.1. ECRA Score
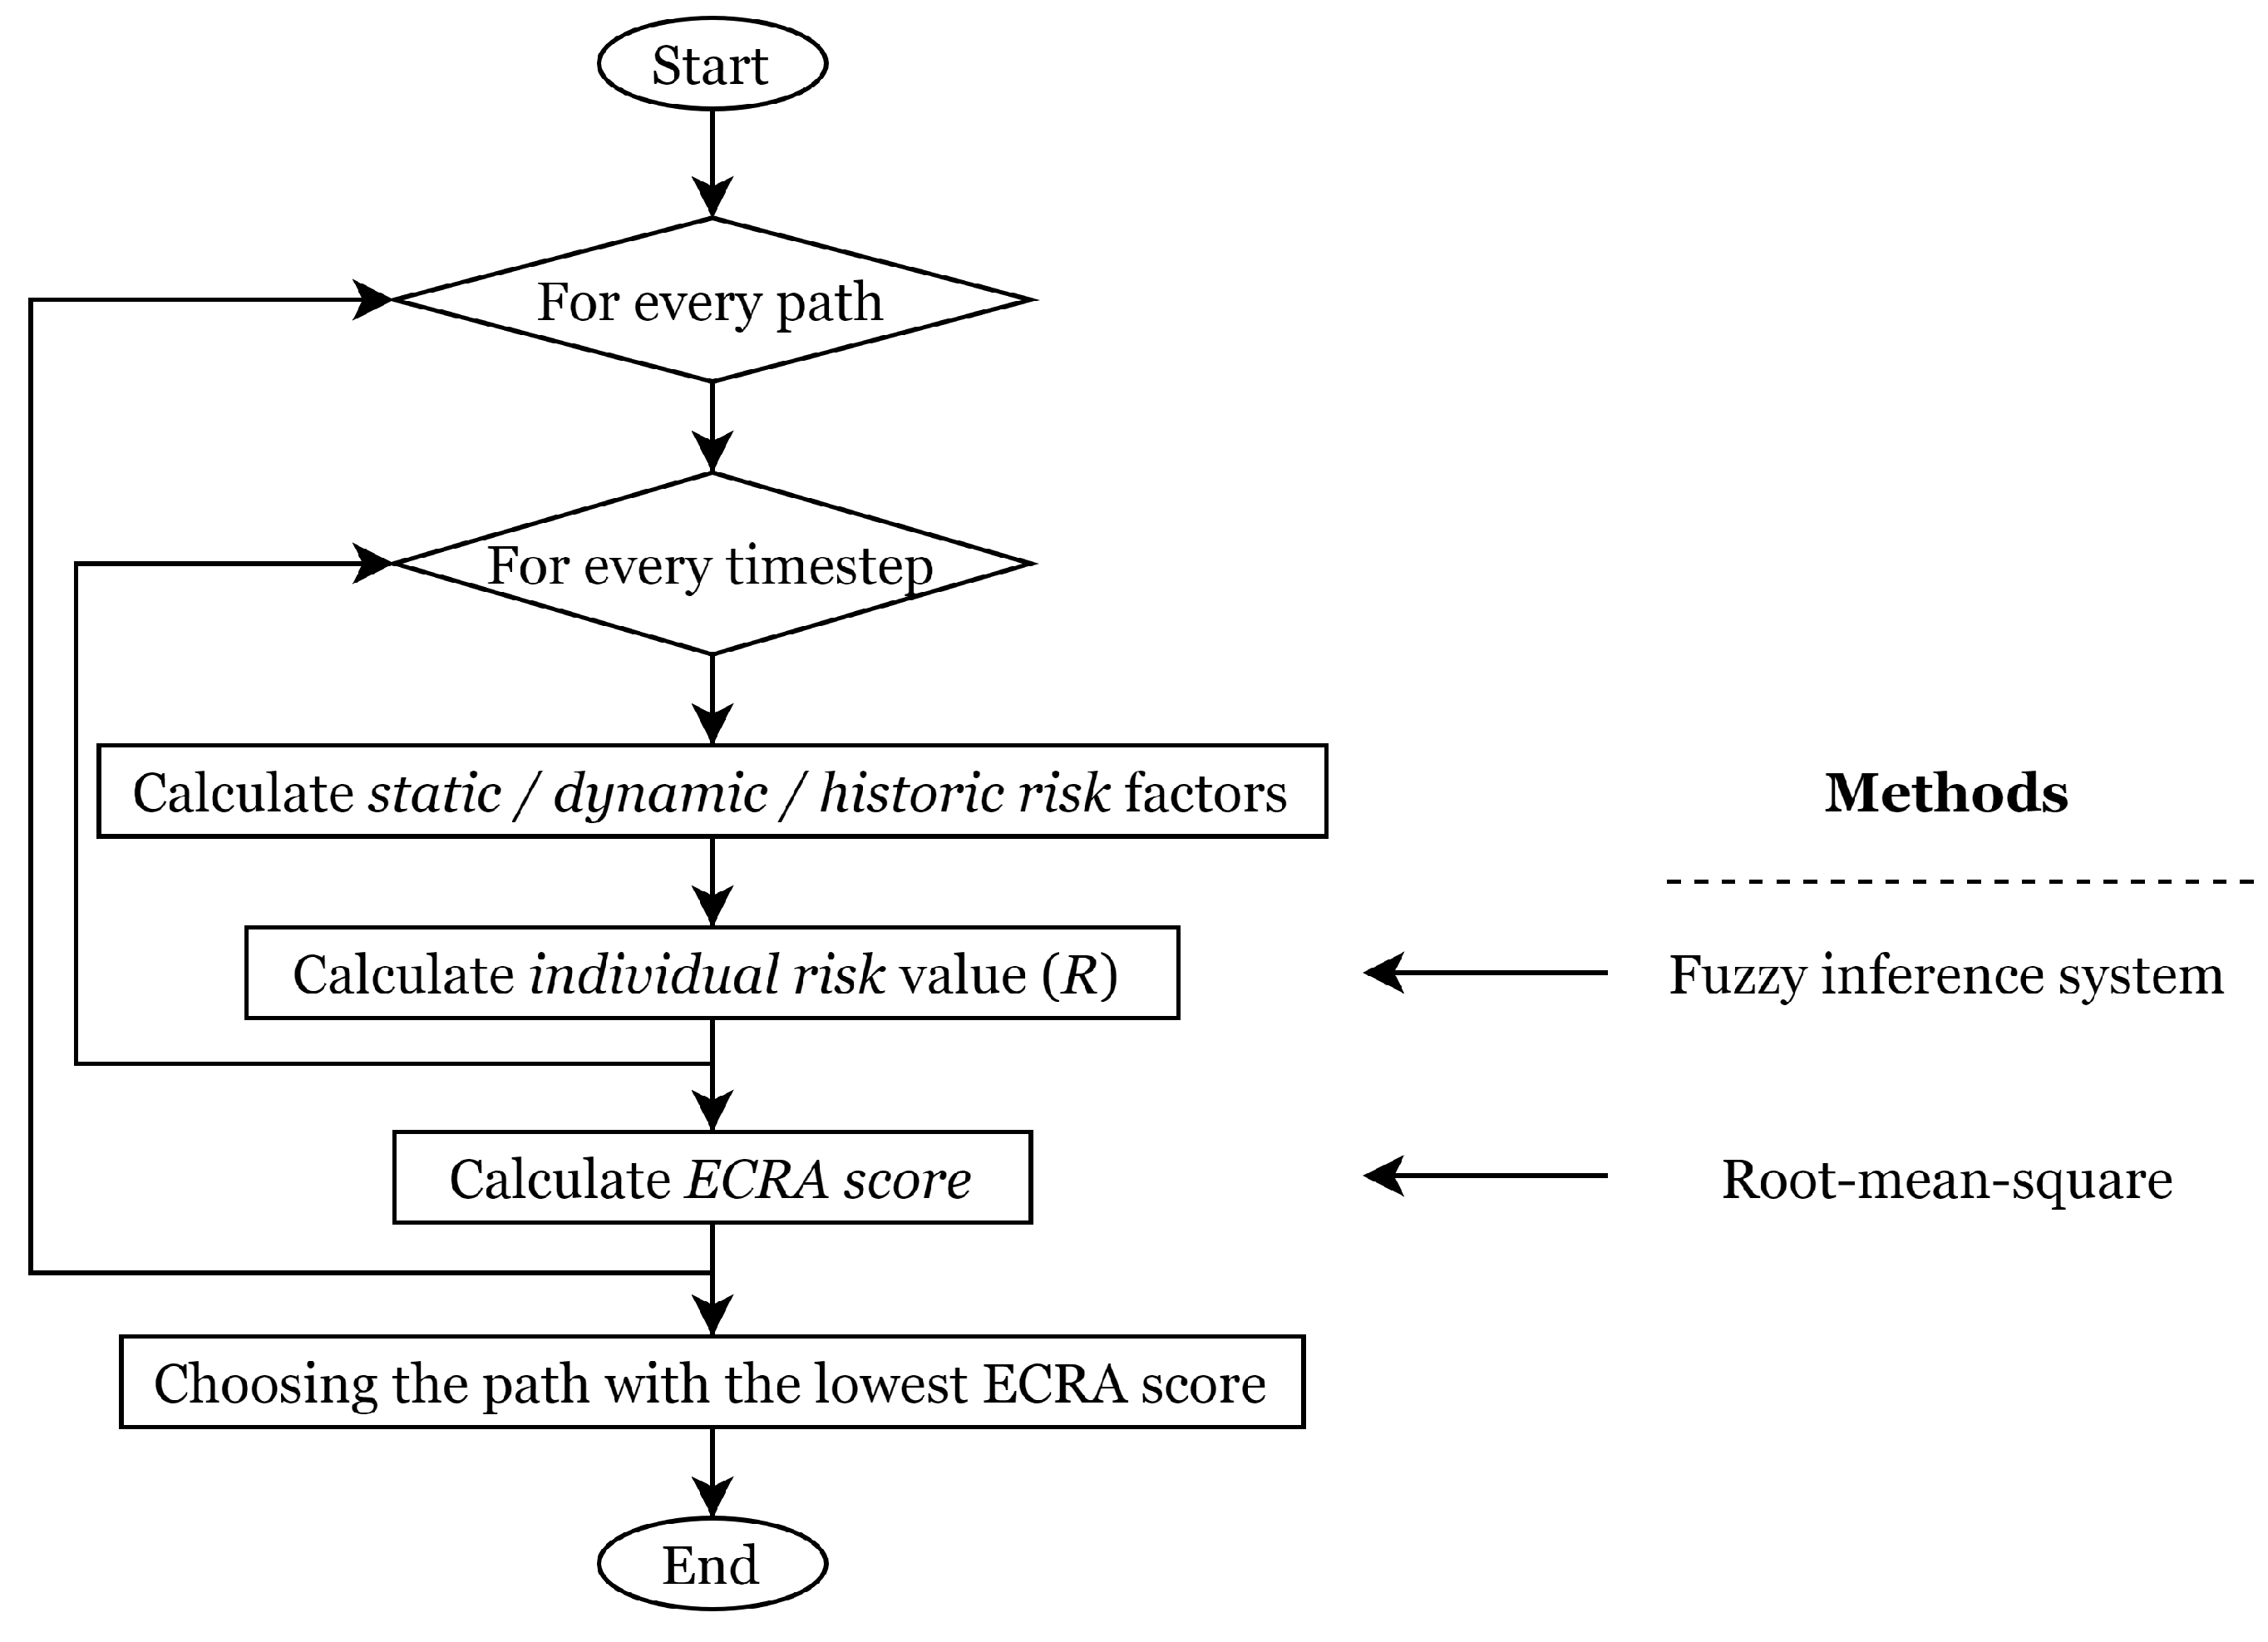
ECRA score (see Equation (1) for a path is obtained by applying root-mean-square (RMS) on all the individual risk values () along the traversed path ():
The individual risk value for each timestep i (see Equation (2) is composed of three components combined using the fuzzy inference system:
- static risk;
- dynamic risk;
- historic risk.
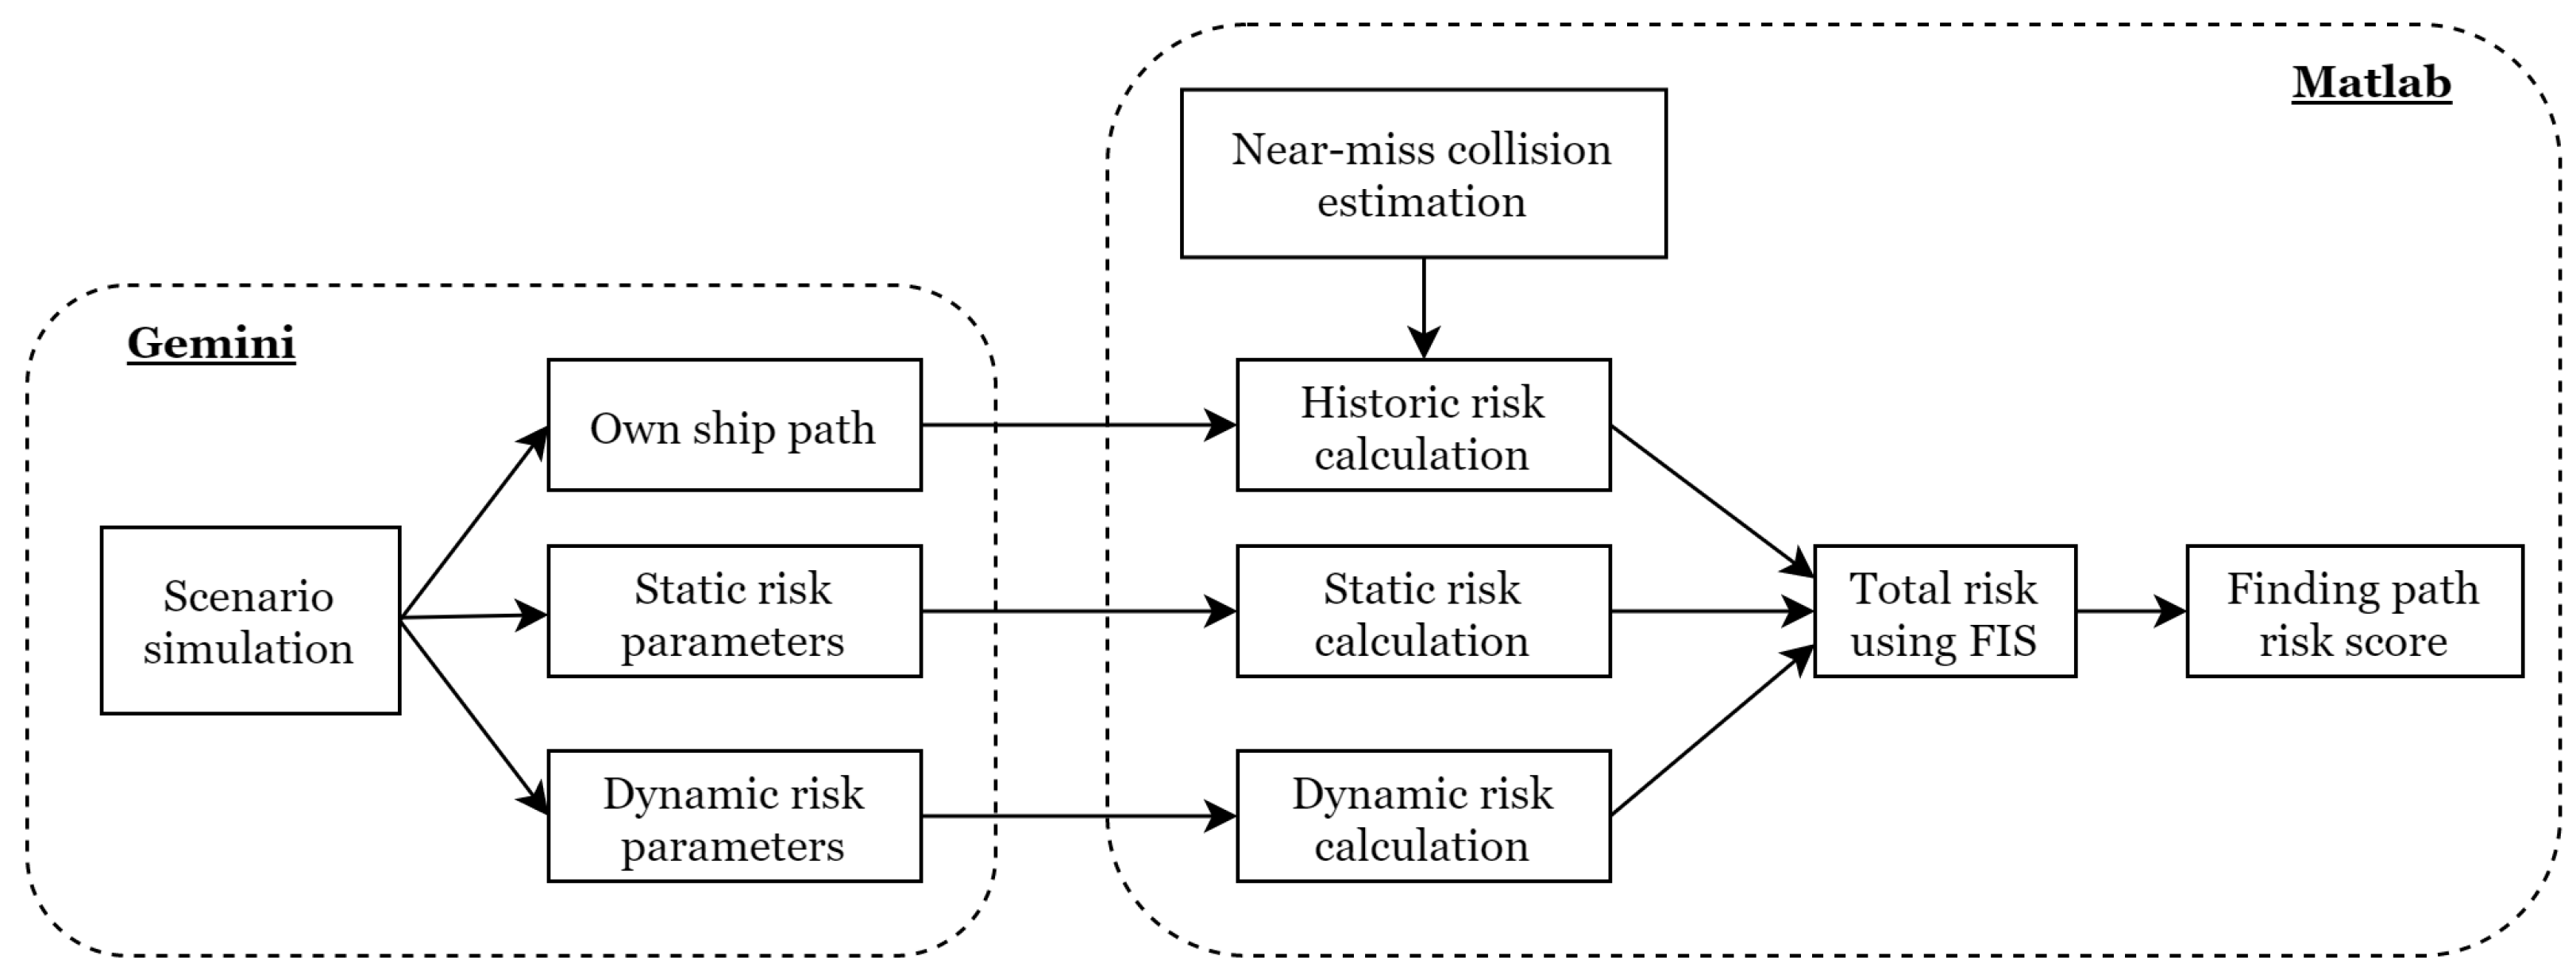
This is repeated for every path in the ESP scenario. See a flowchart of this process in Figure 1.
The architecture of FIS and its membership functions are described in detail in Section 4. It is anticipated that more dangerous (incautious) paths (closer to the land/static structures/target ships, and last-minute collision avoidance) will have higher ECRA scores. In later stages, it could also be possible to add other components, such as the environmental risk factor that represents risk based on the real-time or historic weather data, or COLREGs compliance evaluation scores as proposed in Hagen et al. [33].
The following section lays out detailed methodology on how the three risk factors are obtained.
3.2. Static Risk Factor
In this article, the static risk (SR) factor represents the risk of a vessel stranding or grounding in regard to other static objects/structures in its vicinity. These objects may include a landmass, islands, bridges, lighthouses, and other offshore structures in the water. Usually, data about these objects is available in the electronic navigational charts (ENCs) and they could be detected using the situational awareness sensors installed on the surface vessel.
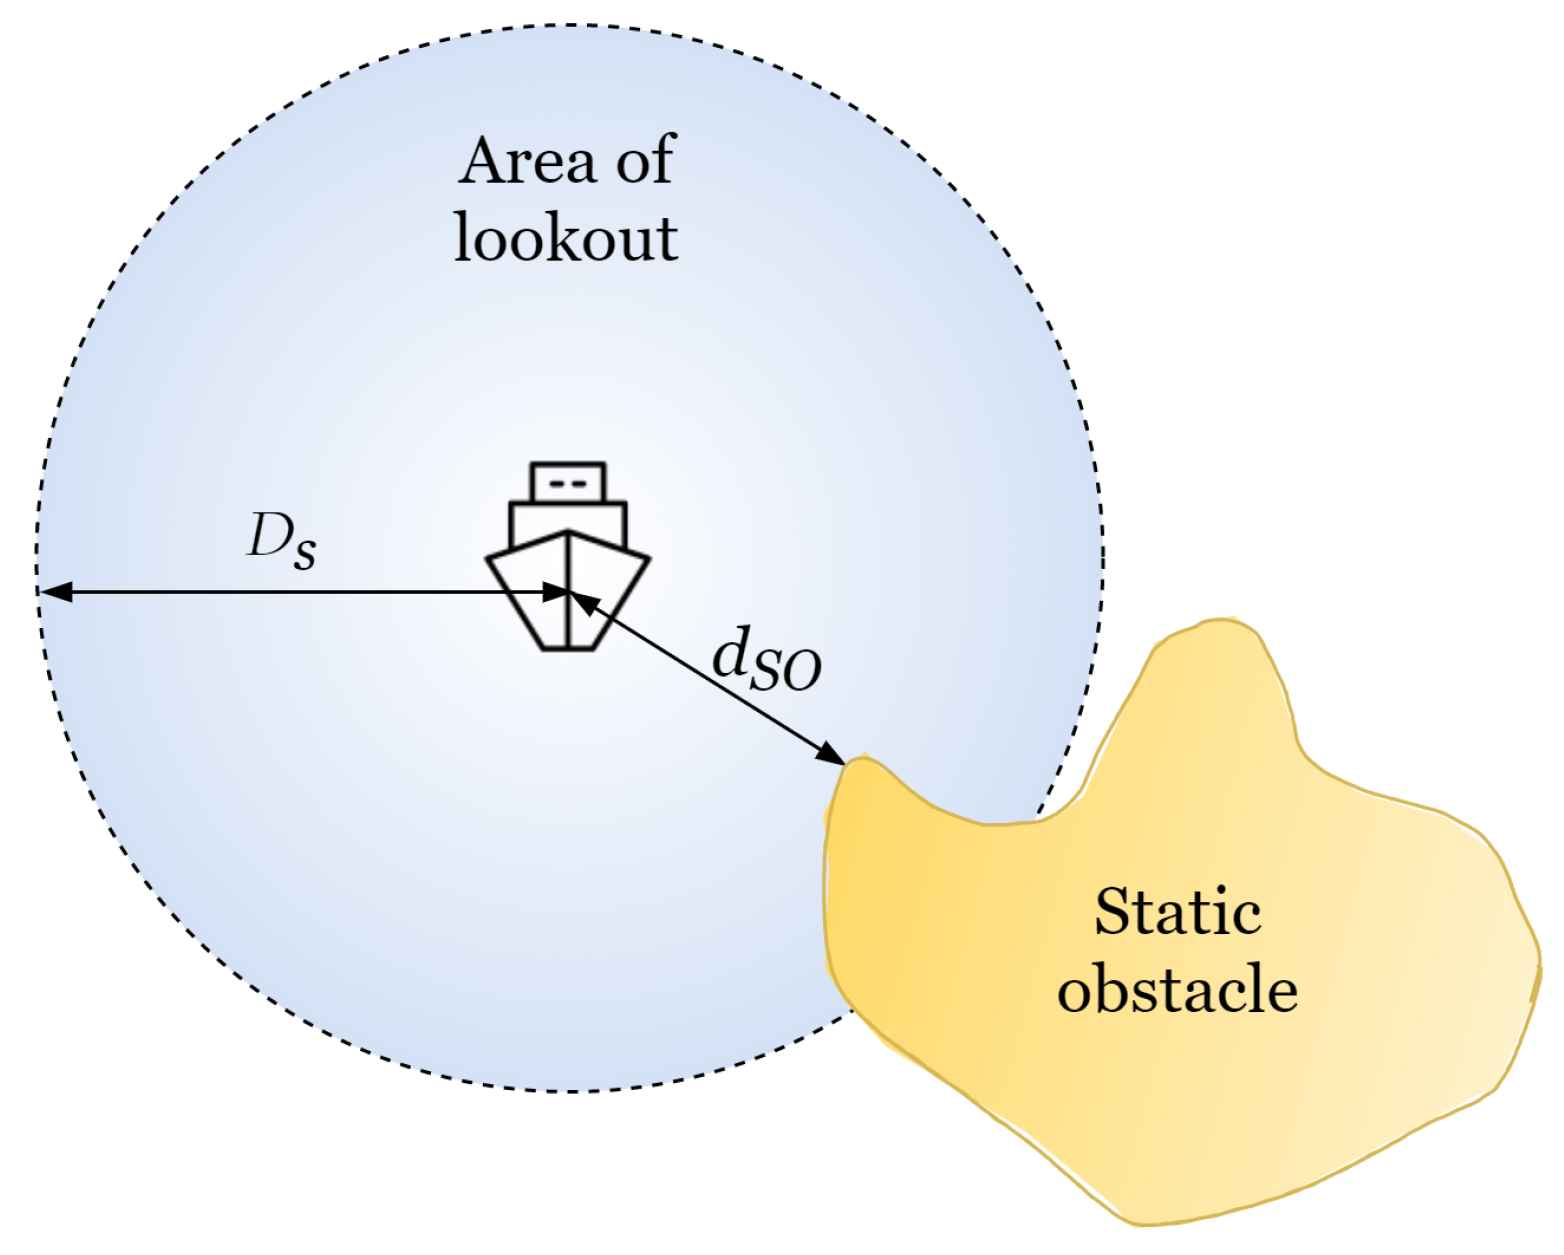
The static risk measure calculated in the simulator is based on the relative distance () from the own ship (OS) to the closest static obstacle, in this case, a landmass. This parameter is extracted from the simulator at every timestep along the vessel’s path. In order to emphasise the higher risk areas that are close to static obstacles, an exponential function is applied to this parameter to acquire a more comprehensive static risk measure. However, landmasses that are too far from the own ship are of no interest. Therefore, the area of lookout is introduced around the own vessel. For a visual representation of the above-mentioned static measures in relation to the own vessel, see Figure 2. This defines the area in which a non-zero static risk is calculated. The radius of the area of lookout () depends on the length of the vessel (l). Static risk within this area is calculated using the following equation:
Here, the distance constant value is: . Values of the static risk outside this area equal zero. The own vessel with the area of lookout around it and the relative distance to the nearest static obstacle are represented in Figure 2.
3.3. Dynamic Risk Factor
The dynamic risk (DR) factor, in this paper, is considered a geometrical collision risk associated with interactions between the own vessel and other dynamic obstacles, such as target ships (TS) in the vicinity. In autonomous navigation systems, the collision risk index is often used as the sole collision risk evaluation measure. However, in this paper, CRI is considered as the dynamic risk factor—a component of a larger ECRA score:
To ensure that only the target vessels in close vicinity are considered potentially risky, an area of lookout is introduced here as a threshold () value.
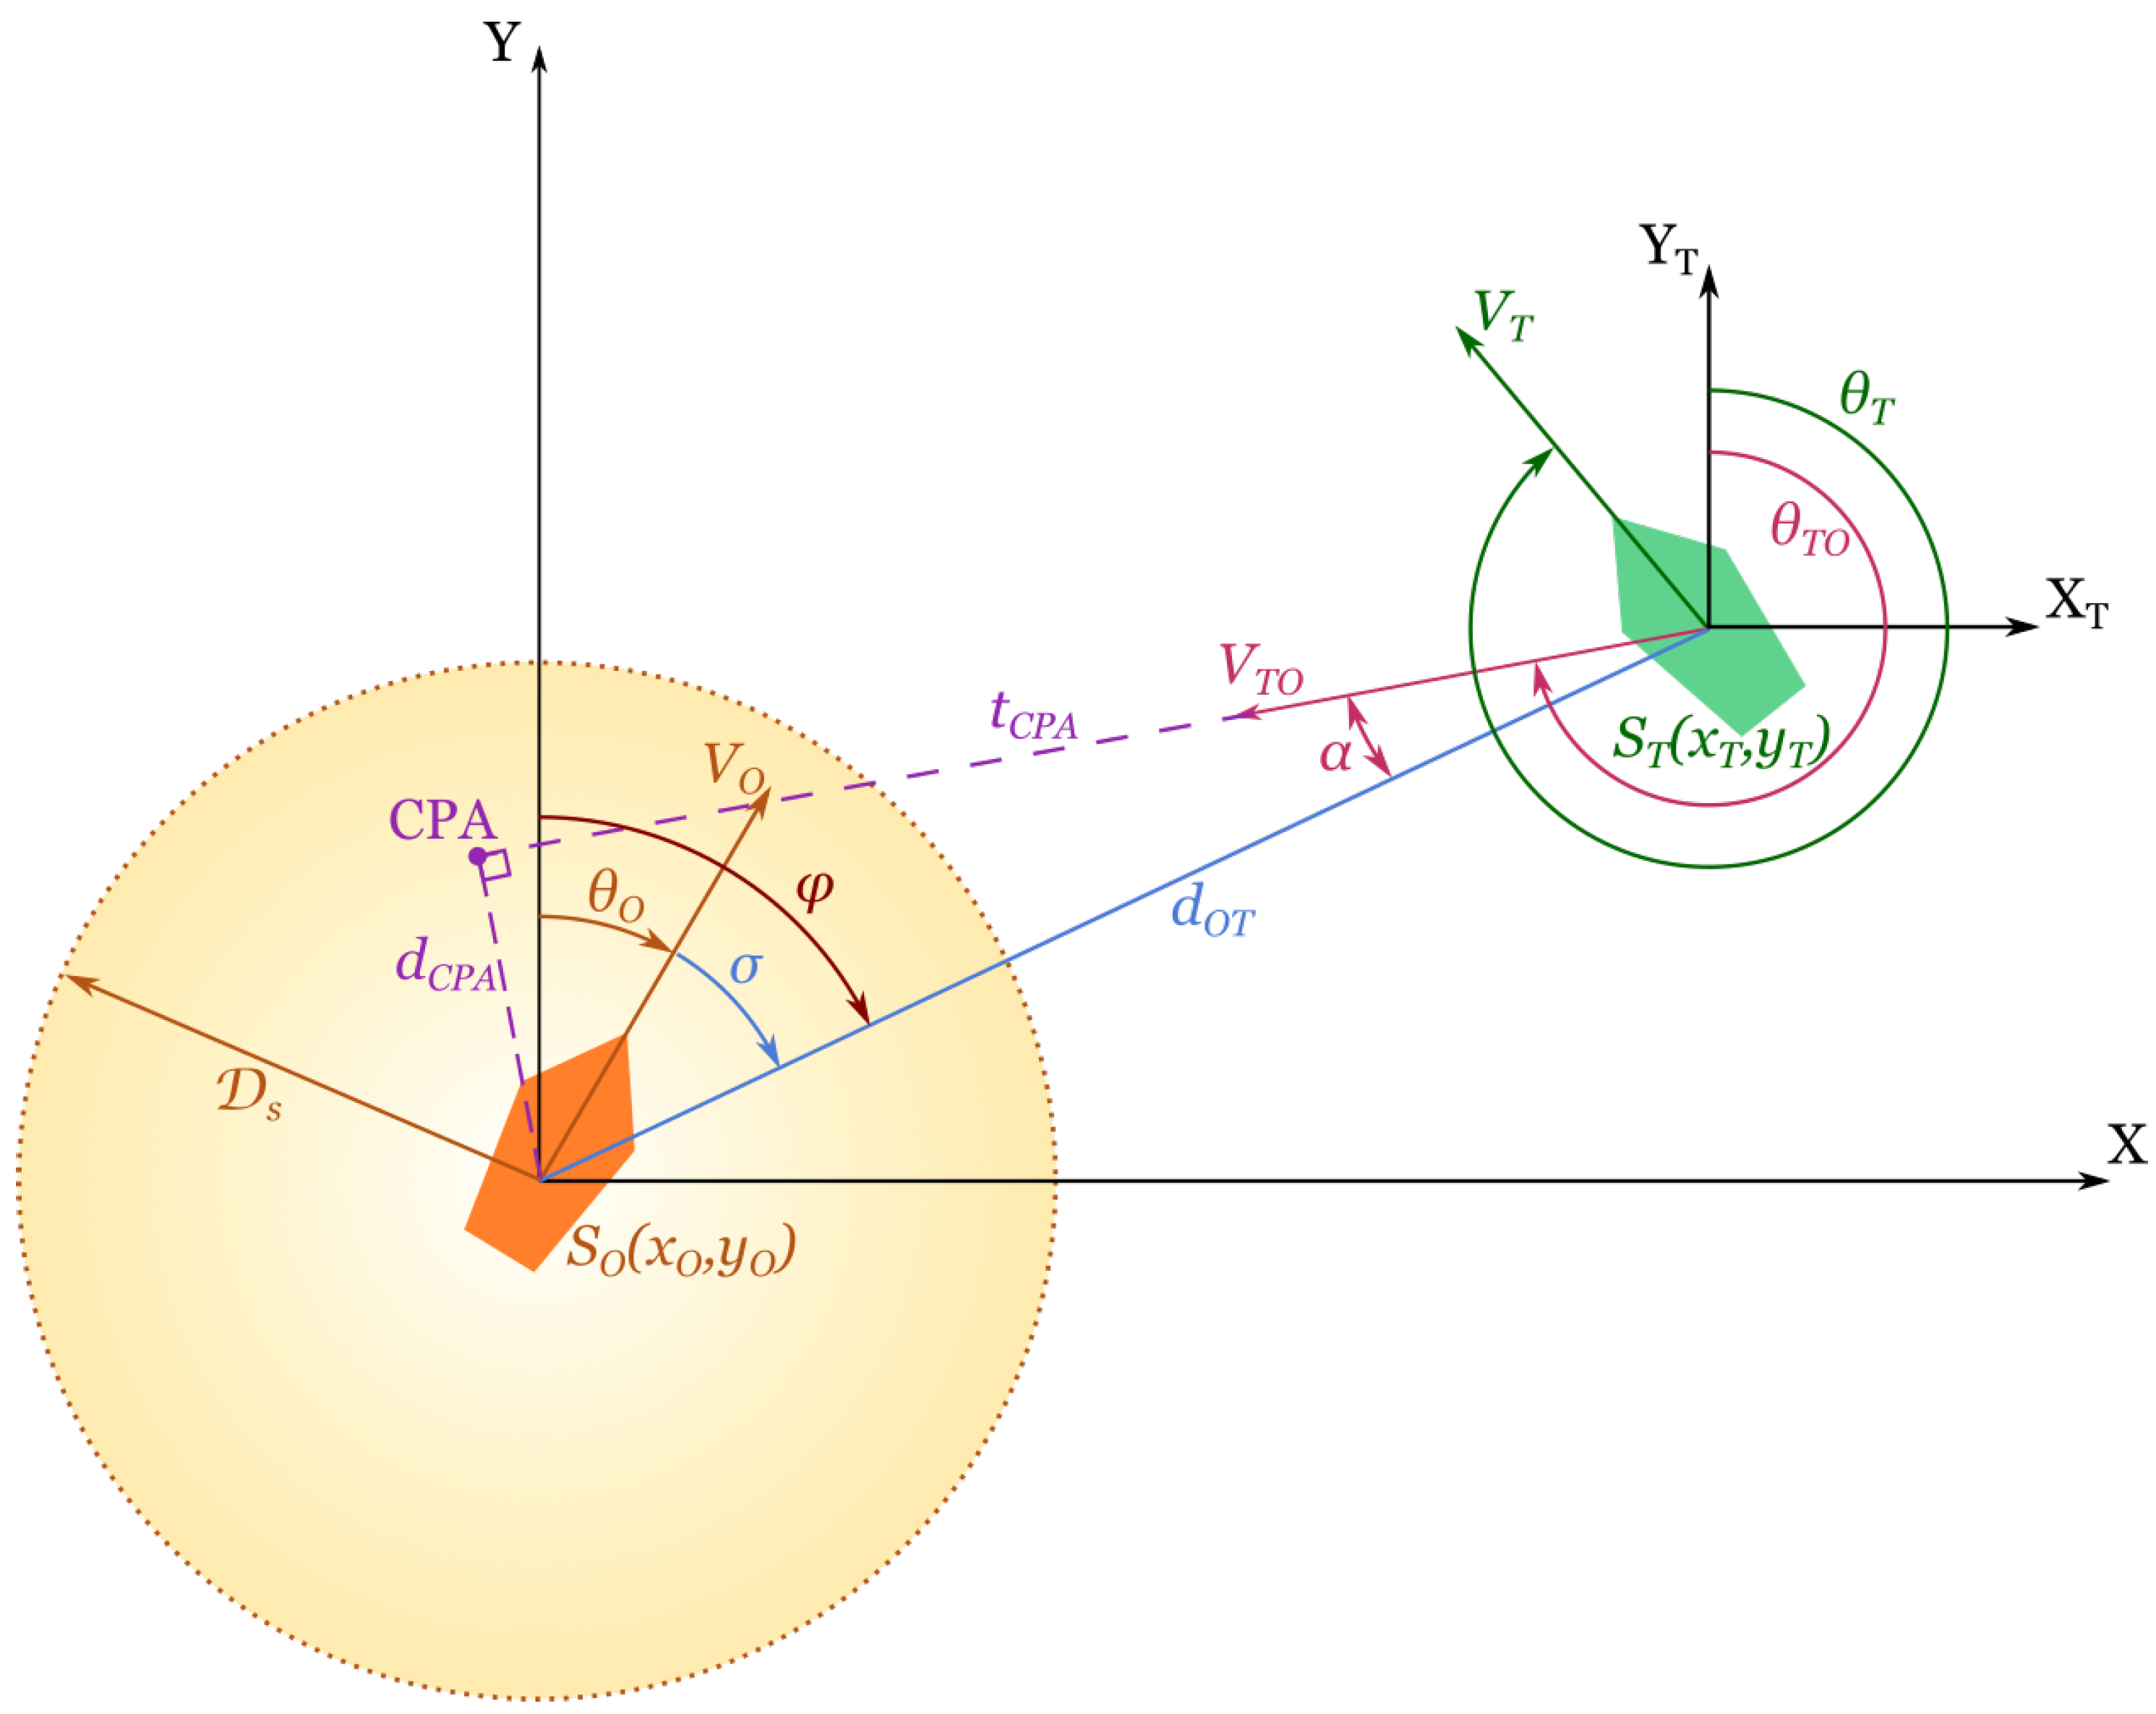
As covered in Section 2, several CRI evaluation methods exist. The author implemented three such CRI methods based on the closest point of approach, by Kearon [17], Lisowski [21] and Mou et al. [19]. In order to calculate the CRI values, several geometric relation and motion parameters of a ship–ship pair interaction have to be extracted (see Figure 3).
These parameters, calculated at every timestep for a ship–ship pair, are:
- , relative distance between the two encountered ships;
- , relative bearing;
- , distance to the closest point of approach;
- , time to the closest point of approach.
Distance and time to the closest point of approach (DCPA and TCPA, respectively) are two parameters that are often used as part of the CRI calculation, and are necessary for the calculation of the CRI values in this paper. and components are calculated using the following equations:
where are target ship coordinates, are own ship coordinates, denotes relative heading and denotes the azimuth of the target vessel. Additionally, spatial () and temporal () safety domains for dynamic interactions are introduced around the own vessel and are used for the CRI calculation. To sum up, the dynamic risk calculation includes the following components—.
When these parameters are acquired, it is possible to calculate the CRI measures. First, the Kearon [17] CRI evaluation model uses a polynomial equation to combine the and measures:
The resulting value is a non-normalised risk, so before using this CRI value in the FIS, it has to be normalised. In this equation, a and b are weights that are adjusted based on the relative bearing values as shown in Table 1. The determining factor in this case is whether the TS is approaching from the starboard or the port side.
The second model used is proposed by Lisowski [21], as shown in Equation (9). This method calculates a square root of a weighted sum of several interaction parameters, including distance and time to the CPA, and relative distance between two ships:
In this equation, weights , and are coefficients dependent on the state of visibility, ship length and type of water area [21]. Before using this CRI value in the FIS, it has to be normalised.
The third CRI calculation method is based on the study of Mou et al. [19], which expresses collision risk using an exponential function:
where is a coefficient that represents the relative heading angle between the two encountered ships. For head-on scenarios , for the crossing situation, it is 8.5 and for overtaking 2.34 [15]. Before using this CRI value in the FIS, it has to be normalised.
3.4. Historic Risk Factor
Historic risk (HR) factor is the third risk evaluation measure. This component is based on the historic navigation patterns in the area of interest (obtained from the historic automatic identification system (AIS) data), with a focus on finding the possible near-miss collisions between vessels. As the near-miss collisions have rarely (or not at all) been documented, the approach used in this paper finds the theoretical NMC points based on the intrusion of a ship’s domain. For this purpose, historic AIS data for the area of interest are used to detect potentially dangerous (high risk) locations on a map in waterways. In this article, the historic NMC map is used to detect how far from these NMC points the planned path is located.
There are several ways to estimate near-miss collisions between two encountering vessels. In this paper, the author focuses on NMC estimation based solely on the safety domain intrusion/overlapping, similar to Grossmann [31]. Here, several shapes of ship domain could be used. A review of different ship domains is given in Szlapczynski and Szlapczynska [35]. For the sake of simplicity, a circular safety domain is used in this research, with radius depending on the ship length (obtained from the AIS data): . The steps of finding NMC points are:
- safety domain overlap investigation at each timestep using equirectangular projection distance between vessels;
- midpoint calculation for each overlap case (to find the collision point).
First, the safety domain overlap is investigated by calculating the distance between the two geographical coordinates and , where represents latitude and is longitude of vessels’ locations, using equirectangular projection based on Pythagoras’ theorem. Although the Haversine formula would give better precision when calculating the great-circle distance d between two points, it is computationally more expensive than the equirectangular approximation. Therefore, in this case, when distances between the NMC vessels are relatively small, the author prefers using the latter method to speed up the calculation time.
In situations where safety domain intrusion is detected, the historic NMC point is calculated as the midpoint between the two vessels. The output of the AIS data processing is a list containing the NMC points.
To find the historic risk along the path, the previously obtained list of the NMC points in the area is used. At each timestep of the path, the distance from the vessel to the closest NMC point from the list is calculated. If this point is within a pre-defined threshold range from the vessel, then the historic collision risk is calculated linearly to gain the historic risk value in range , where the lower value represents lower risk:
Implementation of the methodology proposed in this section and other practical aspects are described in the following section.
4. Implementation of Evaluation Simulator Platform
A concept of an evaluation simulator platform (see Figure 4) for simulation-based testing of autonomous navigation algorithms has been proposed previously in Vagale et al. [3].
As mentioned earlier, the focus of this paper is on the implementation of the ECRA component and three historic risk factors it contains. To verify that the proposed ECRA method could be used for autonomous ship algorithm performance evaluation, the method was practically implemented and tested on a few test cases.
The following sections discuss important aspects of the implementation, such as architecture of the developed simulation environment, AIS data and its preprocessing, and implementation of the fuzzy inference system in Matlab.
4.1. Simulation Environment
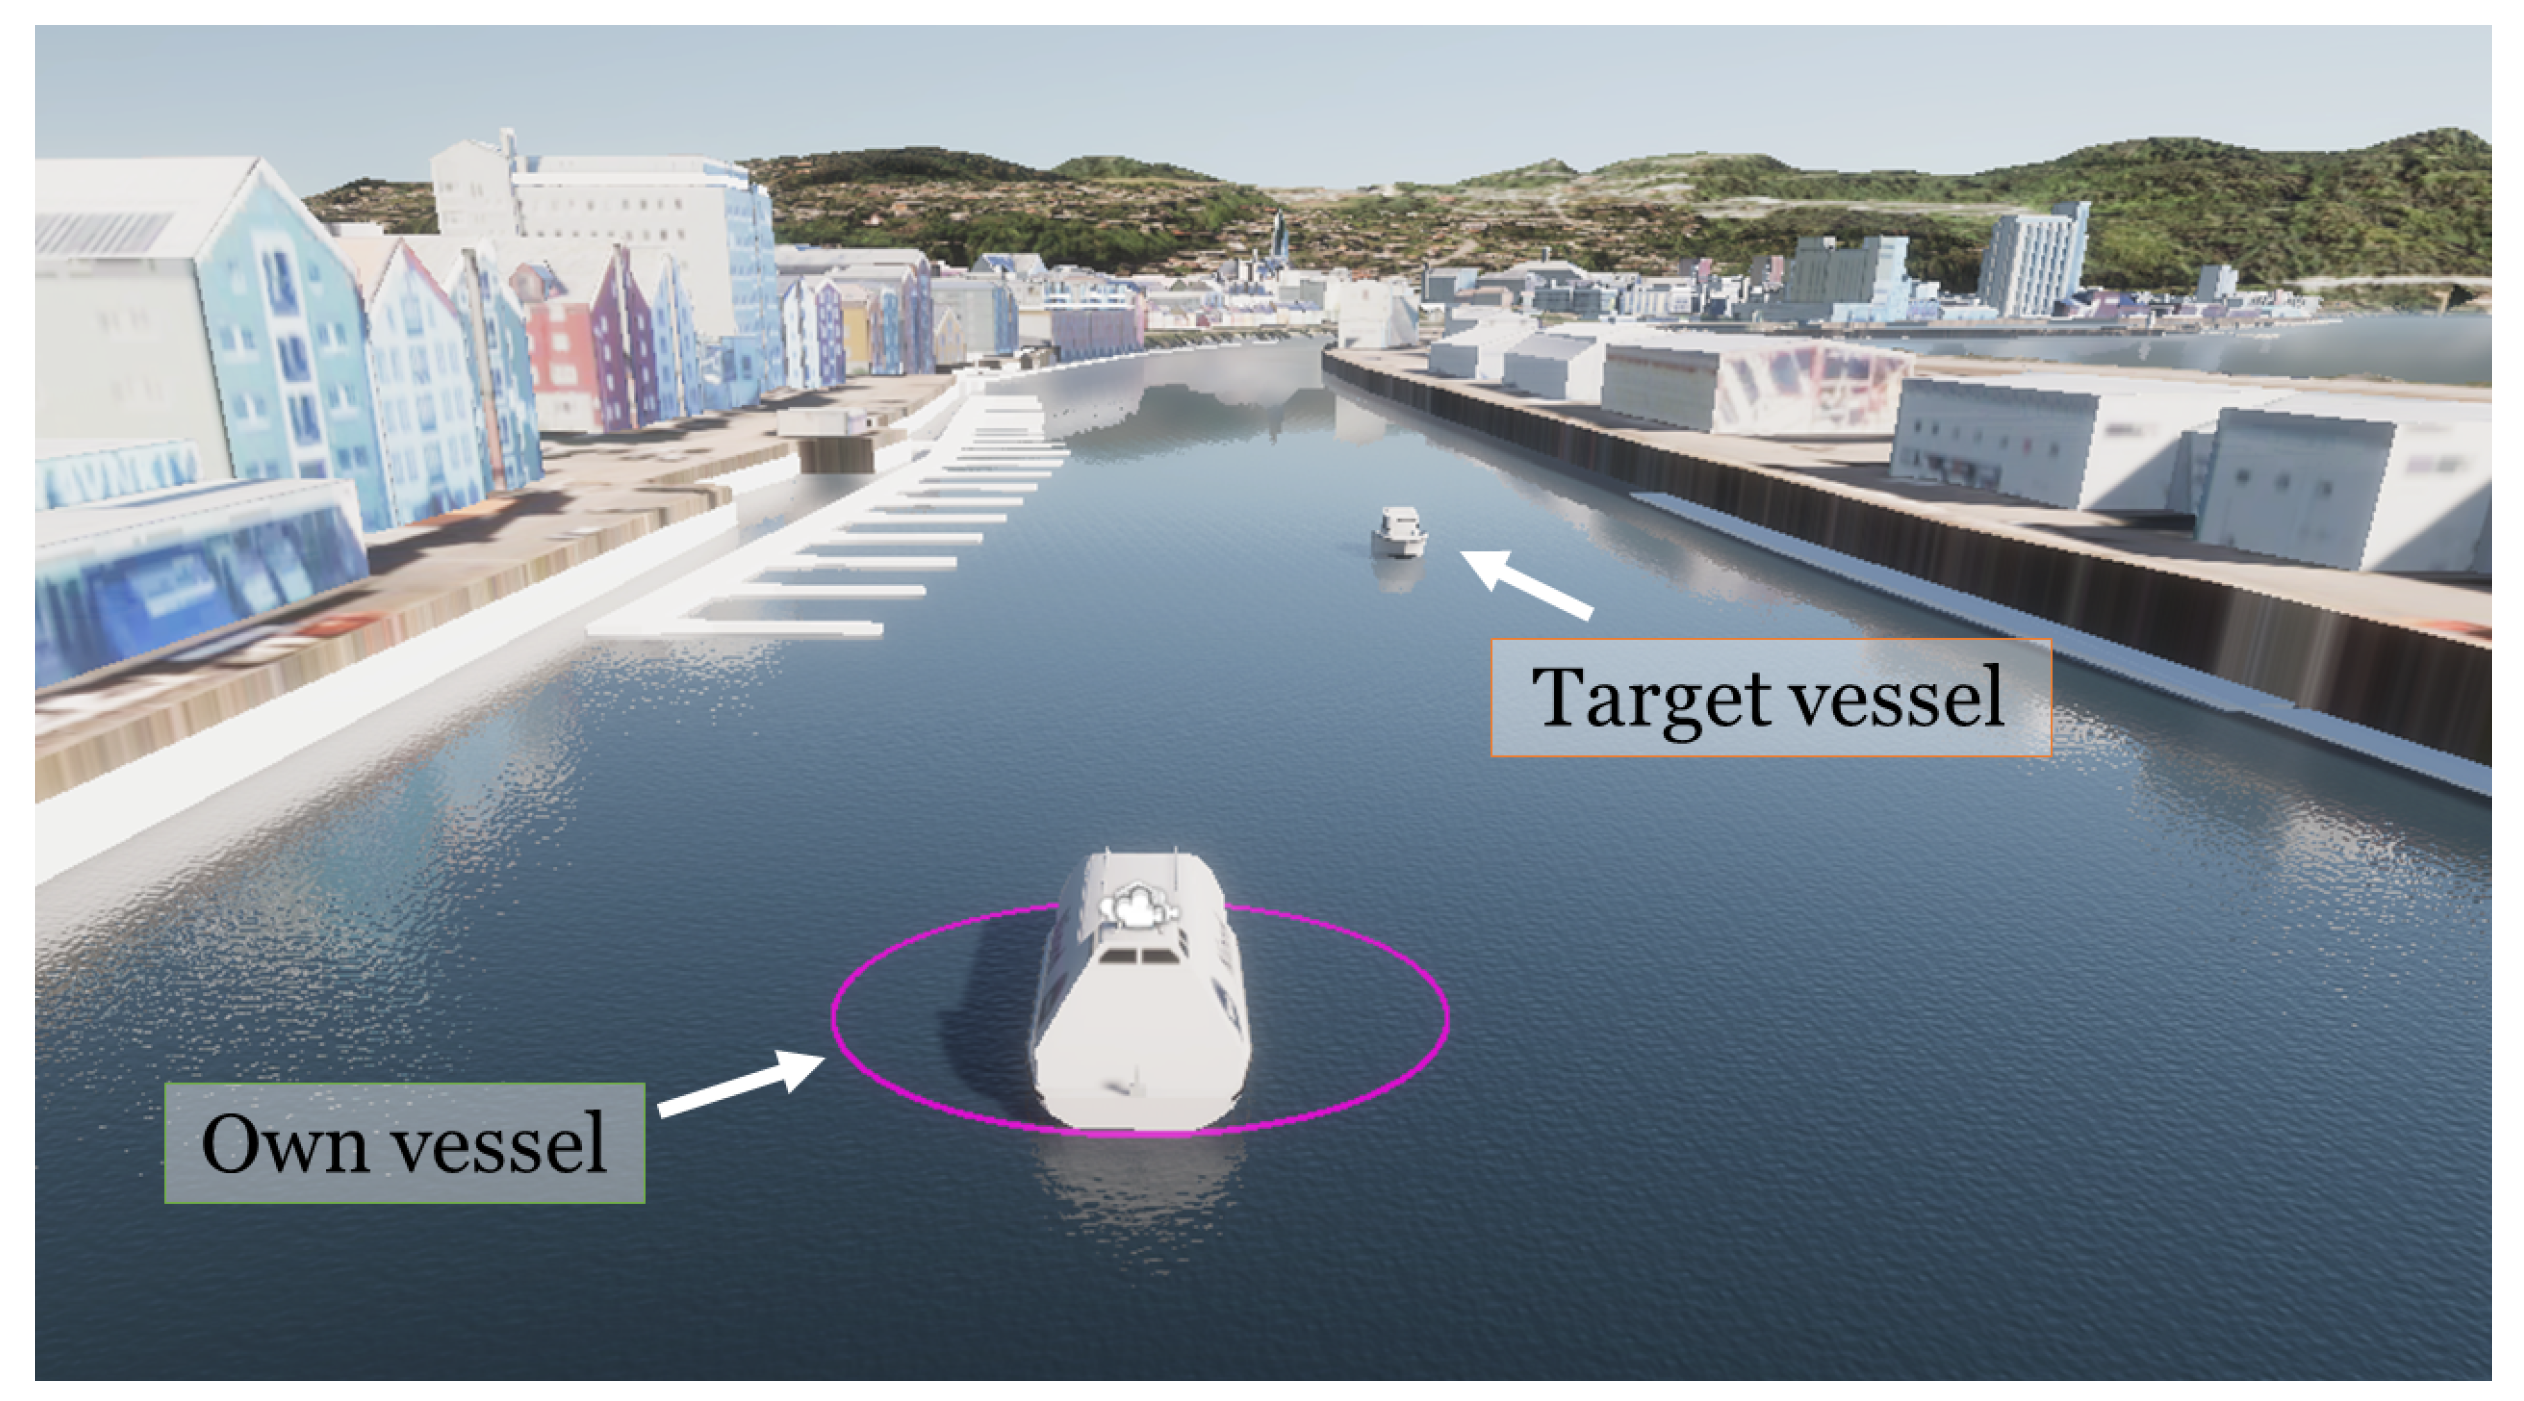
An open-source maritime platform named Autoferry Gemini [36] based on Unity game engine is used for the simulations of autonomous ships’ navigation scenarios (see Figure 5).
Simulation of ship navigation scenarios and calculation of the necessary ship interaction parameters is performed in Gemini. Additionally, Matlab (https://www.mathworks.com (accessed on 31 March 2022)) is used for calculation of individual risk factors and the ECRA score estimation using FIS, AIS data processing and data visualisation. The architecture of the framework used for calculating ECRA score is presented in Figure 6.
4.2. Automatic Identification System Data
Historic data gathered from the automatic identification system (AIS) were used for NMC calculation. AIS is a tracking tool that gathers data about different vessels’ identities, speeds and courses in the vicinity [37]. The geographical area of interest in this research is Trondheim fjord and its waters. Therefore, an AIS dataset containing historic data in this area was acquired from the Norwegian Coastal Administration (NCA) (https://www.kystverket.no/en (accessed on 31 March 2022)). Some useful parameters from this dataset that can aid geometric collision risk assessment are speed over ground (SOG), course over ground (COG), true heading, navigation status, rate of turn (ROT), calculated speed, ship length, longitude and latitude. An important thing to note is that, due to the specifics of AIS, data are typically received by several base stations at the same time. However, these base stations are not synchronised in time. Hence, the same “observation” may be included in the dataset with two different timesteps.
Use of the AIS data for near-miss collision detection required some pre-processing:
- separating and storing data about each vessel;
- cleaning data—(i) sorting in ascending order based on timestep, (ii) removing records with navigation status “moored” () or “aground” ();
- separating different routes of the same ship to avoid incorrect interpolation of missing data for large resting intervals;
- interpolating the AIS data within each route to fill in for the missing timesteps (10 s intervals are used here).
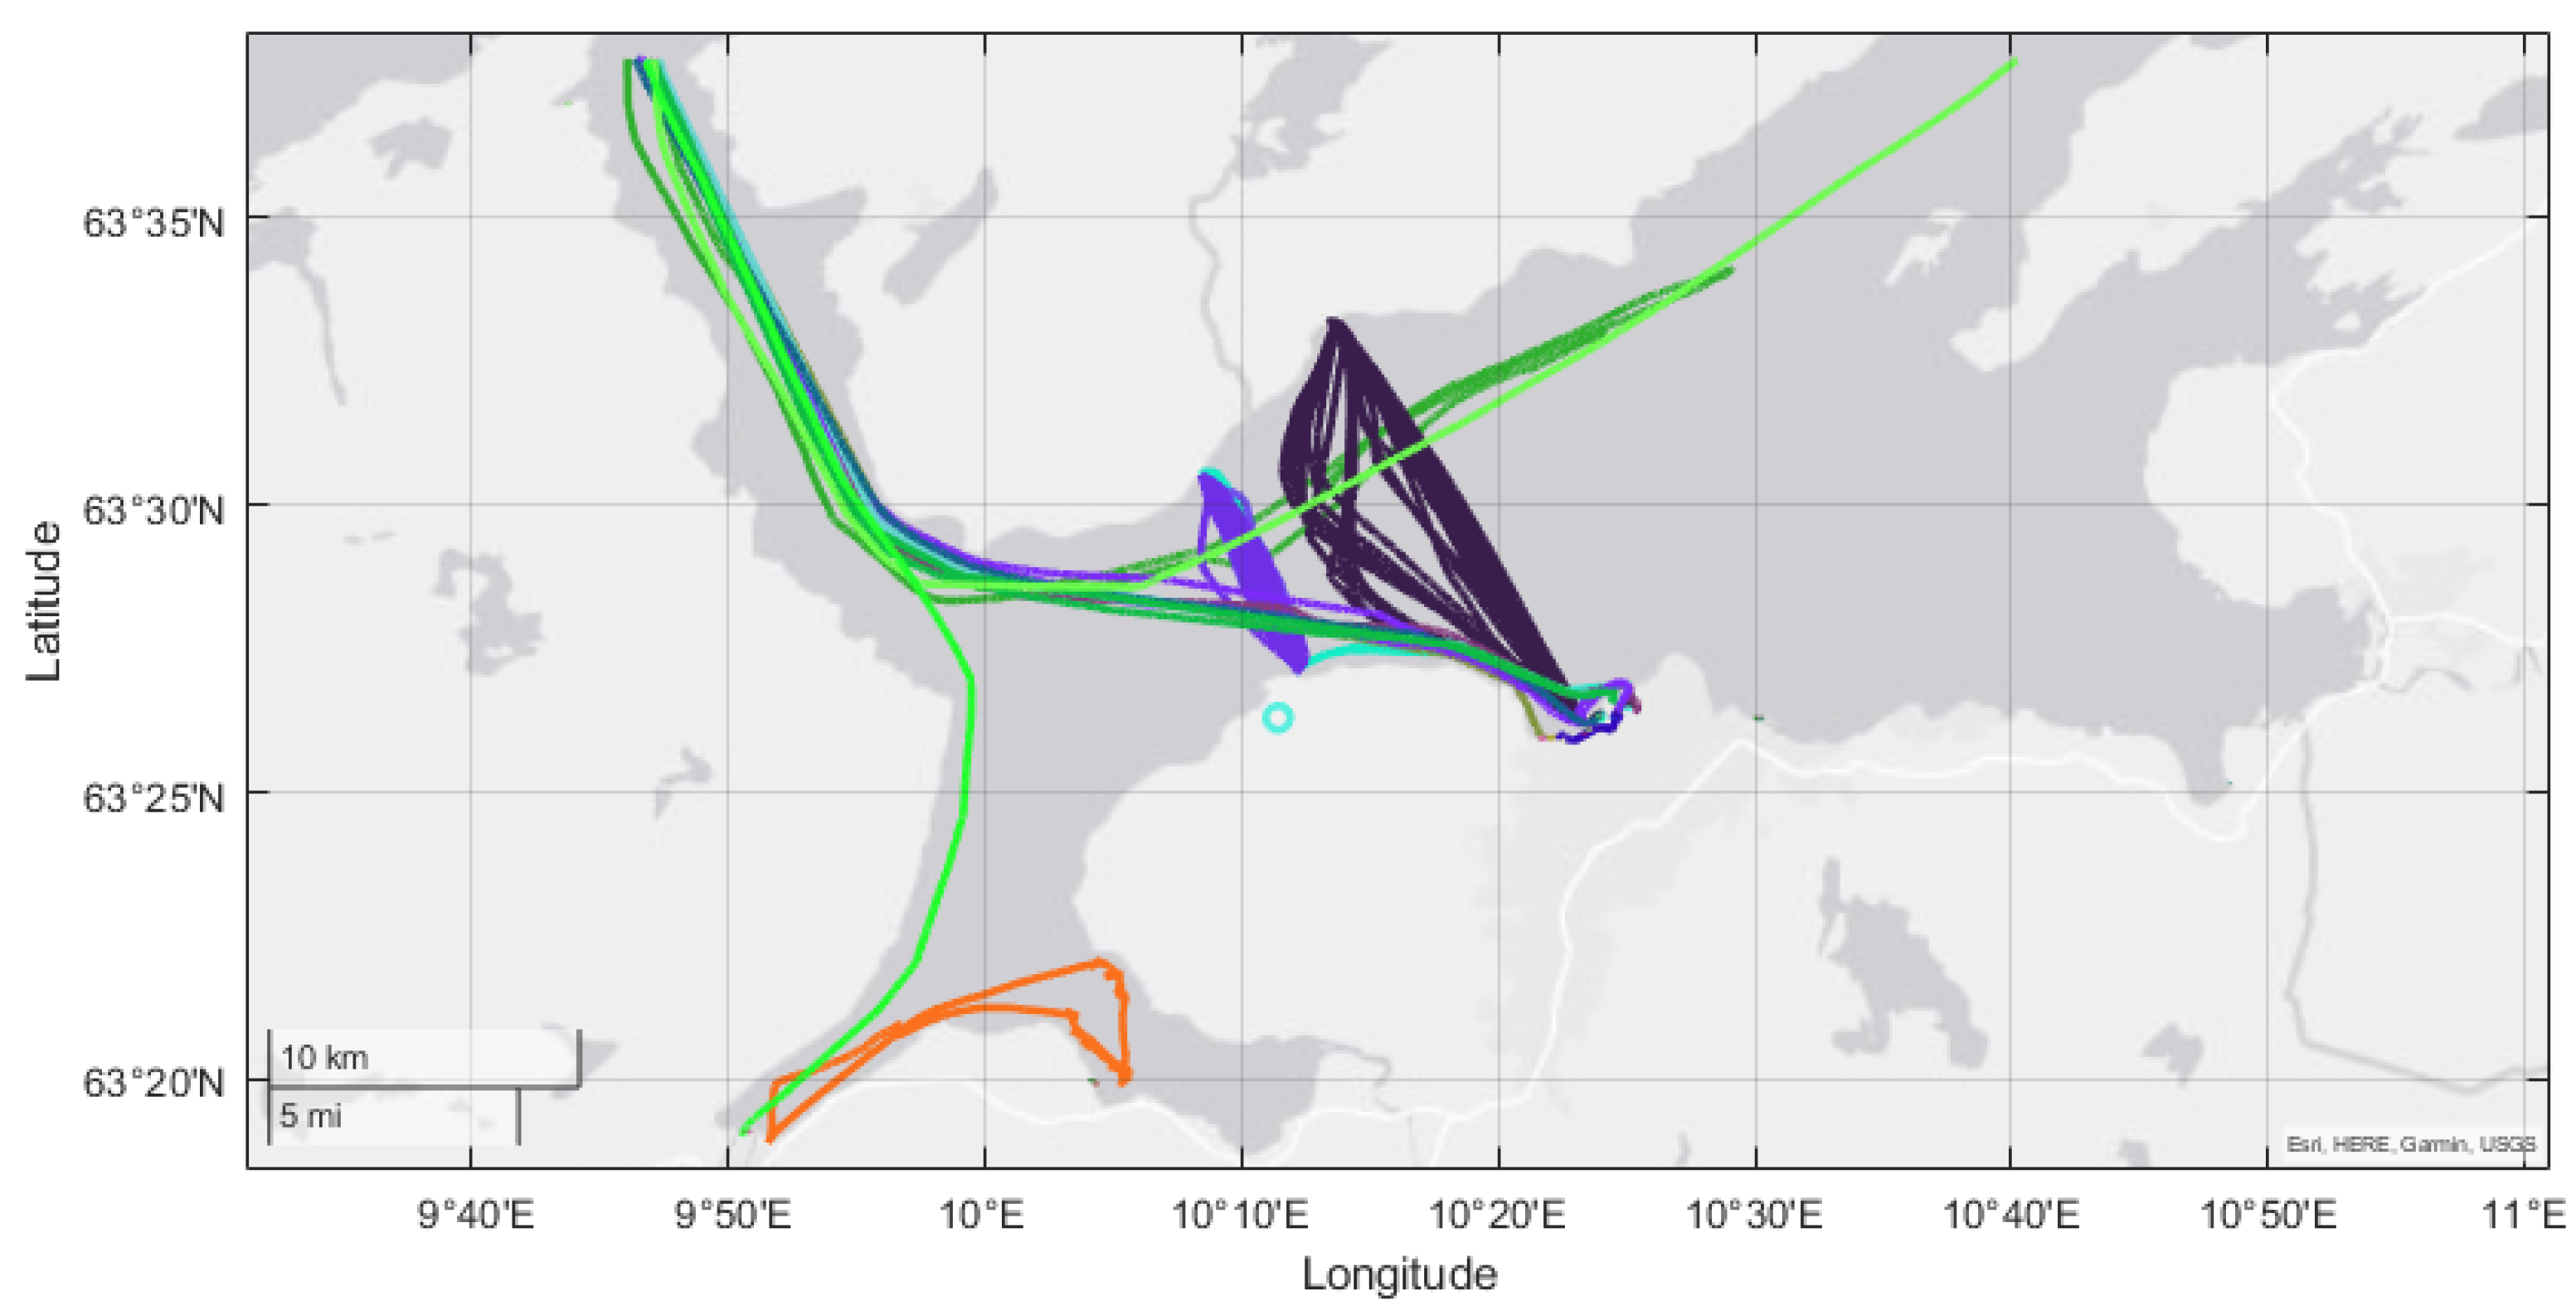
The reason for excluding vessels based on their navigation status is that this research focuses on vessels in motion and their close encounter situations. An example of interpolated trajectories of different vessels in the fjord based on AIS data is demonstrated in Figure 7.
When processing AIS data, some missing or incorrect values were encountered. For example, in a few cases, the reported ship length is equal to zero. In these situations, some assumptions have to be introduced to deal with erroneous data. However, in such cases, the safety domain overlap method might not give as precise results anymore. “Jumping” position is another issue observed in the data. In this case, some data are missing that give information about how the vessel got from one location to another after a longer time. This was solved by separating the data into multiple trips of the same vessel to avoid incorrect data interpolation between those locations.
4.3. Fuzzy Inference System for ECRA Score Calculation
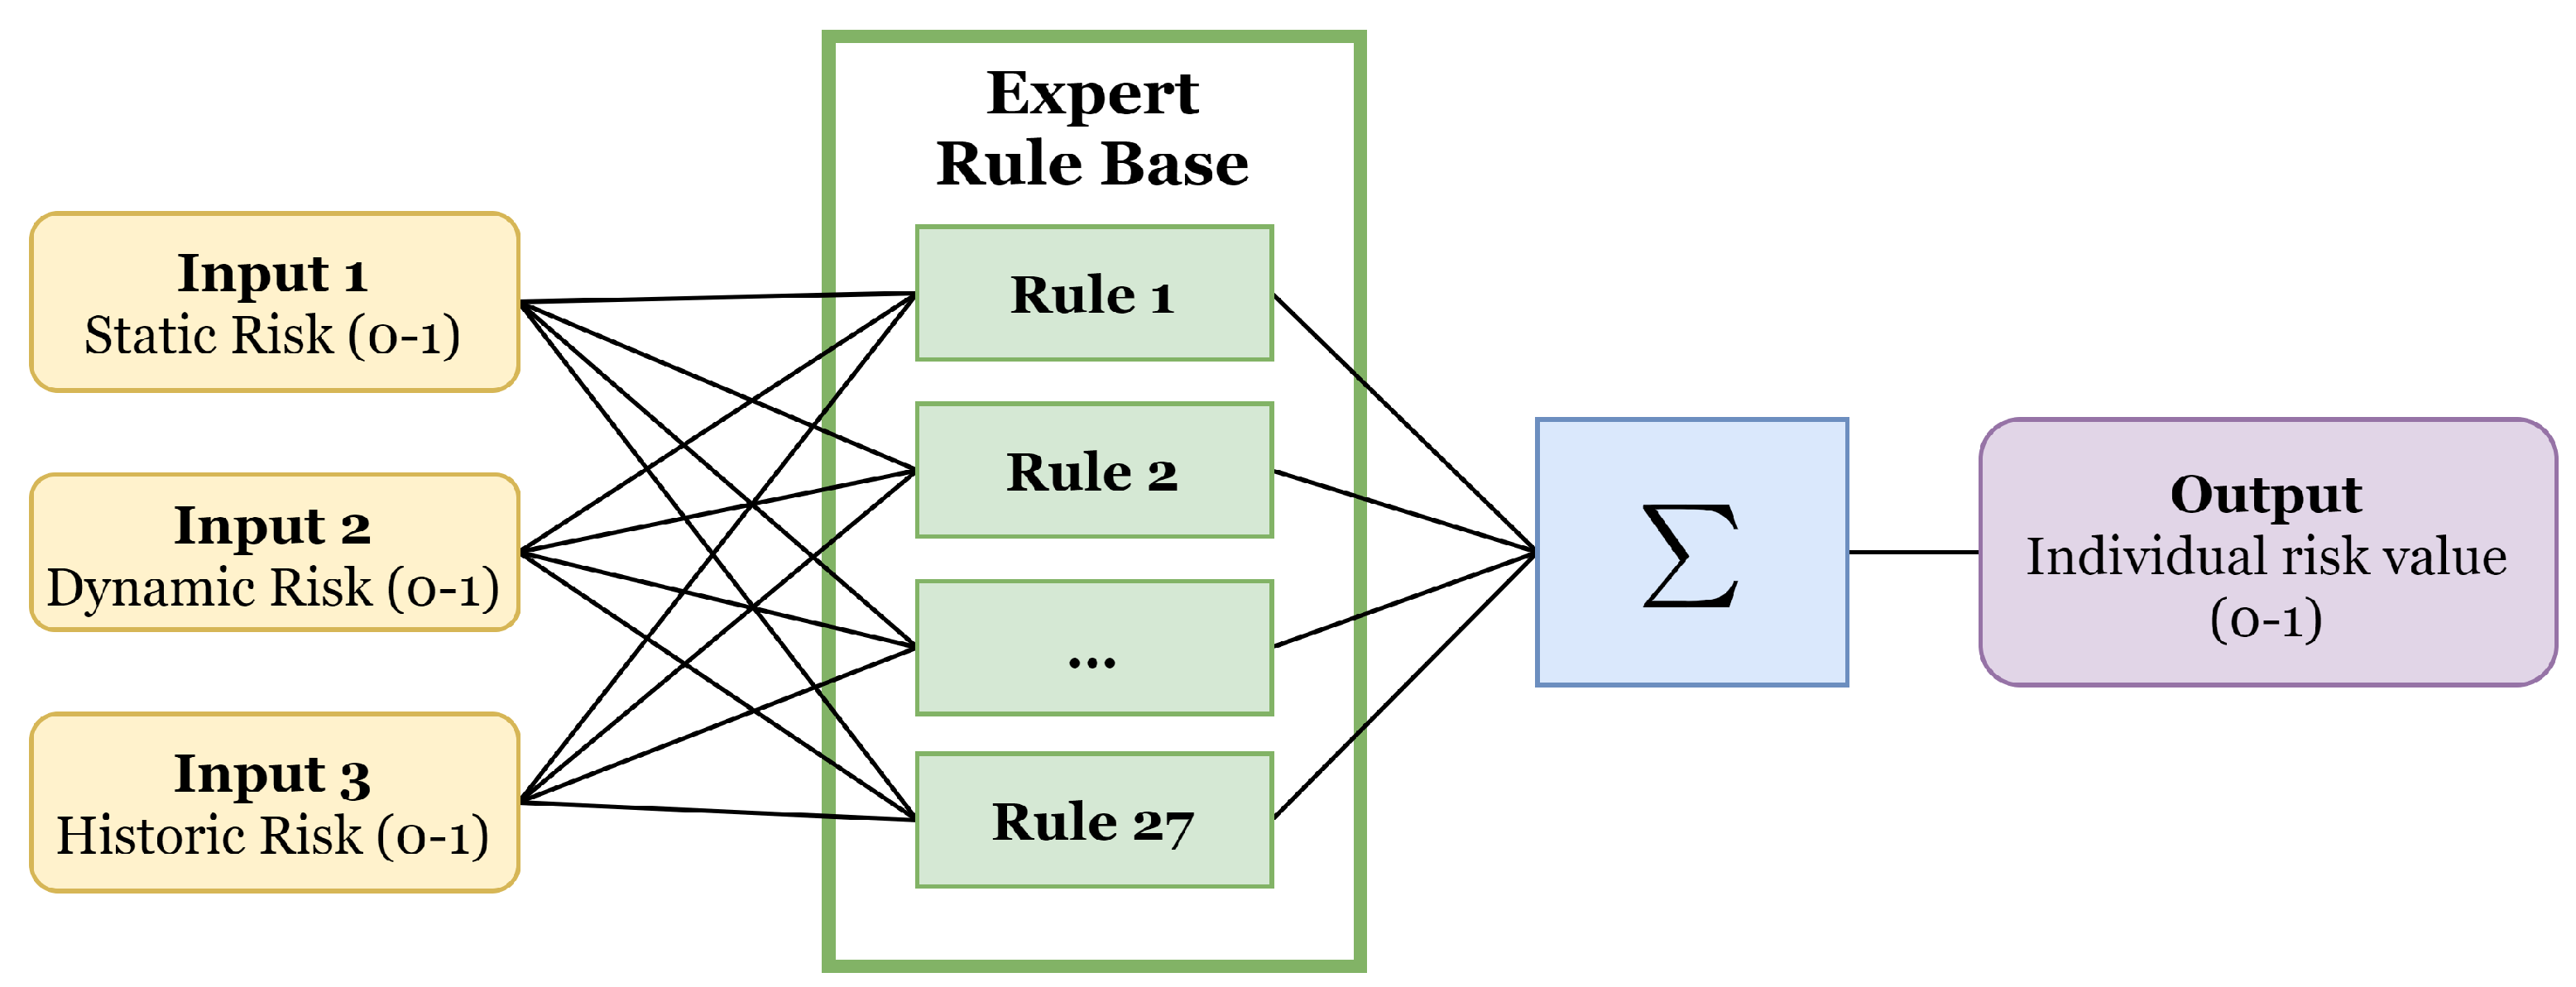
The individual risk of collision is calculated at every timestep using a fuzzy inference system that is based on expert knowledge. The Fuzzy Logic Toolbox (https://se.mathworks.com/help/fuzzy/fuzzylogicdesigner-app.html (accessed on 31 March 2022)) in Matlab is used for modelling FIS. The designed multiple-input and single-output (MISO) system is a Type-1 Mamdani FIS with three inputs (static/dynamic/historic risks), one output (individual risk value) and twenty-seven rules in the expert rule base (see Figure 8).
4.3.1. Membership Functions
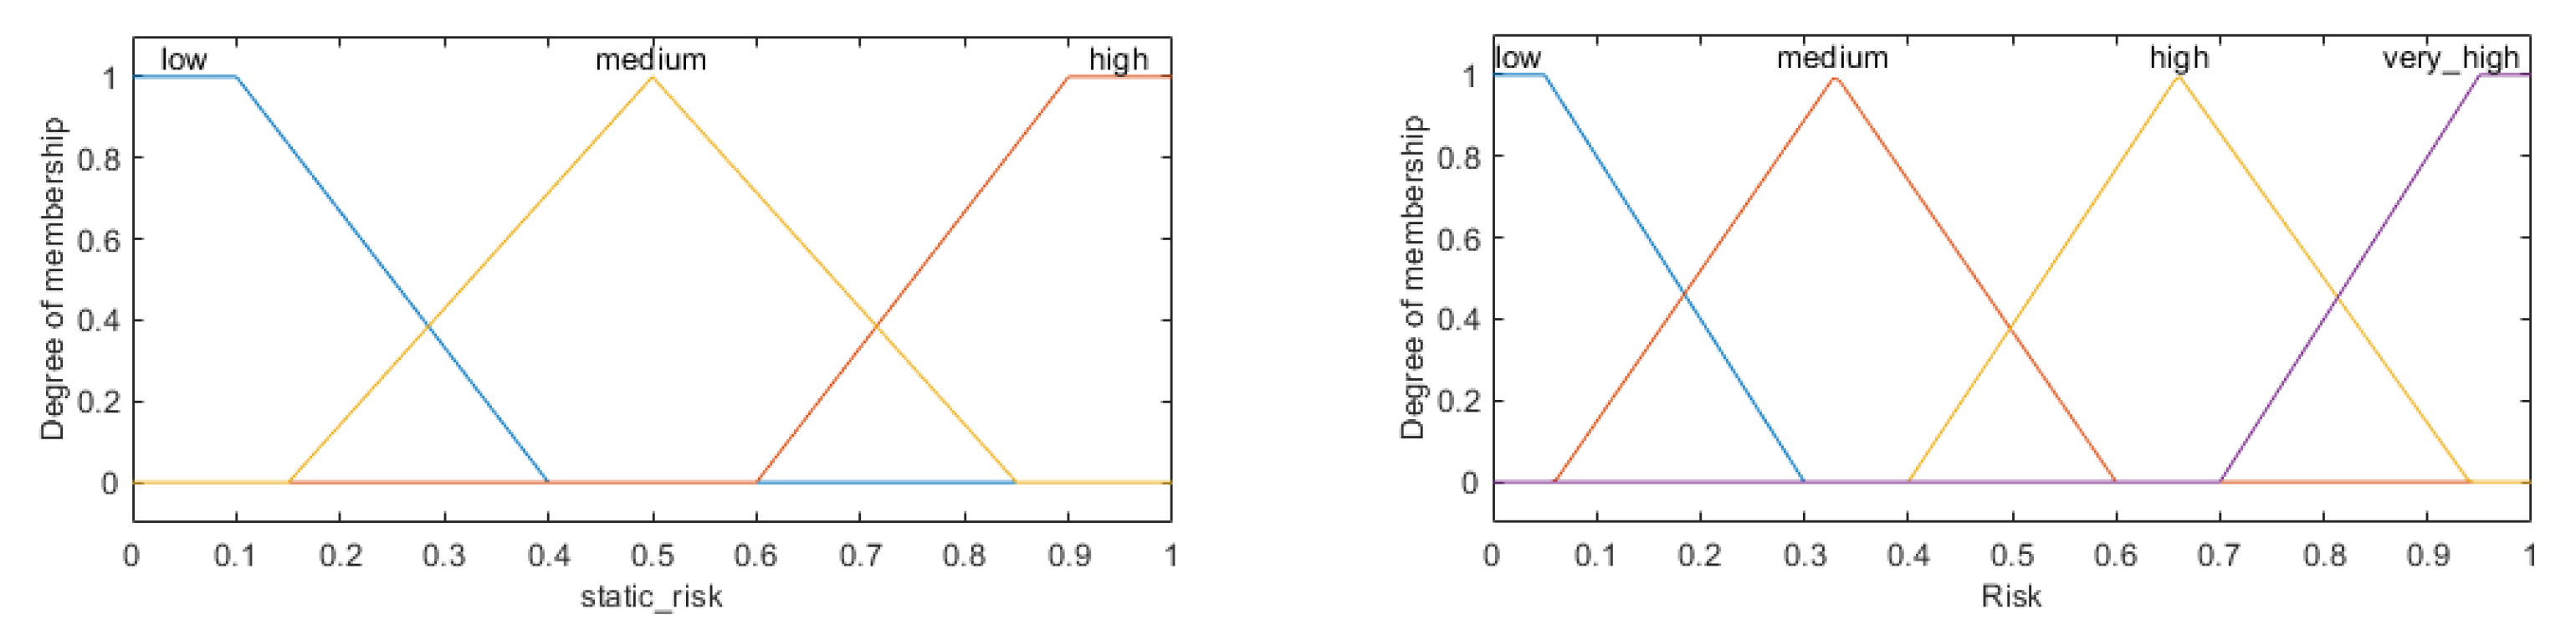
All the input variables have the same shape of membership function with three linguistic states (values)—low (L), medium (M) and high (H) (see the left-hand side in Figure 9). The output, however, has four linguistic states—low (L), medium (M), high (H), and very high (VH) (see the right-hand side in Figure 9).
4.3.2. Expert Rule Base
Fuzzy rule base has been developed based on a group of experts’ knowledge. The experts invited to take part in this research are experienced mariners and maritime training simulator instructors from Norway with over 10 years of experience. The fuzzy reasoning rule base is given in Table 2.
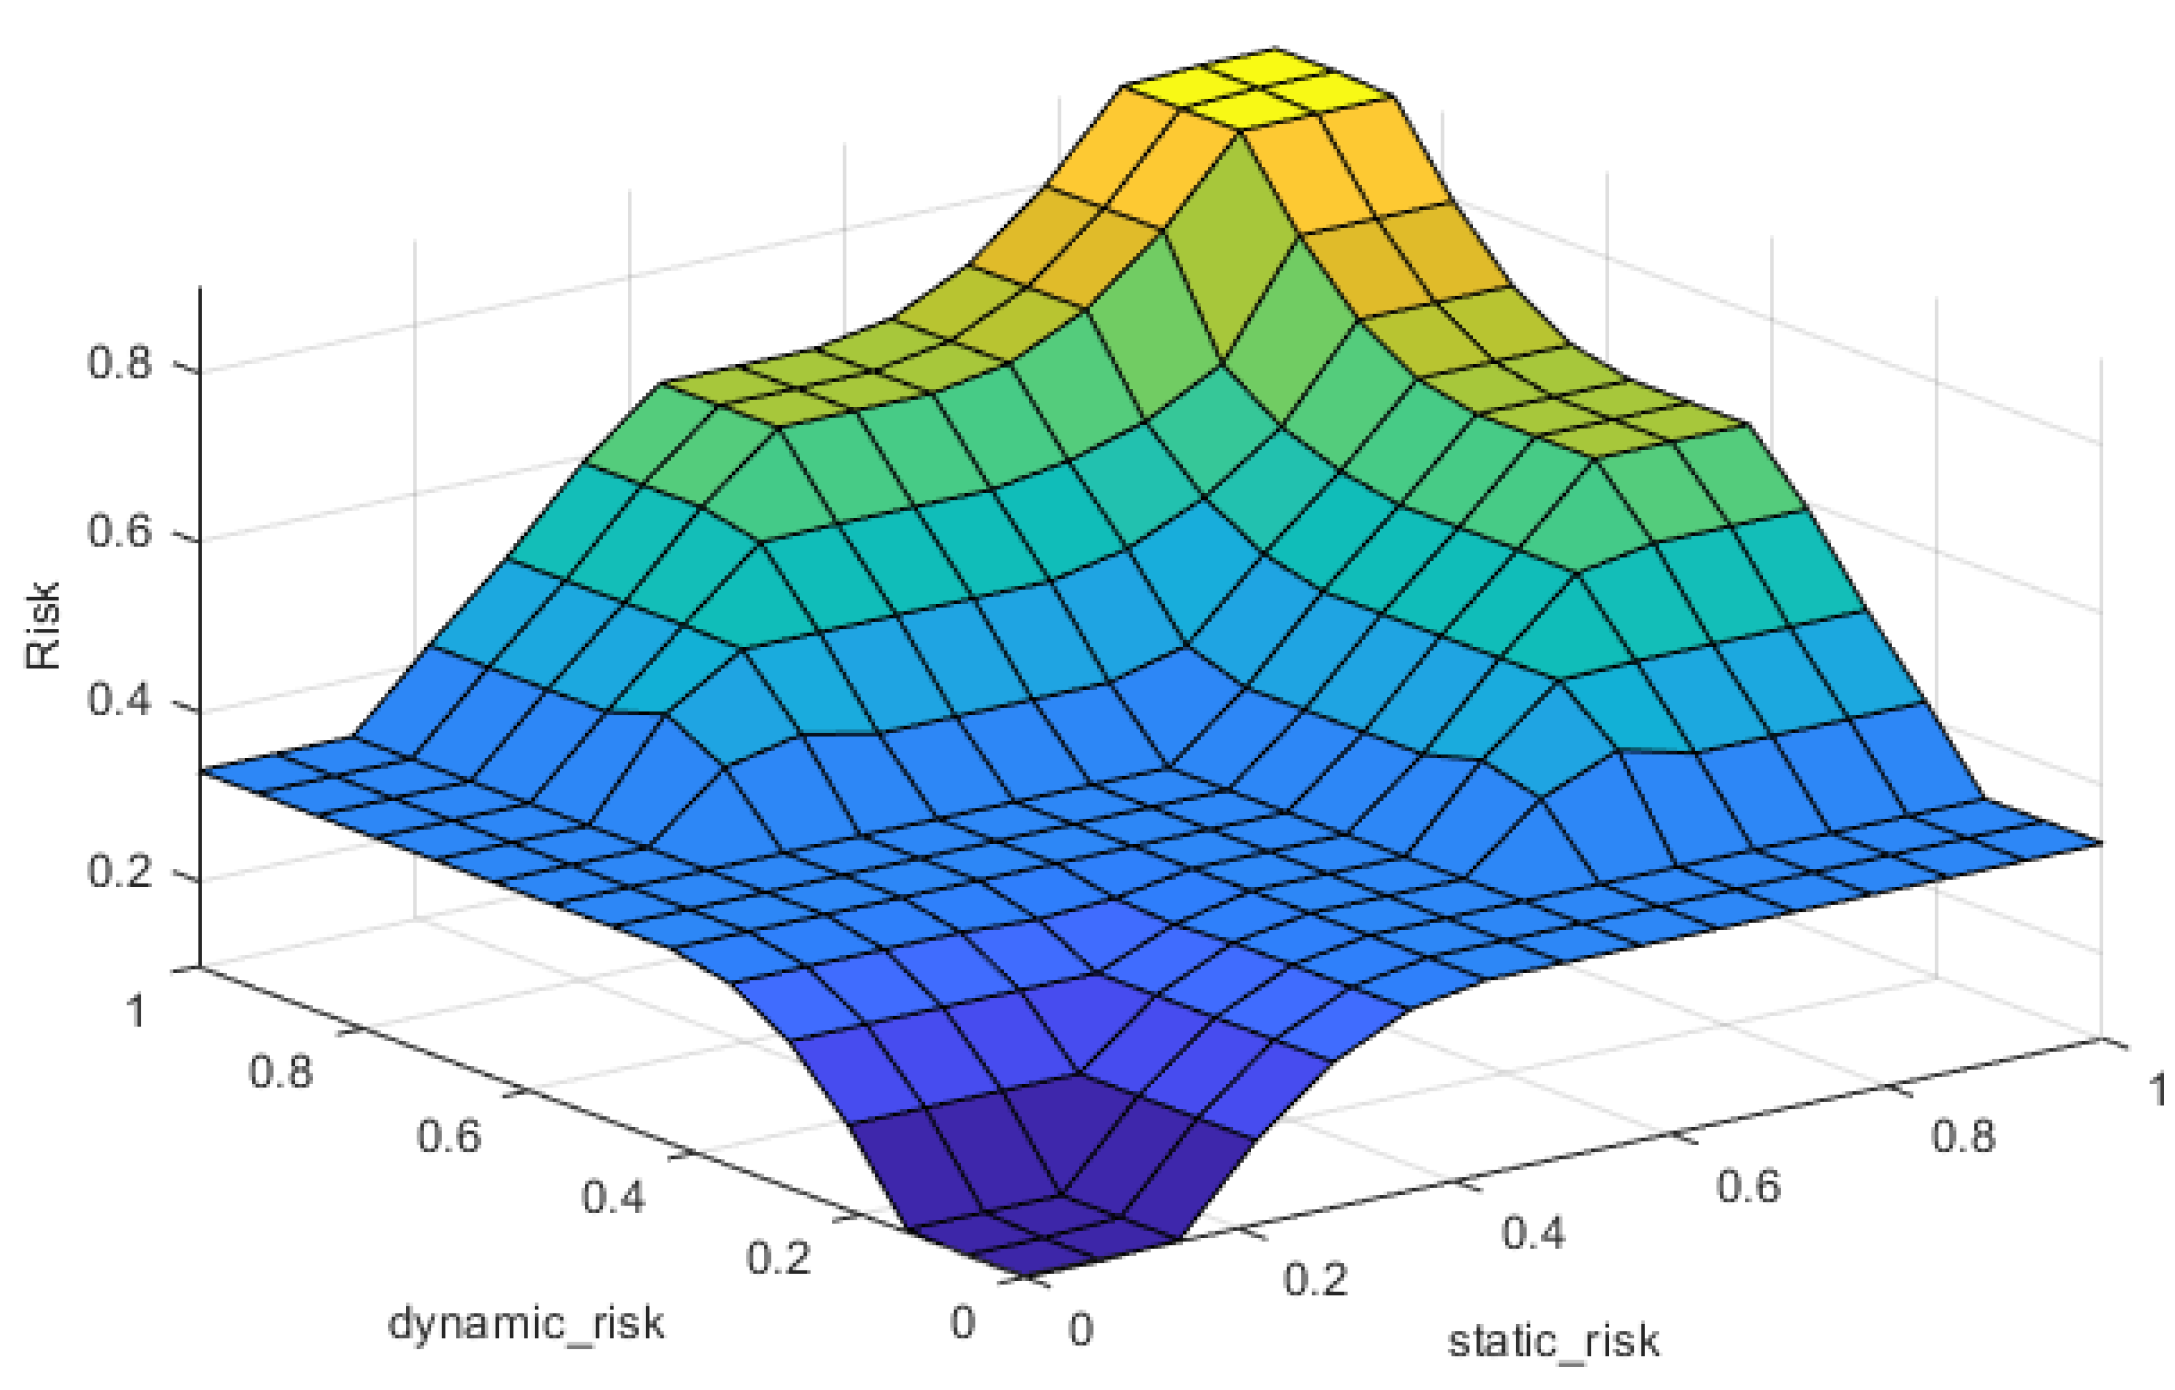
Based on the obtained expert rule base, the generated surface plot is demonstrated in Figure 10. This plot shows the relation between two input variables (static risk and dynamic risk) and the output individual collision risk value.
In order to implement the system, all the input values are normalised to the range . It is possible to tune fuzzy membership function parameters and extend the rule base using different tuning methods, such as GA, PSO and others.
5. Simulation and Results
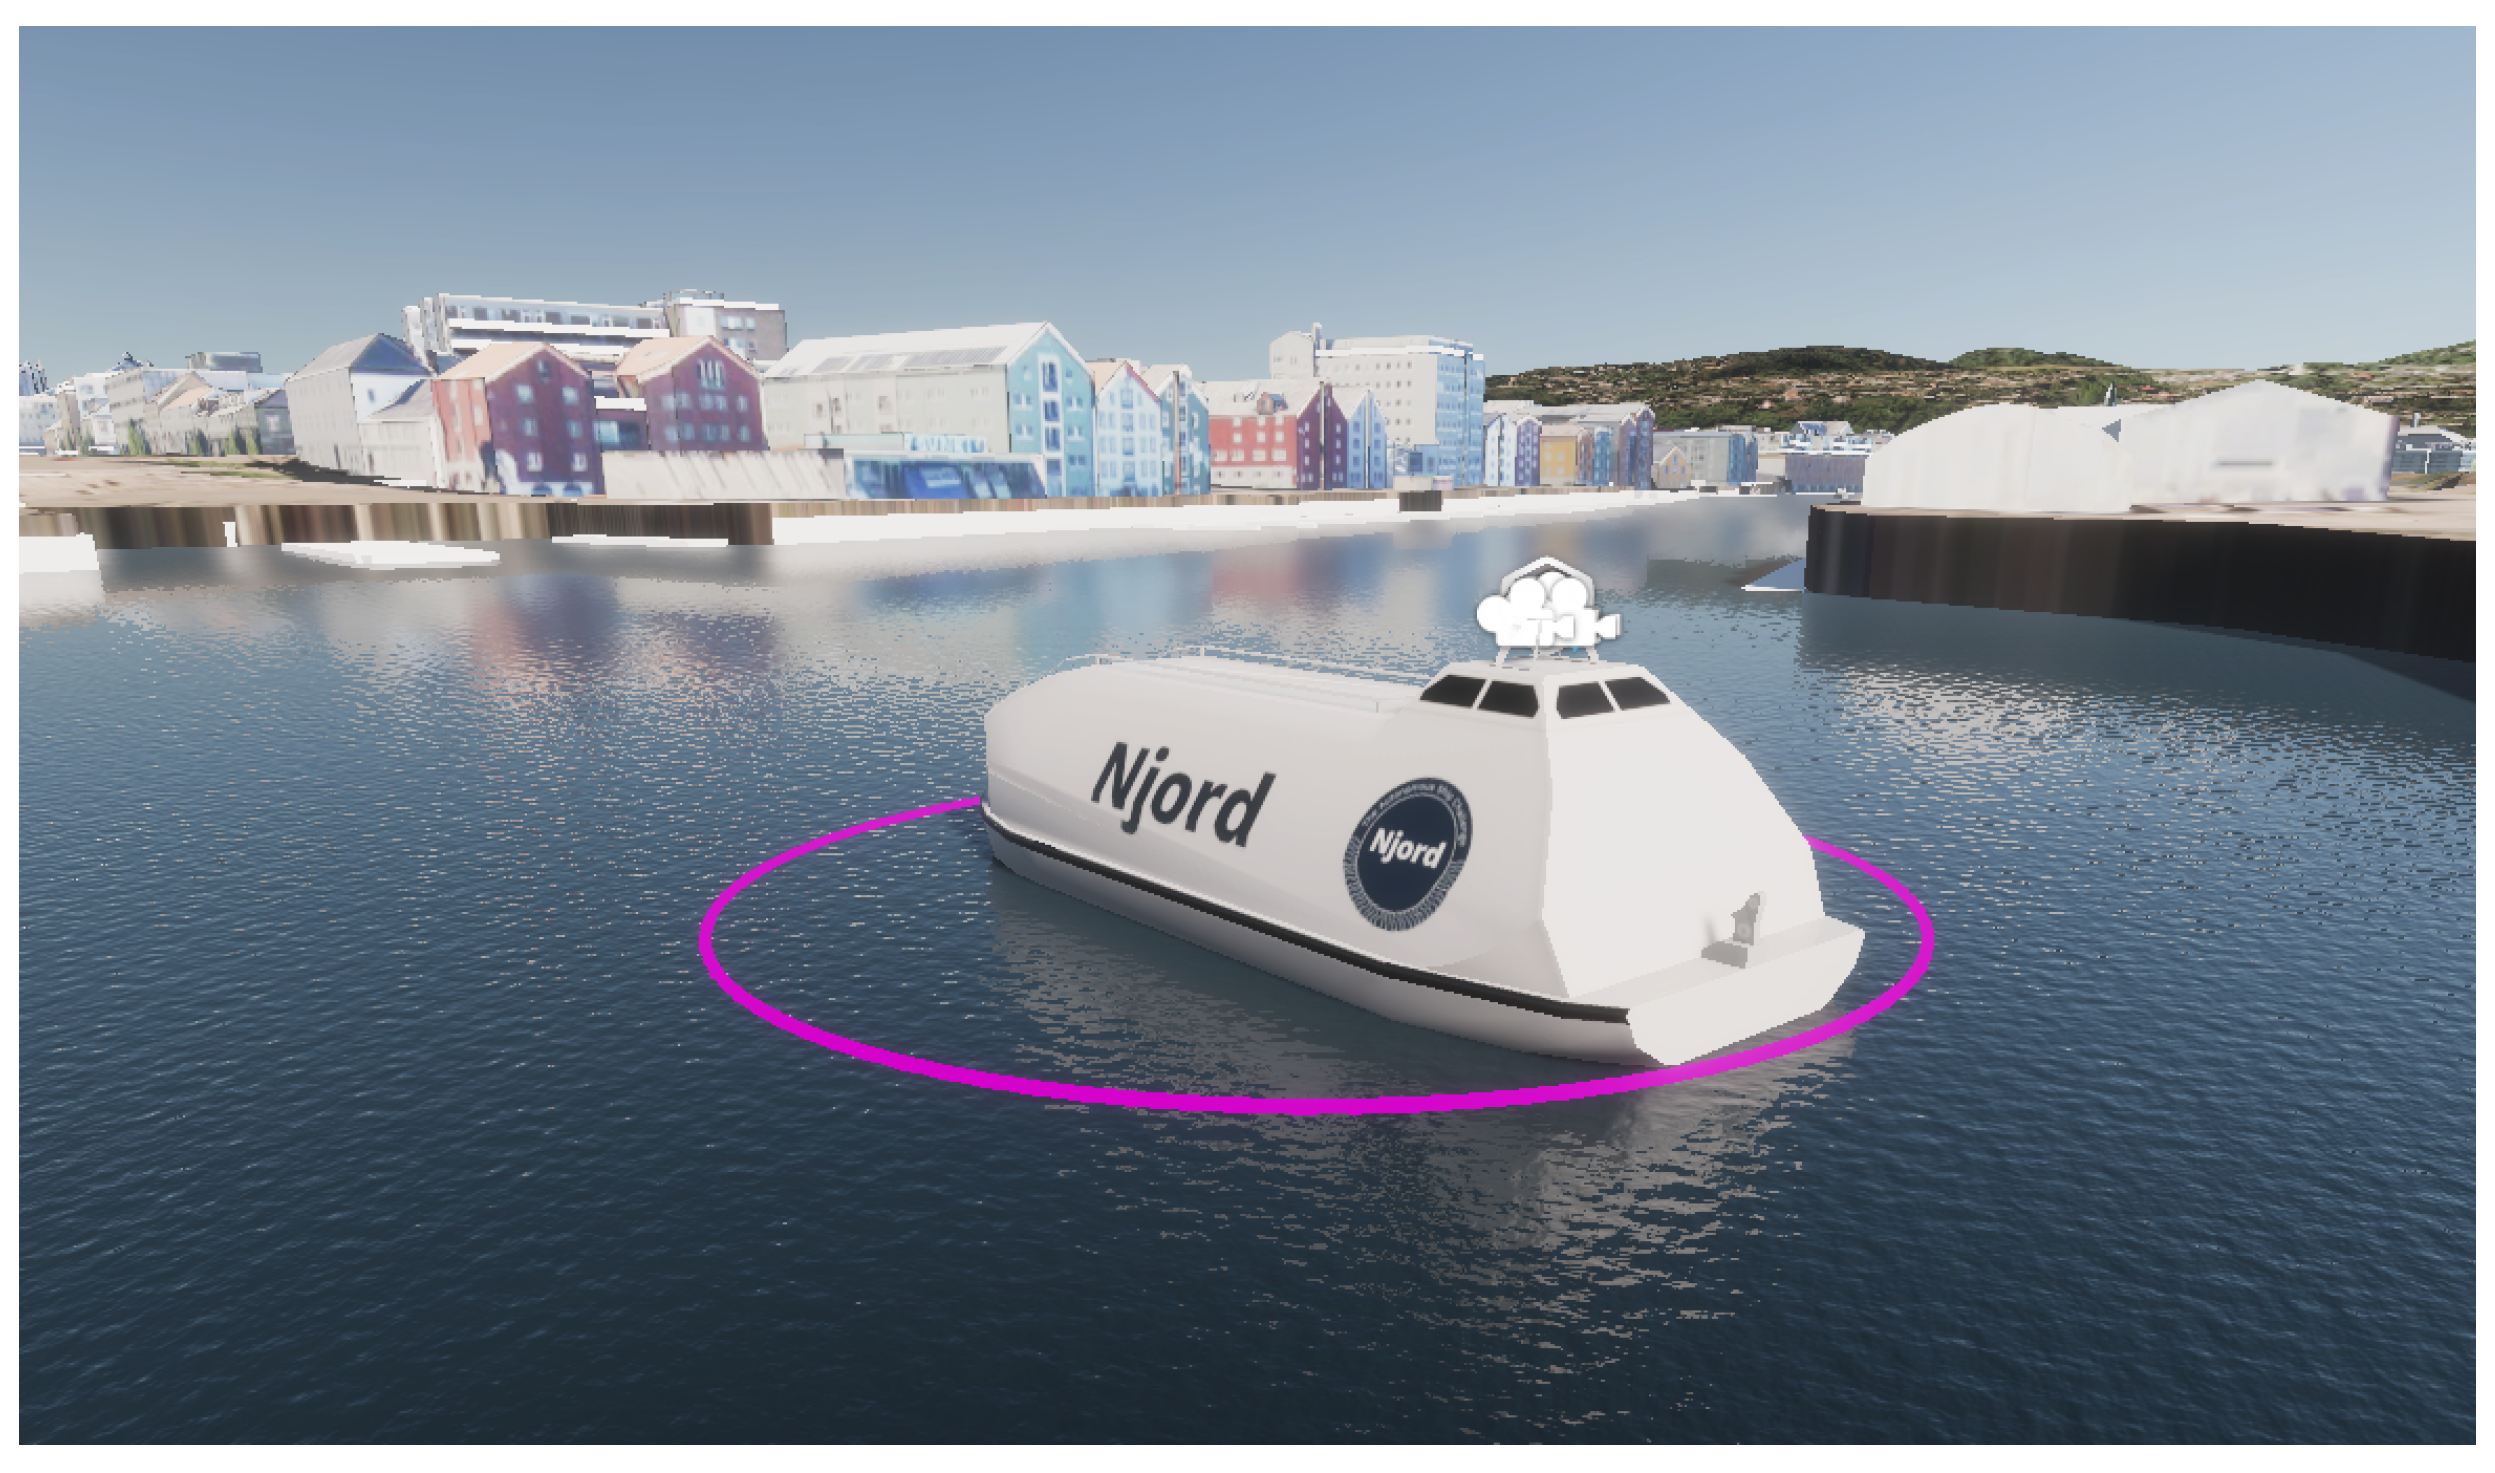
Simulations were executed using Unity 2019.4.21f1 on an Intel i7 with a hexa-core processor. Risk calculations and fuzzy system were executed in Matlab R20201a. The own ship model used in simulations is the Njord vessel—an 11 m long retrofitted lifeboat model inspired by Ocean Space Drone by Kongsberg Seatex (see Figure 11). The target ship in the simulator is chosen to be a 7.51 m long cabin cruiser Havfruen V motorboat (medium-sized boat) model [38].
When working across platforms, it should be noted that the historic AIS data are provided in the geographic coordinate system (GCS), while parameters extracted from Unity are in local Unity units. A conversion between the coordinate systems has to be performed where necessary.
The Gemini simulator includes a few existing scenarios of ship navigation that are based on real-ship collected data (see description of the dataset collection in Chapter 3 in Vasstein [38]). The scenario data collection took place in Ravnkloa in Trondheim, Norway, on 15 September 2020. The author was greatly interested in testing the proposed method in three different navigation situations. Therefore, for validation purposes, three scenarios from Gemini, numbers 5, 8 and 9, were selected as the validation test setups. In all scenarios, the ECRA score is calculated for the path of the Njord vessel (OS). For each test case, additionally to the original OS path (path A), three derived paths were generated—a cautious path (B) and two incautious paths (C and D). This allows to compare four different OS path ECRA scores for each scenario. Path B is a path where the OS keeps a cautious distance from both static and dynamic obstacles in the vicinity. Here, path C is a path where safety in regard to static obstacles is compromised. That means the OS chose to navigate from the start position to the end position without keeping a cautious distance from the static obstacles. As for path D, it comprises a relatively dangerous manoeuvre of the OS with navigation in the direction of TS and a last minute collision avoidance. It is worth noting that, in all test cases, the TS keeps its trajectory; however, only the OS path is altered.
5.1. Test Case 1
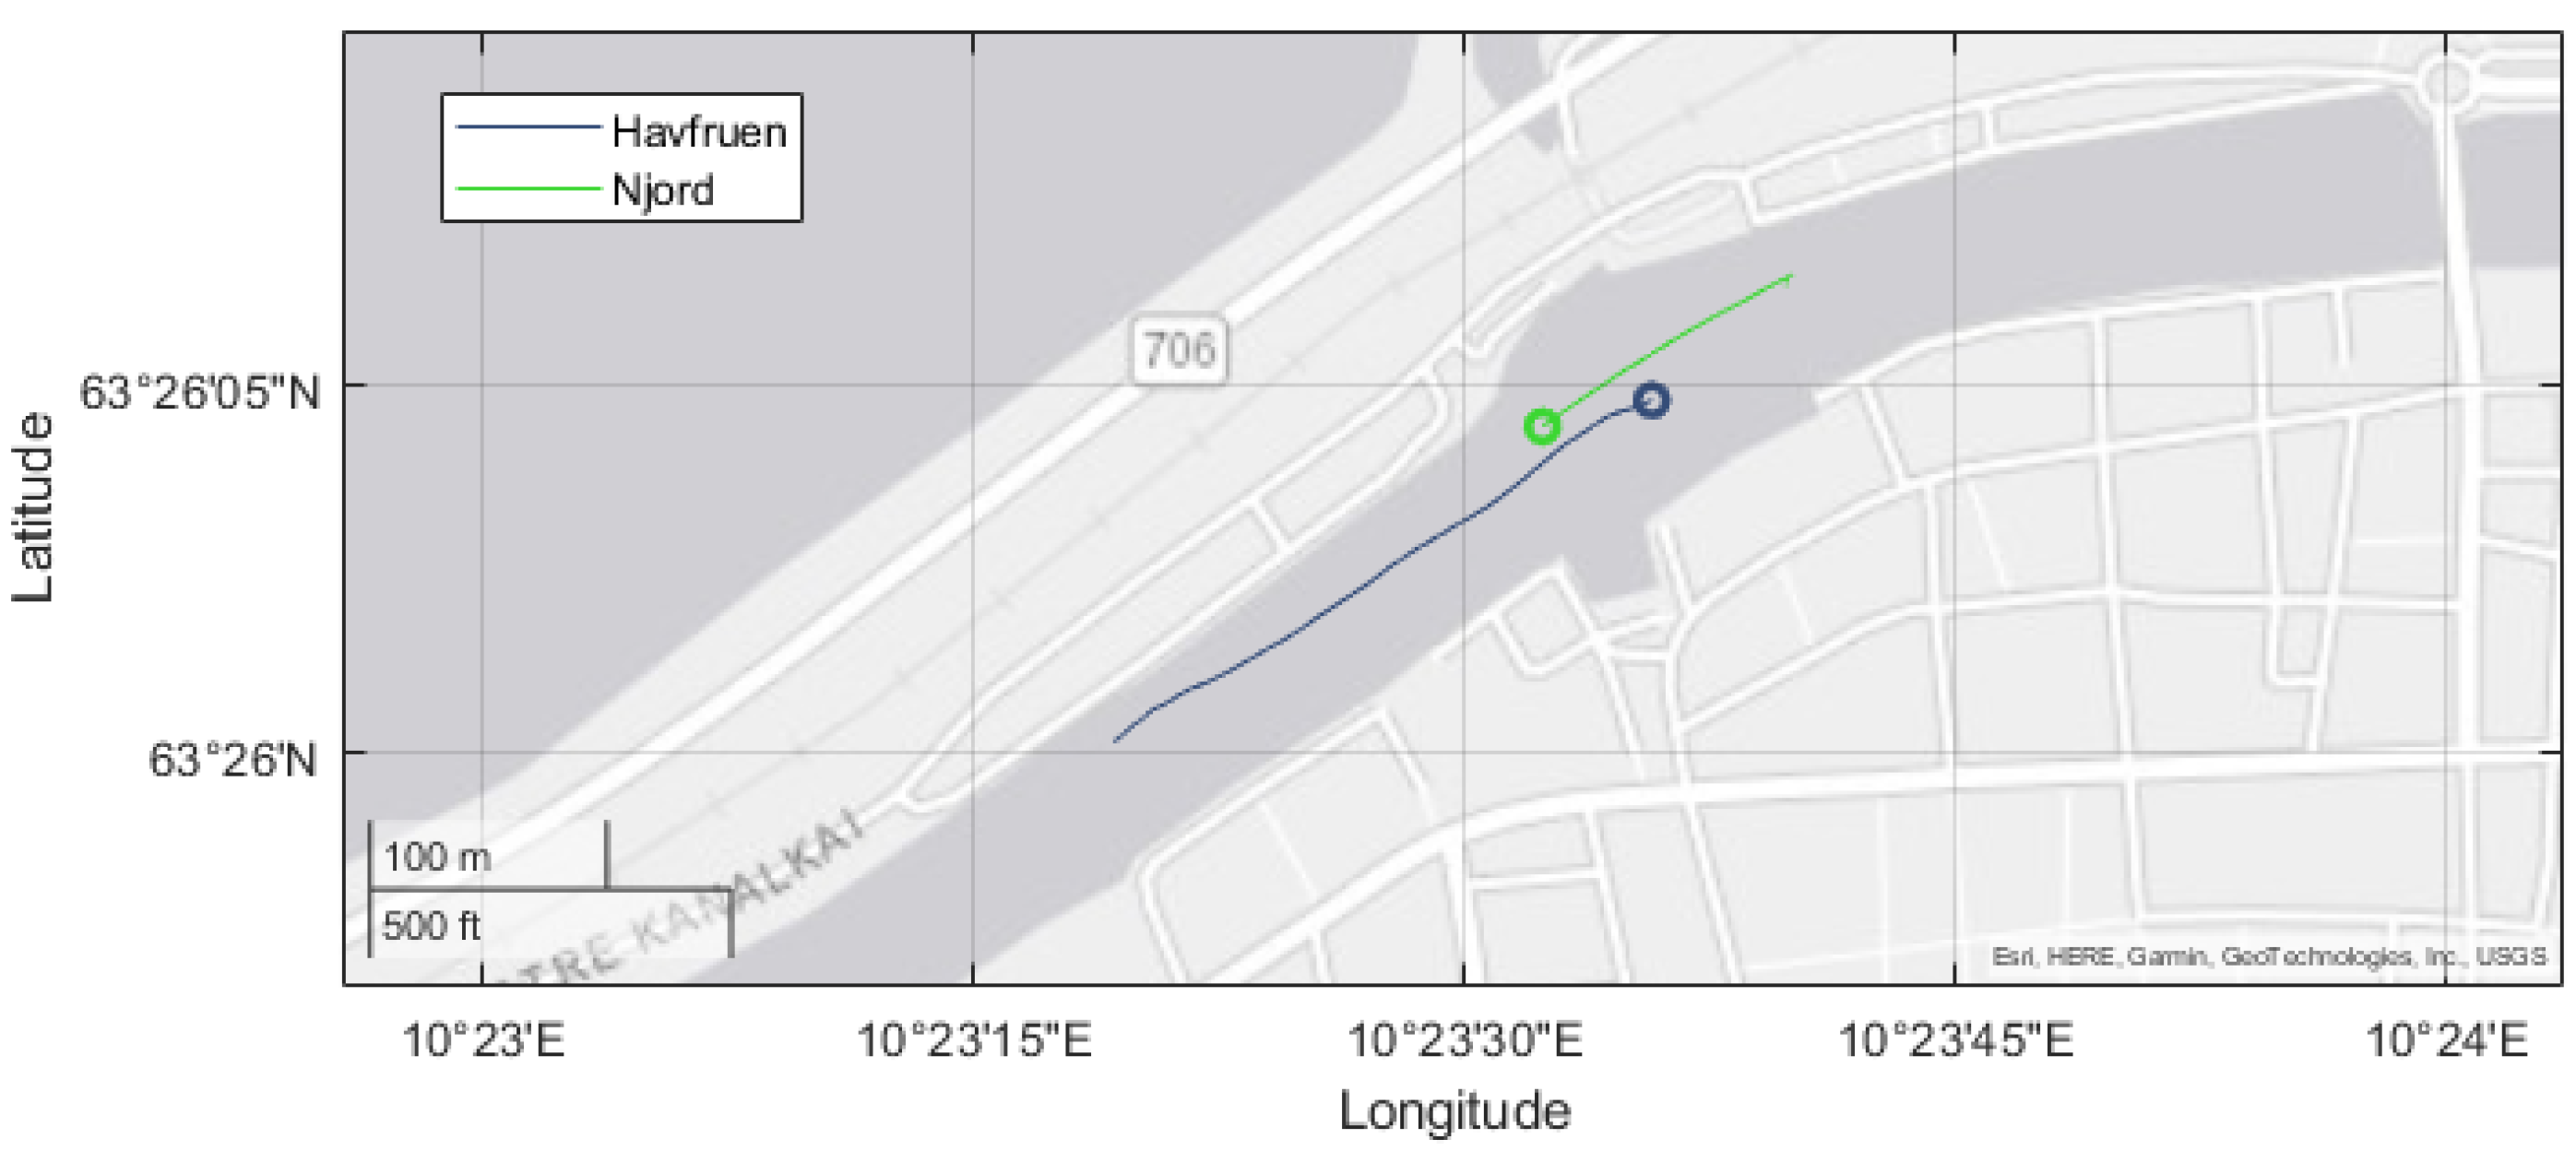
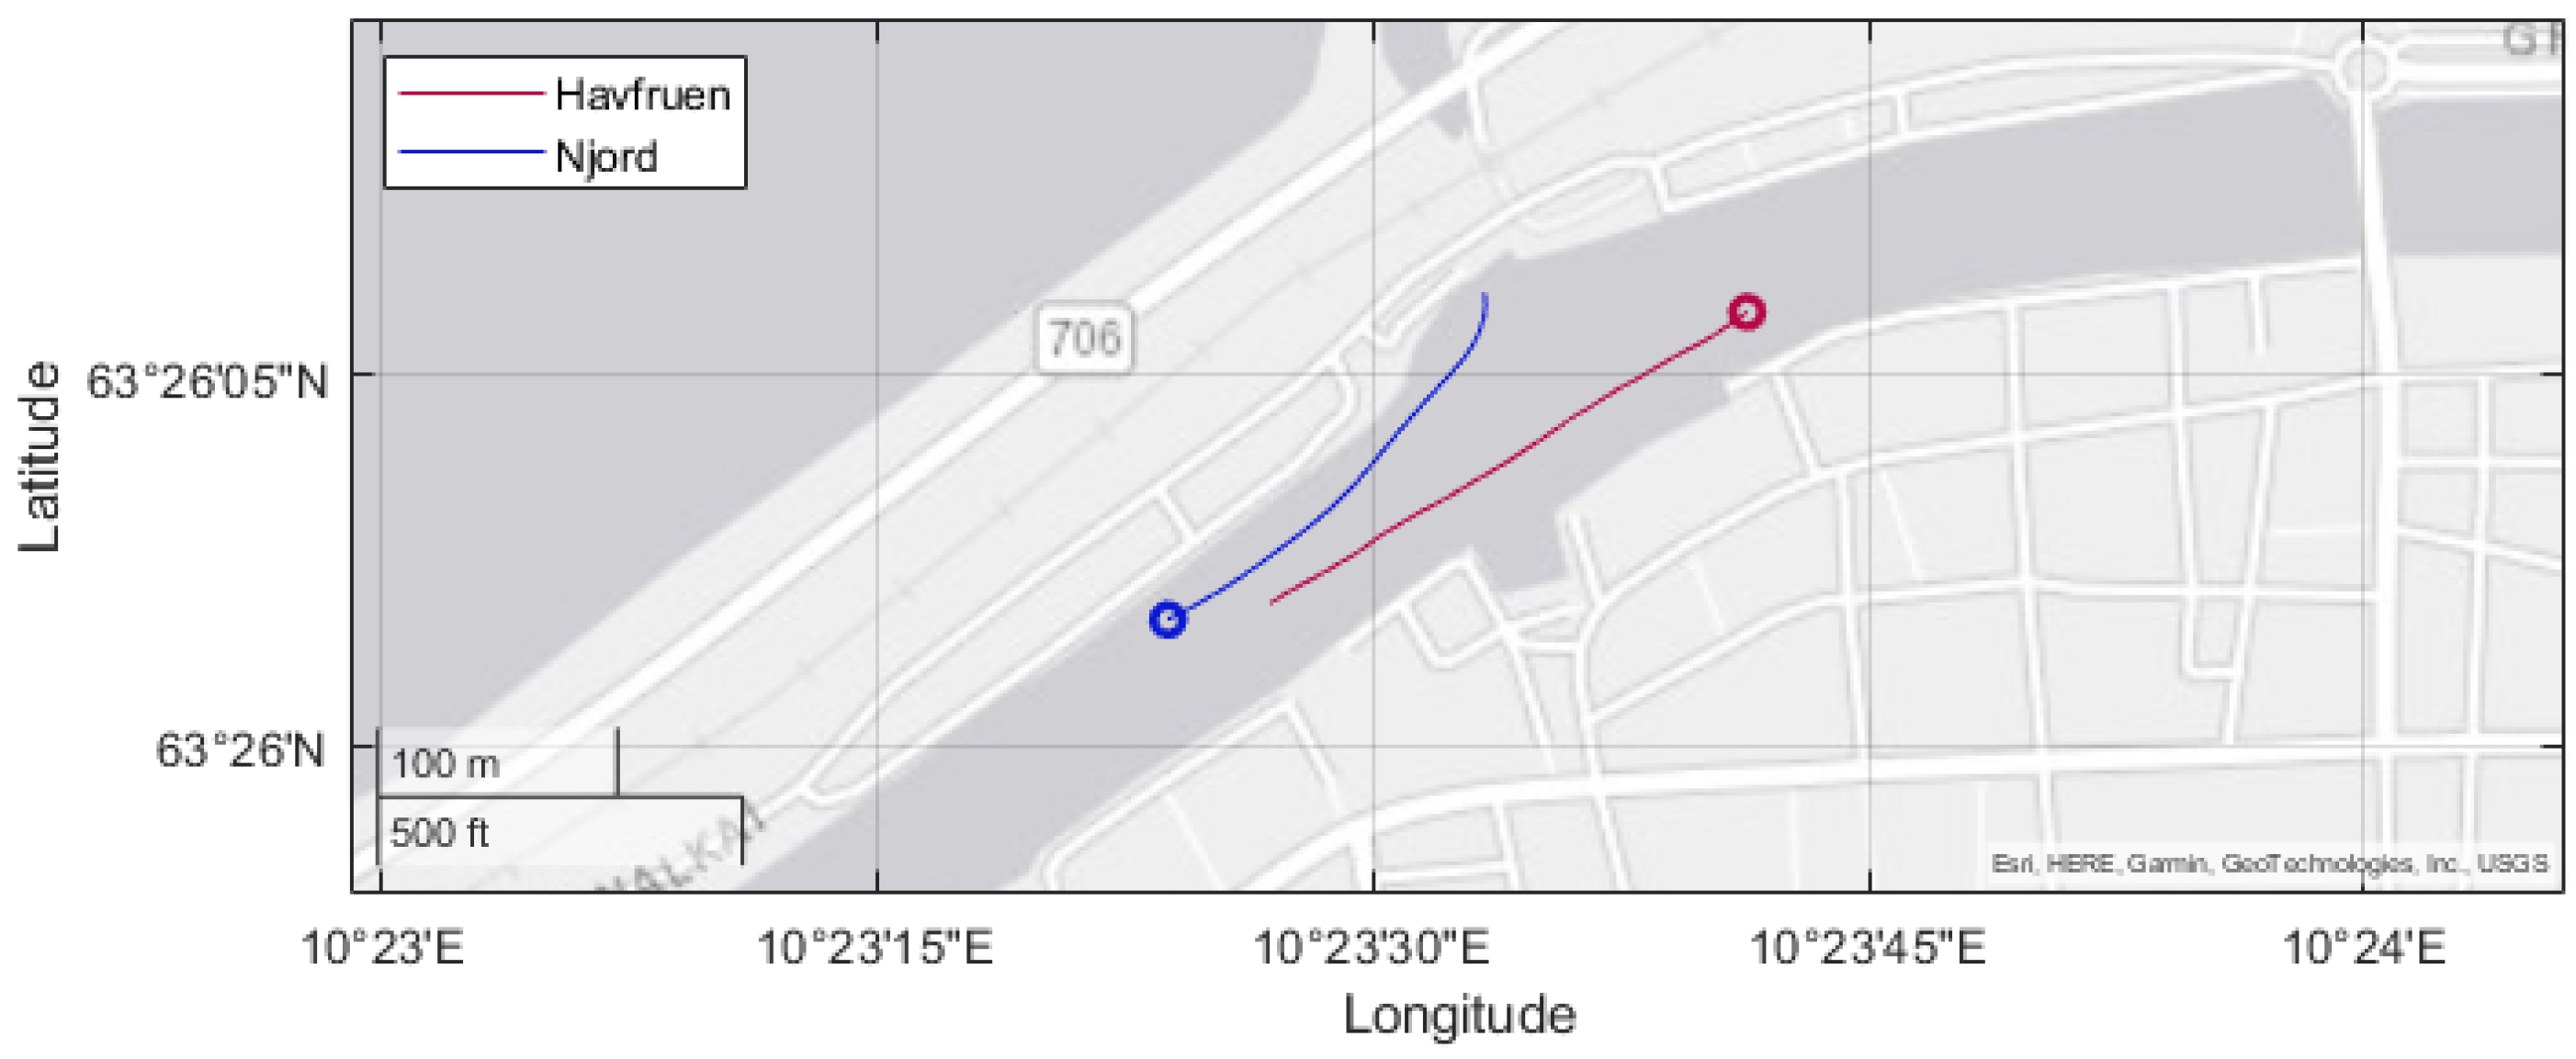
Scenario 8 is presumed as test case 1. It is a head-on encounter passing scenario (see Figure 12).
In this situation, the Njord vessel is assumed to be the own ship, whereas Havfruen is the target ship. The original path 1-A represents the real path. For the generated path 1-B, the OS traverses a cautious path. Here, that includes keeping a larger distance from the target ship when passing it and the land (static obstacle), as well as performing an obvious collision avoidance manoeuvre early in time. For the generated path 1-C, the OS follows a more incautious path in regard to distance to static obstacles (closer to the land), but still avoiding the TS and reaching the goal position. The generated path 1-D is similar to path C; however, this path is more incautious in regard to dynamic obstacles. Here, an incautious path is a path where the OS keeps its head-on direction towards the TS and performs a collision avoidance manoeuvre at the last moment, passing the TS with a small distance in between. This is an attempt to represent a potentially dangerous situation that could arise in a narrow channel.
5.2. Test Case 2
Scenario 9 in Gemini is chosen for test case 2. This is a situation where OS enters the channel from the direction under the bridge and avoids the TS navigating in the channel (see Figure 14).
5.3. Test Case 3
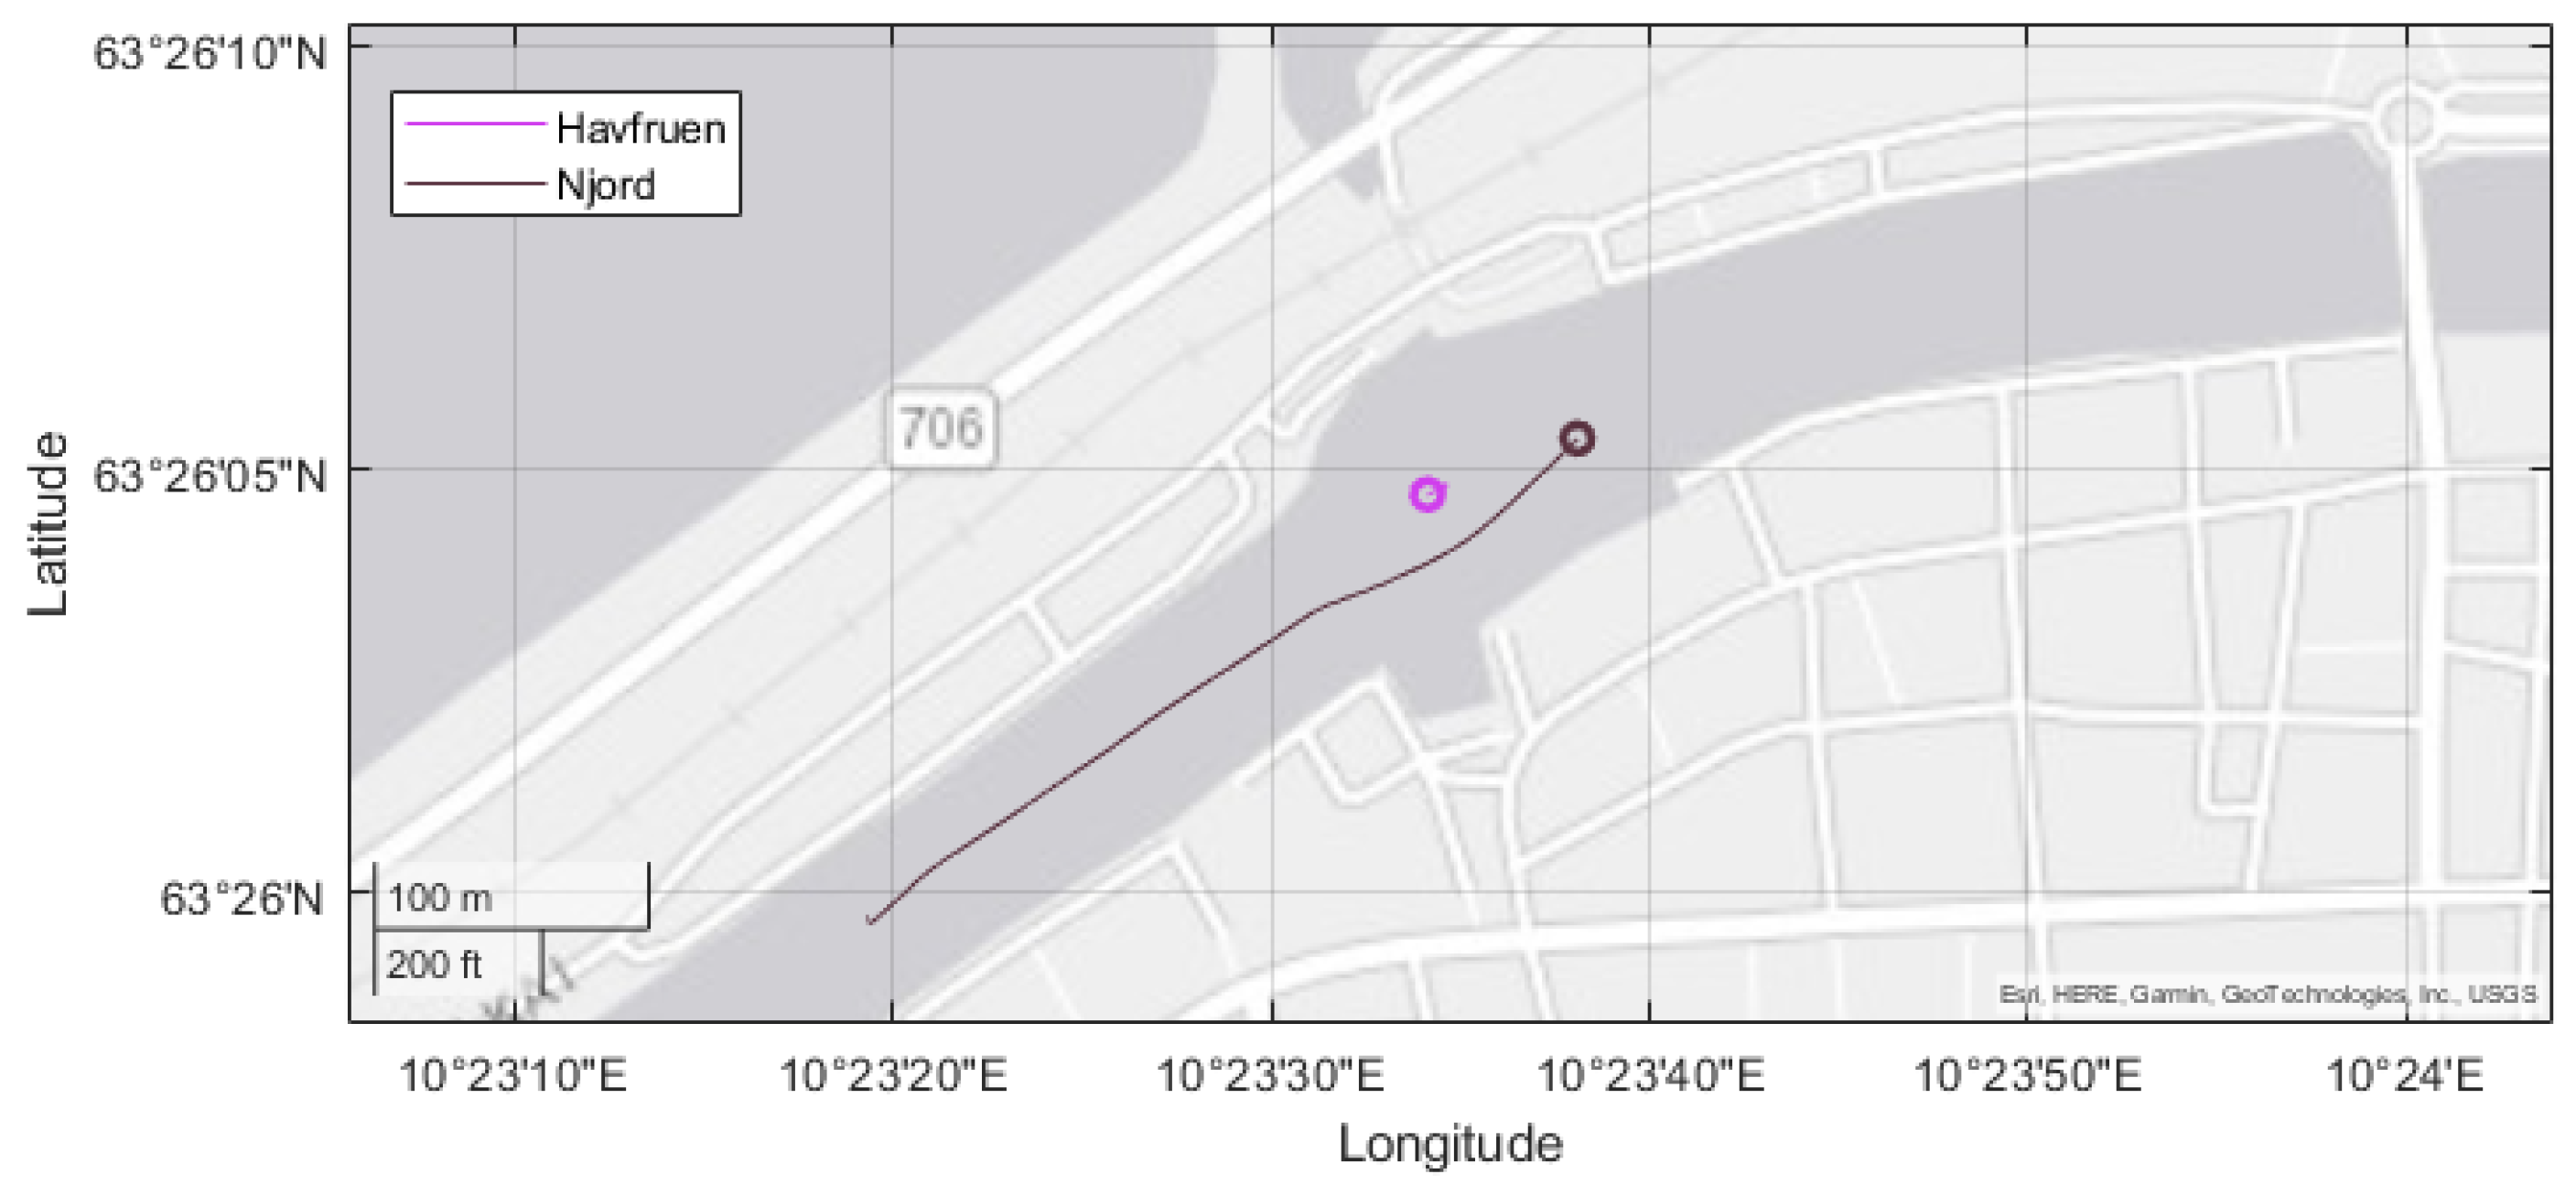
Finally, test case 3 is based on scenario 5 in Gemini. This head-on encounter scenario differs from the previous one for the reason that here TS mostly keeps its position static. Its motion is most probably only affected by the water movement (current). Its position still changes slightly, so the extended risk calculation method still considers it a dynamic obstacle that provides danger to the OS. Here, OS navigates in the channel and encounters an almost standing TS in a head-on situation (see Figure 16).
5.4. Results
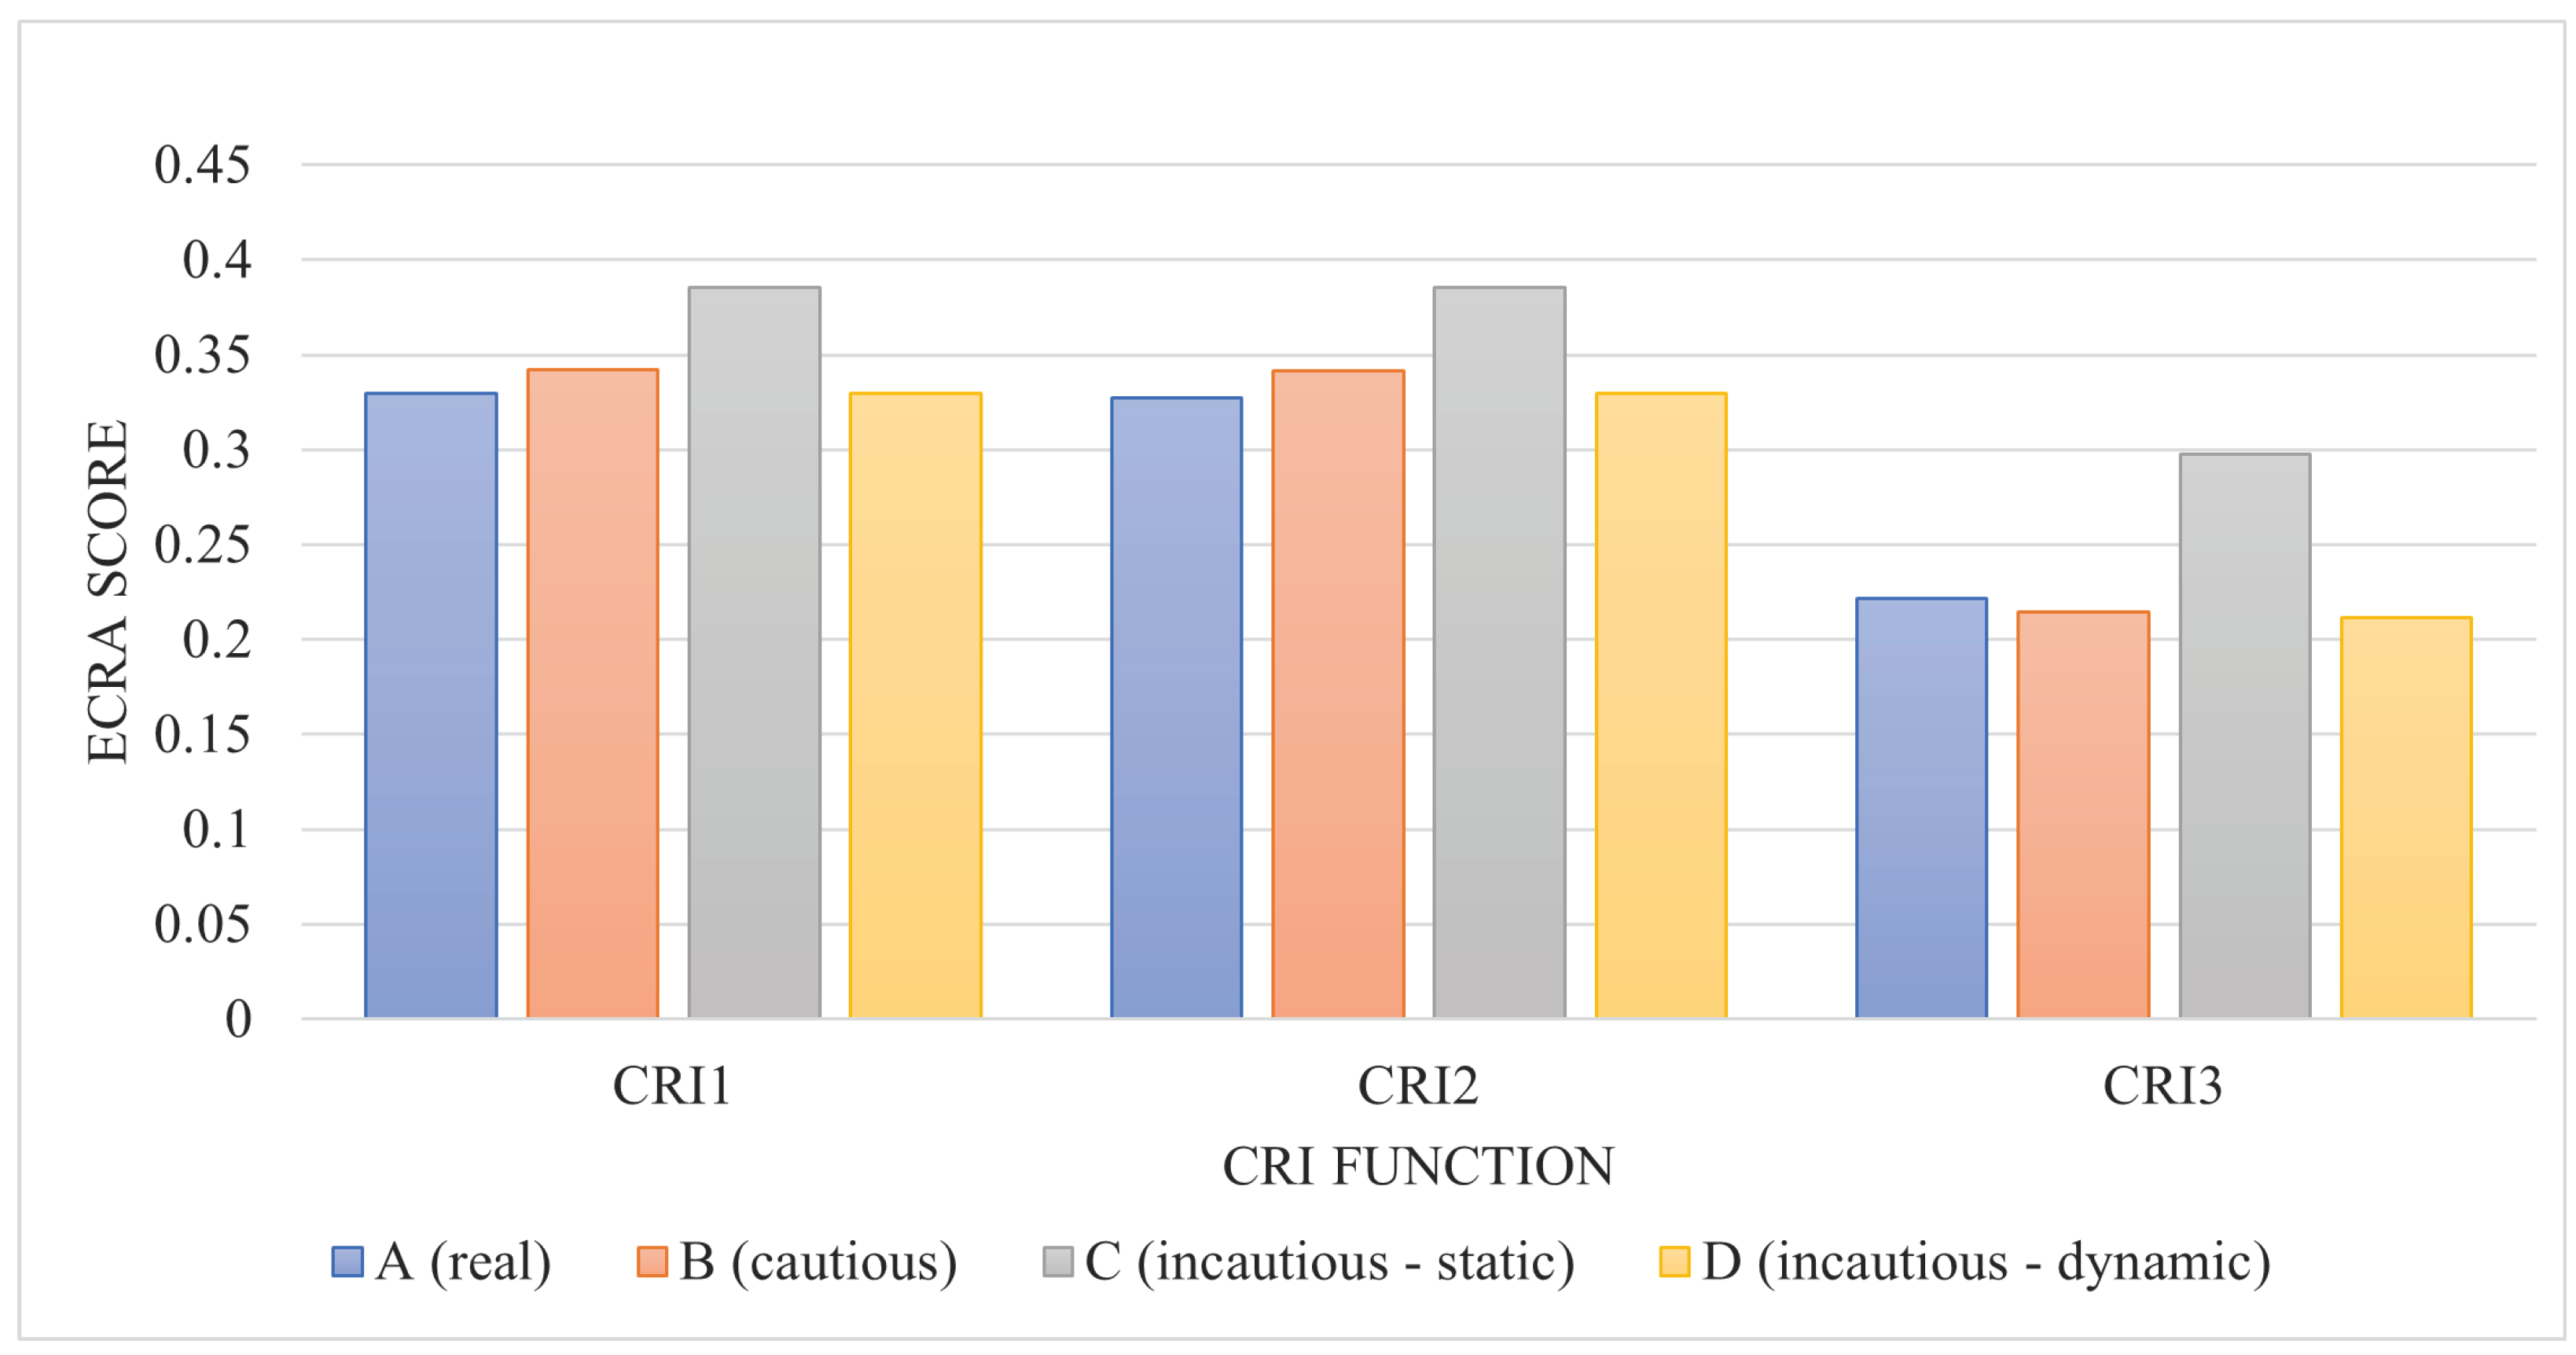
Simulation results are discussed focusing on two aspects: (i) ECRA scores of the generated cautious/incautious paths (B, C and D) compared to the original path (A), and (ii) comparison of ECRA scores when using different CRI functions. For the former aspect, deviation parameters and (%) for each path in all test cases were calculated, presuming the original path as the benchmark.
The results demonstrate that, in test cases 1 and 2, path B (cautious path) presents a decrease in the ECRA score (3.53% and 8.43%, respectively); however, in the third test case, path B risk has increased by 2.21%. This result highlights that an attempt to improve the safety of the planned path (when that is possible), in terms of collision with static and dynamic structures, leads to decreased ECRA score on the path according to the calculation method proposed in this article. However, the increase of the ECRA score for path 3-B could be attributed to several factors—difficulty in improving the original path when it is already cautious, the specifics of the three chosen CRI calculation methods, tuning of the method parameters and the specifics of the navigation situation in test case 3, to name a few.
Superior results are demonstrated for path C where the vessel avoids the TS by navigating closer to the static obstacles. Here, a significant increase in the ECRA score ( is 57.98%, 11.61% and 21.58% for setups 1, 2 and 3, respectively) is observed in all three test setups. This indicates that the proposed method responds well to the increased risk of grounding and stranding.
ECRA scores of path D in all three test cases show varying results. A slight improvement () is demonstrated in a head-on encounter scenario in test case 1. However, in test cases 2 and 3, the ECRA score has decreased by 7.08% and 0.88% compared to the original path. The simulation observations and results analysis indicate that in some cases when the dynamic risk factor has been increased (due to the more dangerous situation in terms of the TS), the static risk factor decreases, thus leading to a lower ECRA score.
The comparison of ECRA scores for different chosen CRI methods demonstrates that and provide similarly looking results for test cases 1 and 3. The similarity between test cases 1 and 3 is found in the type of direct head-on encounter scenarios. This could indicate that, for head-on encounter scenarios, when the ship headings are changing slightly, and respond similarly. However, in test case 2, no specific pattern is observed. A larger number of scenarios should be tested to provide clearer conclusions about the use of CRI functions.
6. Discussion
Simulation results reveal that the static risk component has a great impact on the ECRA score. The author speculates that this has led to a result that, in some cases, a theoretically incautious path demonstrated a decrease in the ECRA score, and opposite cases when a theoretically cautious path had a slight increase in the ECRA score. Another reason could be that the generated paths for each test setup were following simple principles described above of what a cautious/incautious path in different scenarios would look like. However, this research would benefit from validating these generated paths by a group of experts.
It is worth also discussing the interesting findings revealed when consulting with nautical experts. Based on the experts’ judgement, out of all the proposed risk factors, static risk has a higher importance than dynamic risk. An explanation could be that in Norway a large portion of the marine accidents are connected with ship grounding on the hard coastal rock in Norway. This type of risk is the “invisible danger”, as it is often difficult to foresee. In contrast, when two ships are navigating in close vicinity, both of them are responsible for taking actions to avoid a collision. Additionally, according to experts, weather and environmental conditions have a large impact on the ECRA score and this should be considered for future work. Another aspect that could be included as part of the dynamic risk is the ship type. Finally, the experts came to an agreement that the historic risk has the least impact on the ECRA score in the proposed method.
One limitation of this method could be that the test scenarios consider only two-vessel-encounter situations. How would the results change when dealing with multi-vessel collision avoidance? A solution here could be to adapt a vessel conflict ranking operator (VCRO) proposed by Zhang et al. [32], or an improved version of the method (NVCRO) [39]. This research has given rise to a few other ideas for improvement and questions. Tuning the fuzzy system parameters using an adaptive neuro-fuzzy inference system (ANFIS) might improve the calculation of the ECRA score. Another alternative would be to use other tuning methods, such as genetic algorithm (GA) or particle swarm optimisation (PSO) for tuning of the membership function parameters. Another question is, how does the navigation risk change for different navigation modes, e.g., (un)docking? The proposed method currently does not differ between navigation situations. Therefore, the ECRA score will be obviously higher when the vessel is (un)docking or navigating in a narrow pathway/channel, even though it is the intended action. However, in such case, the vessel and its planned path should not be penalised as much, as it is an intentional action and the CRA method should be more tolerant. The consultation with the nautical experts turned out to give additional insight into the problem. With this in mind, in the next stages of the simulator development, it would be useful to get feedback from nautical experts on the risk assessment decisions in various scenarios and for feedback on the generated scenarios. Finally, a question that has been around since the first stages of this research is, how fair is it to assess parameters of the path if the path planning/collision avoidance algorithm has made an uninformed choice when performing planning? This leads to an idea that the proposed CRA method could also be incorporated as part of these algorithms to improve their outcome from the safety perspective.
This research has opened several future research directions for improving the proposed method, such as:
- extending the fuzzy system with additional risk factors that assess environmental conditions, COLREGs, compliance with good seamanship, etc.;
- extending the ECRA method by including consequences (cost) of different incident outcomes (such statistics could be based on insurance company data);
- using nautical experts’ knowledge to receive feedback on how realistic generated scenarios in the simulator and the planned paths are;
- using nautical experts’ knowledge to identify conditions for improved near-miss collision detection in real-life scenarios.
In order to test the proposed method more extensively, a number of navigation algorithms should be tested in the simulator and their paths evaluated and compared.
7. Conclusions
In this article, the author proposed and tested an extended collision risk assessment method for evaluating autonomous ship navigation paths by combining several risk factors using a fuzzy inference system. The method considers static, dynamic and historic risk factors as part of the ECRA score. Here, the historic risk factor is based on the near-miss collision calculation from the historic AIS data. The calculated ECRA score for each path allows for comparing the safety of these paths and choosing the least risky one. The proposed method was validated in three test setups, and the results were analysed using the Gemini simulator combined with Matlab. The test simulation compared risk values of the original path, cautious path and two incautious paths. Results show that the proposed extended collision risk assessment method is able to assign higher risk values to more dangerous paths and lower risk values to safer paths. The method assigns special attention to collision risk with regard to static obstacles. On the other hand, one could argue that the extended CRA method does not consider the complete picture of the navigation situation. The author is confident enough to say that the proposed method is satisfactory for assessing collision risk in good weather conditions, and could be supplemented with multiple other risk factors in the future. Subsequent work could use the ESP prototype implemented in this paper for extensive testing and more rigorous studies. The Gemini simulator and ESP itself have great potential, opening doors for more extensive testing and experimentation, including tuning the existing methods or complementing them with new methods.
Funding
This work was supported in part by the Research Council of Norway through the Centre of Excellence funding scheme, Project Number 223254, AMOS (https://www.ntnu.edu/amos, accessed on 16 May 2022).
Institutional Review Board Statement
Not applicable.
Informed Consent Statement
Not applicable.
Data Availability Statement
Not applicable.
Acknowledgments
The author is grateful for the historic AIS data provided by the Norwegian Coastal Administration (https://www.kystverket.no/en (accessed on 31 March 2022)). Criticisms and discussions regarding the topics of this paper with Robin T. Bye and Ottar L. Osen (Norwegian University of Science and Technology) are greatly appreciated. Additionally, the author expresses a great appreciation to a team of experts—Andreas Madsen, Tron Resnes and Dag Rutledal—for sharing their marine experience.
Conflicts of Interest
The author declares that there is no conflict of interest.
References
- Norwegian Maritime Authority. Continued Focus on Safety Culture and Risk Understanding in 2022. 2022. Available online: https://www.sdir.no/en/shipping/accidents-and-safety/safety-investigations-and-reports/continued-focus-on-safety-culture-and-risk-understanding-in-2022 (accessed on 28 March 2022).
- Vagale, A.; Bye, R.T.; Oucheikh, R.; Osen, O.L.; Fossen, T.I. Path planning and collision avoidance for autonomous surface vehicles II: A comparative study of algorithms. J. Mar. Sci. Technol. 2021, 26, 1307–1323. [Google Scholar] [CrossRef]
- Vagale, A.; Bye, R.T.; Osen, O.L. Evaluation of Path Planning Algorithms of Autonomous Surface Vehicles Based on Safety and Collision Risk Assessment. In Proceedings of the OCEANS 2020 MTS/IEEE Global: Singapore—U.S. Gulf Coast, Biloxi, MS, USA, 5–30 October 2020; pp. 1–8. [Google Scholar] [CrossRef]
- Vagale, A.; Osen, O.L.; Brandsæter, A.; Hovden, C.; Kristiansen, H.T.; Bye, R.T. On the use of Maritime Training Simulators with Humans in The Loop for Understanding and Evaluating Algorithms for Autonomous Vessels. In Proceedings of the 4th International Conference on Maritime Autonomous Surface Ships (ICMASS), Singapore, 6–7 April 2022. [Google Scholar]
- Ozturk, U.; Cicek, K. Individual collision risk assessment in ship navigation: A systematic literature review. Ocean Eng. 2019, 180, 130–143. [Google Scholar] [CrossRef]
- Čorić, M.; Mandžuka, S.; Gudelj, A.; Lušić, Z. Quantitative ship collision frequency estimation models: A review. J. Mar. Sci. Eng. 2021, 9, 533. [Google Scholar] [CrossRef]
- Utne, I.B.; Rokseth, B.; Sørensen, A.J.; Vinnem, J.E. Towards supervisory risk control of autonomous ships. Reliab. Eng. Syst. Saf. 2020, 196, 106757. [Google Scholar] [CrossRef]
- Yu, Q.; Liu, K.; Yang, Z.; Wang, H.; Yang, Z. Geometrical risk evaluation of the collisions between ships and offshore installations using rule-based Bayesian reasoning. Reliab. Eng. Syst. Saf. 2021, 210, 107474. [Google Scholar] [CrossRef]
- Chang, C.H.; Kontovas, C.; Yu, Q.; Yang, Z. Risk assessment of the operations of maritime autonomous surface ships. Reliab. Eng. Syst. Saf. 2021, 207, 107324. [Google Scholar] [CrossRef]
- Goerlandt, F.; Montewka, J. Maritime transportation risk analysis: Review and analysis in light of some foundational issues. Reliab. Eng. Syst. Saf. 2015, 138, 115–134. [Google Scholar] [CrossRef]
- Stankiewicz, P.G.; Mullins, G.E. Improving Evaluation Methodology for Autonomous Surface Vessel COLREGS Compliance. In Proceedings of the OCEANS 2019, Marseille, France, 17–20 June 2019; pp. 1–7. [Google Scholar] [CrossRef]
- Gug, S.G.; Harshapriya, D.; Jeong, H.S. Maritime Collision Risk Analysis with Geographical Parameters in Busan Harbor. In Proceedings of the 14th ISOPE Pacific/Asia Offshore Mechanics Symposium, PACOMS 2020, Dalian, China, 22–25 November 2020; pp. 503–508. [Google Scholar]
- Zhou, J.; Ding, F.; Yang, J.; Pei, Z.; Wang, C.; Zhang, A. Navigation safety domain and collision risk index for decision support of collision avoidance of USVs. Int. J. Nav. Archit. Ocean. Eng. 2021, 13, 340–350. [Google Scholar] [CrossRef]
- Huang, Y.; Chen, L.; Chen, P.; Negenborn, R.R.; van Gelder, P. Ship collision avoidance methods: State-of-the-art. Saf. Sci. 2020, 121, 451–473. [Google Scholar] [CrossRef]
- Ha, J.; Roh, M.I.; Lee, H.W. Quantitative calculation method of the collision risk for collision avoidance in ship navigation using the CPA and ship domain. J. Comput. Des. Eng. 2021, 8, 894–909. [Google Scholar] [CrossRef]
- Gang, L.; Wang, Y.; Sun, Y.; Zhou, L.; Zhang, M. Estimation of vessel collision risk index based on support vector machine. Adv. Mech. Eng. 2016, 8, 1–10. [Google Scholar] [CrossRef] [Green Version]
- Kearon, J. Computer Programs for Collision Avoidance and Traffic Keeping; Academic Press: London, UK, 1977; pp. 229–242. [Google Scholar]
- Zhen, R.; Riveiro, M.; Jin, Y. A novel analytic framework of real-time multi-vessel collision risk assessment for maritime traffic surveillance. Ocean Eng. 2017, 145, 492–501. [Google Scholar] [CrossRef]
- Mou, J.M.; Tak, C.v.d.; Ligteringen, H. Study on collision avoidance in busy waterways by using AIS data. Ocean Eng. 2010, 37, 483–490. [Google Scholar] [CrossRef]
- Tam, C.; Bucknall, R. Collision risk assessment for ships. J. Mar. Sci. Technol. 2010, 15, 257–270. [Google Scholar] [CrossRef]
- Lisowski, J. Game control of moving objects. IFAC Proc. Vol. 2002, 35, 373–378. [Google Scholar] [CrossRef] [Green Version]
- Namgung, H.; Kim, J.S. Collision Risk Inference System for Maritime Autonomous Surface Ships Using COLREGs Rules Compliant Collision Avoidance. IEEE Access 2021, 9, 7823–7835. [Google Scholar] [CrossRef]
- Xu, X.; Geng, X.; Wen, Y. Modeling of Ship Collision Risk Index Based on Complex Plane and Its Realization. TransNav Int. J. Mar. Navig. Saf. Sea Transp. 2016, 10, 251–256. [Google Scholar] [CrossRef]
- Balmat, J.F.; Lafont, F.; Maifret, R.; Pessel, N. MAritime RISk Assessment (MARISA), a fuzzy approach to define an individual ship risk factor. Ocean Eng. 2009, 36, 1278–1286. [Google Scholar] [CrossRef]
- Ren, Y.; Mou, J.; Yan, Q.; Zhang, F. Study on Assessing Dynamic Risk of Ship Collision. In Proceedings of the 1st International Conference on Transportation Information and Safety (ICTIS), Wuhan, China, 30 June–2 July 2011; pp. 2751–2757. [Google Scholar] [CrossRef]
- Ahn, J.H.; Rhee, K.P.; You, Y.J. A study on the collision avoidance of a ship using neural networks and fuzzy logic. Appl. Ocean Res. 2012, 37, 162–173. [Google Scholar] [CrossRef]
- Bukhari, A.C.; Tusseyeva, I.; Lee, B.G.; Kim, Y.G. An intelligent real-time multi-vessel collision risk assessment system from VTS view point based on fuzzy inference system. Expert Syst. Appl. 2013, 40, 1220–1230. [Google Scholar] [CrossRef]
- Goerlandt, F.; Montewka, J.; Kuzmin, V.; Kujala, P. A risk-informed ship collision alert system: Framework and application. Saf. Sci. 2015, 77, 182–204. [Google Scholar] [CrossRef] [Green Version]
- Goerlandt, F.; Montewka, J.; Lammi, H.; Kujala, P. Analysis of near collisions in the Gulf of Finland. In Advances in Safety, Reliability and Risk Management; CRC Press: Boca Raton, FL, USA, 2012; pp. 2880–2886. [Google Scholar] [CrossRef]
- Mestl, T.; Tallakstad, K.T.; Castberg, R. Identifying and Analyzing Safety Critical Maneuvers from High Resolution AIS Data. TransNav Int. J. Mar. Navig. Saf. Sea Transp. 2016, 10, 69–77. [Google Scholar] [CrossRef] [Green Version]
- Grossmann, M. Collision Risk Assessment in Coastal Waters. Ph.D. Thesis, TU Delft, Delft, The Netherlands, 2019. [Google Scholar]
- Zhang, W.; Goerlandt, F.; Montewka, J.; Kujala, P. A method for detecting possible near miss ship collisions from AIS data. Oceans Eng. 2015, 107, 60–69. [Google Scholar] [CrossRef]
- Hagen, I.B.; Vassbotn, O.; Skogvold, M.; Johansen, T.A.; Brekke, E. Safety and COLREGS Evaluation for Marine Collision Avoidance Algorithms. Ocean. Eng. 2021; under review. [Google Scholar]
- Chen, Y.Y.; Ellis-Tiew, M.Z.; Chen, W.C.; Wang, C.Z. Fuzzy Risk Evaluation and Collision Avoidance Control of Unmanned Surface Vessels. Appl. Sci. 2021, 11, 6338. [Google Scholar] [CrossRef]
- Szlapczynski, R.; Szlapczynska, J. Review of ship safety domains: Models and applications. Ocean Eng. 2017, 145, 277–289. [Google Scholar] [CrossRef]
- Vasstein, K.; Brekke, E.F.; Mester, R.; Eide, E. Autoferry Gemini: A real-time simulation platform for electromagnetic radiation sensors on autonomous ships. IOP Conf. Ser. Mater. Sci. Eng. 2020, 929, 012032. [Google Scholar] [CrossRef]
- Kystverket. Automatic Identification System (AIS)|Kystverket. Available online: https://www.kystverket.no/en/navigation-and-monitoring/ais/ (accessed on 31 March 2022).
- Vasstein, K. A High Fidelity Digital twin Framework for Testing Exteroceptive Perception of Autonomous Vessels. Ph.D. Thesis, Norwegian University of Science and Technology, Trondheim, Norway, 2021. [Google Scholar]
- Zhang, W.; Feng, X.; Qi, Y.; Shu, F.; Zhang, Y.; Wang, Y. Towards a model of regional vessel near-miss collision risk assessment for open waters based on AIS data. J. Navig. 2019, 72, 1449–1468. [Google Scholar] [CrossRef]
Figure 1.
Flowchart of the extended collision risk assessment (ECRA) calculation for each path and corresponding methods used.
Figure 1.
Flowchart of the extended collision risk assessment (ECRA) calculation for each path and corresponding methods used.

Figure 2.
Representation of the area of lookout around the surface vessel and a static obstacle in the close vicinity.
Figure 2.
Representation of the area of lookout around the surface vessel and a static obstacle in the close vicinity.

Figure 3.
Geometric relation and motion parameters of two interacting ships—own ship (orange) and target ship (green). Idea adapted from Chen et al. [34].
Figure 3.
Geometric relation and motion parameters of two interacting ships—own ship (orange) and target ship (green). Idea adapted from Chen et al. [34].

Figure 4.
Structure of the evaluation simulator platform (ESP), adapted from Vagale et al. [3].
Figure 4.
Structure of the evaluation simulator platform (ESP), adapted from Vagale et al. [3].

Figure 5.
The own vessel navigates in a head-on encounter situation with another target vessel in the Trondheim channel. Screenshot from the Autoferry Gemini simulator.
Figure 5.
The own vessel navigates in a head-on encounter situation with another target vessel in the Trondheim channel. Screenshot from the Autoferry Gemini simulator.

Figure 6.
Architecture of the simulation framework used for ECRA calculation.

Figure 7.
Historic automatic identification system (AIS) data trajectories (after interpolation) of different vessels on one day, plotted on the geographic map in the Trondheim fjord area.
Figure 7.
Historic automatic identification system (AIS) data trajectories (after interpolation) of different vessels on one day, plotted on the geographic map in the Trondheim fjord area.

Figure 8.
Fuzzy inference process.

Figure 9.
Membership functions of the fuzzy inference system (FIS) of input static risk (left) and output risk value (right).
Figure 9.
Membership functions of the fuzzy inference system (FIS) of input static risk (left) and output risk value (right).

Figure 10.
Surface plot of the FIS based on the expert rule base, showing dependency of the individual risk on the dynamic and static risk inputs.
Figure 10.
Surface plot of the FIS based on the expert rule base, showing dependency of the individual risk on the dynamic and static risk inputs.

Figure 11.
Njord vessel in the Autoferry Gemini simulator.

Figure 12.
Test case 1—head-on passing encounter. The circle depicts the end position.

Figure 13.
A plot showing resulting ECRA scores for four scenarios of test case 1, using three different CRI methods.
Figure 13.
A plot showing resulting ECRA scores for four scenarios of test case 1, using three different CRI methods.

Figure 14.
Test case 2. The circle depicts the end position.

Figure 15.
A plot showing resulting ECRA scores for four scenarios of test case 2, using three different CRI methods.
Figure 15.
A plot showing resulting ECRA scores for four scenarios of test case 2, using three different CRI methods.

Figure 16.
Test scenario 5. The circle depicts the end position.

Figure 17.
A plot showing resulting ECRA scores for four scenarios of test case 3, using three different CRI methods.
Figure 17.
A plot showing resulting ECRA scores for four scenarios of test case 3, using three different CRI methods.


| Side | Relative Bearing () | a | b |
|---|---|---|---|
| Starboard | −112.5° ⩽ σ ⩽ 0° | 5 | 1 |
| Port | 0° < σ ⩽ 112.5° | 5 | 0.5 |
| Stern | otherwise | 0 | 0 |
Table 2.
Expert rule base of the output risk value based on nautical experts’ knowledge.
| () | () | () | ||||||||
|---|---|---|---|---|---|---|---|---|---|---|
| L | M | H | L | M | H | L | M | H | ||
| L | L | L | M | L | M | M | L | M | M | |
| M | M | M | H | M | M | H | M | M | H | |
| H | M | M | VH | M | H | VH | M | VH | VH | |
Table 3.
ECRA score in test case 1 for four own ship (OS) paths using three different collision risk index (CRI) methods.
Table 3.
ECRA score in test case 1 for four own ship (OS) paths using three different collision risk index (CRI) methods.
| ECRA Score | ||||||
|---|---|---|---|---|---|---|
| Path | CRI1 | CRI2 | CRI3 | μ | σ | σ (%) |
| 1-A | 0.3305 | 0.3308 | 0.2329 | 0.2981 | 0 | 0 |
| 1-B | 0.3234 | 0.3238 | 0.2154 | 0.2875 | −0.0105 | −3.53 |
| 1-C | 0.5262 | 0.5266 | 0.3599 | 0.4709 | 0.1728 | 57.98 |
| 1-D | 0.3435 | 0.3432 | 0.2412 | 0.3093 | 0.0112 | 3.77 |
Table 4.
ECRA scores in test case 2 for four proposed scenarios using three different CRI methods.
| ECRA Score | ||||||
|---|---|---|---|---|---|---|
| Path | CRI1 | CRI2 | CRI3 | μ | σ | σ (%) |
| 2-A | 0.4138 | 0.4062 | 0.4025 | 0.4075 | 0 | 0 |
| 2-B | 0.3864 | 0.3531 | 0.3800 | 0.3732 | −0.0343 | −8.43 |
| 2-C | 0.4969 | 0.4244 | 0.4431 | 0.4548 | 0.0473 | 11.61 |
| 2-D | 0.4186 | 0.3402 | 0.3772 | 0.3787 | −0.0288 | −7.08 |
Table 5.
ECRA scores in test case 3 for four proposed scenarios using three different CRI methods.
| ECRA Score | ||||||
|---|---|---|---|---|---|---|
| Path | CRI1 | CRI2 | CRI3 | μ | σ | σ (%) |
| 3-A | 0.3298 | 0.3274 | 0.2213 | 0.2928 | 0 | 0 |
| 3-B | 0.3419 | 0.3417 | 0.2143 | 0.2993 | 0.0065 | 2.21 |
| 3-C | 0.3855 | 0.3853 | 0.2973 | 0.3560 | 0.0632 | 21.58 |
| 3-D | 0.3297 | 0.3294 | 0.2117 | 0.2903 | −0.0026 | −0.88 |
Publisher’s Note: MDPI stays neutral with regard to jurisdictional claims in published maps and institutional affiliations. |
© 2022 by the author. Licensee MDPI, Basel, Switzerland. This article is an open access article distributed under the terms and conditions of the Creative Commons Attribution (CC BY) license (https://creativecommons.org/licenses/by/4.0/).
Share and Cite
MDPI and ACS Style
Vagale, A. Evaluation Simulator Platform for Extended Collision Risk of Autonomous Surface Vehicles. J. Mar. Sci. Eng. 2022, 10, 705. https://0-doi-org.brum.beds.ac.uk/10.3390/jmse10050705
AMA Style
Vagale A. Evaluation Simulator Platform for Extended Collision Risk of Autonomous Surface Vehicles. Journal of Marine Science and Engineering. 2022; 10(5):705. https://0-doi-org.brum.beds.ac.uk/10.3390/jmse10050705
Chicago/Turabian StyleVagale, Anete. 2022. "Evaluation Simulator Platform for Extended Collision Risk of Autonomous Surface Vehicles" Journal of Marine Science and Engineering 10, no. 5: 705. https://0-doi-org.brum.beds.ac.uk/10.3390/jmse10050705
Note that from the first issue of 2016, this journal uses article numbers instead of page numbers. See further details here.