Article

Social, Economic and Environmental Sustainability of Port Regions: MCDM Approach in Composite Index Creation

by
Jelena J. Stanković
1,*,
Ivana Marjanović
1,
Jason Papathanasiou
2 and
Saša Drezgić
3,*
1
Faculty of Economics, University of Niš, 18000 Niš, Serbia
2
Department of Business Administration, University of Macedonia, 54636 Thessaloniki, Greece
3
Faculty of Economics and Business, University of Rijeka, 51000 Rijeka, Croatia
*
Authors to whom correspondence should be addressed.
J. Mar. Sci. Eng. 2021, 9(1), 74; https://0-doi-org.brum.beds.ac.uk/10.3390/jmse9010074
Submission received: 14 December 2020 / Revised: 5 January 2021 / Accepted: 6 January 2021 / Published: 13 January 2021
(This article belongs to the Special Issue Maritime Transport and Its Impact on Regional Economic Development)

Abstract

:
Maritime transport and ports are among the most important linkages between global economies, handling more than 90% of internationally traded goods. Economic importance of maritime transport imposes significant implications on the social and environmental performance of port regions. The paper aims to create composite indices as relevant, scientific-based tools used in comparing and monitoring various aspects of sustainability across 37 sea port regions in seven countries on the European side of the Mediterranean, covering a five-year period from 2014 to 2018. The model encompasses Eurostat and OECD annual NUTS2 level data covering economic, social and environmental dimensions of sustainability. Two important indicators of maritime transport activity, maritime transport of freight and maritime transport of passengers, are included within the group of economic indicators. To create composite indices, the multicriteria decision making (MCDM) framework was used as an integrated approach of entropy in the weighting segment, and the Preference Ranking Organization METHod for Enrichment of Evaluations (PROMETHEE) as an aggregation method. The results highlight GDP per capita and population density as indicators of the greatest relative importance when it comes to port regions sustainability. The ranking results indicate that, despite the fact that Attica is the best ranked region in terms of overall sustainability, the largest number of top rated port regions are in Italy, Spain and France.

1. Introduction

International logistics chains largely depend on maritime transport. In recent years, there has been a significant increase in the volume of international maritime trade, driven by containerization and globalization. Maritime transport of goods represents a rather affordable and clean form of transport, and therefore, has primacy over road and air transport [1]. The growth of maritime traffic induces the growth and development of ports, which directly affects the economic development of port regions as well as employment. Until recently, the most noticeable economic impact of the port was the provision of a large number of jobs. However, with the development of containerization, there has been a reduction in employment in ports, although ports continue to contribute to the overall economy in other forms, primarily through the provision of efficient maritime transport [2].
The regional economic development of port regions is largely determined by the level of port development, since port activities have multiplier effects on the local, regional and national economy [3]. Recent decades have witnessed a significant growth in the global maritime economy, which plays a significant role in the socio-economic development of many regions around the world [4]. Economic growth from seaports can produce spill-over effects in neighbouring port regions and occasionally in neighbouring land areas [5,6,7]. Nevertheless, the growth of international maritime trade and port development, besides the positive impact on the economy, has significant negative impacts on the environment.
The traditional development of ports, in addition to favourable economic impacts, can, if not mitigated, have negative impacts on the environment. On the other hand, the impacts on society can be twofold, both positive and negative, since due to favourable economic conditions a large number of people come to port regions, which can lead to the increased urbanization and consequently to the reduction in the quality of life [8].
The increase in maritime transport has conditioned the need to adapt and expand the port infrastructure, which has led to environmental degradation [9]. Given that it is estimated that almost 70% of ship emissions occur within 400 km of land [10], maritime transport can significantly contribute to the degradation of air quality in maritime regions [11]. It can, therefore, be concluded that the environmental impacts of maritime transport are not negligible, although when emissions per kilometre are observed, maritime transport can be considered environmentally friendly [12]. Given that the basic elements of the maritime sector are ships and ports, and ships are mostly outside the reach of national regulators because they sail in international waters, ports play a key role in the transition of the maritime sector towards sustainability [13]. The key premise of achieving sustainable growth is achieving socio-economic development while maintaining the base of natural resources, with much attention recently paid to marine resources through the Blue Growth initiative and the inclusion of sustainable ocean and coastal development as one of the goals of sustainable development [14]. Achieving sustainable development in port regions through strategies aimed at reducing environmental impact has direct and indirect impacts [15]: directly, it will contribute to environmental sustainability and economic progress, while indirectly it will contribute to social sustainability through improving the quality of life.
Given that sustainability issues of port regions are multidimensional, it is challenging for policymakers to act on sustainability data from a large number of heterogeneous data sources. Consequently, they need an integrated indicator that covers all aspects of sustainability which can be provided by composite sustainability index. The application of a single composite sustainability index enables comparison among entities, timely analysis of trends and facilitates decision making [16].
With regard to the foregoing and motivated by the lack of research on a comprehensive assessment of the sustainability of port regions, this paper uses a multicriteria approach to identify trends in achieving the sustainability of port regions, in order to provide adequate recommendations for implementing strategies and policies in this area. Methodologically, the paper is focused on improvements of the frequent shortcomings in composite index creation—compensatory effect due to the equal importance of all indicators in the index, or lack of objectivity due to subjective determination of relative importance of indicators.
The paper provides a comprehensive assessment of the sustainability of port regions and consists of the following sections: The second section provides an extensive review of the literature related to sustainability issues and the importance of creating a composite index. The third section provides an overview of data and methodology on the basis of which the sustainability index of port regions will be created, while the fourth section is dedicated to the results of analysis and discussion. The concluding remarks are offered in the last section.

2. Literature Review

The issue of sustainable development became particularly important in the second half of the twentieth century, with an initial focus on researching the impact of economic growth on environmental sustainability [17]. Nowadays, the concept of sustainability is a multidimensional problem that encompasses the economic, environmental and social dimension of sustainability. Sustainable development can be defined as ”development that meets the needs of the present without compromising the ability of future generations to meet their own needs” [18]. Research in the field of sustainable development has led to the development of the concept of sustainable transport. Sustainable transport has both a narrow and a broader definition [19]: the focus of the narrow definition is on environmental issues and resource depletion, while the broader definition includes social and economic welfare in addition to environmental ones. On the one hand, the transport sector can be presented as the bloodstream of global economies, which enables the flow of people, goods and resources; facilitates everyday life; and promotes economic development, while on the other hand, it contributes to side effects that threaten the very foundation on which society depends [20]. Given the major economic, environmental and social impacts of transport, it is essential that this sector embraces the concept of sustainability [21]. For a detailed review of sustainable transport research see work of Zhao and associates [19].
Concerns about sustainable development in port regions have grown in recent decades, leading to a large amount of academic literature related to various aspects of the region’s sustainability. On the other hand, there is a lack of methodological contributions to measuring the sustainability of port regions that would encompass all aspects of sustainability (economic, environmental and social aspects). There are a significant number of papers considering some aspects of sustainability. Numerous authors have discussed the impact of maritime transport on economic growth [22,23,24,25], environmental performance [15,26,27,28,29,30,31,32] and social sustainability [33,34].
Recognizing the need to achieve the sustainability of port regions is reflected in the Blue Growth concept, which aims to achieve social inclusion and provide employment for the population of port regions while maintaining marine resource base [14]. Additionally, the concept of Blue Growth recognizes maritime economic activities as key drivers of employment and economic growth and represents a long-term strategy aimed to provide the sustainable growth of the maritime sector [35]. However, increasing environmental awareness leads to increasing pressures on ports to comply with regulatory and social requirements, with the achievement of environmental sustainability being considered a significant factor in port competitiveness [36]. Consequently, the main purpose of obtaining sustainable development of ports and port regions is to uncover a reliable, environmentally and socially acceptable approach to port management, while attaining economic benefits [12].
The sustainable development of port regions is characterized by a complex decision-making process and the involvement of several actors, bearing in mind that this is a complex problem involving economic, environmental and social issues. The implementation of sustainable development faces multiple challenges in terms of organizational and technical barriers, policy framework and socio-economic acceptance [37]. Adequate decision-making in such conditions requires adequate support reflected in an appropriate performance measurement system. Most existing maritime decision-making tools focus on cost indicators or operational performance indicators [15].
However, bearing in mind that the issue of sustainability of port regions is a multidimensional problem, it is necessary to create a synthetic measure that will cover all aspects of sustainability. Among the basic goals of regional development is greater sustainability of regions while respecting economic, environmental and social dimensions. Nevertheless, measuring progress towards sustainability is difficult due to the lack of appropriate measures to quantify stated progress. For this purpose, composite sustainability indices can be used as one of the most important tools for assessing progress towards defined sustainability goals [38]. Although several authors have pointed to the need of using composite sustainability indices, their use is relatively rare, especially at the regional level [39]. Particularly noticeable is the lack of research and practice that would offer the authorities in port regions adequate management instruments that could assess, monitor and measure the effects of the implementation of sustainability strategies [40].
Composite indices are aggregate indices of individual indicators that are grouped and weighted using an appropriate quantitatively based methodology and serve to measure multidimensional concepts [41]. The use of composite indices has become popular especially due to the fact that they provide a comprehensive assessment of a complex phenomenon, and can be used both for informing the public and for making decisions since they are much easier to interpret and analyse compared to analysing indicators that quantify individual dimensions of the observed phenomenon. When creating composite indexes, a hierarchical structure is created where at the very bottom there are individual indicators that are grouped into dimensions, which are then grouped and form a composite index. The convenience of applying composite indices is that they enable comparability of different entities, and making adequate, quantitatively based decisions. Creating composite indices is a multiphase process [41]. In the first phase, data collection and creation of a database that is hierarchically structured is performed, where for each indicator, a definition and description of the unit of measurement, the dimension in which it fits, as well as the source of information should be given. In the second phase, the weights of indicators and dimensions are calculated, while in the third phase, the indicators are grouped into dimensions, and then the dimensions into a composite index using the appropriate aggregation technique.
The application of composite indices in sustainability assessments has certain advantages [30]. First, composite indices make it possible to track progress and identify trends and changes over time. Second, composite indices show in a simple way the success of policies and strategies at different levels, both regional and national. Third, composite indices make it possible to identify a worsening situation and represent a kind of early warning system. Fourth, composite sustainability indices can be a tool to raise public awareness of the importance of achieving sustainable growth. Composite indices are traditionally used in situations when it is necessary to obtain aggregate information from a set of individual indicators grouped into different levels of the hierarchy [42]. Since the sustainability of port regions is a problem that can be defined through a three-dimensional perspective (economic, environmental and social), the application of composite indicators for sustainability assessment enables better information and facilitates decision-making of all stakeholders. The composite index can be a valuable tool for evaluating trends in the overall sustainability performance of port regions, in terms of determining progress or deterioration of sustainability over time [16]. Several authors have proposed the application of composite indicators to assess the sustainability of port regions [35,43].
Bearing in mind the above, it can be noted that a large number of individual indicators that measure different dimensions and are characterized by different units of measurement is inherent in sustainability studies, and measuring sustainability is a problem that exceeds the individual’s ability to adequately quantify sustainability and conduct informed decision making. In such situations, the application of multicriteria methods is preferred [44]. Therefore, the main goal of this paper is to create an index of sustainability of port regions using the methods of multicriteria analysis.

3. Data and Methodology

This section details the data and methods used in compiling the sustainability index of port regions. To create composite sustainability index for port regions, a new decision-making framework based on the entropy weight method and PROMETHEE approach was proposed and applied to annual NUTS2 level data.

3.1. Description of the Dataset

Achieving the sustainability of port regions implies the simultaneous achievement of the goals of each of the three pillars of sustainability. The goal of environmental sustainability is to minimize the negative impacts caused by port activities, and the goal of social sustainability is to improve the quality of life of people in port regions by providing higher employment, providing better educational opportunities and better living standards, while the goal of economic sustainability is improving economic performance [12].
Consequently, indicators included in the issues of assessing the sustainability of port regions were selected on the basis of a comprehensive review of the literature, where the selection of indicators was also conditioned by the availability of data. Based on the data taken from the Eurostat database [45] and the OECD [46] database, the hierarchical structure of the model was established and presented in Figure 1.
Economic dimension refers to indicators that represent economic performance of the region and include the data related to the maritime transport activity, regional GDP per capita, employment and unemployment data and economic activity data. Social dimension includes data related to the demographic and educational characteristics of the region, while the environmental dimension refers to air pollution.
The model included all relevant and available on an annual basis data from the Eurostat and OECD databases. In addition to the above, data on poverty and social exclusion generated through the SILC survey would be considered relevant for the assessment of social sustainability. However, these data were not collected in a multiyear series for all observed regions, and were, therefore, excluded from the model. In addition, when it comes to the environmental dimension of sustainability, data on generated and collected waste are certainly relevant, but as these indicators are available at the NUTS2 level only as biennial data, they were also omitted from the model.

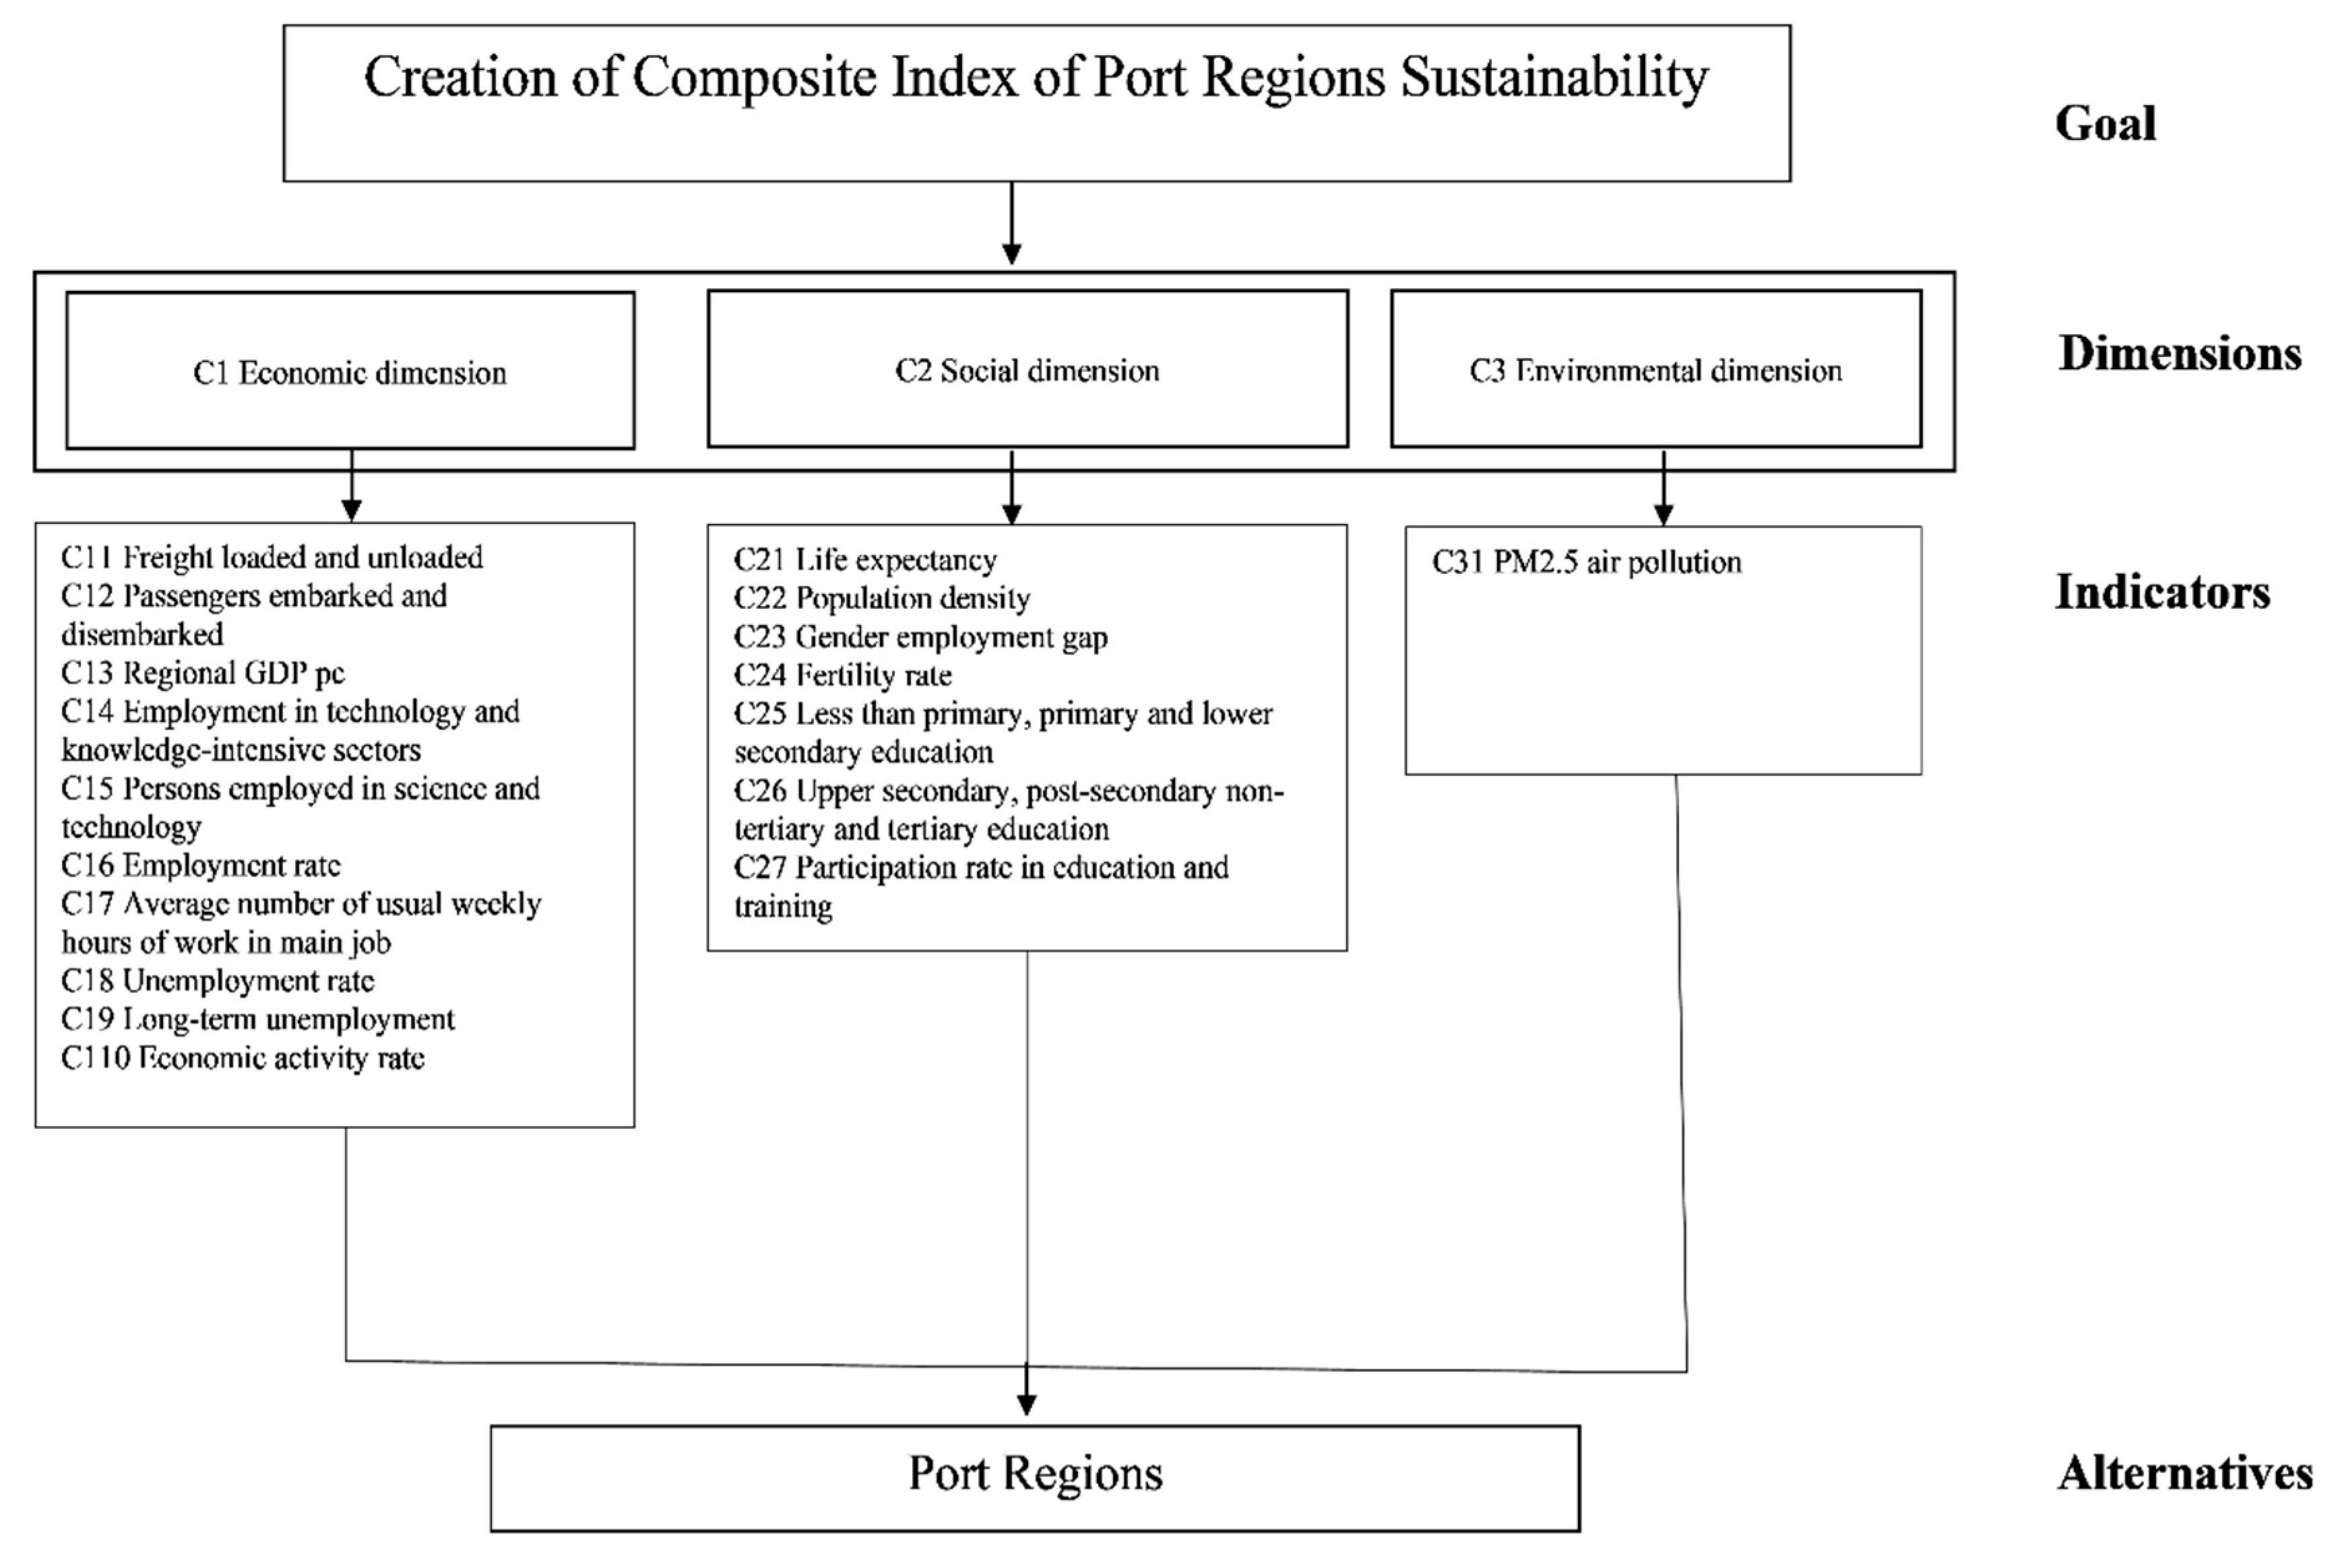
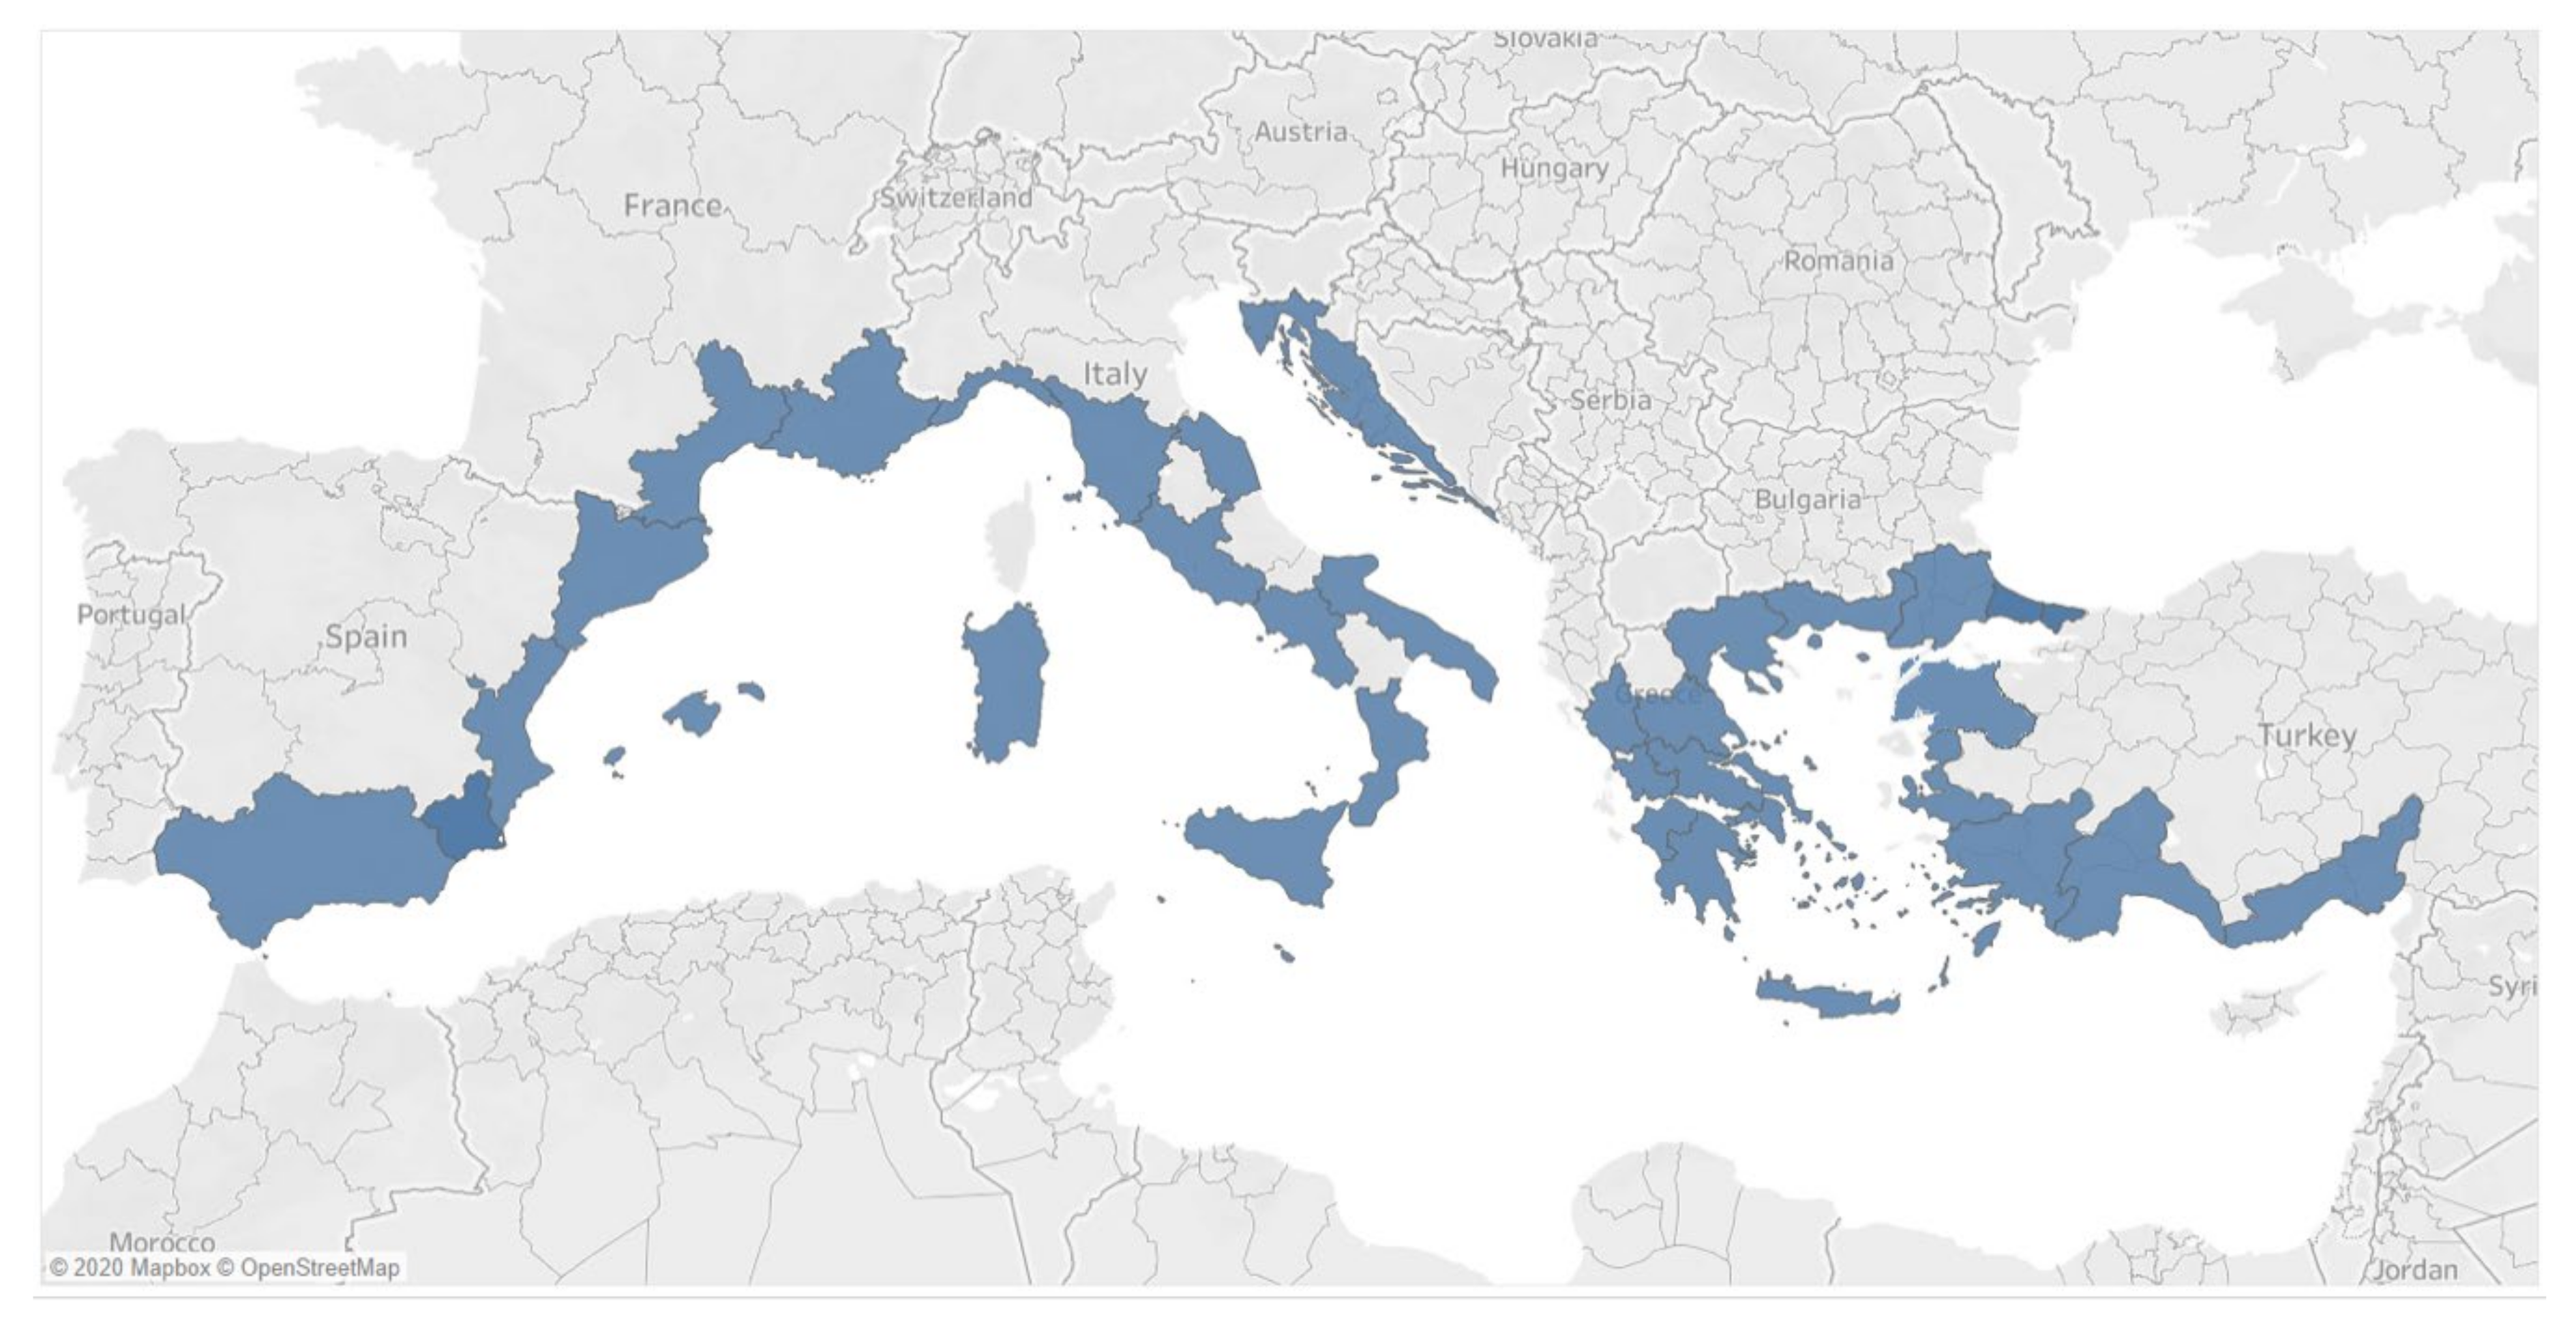
3.2. Description of the Alternatives

The research covers the port regions of the European part of the Mediterranean, a total of thirty-seven areas that correspond to the NUTS2 classification, and each of them was considered as an alternative in the model.
All observed regions are from seven countries (Figure 2): Greece, Croatia, Italy, France, Spain, Malta and Turkey. Due to the unavailability of data, the port regions of Slovenia, Cyprus and Portugal were not considered. Lack of available data is a reason to not include in analysis port regions in non-EU countries such as Albania and Montenegro.Additionally, the data included in the model were not available for all port regions in countries listed above, so the total number of port regions considered in Greece is ten, in Spain seven, in France two, in Croatia one, in Italy nine and in Malta one, while the number of analysed port regions in Turkey is seven.

3.3. Determination of Criteria Weights

Determining the appropriate weight for each criterion is among the main points in multicriteria methods [47]. There are a number of methods for determining the relative significance of the criteria, and the entropy method is applied in this paper. Entropy is used as a measure of uneven distribution, disturbance, degree of dependence or complexity of a system [48]. The essence of the Entropy method is to determine the uncertainty in information. It represents an objective method of determining weights and is defined as a measure of the degree of disorder of the system [49]. The entropy method is a typical diversity-based weighting method that calculates attribute weights based on the diversity of attribute data among alternatives and requires only objective data to calculate weights [50]. The advantage of the entropy method is its simplicity and the absence of decision makers, since data on the subjective preferences of decision makers are not required to determine the weight.
To explain the process of weight determination in the entropy method, the set of m objects and n criteria for each object is considered [48]. The entropy of the jth criterion is defined as follows:
H j = k i = 1 m f i j ln f i j ,           i = 1 , 2 , m , j = 1 , 2 , n ,
where k = 1 ln m , and f i j = x i j i = 1 m x i j , while x i j represents the value of jth criterion for ith port region. The lower the value of entropy, the higher the value of the relative significance of the criterion, and vice versa. Further, the relative significance of the jth criterion is defined as follows:
w j = 1 H j j = 1 n ( 1 H j )

3.4. PROMETHEE Method

Sustainability assessment in any area can be observed through a multicriteria decision-making process. Evaluating the degree of sustainability and making adequate decisions require the support of multicriteria analysis tools [51]. The application of multicriteria analysis in sustainability assessments can be seen in numerous papers and various fields [51,52,53,54,55,56]. All these studies confirmed the feasibility and success of multicriteria analysis in sustainability evaluation. Among the many multicriteria methods, Preference Ranking Organization Method for Enrichment of Evaluations (PROMETHEE) is becoming increasingly popular due to its simplicity and ease of understanding [57]. The PROMETHEE method belongs to the family of outranking methods. It was first introduced by Brans [58] and further developed by Brans and Vincke [59].
The following prerequisites must be met for the application of the PROMETHEE method [53,60]: (i) the degree of difference in performance between the two alternatives must be taken into account; (ii) since the comparison is made on a pairwise basis, the scale of the criteria is irrelevant; (iii) as a result of comparing two alternatives, three situations may arise: one alternative is preferred over the other, the alternatives are incomparable or the alternatives are indifferent; (iv) the method must be easily understood by decision makers; and (v) weights must be assigned in a flexible manner. There are several advantages of the PROMETHEE method [61]: (i) it can simultaneously deal with quantitative and qualitative criteria; (ii) it represents a user-friendly outranking method; (iii) it is flexible when defining preference/indifference thresholds for criteria; (iv) it is applicable in various fields.
Over time, a large number of variants of the PROMETHEE method have been developed, and PROMETHEE II is applied in this paper. The decision maker must provide two types of information in order to implement the PROMETHEE II method [62]: relative importance and preference function for each criterion. The computational procedure of PROMETHEE II is based on several steps [59,63]. In order to formulate the decision-making problem, a set of alternatives A = {a1 ... am} and a set of criteria G = {g1 ... gn} is considered.
Step 1. Determine the preference of an alternative ai over an alternative aj for each criterion gk
d k a i , a j = g k a i g k a j ,
where g k a i represents the value of criterion gk concerning the ith alternative, while g k a j , represents the value of criterion gk concerning the jth alternative.
Step 2. Selection of the preference function Pk (usual criterion, U-shape criterion, V-shape criterion, level criterion, V-shape with indifference criterion and the Gaussian criterion). For the sake of simplicity in this study, the usual preference function is used, due to its simplicity, as well as the fact that it does not require the involvement of decision makers.
P k a i , a j = P k d k a i , a j ,
0 P k a i , a j 1
Depending on the selected preference function, the decision maker may be asked to define additional parameters related to the threshold values, specifically, the values that express preference and indifference threshold. If the difference between the alternatives is less than the indifference threshold, then neither alternative is preferred, and if the difference between alternatives a i and a j is greater than the preference threshold d k a i , a j , then action a j is preferable to action a i [64].
Step 3. Calculation of the global preference index π a i , a j . It represents a weighted sum of all preferences   P k a i , a j , wherein 𝑤k is the relative importance of the jth criterion.
π a i , a j = k = 1 j P k d k a i , a j · w k ,
w k 0 ,   k = 1 j w k = 1 ,
Step 4. Calculation of the outranking flows of each alternative, where φ+ and φ denote the positive flow score and the negative flow score, respectively.
φ + a i = 1 n 1 x ϵ A π a i , x ,
φ a i = 1 n 1 x ϵ A π x , a i ,
The positive flow score indicates the global preference of the alternative a i compared to all other alternatives, with the alternative being better if the value of the positive flow result is higher. Negative flow score expresses global weakness of the alternative a i compared to all other alternatives, and the lower the value of the negative flow score is, the better the alternative is [64].
Step 5. Calculation of the net outranking flows, based on which the ranking of alternatives is determined:
φ a i = φ + a i φ + a i

4. Results

As a result of the analysis, on the one hand, there are the weight coefficients of the indicators determined by the entropy method, while on the other hand, there are the sustainability indices of port regions obtained using the PROMETHEE method.

4.1. Indicator Weighting

Table 1 shows the weights of all dimensions, as well as the weights of each of the indicators within the dimensions. The indicators’ weights were obtained by applying Equation (2), while the dimensions’ weights were determined as the sum of the individual weights of the indicators within the dimensions. Through the weight review, it is pointed out that the most important indicators are regional GDP per capita as an economic dimension of sustainability, and population density, which is within the social dimension of sustainability.
The weighting results designate which indicators have a dominant role in the composite index and to the greatest extent influence the value of the created composite index. Based on the obtained weighting coefficients, it is clear that GDP per capita and population density have the greatest influence on the composite sustainability index of port regions. This research result provides an information basis for decision making to policy makers at the local level, which should be aimed at stimulating a favourable business environment that leads to GDP growth, but also the generation of human capital, through a larger number of inhabitants living in the observed port region. Additionally, indicators related to the activity of maritime passenger and cargo traffic are of great importance in the composite sustainability index of maritime regions. Such a result indicates the economic importance of maritime transport in these regions. Furthermore, the policy for the development of maritime passenger traffic creates facilities and infrastructure within the port region, which also affects the quality of life of the population. Therefore, in addition to the direct usefulness of the research results related to the definition and creation of local economic policies, indirect benefits can be observed through the effects of these policies on the economy and the population.

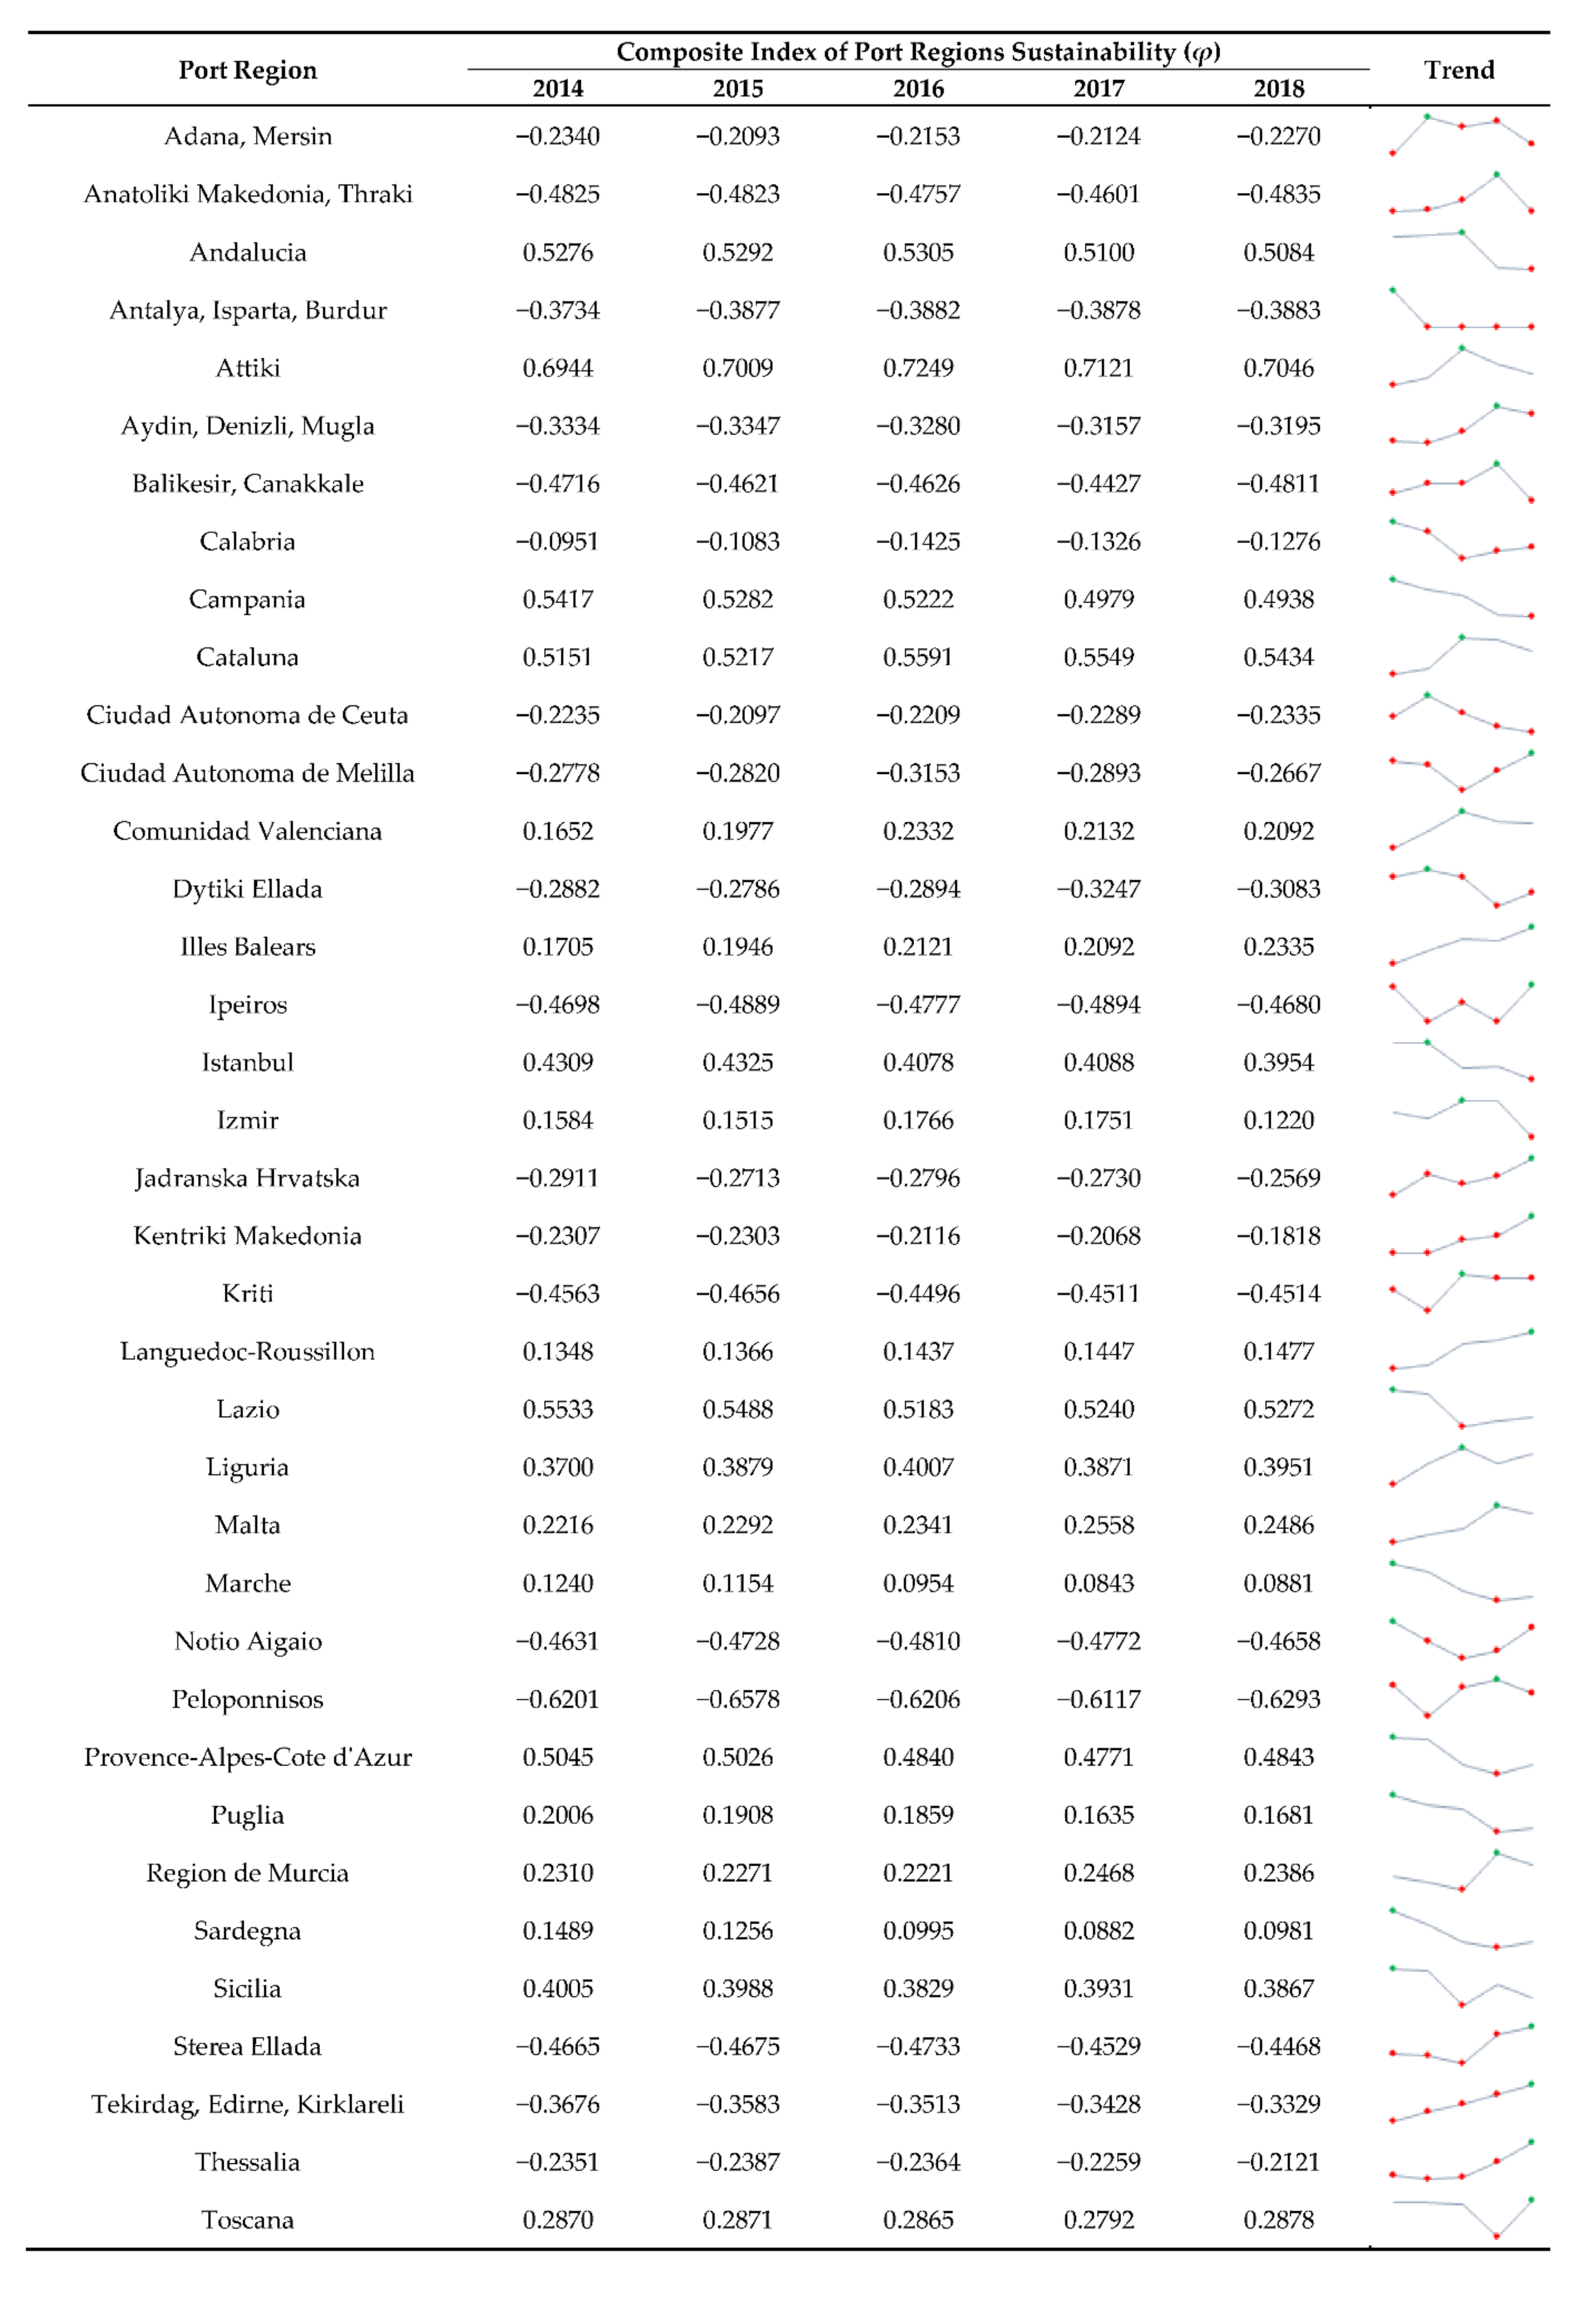
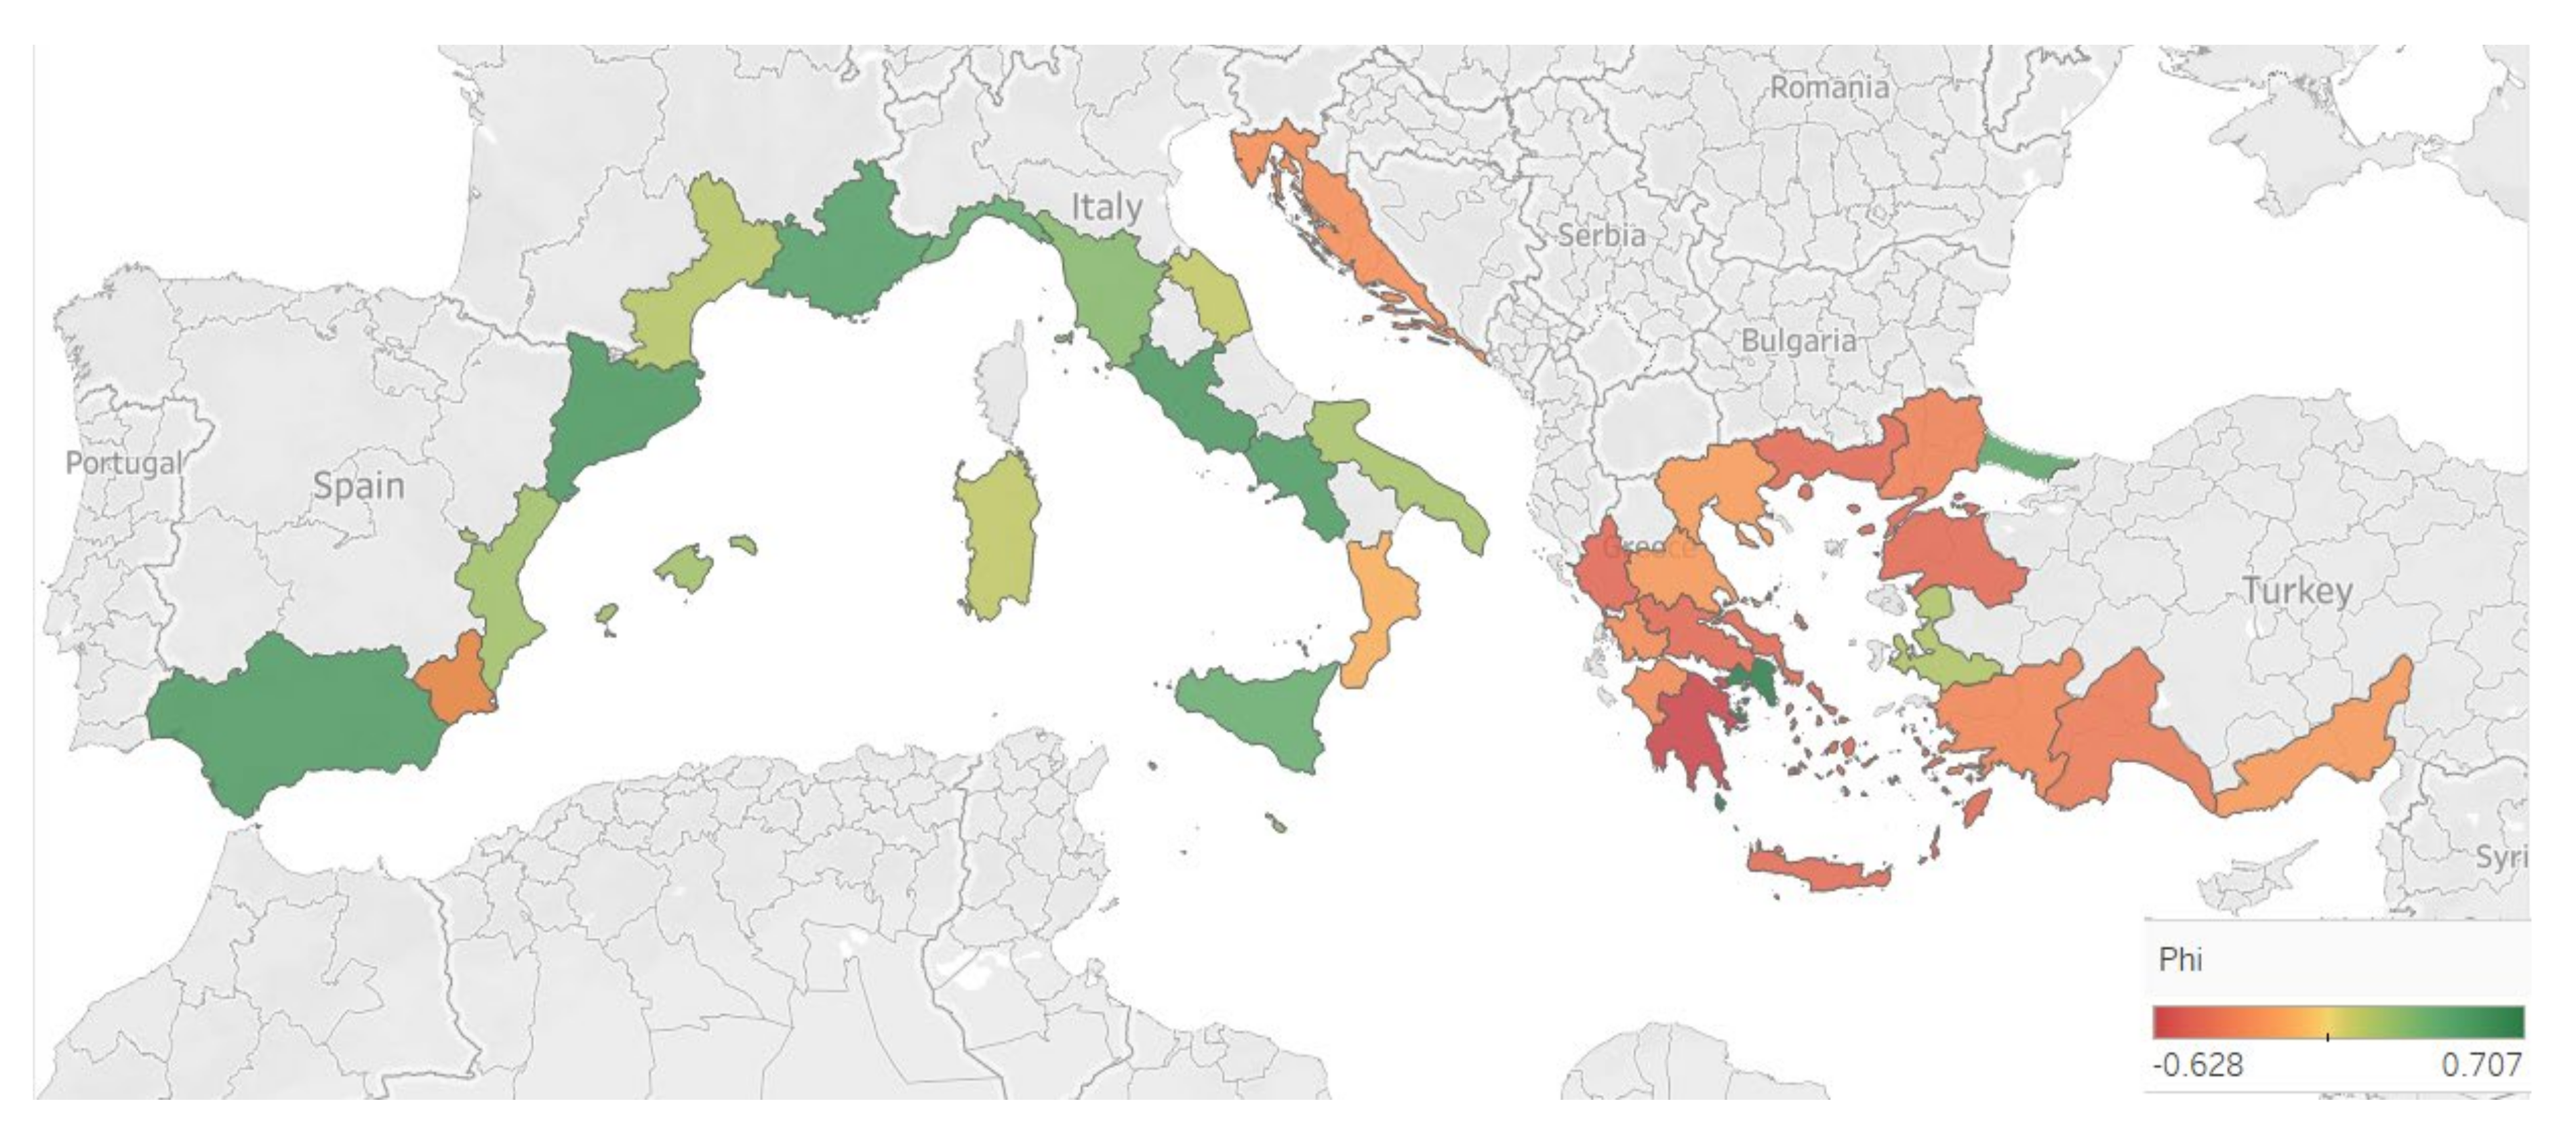
4.2. Port Sustainability Indices

The ranking results generated using PROMETHEE II methods, in individual years from the observation period, as well as the trend of the net outranking flow values ( φ ) are given in Figure 3. The obtained value of the net outranking flow represents the composite index of port region sustainability.
The presented results clearly indicate that in the observed period there were no significant differences in the indicators of sustainability of port regions included in the research. Positive net outranking flow is related to preferred sustainability of the port region, indicating that the indicators of these port regions have a greater positive flow (global preference of port region indicators compering to the other from the sample), with regard to the negative flow (global weakness of port region indicators compering to the other from the sample). The highest level of sustainability in the entire period was shown by Attica (Greece), where the net flow ranged from 0.6944 to 0.7249, followed by regions mostly from Italy and Spain such as Campania, Lazio, Sicilia, Sardinia, Toscana, Puglia, Marche, Catalonia, Andalusia and Valencian Community. Positive net outranking flow in all observed years was also recorded in the four regions in France and Turkey such as Provence-Alpes-Côte d’Azur, Languedoc-Roussillon, Istanbul and Izmir, as well as in Malta. The ranking results are primarily useful to the scientific community and policy makers, because they indicate the existence of disparities in the development and sustainability of the European part of the Mediterranean port regions. This conclusion on the use of results can be applied to policy makers at the national level, in countries within which there are large disparities in development between port regions, such as Greece and Turkey. Furthermore, this may also apply to decision makers within the European Union, in order to reduce regional disparities of similar and geographically related port regions in different EU countries.
Overall ranking results are provided in Table 2.
The interpretation of the cumulative results does not differ much from the interpretation of individual years in the observed period, because there are no significant fluctuations in values by years. A total of nineteen of the thirty-seven analysed regions showed preferred composite sustainability indices, which include indicators of all three relevant dimensions—economic, social and environmental (ranked 1 to 19 in Table 2). On the other hand, as many as eighteen observed regions showed a negative net output flow, which indicates their insufficient sustainability (ranked 20 to 37 in Table 2). Most of these regions are located in Greece and Turkey. In addition to the above, Calabria (Italy) and Adriatic Croatia also showed undesirable sustainability results.

5. Discussion

The model developed in paper research in order to preform sustainability assessment of Mediterranean port regions was constructed considering the fact that sustainability is a complex and multidimensional issue, the evaluation of which requires a specific kind of index, obtained through aggregations of individual variables [65]. Thus, the proposed model contains 31 indicators covering three dimensions of sustainability—economic, sociological and environmental. The similar theoretical concept was proposed by Sislian and associates [66] based on a complete review of the literature on port sustainability, who recommend addressing the assessment issues globally and from a three-dimensional perspective: economic, social and environmental. Di Vaio and associates [40] conducted the assessment of Italian port regions including in the analysis managerial key performance indicators (KPIs), and by applying the Balanced Scorecard model, the results provided the inter-organizational relationships between shipping lines and developing environmentally sustainable and energy efficient ports. The first segment of the methodology for assessing the sustainability of port regions involves the weight determination of each of these indicators, within the composite index that is being created. The two indicators of the greatest importance in the composite index are GDP per capita and population density, as representatives of the economic and sociological dimensions. If the significance of the indicators within each of the dimensions is observed (Table 1), it can be noticed that the values of relative weights within the economic dimension are the highest (0.6550), followed by social indicators (0.3293), while the lowest relative significance refers to the environmental indicator included in the model (0.0157). Logic of the weight determination is based on the knowledge that entropy is actually a measure of system disorder and that a more orderly system means higher entropy. Since the weighting coefficients are obtained by subtracting the entropy values from one, it can be concluded that the higher weight of the specific indicator in this model indicates higher disparities between port regions regarding the observed indicator. Based on the results of the research, it can be concluded that among the observed port regions, the largest disparities still occur in terms of economic indicators. The indicators referring to maritime transportation Freight loaded and unloaded and Passengers embarked and disembarked are of great importance in the model for assessing the sustainability of port regions, and their weighting coefficients are above the average of the group of indicators that belong to the economic dimension. The importance of the indicator related to the transport of passengers is greater (0.1323), which can be related to the fact that maritime tourism creates demand for specific infrastructure in the region (roads, urban facilities, shopping centers, entertainment facilities, etc.), which is primarily intended for residents of the port region, and then for passengers in maritime transportation, where cruise passengers are most often present [67].
By using the sensitivity analysing tool (walking weights), the possible increase or decrease in the weights value that will not change the provided ranking results is calculated (Table 3). As the indicator related to the ecological dimension is less important in relation to the average values of indicators from the economic and social dimension, it is interesting to point out that increasing the relative importance of this indicator to 0.0213 will not affect the change of rank obtained using integrated Entropy-PROMETHEE approach.
Sensitivity analysis was also performed in relation to the change in the choice of the preference function, and it was found that the choice of another preference function leads to a moderate rank reversal. The most significant change in rank was observed if the linear preference function was applied (where the value of the Spearman’s rank correlation coefficient between the ranks determined by applying the usual preference function and the linear preference function was 0.786), while the smallest change in the order of alternatives was detected when the Gaussian preference function was selected (the value of the Spearman’s rank correlation coefficient in this case was 0.997).
Further research will be focused on assessing the efficiency of port regions, linking economic and social efficiency and their impact on environmental indicators within the observed region, using three-stage DEA method.
Finally, spatial visualisation of the results of the sustainability assessment of port regions is given in Figure 4. Figure 4 clearly indicates that sustainable port regions showing preferred sustainability indicators are concentrated in the western part of the European side of the Mediterranean. These are mainly the regions of Italy, Spain and France. In addition to the above, in the eastern part of the European side of the Mediterranean, port regions that have good composite indices of sustainability are Attica, Istanbul and Izmir.

6. Conclusions

Maritime transport is among the most important drivers of the development of port regions of the Mediterranean Sea, both economically and socially. The socio-economic development of port regions is stimulated by passenger and freight flows, which at the same time ensure the spatial cohesion of all parts of port regions, connecting insular and continental parts of the region [68]. However, maritime transport also affects environmental degradation. Therefore, the issue of sustainable development of port regions is important, which would include both the social and economic dimensions of sustainability, as well as the environmental dimension of sustainability.
The composite sustainability index enables completely transparent measurement of the sustainability of port regions as well as monitoring sustainability trends in order to take timely actions. According to González Laxe and associates [41], contemporary literature is mainly focused on assessment of some partial sustainability aspects as economic and environmental dimensions, while no global synthetic indices have been proposed to measure port sustainability. In order to fill the literature gap, Gonzaález Laxe and associates [42] proposed the methodology for creating a complex measure of sustainability that including economic, social, institutional and environmental indicators and implemented it in assessing 16 port regions in Spain, through the weighted average of Z-scores calculated for the total number of 11 indicators, i.e., 24 sub-indicators. In methodological terms, the contribution of this paper above the state of the art is in the proposed MCDM approach which creates a composite index through the aggregate Entropy-PROMETHEE method, which includes a much larger number of indicators, and at the same time, it is possible to compare port regions outside the national framework. By applying entropy, the relative importance of indicators in the model is determined, which excludes the compensatory effect of less important indicators on the final result, and at the same time enables that weight determination is not general but tailor made for observed port regions in a given time period.
The advantage of applying composite sustainability indices is that they allow overall comparisons between port regions, which is not possible using various indicators as individual measures of sustainability through several of its dimensions. In addition to the methodological improvement of the creation of composite indices in this area, the paper also contributed through the comparison of the sustainability of port regions and beyond national frameworks, through the coverage of 37 regions in seven Mediterranean countries. The economic dimension is of the greatest importance in assessing the sustainability of port regions, because it is in economic indicators (GDP per capita) that the largest disparities among port regions occur. In addition to economic, social dimensions, specifically the indicator related to population density is of great importance in the sustainability of port regions (indirectly, it also has economic significance, through the human capital of the region).
The limitations of research and generated results refer primarily to the missing data related to poverty and social exclusion, as well as waste management indicators, which are certainly important for assessing the sustainability of port regions. Finally, further research guidelines are towards assessing the efficiency of port regions, as a compatible and related analysis, which would complement the ranking results and sustainability assessments given in this paper. In addition, further research can be directed towards determining the sustainability of port regions across Europe, in order to obtain a comprehensive overview of the sustainability of European port regions.

Author Contributions

Conceptualization, J.J.S.; resources, I.M. and S.D.; methodology, J.J.S., I.M. and J.P.; database curation, I.M. and J.J.S.; software and formal analysis, J.P.; validation and supervision, J.J.S.; writing—original draft preparation, J.J.S., I.M., J.P. and S.D.; visualization, I.M.; funding acquisition, S.D.; writing—review and editing J.J.S., I.M., J.P. and S.D. All authors have read and agreed to the published version of the manuscript.

Funding

The research in this paper was conducted within the framework of activities on bilateral cooperation project “Researching capacity for implementation of smart cities as basis for sustainable urban development” financed by Ministry of education, science and technological development of Republic of Serbia and Ministry of science and education of Republic of Croatia and has been supported by University of Rijeka under the project “Pametni gradovi u funkciji razvoja nacionalnog gospodarstva” (uniri-drustv-18-255-1424).

Institutional Review Board Statement

Not applicable.

Informed Consent Statement

Not applicable.

Data Availability Statement

The data presented in this study are openly available in https://ec.europa.eu/eurostat/web/regions/data/database reference number [45] and https://stats.oecd.org/Index.aspx?DataSetCode=REGION_DEMOGR reference number [46].

Acknowledgments

The research in this paper was conducted within the framework of activities on bilateral cooperation project “Researching capacity for implementation of smart cities as basis for sustainable urban development” financed by Ministry of education, science and technological development of Republic of Serbia and Ministry of science and education of Republic of Croatia and has been supported by University of Rijeka under the project “Pametni gradovi u funkciji razvoja nacionalnog gospodarstva” (uniri-drustv-18-255-1424).

Conflicts of Interest

The authors declare no conflict of interest.

References

  1. Grewal, D.; Haugstetter, H. Capturing and sharing knowledge in supply chains in the maritime transport sector: Critical issues. Marit. Policy Manag. 2007, 34, 169–183. [Google Scholar] [CrossRef]
  2. Munim, Z.H.; Schramm, H.-J. The impacts of port infrastructure and logistics performance on economic growth: The mediating role of seaborne trade. J. Shipp. Trade 2018, 3, 1. [Google Scholar] [CrossRef] [Green Version]
  3. Song, L.; Mi, J. Port infrastructure and regional economic growth in China: A Granger causality analysis. Marit. Policy Manag. 2016, 43, 456–468. [Google Scholar] [CrossRef]
  4. Yu, Z.; Di, Q. The coordination between maritime economies and marine carrying capacity and their spatiotemporal evolution in the cities of the Bohai rim in China. Ecol. Model. 2020, 438, 109192. [Google Scholar] [CrossRef]
  5. Han, F.; Wang, D.; Li, B. Spillover Effects of Ports and Logistics Development on Economic Power: Evidence from the Chinese BTH Regions. Sustainability 2019, 11, 4316. [Google Scholar] [CrossRef] [Green Version]
  6. Bottasso, A.; Conti, M.; Ferrari, C.; Tei, A. Ports and regional development: A spatial analysis on a panel of European regions. Transp. Res. Part A Policy Pr. 2014, 65, 44–55. [Google Scholar] [CrossRef]
  7. Deng, P.; Lu, S.; Xiao, H. Evaluation of the relevance measure between ports and regional economy using structural equation modeling. Transp. Policy 2013, 27, 123–133. [Google Scholar] [CrossRef]
  8. Schipper, C.; Vreugdenhil, H.; de Jong, M. A sustainability assessment of ports and port-city plans: Comparing ambitions with achievements. Transp. Res. Part D Transp. Environ. 2017, 57, 84–111. [Google Scholar] [CrossRef]
  9. Yang, Y.-C.; Chen, S.-L. Determinants of global logistics hub ports: Comparison of the port development policies of Taiwan, Korea, and Japan. Transp. Policy 2016, 45, 179–189. [Google Scholar] [CrossRef]
  10. Corbett, J.J.; Winebrake, J.J.; Green, E.H.; Kasibhatla, P.; Eyring, V.; Lauer, A. Mortality from Ship Emissions: A Global Assessment. Environ. Sci. Technol. 2007, 41, 8512–8518. [Google Scholar] [CrossRef]
  11. Viana, M.; Hammingh, P.; Colette, A.; Querol, X.; Degraeuwe, B.; de Vlieger, I.; van Aardenne, J. Impact of maritime transport emissions on coastal air quality in Europe. Atmos. Environ. 2014, 90, 96–105. [Google Scholar] [CrossRef]
  12. Lim, S.; Pettit, S.; Abouarghoub, W.; Beresford, A. Port sustainability and performance: A systematic literature review. Transp. Res. Part D Transp. Environ. 2019, 72, 47–64. [Google Scholar] [CrossRef]
  13. Bjerkan, K.Y.; Seter, H. Reviewing tools and technologies for sustainable ports: Does research enable decision making in ports? Transp. Res. Part D Transp. Environ. 2019, 72, 243–260. [Google Scholar] [CrossRef]
  14. Rickels, W.; Weigand, C.; Grasse, P.; Schmidt, J.; Voss, R. Does the European Union achieve comprehensive blue growth? Progress of EU coastal states in the Baltic and North Sea, and the Atlantic Ocean against sustainable development goal 14. Mar. Policy 2019, 106, 103515. [Google Scholar] [CrossRef]
  15. Mansouri, S.A.; Lee, H.; Aluko, O. Multi-objective decision support to enhance environmental sustainability in maritime shipping: A review and future directions. Transp. Res. Part E Logist. Transp. Rev. 2015, 78, 3–18. [Google Scholar] [CrossRef]
  16. Široka, M.; Piličić, S.; Milošević, T.; LaCalle, I.; Traven, L. A novel approach for assessing the ports’ environmental impacts in real time—The IoT based port environmental index. Ecol. Indic. 2021, 120, 106949. [Google Scholar] [CrossRef]
  17. Wołek, M.; Wolański, M.; Bartłomiejczyk, M.; Wyszomirski, O.; Grzelec, K.; Hebel, K. Ensuring sustainable development of urban public transport: A case study of the trolleybus system in Gdynia and Sopot (Poland). J. Clean. Prod. 2021, 279, 123807. [Google Scholar] [CrossRef]
  18. World Commission on Environment and Development. Our Common Future; The Brundtland Report; Oxford University Press: Oxford, UK, 1987. [Google Scholar]
  19. Zhao, X.; Ke, Y.; Zuo, J.; Xiong, W.; Wu, P. Evaluation of sustainable transport research in 2000–2019. J. Clean. Prod. 2020, 256, 120404. [Google Scholar] [CrossRef]
  20. Robèrt, K.-H.; Borén, S.; Ny, H.; Broman, G. A strategic approach to sustainable transport system development—Part 1: Attempting a generic community planning process model. J. Clean. Prod. 2017, 140, 53–61. [Google Scholar] [CrossRef]
  21. Reisi, M.; Sabri, S.; Agunbiade, M.; Rajabifard, A.; Chen, Y.; Kalantari, M.; Keshtiarast, A.; Li, Y. Transport sustainability indicators for an enhanced urban analytics data infrastructure. Sustain. Cities Soc. 2020, 59, 102095. [Google Scholar] [CrossRef]
  22. López-Bermúdez, B.; Freire-Seoane, M.J.; Nieves-Martínez, D.J. Port efficiency in Argentina from 2012 to 2017: An ally for sustained economic growth. Util. Policy 2019, 61, 100976. [Google Scholar] [CrossRef]
  23. Cong, L.-Z.; Zhang, D.; Wang, M.-L.; Xu, H.-F.; Li, L. The role of ports in the economic development of port cities: Panel evidence from China. Transp. Policy 2020, 90, 13–21. [Google Scholar] [CrossRef]
  24. Song, L.; van Geenhuizen, M. Port infrastructure investment and regional economic growth in China: Panel evidence in port regions and provinces. Transp. Policy 2014, 36, 173–183. [Google Scholar] [CrossRef]
  25. Mudronja, G.; Jugović, A.; Škalamera-Alilović, D. Research and development and economic growth: EU port regions. Proc. Rij. Sch. Econ. 2019, 37, 587–602. [Google Scholar] [CrossRef]
  26. Carrera-Gómez, G.; Coto-Millan, P.; Domenech, J.; Inglada, V.; Gonzélez, M.; Castanedo-Galán, J. The Ecological Footprint of Ports: A Sustainability Indicator. Transp. Res. Rec. J. Transp. Res. Board 2006, 1963, 71–75. [Google Scholar] [CrossRef]
  27. Walker, T.R. Green Marine: An environmental program to establish sustainability in marine transportation. Mar. Pollut. Bull. 2016, 105, 199–207. [Google Scholar] [CrossRef]
  28. Acciaro, M.; Vanelslander, T.; Sys, C.; Ferrari, C.; Roumboutsos, A.; Giuliano, G.; Lam, J.S.L.; Kapros, S. Environmental sustainability in seaports: A framework for successful innovation. Marit. Policy Manag. 2014, 41, 480–500. [Google Scholar] [CrossRef]
  29. Roos, E.C.; Neto, F.J.K. Tools for evaluating environmental performance at Brazilian public ports: Analysis and proposal. Mar. Pollut. Bull. 2017, 115, 211–216. [Google Scholar] [CrossRef]
  30. Puig, M.; Wooldridge, C.; Darbra, R. Identification and selection of Environmental Performance Indicators for sustainable port development. Mar. Pollut. Bull. 2014, 81, 124–130. [Google Scholar] [CrossRef]
  31. Puig, M.; Wooldridge, C.; Michail, A.; Darbra, R. Current status and trends of the environmental performance in European ports. Environ. Sci. Policy 2015, 48, 57–66. [Google Scholar] [CrossRef]
  32. Castellano, R.; Ferretti, M.; Musella, G.; Risitano, M. Evaluating the economic and environmental efficiency of ports: Evidence from Italy. J. Clean. Prod. 2020, 271, 122560. [Google Scholar] [CrossRef]
  33. Saunders, F.P.; Gilek, M.; Tafon, R. Adding People to the Sea: Conceptualizing Social Sustainability in Maritime Spatial Planning. Marit. Spat. Plan. 2019, 175–199. [Google Scholar] [CrossRef]
  34. Grimmel, H.; Calado, H.; Fonseca, C.; de Vivero, J.L.S. Integration of the social dimension into marine spatial planning—Theoretical aspects and recommendations. Ocean Coast. Manag. 2019, 173, 139–147. [Google Scholar] [CrossRef]
  35. Fernandez-Macho, J. A statistical assessment of maritime socioeconomic indicators for the European Atlantic area. J. Ocean Coast. Econ. 2016, 2, 4. [Google Scholar] [CrossRef] [Green Version]
  36. Parola, F.; Risitano, M.; Ferretti, M.; Panetti, E. The drivers of port competitiveness: A critical review. Transp. Rev. 2016, 37, 116–138. [Google Scholar] [CrossRef]
  37. Tsamboulas, D.; Moraiti, P. Decision Support Tool of the Sea Intermodal Corridor. Transp. Res. Rec. J. Transp. Res. Board 2013, 2330, 1–8. [Google Scholar] [CrossRef]
  38. Mascarenhas, A.; Nunes, L.M.; Ramos, T.B. Selection of sustainability indicators for planning: Combining stakeholders’ participation and data reduction techniques. J. Clean. Prod. 2015, 92, 295–307. [Google Scholar] [CrossRef]
  39. Nogués, S.; González-González, E.; Cordera, R. Planning regional sustainability: An index-based framework to assess spatial plans. Application to the region of Cantabria (Spain). J. Clean. Prod. 2019, 225, 510–523. [Google Scholar] [CrossRef]
  40. Di Vaio, A.; Varriale, L.; Alvino, F. Key performance indicators for developing environmentally sustainable and energy efficient ports: Evidence from Italy. Energy Policy 2018, 122, 229–240. [Google Scholar] [CrossRef]
  41. González-Laxe, F.; Bermúdez, F.M.; Palmero, F.M.; Novo-Corti, I. Sustainability and the Spanish port system. Analysis of the relationship between economic and environmental indicators. Mar. Pollut. Bull. 2016, 113, 232–239. [Google Scholar] [CrossRef]
  42. González-Laxe, F.; Bermúdez, F.M.; Palmero, F.M.; Novo-Corti, I. Assessment of port sustainability through synthetic indexes. Application to the Spanish case. Mar. Pollut. Bull. 2017, 119, 220–225. [Google Scholar] [CrossRef] [PubMed]
  43. Fernández-Macho, J.; González, P.; Virto, J. An index to assess maritime importance in the European Atlantic economy. Mar. Policy 2016, 64, 72–81. [Google Scholar] [CrossRef]
  44. Peris-Mora, E.; Orejas, J.D.; Subirats, A.; Ibáñez, S.; Alvarez, P. Development of a system of indicators for sustainable port management. Mar. Pollut. Bull. 2005, 50, 1649–1660. [Google Scholar] [CrossRef] [PubMed]
  45. Database—Regions—Eurostat n.d. Available online: https://ec.europa.eu/eurostat/web/regions/data/database (accessed on 8 January 2021).
  46. Regional Statistics. OECD n.d. Available online: https://stats.oecd.org/Index.aspx?DataSetCode=REGION_DEMOGR (accessed on 8 January 2021).
  47. Lotfi, F.H.; Fallahnejad, R. Imprecise Shannon’s Entropy and Multi Attribute Decision Making. Entropy 2010, 12, 53–62. [Google Scholar] [CrossRef] [Green Version]
  48. Wang, Z.; Zhan, W. Dynamic Engineering Multi-criteria Decision Making Model Optimized by Entropy Weight for Evaluating Bid. Syst. Eng. Proc. 2012, 5, 49–54. [Google Scholar] [CrossRef] [Green Version]
  49. Oluah, C.; Akinlabi, E.; Njoku, H. Selection of phase change material for improved performance of Trombe wall systems using the entropy weight and TOPSIS methodology. Energy Build. 2020, 217, 109967. [Google Scholar] [CrossRef]
  50. Chen, P. Effects of the entropy weight on TOPSIS. Exp. Syst. Appl. 2020, 2020, 114186. [Google Scholar] [CrossRef]
  51. Dweiri, F.T.; Khan, S.A.; Almulla, A. A multi-criteria decision support system to rank sustainable desalination plant location criteria. Desalination 2018, 444, 26–34. [Google Scholar] [CrossRef]
  52. Hendiani, S.; Sharifi, E.; Bagherpour, M.; GhannadPour, S.F. A multi-criteria sustainability assessment approach for energy systems using sustainability triple bottom line attributes and linguistic preferences. Environ. Dev. Sustain. 2020, 22, 7771–7805. [Google Scholar] [CrossRef]
  53. Cinelli, M.; Coles, S.R.; Kirwan, K. Analysis of the potentials of multi criteria decision analysis methods to conduct sustainability assessment. Ecol. Indic. 2014, 46, 138–148. [Google Scholar] [CrossRef] [Green Version]
  54. Iacovidou, E.; Voulvoulis, N. A multi-criteria sustainability assessment framework: Development and application in comparing two food waste management options using a UK region as a case study. Environ. Sci. Pollut. Res. 2018, 25, 35821–35834. [Google Scholar] [CrossRef] [PubMed] [Green Version]
  55. Khan, I.; Kabir, Z. Waste-to-energy generation technologies and the developing economies: A multi-criteria analysis for sustainability assessment. Renew. Energy 2020, 150, 320–333. [Google Scholar] [CrossRef]
  56. Boggia, A.; Massei, G.; Pace, E.; Rocchi, L.; Paolotti, L.; Attard, M. Spatial multicriteria analysis for sustainability assessment: A new model for decision making. Land Use Policy 2018, 71, 281–292. [Google Scholar] [CrossRef] [Green Version]
  57. Wu, Y.; Tao, Y.; Zhang, B.; Wang, S.; Xu, C.; Zhou, J. A decision framework of offshore wind power station site selection using a PROMETHEE method under intuitionistic fuzzy environment: A case in China. Ocean Coast. Manag. 2020, 184, 105016. [Google Scholar] [CrossRef]
  58. Brans, J.P.; Mareschal, B.; Vincke, P. PROMETHEE: A New Family of Outranking Methods in Multicriteria Analysis. In Operational Research ’84. Proceedings of the Tenth IFORS Conference Washington D.C.; Springer: Berlin, Germany, 1984. [Google Scholar]
  59. Brans, J.P.; Vincke, P. Note—A Preference Ranking Organisation Method. Manag. Sci. 1985, 31, 647–656. [Google Scholar] [CrossRef] [Green Version]
  60. Brans, J.-P.; Mareschal, B. Chapter 5 PROMETHEE Methods. In Multiple Criteria Decision Analysis: State of the Art Surveys; Springer: Berlin, Germany, 2005. [Google Scholar]
  61. Abdullah, L.; Chan, W.; Afshari, A. Application of PROMETHEE method for green supplier selection: A comparative result based on preference functions. J. Ind. Eng. Int. 2019, 15, 271–285. [Google Scholar] [CrossRef] [Green Version]
  62. Brans, J.-P.; de Smet, Y. PROMETHEE Methods. In Multiple Criteria Decision Analysis; Springer: Berlin, Germany, 2016; pp. 187–219. [Google Scholar]
  63. Makan, A.; Fadili, A. Sustainability assessment of large-scale composting technologies using PROMETHEE method. J. Clean. Prod. 2020, 261, 121244. [Google Scholar] [CrossRef]
  64. Lopes, A.P.F.; Muñoz, M.M.; Alarcón-Urbistondo, P. Regional tourism competitiveness using the PROMETHEE approach. Ann. Tour. Res. 2018, 73, 1–13. [Google Scholar] [CrossRef]
  65. Bluszcz, A. A Comparative Analysis of Selected Synthetic Indicators of Sustainability. Proc. Soc. Behav. Sci. 2016, 220, 40–50. [Google Scholar] [CrossRef] [Green Version]
  66. Sislian, L.; Jaegler, A.; Cariou, P. A literature review on port sustainability and ocean’s carrier network problem. Res. Transp. Bus. Manag. 2016, 19, 19–26. [Google Scholar] [CrossRef]
  67. Urbanyi-Popiołek, I. Cruise industry in the Baltic Sea Region, the challenges for ports in the context of sustainable logistics and ecological aspects. Transp. Res. Proc. 2019, 39, 544–553. [Google Scholar] [CrossRef]
  68. Niavis, S.; Papatheochari, T.; Kyratsoulis, T.; Coccossis, H. Revealing the potential of maritime transport for ‘Blue Economy’ in the Adriatic-Ionian Region. Case Stud. Transp. Policy 2017, 5, 380–388. [Google Scholar] [CrossRef]
Figure 1. Hierarchical structure of the model.
Jmse 09 00074 g001
Figure 2. Preview of the regions included in the analysis.
Jmse 09 00074 g002
Figure 3. Composite index of port regions sustainability ( φ ) in the period 2014–2018.
Jmse 09 00074 g003
Figure 4. Preview of the overall results in a five-year period.
Jmse 09 00074 g004
Table 1. Dimensions’ and indicators’ weights.
DimensionIndicatorIndicator WeightDimension Weight
Economic dimensionFreight loaded and unloaded0.09860.6550
Passengers embarked and disembarked0.1323
Regional GDP pc0.2869
Employment in technology and knowledge-intensive sectors0.0888
Persons employed in science and technology0.0108
Employment rates0.0017
Average number of usual weekly hours of work in main job0.0010
Unemployment rates0.0179
Long-term unemployment0.0160
Economic activity rates0.0011
Social dimensionLife expectancy0.00040.3293
Population density0.2553
Gender employment gap0.0204
Fertility rates0.0039
Less than primary, primary and lower secondary education0.0104
Upper secondary, post-secondary non-tertiary and tertiary education0.0058
Participation rate in education and training0.0331
Environmental dimensionPM2.5 air pollution, mean annual exposure0.01570.0157
Table 2. Ranking results of port regions according to sustainability index in the period 2014–2018.
RankPort RegionRankPort Region
1Attiki20Calabria
2Cataluna21Kentriki Makedonia
3Lazio22Adana, Mersin
4Andalucia23Ciudad Autonoma de Ceuta
5Campania24Thessalia
6Provence-Alpes-Cote d’Azur25Jadranska Hrvatska
7Istanbul26Ciudad Autonoma de Melilla
8Sicilia27Dytiki Ellada
9Liguria28Aydin, Denizli, Mugla
10Toscana29Tekirdag, Edirne, Kirklareli
11Malta30Antalya, Isparta, Burdur
12Region de Murcia31Kriti
13Illes Balears32Sterea Ellada
14Comunidad Valenciana33Balikesir, Canakkale
15Puglia34Notio Aigaio
16Izmir35Anatoliki Makedonia, Thraki
17Languedoc-Roussillon36Ipeiros
18Sardegna37Peloponnisos
19Marche--
Table 3. Sensitivity analysis.
CriteriaWeightWalking Weights (2014–2018)
Freight loaded and unloaded (in 1000 tones)0.09869.60–9.88%
Passengers embarked and disembarked (1000 passengers)0.132313.19–13.66%
Regional GDP pc (current market prices)0.286928.62–29.01%
Employment in technology and knowledge-intensive sectors0.08888.62–8.90%
Persons employed in science and technology (%)0.01080.45–1.35%
Employment rates by sex, age (%)0.00170.11–0.43%
Average number of usual weekly hours of work in main job 0.00100.00–0.71%
Unemployment rates by sex and age (%) 0.01791.70–1.97%
Long-term unemployment (12 + months) 0.01601.52–1.76%
Economic activity rates by sex, age (15 to 64)0.00110.00–0.42%
Life expectancy by age, sex0.00040.00–0.19%
Population density 0.255325.26–25.84%
Gender employment gap 0.02041.90–2.50%
Fertility rates by age0.00390.15–0.45%
Less than primary, primary and lower secondary education (levels 0–2)0.01040.79–1.40%
Upper secondary, post-secondary non-tertiary and tertiary education (levels 3–8)0.00580.33–0.94%
Participation rate in education and training (in last 4 weeks) 0.03312.86–3.40%
PM2.5 air pollution, mean annual exposure (μg per m3)0.01571.32–2.13%
Publisher’s Note: MDPI stays neutral with regard to jurisdictional claims in published maps and institutional affiliations.

