Article

Rescheduling Strategy for Berth Planning in Container Terminals: An Empirical Study from Korea

1
Department of Transportation and Logistics Engineering, Hanyang University, 55, Hanyangdaehak-ro, Sangnok-gu, Ansan-si 15588, Gyeonggi-do, Korea
2
Maritime Safety and Environmental Research Division, Korea Research Institute of Ships and Ocean Engineering, 32, Yuseong-daero 1312 beon-gil, Yuseong-gu, Daejeon 34103, Korea
*
Author to whom correspondence should be addressed.
J. Mar. Sci. Eng. 2021, 9(5), 527; https://0-doi-org.brum.beds.ac.uk/10.3390/jmse9050527
Submission received: 25 April 2021 / Revised: 6 May 2021 / Accepted: 9 May 2021 / Published: 13 May 2021
(This article belongs to the Special Issue The Strategy of Smart Port)

Abstract

:
The rapid increase in international trade volume has caused frequent fluctuation of the vessels’ arrival time in container terminals. In order to solve this problem, this study proposes a methodology for rescheduling berth and quay cranes caused by updated information on the arrival time of vessels. A mixed-integer linear programming model was formulated for the berth allocation and crane assignment problem, and we solved the problem using a rolling-horizon approach. Numerical experiments were conducted under three scenarios with empirical data from a container terminal located in Busan, Korea. The experiments revealed that the proposed model reduces penalty costs and overall delayed departure time compared to the results of the terminal planner.

1. Introduction

As the global economy and supply chain has become more complex, maritime transportation faced the challenge to improve operational reliability and flexibility against supply chain risks. For port container terminals, such operational capabilities are directly related to attracting customers and staying ahead of the competition, as well as sustaining profitability. This is because the reputation for their service can be achieved by catching up with the required departure times of the calling vessels, even if the arrivals of the shipping companies are delayed [1]. Considering the frequent occurrence of deviations from the scheduled arrival times of the vessels [2,3], the development of sophisticated optimization models for berth operations is of utmost importance to deal with the uncertain environment in container terminals.
The berth operations are most relevant to the allocation of berths and Quay Cranes (QCs), which are scarce and expensive resources in container terminals. The Berth Allocation Problem (BAP) is to determine the berthing position and the berthing time of the calling vessels. As depicted in Figure 1, the solution of the BAP (i.e., berth plan) can be represented as a non-overlapped rectangular packing on a two-dimensional time-space diagram which is expressed by the planning time horizon and the length of quay [4]. The Quay Crane Assignment Problem (QCAP) is to determine the number of QCs that are engaged to the vessels at each time. Since the handling times of vessels depend on the number of QCs that are assigned to the vessels, the QCAP is also considered for establishing the berth plan. In this regard, Figure 2 shows an example of the solution for the integrated Berth Allocation and Crane Assignment Problem (BACAP) where the QCs are assigned to the vessels in a time-variant manner. The QC assignment can inherently accelerate or decelerate the handling times of the vessels.
The uncertain arrivals of the calling vessels due to unforeseen events, such as weather conditions or a delay from the previous container terminal, often lead to disruption in the berth operations. The disruption may incur substantial costs to the terminal because the berth and yard operations must be re-planned and relevant resources such as container handling equipment must be re-allocated. Moreover, it may induce delays of the other consecutive vessels due to the chain-effect which severely declines in terminal service reputation for shipping companies. Therefore, one of the main tasks of terminal berth operators is to figure out the optimal reallocation of berths and QCs for incoming vessels to respond to the real-time schedule disruption. In that case, if the actual time of departure (ATD) exceeds the estimated time of departure (ETD) of the vessels, it may result in inevitable modifications to the operational plan of the vessel for the next terminal of destination established by the shipping company. For the shipping companies, such a disruption causes loss of reliability of their services and logistic costs [5]. In order to provide high-quality service to the shipping companies, the berth rescheduling is made in such a way as to minimize the difference between the ETD and the ATD. However, there is a gap between actual operations and optimized operations in the berth rescheduling because the rescheduling in practice is manually conducted by the berth operators according to experience [1].
It is worth mentioning that the smart port initiatives and high-quality terminal operating systems have provided operational improvement by automation and optimization with significantly mitigating manual work. The berth rescheduling operations have the potential for these attempts to take effect with the following two reasons: First, the loss in optimality for the rescheduling operation may cause substantial costs including declined terminal service reputations for shipping companies. Second, co-incidences of vessel delays can make it difficult to execute the berth rescheduling in manual and accelerate the operational inefficiency. It is noted that vessel delays occur frequently [2,3] and further, the more complex global supply chain may provide more uncertainties in vessel arrivals. Accordingly, more efforts of rescheduling will be required to cope with the uncertainties and attract the shipping companies. Therefore, as one of the prerequisites for smart port initiatives, it is imperative to gauge the effect that can be achieved through automation and optimization. To this end, we intend to quantify and identify the gap between research and practice for the berth rescheduling.
This paper provides the methodology to reschedule berths and QCs simultaneously to respond to the updated information where the initial berth plan is disrupted due to the uncertainty of vessels’ arrival. We formulate a mixed-integer linear programming (MILP) model for the dynamic berth rescheduling problem and propose a rolling horizon approach to solve the model. It is especially notable that we conducted the empirical study with the real-world berth operational data in a typical container terminal in Korea. We designed three scenarios that restrict the optimization to reflect the possible fluctuation while terminal operating. The impact of the proposed methodology was assessed in measure of the delayed departure time of vessels, and it was compared with the empirical berth plan conducted by the terminal operator.
The remainder of this paper is organized as follows. A review of previous research is given in Section 2. In Section 3, the problem description and mathematical model that minimizes operation cost associated with reallocation of berths and QCs are presented. As a solution approach, the rolling horizon approach is addressed in Section 4. Then, a numerical experiment is conducted with empirical data in Section 5. Finally, a conclusion is given in Section 6.

2. Literature Review

Many researchers have studied container terminals from various perspectives: economic [6,7,8,9], operational [10,11,12,13], and political [14,15]. In particular, the study of the various operational problems in a container terminal plays an important role in improving efficiency and advancing to a smart container terminal. In this study, we focus on seaside operations among several operational problems.
The BAP has received tremendous attention from the research community in the past decades. As modern container terminals varied in layout and equipment, terminal operation problems became more complex, and different variants of the models and solution methods have been developed in the literature [16]. The berth allocation models are typically classified into discrete and continuous models according to the berthing space [17,18,19]. Due to the complexity of the BAP, several researchers applied heuristic algorithms such as the Lagrangian relaxation procedure, tree search procedure, genetic algorithm, beam search algorithm, particle swarm optimization, etc. to their studies [20,21,22,23,24,25].
Since the QCAP is directly linked to the handling times of vessels, several researchers considered the integration of the BACAP, which causes a great increase in the complexity of the model. To solve this complexity, Guan et al. [26] considered the BAP as a multi-processor task scheduling problem where the processors and tasks correspond to consecutive QCs and vessel handling, respectively. They used minimization of total weighted completion time of tasks as an objective function, where the weight of a task is equivalent to the processing time depending on the number of serving QCs. A greedy algorithm was applied to determine the QC assignment for the arranged vessels in increasing order of the weight. Park and Kim [27] introduced a two-phase structure that makes step by step decisions for berth allocation and detailed time-variant QC assignment. For phase 1, a Lagrangian heuristic is used to solve continuous BAP with consideration of QC resources, where the handling time of a vessel is assumed to be decided by the number that is inversely proportional to the number of QCs engaged to the vessel. For phase 2, dynamic programming that minimizes QC setup cost is made to solve the QCAP. Vacca et al. [28] proposed a model which can be adapted to both BAP and BACAP. The model is based on an exponential number of variables and solved via column generation. A branch and price algorithm was carried out to obtain optimal integer solutions, and several accelerating techniques that can be generalized to other branch and price schemes were introduced. Meisel and Bierwirth [29] devised the Squeaky Wheel Optimization (SWO) heuristic based on priority list building and list insertion method. After deriving the initial priority list from the vessel list that is arranged in the order of the expected time of arrival, the SWO heuristic procedure and local refinement procedure were repeated to explore the improved solution. Iris et al. [30] proposed Generalized Set Partitioning (GSPP) formulations for the BACAP considering both time-variant and time-invariant QC assignment policies. They solved the problem introduced in [29] and applied a set of column reduction techniques to obtain the improved upper and lower bounds, which would be measures of evaluation of new heuristics. Iris et al. [31] proposed an Adaptive Large Neighborhood Search (ALNS)-based heuristic to improve the QC assignment on the mathematical model introduced in [29]. They showed the solution efficiency of the proposed heuristic comparing with the state-of-the-art heuristics.
For implementing the established berth schedule, all input parameters considered at the planning phase must be unchanged. However, in practice, a variety of factors change the plan differently from the information expected at the planning phase, thereby preventing the implementation of the original berth schedule. To cope with the uncertainties, a proactive approach and a reactive approach have been discussed. The proactive approach aims to absorb the uncertainties at the planning level [2,32,33,34,35,36], while the reactive approach aims to handle the real-time disruptions due to the uncertainties at the operation level [1,37,38,39,40]. We focus on the review of the literature using the reactive approach which is close to this study. Zeng et al. [37] devised two strategies (QC rescheduling strategy and berth reallocation strategy) to solve the disruption recovery problem through local rescheduling and tabu search. The numerical experiment showed a comparison of additional costs resulting from QC rescheduling and berth reallocation. Umang et al. [38] studied the BAP with dynamic updates on the ETA of the calling vessels. They proposed a smart greedy method by taking advantage of the estimates of the arrival and handling times from a probability distribution. Xiang et al. [39] introduced the fuzzy decision-making process for the disruption recovery in the BACAP and applied a rolling-horizon optimization algorithm. Li et al. [1], Lv et al. [40] developed an SWO-based construction heuristic to solve the real-time rescheduling for the BACAP.
As discussed above, the number of studies that concern the reactive approach for the BAP or BACAP is limited. The focus of existing studies is mainly on how to reallocate the berths and QCs, and none of them attempts the empirical study to quantify and identify the gap between research and practice for the berth rescheduling. In this paper, the practical restrictions in optimization for the berth rescheduling are considered to estimate the contribution of automation and optimization in real-world terminal environments. Our empirical analysis confirms that the rescheduling strategy for berth planning does have a cost-effective effect on automated terminals and provides managerial insights to berth planners. Furthermore, the results of our research can help understand the effect to be achieved through automation and optimization techniques, and accelerate the smart port initiatives.

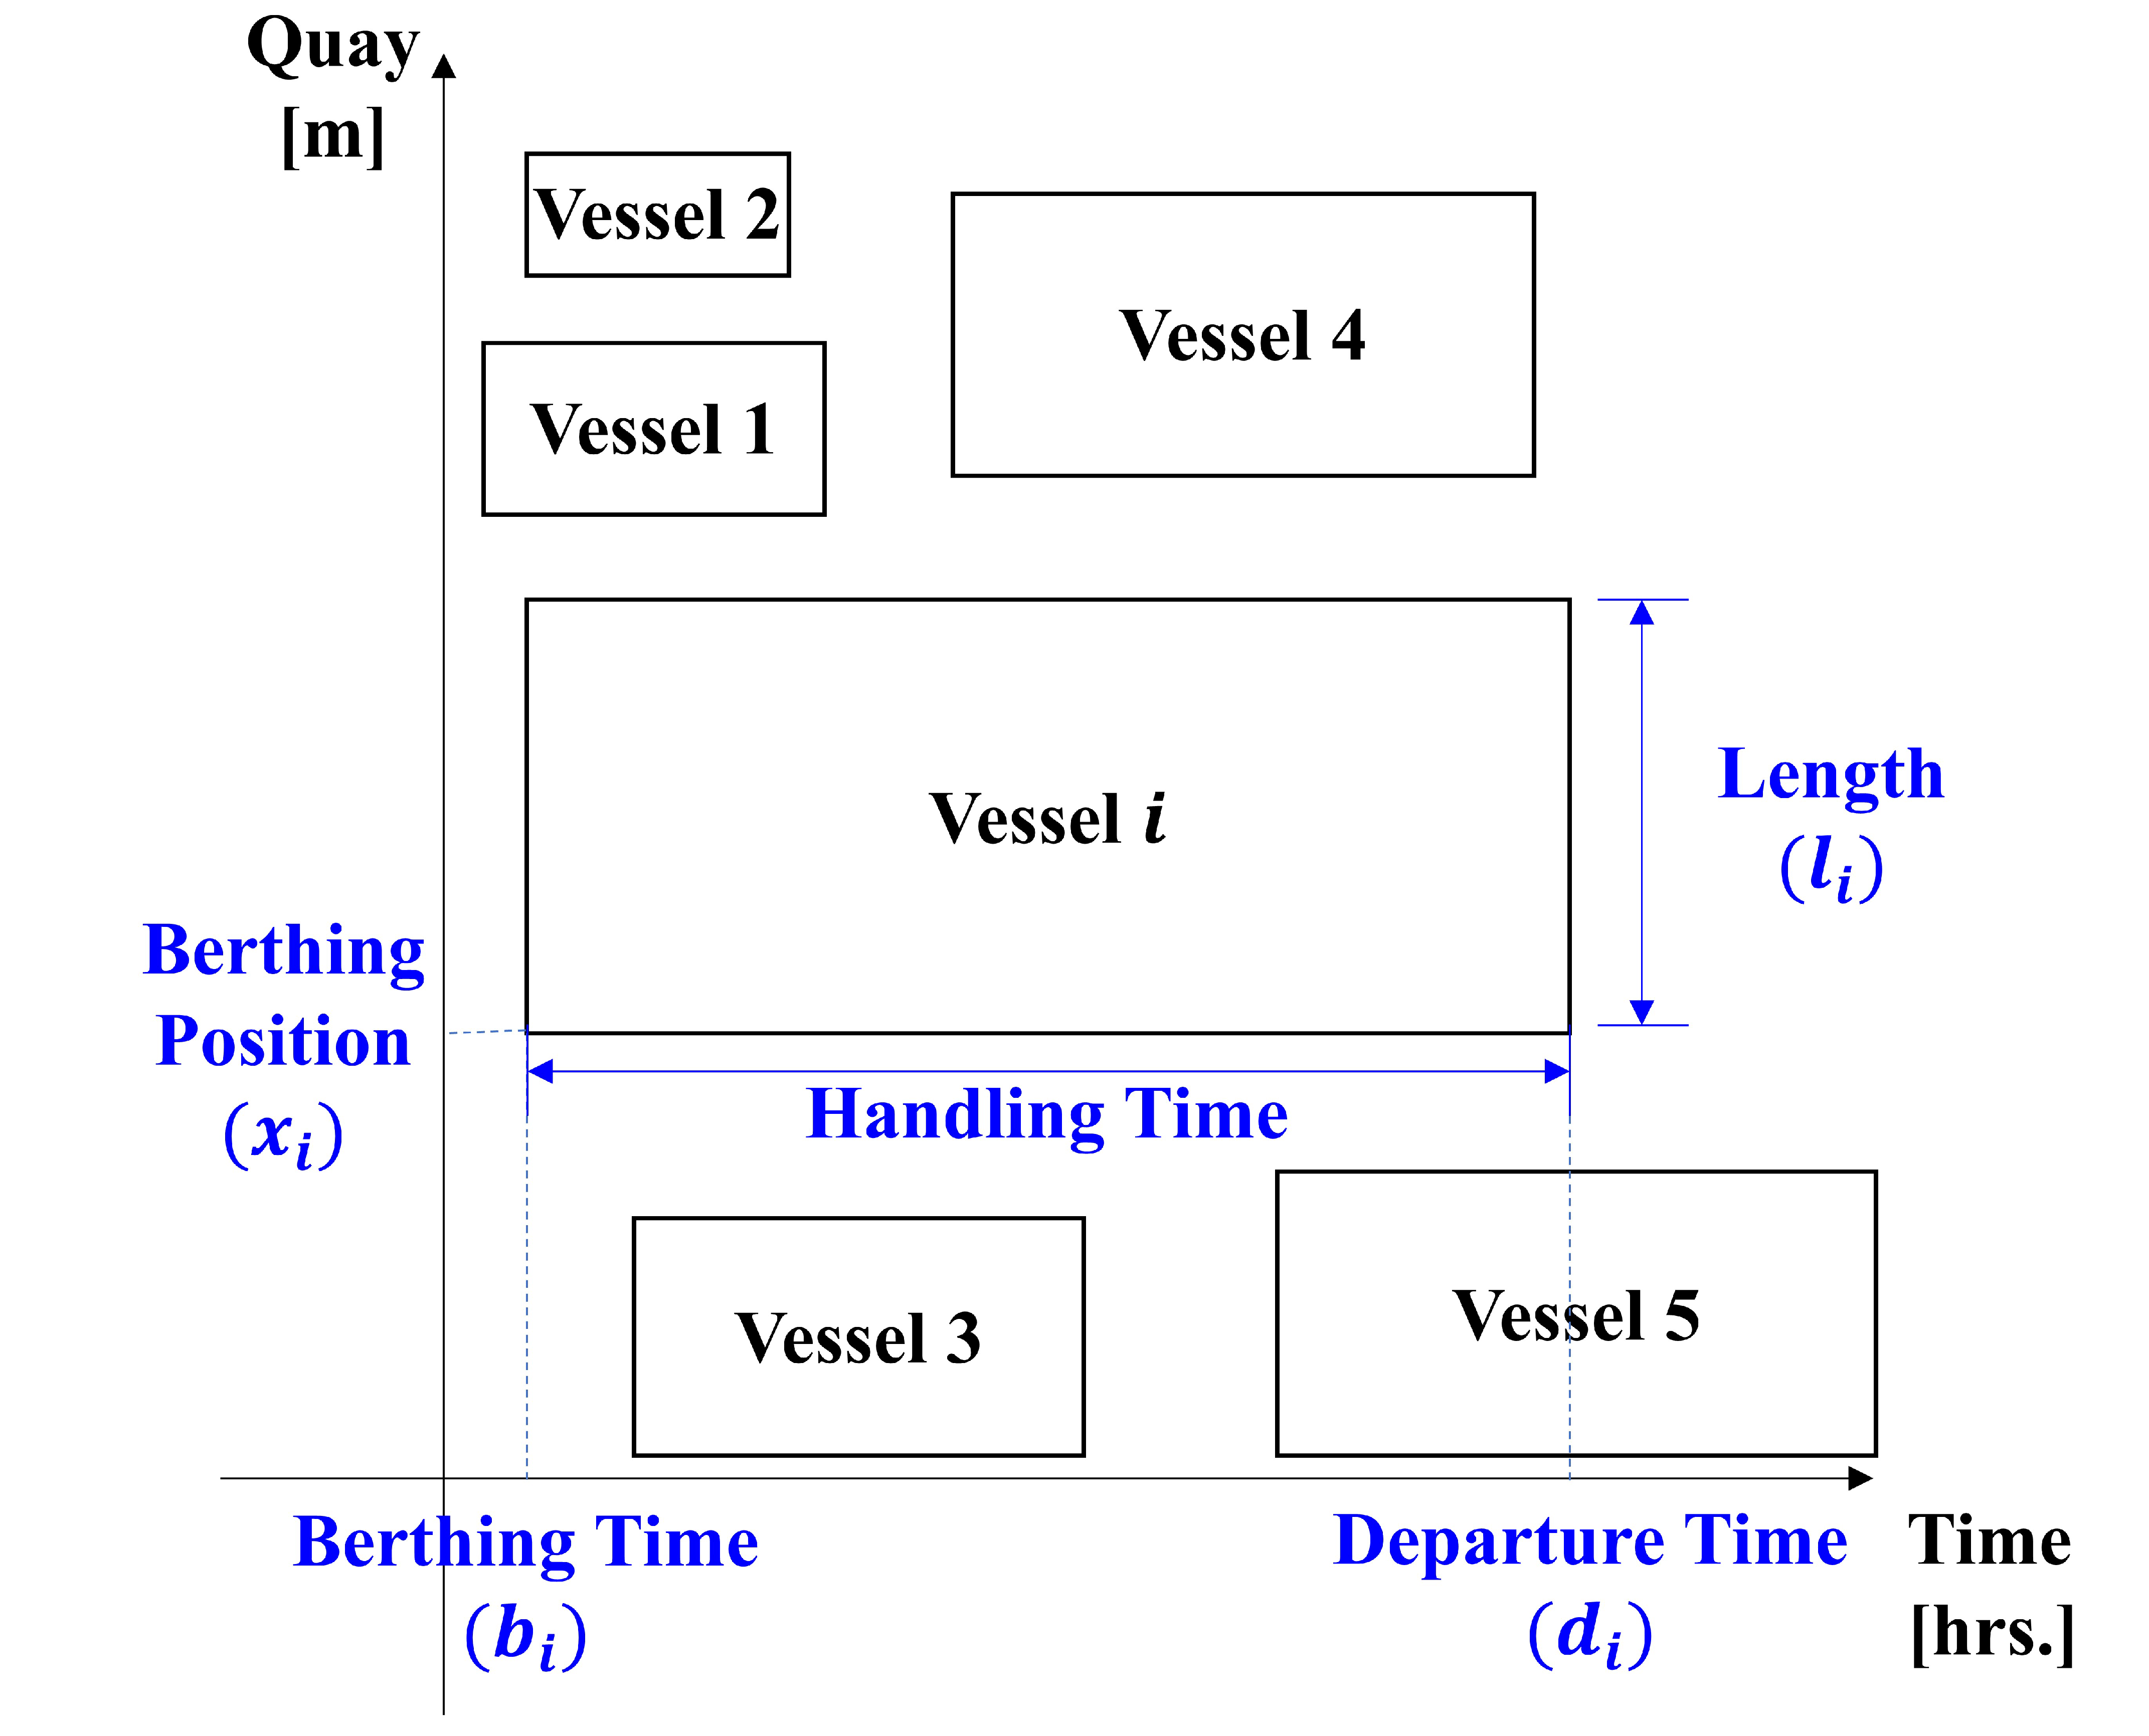
3. Problem Description

This study concerns the dynamic berth rescheduling problem. As shown in Figure 3, the conceptual framework to model the problem works as follows. We assume that the initial baseline schedule is given, and the terminal receives a dynamic update on the arriving vessel information. The baseline schedule is continuously executed until the vessel information is updated. The controller identifies the impact of the updated information on the feasibility of the plan during the execution of the baseline schedule. If it turns out to be a cause of the schedule disruption, this triggers the solver to modify the current schedule. The solver creates the re-optimized schedule to cope with the disruption. Then, the baseline schedule is considered to be replaced with the newly obtained re-optimized schedule by the solver.
To create the initial baseline schedule at the planning stage, a variety of service costs such as berthing delay from ETA, departure delay from ETD, deviation from the ideal berthing position are considered in literature [19,20,27,29]. In contrast, for the recovery schedule at the operation stage, catching up with the required departure times (i.e., ETDs) of the calling vessels is of utmost importance to achieve the service reputation, even if the arrivals of the shipping companies are delayed [1]. As mentioned in Section 1, the service reputation is essential to stay ahead of the competition, as well as sustain profitability. Accordingly, in the conceptual framework for rescheduling, the solver model explicitly considers the service reputation and aims to minimize the departure delay from ETD.
The solver yields the recovery schedule based on re-optimization of the berth scheduling in the event of the schedule disruption. A common approach for dynamic rescheduling is to apply an optimization model on a rolling planning horizon [38]. If the solver is triggered at time epoch τ , the baseline schedule (i.e., determination of the berthing times and positions, assignment of the dedicated QCs for the vessels), which was planned before time τ , remains unchanged, and the schedule after time τ is planned completely new. The following subsections detail the re-optimization model to recover the berth schedule.

3.1. Assumption

  • Quay layout is assumed as a continuous space.
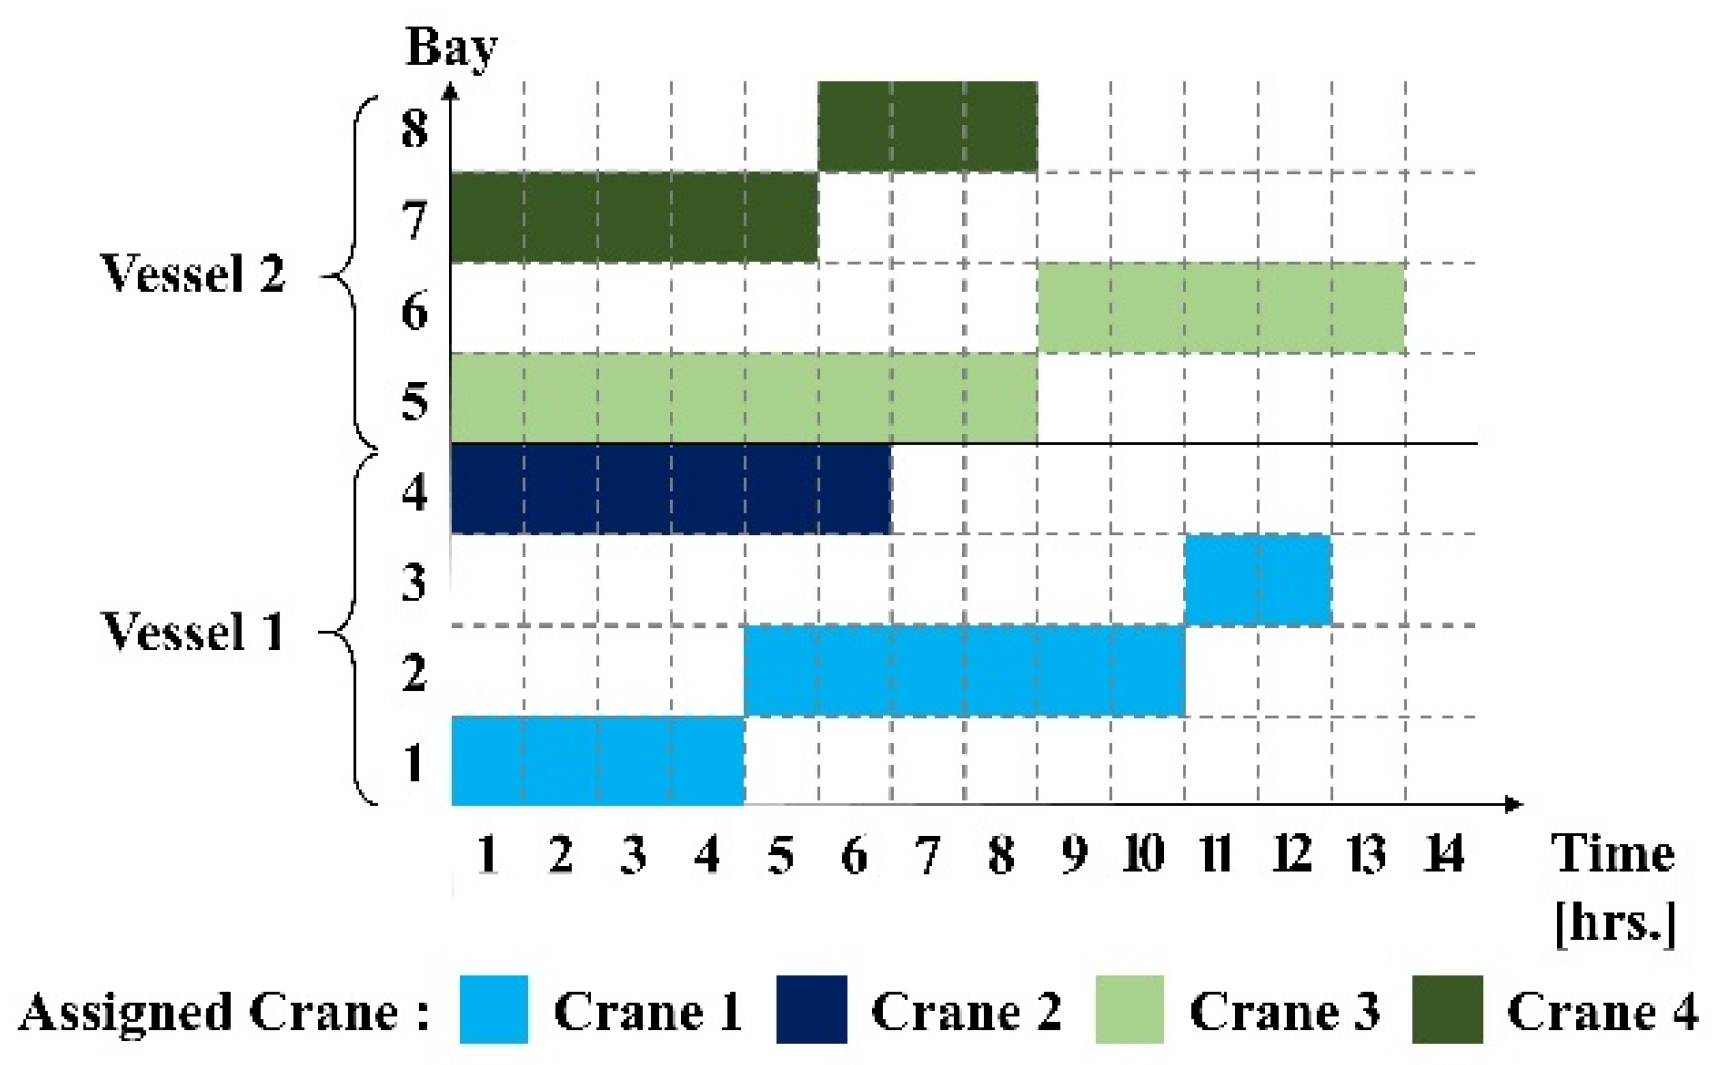
  • Each vessel has a maximum and minimum number of QCs that can be assigned. It is decided in advance through an agreement between the terminal and the shipping company to ensure minimum productivity. For some feeder vessels, if the minimum number of QCs is not given, one is assumed.
  • When vessels berth and departure at the terminal, tugboat and pilot schedule between seaport to inland ports and line handling take an hour. That is, it is ensured a minimum of 2 h between vessels.
  • QCs have constant productivity and start the loading/discharging process the moment the vessel is berthed.
  • The number of QCs working on the vessel may change during loading/discharging operation. However, the minimum number of QCs that can be assigned must be met to ensure continuous work. Namely, it is assumed that the vessel which has started operation will not be stopped.

3.2. Notation

3.2.1. Parameters

V ( τ ) Set of vessels to be scheduled at time τ , V ( τ ) = V 1 ( τ ) V 2 ( τ )
V 1 ( τ ) Subset of vessels which are berthed or have not yet departed the port at time τ
V 2 ( τ ) Subset of vessels which are not yet berthed at time τ
T Length of planning period (unit: an hour)
L Total length of quay
Q Total number of QCs
q i m i n Minimum number of QCs that can be assigned per hour to vessel i
q i m a x Maximum number of QCs that can be assigned per hour to vessel i
n i Possible number of QCs assigned to vessel i at a particular point in time
( q i m i n n i q i m a x )
E T A i The most recently updated arrival time of vessel i
E T D i Departure time of vessel i in proforma schedule
b i 1 Determined berthing time of specific vessel i in V 1 ( τ )
x i 1 Determined berthing position of specific vessel i in V 1 ( τ )
l i Length of vessel i
r i Total number of containers to be discharged or loaded for vessel i
r i 1 Remained number of containers to be discharged or loaded for specific vessel i in V 1 ( τ ) at time τ
p Productivity of one QC
m i Total number of QCs required for vessel i , m i = r i p
m i 1 Remained number of QCs required for specific vessel i in V 1 ( τ ) at time τ , m i 1 = r i 1 p
g a p x Minimum time interval needed between vessels
g a p y Minimum distance needed between vessels
c i Penalty cost corresponding to the departure delay of vessel i
M A large number

3.2.2. Decision Variables

b i Berthing time of vessel i
d i Departure time of vessel i
x i Berthing position of vessel i
v i j x 1 if vessel i is completely on the left side of vessel j on x-axis (time) in the time-space diagram, 0 otherwise (where i j )
v i j y 1 if vessel i is completely below vessel j on y-axis (space) in the time-space diagram, 0 otherwise (where i j )
q i t n i 1 if n i QCs are assigned to vessel i at time t , 0 otherwise

3.3. Model Formulation

In this section we describe the MILP model for the dynamic berth rescheduling problem. A list of notations, i.e. parameters, decision variables of the model, can be found in Section 3.2.
M i n   i = 1 N [ c i ( d i E T D i ) + ]
s.t.
b i = b i 1 ,   f o r   i V 1 ( τ )
x i = x i 1 ,   f o r   i V 1 ( τ )
b i E T A i ,   f o r   i V 2 ( τ )
x i L l i ,   f o r   i V 2 ( τ )
b j d i + g a p x + M ( v i j x 1 ) ,   f o r   i , j V ( τ ) ,   i j
x j x i + l i + g a p y + M ( v i j y 1 ) ,   f o r   i , j V ( τ ) ,   i j
v i j x + v j i x + v i j y + v j i y 1 ,   f o r   i , j V ( τ ) ,   i j
b i t × q i t n i + M ( 1 q i t n i ) ,   f o r   i V 2 ( τ ) ,   m a x ( E T A i ,   τ ) t T ,   q i m i n n i q i m a x
d i   t × q i t n i + 1 ,   f o r   i V 1 ( τ ) ,   m a x ( E T A i ,   τ ) t < T ,   q i m i n n i q i m a x
d i b i m i q i m i n ,   f o r   i V ( τ )
t = τ T n i = q i m i n q i m a x n i × q i t n i m i 1 ,   f o r   i V 1 ( τ )
t = τ T n i = q i m i n q i m a x n i × q i t n i m i ,   f o r   i V 2 ( τ )
i V ( τ ) n i = q i m i n q i m a x n i × q i t n i Q ,   f o r   t = τ , , T
n i = q i m i n q i m a x q i t n i 1 ,   f o r   i V ( τ ) ,   t = τ , , T
n i = q i m i n q i m a x q i t n i n i = q i m i n q i m a x ( q i ( t 1 ) n i + q i t n i ) 1 ,   f o r   i V ( τ ) ,   τ t < t T
x i 0 ,   b i 0 ,   d i 0
q i t n i ,   v i j x , v i j y   : b i n a r y
The rescheduling of the berth plan aims to minimize the delays from the ETD of the vessels. The objective function (1) defines a weighted penalty costs for delays from ETD, taking into account the service priorities of each vessel. Constraints (2) and (3) ensure to sustain the already determined berthing time and position for the vessels which are berthed or have not yet departed the port at time epoch τ . Constraints (4)–(8) ensure the feasible berthing position, berthing time, and departure time of all vessels so that they do not overlap with each other within the time-space diagram. Constraints (9)–(16) are related to QC assignment to vessels. Constraint (12) indicates only the required QC capacities to handle the remained containers are considered for the vessels which are berthed or have not yet departed the port at time epoch τ . Constraint (16) satisfies the assumption of the model to ensure continuous work. Lastly, Constraints (17) and (18) define decision variable type.

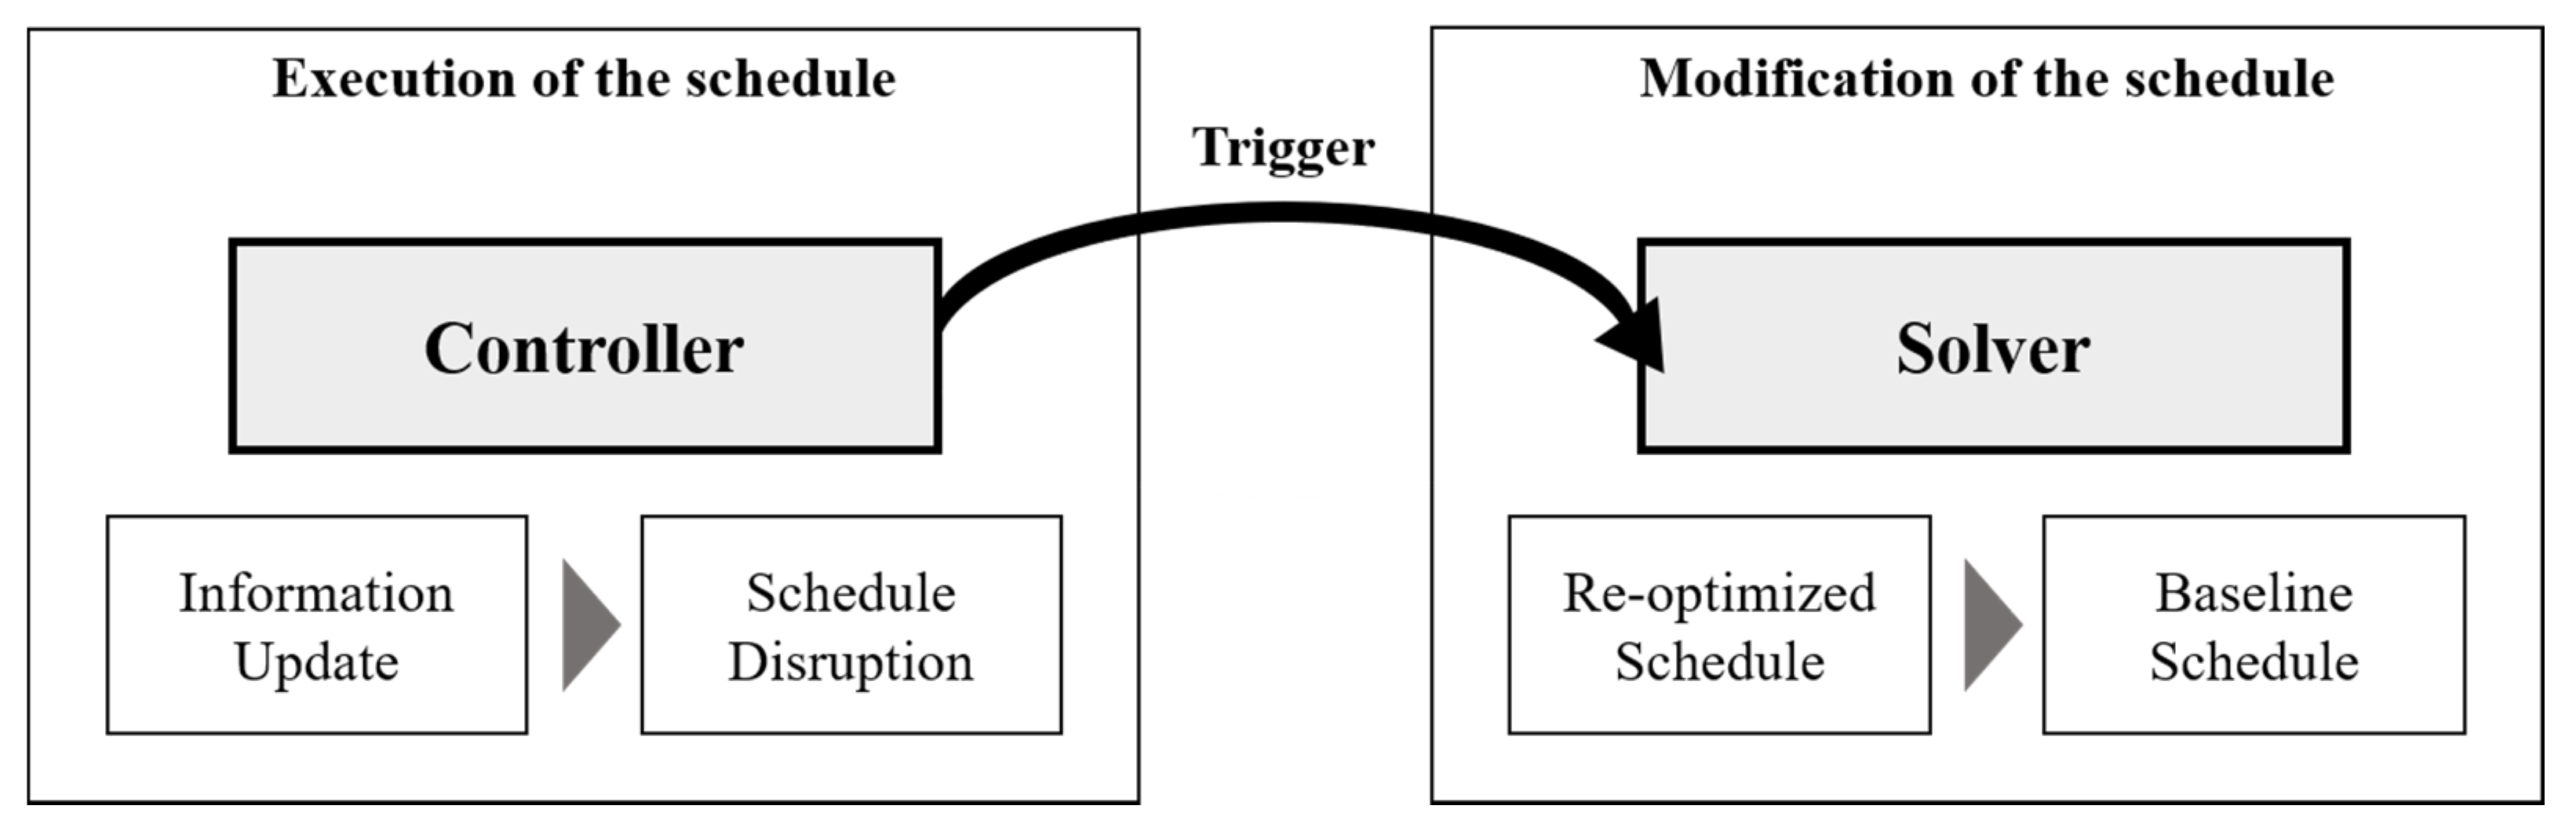
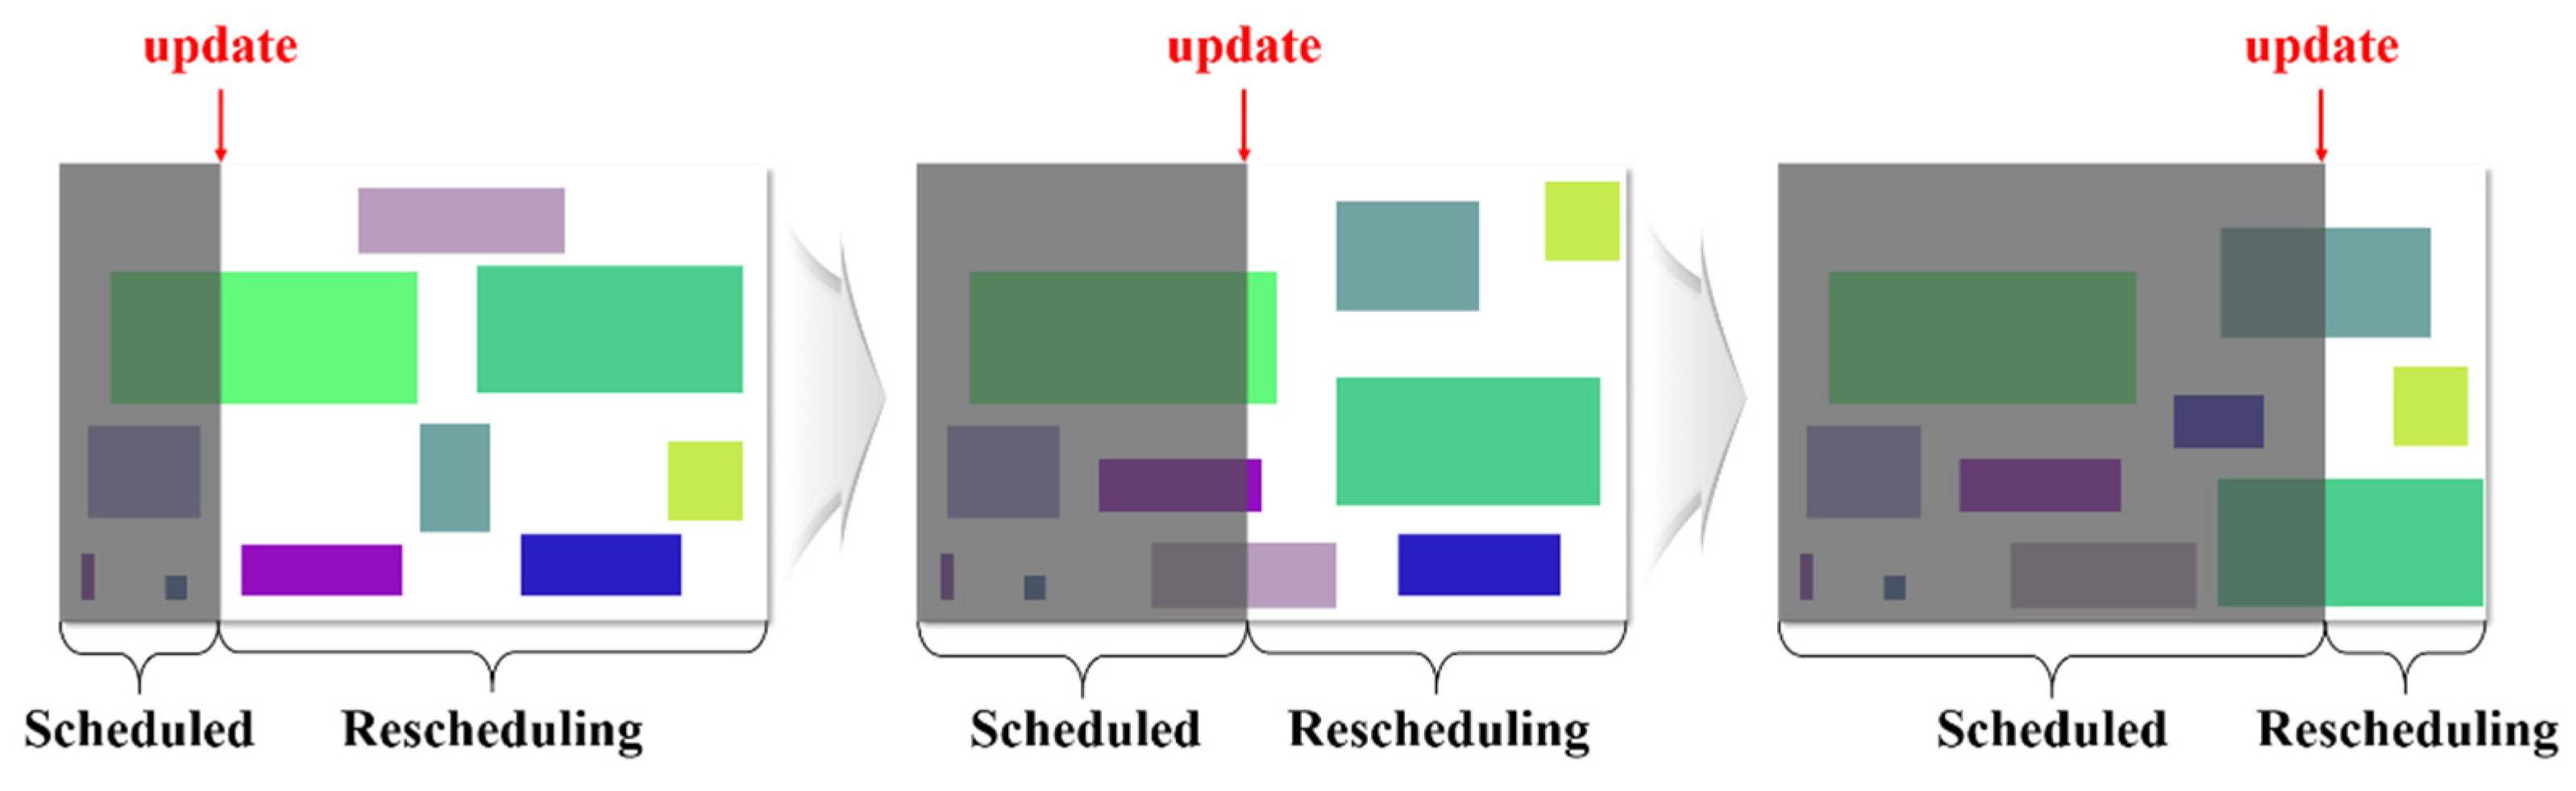
4. Solution Approach

In this study, we apply a rolling-horizon approach for the rescheduling method to accommodate the framework presented in Section 3. In general, dynamic rescheduling is to apply an optimization model on a rolling planning horizon [38]. A rolling-horizon optimization algorithm has been widely employed in research on rescheduling problems [39]. The main idea of the rolling-horizon approach is to divide the planning horizon into sub-horizons, and then iteratively solve sub-problems for each sub-horizon. The rolling-horizon approach allows to plan for the planning horizon, and then reflects the results of the previous sub-horizon on the planning for the next sub-horizon. Through the rolling-horizon approach, we can reflect the highly dynamic and fluctuating environment generated during the berth planning and derive the flexible plan within a reasonable computation time by updating the plan every sub-horizon.
For the description of the rolling-horizon approach, the following notations are introduced: length of the planning horizon ( T ), length of the rolling sub-horizon ( S ), and length of the frozen time window ( F ). Then, the total number of iterations ( N ) for the rolling-horizon method is equivalent to T divided by S . The rolling-horizon rescheduling procedure is terminated if the number of iterations N is reached.
More specifically, Figure 4 shows a snapshot in the rescheduling framework. In Figure 4, the leftmost one presents the initial situation where the baseline schedule is executed in grey-shaded time period and at the specific time epoch, the berth rescheduling is required. The controller component triggers the solver component. Then, for the time period to be rescheduled, the sub-problem for each sub-horizon is iteratively solved by the solver component. Here, the exact optimization algorithm is implemented based on the mathematical model in Section 3, where the length of planning period T is reduced to the length of rolling sub-horizon S . The result of the solver is kept until the vessel information is updated. The next one shows the updated situation again, and the controller and solver works for the reallocations of the berth and QCs in the same way described.

5. Numerical Experiments

5.1. Experiment Environment

To find out the effectiveness of the proposed method in real-life environment, the berth plan generated by the proposed model and the result of the berth planner in the terminal were compared. The experiment environment was set to a berth length of 1200 m and a total of 12 QCs, which is the actual environment from a terminal in Pusan Newport, Republic of Korea. In addition, the data of vessels that berthed at the container terminal in the actual berth schedule, including ETA, ETD, vessel length, number of containers to be handled, minimum/maximum number of QCs that can be assigned, and the actual time of berthing/departure (ATB/ATD), were used. For the penalty costs corresponding to the departure delay of the vessels, the costs resulting from reassigning a vessel to another terminal were used [41].
In real-life environments, berth planning is conducted without knowing the information of all vessels. In the experiments, this factor is considered by using an actual time of arrival (ATA), ATB, and ATD gathered from vessels in the terminal. For the periodic rescheduling strategy, information from each vessel is known 24 h prior to arrival, and the proposed model is triggered to reschedule every 6 h. That is, the length of the planning horizon T , rolling sub-horizon S , and rescheduling period are 1 week, 24 h, and 6 h, respectively. The experiments are carried out on a computer with Intel Core i7-7700HQ 2.80GHz and 16.0 GB of RAM working under Windows 10 Server operating system. We ran commercial solver Gurobi 8.0.1 to solve the subproblems for rolling-horizon optimization. For implementing the rolling-horizon optimization, the average computation time is in the range of 500 and 1000 s.

5.2. Experiment Scenarios

As mentioned in Section 4, in numerical experiments, we derived the result of rescheduling using a rolling-horizon approach. However, there are not only the dynamic nature of the information but also other various factors that make efficient berth operations difficult for planners to determine berth allocation at the actual terminal. For example, there are specific situations where it is difficult to change the berth plan due to the request of the consignor, the tight schedule to the next destination port, the relationship between terminal and shipping company, and the relationship between the mother ship and feeder ship, and so on. Moreover, because of the complexity of the terminal’s operations, the loading/discharging processing time of the vessel may be delayed longer than expected. Even though such factors do not appear on the data, they can be considered an inherent factor considering the actual operating environment of the terminal.
When comparing the results of the rescheduling of the berth plan with those of the terminal planner, to eliminate these inherent factors as much as possible and analyze the results, three scenarios were assumed as shown in Table 1. Scenario 1 is a case where intrinsic factors are not considered. In this scenario, all vessels can berth immediately after their ATA instead of ETA. Scenario 2 assumed that berthing time is determined by the terminal planner due to exceptional circumstances, and it is best for modifying the berth plan. In this scenario, every vessel can berth only after the ATB in place of ATA. In addition to the assumption of Scenario 2, Scenario 3 assumed the processing time of the vessel was delayed. In this scenario, the productivity of a QC, p is reduced from 30 to 25 containers per hour to derive the berth plan. Numerical experiments were conducted on each of the three scenarios, and the results were analyzed.

5.3. Result of Experiments under Three Scenarios

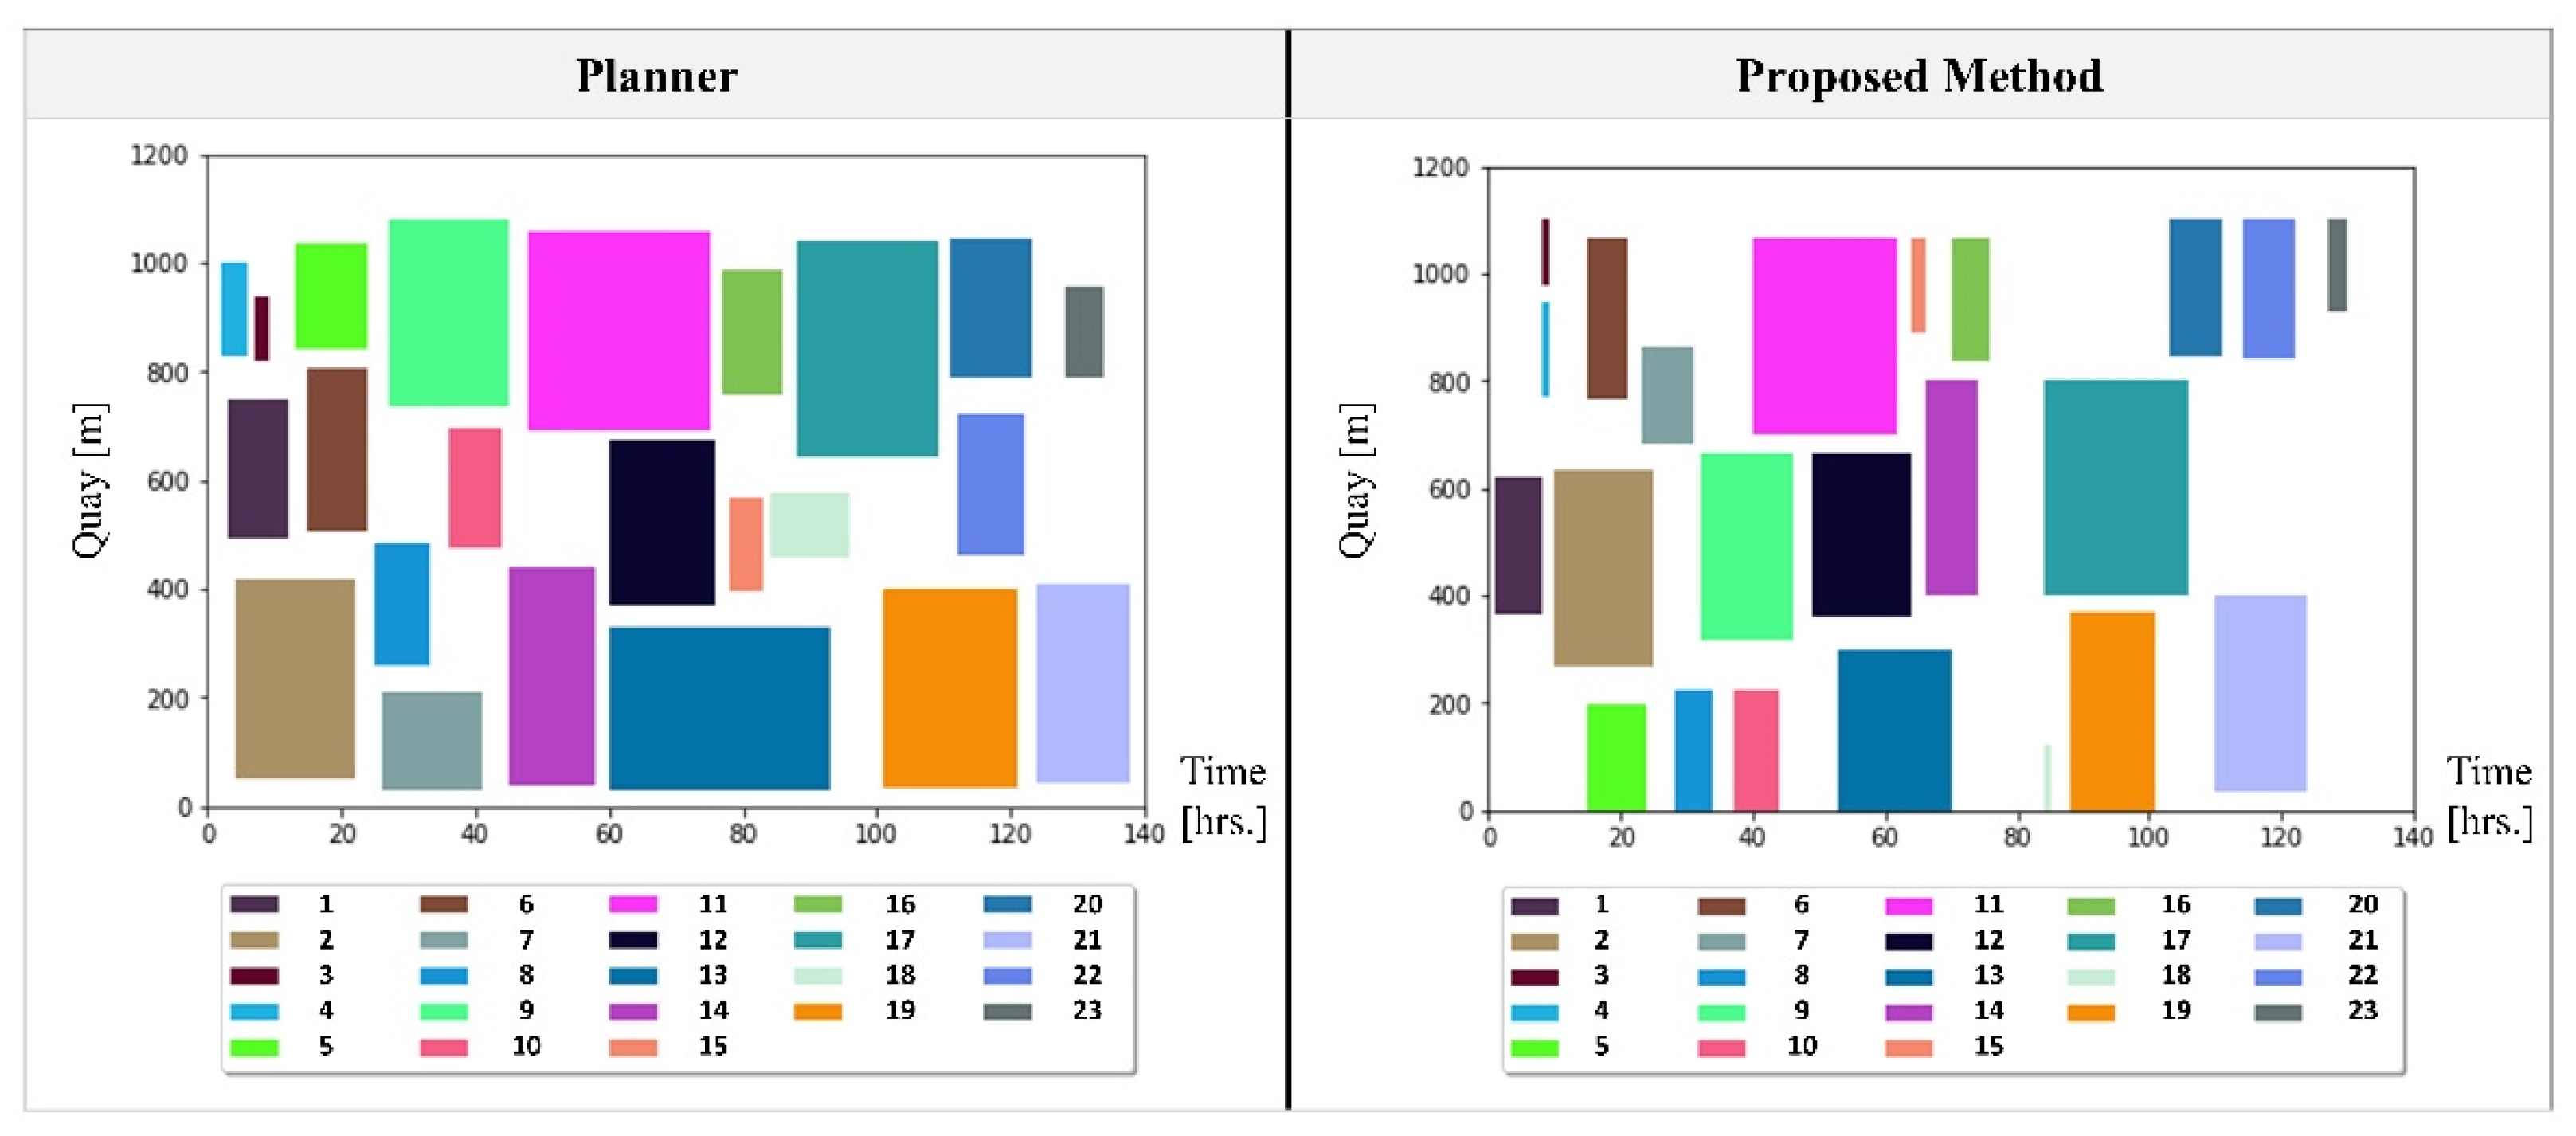
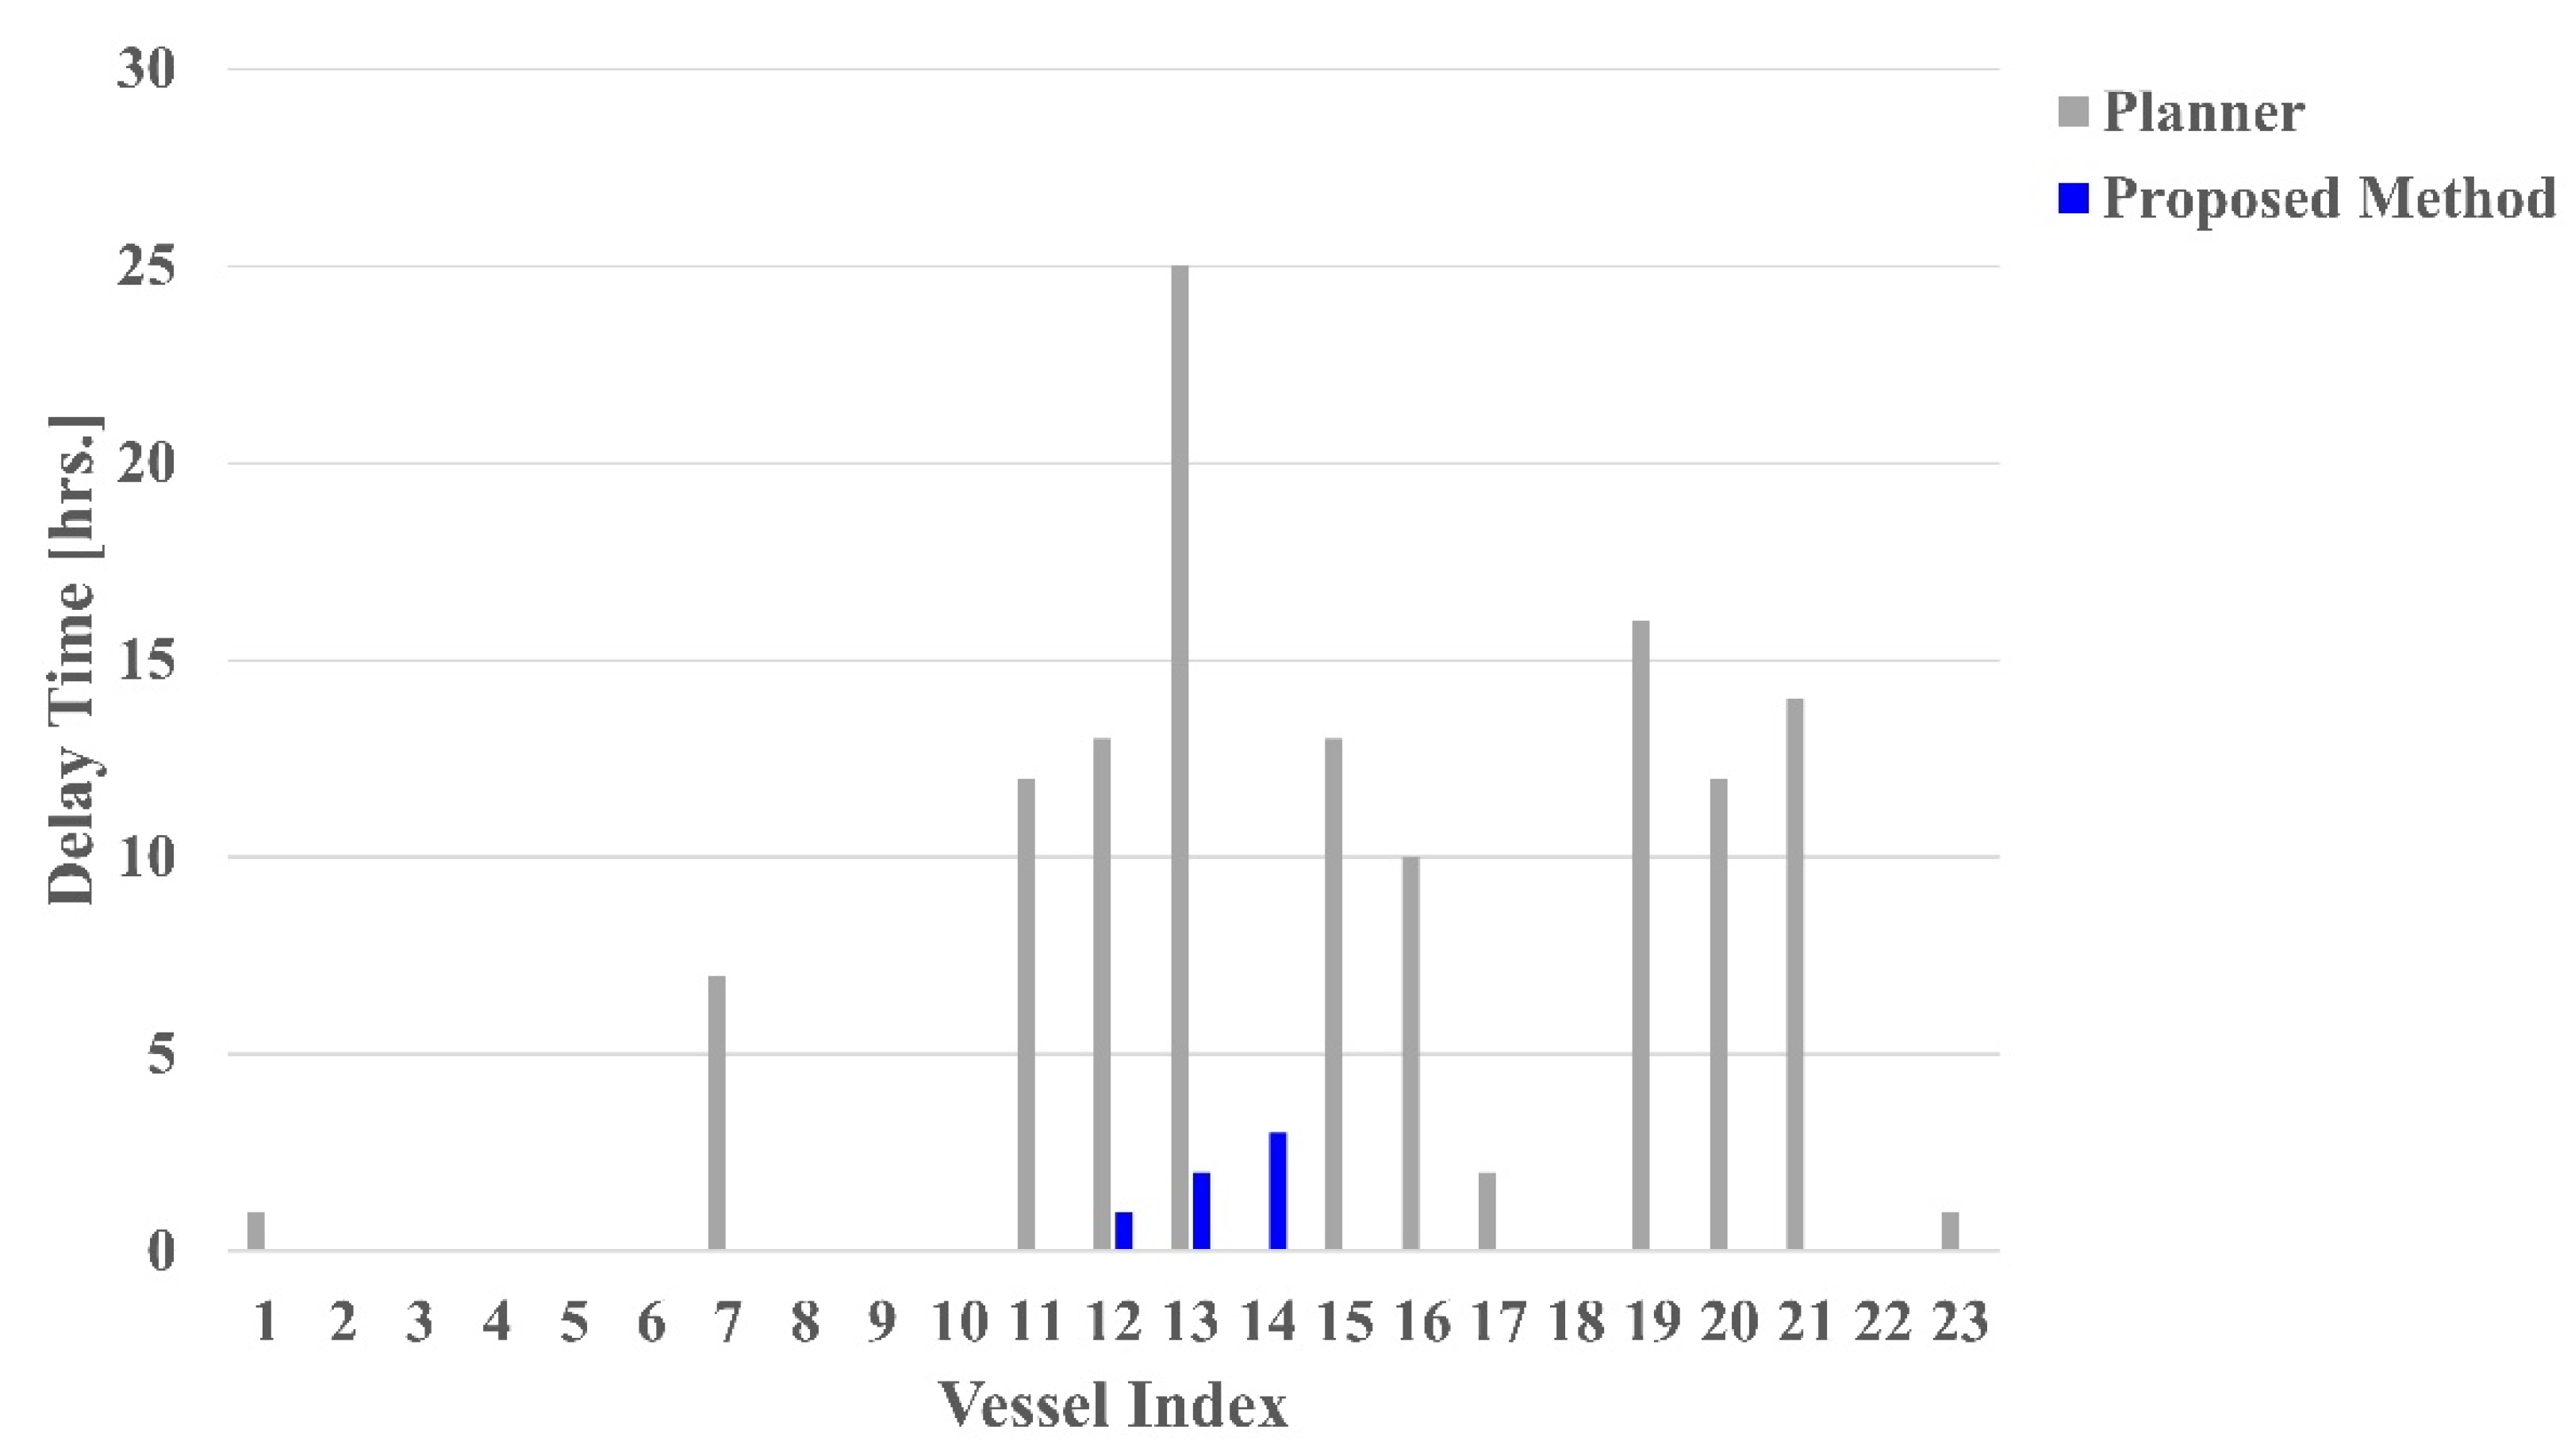
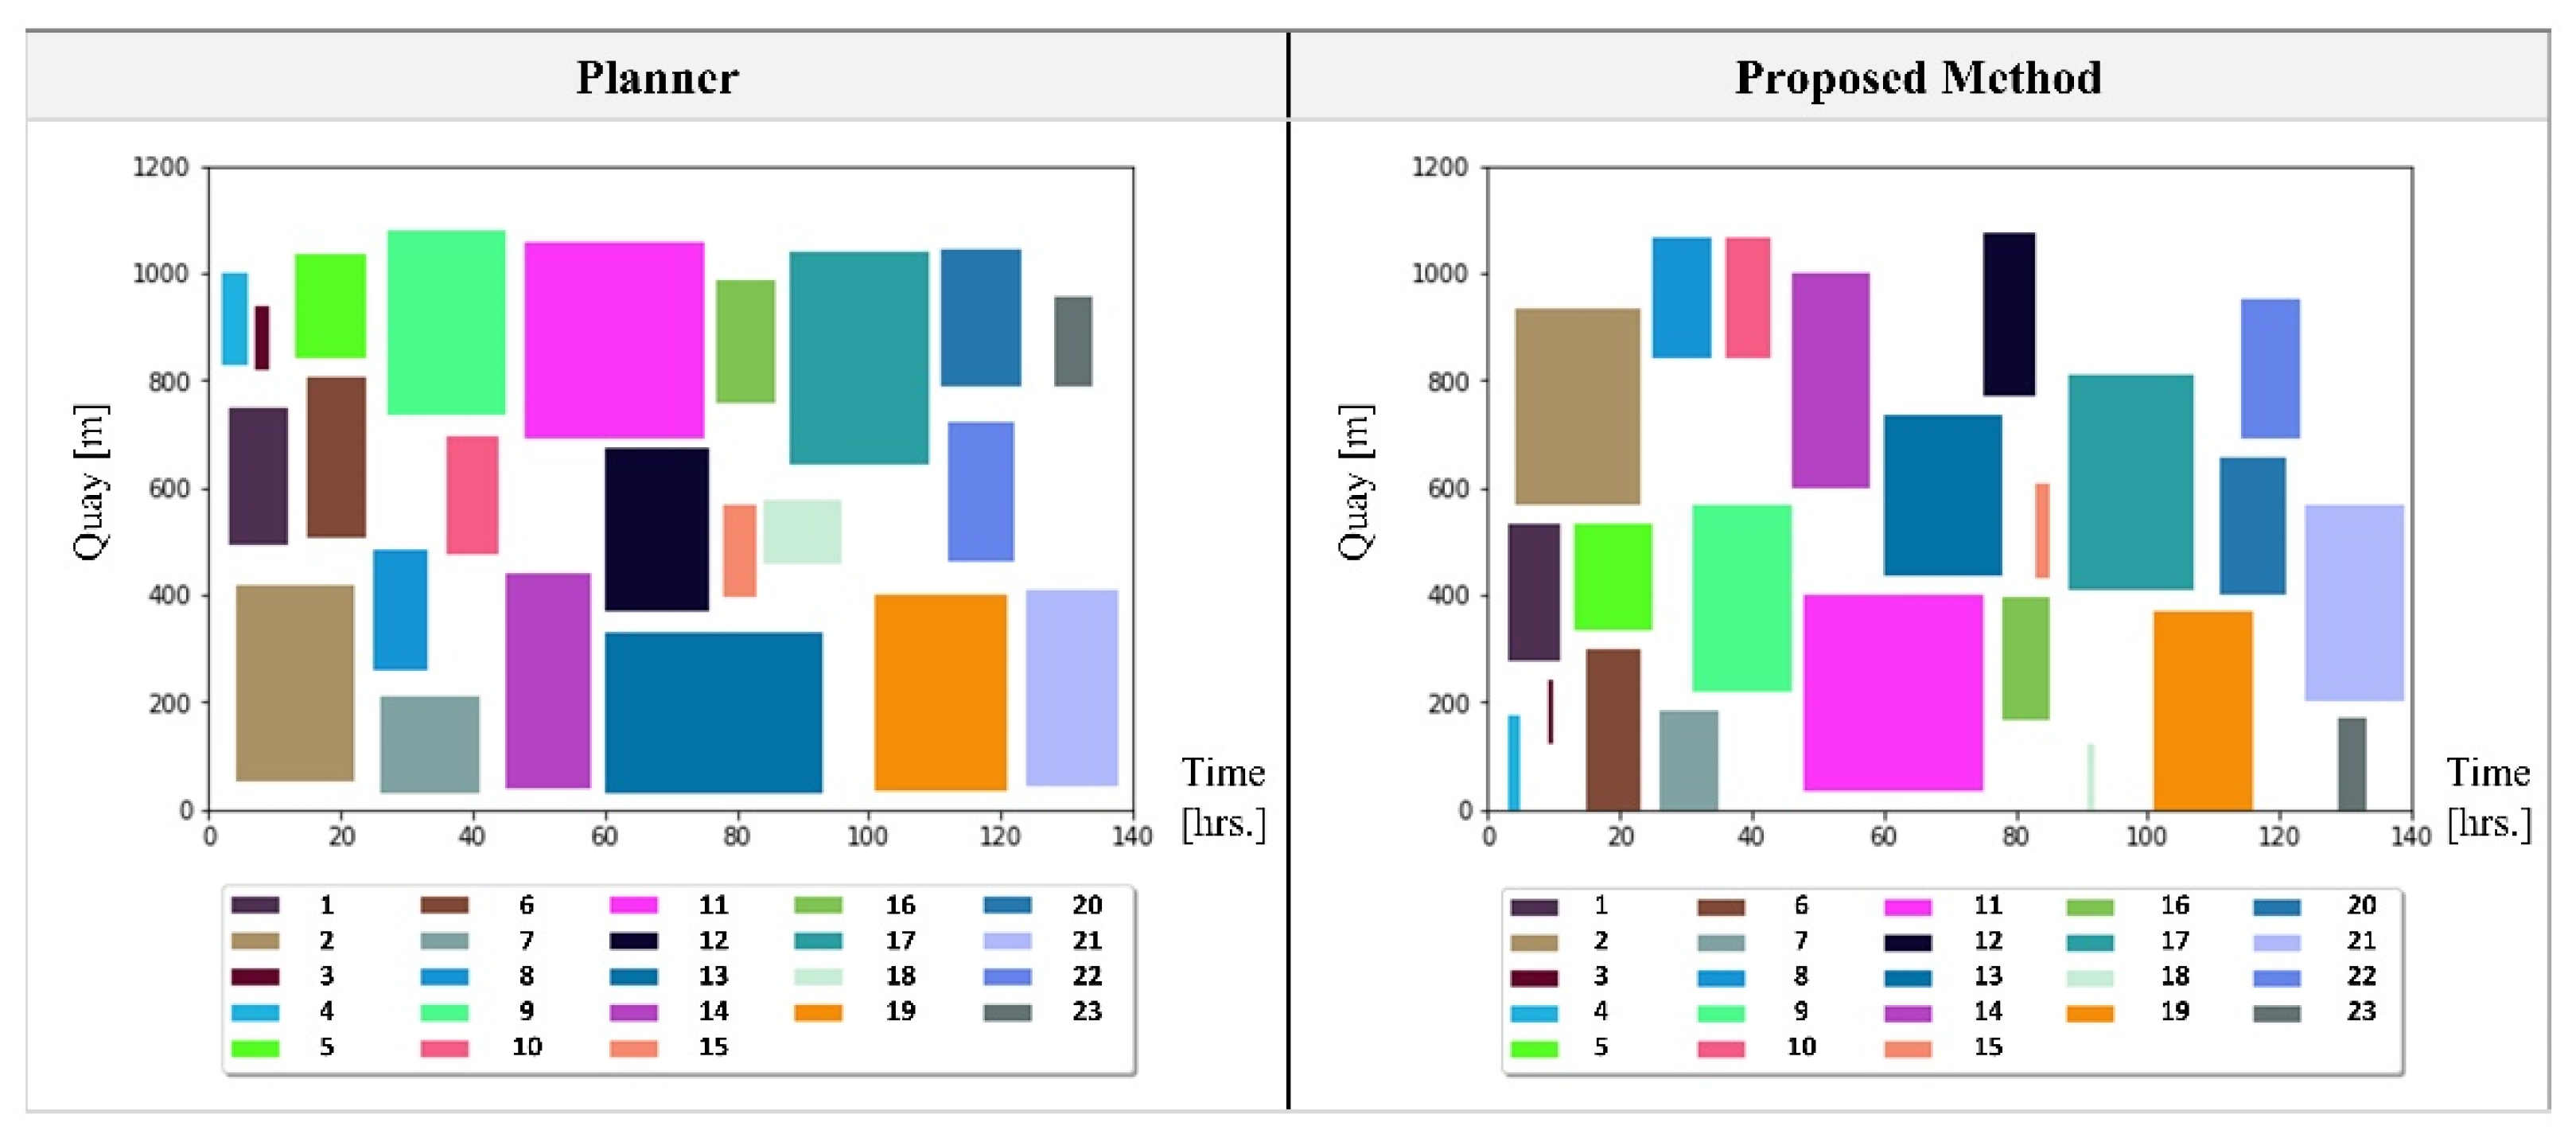
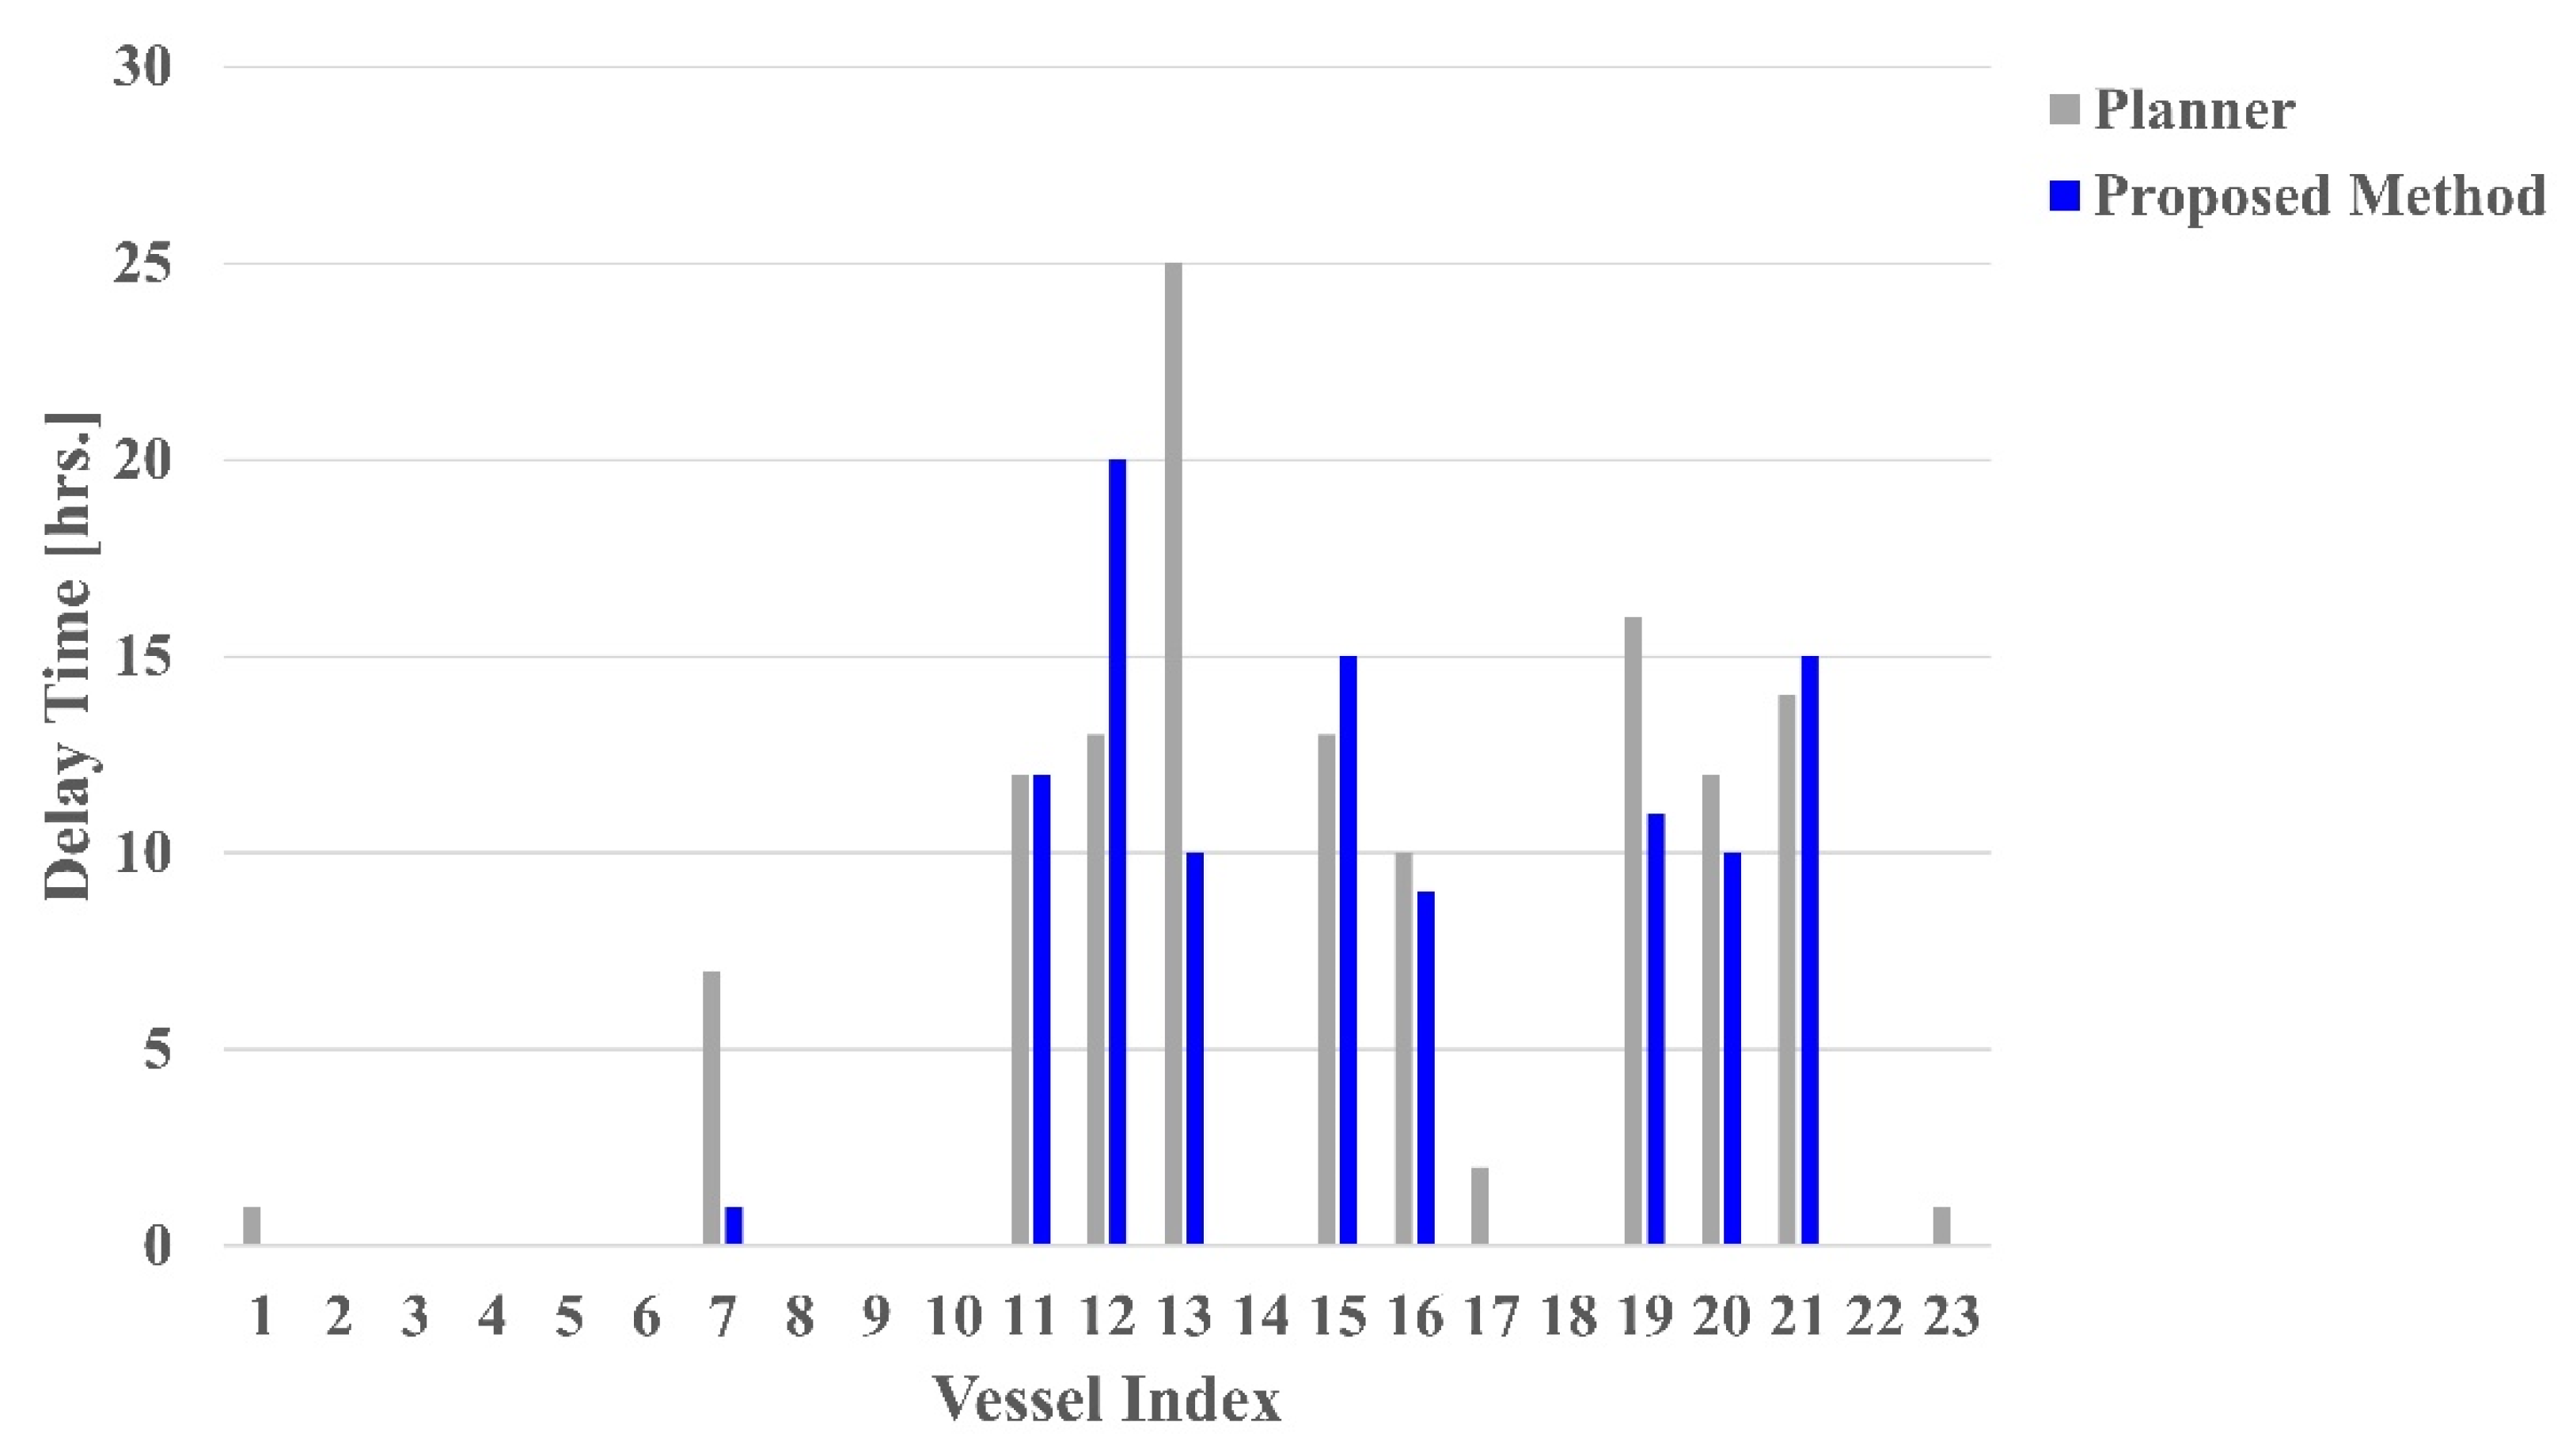
5.3.1. Scenario 1: A Case Where Vessels Can Berth after Their ATA

For the actual planner’s result, as shown in Figure 5, a total of 12 vessels had delayed ETD, which accumulates to 126 h of delay. For the proposed model under Scenario 1, a total of 3 vessels had delays, which accumulate to 6 h of delay. This scenario showed that the penalty cost, the expected cost of reassigning the vessel to other terminals, can be reduced by about 2.23 million dollars.
As can be seen in Figure 6, the proposed method in this study reduced departure delay time on most vessels from the results of the planner. For Vessel 14, a delay did not occur in the result of the planner, but it occurred in the proposed methodology. As the vessel is berthed more greedily than the proposed methodology, vessels arriving at similar times are delayed and it incurs significant costs to the terminal.

5.3.2. Scenario 2: A Case Where Vessels Can Berth after Their ATB

As the result of Scenario 2, the model had a delay of only 8 vessels, which accumulates to 74 h of delay, thus reducing the objective value by 44.67% compared to the planner’s berth allocation results. The expected amount of saved penalty cost by Scenario 2 is about 1.11 million dollars. In Scenario 2, although the vessel’s berthing time had to be determined disadvantageously, the objective value and delay time were generally reduced in comparison with the result of the planner. Significantly, it can be seen in Figure 7 that the handling time for vessels 9, 11, 13, and 19 that were affected by QC allocation and productivity had shorter times compared to the result of a planner.
Figure 8 shows that the proposed method had a lower departure delay on most vessels than the planner’s results. However, compared to Scenario 1, the results of the model also show that there were delays in the departure of vessels.

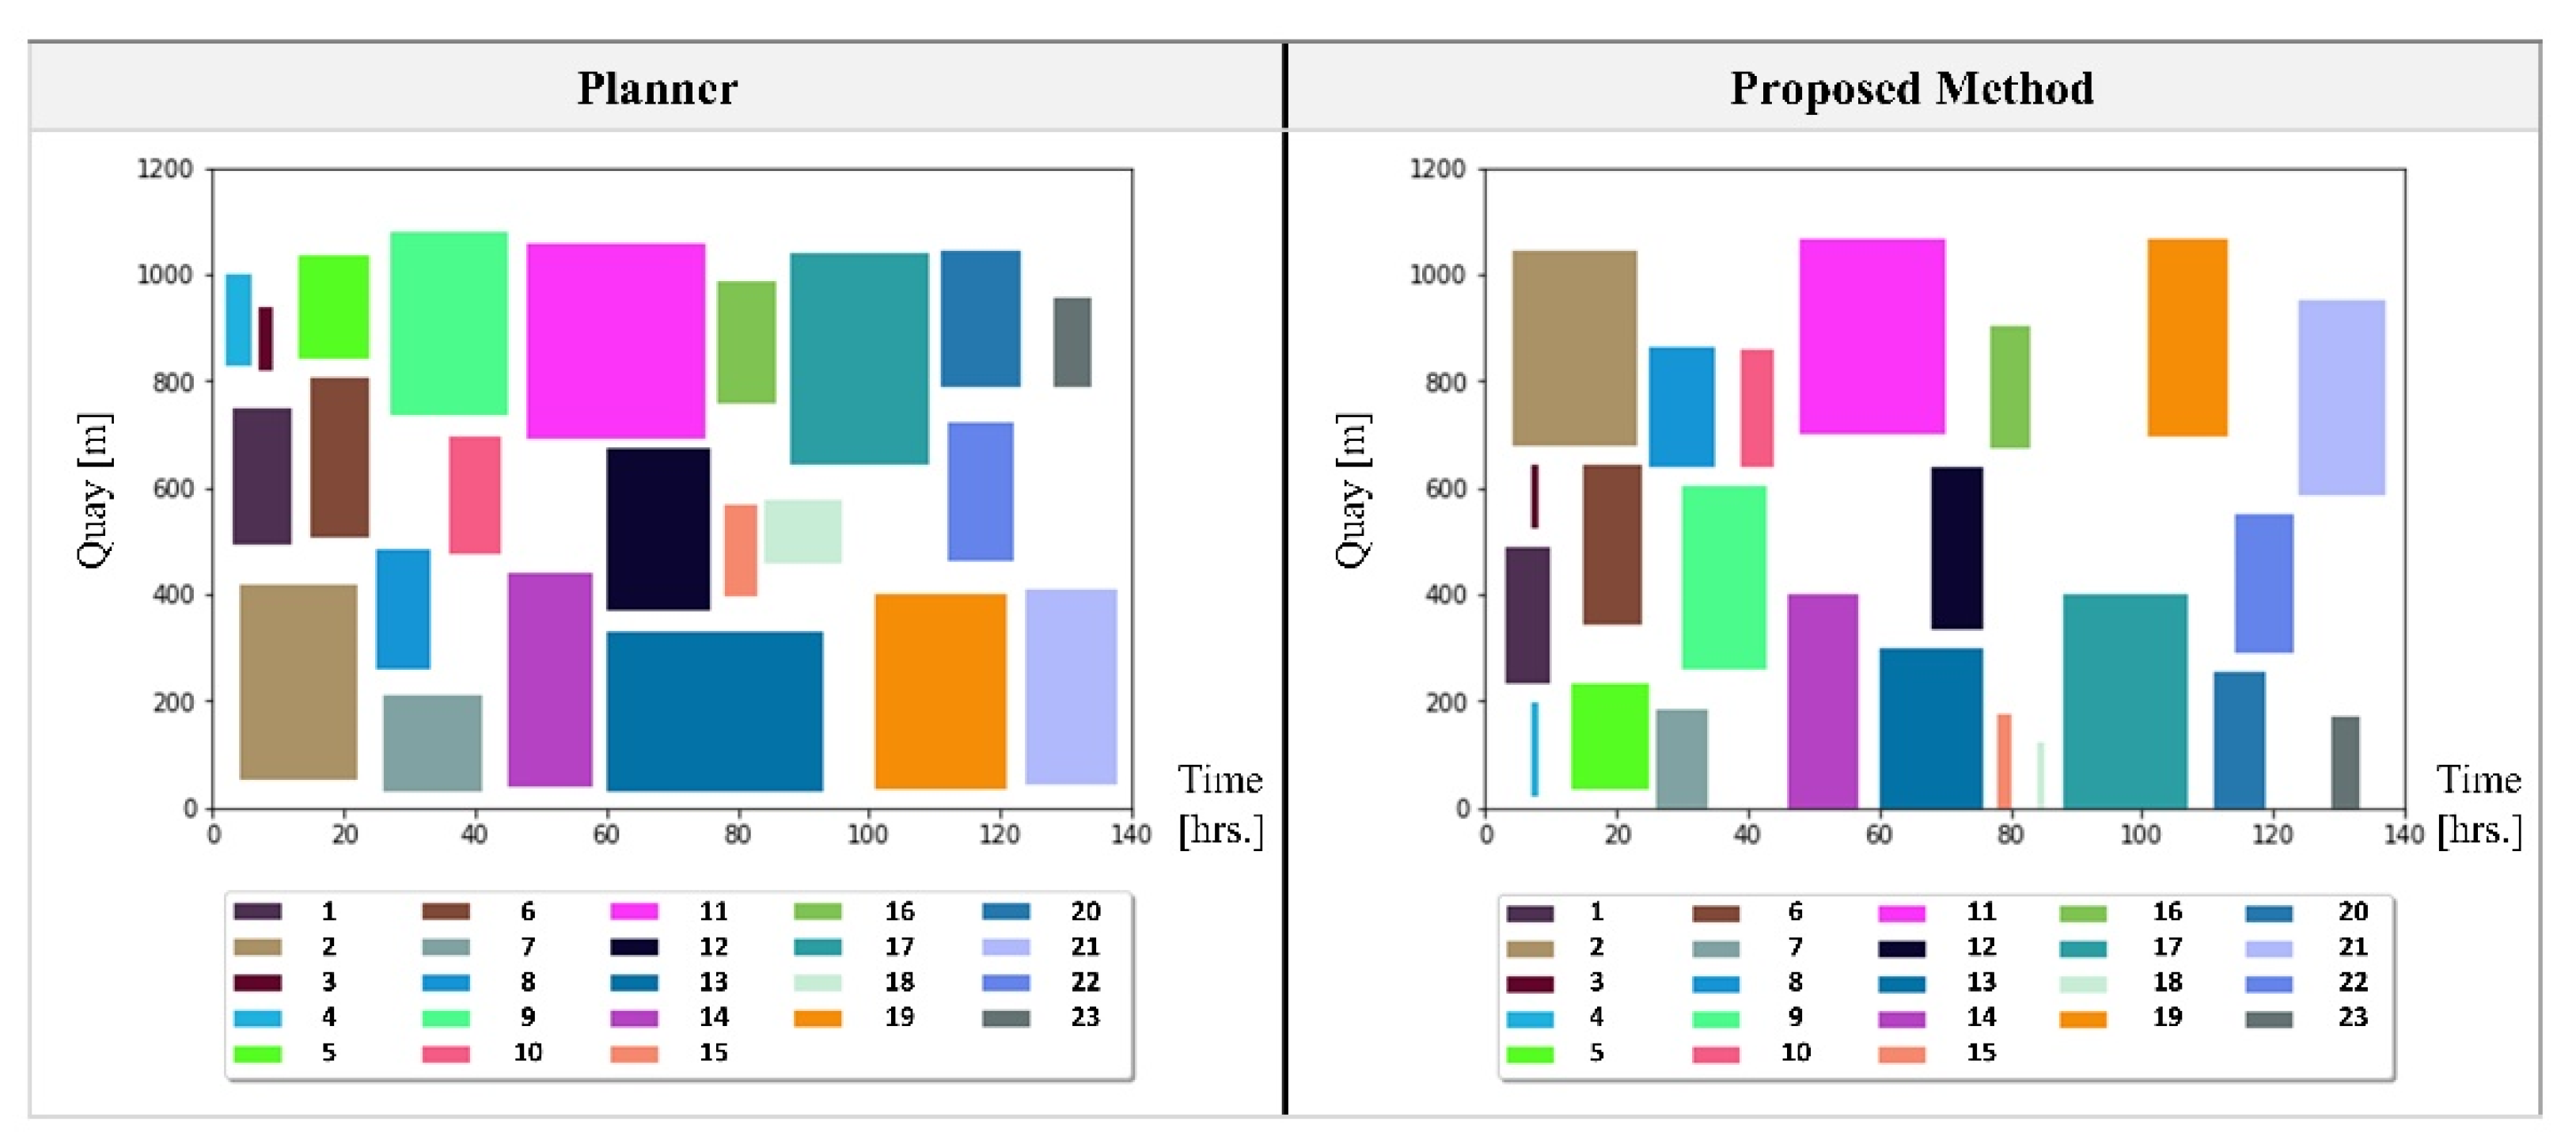
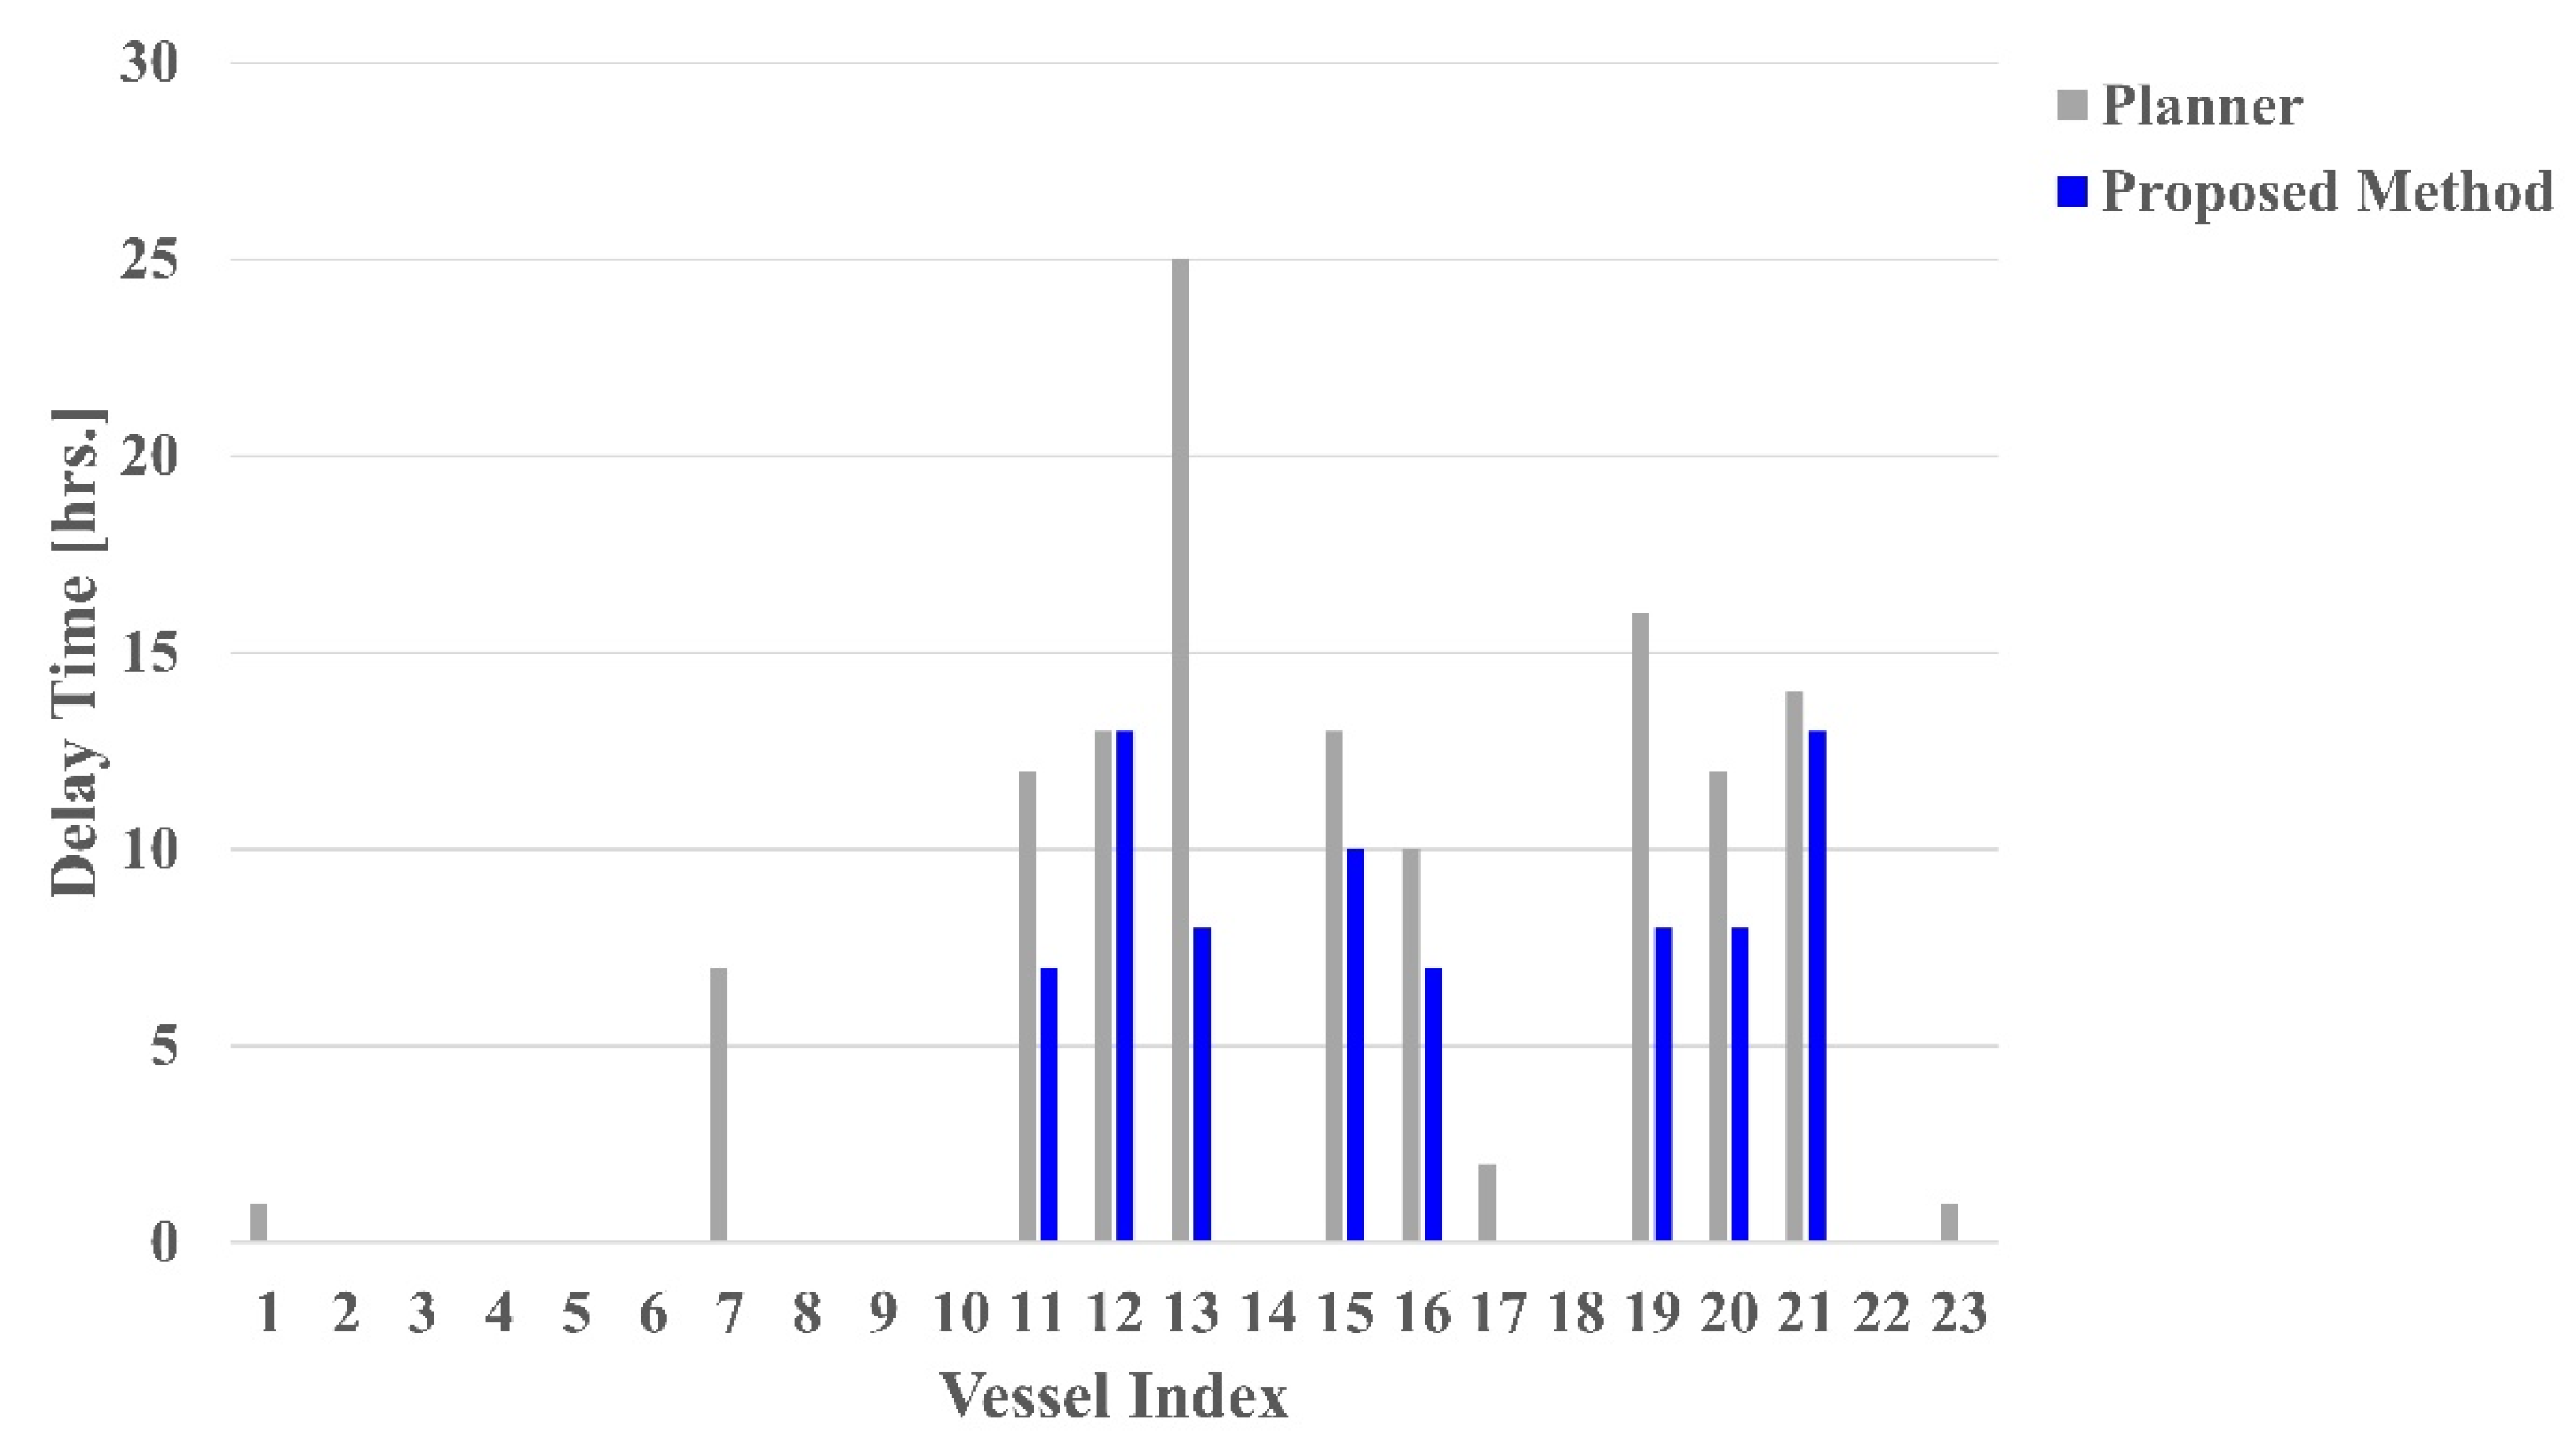
5.3.3. Scenario 3: A Case Where Productivity of QCs Is Reduced

As can be seen in Figure 9, only 9 vessels were delayed, and the total delay time was 103 h, decreasing the objective value by 21.82%. By Scenario 3, the penalty cost corresponding to about 0.55 million dollars can be reduced. Despite the case, where the minimum productivity of the QCs is assumed and takes a longer time to process the vessel, in general, the objective value and delay time was reduced compared to the planner. It means that the strategic method of determining QC allocation based on ETD and penalty cost worked effectively.
In Figure 10, the berth schedule planned by the model resulted in more delay for a few vessels, while the overall cost was reduced by decreasing the delay for other vessels. In particular, vessel 12, which was delayed more in the result of the proposed model than the result of the planner, costs only half as much as vessel 13. It indicates that vessel 12 was strategically delayed to reduce the total cost by allocating QCs to vessel 13 intensively.

6. Conclusions

Since a vessel arrives late due to various uncertainties, the baseline berth plan can no longer be executed, which causes huge financial losses to terminals. To prevent this, we proposed a berth and QC rescheduling strategy that minimizes costs when disruptions occur in the initial plan. A MILP model was formulated and a rolling-horizon approach was suggested to solve the mathematical model effectively. Numerical experiments based on the empirical data from the terminal in Busan were conducted to compare the results of the proposed method with those of a planner. Experimental results show that the delay tendencies of the planner and the proposed method are similar, but overall delay time is reduced in the results of the proposed method. As setting the scenario conservatively, the delay time of the proposed method is gradually increased. Nevertheless, the dynamic rescheduling results in fewer penalty costs than the planner scheduling manually.
It is noted that the optimization for berth rescheduling can be enhanced with taking the information on the uncertainties into account. This is because it can adapt to uncertainties in a robust way and further enrich the proactive approaches for berth planning. If the vessel’s arrival time is predictable through analysis of the vessel’s delay data, it can help predict the expected losses of the terminal due to the possible disruptions and berth rescheduling operation at the planning stage. Then, this anticipation enables to proactively create the berth plan with schedule robustness by minimizing the expected losses in the terminal or reducing the possible occurrence of disruptions. Predictive-based operational logic can realize the global optimization of the terminal through the smart port technology, as collecting real-time information on oceans and terminal, and predicting various port management systems (e.g., berth planning, yard planning) comprehensively.
Furthermore, this study can be extended by taking into account the energy efficiency aspect for next-generation green ports [42]. The integration of energy management and operational improvements can attain energy savings and emission reductions [43].

Author Contributions

Conceptualization, A.K., H.-J.P., J.-H.P., and S.-W.C.; data curation, A.K.; formal analysis, A.K., H.-J.P., and S.-W.C.; funding acquisition, J.-H.P. and S.-W.C.; investigation, A.K. and H.-J.P.; methodology, A.K., H.-J.P., and S.-W.C.; project administration, J.-H.P. and S.-W.C.; resources, J.-H.P. and S.-W.C.; software, H.-J.P. and S.-W.C.; supervision, J.-H.P. and S.-W.C.; validation, A.K.; visualization, A.K.; writing—original draft, A.K. and H.-J.P.; writing—review and editing, J.-H.P. and S.-W.C. All authors have read and agreed to the published version of the manuscript.

Funding

This research is a part of the project titled “Development of Open Platform Technologies for Smart Maritime Safety and Industries” funded by the Korea Research Institute of Ships and Ocean Engineering (PES4070).

Institutional Review Board Statement

Not applicable.

Informed Consent Statement

Not applicable.

Data Availability Statement

Not applicable.

Conflicts of Interest

The authors declare no conflict of interest.

References

  1. Li, M.Z.; Jin, J.G.; Lu, C.X. Real-time disruption recovery for integrated berth allocation and crane assignment in container terminals. Transp. Res. Rec. 2015, 2479, 49–59. [Google Scholar] [CrossRef] [Green Version]
  2. Moorthy, R.; Teo, C.P. Berth management in container terminal: The template design problem. OR Spectr. 2006, 28, 495–518. [Google Scholar] [CrossRef]
  3. Yu, J.; Tang, G.; Song, X.; Yu, X.; Qi, Y.; Li, D.; Zhang, Y. Ship arrival prediction and its value on daily container terminal operation. Ocean. Eng. 2018, 157, 73–86. [Google Scholar] [CrossRef]
  4. Kim, K.H.; Park, Y.M. A Crane Scheduling Method for Port Container Terminals. Eur. J. Oper. Res. 2004, 156, 752–768. [Google Scholar] [CrossRef]
  5. Notteboom, T.E. The time factor in liner shipping services. Marit. Econ. Logist. 2006, 8, 19–39. [Google Scholar] [CrossRef]
  6. Sanchez, R.J.; Hoffmann, J.; Micco, A.; Pizzolitto, G.V.; Sgut, M.; Wilmsmeier, G. Port efficiency and international trade: Port efficiency as a determinant of maritime transport costs. Marit. Econ. Logist. 2003, 5, 199–218. [Google Scholar] [CrossRef]
  7. Notteboom, T.; Rodrigue, J.P. Containerisation, box logistics and global supply chains: The integration of ports and liner shipping networks. Marit. Econ. Logist. 2008, 10, 152–174. [Google Scholar] [CrossRef]
  8. Acciaro, M. A critical review of port pricing literature: What role for academic research? Asian J. Shipp. Logist. 2013, 29, 207–228. [Google Scholar] [CrossRef] [Green Version]
  9. Notteboom, T.; Pallis, T.; Rodrigue, J.P. Disruptions and resilience in global container shipping and ports: The COVID-19 pandemic versus the 2008–2009 financial crisis. Marit. Econ. Logist. 2021, 1, 1–32. [Google Scholar]
  10. Stahlbock, R.; Voß, S. Operations research at container terminals: A literature update. OR Spectr. 2008, 30, 1–52. [Google Scholar] [CrossRef]
  11. Carlo, H.J.; Vis, I.F.; Roodbergen, K.J. Storage yard operations in container terminals: Literature overview, trends, and research directions. Eur. J. Oper. Res. 2014, 235, 412–430. [Google Scholar] [CrossRef]
  12. Vis, I.F. Survey of research in the design and control of automated guided vehicle systems. Eur. J. Oper. Res. 2006, 170, 677–709. [Google Scholar] [CrossRef]
  13. Vis, I.F.; De Koster, R. Transshipment of containers at a container terminal: An overview. Eur. J. Oper. Res. 2003, 147, 1–16. [Google Scholar] [CrossRef]
  14. Monios, J.; Wilmsmeier, G.; Ng, A.K. Port system evolution—The emergence of second-tier hubs. Marit. Policy Manag. 2019, 46, 61–73. [Google Scholar] [CrossRef]
  15. Martin, J.; Thomas, B.J. The container terminal community. Marit. Policy Manag. 2001, 28, 279–292. [Google Scholar] [CrossRef]
  16. Lai, K.K.; Shih, K. A Study of Container Berth Allocation. J. Adv. Transp. 1992, 26, 45–60. [Google Scholar] [CrossRef]
  17. Imai, A.; Nagaiwa, K.I.; Tat, C.W. Efficient Planning of Berth Allocation for Container Terminals in Asia. J. Adv. Transp. 1997, 31, 75–94. [Google Scholar] [CrossRef]
  18. Kim, K.H.; Moon, K.C. Berth Scheduling by Simulated Annealing. Transp. Res. Part B Methodol. 2003, 37, 541–560. [Google Scholar] [CrossRef]
  19. Bierwirth, C.; Meisel, F. A Survey of Berth Allocation and Quay Crane Scheduling Problems in Container Terminals. Eur. J. Oper. Res. 2010, 202, 615–627. [Google Scholar] [CrossRef]
  20. Bierwirth, C.; Meisel, F. A Follow-up Survey of Berth Allocation and Quay Crane Scheduling Problems in Container Terminals. Eur. J. Oper. Res. 2015, 244, 675–689. [Google Scholar] [CrossRef]
  21. Imai, A.; Nishimura, E.; Papadimitriou, S. The Dynamic Berth Allocation Problem for a Container Port. Transp. Res. Part. B Methodol. 2001, 35, 401–417. [Google Scholar] [CrossRef]
  22. Guan, Y.; Cheung, R.K. The Berth Allocation Problem: Models and Solution Methods. OR Spectr. 2004, 26, 75–92. [Google Scholar] [CrossRef]
  23. Imai, A.; Nishimura, E.; Hattori, M.; Papadimitriou, S. Berth Allocation at Indented Berths for Mega-containerships. Eur. J. Oper. Res. 2007, 179, 579–593. [Google Scholar] [CrossRef] [Green Version]
  24. Wang, F.; Lim, A. A Stochastic Beam Search for the Berth Allocation Problem. Decis. Support Syst. 2007, 42, 2186–2196. [Google Scholar] [CrossRef]
  25. Ting, C.J.; Wu, K.C.; Chou, H. Particle Swarm Optimization Algorithm for the Berth Allocation Problem. Expert Syst. Appl. 2014, 41, 1543–1550. [Google Scholar] [CrossRef]
  26. Guan, Y.; Xiao, W.Q.; Cheung, R.K.; Li, C.L. A Multiprocessor Task Scheduling Model for berth Allocation: Heuristic and Worst-case Analysis. Oper. Res. Lett. 2002, 30, 343–350. [Google Scholar] [CrossRef]
  27. Park, Y.M.; Kim, K.H. A scheduling method for Berth and Quay cranes. OR Spectr. 2003, 25, 1–23. [Google Scholar] [CrossRef]
  28. Vacca, I.; Salani, M.; Bierlaire, M. An exact algorithm for the integrated planning of berth allocation and quay crane assignment. Transp. Sci. 2013, 47, 148–161. [Google Scholar] [CrossRef] [Green Version]
  29. Meisel, F.; Bierwirth, C. Heuristics for the Integration of Crane Productivity in the Berth Allocation Problem. Transp. Res. Part E: Logist. Transp. Rev. 2009, 45, 196–209. [Google Scholar] [CrossRef]
  30. Iris, Ç.; Pacino, D.; Ropke, S.; Larsen, A. Integrated berth allocation and quay crane assignment problem: Set partitioning models and computational results. Transp. Res. Part E Logist. Transp. Rev. 2015, 81, 75–97. [Google Scholar] [CrossRef] [Green Version]
  31. Iris, Ç.; Pacino, D.; Ropke, S. Improved Formulations and an Adaptive Large Neighborhood Search Heuristic for the Integrated Berth Allocation and Quay Crane Assignment Problem. Transp. Res. Part E Logist. Transp. Rev. 2017, 105, 123–147. [Google Scholar] [CrossRef]
  32. Zhou, P.F.; Kang, H.G. Study on Berth and Quay-crane Allocation under Stochastic Environments in Container Terminal. Syst. Eng. Theory Pract. 2008, 28, 161–169. [Google Scholar] [CrossRef]
  33. Zhen, L.; Lee, L.H.; Chew, E.P. A decision model for berth allocation under uncertainty. Eur. J. Oper. Res. 2011, 212, 54–68. [Google Scholar] [CrossRef]
  34. Xu, Y.; Chen, Q.; Quan, X. Robust berth scheduling with uncertain vessel delay and handling time. Ann. Oper. Res. 2012, 192, 123–140. [Google Scholar] [CrossRef]
  35. Zhen, L. Tactical berth allocation under uncertainty. Eur. J. Oper. Res. 2015, 247, 928–944. [Google Scholar] [CrossRef]
  36. Iris, Ç.; Lam, J.S.L. Recoverable robustness in weekly berth and quay crane planning. Transp. Res. Part B Methodol. 2019, 122, 365–389. [Google Scholar] [CrossRef]
  37. Zeng, Q.; Yang, Z.; Hu, X. Disruption Recovery Model for Berth and Quay Crane Scheduling in Container Terminals. Eng. Optim. 2011, 43, 967–983. [Google Scholar] [CrossRef]
  38. Umang, N.; Bierlaire, M.; Erera, A.L. Real-time management of berth allocation with stochastic arrival and handling times. J. Sched. 2017, 20, 67–83. [Google Scholar] [CrossRef] [Green Version]
  39. Xiang, X.; Liu, C.; Miao, L. Reactive strategy for discrete berth allocation and quay crane assignment problems under uncertainty. Comput. Ind. Eng. 2018, 126, 196–216. [Google Scholar] [CrossRef]
  40. Lv, X.; Jin, J.G.; Hu, H. Berth allocation recovery for container transshipment terminals. Marit. Policy Manag. 2020, 47, 558–574. [Google Scholar] [CrossRef]
  41. Cho, S.W.; Park, H.J.; Lee, C. An integrated method for berth allocation and quay crane assignment to allow for reassignment of vessels to other terminals. Marit. Econ. Logist. 2021, 23, 123–153. [Google Scholar] [CrossRef]
  42. Iris, Ç.; Lam, J.S.L. Optimal energy management and operations planning in seaports with smart grid while harnessing renewable energy under uncertainty. Omega 2021, 102445. [Google Scholar] [CrossRef]
  43. Iris, Ç.; Lam, J.S.L. A review of energy efficiency in ports: Operational strategies, technologies and energy management systems. Renew. Sustain. Energy Rev. 2019, 112, 170–182. [Google Scholar] [CrossRef]
Figure 1. Time-space diagram.
Jmse 09 00527 g001
Figure 2. An example of QCAP.
Jmse 09 00527 g002
Figure 3. Conceptual framework to model a dynamic berth rescheduling problem.
Jmse 09 00527 g003
Figure 4. Rolling-horizon with reallocation of berth and QCs.
Jmse 09 00527 g004
Figure 5. The result of Scenario 1.
Jmse 09 00527 g005
Figure 6. Departure delay time by vessel in Scenario 1.
Jmse 09 00527 g006
Figure 7. The result of Scenario 2.
Jmse 09 00527 g007
Figure 8. Departure delay time by vessel in Scenario 2.
Jmse 09 00527 g008
Figure 9. The result of Scenario 3.
Jmse 09 00527 g009
Figure 10. Departure delay time by vessel in Scenario 3.
Jmse 09 00527 g010
Table 1. Summary of the experiment scenarios.
Scenario 1 Ω = { ω   |   E T A i = A T A i   f o r   a l l   v e s s e l s   i ,     p = 30   f o r   a l l   Q C s }
Scenario 2 Ω = { ω   |   E T A i = A T B i   f o r   a l l   v e s s e l s   i ,     p = 30   f o r   a l l   Q C s }
Scenario 3 Ω = { ω   |   E T A i = A T B i   f o r   a l l   v e s s e l s   i ,     p = 25   f o r   a l l   Q C s }
Publisher’s Note: MDPI stays neutral with regard to jurisdictional claims in published maps and institutional affiliations.

