
Impact of Typhoons on Floating Offshore Wind Turbines: A Case Study of Typhoon Mangkhut

1
Navigation College, Dalian Maritime University, No.1 Linghai Road, Dalian 116026, China
2
State Key Laboratory of Coastal & Offshore Engineering, Dalian University of Technology, No.2 Linggong Road, Dalian 116024, China
3
School of Naval Architecture, Dalian University of Technology, No.2 Linggong Road, Dalian 116024, China
*
Authors to whom correspondence should be addressed.
J. Mar. Sci. Eng. 2021, 9(5), 543; https://0-doi-org.brum.beds.ac.uk/10.3390/jmse9050543
Submission received: 8 April 2021
/
Revised: 6 May 2021
/
Accepted: 10 May 2021
/
Published: 17 May 2021
(This article belongs to the Special Issue FOWT–Floating Offshore Wind Turbine: Experimental and Numerical Modelling of Motion Behaviour in Waves, Wind and Current)
Abstract
:A typhoon is a restrictive factor in the development of floating wind power in China. However, the influences of multistage typhoon wind and waves on offshore wind turbines have not yet been studied. Based on Typhoon Mangkhut, in this study, the characteristics of the motion response and structural loads of an offshore wind turbine are investigated during the travel process. For this purpose, a framework is established and verified for investigating the typhoon-induced effects of offshore wind turbines, including a multistage typhoon wave field and a coupled dynamic model of offshore wind turbines. On this basis, the motion response and structural loads of different stages are calculated and analyzed systematically. The results show that the maximum response does not exactly correspond to the maximum wave or wind stage. Considering only the maximum wave height or wind speed may underestimate the motion response during the traveling process of the typhoon, which has problems in guiding the anti-typhoon design of offshore wind turbines. In addition, the coupling motion between the floating foundation and turbine should be considered in the safety evaluation of the floating offshore wind turbine under typhoon conditions.
1. Introduction
With the guidance of the world energy strategy, clean energy is developing rapidly. One essential research direction for clean energy development is offshore wind power. This frontier field has advantages including abundant reserves and a wide distribution. Additionally, offshore wind power technology does not occupy land resources and is close to the power load center. In the future, this technology will gradually extend to the deep sea. As the main force of deep-sea development, the floating wind turbine uses a floating platform as a support to eliminate the constraints of different seabed conditions and has excellent development potential. However, in the process of developing offshore wind power in China, typhoons are an unavoidable problem. On average, nine typhoons land on the southeast coast of China every year [1]. Typhoons are intensive ocean forces that can destroy coastal properties or offshore engineering structures, leading to significant economic losses [2]. Generally, typhoon-induced waves are characterized by extreme heights [3,4], which pose a substantial threat to the stability and structural integrity of floating foundations [5,6,7].
Nevertheless, most studies are based on the annual extreme value sampling method to select combined working conditions and directly simulate typhoon waves with a wave spectrum (mainly the JONSWAP spectrum) [8]. The wave spectrum can simulate a typhoon wave through the basic parameters in order to calculate the motion response and wave loads of a floating wind turbine, which means that the wave spectrum’s shape development will significantly affect the prediction results. Additionally, the JONSWAP spectrum was derived from the long-term observation data of waves in the North Sea. Due to the differences in the water depth, water temperature, and meteorological conditions, the simulation of the sea conditions of the South China Sea directly by the JONSWAP spectrum is not suitable, so the critical spectral parameters need to be modified.
Moreover, the direct parameterization of typhoon waves cannot fully reveal its dynamic mechanism. The current parameterization process mainly simulates the prevailing situation of a wind wave. This process is primarily used near the typhoon’s center and is not suitable for the entire typhoon wave field. The characteristics of wind waves, swells, and mixed waves under typhoon sea conditions are distinct, and the dominant part of the swells needs to be considered. Many research results verified this conclusion [9,10,11,12]. Therefore, it is necessary to establish an accurate and reliable wave model to simulate the whole typhoon process.
The anti-typhoon design of offshore wind turbines is a crucial problem that needs to be addressed to realize the large-scale development of wind energy [13]. The primary purpose of analyzing typhoon-induced impacts during the whole travel process is to determine a more reasonable and reliable approach for offshore wind turbine design. Therefore, the study of offshore wind turbines at different typhoon-influenced stages is very important for anti-typhoon design and the safe operation of wind energy utilization.
To investigate the differences in the wave characteristics at different stages and their effects on offshore wind turbines, this paper presents a study on the typhoon-induced response of wind turbines considering multistage influences. First, a simulation method of the typhoon wind field is proposed based on the Holland model combined with the European Centre for Medium-Range Weather Forecast (ECMWF) data. Second, a multibody dynamic model of floating wind turbines is established, and the accuracy of the model is verified. Finally, the motion response of the floating platform and structural load of the tower, blades, and mooring lines are examined, and the multistage influences are discussed.
2. Environmental Conditions and Floating Wind Turbine System
2.1. Environmental Conditions
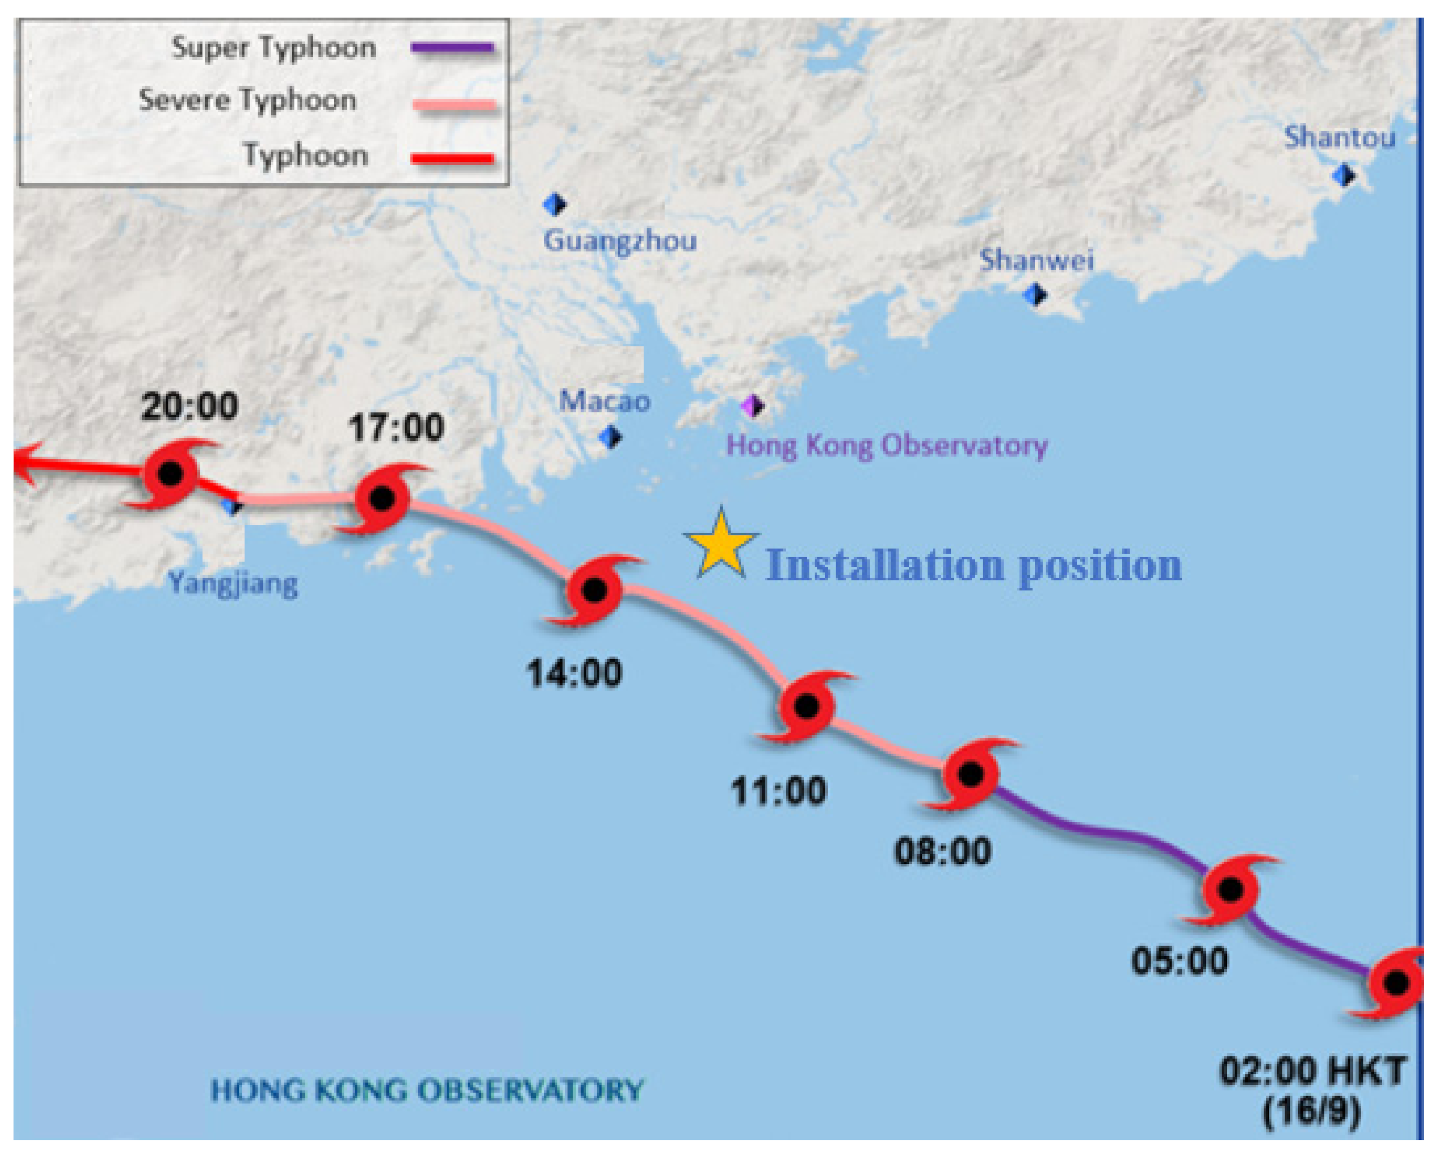
The environmental conditions in this paper are based on the evolution of Typhoon Mangkhut (international designation: 1822) at 114° E and 21.48° N within 48 h (from 8:00 on 15 September 2018 to 8:00 on 17 September 2018). Typhoon Mangkhut formed in the western Pacific region on 7 September 2018 and then progressed all the way to the west and continued to intensify. The typhoon made landfall on the northeastern coast of Luzon Island in the early morning of 15 September (super typhoon, wind speed 65 m/s) and landed on the coast of Taishan city, Guangdong Province at approximately 09:00 on 16 September (strong typhoon, wind speed 45 m/s). Figure 1 shows the track of Typhoon Mangkhut and the target installation position of the wind farm.
2.2. Numerical Model of the Floating Wind Turbine System
2.2.1. Floating Wind Turbine
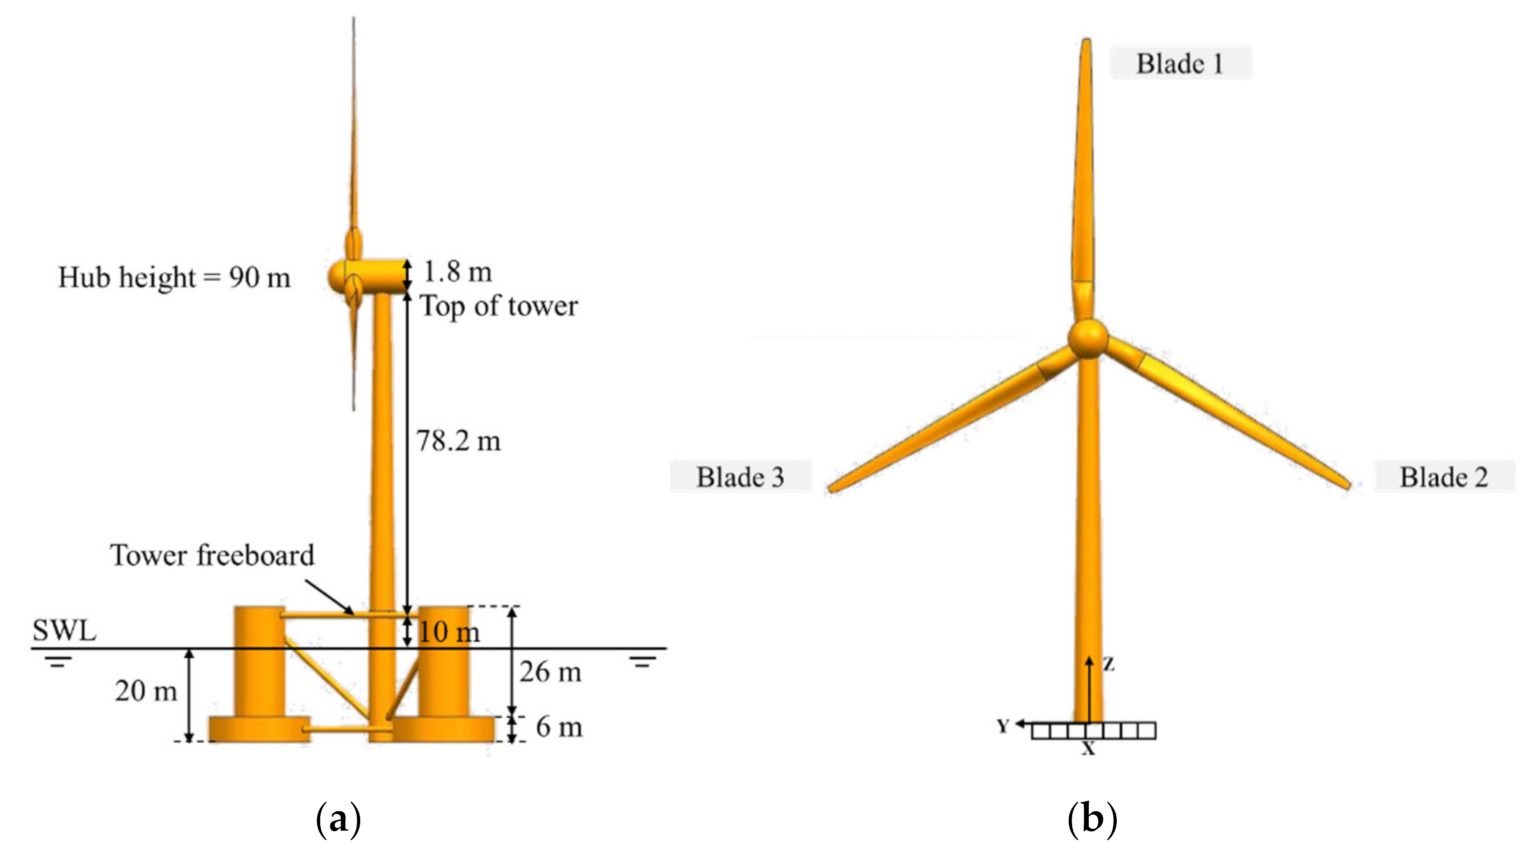
Considering that the dominant water depth of the target wind farm varies from 100 m to 200 m, the OC4-DeepCwind semi-submersible floating wind turbine is selected as the reference platform [14]. The upper wind turbine is the NREL 5-MW baseline wind turbine developed by the National Renewable Energy Laboratory (NREL) [15]. The rotor diameter and hub heights are 126.0 m and 90.0 m above the still water line (SWL), respectively. The OC4-DeepCwind semi-submersible platform consists of three offset columns with large-diameter lower bases, one center column for supporting the turbine, and a series of horizontal and diagonal cross bracings. The overall conceptual configuration of the floating wind turbine is shown in Figure 2. The gross properties of the platform are given in Table 1.
2.2.2. Mooring System
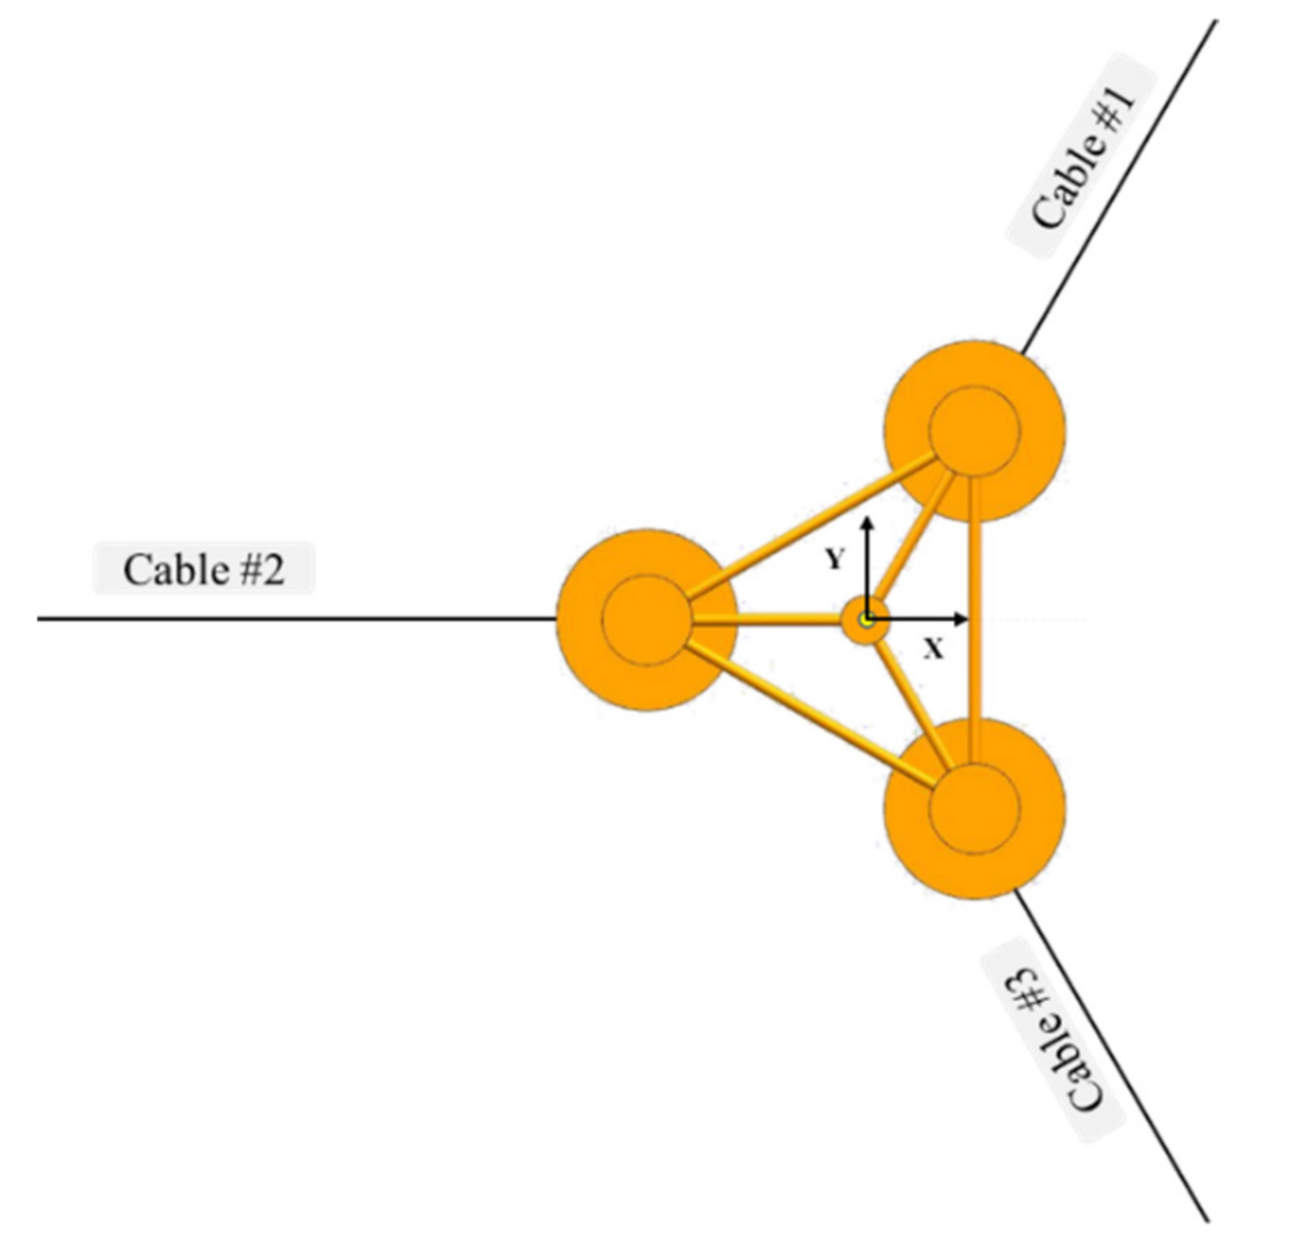
The mooring system for the DeepCwind semi-submersible platform consists of three catenary lines that provide the primary global restoring forces for platform motion. The relevant information for the mooring system is listed in Table 2. The three mooring cables are oriented at 60°, 180°, and 300° (cables 1, 2, and 3, respectively) about the heave axis with 0° aligned with the surge axis (see Figure 3).
3. Numerical Typhoon Model
3.1. Wave Model
The SWAN model, which is a numerical wave model based on an energy balance equation [16], is adopted to simulate the typhoon wave field. Physical processes such as wave generation and dissipation are comprehensively considered in this model and can be applied to large-scale sea areas and coastal regions. The relationship between the wave variance spectrum or energy density and the evolution of the action density can be defined as:
where and represent the wave energy over (radian) frequencies and propagation directions, respectively. The change rate of the action density can be expressed by the action balance equation:
where and represent two-dimensional geographical space and time coordinates, respectively; and are the propagation velocities in space; and are the propagation velocities in spectral space ; is the nonconservative source/sink term, which consists of the input term of the wind , the dissipation , and the nonlinear wave-wave interaction term . The source term is defined as follows:
The dissipation of the wave energy mainly considers three different dissipation mechanisms: white capping , bottom friction , and depth-induced breaking . In deep water, white capping is the main factor that controls the saturation of the high-frequency part of the spectrum:
where is a steepness-dependent coefficient; is the wavenumber; and and represent the mean frequency and mean wavenumber respectively. Bottom friction is expressed as:
where is the bottom friction coefficient, which generally depends on the trajectory of the bottom water mass point.
3.2. Wind Field
The quality of the wind field has a significant impact on the simulation results when the simulating waves are under a typhoon event. Large deviations are generally caused by the wind field data rather than the wave model itself. The observation of the wind speed during typhoon movement is not easy, and wind speed remote sensing data are obviously small near the typhoon center [17]. Therefore, at present, researchers generally use the typhoon pressure field to calculate the typhoon wind field based on the principle of the gradient wind [18,19], including theoretical pressure models and empirical models. The wind field calculated by the typhoon pressure field is synthesized with the wind field measured by remote sensing. In addition to restoring the wind field during the transit of the typhoon, the wind field far away from the center of the typhoon after the typhoon is generated and attenuated can also be more accurately considered. In this study, the wind field is simulated by the Holland model combined with the ECMWF data.
3.2.1. Holland Model
Based on the exponential pressure distribution model [20], Australian scholar Holland [21] introduced a typhoon wind field shape parameter to describe the radial distribution of the pressure:
where is the pressure at radius ; is the minimum pressure in the typhoon center; is the difference between the peripheral pressure and central pressure; is the radius of the maximum wind speed. By introducing the gradient wind equation, Holland deducted the exponential distribution formula of the radial wind speed in the range of :
where refers to the gradient wind speed at radius ; is the Coriolis parameter (; is the rotational angular velocity of the earth; is the geographic latitude); is air the density. The peripheral pressure of the typhoon is generally taken as 1010 hPa in the Northwest Pacific; and are scale parameters related to the influence scope and intensity of a tropical cyclone, and and satisfy the following requirements: . In this paper, the maximum wind speed radius obtained by fitting the upper wind speed of several hurricanes by Willoughby is shown in Equation (8), and the dimensionless parameter deduced by Vickery by fitting the measured surface wind speed is shown in Equation (9).
where denotes the latitude.
3.2.2. ECFWM Model
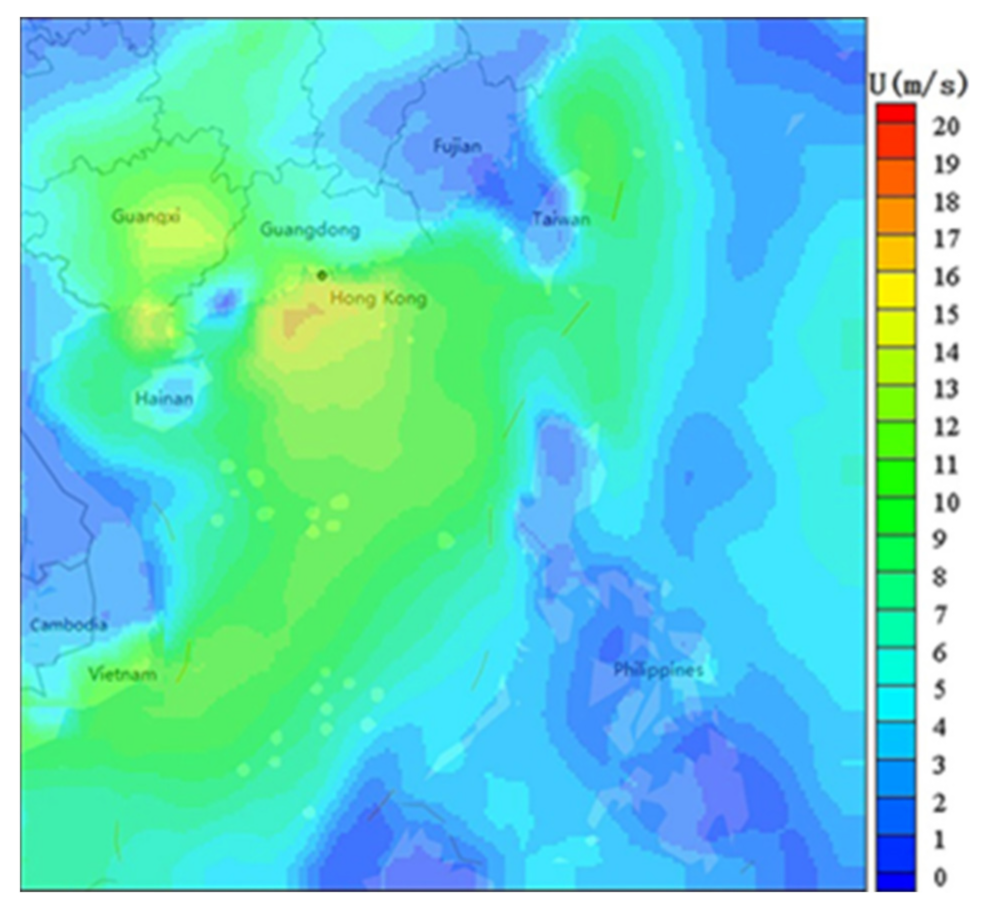
The ECMWF provides global grid data four times at 6-h intervals a day. The minimum resolution of the grid plane is 0.125° × 0.125°, and there are 60 layers of layered data, including the temperature, pressure, and potential. The ground data include the temperature, pressure, etc. In this study, the wind field data 10 m above the sea surface are employed, as shown in Figure 4.
3.2.3. Synthetic Wind Field
The synthetic wind field is constructed using the wind field obtained by the Holland model and ECMWF data. The wind field of the Holland model and ECMWF data is superposed with a certain weight coefficient to construct the corresponding SWAN model wind field:
where is the synthetic wind field; is the Holland model wind field; is the ECMWF sea surface wind field; and is the weight coefficient, which is expressed as:
where is the typhoon influence area coefficient, ; is the distance between the calculation point and typhoon center (km); if , then the ECMWF wind field is taken. The synthetic wind field of Typhoon Mangkhut is shown in Figure 5.
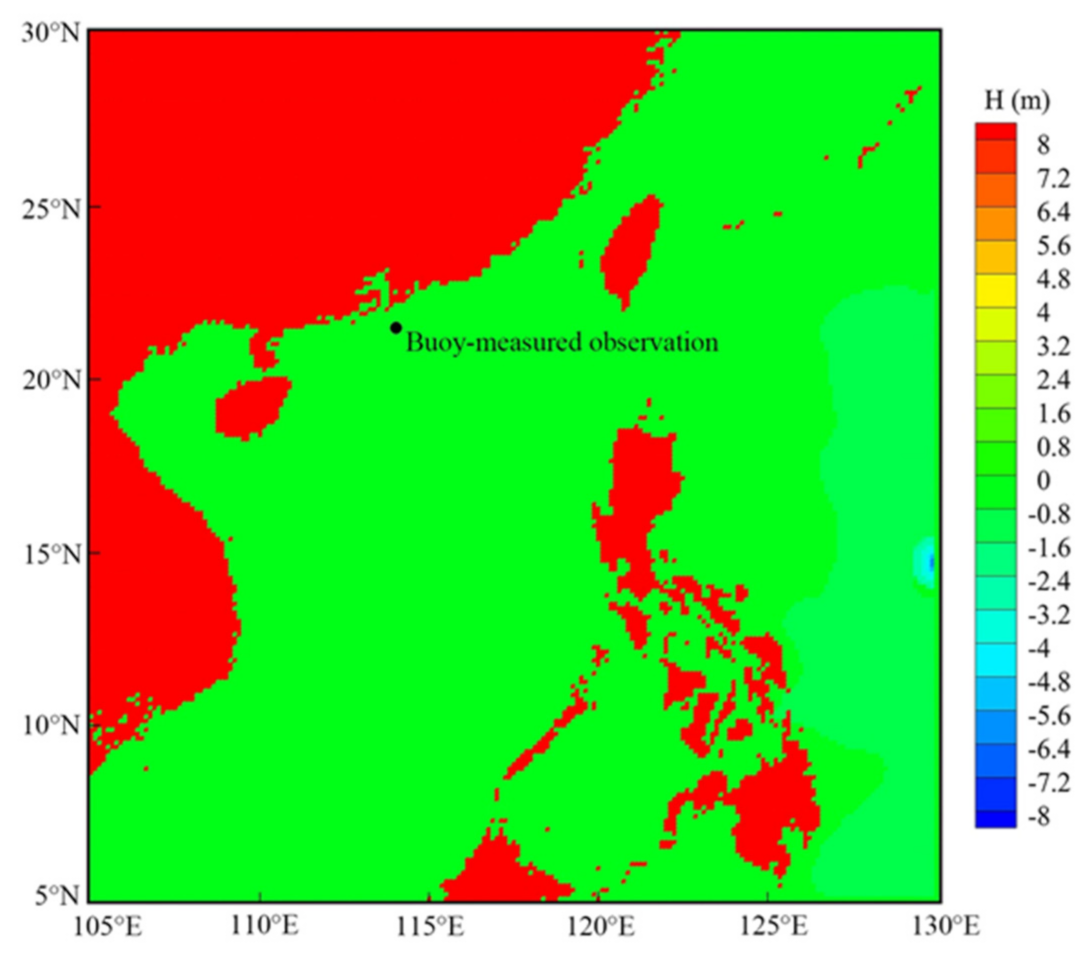
3.3. Model Validation
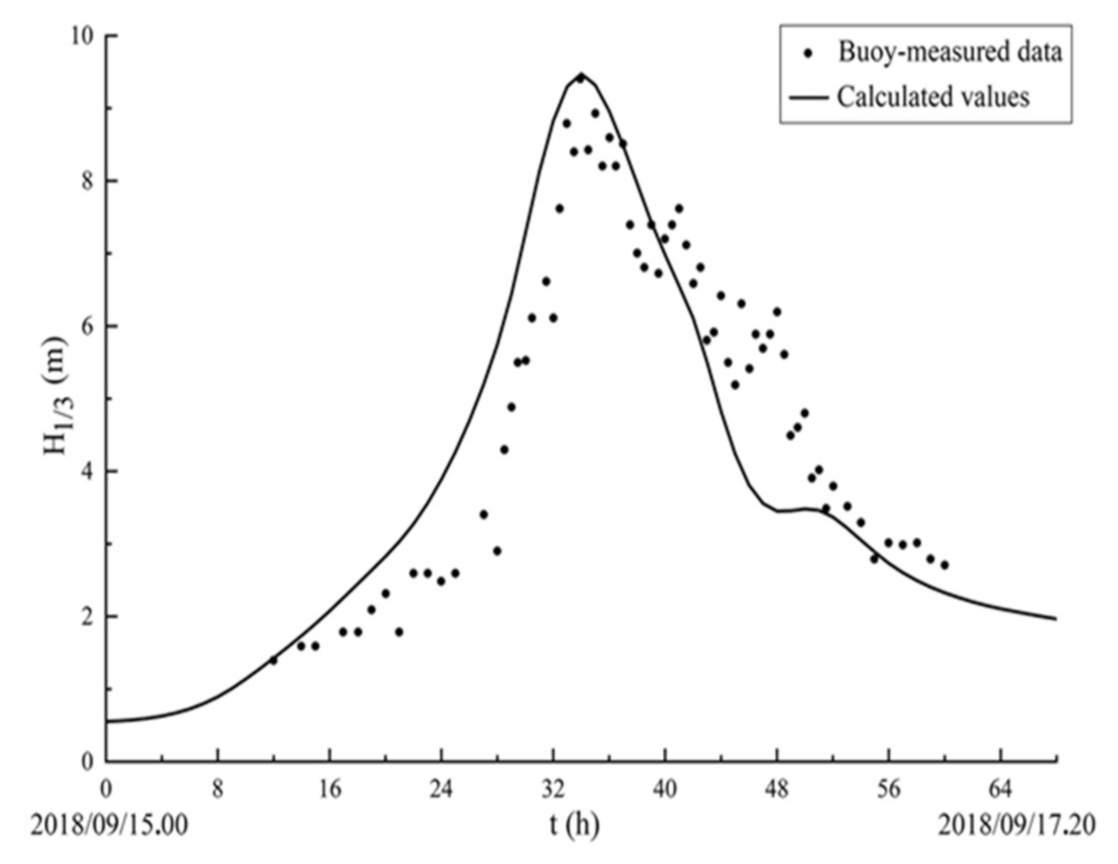
In the present work, combined with the synthetic wind field, the typhoon wave of the study area is simulated by using the SWAN model. To verify the accuracy of the wave model, the buoy-measured significant wave height at the wave observation points in the South China Sea is compared with the calculated value of the model. The buoy-measured observation is located at 114° E, 21.48° N (see Figure 6). According to the range of the calculation domain and the path and time of Typhoon Mangkhut, the calculation range of the model is set at 105–130° E and 5–30° N. A rectangular grid is used to discretize the computational domain, and the number of model grids is 200 × 200. The simulation time is from 00:00 on 15 September 2018 to 20:00 on 17 September 2018, and the calculation time step is set to 1 h. Figure 7 compares the significant wave heights calculated by the model with the buoy-measured data during the transit of Typhoon Mangkhut. Although the phase between the model calculation results and the measured data is slightly different, the maximum significant wave heights calculated by the model are basically consistent with the buoy-measured data, which is approximately 9.5 m. The calculated results of the model are in good agreement with the buoy-measured data, which verifies the accuracy of the model.
4. Coupled Dynamics Model
4.1. Aerodynamics Model
As a pre-processing tool for the aerodynamics model, TurbSim [22] based on the Kaimal spectrum is adopted to generate a three-dimensional turbulence wind time series according to the average wind speed at a height of 10 m above sea level. In detail, 97 wind speed time series, each lasting 1800 s with a time step of 0.05 s, are used to simulate the extreme wind loads.
In the aerodynamic model, the blade element momentum theory (BEMT) is used to calculate the aerodynamic load acting on the wind turbine blades. The theory divides the wind turbine blades into independent elements. Figure 8 illustrates the aerodynamic forces and velocities of an arbitrary blade element. In Figure 8, is the rotor speed; is the local radius of the blade element; and denote the inflow and relative speed, respectively; and are the axial and tangential induction coefficients, respectively; , , and are the angles of attack, twist, and inflow, respectively; and and are the lift and drag forces, respectively. The flapwise loads and edgewise loads extracted by each rotor annulus section were calculated as follows:
where and are the lift and drag coefficients of the sectional airfoil, respectively, which are functions related to ; is the air density; and is the chord length of the blade element.
The edgewise moment and flapwise moment of the blade root are obtained by integrating the section load in the span direction:
where is the radius of the blade tip.
The aerodynamic loads on the tower, nacelle, and hub can be calculated by the following equation:
where is the air density; is the drag coefficient; is the normal relative wind velocity of the element; and is the area of the element.
4.2. Hydrodynamics Model
The hydrodynamics are modeled using a suitable combination of incident-wave kinematics and hydrodynamic loading models. The hydrodynamic load is derived from the integral of hydrodynamic pressure on the wet surface of the floating platform, including the contribution of the inertia (added mass) and linear resistance (radiation), buoyancy (recovery), incident wave scattering (diffraction), current, and nonlinear effects. In irregular incident waves, the total forces acting on the semi-submersible platform with the mooring system in the time domain are calculated as follows [23]:
where represents the component of the impulsive hydrodynamic added mass; , , and represent the displacement, velocity, and acceleration of the translation or rotation platform, respectively; represents the component of the total excitation force on the support platform from incident waves; represents the component of the total load on the support platform from the contribution of all mooring lines; represents the component of the Kronecker-Delta function (i.e., the identity matrix); represents the component of the linear hydrostatic-restoring matrix from the water-plane area and the center of buoyancy; represents the component of the matrix of wave-radiation-retardation kernels or impulse-response functions of the radiation problem; represents the dummy integration variable using the same units as the simulation time; represents the displaced volume of fluid when the support platform is in its nondisplaced position; and , and represent the water density, gravitational acceleration constant, and simulation time, respectively. To obtain these matrices, the frequency-domain potential flow panel method code WAMIT (Wave Analysis MIT) [24] is used.
4.2.1. Irregular Waves
Random and irregular waves are described by the superposition of multiple linear wave components. This method assumes that the sea surface can be described as a stationary random process, and an appropriate wave spectrum is used to express the time-dependent wave elevation , which is shown in Equation (18) [23].
where is the imaginary number; is the frequency of incident waves; and represents the discrete Fourier transform of a realization of white Gaussian noise and is calculated using the Box-Muller method. Further information on the calculation and effect of is found in Jonkman [23]. is the two-sided power spectral density (PSD) of the wave elevation per unit time, which is defined as shown in Equation (19).
4.2.2. Radiation Forces
The wave radiation loads consist of the impulsive hydrodynamic added mass components and an additional wave radiation contribution from the added mass and damping; it can be expressed as the convolution integral . The velocity and acceleration of the convolution integral are expressed as follows [23]:
Here, represents an alternative form of the wave-radiation-retardation kernel, which is intrinsically related to [23].
The wave radiation loads are calculated by the summation of and , therefore accounting for all radiation effects, including surface memory effects. Equation (22) is usually used to calculate , where the damping matrix is calculated from the frequency-domain representation in WAMIT.
4.2.3. Diffraction Forces
The expression of the total wave excitation load of irregular waves is as follows:
where represents the hydrodynamic wave excitation vector related to the wave frequency and direction obtained from the frequency domain. WAMIT can directly integrate and calculate the excitation force of the hydrodynamic pressure over the surface.
A thorough introduction of all the various forces is beyond the scope of this study. More details on the hydrodynamic load model can be found in Jonkman [23].
4.3. Mooring Model
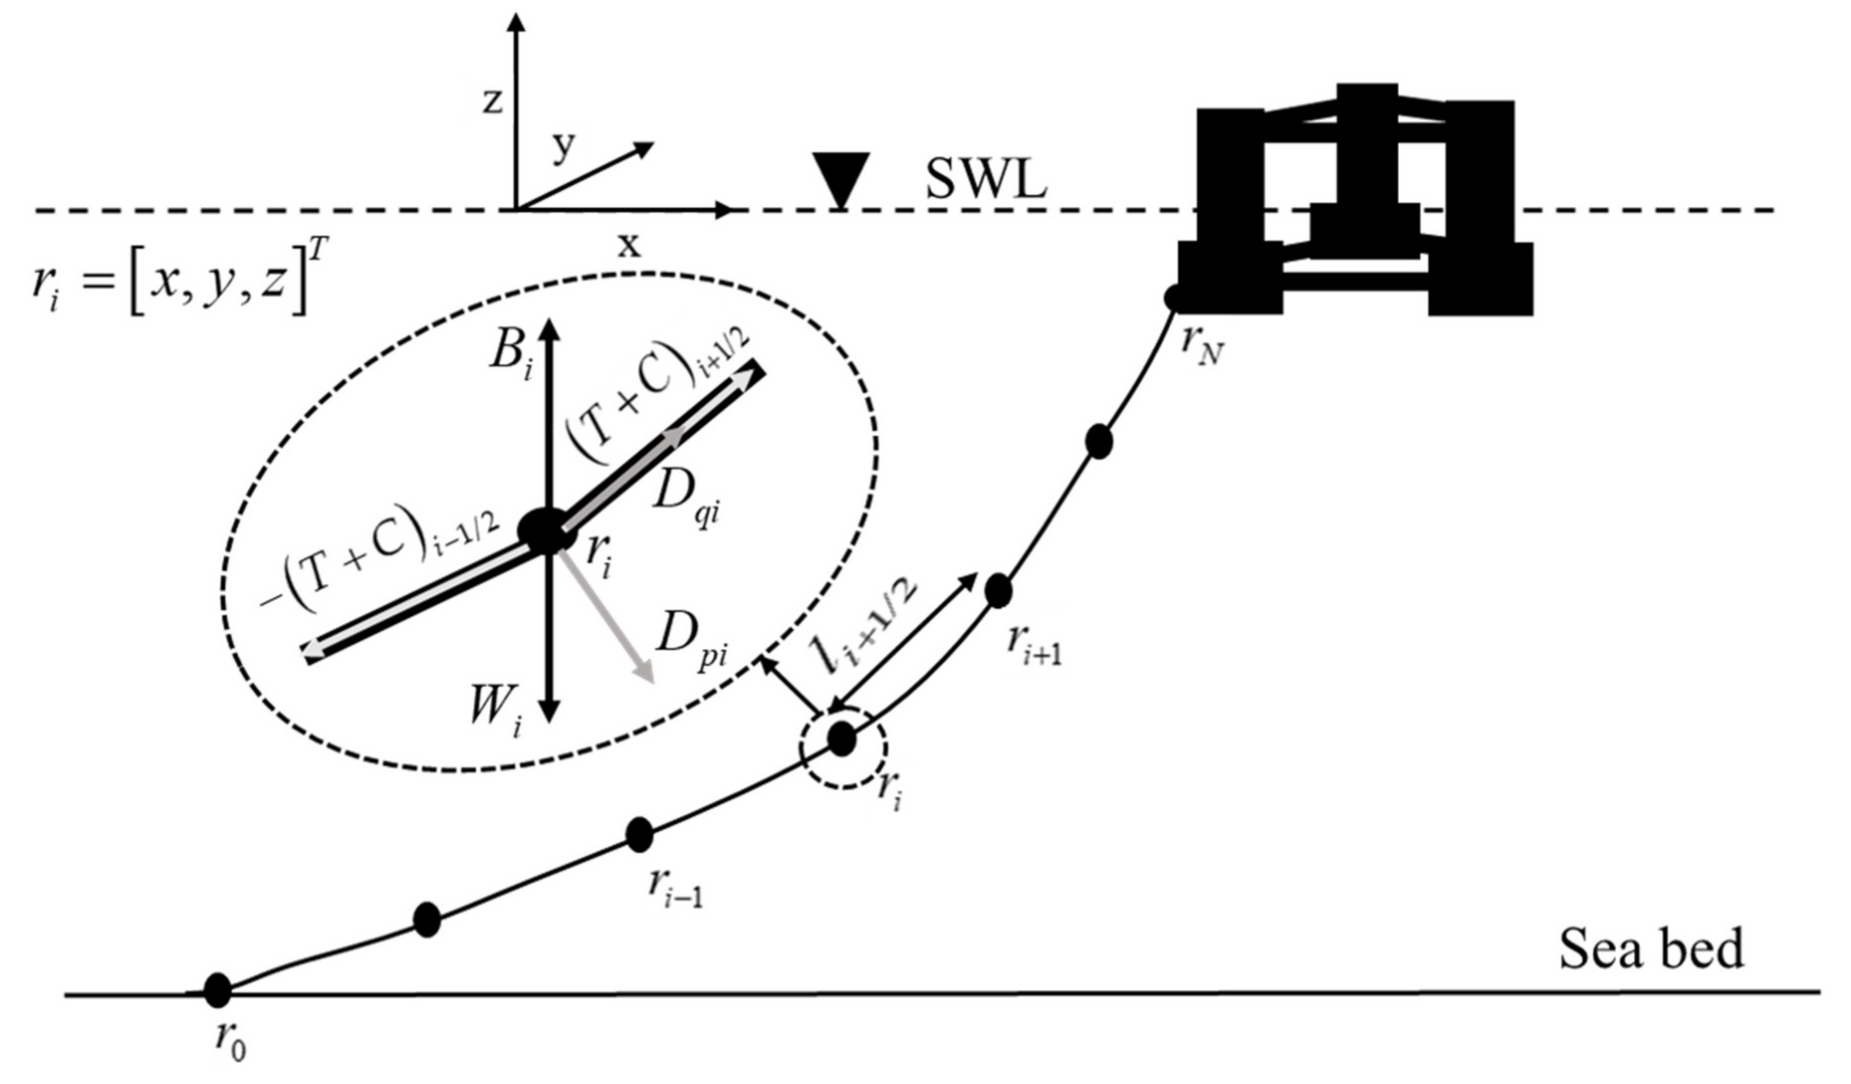
The mooring model uses a lumped-mass approach to model the dynamics over the length of the mooring line and the Morison equation to calculate the hydrodynamic forces acting on such lines. According to the lumped-mass method, each line is broken into evenly sized line segments connecting node points (see Figure 9). The right-hand inertial reference frame defines the upward direction of the water surface as the positive direction of the z-axis. Each node’s position is defined by a vector containing the , , and coordinates of the node position. The mass of each segment is equally transferred to both its extremity nodes. The same principle applies to the external forces acting on each segment. The forces are calculated at each node and at each time step [25]. The equation of motion for each node can be expressed as follows:
where is the node’s position at instantaneous time ; is the node’s velocity at instantaneous time ; is the node’s acceleration at instantaneous time ; is the mass of the node; is the hydrodynamic added mass of the node; and is the total force acting on the node.
The force acting on a node can be further decomposed into different components caused by various physical phenomena:
The right-hand side of Equation (25) is composed of internal forces and external forces. and are the transverse and tangential hydrodynamic drag forces modeled using the Morison equation; is calculated as a function of the segment strain and Young modulus of the line; is a function of the strain rate and damping coefficient; is calculated based on the segment’s dry weight and buoyancy; and is modeled by a spring-damper system. For more detailed information on how to model the above forces, please refer to reference [25].
In three-dimensional space, Equation (24) can be expressed in the form of a matrix:
The entire motion equation of a line composed of segments is represented by a matrix composed of submatrices, as shown in Equation (26). The differential equations of motion are solved using a constant time step Runge-Kutta second-order (RK2) integration scheme [26]. The second-order ordinary differential equations expressed in Equation (26) can be easily reduced to a system of first-order differential equations [25]. In this study, each mooring line was divided into 20 segments, and the mooring iteration time step is 0.001 s.
4.4. Model Validation
4.4.1. Free Decay Test
To verify the accuracy of the numerical model, the natural periods of the floating platform discerned from the free decay tests, which are regarded as the essential verification criteria, are checked after a comparison with the results from a series of previous studies [27]. The three degrees of freedom response with an initial displacement of 5 m or 5° are tested, and a comparison is presented in Table 3 to indicate the reliability of the simulation results. From Table 3, a comparison of the motion period among the present study, test data, and FAST shows acceptable agreement, even though the surge natural period seems to be slightly larger in the present study.
4.4.2. Irregular Waves
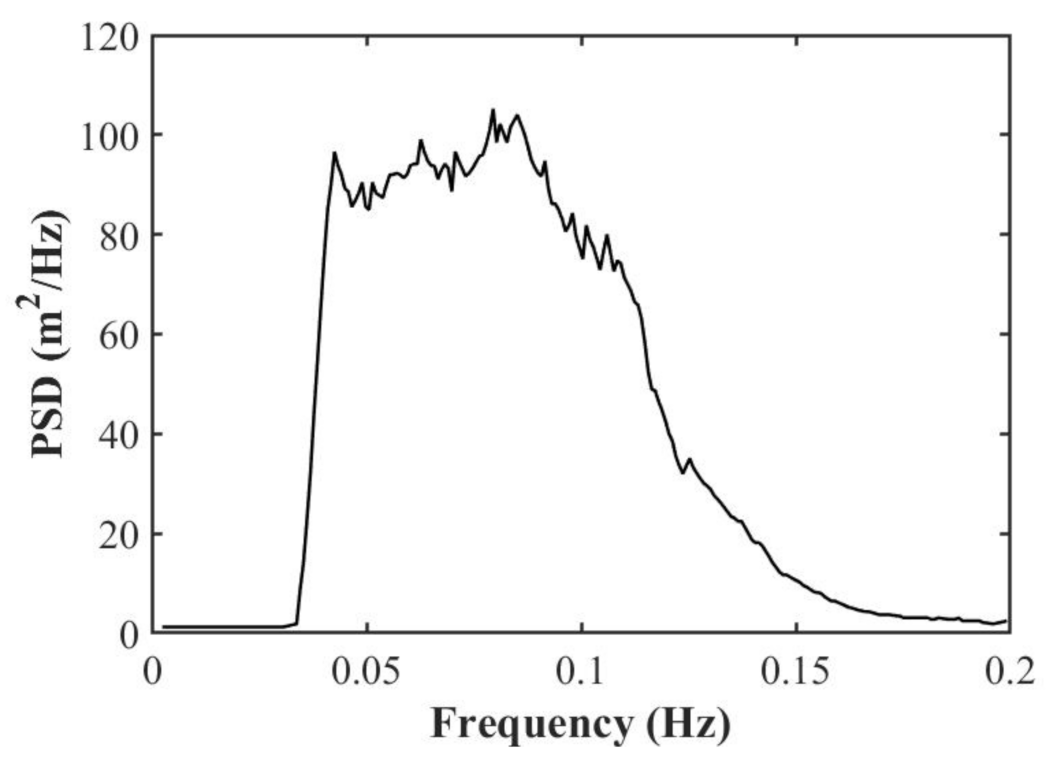
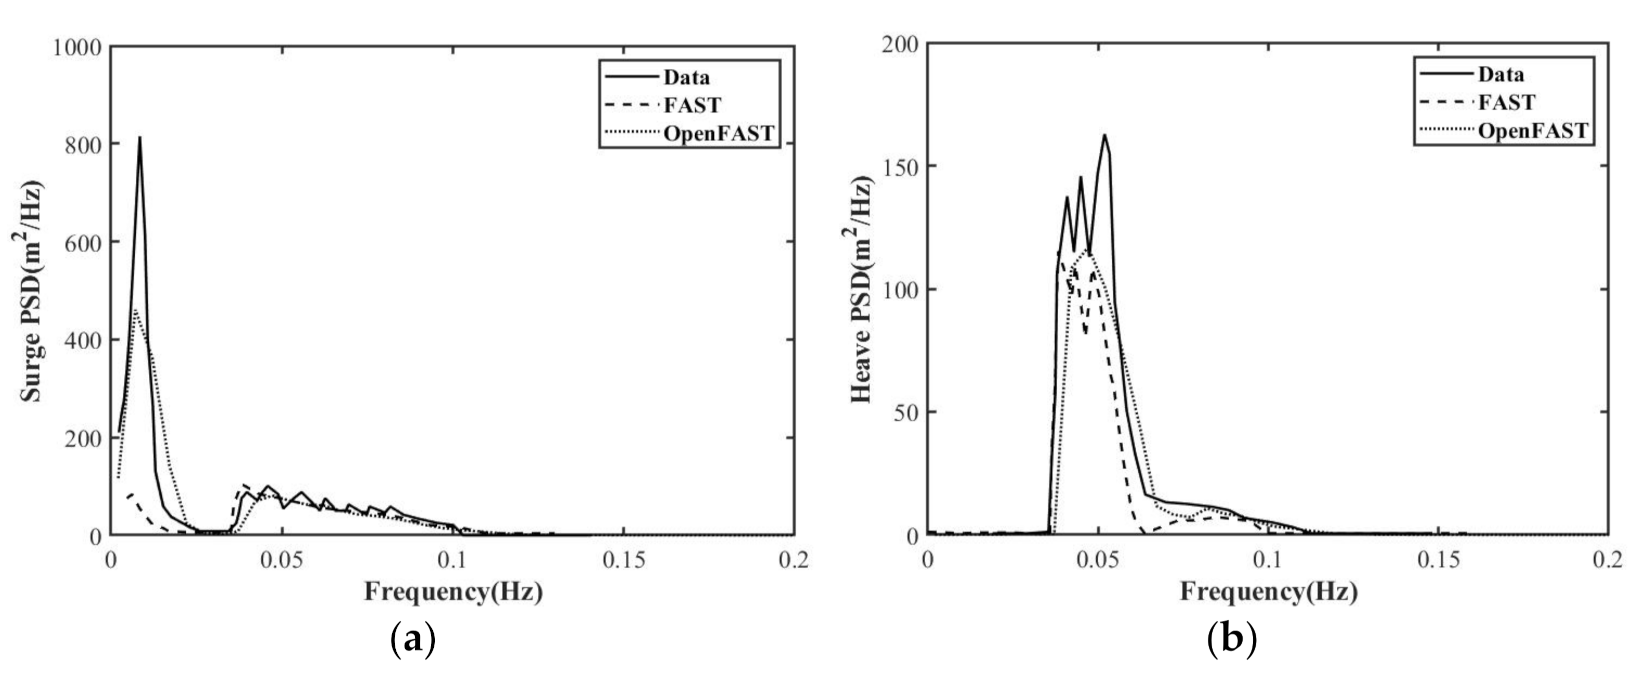
To continue the validation study, the behavior of the DeepCwind semi-submersible platform subjected to a severe irregular wave in the absence of wind was simulated with the OpenFAST model. The irregular wave that was investigated possessed a broad-band spectrum, with a significant wave height of 11.3 m (see Figure 10) [27].
Figure 11 shows a comparison with the PSDs of Coulling’s study [27] under irregular wave conditions. In the wave frequency range of 0.04–0.20 Hz, the surge response results in the present study are in good agreement with the test data. The heave, tower-base bending moment, and cable tension results are slightly smaller than the test data. For a low natural frequency of 0.0093 Hz, the results in the present study are obviously smaller than the test data because the second-order wave loads are ignored. Compared with the FAST simulation results, the OpenFAST simulation results are closer to the test data.
5. Results and Discussion
5.1. Typhoon-Induced Wind and Wave
The simulation time of this paper is from 8:00 on 15 September 2018 to 8:30 on 17 September 2018 and is divided into 97 stages with 0.5-h intervals. Figure 12 shows the maximum wind speed and significant wave height at different stages. The two curves demonstrate an increasing trend first and then a decreasing trend during the passage of the typhoon. However, the maximum values of the wind speed and significant wave height appear at different stages (50th, 49th). The inconsistency of the maximum wind and waves will excite the vibrations of different parts of the wind turbine during different stages. The multistage effects of the typhoon will be discussed as follows.
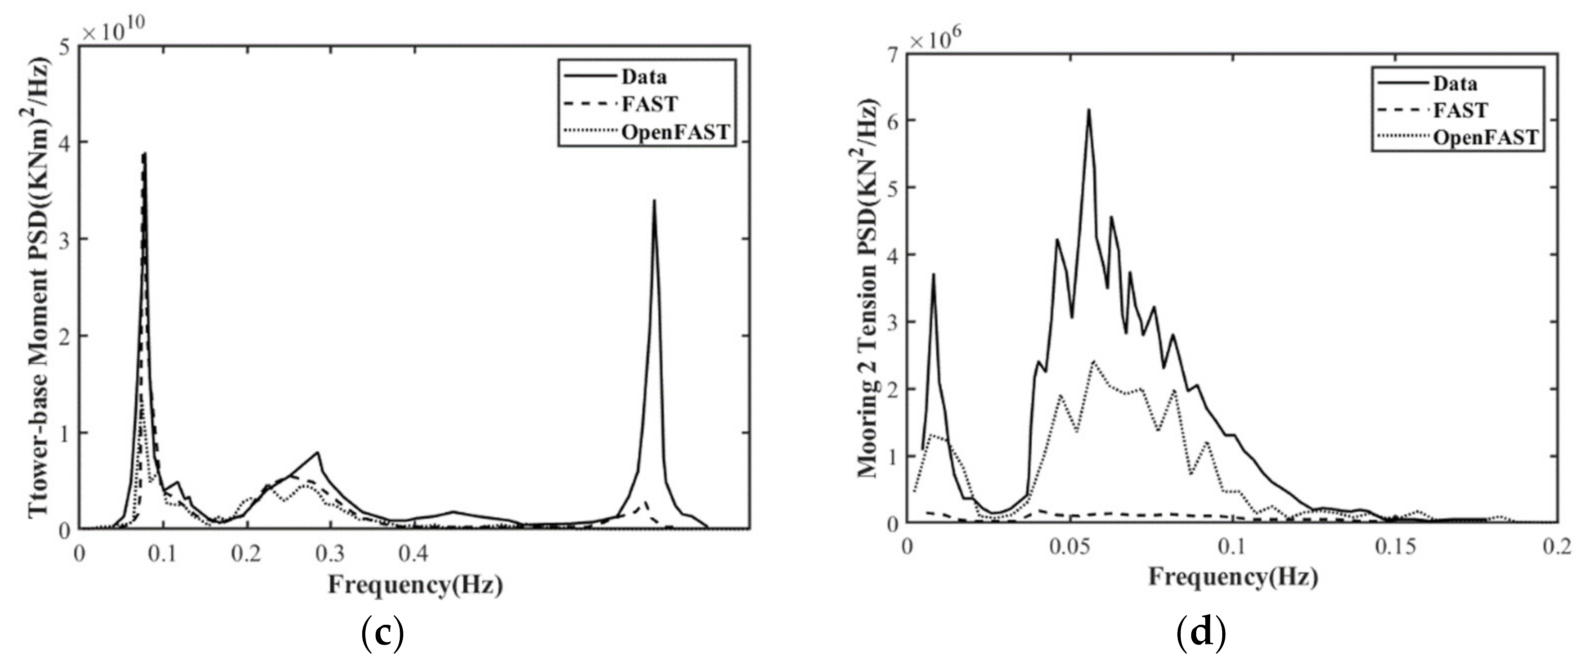
The typhoon wave spectra at different stages are shown in Figure 13. The blue dots represent the peak values at each stage. The arrows indicate the moving direction of the spectral peaks. Clearly, the wave energy spectra changed significantly during the passage of the typhoon. With the traveling of the typhoon, (1) the wave spectral peak gradually increases and then decreases, and the maximum peak value is much larger than the normal sea state; (2) the width of the wave spectrum shows an evident trend of first narrowing and then widening; and (3) the spectral period moves to a low frequency and then back to a high frequency. The wave spectra at different stages demonstrate that the typhoon wave is a mixture of swells and wind waves. At the same time, the surge natural frequency (0.0092 Hz) and pitch natural frequency (0.0392 Hz) are beyond the range of the wave spectrum, which can effectively avoid a resonance with the waves. In comparison, the heave natural frequency (0.0575 Hz) is within the wave frequency range and may amplify the heave motion of the platform by waves, especially in a severe sea state. It is suggested that the natural frequency of the platform can be reduced by adding weight to the cables or optimizing the heave plate to alleviate the dramatic motion under typhoon conditions.
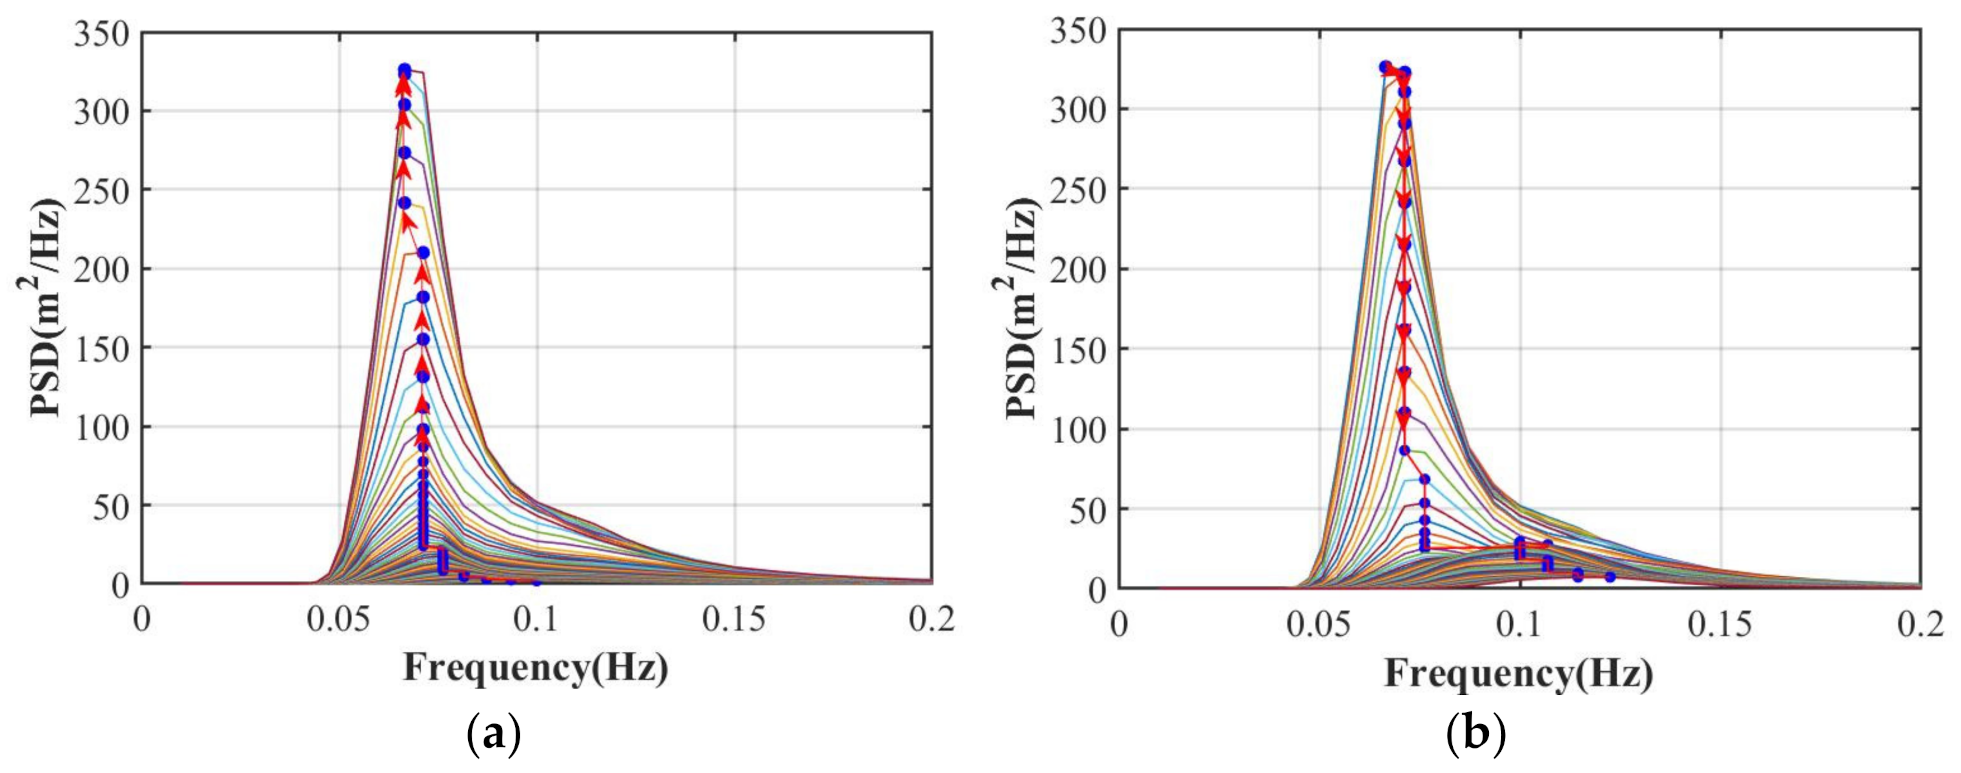
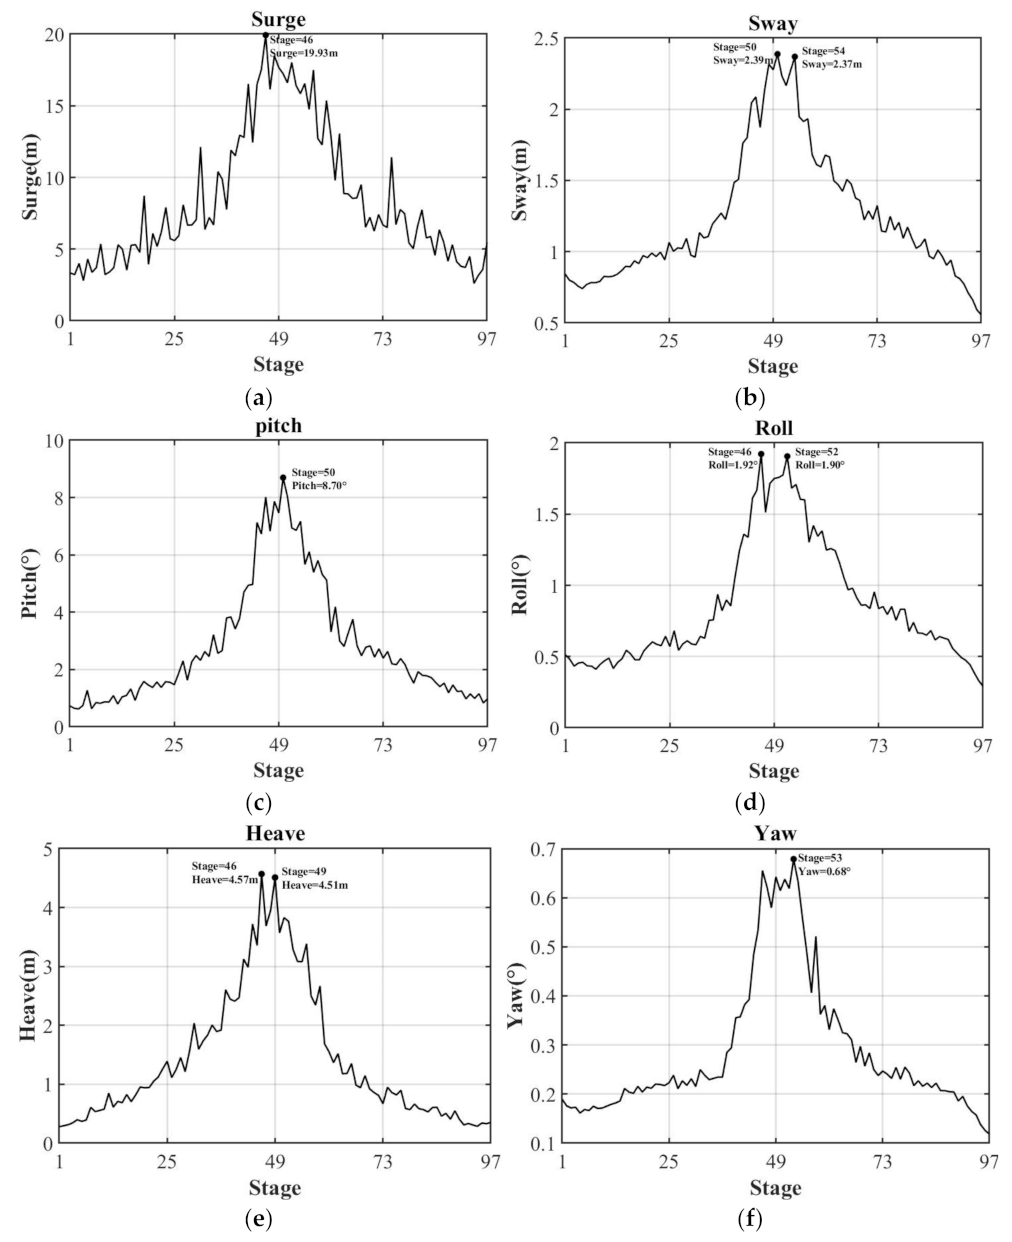
5.2. Motion Response
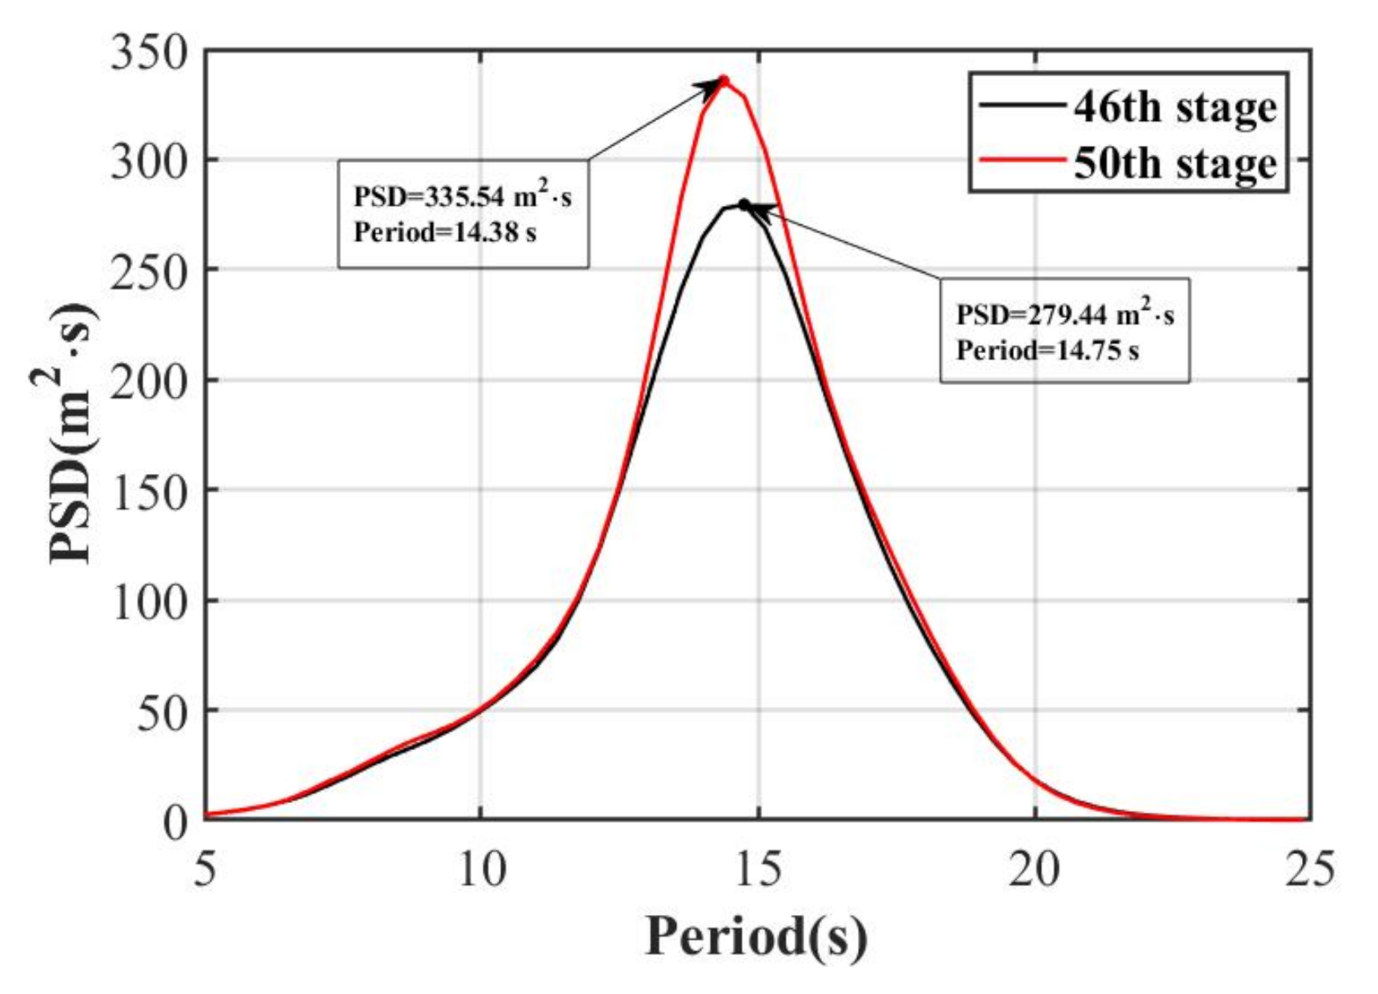
Figure 14 represents the maximum motion response of the six degrees of freedom of the floating wind turbine at different stages. It is noted that the maximum motion response is not the expected maximum which can be obtained by the global maxima method and generalized extreme value distributions based on 20 to 100 samples, as proposed by Aggarwal, et al. (2015) [28]. The maxima presented in this paper is extracted from a single sample of each typhoon stage. The reference point of the motion is at 10 m above sea level (at the tower base). As shown in Figure 14, large responses of the surge, heave, and pitch with maximum values of 19.93 m, 4.57 m, and 8.70° appear at the 49th, 46th, and 50th stages, respectively, but the maximum responses of the sway, roll, and yaw are relatively small. Notably, for surge and heave motions, the maximum response occurs 1.5 h before the maximum wave; for pitch, the maximum response occurs 0.5 h after the maximum wave. From a comparison of the wave spectra of stages 46 and 50 (see Figure 15), although the spectral peak value of stage 46 is smaller, the spectral period is closer to the low-frequency motion surge. Thus, the maximum surge response is excited in this stage. Clearly, the maximum response does not correspond to the maximum wave. This finding reveals that swells have a more significant impact on the movement of the platform.
5.3. Structure Loads
5.3.1. Mooring Loads
The structural integrity of the mooring system is crucial to the survivability of the wind turbine. Therefore, it is necessary to monitor the cable tension during the traveling process of a typhoon. The breaking load () is defined according to nominal diameters of the mooring lines [29]. Equations (27) and (28) are the formulas used to calculate and the safety factor ().
where and represent the diameter and maximum tension in the mooring line, respectively. The requirements of the minimum safety factor in different states are listed in Table 4 [30].
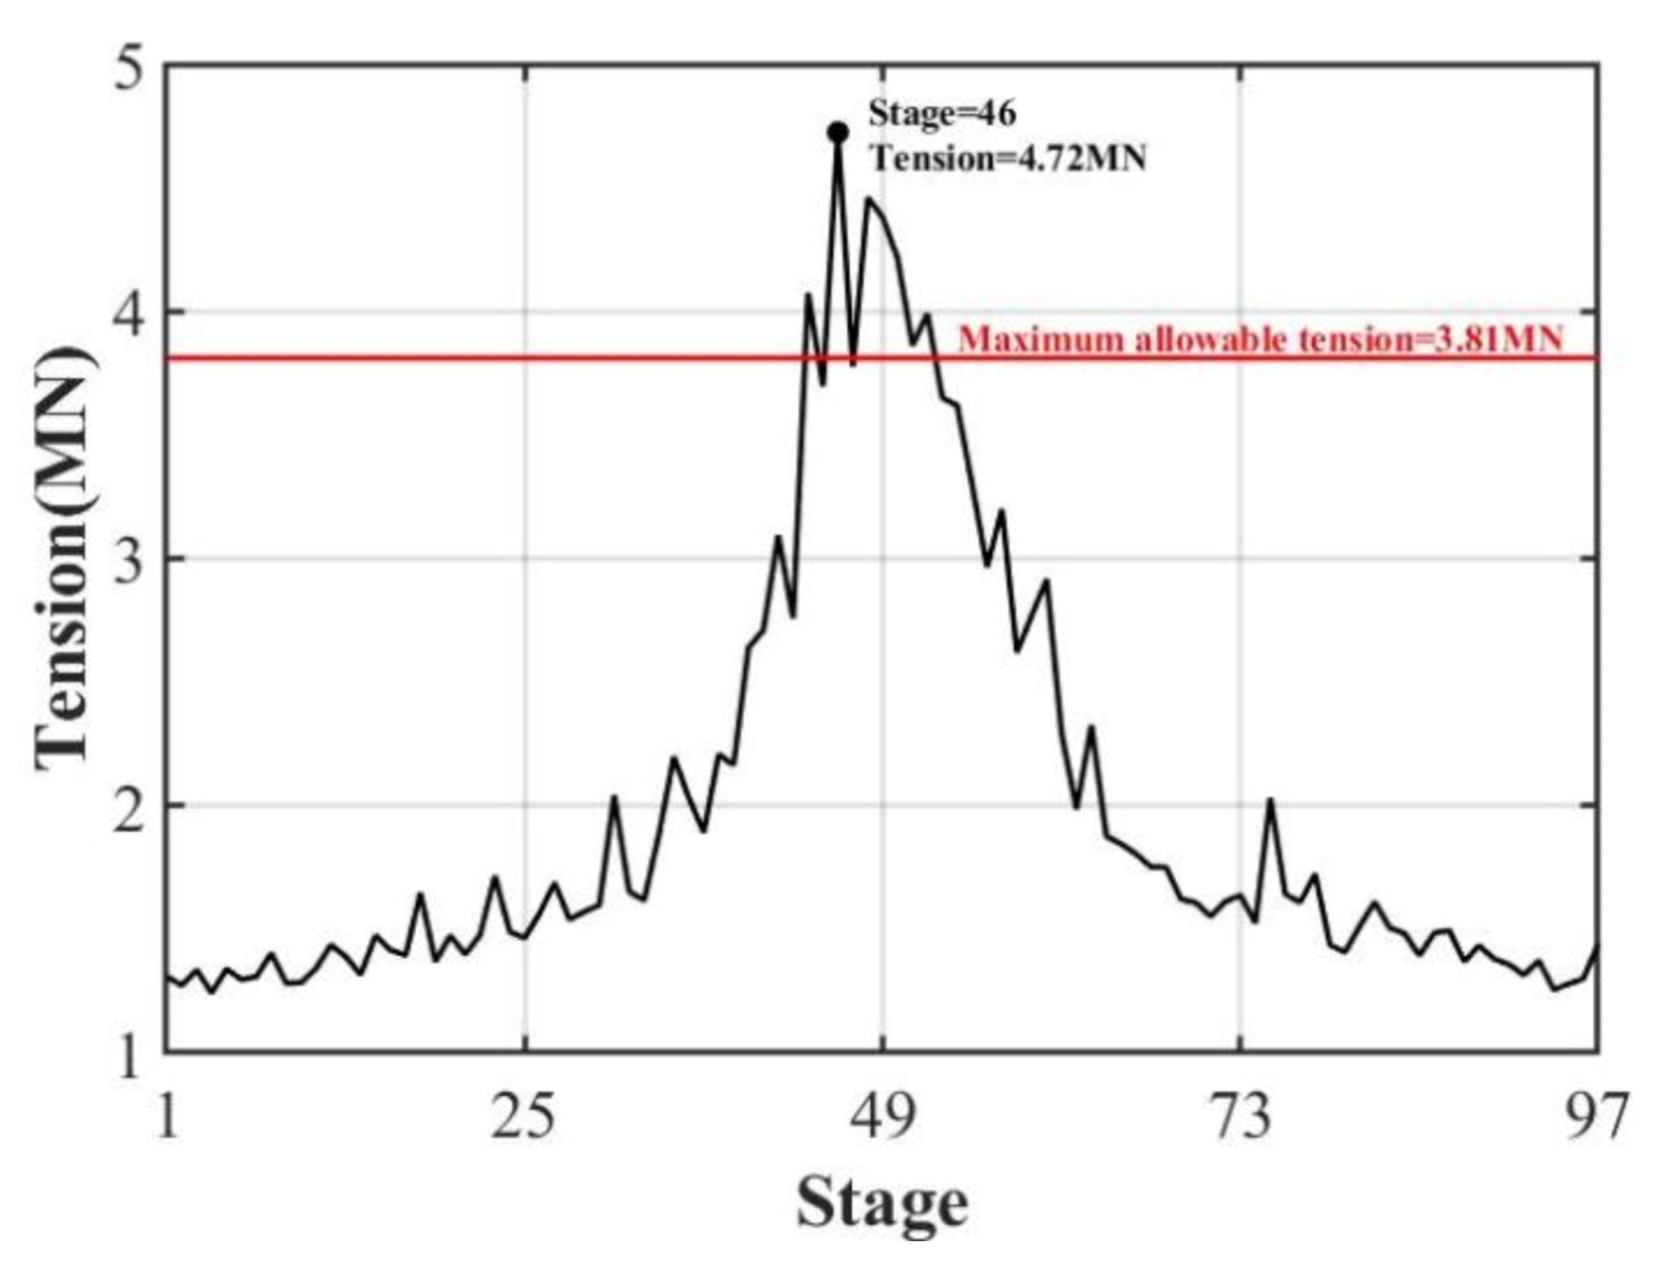
Figure 16 shows the maximum tension at different stages. The maximum value of 4.72 MN was generated before the maximum wind speed or wave height occurred. According to Equations (27) and (28), the maximum allowable tension of the cable in extreme sea states is 3.81 MN. It can be seen that the maximum tension exceeds the allowable tension in the 44th, 46th, 48th, 49th, 50th, 51st, and 52nd stages, threatening the safety of the platform. Notably, the original design of the three catenary lines with a diameter of 0.0766 m is not suitable for typhoon conditions in the South China Sea. An appropriate increase in the number and diameter of cables is recommended to cope with the extreme sea conditions in the South China Sea.
5.3.2. Loads of the Blade Root and Tower Base
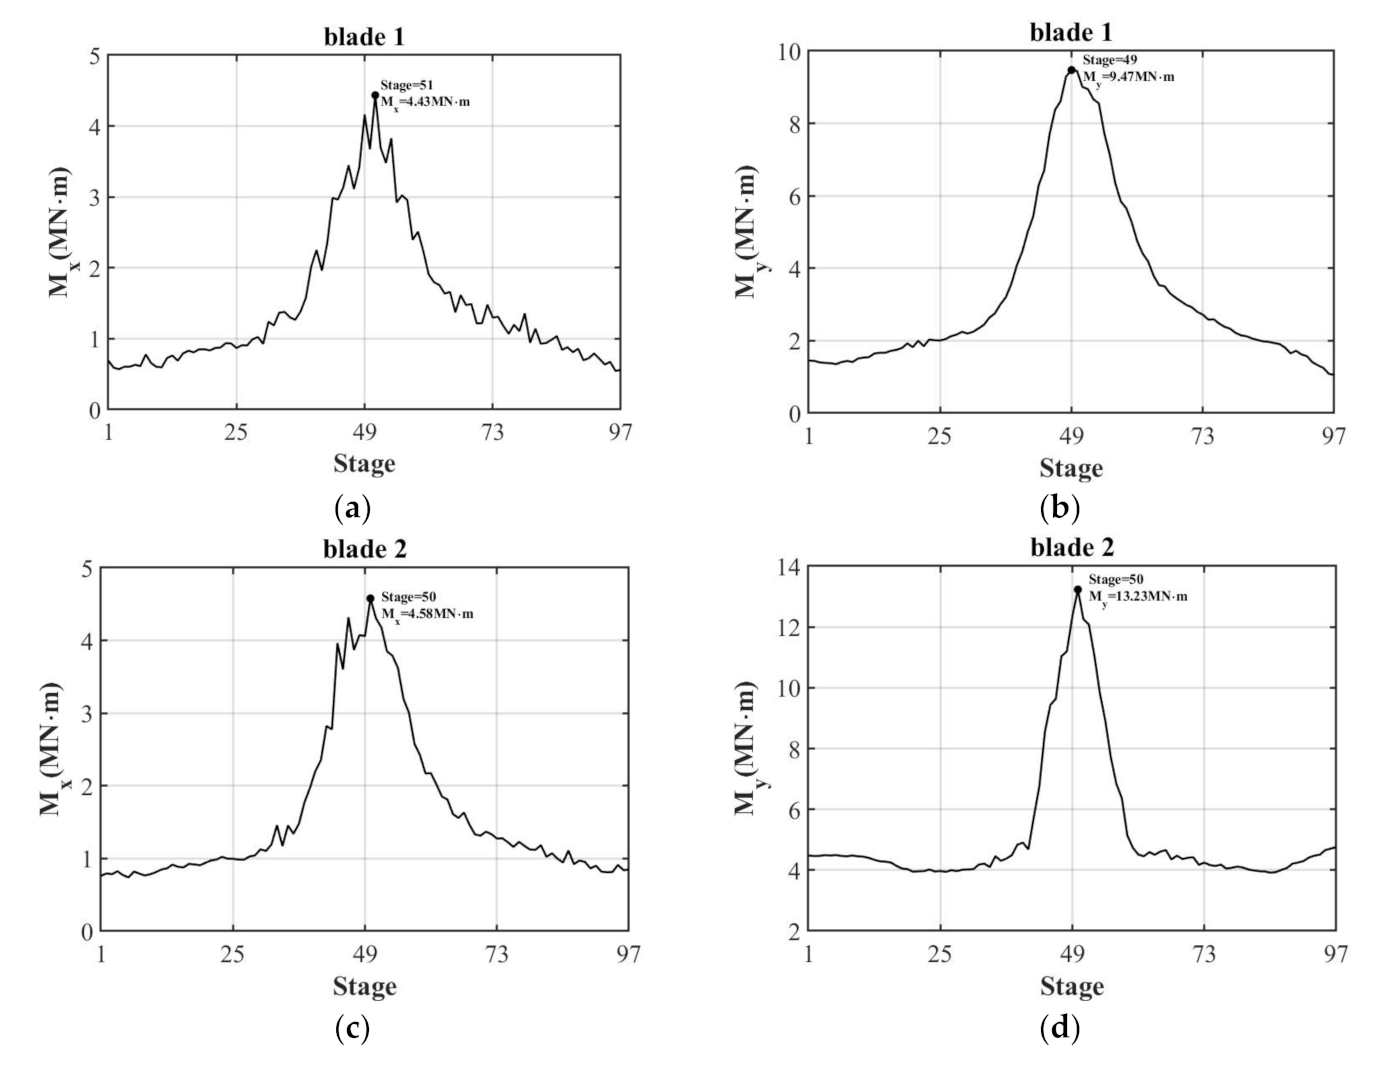
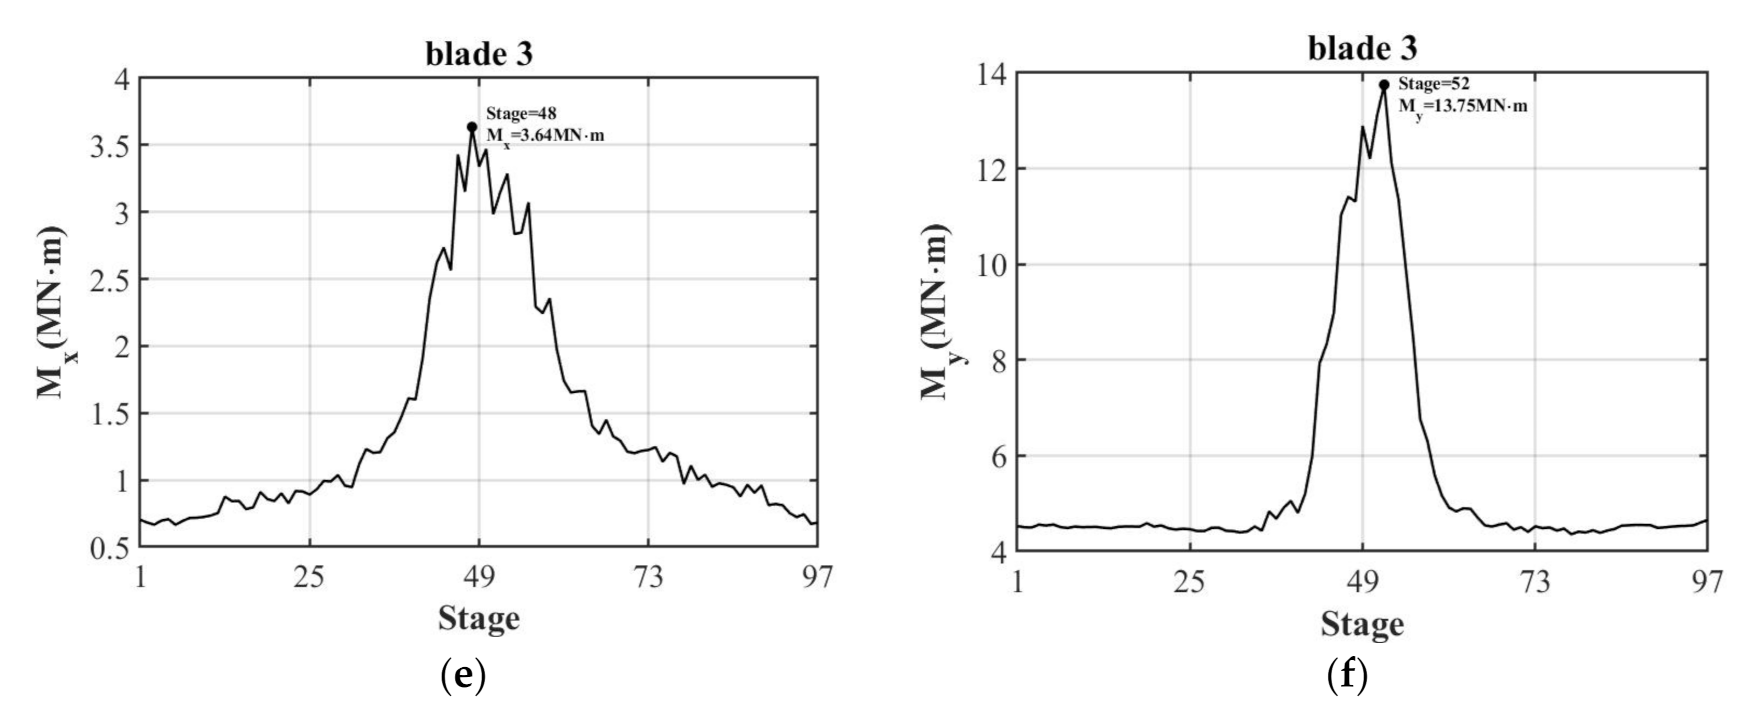
According to the records of wind farms damaged by typhoons, blade breakage and tower collapse are the main failures of wind turbines [31,32,33]. Thus, it is essential to monitor the loads of the blade root and tower base under typhoon conditions. The position of the blades when the wind turbine shut down with feathering is shown in Figure 2b. Looking downwind clockwise, blade 1 points up and blade 3 is ahead of blade 2, which is ahead of blade 1. The maximum bending moments of the blade root and tower base at different stages are investigated and shown in Figure 17 and Figure 18, respectively.
In Figure 17, and represent the edgewise moment and flapwise moment on the blade root, respectively. The following points can be obtained from the figure: (1) and have values of the same order of magnitude, but plays a dominant role throughout the traveling process of the typhoon. (2) The bending moments of blades 2 and 3 are basically the same. Markedly, the rotor is under the aerodynamic imbalance condition. Compared with blades 2 and 3, the maximum flapwise moment of blade 1 is less than 28.4% and 31.1%, respectively. Thus, the blade azimuth has a great impact on the structural loads. To reduce blade failure during the passage of a typhoon, the study of the best stop position is recommended. (3) The maximum wind speed appears at the 50th stage. However, the largest blade load does not take place at the same time.
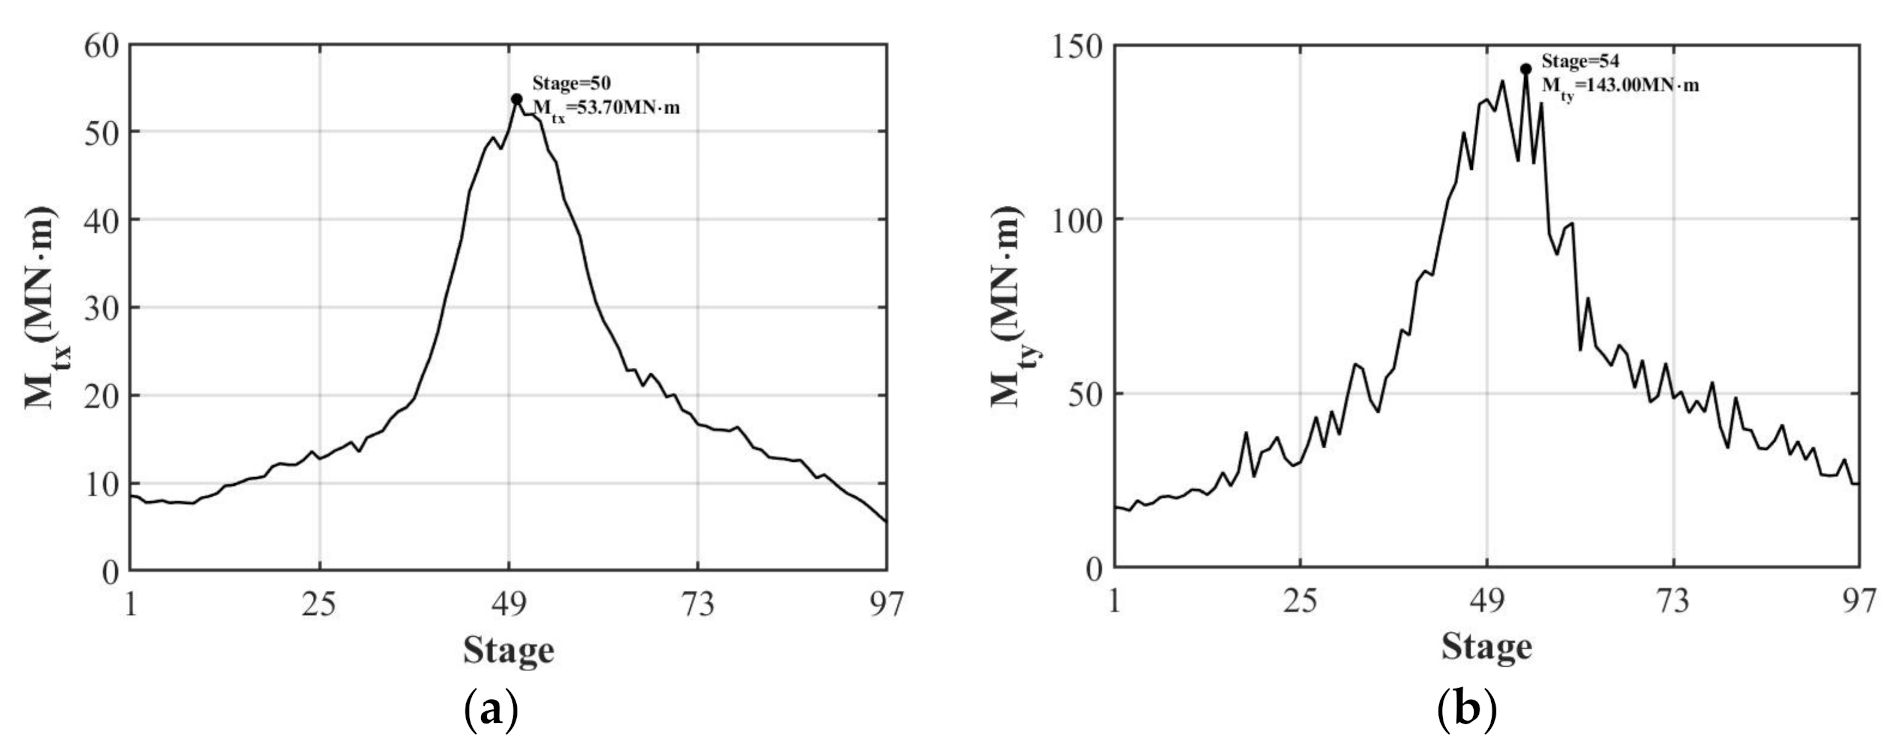
Figure 18 shows the largest side-to-side bending moment and fore-aft bending moment of the tower base at different stages. It is found that is the dominant bending moment through the process of the typhoon, and the maximum value is 143 MN·m, which is 2.7 times larger than that of . Similarly, the largest structural loads do not all appear with the maximum wind speed, which is different from fixed wind turbines. This finding indicates that the motion of the floating platform greatly influences the structural loads of the blades. The typhoon-resistance design of floating offshore wind turbines is a complicated problem that has to consider the coupling effect of the floating platform and upper wind turbine.
6. Conclusions
This paper analyzed the impact of Typhoon Mangkhut on the motion response and structural loads of the DeepCwind offshore wind turbine. The research contents included a numerical typhoon model, multi-dynamic model, typhoon-induced wave analysis, and typhoon-induced response analysis. The conclusions are described in the following points:
- The calculated results of the SWAN model combined with the synthetic wind field are in good agreement with the measured data. The simulation results show that the proposed method is feasible for simulating typhoon-induced wave fields. In addition, the reliability of the OpenFAST model is verified.
- The heave natural frequency is within the wave frequency range, which will resonate with the wave and aggravate the motion response of the heave. It is suggested that the natural frequency of the platform can be reduced by adding weight to the cable or setting a heave plate for safe operation under typhoon conditions.
- For the motion response, the maximum response does not exactly correspond to the maximum wave or wind stage. Considering only the maximum wave height or wind speed may underestimate the motion response during the traveling process of the typhoon, which has problems in guiding the anti-typhoon design of offshore wind turbines. The sea state during two hours before and after extreme winds and waves should also be simulated to obtain the maximum possible motion response.
- For structural loads: (1) the maximum mooring tension exceeds the allowable tension during the passage of the typhoon. An appropriate increase in the number and size of the mooring line is recommended to cope with the extreme sea conditions in the South China Sea. (2) The maximum bending moments of the blade root and tower base are not generated by the extreme wind speed. The motion of the floating platform exerts an evident influence on the structural loads on the wind turbine. Therefore, the coupling motion between the floating foundation and turbine should be considered in the safety evaluation of the floating offshore wind turbine under typhoon conditions.
Author Contributions
Conceptualization, all authors; methodology, J.L., Y.J., and Y.M.; formal analysis, all authors.; writing—original draft preparation, J.L. and J.B.; writing—review and editing, J.L., Y.J., and Y.M.; visualization, J.B. and Y.J.; funding acquisition, J.L. All authors have read and agreed to the published version of the manuscript.
Funding
This research was funded by the National Natural Science Foundation of China [Grant No. 52001043], and the Fundamental Research Funds for the Central Universities [Grant No. 3132019400, and No. 3132021124].
Institutional Review Board Statement
Not applicable.
Informed Consent Statement
Not applicable.
Data Availability Statement
Not applicable.
Conflicts of Interest
The authors declare no conflict of interest.
References
- Xiao, F.; Xiao, Z. Characteristics of tropical cyclones in China and their impacts analysis. Nat. Hazards 2010, 54, 827–837. [Google Scholar]
- Wang, L.; Zhang, Z.; Liang, B.; Lee, D.; Luo, S. An efficient method for simulating typhoon waves based on a modified holland vortex model. J. Mar. Sci. Eng. 2020, 8, 177. [Google Scholar] [CrossRef] [Green Version]
- Forristall, G. Comparing hindcasts with wave measurements from hurricanes Lili, Ivan, Katrina and Rita. In Proceedings of the 10th International Workshop on Wave Hindcasting and Forecasting and Coastal Hazards Symposium, Oahu, HI, USA, 11–16 November 2007. [Google Scholar]
- Hsiao, S.C.; Chen, H.; Wu, H.L.; Chen, W.B.; Lin, L.Y. Numerical simulation of large wave heights from super typhoon Nepartak (2016) in the eastern waters of Taiwan. J. Mar. Sci. Eng. 2020, 8, 217. [Google Scholar] [CrossRef] [Green Version]
- Chi, S.-Y.; Liu, C.-J.; Tan, C.-H.; Chen, Y.-H. Study of typhoon impacts on the foundation design of offshore wind turbines in Taiwan. Proc. Instit. Civ. Eng. Forensic Eng. 2020, 173, 35–47. [Google Scholar] [CrossRef]
- Nematbakhsh, A.; Olinger, D.J.; Tryggvason, G. Nonlinear simulation of a spar buoy floating wind turbine under extreme ocean conditions. J. Renew. Sustain. Energy 2014, 6, 1–20. [Google Scholar] [CrossRef]
- Ren, N.; Li, Y.; Ou, J. Coupled wind-wave time domain analysis of floating offshore wind turbine based on computational fluid dynamics method. J. Renew. Sustain. Energy 2014, 6, 1–13. [Google Scholar] [CrossRef]
- Liu, Y.; Li, S.; Yi, Q.; Chen, D. Wind profiles and wave spectra for potential wind farms in South China Sea. Part II: Wave spectrum model. Energies 2017, 10, 127. [Google Scholar] [CrossRef] [Green Version]
- Liu, H.; Xie, L.; Pietrafesa, L.J.; Bao, S. Sensitivity of wind waves to hurricane wind characteristics. Ocean Model. 2007, 18, 37–52. [Google Scholar] [CrossRef]
- Mo, D.; Liu, Y.; Hou, Y.; Liu, Z. Bimodality and growth of the spectra of typhoon-generated waves in northern South China Sea. Acta Oceanol. Sin. 2019, 38, 70–80. [Google Scholar] [CrossRef]
- Wang, N.; Hou, Y.; Li, S.; Li, R. Numerical simulation and preliminary analysis of typhoon waves during three typhoons in the Yellow Sea and East China Sea. J. Oceanol. Limnol. 2019, 37, 1805–1816. [Google Scholar] [CrossRef]
- Yao, X.; He, H.; Song, J.; Hou, Y.; Li, F. Observations and modeling of typhoon waves in the South China Sea. J. Phys. Oceanogr. 2017, 47, 1307–1324. [Google Scholar]
- Wang, H.; Ke, S.; Wang, T.; Zhu, S. Typhoon-induced vibration response and the working mechanism of large wind turbine considering multi-stage effects. Renew. Energy 2020, 153, 740–758. [Google Scholar] [CrossRef]
- Robertson, A.; Jonkman, J.; Masciola, M.; Song, H.; Goupee, A.; Coulling, A.; Luan, C. Definition of the Semisubmersible Floating System for Phase II of OC4; National Renewable Energy Lab(NREL): Golden, CO, USA, 2014. [Google Scholar]
- Jonkman, J.; Butterfield, S.; Musial, W.; Scott, G. Definition of a 5-mw Reference Wind Turbine for Offshore System Development; National Renewable Energy Lab(NREL): Golden, CO, USA, 2009. [Google Scholar]
- Hasselmann, K.; Barnett, T.P.; Bouws, E.; Carlson, H.; Cartwright, D.E.; Enke, K.; Ewing, J.A.; Gienapp, H.; Hasselmann, D.E.; Kruseman, P.; et al. Measurements of wind-wave growth and swell decay during the Joint North Sea Wave Project (JONSWAP). Dtsch. Hydrogr. Z. 1973, 12A8, 1–95. [Google Scholar]
- Mueller, K.J.; Demaria, M.; Knaff, J.; Kossin, J.P.; Haar, T.V. Objective estimation of tropical cyclone wind structure from infrared satellite data. Weather Forecast. 2006, 21, 990–1005. [Google Scholar] [CrossRef] [Green Version]
- Shi, Q.; Tang, J.; Shen, Y.; Ma, Y. Numerical investigation of typhoon waves generated by three typhoons in the China sea. Ocean Sci. Discuss. 2019, 2019, 1–26. [Google Scholar]
- Knaff, J.A.; Demaria, M.; Molenar, D.; Sampson, C.R.; Seybold, M.G. An automated, objective, multiple-satellite-platform tropical cyclone surface wind analysis. J. Appl. Meteorol. Climatol. 2011, 50, 2149–2166. [Google Scholar] [CrossRef] [Green Version]
- Myers, V.A. Characteristics of united states hurricanes pertinent to levee design for Lake Okeechobee, Florida. Hydrometeorol. Rep. US Weather Bur. 1954, 32, 126. [Google Scholar]
- Holland, G.J. An analytical model of the wind and pressure profiles in hurricanes. Mon. Weather Rev. 1980, 108, 1212–1218. [Google Scholar] [CrossRef]
- Jonkman, B.J. Turbsim User’s Guide v2.00.00; National Renewable Energy Lab(NREL): Golden, CO, USA, 2016. [Google Scholar]
- Jonkman, J. Dynamics Modeling and Loads Analysis of an Offshore Floating Wind Turbine; National Renewable Energy Lab(NREL): Golden, CO, USA, 2007. [Google Scholar]
- Lee, C.H.; Newman, J.N. WAMIT User Manual; Versions 6.4, 6.4PC, 6.3S, 6.3S-PC; WAMIT, Inc.: Chestnut Hill, MA, USA, 2006. [Google Scholar]
- Hall, M.; Goupee, A. Validation of a lumped-mass mooring line model with DeepCwind semisubmersible model test data. Ocean Eng. 2015, 104, 590–603. [Google Scholar] [CrossRef] [Green Version]
- Press, W.H.; Teukolsky, S.A.; Vetterling, W.T.; Flannery, B.P. Numerical Recipes: The Art of Scientific Computing, 3rd ed.; Cambridge University Press: Cambridge, UK, 2007. [Google Scholar]
- Coulling, A.J.; Goupee, A.J.; Robertson, A.N.; Jonkman, J.M.; Dagher, H.J. Validation of a FAST semi-submersible floating wind turbine numerical model with DeepCwind test data. J. Renew. Sustain. Energy. 2013, 5, 1–29. [Google Scholar] [CrossRef]
- Aggarwal, N.; Manikandan, R.; Saha, N. Predicting short term extreme response of spar offshore floating wind turbine. Procedia Eng. 2015, 116, 47–55. [Google Scholar] [CrossRef] [Green Version]
- DNV. Offshore Standard DNV os-e301 Position Mooring; Det Norske Veritas: Bergen, Norway, 2010. [Google Scholar]
- DNV. Offshore Standard DNV os-j103. Design of Floating Wind Turbine Structures; Det Norske Veritas: Bergen, Norway, 2013. [Google Scholar]
- Chou, J.; Tu, W. Failure analysis and risk management of a collapsed large wind turbine tower. Eng. Fail. Anal. 2011, 18, 295–313. [Google Scholar] [CrossRef]
- Chou, J.; Chiu, C.; Huang, I.; Chi, K. Failure analysis of wind turbine blade under critical wind loads. Eng. Fail. Anal. 2013, 27, 99–118. [Google Scholar] [CrossRef]
- Chou, J.-S.; Ou, Y.-C.; Lin, K.-Y. Collapse mechanism and risk management of wind turbine tower in strong wind. J. Wind Eng. Ind. Aerodyn. 2019, 193, 103962. [Google Scholar] [CrossRef]
Figure 1.
The track of Typhoon Mangkhut.

Figure 2.
(a) Conceptual drawing of the OC4-DeepCwind semi-submersible floating wind turbine and (b) blade numbering.
Figure 2.
(a) Conceptual drawing of the OC4-DeepCwind semi-submersible floating wind turbine and (b) blade numbering.

Figure 3.
Sketch of the mooring system.

Figure 4.
Cloud map of the ECMWF wind field of Typhoon Mangkut.

Figure 5.
Cloud map of the synthetic wind field of Typhoon Mangkut.

Figure 6.
The location of the buoy-measured observation.

Figure 7.
Comparison between the calculated values and buoy-measured data of the significant wave height.
Figure 7.
Comparison between the calculated values and buoy-measured data of the significant wave height.

Figure 8.
Aerodynamic forces and velocities of an arbitrary blade element.

Figure 9.
The schematic diagram of the mooring model.

Figure 10.
Irregular wave spectrum.

Figure 11.
Comparison of PSDs under irregular wave conditions: (a) Surge, (b) Heave, (c) Tower-base fore-aft bending moment, and (d) Mooring line 2 fairlead tension.
Figure 11.
Comparison of PSDs under irregular wave conditions: (a) Surge, (b) Heave, (c) Tower-base fore-aft bending moment, and (d) Mooring line 2 fairlead tension.


Figure 12.
(a) Maximum wind speed and (b) Significant wave height at different stages: N = 1 corresponds to the data for 8:00 on 15 September.
Figure 12.
(a) Maximum wind speed and (b) Significant wave height at different stages: N = 1 corresponds to the data for 8:00 on 15 September.

Figure 13.
Wave energy spectra at different stages: (a) Typhoon arrival process and (b) Typhoon departure process.
Figure 13.
Wave energy spectra at different stages: (a) Typhoon arrival process and (b) Typhoon departure process.

Figure 14.
Maximum motion response at different stages: (a) Surge, (b) Sway, (c) Pitch, (d) Roll, (e) Heave, and (f) Yaw.
Figure 14.
Maximum motion response at different stages: (a) Surge, (b) Sway, (c) Pitch, (d) Roll, (e) Heave, and (f) Yaw.

Figure 15.
Wave spectra of stages 46 and 50.

Figure 16.
Maximum tension at different stages.

Figure 17.
Maximum edgewise moment and flapwise moment at the blade root at different stages: (a,b) Blade 1, (c,d) Blade 2, and (e,f) Blade 3.
Figure 17.
Maximum edgewise moment and flapwise moment at the blade root at different stages: (a,b) Blade 1, (c,d) Blade 2, and (e,f) Blade 3.


Figure 18.
Maximum loads of the tower base at different stages: (a) Tower-base side-to-side bending moment and (b) Tower-base fore-aft bending moment.
Figure 18.
Maximum loads of the tower base at different stages: (a) Tower-base side-to-side bending moment and (b) Tower-base fore-aft bending moment.


Table 1.
Platform gross properties.
| Properties | Value |
|---|---|
| Depth of the platform base below the SWL (total draft) | 20 m |
| Elevation of the main column (tower base) above the SWL | 10 m |
| Elevation of offset columns above the SWL | 12 m |
| Spacing between the offset columns | 50 m |
| Length of the upper columns | 26 m |
| Length of the base columns | 6 m |
| Depth to the top of base columns below the SWL | 14 m |
| Diameter of the main column | 6.5 m |
| Diameter of the offset (upper) columns | 12 m |
| Diameter of the base columns | 24 m |
| Diameter of the pontoons and cross braces | 1.6 m |
| Platform mass, including ballast | 1.3473 × 10⁷ kg |
| Center of mass (CM) location below the SWL | 13.46 m |
| Platform roll inertia about the CM | 6.827 × 10⁹ kg-m2 |
| Platform pitch inertia about the CM | 6.827 × 10⁹ kg-m2 |
| Platform yaw inertia about the CM | 1.226 × 10¹⁰ kg-m2 |
Table 2.
Mooring system properties.
| Properties | Value |
|---|---|
| Number of mooring lines | 3 |
| Angle between adjacent lines | 120 deg |
| Depth to anchors below the SWL (water depth) | 14 m |
| Depth to fairleads below the SWL | 200 m |
| Radius to anchors from the platform centerline | 837.6 m |
| Radius to fairleads from the platform centerline | 40.868 m |
| Unstretched mooring line length | 835.5 m |
| Mooring line diameter | 0.766 m |
| Equivalent mooring line mass density | 113.35 kg/m |
| Equivalent mooring line mass in water | 108.63 kg/m |
| Equivalent mooring line mass extensional stiffness | 7.536 × 10⁸ N |
Table 3.
Summary of the verifications for dynamics simulation.
| Research | Surge(s) | Heave(s) | Pitch(s) |
|---|---|---|---|
| FAST [27] | 107.0 | 17.3 | 26.8 |
| Test [27] | 107.0 | 17.5 | 25.8 |
| The present study | 109.1 | 17.4 | 25.5 |
Table 4.
Requirements of the minimum safety factors.
| State | Analysis Method | Safety Factor |
|---|---|---|
| Normal state | Dynamic | 1.67 |
| Extreme sea states | Dynamic | 1.3 |
| Broken mooring lines | Dynamic | 1.0 |
Publisher’s Note: MDPI stays neutral with regard to jurisdictional claims in published maps and institutional affiliations. |
© 2021 by the authors. Licensee MDPI, Basel, Switzerland. This article is an open access article distributed under the terms and conditions of the Creative Commons Attribution (CC BY) license (https://creativecommons.org/licenses/by/4.0/).
Share and Cite
MDPI and ACS Style
Li, J.; Bian, J.; Ma, Y.; Jiang, Y. Impact of Typhoons on Floating Offshore Wind Turbines: A Case Study of Typhoon Mangkhut. J. Mar. Sci. Eng. 2021, 9, 543. https://0-doi-org.brum.beds.ac.uk/10.3390/jmse9050543
AMA Style
Li J, Bian J, Ma Y, Jiang Y. Impact of Typhoons on Floating Offshore Wind Turbines: A Case Study of Typhoon Mangkhut. Journal of Marine Science and Engineering. 2021; 9(5):543. https://0-doi-org.brum.beds.ac.uk/10.3390/jmse9050543
Chicago/Turabian StyleLi, Jiawen, Jingyu Bian, Yuxiang Ma, and Yichen Jiang. 2021. "Impact of Typhoons on Floating Offshore Wind Turbines: A Case Study of Typhoon Mangkhut" Journal of Marine Science and Engineering 9, no. 5: 543. https://0-doi-org.brum.beds.ac.uk/10.3390/jmse9050543
Note that from the first issue of 2016, this journal uses article numbers instead of page numbers. See further details here.