
Reliability Modelling and Analysis of the Power Take-Off System of an Oscillating Wave Surge Converter


Abstract
:1. Introduction
1.1. Wave Energy and Reliability
1.2. MegaRoller OWSC Concept Development
1.3. Focus and Structure of This Article
2. Materials and Methods
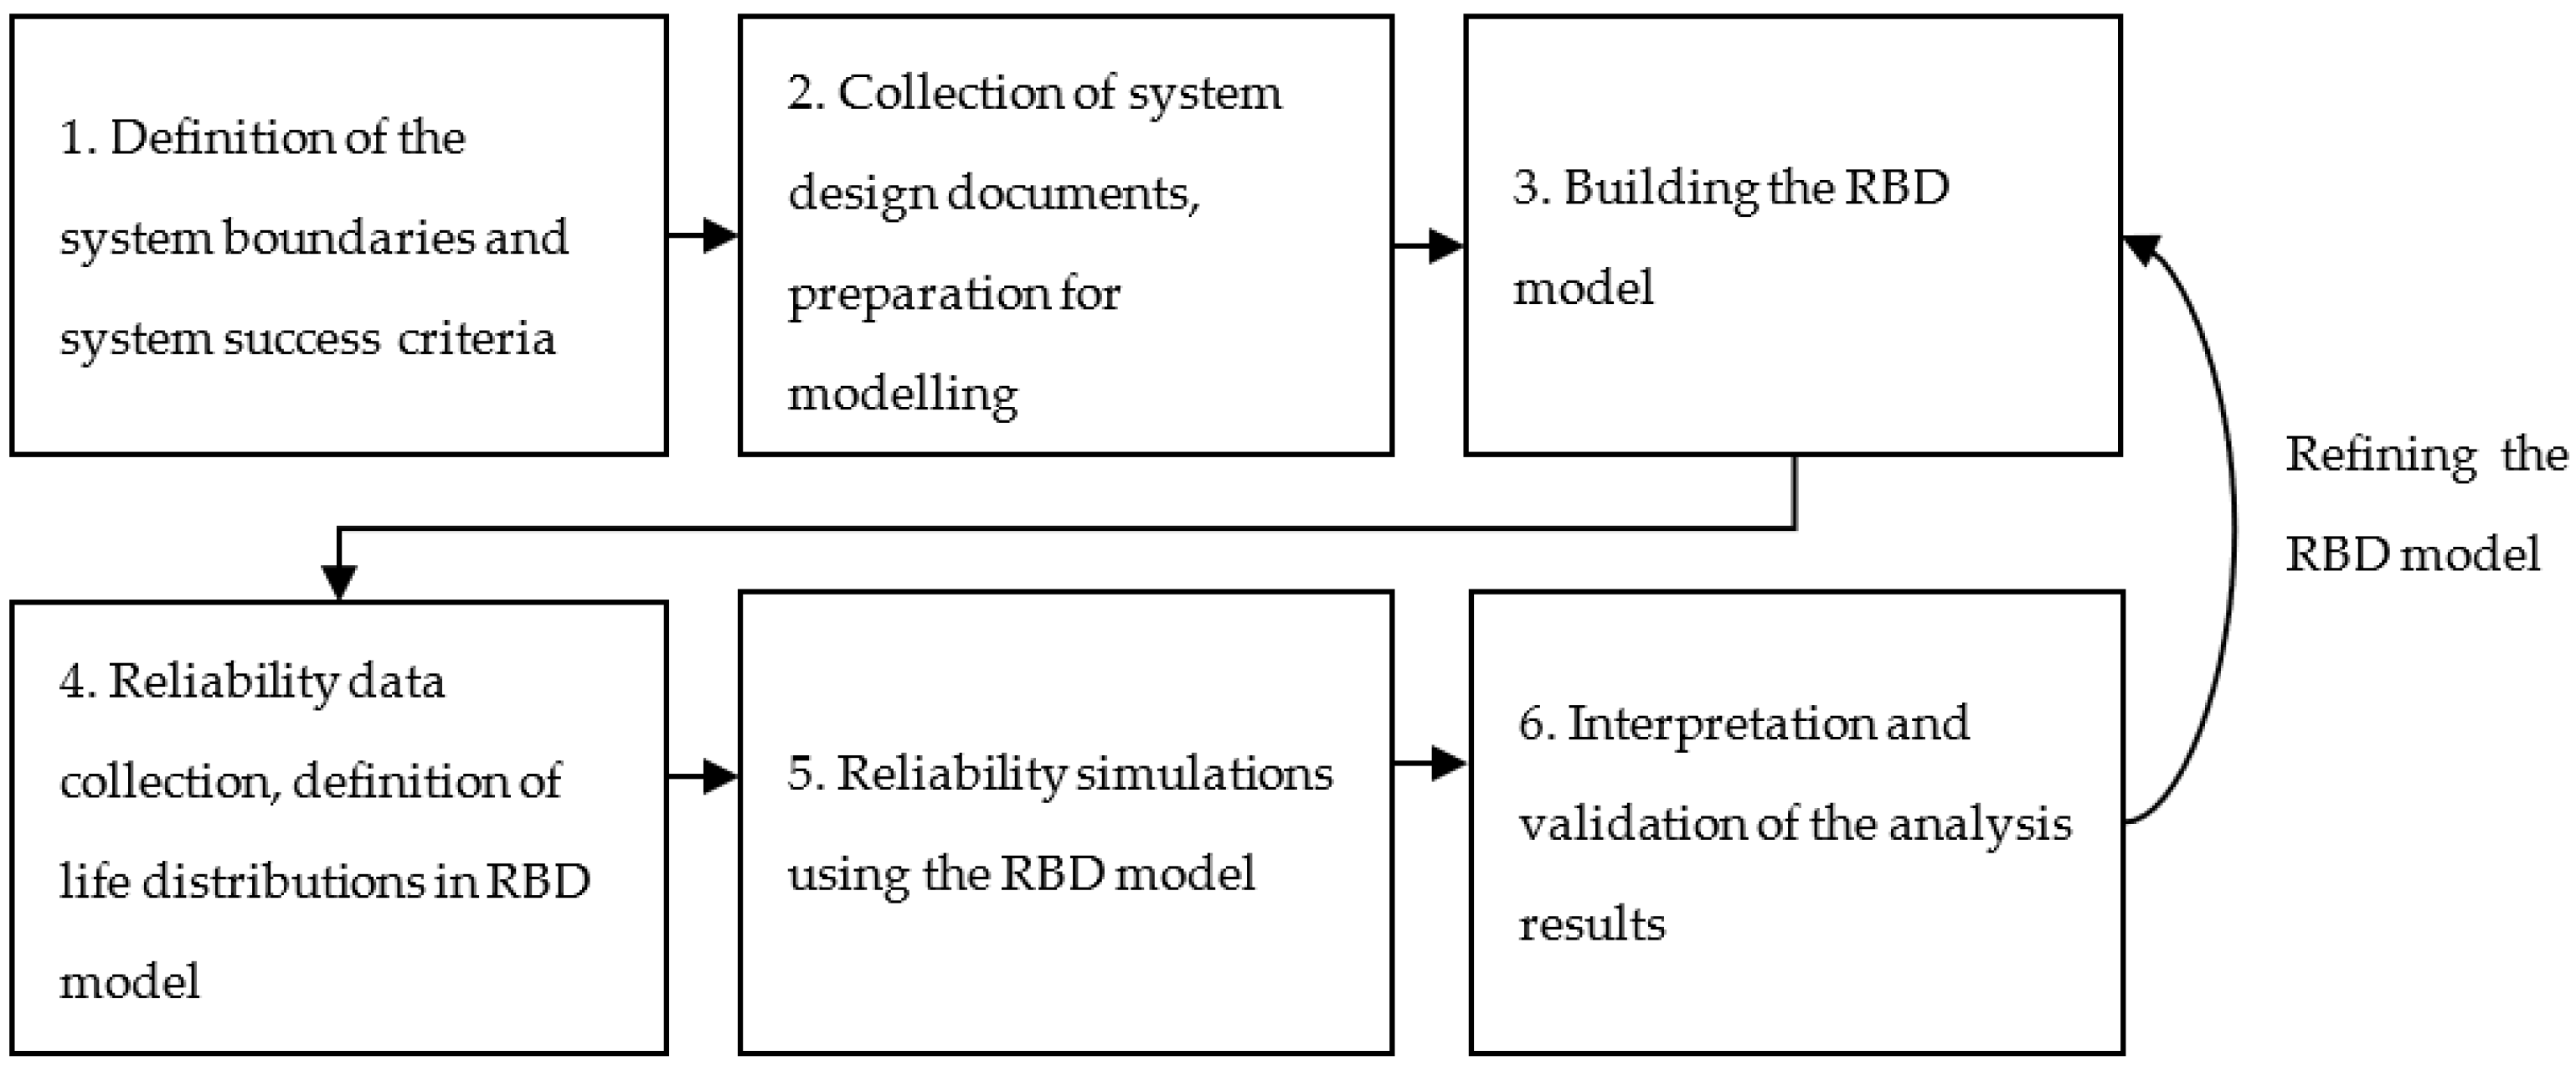
2.1. Reliability Modelling Method
2.2. Reliability Data Collection for WEC Technologies and Concepts
- The capacity factor (CF): the ratio of the turbines’ actual power output over a period of time to its theoretical power output.
- Time-based availability (At): the share of time where a wind turbine (WT) is operating or able to operate in comparison to the total time.
- Technical availability (Atech): the share of time where a WT is available from a technical perspective.
- Energetic availability (Aw): the turbines’ energy yield compared with the potential output, which highlights long down times during high wind speed phases and reduced operation.
- Failure rate (λ): the probability of a system failing within a specific period of time.
- Mean time to failure (MTTF): 1/λ, if the failure rate is constant.
- Mean time between failures (MTBF): for repairable systems, this also includes downtime due to repair.
- Mean downtime: expected or average downtime after a system fails and stops operation.
3. Results
3.1. Modelling Process
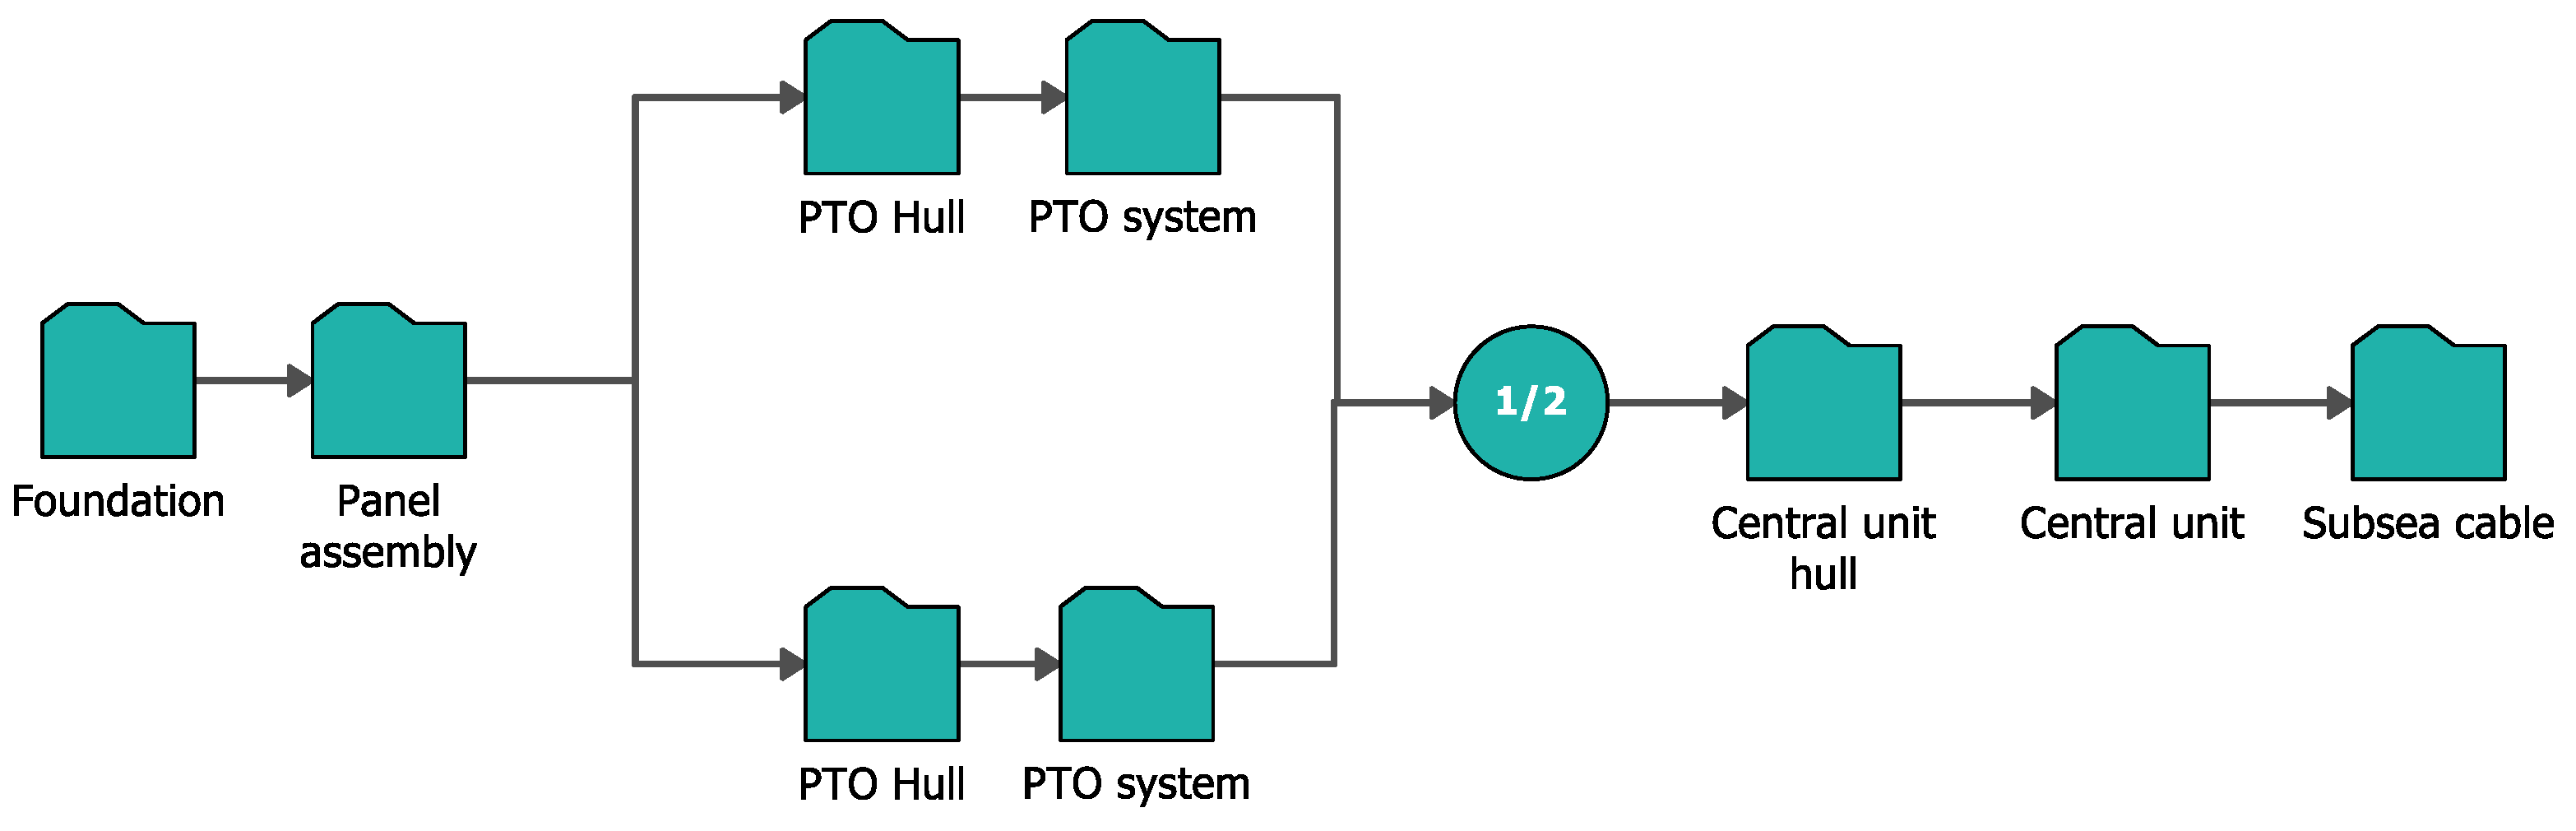
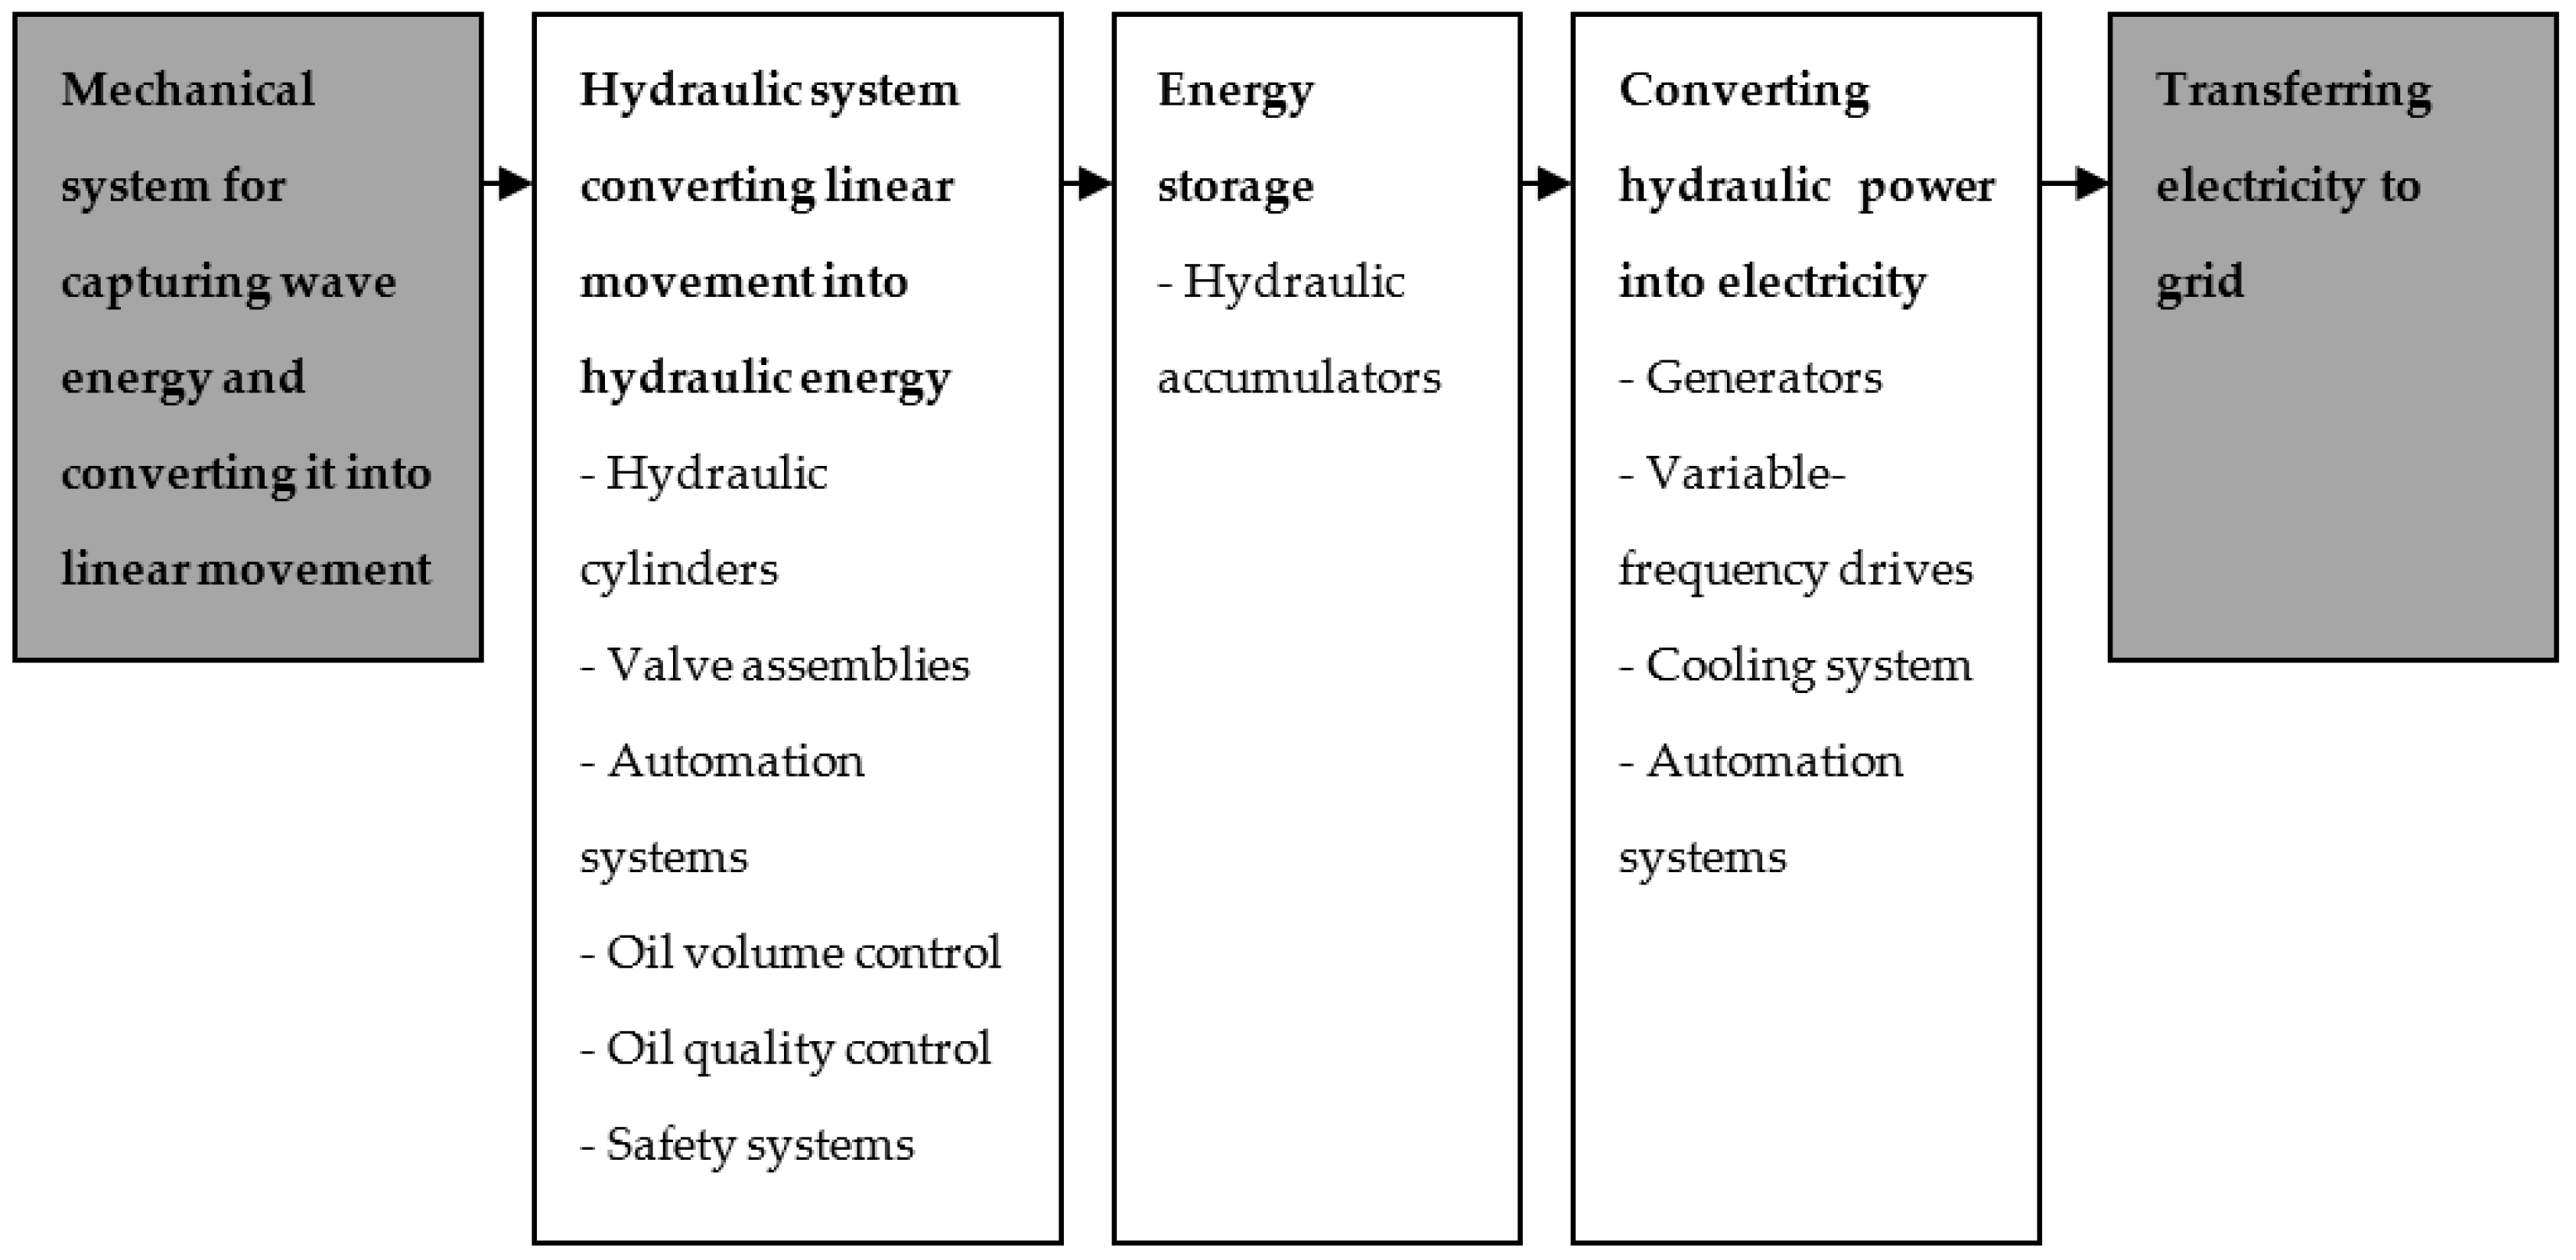
3.2. RBD Model Structure and Characteristics
3.2.1. Component Types and Life Distributions

| Component Type | Life Distribution | Comments |
|---|---|---|
| Automation products (processor modules, I/O modules, communication modules, etc.) | 1-parameter Exponential | MTTF data available from manufacturers. |
| Contactors | 1-parameter Exponential | –– “–– |
| Electric generators | 2-parameter Weibull | Rotating machinery (the main failure mechanism is bearing wear). Data from OREDA database [35]. |
| Electric motors | 2-parameter Weibull | –– “–– |
| Hydraulic accumulators | 2-parameter Weibull | Piston-type device (the main failure mechanism is sealing wear). Data from manufacturer. |
| Hydraulic cylinders | 2-parameter Weibull | Piston-type device. Data from literature [40]. |
| Hydraulic motors | 2-parameter Weibull | Rotating machinery. Data from OREDA database [35]. |
| Hydraulic pumps | 2-parameter Weibull | –– “–– |
| Relays | 1-parameter Exponential | MTTF data available from manufacturers. |
| Valves (electronic control) | 1-parameter Exponential | Main failure mechanism is failure of the electronic control. MTTF from ISO 13849-1:2015. |
| Variable-frequency drives | 1-parameter Exponential | MTTF data available from manufacturers. |
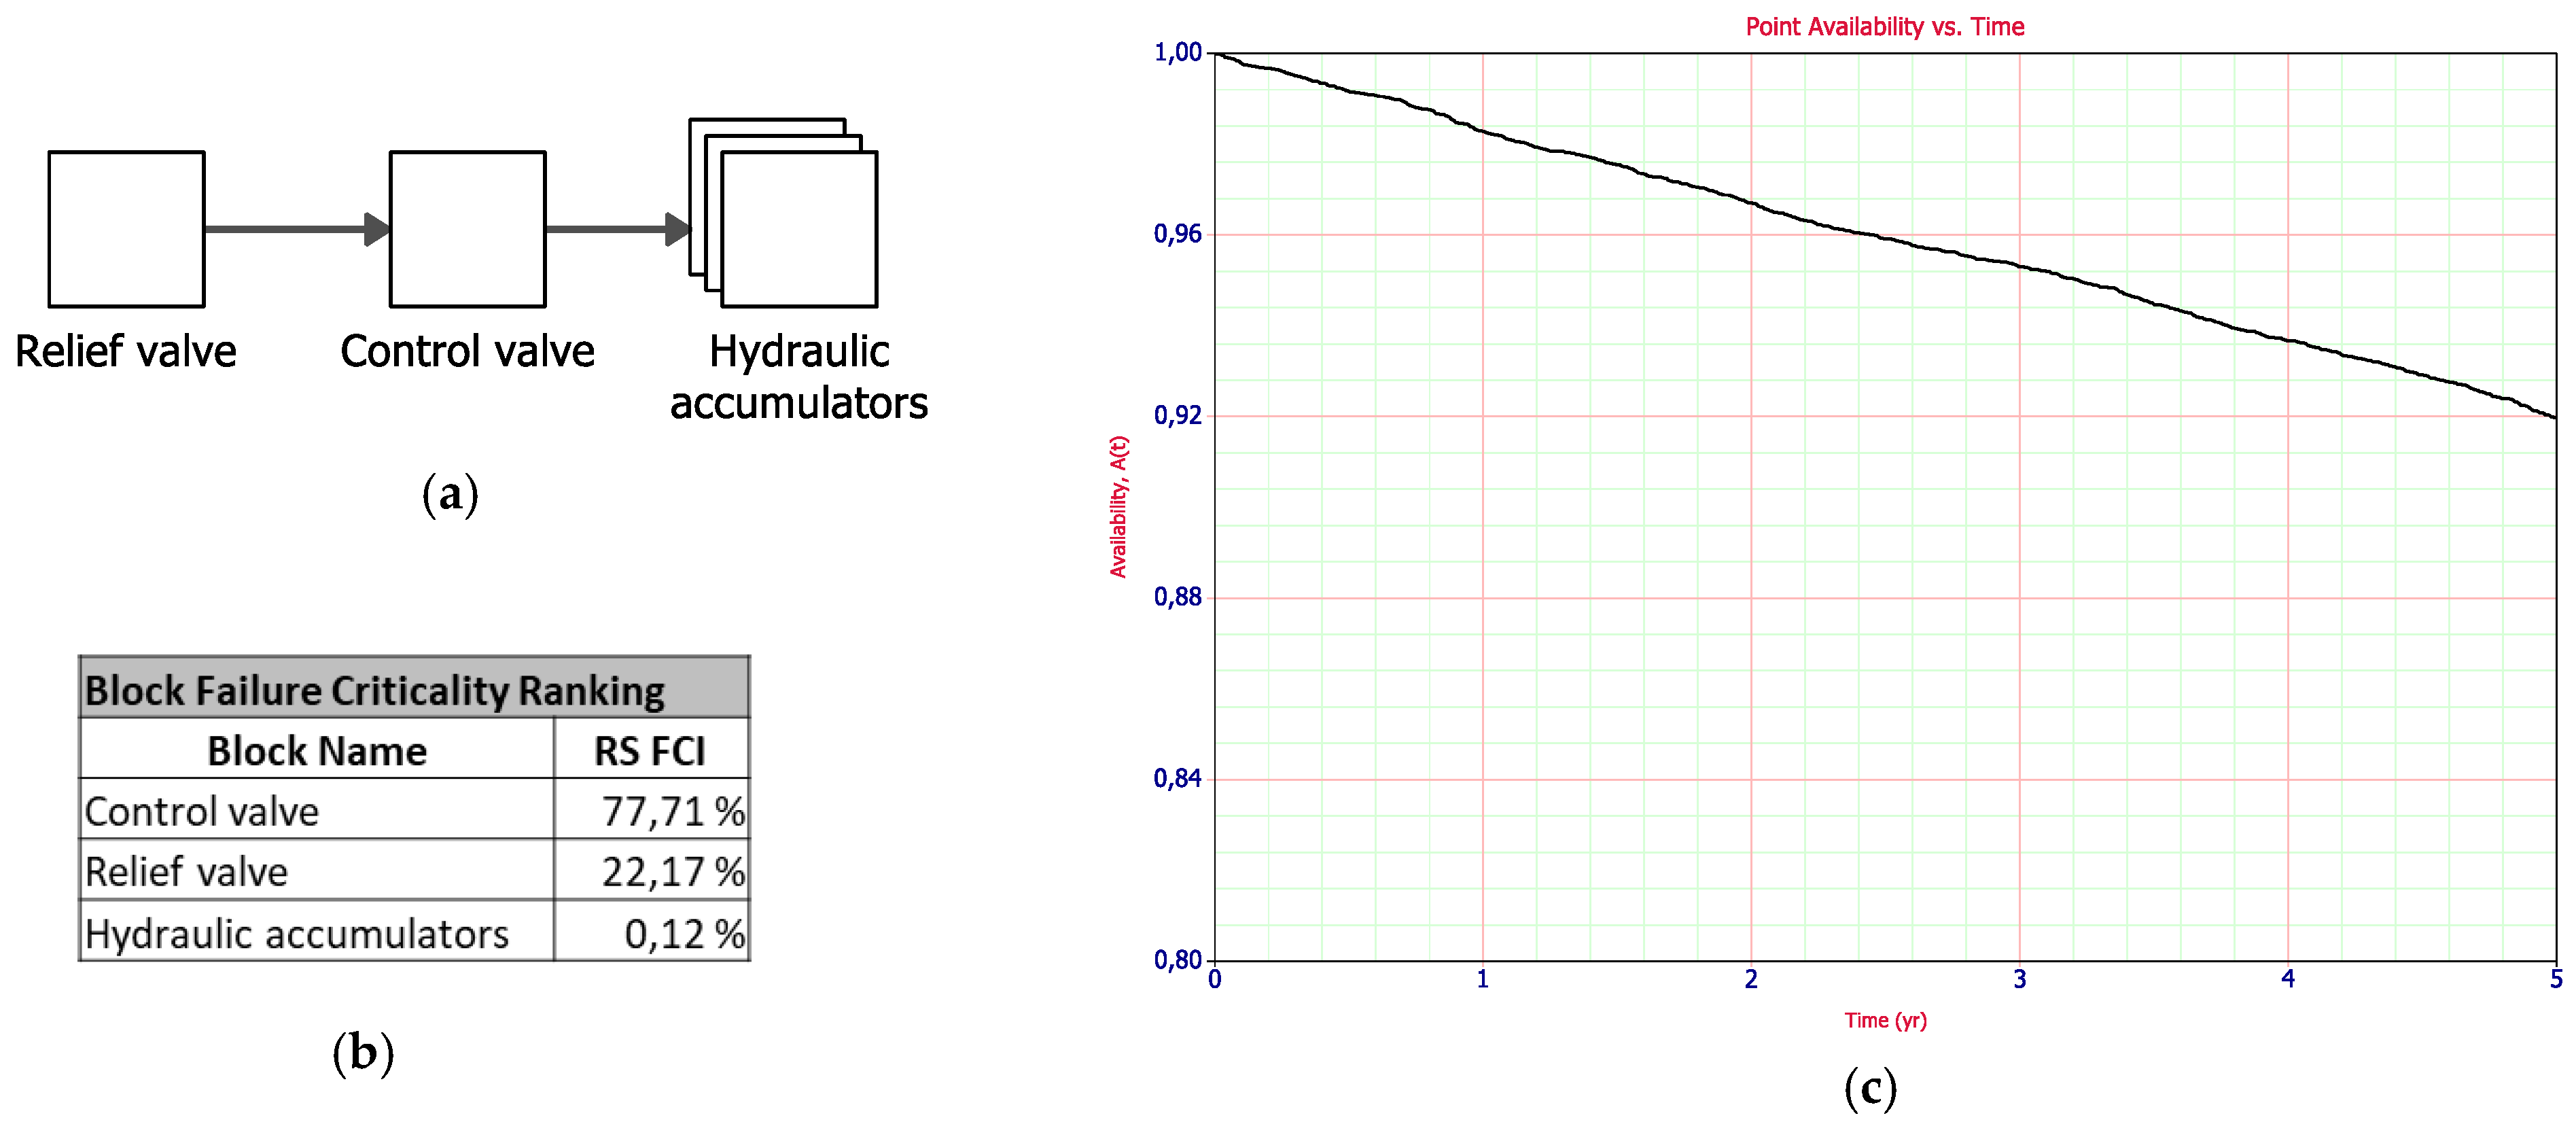
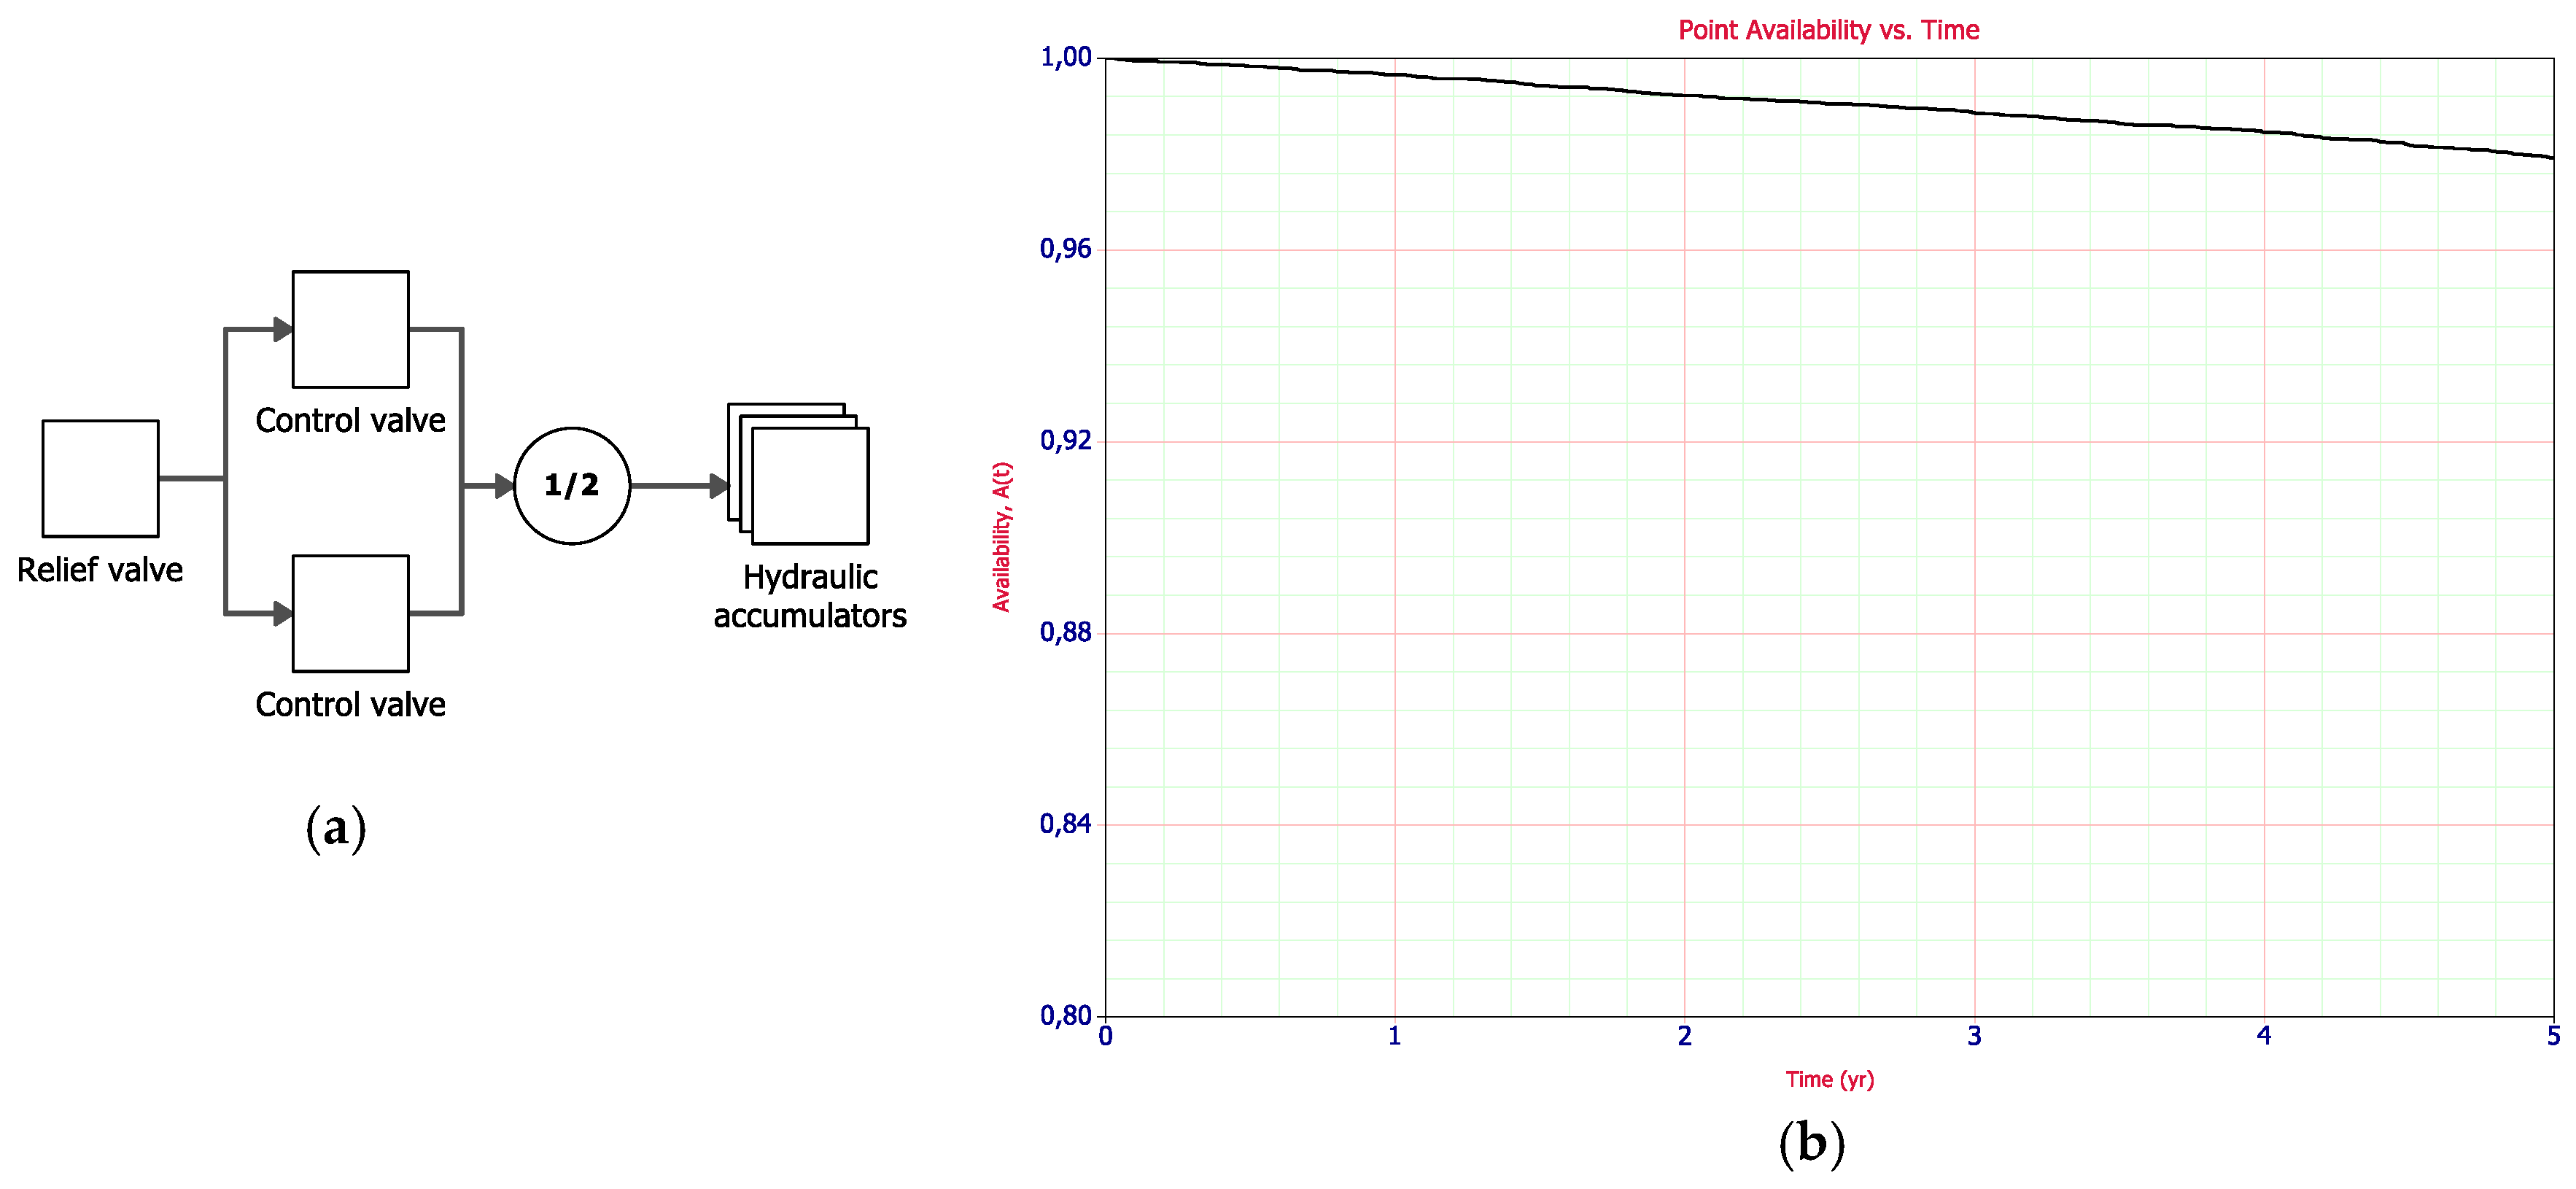
3.2.2. Case Example
4. Discussion
- Prediction of the failure probability of the PTO system during the intended periodic maintenance interval. This information can be used, for example, to further develop the scheduling of periodic maintenance activities to optimize the economic efficiency of the system.
- A listing of the most-reliability-critical components in the PTO system. This can be used to focus real-world testing of the device and to support future design efforts if further efforts to increase the system reliability are necessary.
- A visual representation of the PTO system reliability structure, which can be easily modified to compare various future design choices in terms of reliability performance.
Author Contributions
Funding
Conflicts of Interest
References
- Ocean Energy Europe (OEE). Available online: https://www.oceanenergy-europe.eu (accessed on 2 March 2021).
- European Commission Strategic Energy Technologies Information System (SETIS). Ocean Energy. Available online: https://setis.ec.europa.eu/system/files/Technology_Information_Sheet_Ocean_Energy.pdf (accessed on 2 March 2021).
- Ocean Energy Europe (OEE). Wave Energy. Available online: https://www.oceanenergy-europe.eu/ocean-energy/wave-energy/ (accessed on 2 March 2021).
- International Renewable Energy Agency (IRENA). Ocean energy. Available online: https://www.irena.org/ocean (accessed on 2 March 2021).
- International Renewable Energy Agency (IRENA). Wave Energy Technology Brief; IRENA: Abu Dhabi, United Arab Emirates, 2014. [Google Scholar]
- The European Marine Energy Centre Ltd. Wave Devices. Available online: http://www.emec.org.uk/marine-energy/wave-devices/ (accessed on 2 March 2021).
- Gunawardane, S.D.G.S.P.; Folley, M.; Kankanamge, C.J. Analysis of the hydrodynamics of four different oscillating wave surge converter concepts. Renew. Energy 2019, 130, 843–852. [Google Scholar] [CrossRef]
- Têtu, A. Power Take-Off Systems for WECs. In Handbook of Ocean Wave Energy. Ocean Engineering & Oceanography; Pecher, A., Kofoed, J., Eds.; Springer: Cham, Switzerland, 2017; Volume 7. [Google Scholar]
- Kofoed, J. The Wave Energy Sector. In Handbook of Ocean Wave Energy. Ocean Engineering & Oceanography; Pecher, A., Kofoed, J., Eds.; Springer: Cham, Switzerland, 2017; Volume 7. [Google Scholar]
- Wolfram, J. On Assessing the Reliability and Availability of Marine Energy Converters: The Problems of a New Technology. Proc. Inst. Eng. Part J. Risk Reliab. 2006, 220, 55–68. [Google Scholar] [CrossRef]
- Ambühl, S. Reliability of Wave Energy Converters. Ph.D. Thesis, Aalborg University, Aalborg, Denmark, 2015. [Google Scholar]
- Ransley, E.J. Survivability of Wave Energy Converter and Mooring Coupled System using CFD. Ph.D. Thesis, University of Plymouth, Plymouth, UK, 2015. [Google Scholar]
- Coe, R.G.; Neary, V.S. Review of Methods for Modeling Wave Energy Converter Survival in Extreme Sea States. In Proceedings of the 2nd Marine Energy Technology Symposium (METS2014), Seattle, WA, USA, 15–17 April 2014. [Google Scholar]
- O’Brien, L.; Christodoulides, P.; Renzi, E.; Stefanakis, T.; Dias, F. Will oscillating wave surge converters survive tsunamis? Theor. Appl. Mech. Lett. 2015, 5, 160–166. [Google Scholar] [CrossRef] [Green Version]
- Cretu, A.; Munteanu, R.; Iudean, D.; Vladareanu, V.; Karaisas, P. Reliability assessment of linear generator type wave energy converters. In Proceedings of the 2016 International Conference on Applied and Theoretical Electricity, ICATE 2016—Proceedings, Craiova, Romania, 6–8 October 2016. [Google Scholar]
- Mueller, M.; Lopez, R.; McDonald, A.; Jimmy, G. Reliability analysis of wave energy converters. In Proceedings of the 2016 IEEE International Conference on Renewable Energy Research and Applications, ICRERA 2016, Birmingham, UK, 20–23 November 2016; pp. 667–672. [Google Scholar]
- Thies, P.R. Advancing Reliability Information for Wave Energy Converters. Ph.D. Thesis, University of Exeter, Exeter, UK, 2012. [Google Scholar]
- Henderson, R. Design, simulation, and testing of a novel hydraulic power take-off system for the Pelamis wave energy converter. Renew. Energy 2006, 31, 271–283. [Google Scholar] [CrossRef]
- McAuliffe, F.D.; Macadré, L.-M.; Donovan, M.H.; Murphy, J.; Lynch, K. Economic and Reliability Assessment of a Combined Marine Renewable Energy Platform. In Proceedings of the 11th European Wave and Tidal Energy Conference, Nantes, France, 6–11 September 2015; p. 10. [Google Scholar]
- Heikkilä, E.; Sarsama, J.; Välisalo, T.; Räikkönen, M.; Tiusanen, R. Reliability-centered Development of a Wave Energy Converter: Interfaces between Reliability Modeling, FMECA and LCC. In Proceedings of the 2019 World Congress: Resilience, Reliability and Asset Management: Conference Proceedings, Singapore, 28–31 July 2019; pp. 248–251. [Google Scholar]
- Tiusanen, R.; Heikkilä, E.; Räikkönen, M.; Välisalo, T. System Approach to Reliability Engineering—Case: Wave Energy Converter. In Proceedings of the 30th European Safety and Reliability Conference and the 15th Probabilistic Safety Assessment and Management Conference (ESREL2020 PSAM15), Venice, Italy, 1–5 November 2020. [Google Scholar]
- Gray, A.; Dickens, B.; Bruce, T.; Ashton, I.; Johanning, L. Reliability and O&M sensitivity analysis as a consequence of site specific characteristics for wave energy converters. Ocean Eng. 2017, 141, 493–511. [Google Scholar]
- AW-Energy Website on WaveRoller Technology. Available online: http://aw-energy.com/waveroller/#technology (accessed on 3 March 2021).
- MegaRoller Project Website. Available online: https://www.sintef.no/projectweb/megaroller/ (accessed on 3 March 2021).
- Reubens, R. To craft, by design, for sustainability: Towards holistic sustainability design for developing-country enterprises. Ph.D. Thesis, Delft University of Technology, Delft, The Netherlands, 2016. [Google Scholar]
- Horváth, I. Comparison of three methodological approaches of design research. In Proceedings of the DS 42: Proceedings of ICED 2007, the 16th International Conference on Engineering Design, Paris, France, 28–31 July 2007. [Google Scholar]
- Iivari, J.; Venable, J. Action research and design science research-Seemingly similar but decisively dissimilar. In Proceedings of the ECIS 2009 Proceedings, 2009; Available online: https://core.ac.uk/download/pdf/301355252.pdf (accessed on 3 March 2021).
- IEC 61078:2016. Reliability block diagrams. Available online: https://webstore.iec.ch/publication/25647 (accessed on 3 March 2021).
- Čepin, M. Reliability Block Diagram. In Assessment of Power System Reliability; Springer: London, UK, 2011. [Google Scholar]
- Relia Soft Corporation. System Analysis Reference. Available online: http://reliawiki.org/index.php/System_Analysis_Reference (accessed on 3 March 2021).
- O’Connor, A.; Modarres, M.; Mosleh, A. Probability Distributions Used in Reliability Engineering; Center for Reliability Engineering University of Maryland: College Park, MD, USA, 2016. [Google Scholar]
- Scheu, M.N.; Kolios, A.; Fischer, T.; Brennan, F. Influence of statistical uncertainty of component reliability estimations on offshore wind farm availability. Reliab. Eng. Syst. Saf. 2017, 168, 28–39. [Google Scholar] [CrossRef]
- Pfaffel, S.; Faulstich, S.; Rohrig, K. Performance and Reliability of Wind Turbines: A Review. Energies 2017, 10, 1904. [Google Scholar] [CrossRef] [Green Version]
- Dao, C.; Kazemtabrizi, B.; Crabtree, C. Wind turbine reliability data review and impacts on levelised cost of energy. Wind Energy 2019, 22, 1848–1871. [Google Scholar] [CrossRef] [Green Version]
- OREDA Cloud Database; Sintef: Trondheim, Norway, 2020.
- ISO 13849-1:2015. Safety of Machinery. Safety-Related Parts of Control Systems. Part 1: General Principles for Design. Available online: https://www.iso.org/standard/69883.html (accessed on 3 March 2021).
- Relia Soft Corporation. 2015. BlockSim Features Overview. Available online: http://help.synthesisplatform.net/blocksim_reno9/introduction_to_blocksim.htm (accessed on 11 May 2021).
- Marquez, A.C.; Heguedas, A.S.; Iung, B. Monte Carlo-based assessment of system availability. A case study for cogeneration plants. Reliab. Eng. Syst. Saf. 2005, 88, 273–289. [Google Scholar] [CrossRef]
- General Electric Company. About Weibull Distribution. 2018. Available online: https://www.ge.com/digital/documentation/meridium/Help/V43050/Default/Subsystems/ReliabilityAnalytics/Content/WeibullDistrubution.htm (accessed on 3 March 2021).
- Jocanović, M.; Šević, D.; Karanović, V.; Beker, I.; Dudić, S. Increased efficiency of hydraulic systems through reliability theory and monitoring of system operating parameters. Stroj. Vestn. J. Mech. Eng. 2012, 58. [Google Scholar] [CrossRef]
- Wang, W.; Loman, J.; Vassiliou, P. Reliability importance of components in a complex system. In Proceedings of the Annual Reliability and Maintainability Symposium, Los Angeles, CA, USA, 26–29 January 2004; pp. 6–11. [Google Scholar]


Publisher’s Note: MDPI stays neutral with regard to jurisdictional claims in published maps and institutional affiliations. |
© 2021 by the authors. Licensee MDPI, Basel, Switzerland. This article is an open access article distributed under the terms and conditions of the Creative Commons Attribution (CC BY) license (https://creativecommons.org/licenses/by/4.0/).
Share and Cite
Heikkilä, E.; Välisalo, T.; Tiusanen, R.; Sarsama, J.; Räikkönen, M. Reliability Modelling and Analysis of the Power Take-Off System of an Oscillating Wave Surge Converter. J. Mar. Sci. Eng. 2021, 9, 552. https://0-doi-org.brum.beds.ac.uk/10.3390/jmse9050552
Heikkilä E, Välisalo T, Tiusanen R, Sarsama J, Räikkönen M. Reliability Modelling and Analysis of the Power Take-Off System of an Oscillating Wave Surge Converter. Journal of Marine Science and Engineering. 2021; 9(5):552. https://0-doi-org.brum.beds.ac.uk/10.3390/jmse9050552
Chicago/Turabian StyleHeikkilä, Eetu, Tero Välisalo, Risto Tiusanen, Janne Sarsama, and Minna Räikkönen. 2021. "Reliability Modelling and Analysis of the Power Take-Off System of an Oscillating Wave Surge Converter" Journal of Marine Science and Engineering 9, no. 5: 552. https://0-doi-org.brum.beds.ac.uk/10.3390/jmse9050552