Article

Upper Pleistocene and Holocene Storm Deposits Eroded from the Granodiorite Coast on Isla San Diego (Baja California Sur, Mexico)

by
Ginni Callahan
1,
Markes E. Johnson
2,*,
Rigoberto Guardado-France
3 and
Jorge Ledesma-Vázquez
3
1
Sea Kayak Baja Mexico, Nicolas Bravo s/n, Entre Baja California y El Muro de Contención, Colonia Centro, Loreto 23880, Baja California Sur, Mexico
2
Department of Geosciences, Williams College, Williamstown, MA 01267, USA
3
Facultad de Ciencias Marinas, Universidad Autónoma de Baja California, Ensenada 22800, Baja California, Mexico
*
Author to whom correspondence should be addressed.
J. Mar. Sci. Eng. 2021, 9(5), 555; https://0-doi-org.brum.beds.ac.uk/10.3390/jmse9050555
Submission received: 19 April 2021 / Revised: 12 May 2021 / Accepted: 19 May 2021 / Published: 20 May 2021

Abstract

:
This project examines the role of hurricane-strength events likely to have exceeded 119 km/h in wind speed that entered the Gulf of California from the open Pacific Ocean during Late Pleistocene and Holocene times to impact the granodiorite shoreline on Isla San Diego. Conglomerate dominated by large, ellipsoidal to subspherical boulders at the islands south end were canvassed at six stations. A total of 200 individual cobbles and boulders were systematically measured in three dimensions, providing the database for analyses of variations in clast shape and size. The project’s goal was to apply mathematical equations elaborated after Nott (2003) with subsequent refinements to estimate individual wave heights necessary to lift igneous blocks from the joint-bound and exfoliated coast on Isla San Diego. On average, wave heights on the order of 3 m are calculated as having impacted the Late Pleistocene rocky coastline on Isla San Diego during storms, although the largest boulders more than a meter in diameter are estimated to weigh two metric tons and would have required waves in excess of 10 m for extraction. Described for the first time, a fossil marine biota associated with the boulder beds confirms a littoral-to-very-shallow water setting correlated with Marine Isotope Substage 5e approximately 125,000 years ago. A narrow submarine ridge consisting, in part, of loose cobbles and boulders extends for 1.4 km to the southwest from the island’s tip, suggesting that Holocene storms continued to transport rock debris removed from the shore. The historical record of events registered on the Saffir–Simpson Hurricane Wind Scale in the Gulf of California suggests that major storms with the same intensity struck the island in earlier times.

1. Introduction

Oriented northeast to southwest between mainland Mexico and the Baja California Peninsula, 40 named islands in the Gulf of California spread out over a sea surface of 160,000 km2. These gulf islands range between 1224 km2 and 22 ha in size [1]. Island development postdates the opening of the gulf to the Pacific Ocean by rifting from the mainland more than 5 million years ago and many formed as fault blocks influenced by regional tectonics. Most are composed of Miocene volcanic flows or from intrusive igneous rocks of yet older Cretaceous origin. Of the 40 islands, 8 islands fall into the category dominated by granite or closely related granodiorite, and this study looks at one of the smallest in the lower Gulf of California called Isla San Diego with an area of 60 ha [1]. Survey work conducted through satellite imagery shows that rocky shores account for nearly half the gulf’s peninsular coastline including related islands [2]. At slightly more than 23%, andesite dominates the region’s total shores, followed by granite or granodiorite at 9%, and limestone at 7.5%, while rock types including other igneous rocks or metamorphic rocks are less well represented.
This contribution belongs to a series of papers focused on the erosion of coastal boulder beds from their parent rocks within the Gulf of California. Upper Pleistocene and Holocene deposits formed by boulders are commonly found along the peninsular shores of Baja California and around the gulf islands but most studies in coastal geomorphology seldom compare the results of rock density on an interregional basis as related to different parent rock types. The application of mathematical formulae to estimate storm wave height was applied previously to coastal boulder deposits throughout the Gulf of California, including those formed by limestone, rhyolite, and andesite clasts [3,4,5,6]. Extension of this program now includes the Pleistocene boulder beds eroded from the granodiorite coast of Isla San Diego, applying the same methodology of systematic size measurements to calculate volume and weight based on rock density preliminary to the estimation of wave heights derived from competing equations. The study also newly describes marine fossils preserved within the Pleistocene conglomerate of Isla San Diego that date the deposits with reasonable accuracy. Finally, development during the Holocene time of a long marine ridge off the southwestern tip of the island brings into consideration the ongoing influence of hurricanes capable of moving large boulders in a shallow, subtidal setting.
Aside from the limited statistics available on the size, geologic origins, and coastal composition of islands in the Gulf of California [1,2], barely any literature exists on the geology and geomorphology of Isla San Diego except for an early nineteenth-century appraisal that includes the only previous description of the submarine ridge off the island’s southernmost end [7]. Attention to the phenomenon of coastal mega boulders and their relationship to major storms or tsunami events is a topic of growing interest [8,9,10,11]. Especially in the context of rock density, the data from Isla San Diego provide further insight on comparison of storm beds of Pleistocene and Holocene origins throughout the gulf region [3,4,5,6] with oceanic basalt in the Azores and Canary Islands of the North Atlantic [12,13], as well as rare mantel rocks from storm beds in coastal Norway on the Norwegian Sea [14].

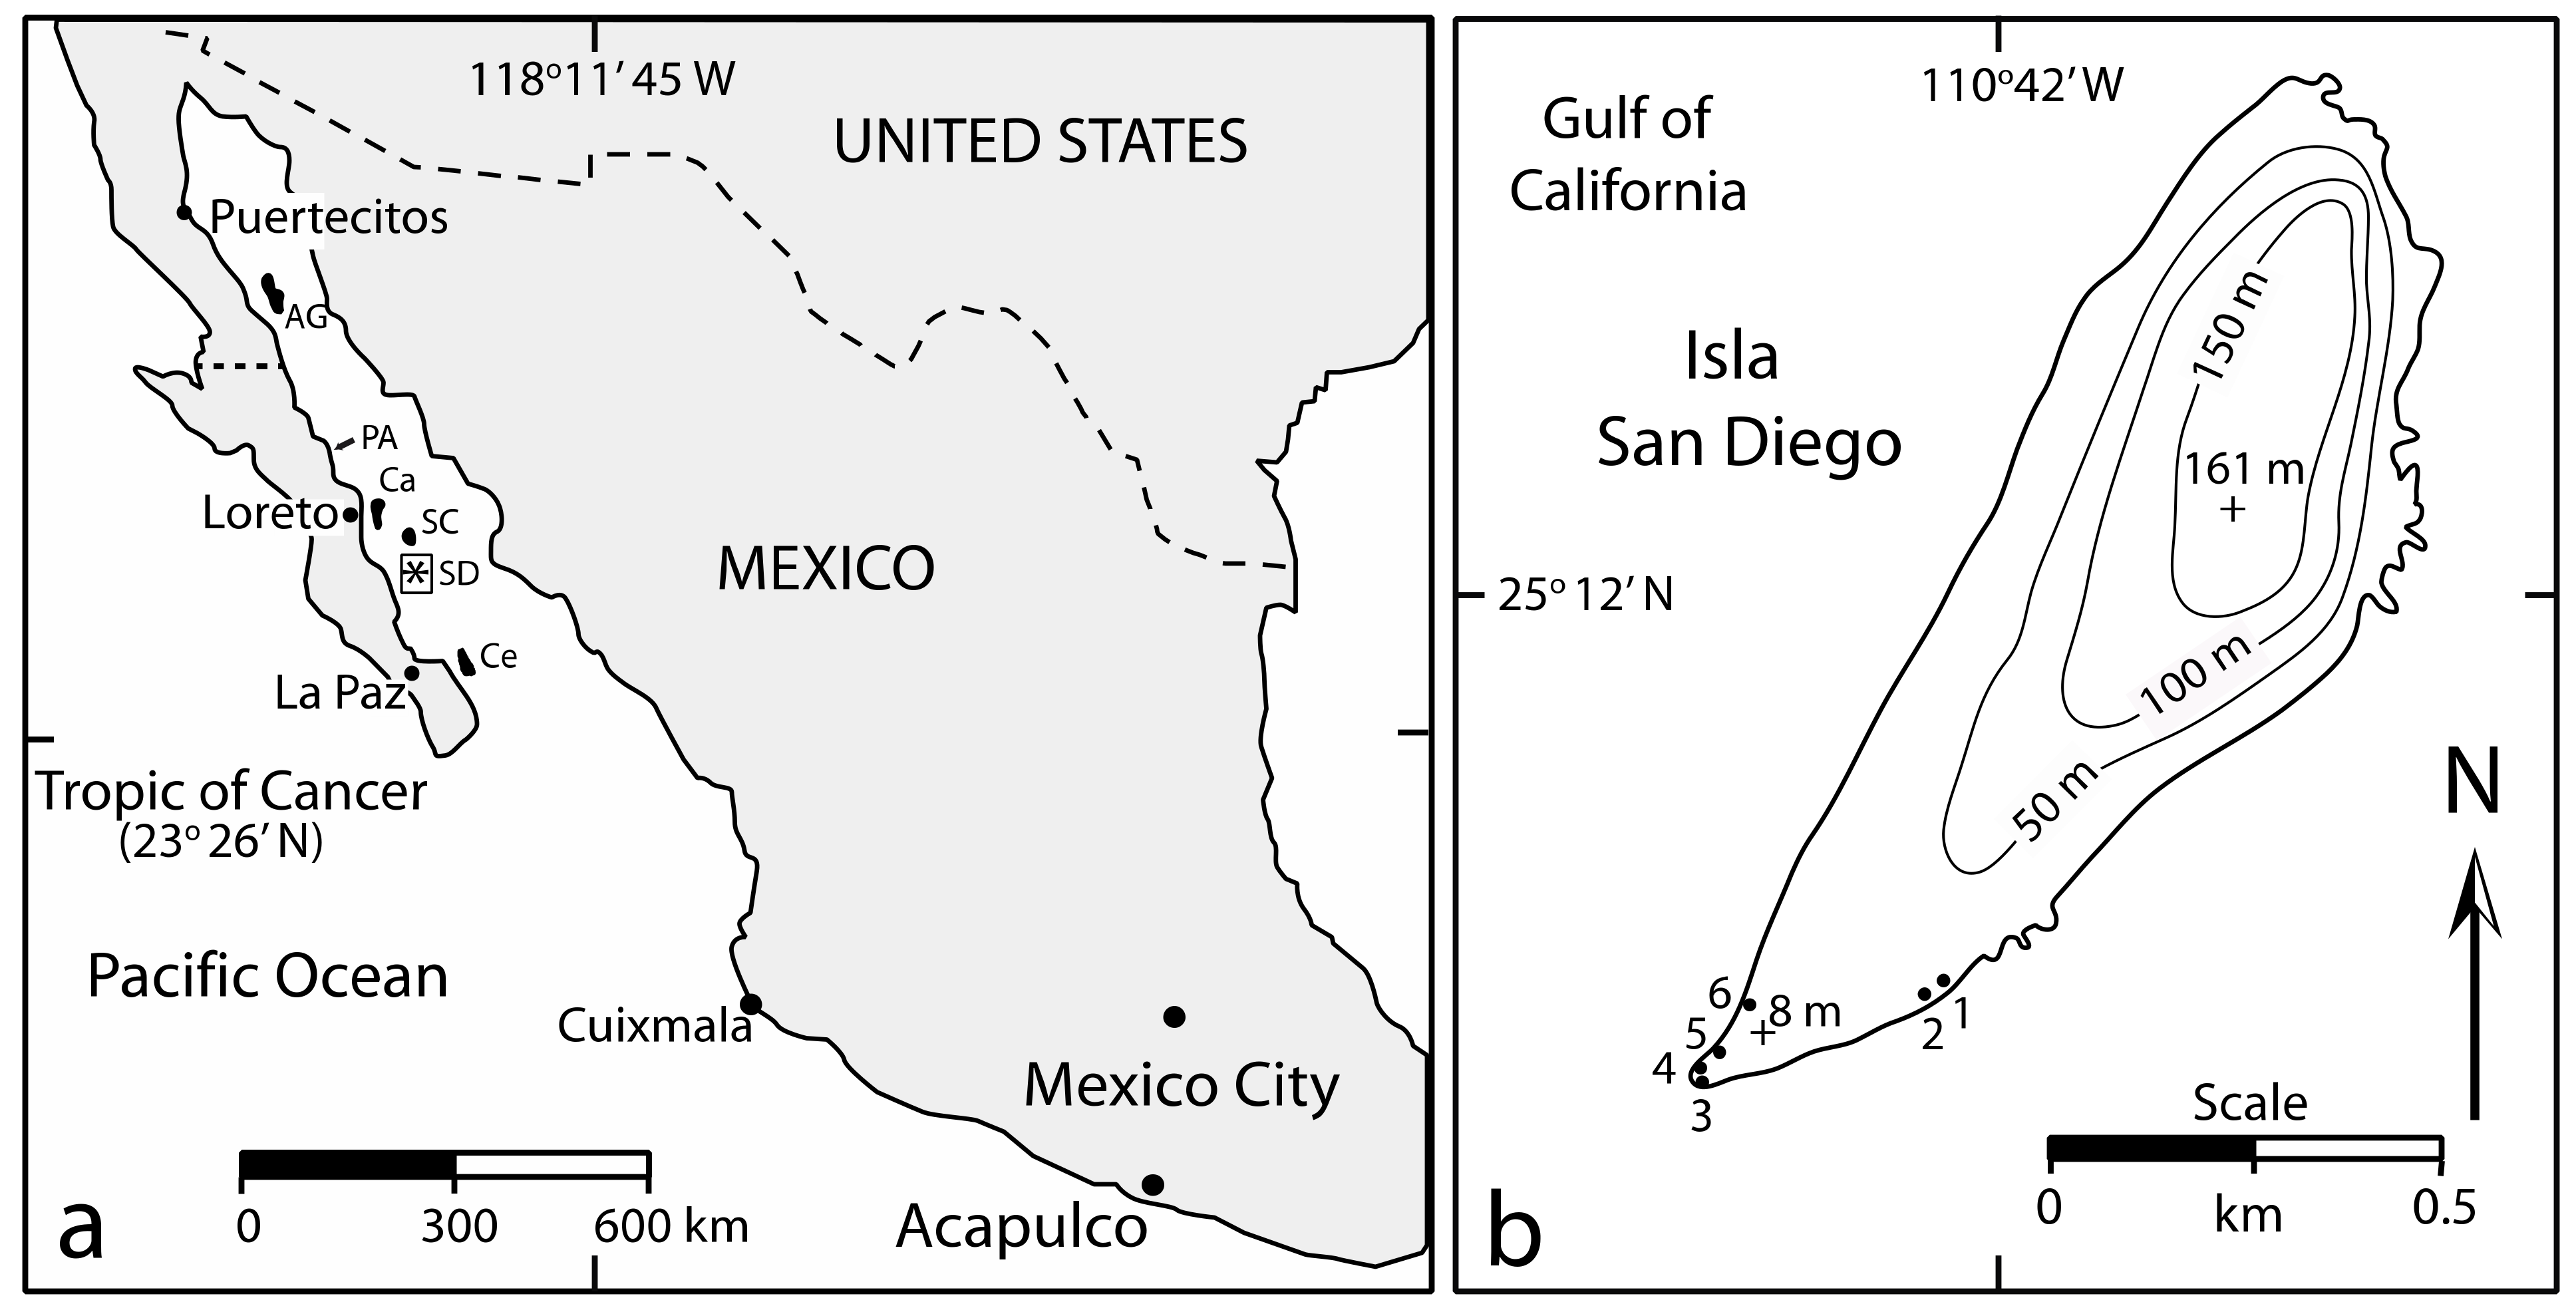
2. Geographical and Geological Setting

Stretching for more than 1000 km in length (Figure 1a), the Gulf of California is a marginal sea seated over a tectonically active zone that entails spreading centers offset by a succession of transform faults [15]. The central spine of the adjacent Baja California Peninsula is formed by granodiorite, broadly dated to a Cretaceous origin between 97 and 90 million years ago [16]. Upfaulted granodiorite basement occurs on the Baja California Peninsula at Punta San Antonio north of Loreto, on Isla Catalina east of Loreto, as well as Isla Santa Cruz and Isla San Diego (Figure 1a). Peninsular and island development including those areas with granodiorite resulted from Miocene extensional rifting that began prior to flooding 13 million years ago and lasted for 9.5 million years when a change in dynamics initiated transform faults connected with the San Andreas Fault on the US side of the border [1,2,15]. A detachment zone was activated approximately 3.5 million years ago that resulted in half-graben structures separating the islands from the rest of the Baja California Peninsula. The detachment zone that extends from Punta San Antonio to Isla San Diego (Figure 1a) is identified as the Comondú Detachment.
Isla San Diego is at the southeast end of the detachment zone 20 km or 11 nautical miles due east of the closest access point on the Baja California Peninsula. The main north–south highway is too distant from the peninsula’s eastern shore to make boat access to the island convenient. Compared to other islands farther to the northwest or southeast, the relative isolation of Isla San Diego meant that it received little attention from geographers and geologists. No formal topographic map by the Federal Mexican government exists for Isla San Diego and its dimensions and topography were appraised by satellite imagery [2]. The island is elongated in shape, approximately 1.5 km in length and 0.43 km in width with northeast to southwest orientation (Figure 1b). The maximum elevation is more than 160 m above mean sea level, as attained to the north, but the island’s central ridgeline tapers gradually downward to the shore at the southwest end.
The island core is composed entirely of granodiorite and the conglomerate beds eroded from these basement rocks occur exclusively at the southwestern end. A prominent submarine ridge extends from the tip of the island [7], where large boulders of loosely piled granodiorite are close to the surface (Figure 2a). Granodiorite sea cliffs are well exposed along the east shore for more than 400 m from the southwest tip of the island to the northeast, where a series of closely spaced grottos are eroded as a result of spheroidal weathering between joints in the rock (Figure 2b). Additional weathering along both flanks of the island is the result of sheeted exfoliation typical of granitoid rocks.
The greater part of Mexico’s Natural Protected Areas (Áreas Naturales Protegida) is taken up by the Gulf of California Biosphere Reserve protecting all islands in the Gulf of California, which accounts for roughly 19% of the nation’s total conservation reserves [17]. Therefore, Isla San Diego is protected under conservation guidelines due to its biodiversity and ecological characteristics. All materials and fossils identified in this study were left in place on Isla San Diego.

3. Materials and Methods

3.1. Data Collection

The raw data for this study were collected in March 2021 from deposits composed exclusively of granodiorite cobbles and boulders consolidated by a thin limestone matrix. Individual clasts from six stations were measured manually to the nearest half centimeter in three dimensions perpendicular to one another (long, intermediate, and short axes). Differentiated from cobbles, the base definition for a boulder adapted in this exercise was that of Wentworth [18] for an erosional clast equal or greater than 25.6 cm in diameter. Triangular plots were employed to show variations in clast shape, following the design of Sneed and Folk [19] for river pebbles. In the field, all measured clasts were characterized as subrounded, and a smoothing factor of 20% was applied uniformity to adjust for the estimated volume calculated by the simple multiplication of length from the three axes. Comparative data on maximum cobble and boulder dimensions were fitted to bar graphs to show size variations in the long and intermediate axes from one sample to the next. The rock density from a granodiorite sample yielded a value of 2.52 g/cm3.

3.2. Hydraulic Model

Granodiorite is the typical intrusive magmatic rock characteristic of several islands in the Gulf of California. Herein, two formulas were applied to estimate the size of storm waves against joint-bound blocks. Equation (1) derives from the work of Nott [20] and Equation (2) is modified from an alternative approach using the velocity equations of Nandasena et al. [21] applied to storm deposits by Pepe et al. [22].
H s = ρ s ρ w ρ w a C 1
H s = 2 ρ s ρ w ρ w .   c   .   cos θ + µ s   .   sin θ c 1 100
where Hs = height of the storm wave at breaking point; ρs = density of the boulder (tons/m3 or g/cm3); ρw = density of water at 1.02 g/mL; a = length of the boulder on long axis in cm; θ is the angle of the bed slope at the pretransport location (1° for joint-bounded boulders); μs is the coefficient of static friction (=0.7); and Cl is the lift coefficient (=0.178). Equation (1) is more sensitive to the length of a boulder on the long axis, whereas Equation (2) is more sensitive to the length of a boulder on the short axis. Therefore, some differences are expected in the estimates of HS.

4. Results

4.1. Base Map and Sample Stations

Isla San Diego is among the smallest named islands formed by granodiorite in the Gulf of California [1]. Its size was conducive to a close coastal survey by kayak that allowed for the location and appraisal of conglomerate beds on the island’s periphery. Six sampling stations were chosen from the conglomerate outcrops found only around the southwestern end of the island (Figure 1b). Between 30 and 35 individual clasts were measured within a meter’s radius from a position above the source basement rock. Co-ordinates are listed in Appendix A (Table A1, Table A2, Table A3, Table A4, Table A5 and Table A6) for each station recorded by a hand-held device for tracking by the satellite-based global positioning system (GPS). Sample Stations 1 and 2 (Figure 3a) are located on the east shore 375 m and 350 m north of the island’s tip, respectively, where the conglomerate sits directly above a bench of granodiorite approximately 1.5 m above mean sea level. Station 3 is located at the extreme southwestern tip of the island (Figure 3b), where crude layering in the conglomerate shows a 30° inclination to the northwest. Three additional stations were established on the west shore (Figure 1b), where the contact is concealed by talus. Clasts measured at those stations also were limited to a 2 m radius at points near the bottom of the conglomerate bed but included some samples from the talus showing evidence of carbonate cement formerly binding the conglomerate. Clean clasts from the intertidal zone on that side of the island are reworked by coastal currents and were excluded.

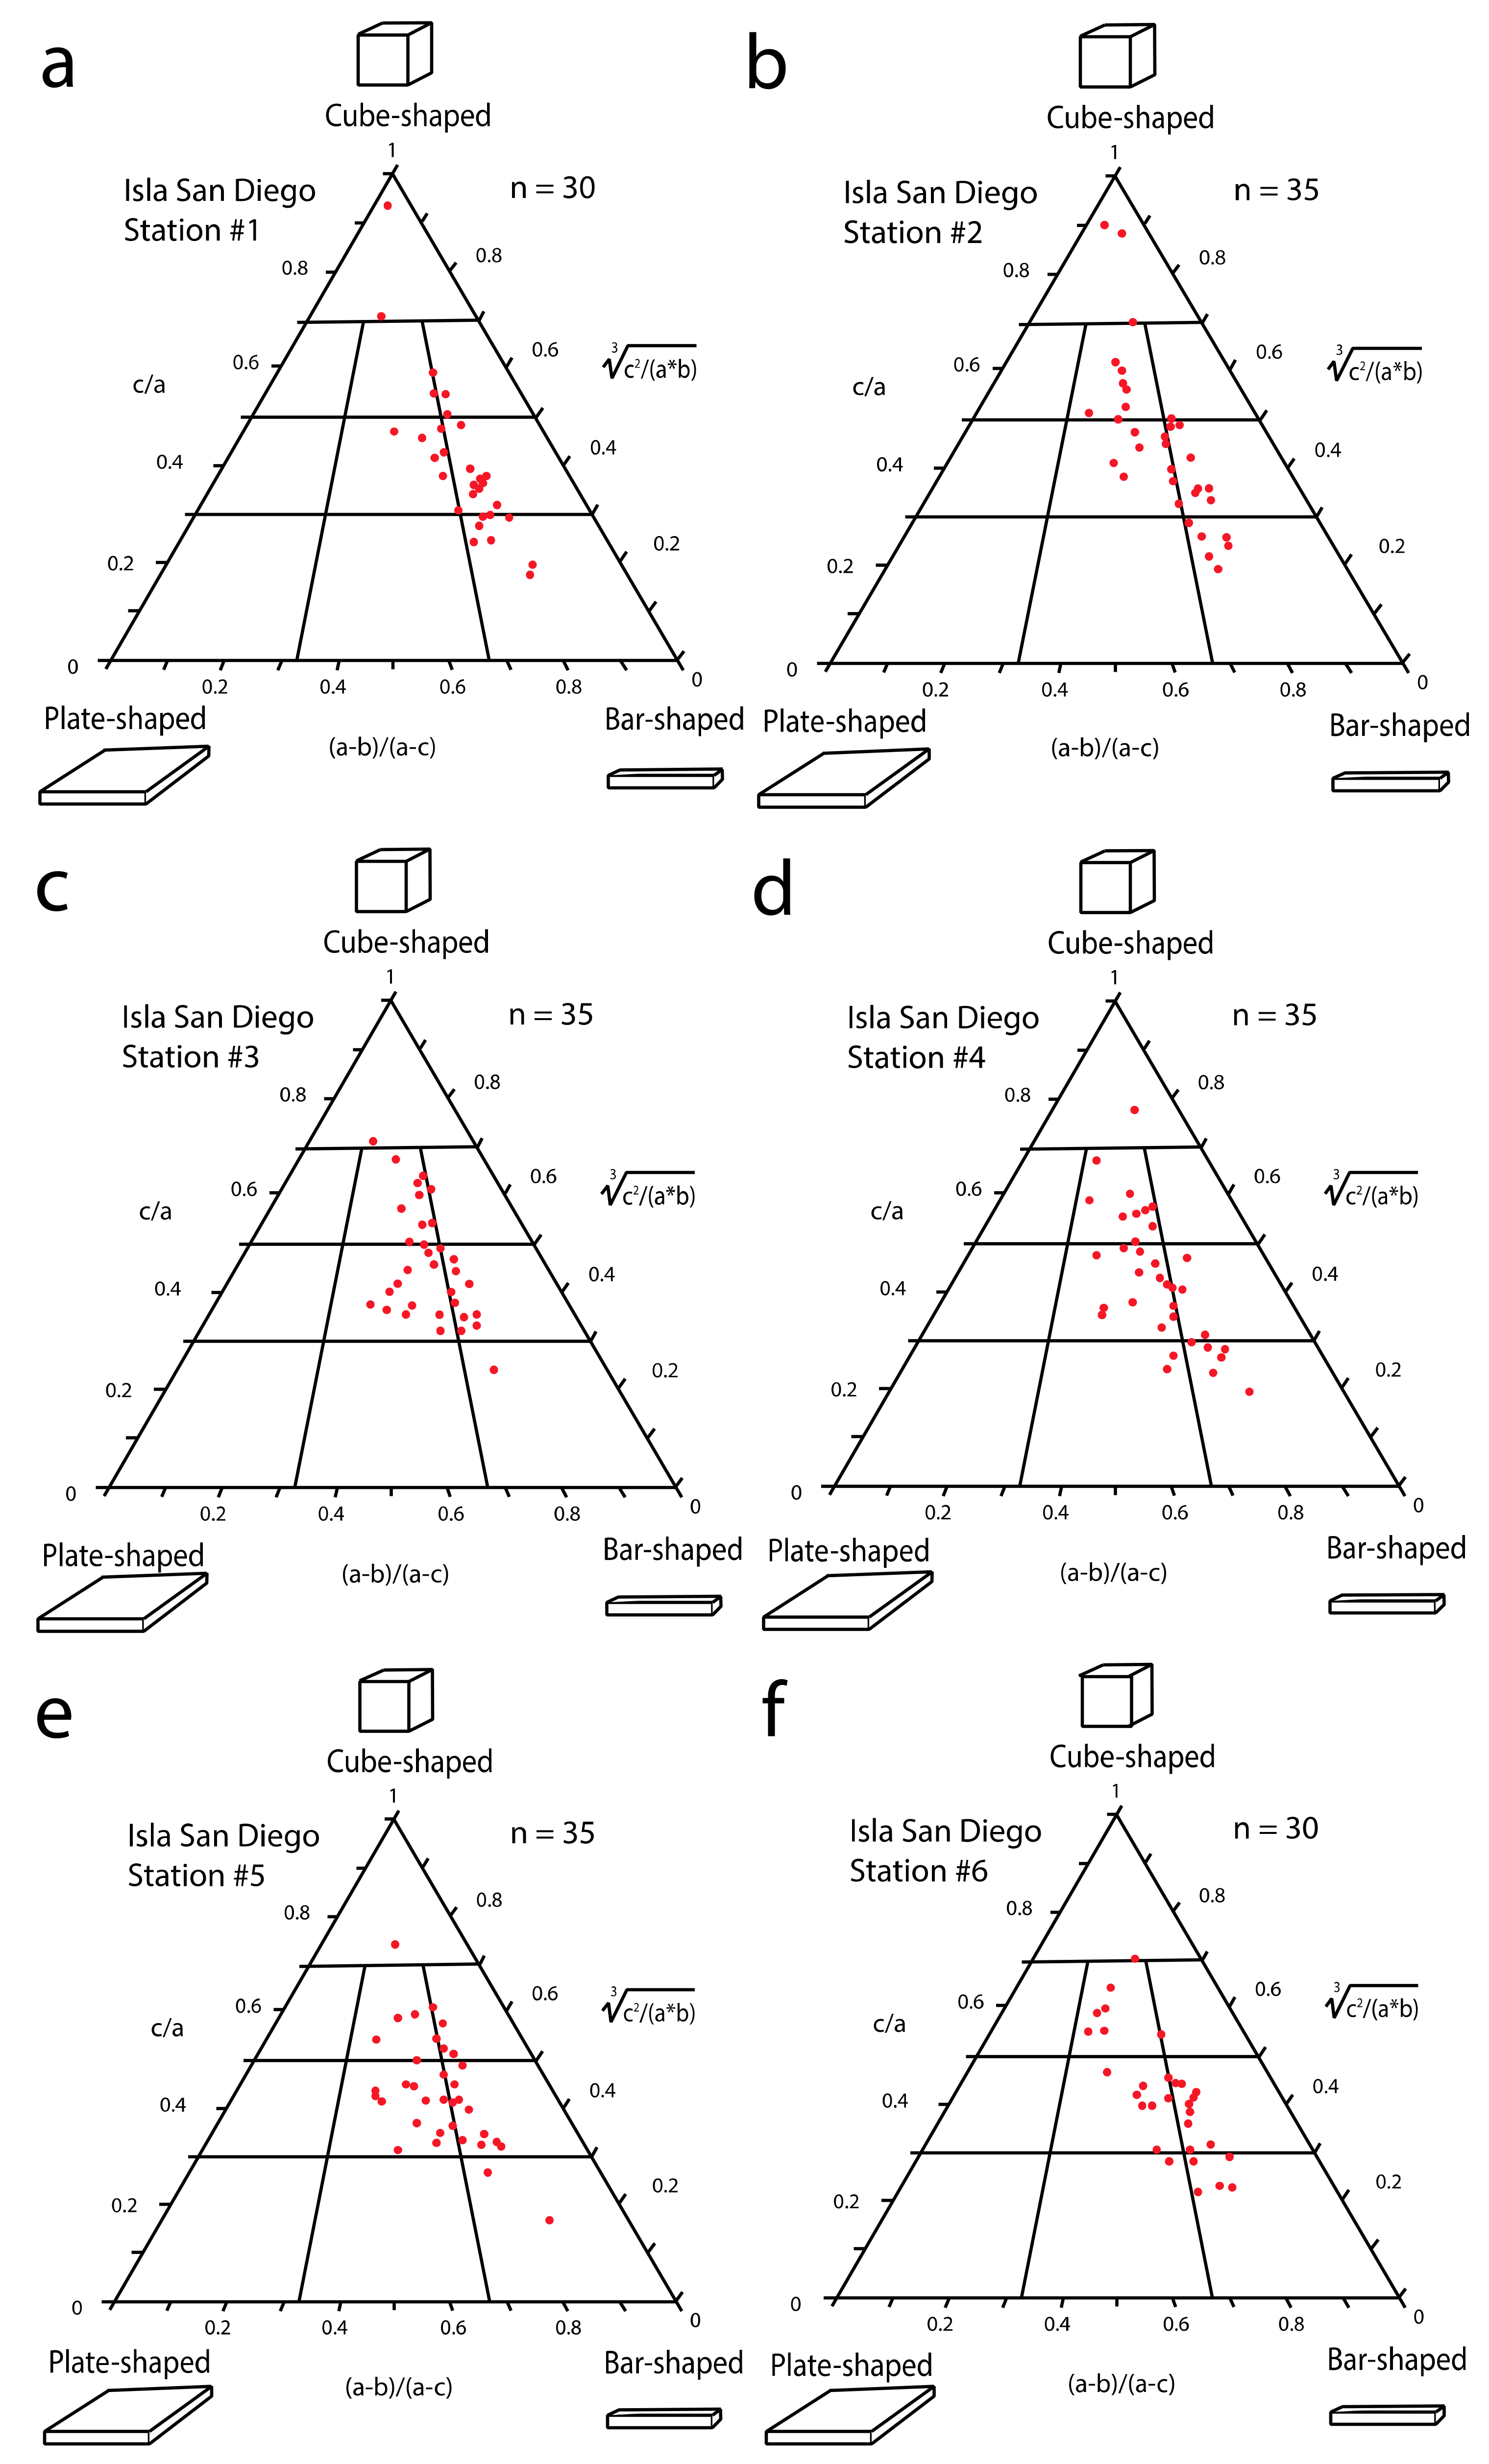
4.2. Comparative Variation in Clast Shapes

Raw data on clast size in three dimensions collected from each of the six sampling stations are recorded in Appendix A (Table A1, Table A2, Table A3, Table A4, Table A5 and Table A6). With regard to shape, points representing individual cobbles and boulders were fitted to a set of Sneed–Folk triangular diagrams (Figure 4a–f). The slope of points is in general agreement among the six plots, following a uniformly diagonal trend from the middle of the second tier to the lower right-hand rhomboid. Erosional wear on a perfect cube at all four corners results in a clast with equal values in three dimensions that will plot at the apex of the small triangle in the topmost tier. Variations that reflect slightly smaller values for the intermediate and short axis will shift the location more toward the center of that space. Only one or two clasts fall into this field, which indicates that vertical joints and horizontal fractures in the parent granodiorite are not evenly spaced in an orderly three-dimensional grid. Any point that falls into the center of the rhomboid on the right-hand end of the lower tier represents an individual clast with a long axis twice the length of the intermediate axis perpendicular to it, which, in turn, measures five times the length of the short axis perpendicular to the other two. The form of such a clast is initially bar-shaped but becomes more spindle-shaped as the sharp edges at the corners are worn away by abrasion.
The greatest number of points from each of the six samples falls within the third tier from the top but on opposite sides of the line separating the right side of the diagram from the center. A particular clast with dimensions in which the intermediate and short axis are close in value, but roughly half that of the long axis will fall squarely onto the midline between the two rhomboids at the center of the diagram. As the third dimension (shortest axis) decreases in length, the point will shift in position across the line to the right and lower downward in position. Overall, the comparative results of shape analysis indicate that most of the cobbles and boulders in the Pleistocene conglomerate are elongated in shape but as relatively fat spindles with an ellipsoidal outline. It is important to distinguish overall size from shape. That is to say, a smaller cobble with the same ratio of measurements between long, intermediate, and short axes will plot exactly the same as a larger boulder with the same ratios. Although clasts were chosen at random, a reasonably large population of clasts within a limited search radius at any one station assures that the sample is representative. In this case, the absence of more perfectly spherical clasts, and the dominant trend toward thickened spindles is evident.

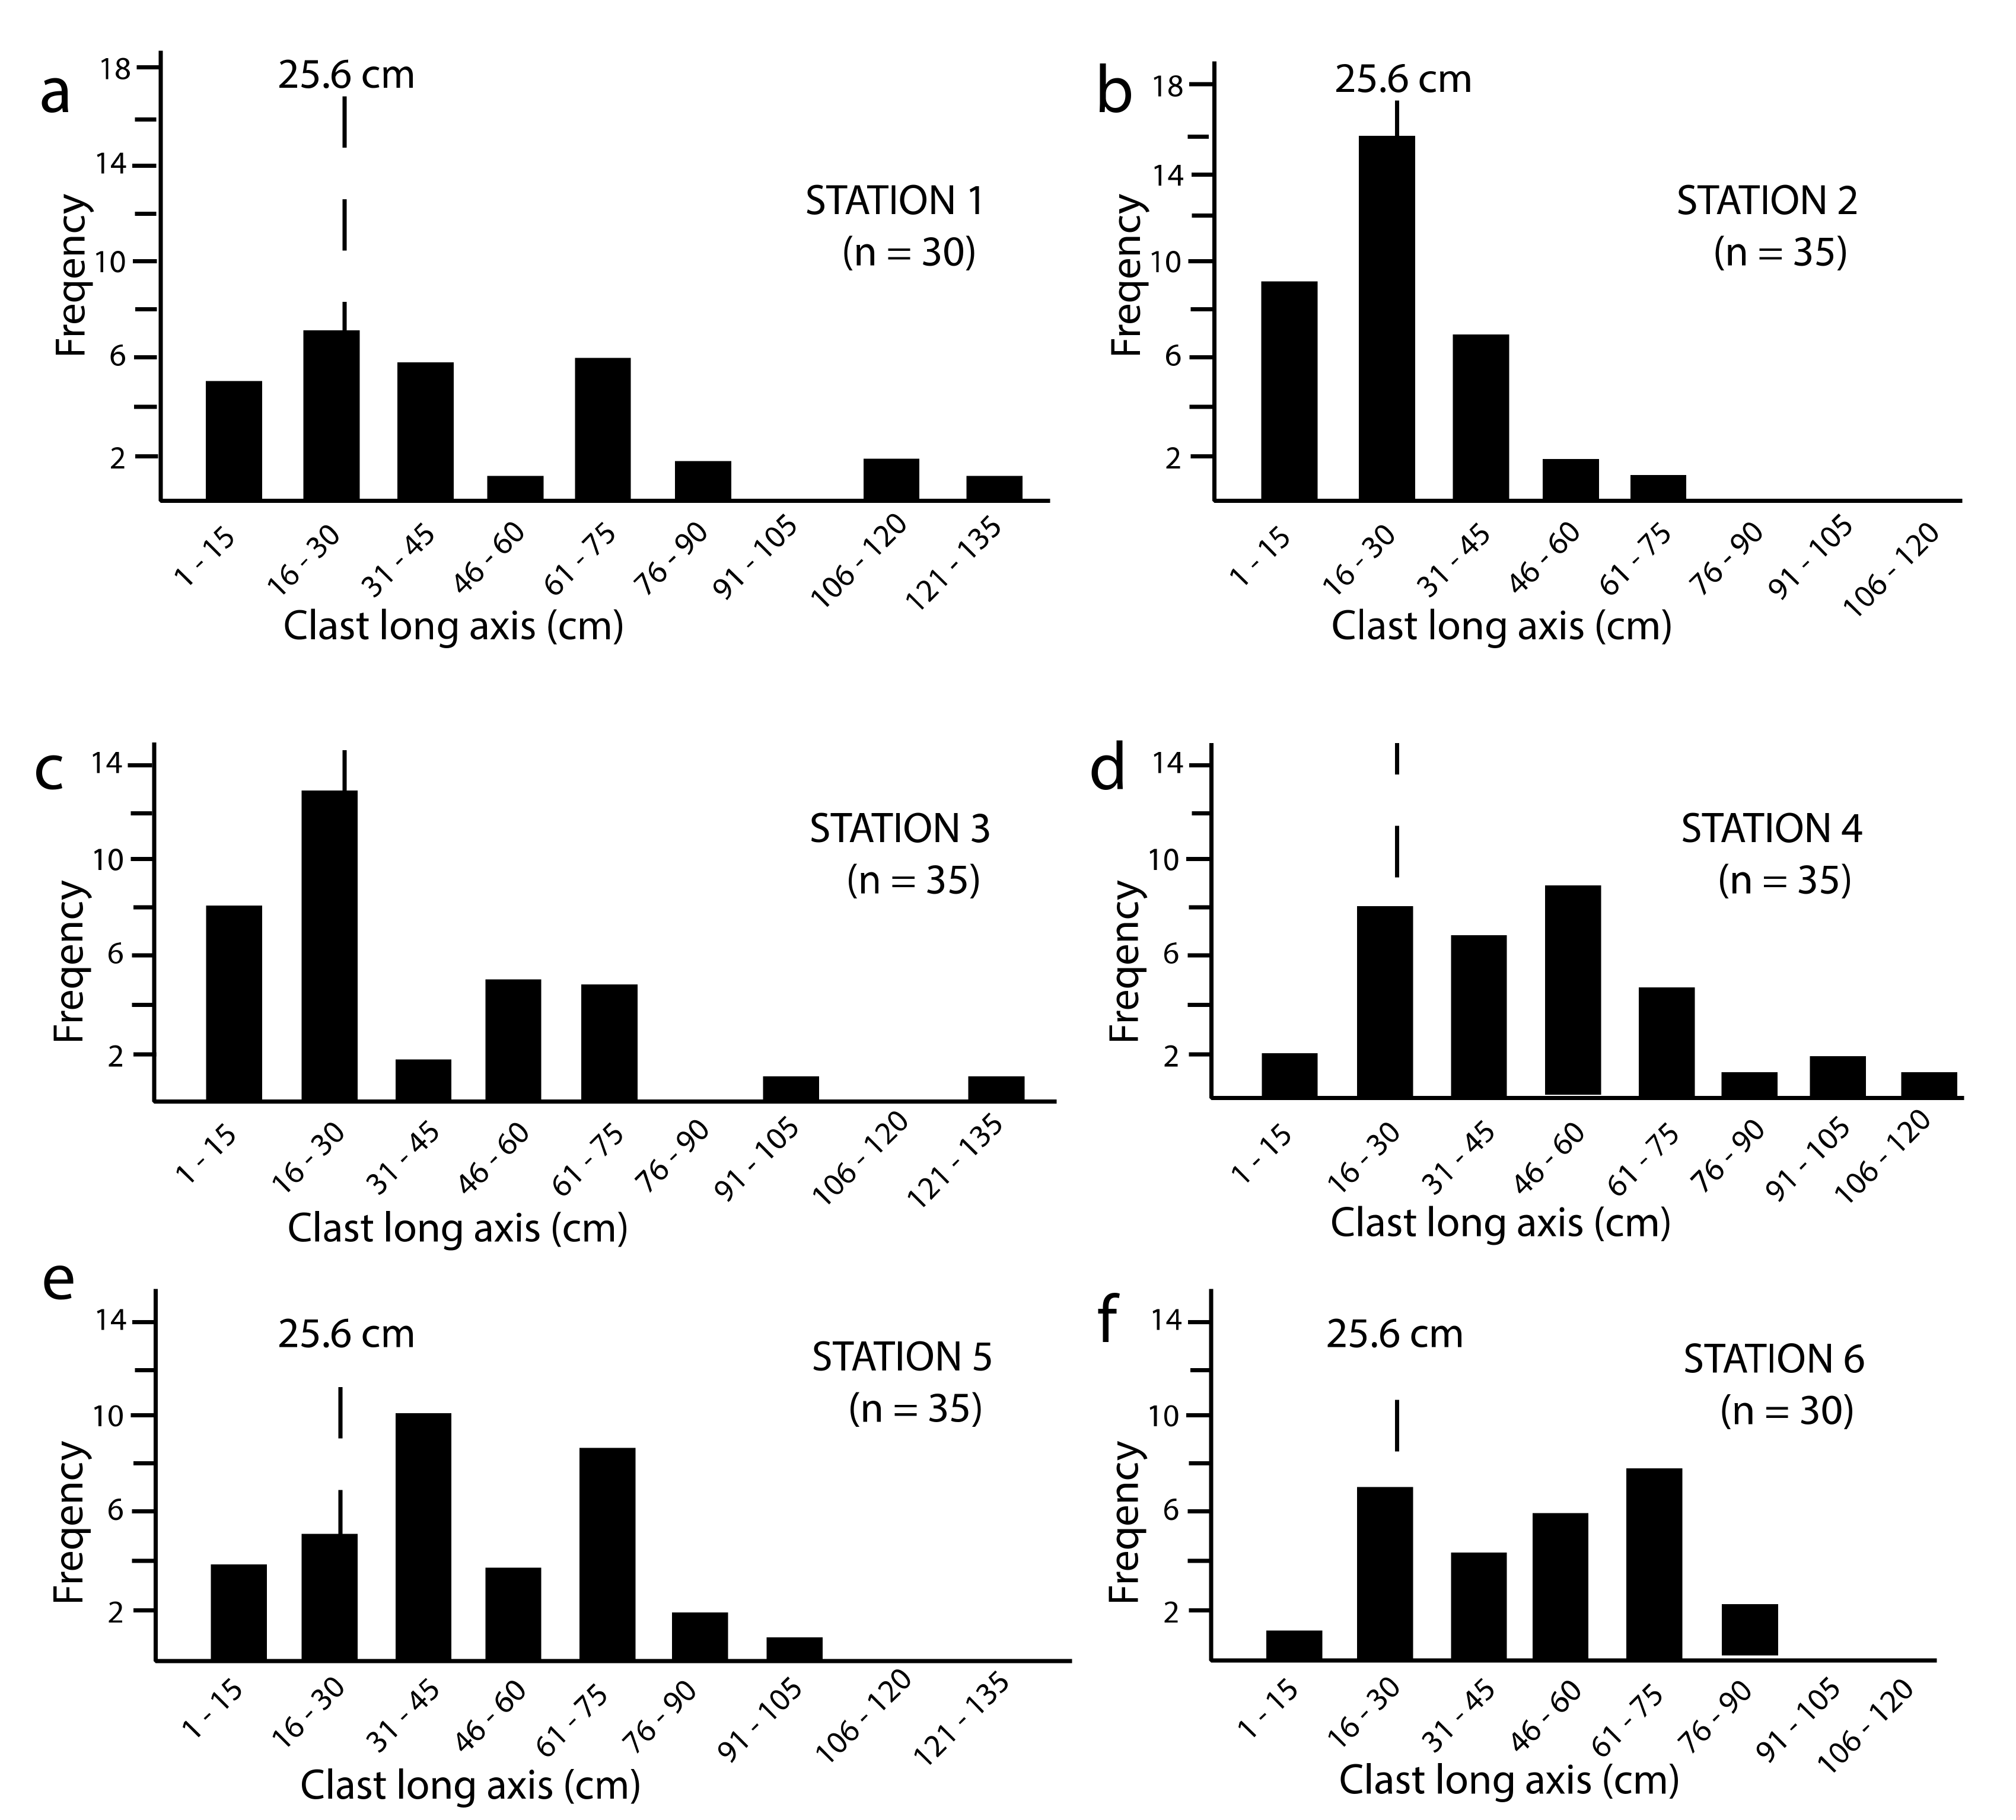
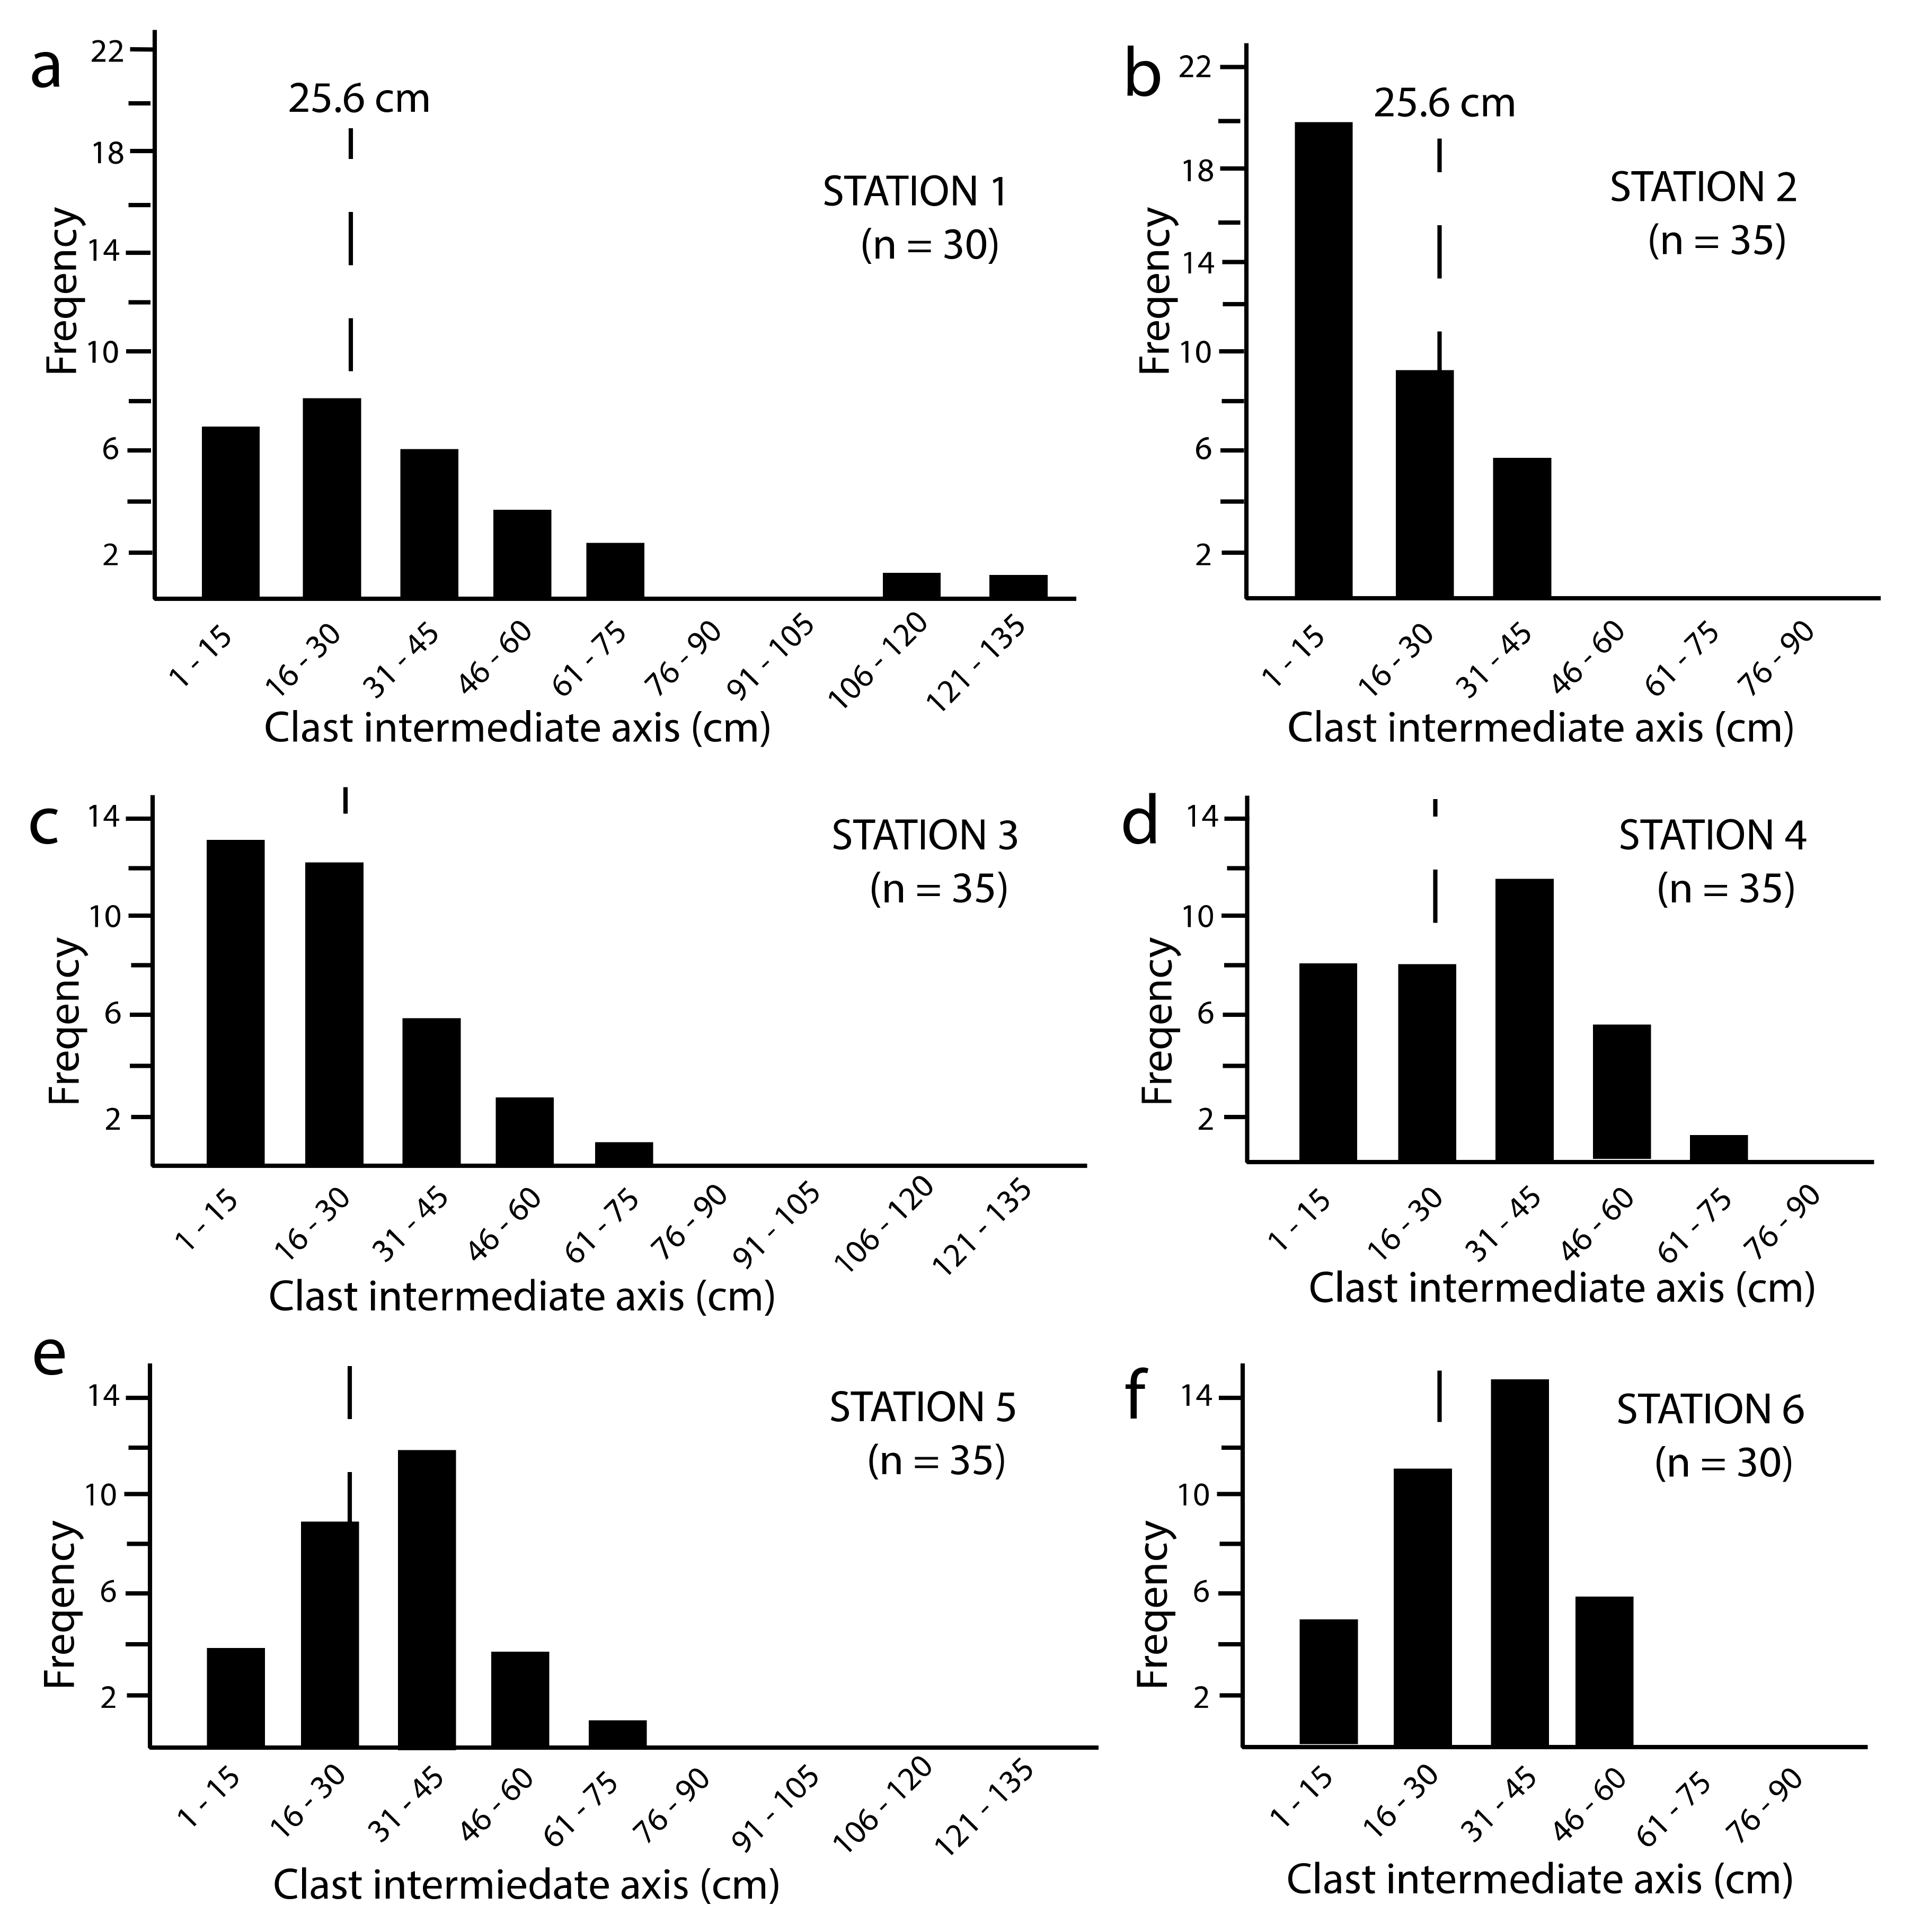
4.3. Comparative Variation in Clast Sizes

Drawn from original data (Table A1, Table A2, Table A3, Table A4, Table A5 and Table A6), clast size is treated separately to best effect on bar graphs as a function of frequency against maximum and intermediate lengths of the two longest axes perpendicular to one another. The first set of six graphs so plotted (Figure 5a–f) exhibit trends in the maximum dimension for clast length sorted by intervals of 15 cm in which the boundary between cobbles and boulders is marked within the range for clasts between 16 and 30 cm in diameter. The pattern is compared with another six graphs (Figure 6a–f) based on measurements for the length of the intermediate axis in the same 200 clasts.
Based on four of the six graphs (Figure 5a,d–f) representing maximum axial length, it is shown that boulders outnumber the smaller cobbles at rations between 3:1 and 3:2. The opposite is indicated by two of the graphs (Figure 5b,c) in which the smaller cobbles outnumber the larger boulders at ratios 2:1 or less. Based on two of the six graphs (Figure 6b,c) representing the intermediate axial length for the same 200 clasts, it may be argued that cobbles outnumber the larger boulders in only two of the graphs (Figure 6b,c), whereas cobbles are slightly outnumbered by boulders in two graphs (Figure 6a,d) and occur at parity in two others (Figure 6a,f). Overall, comparative data between maximum length and intermediate axial length confirm the results on clast shape (Figure 4), showing the dominance of ellipsoidal boulder shapes.

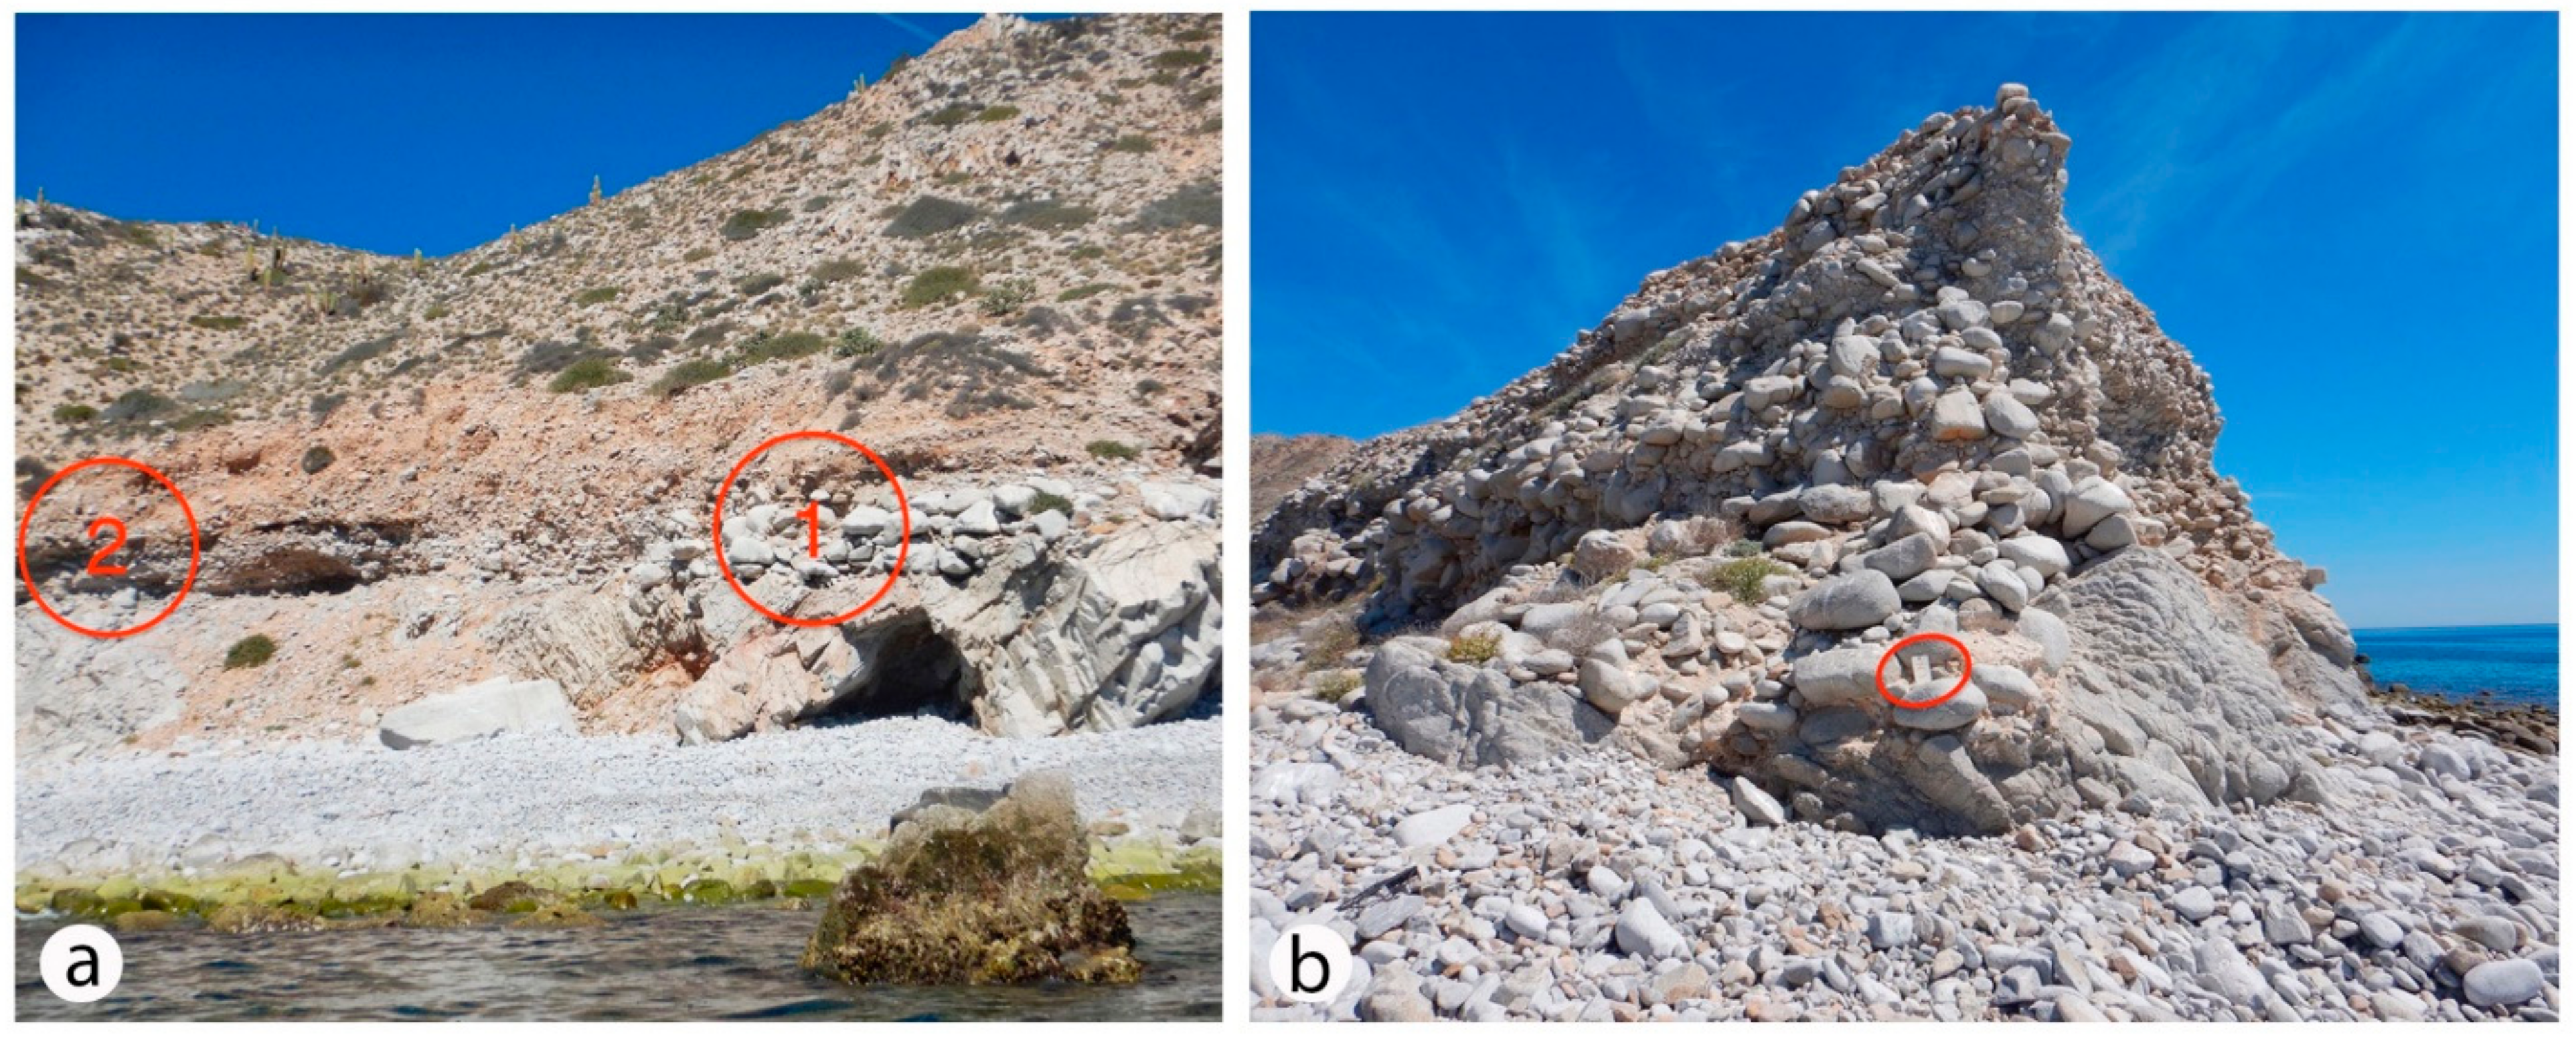
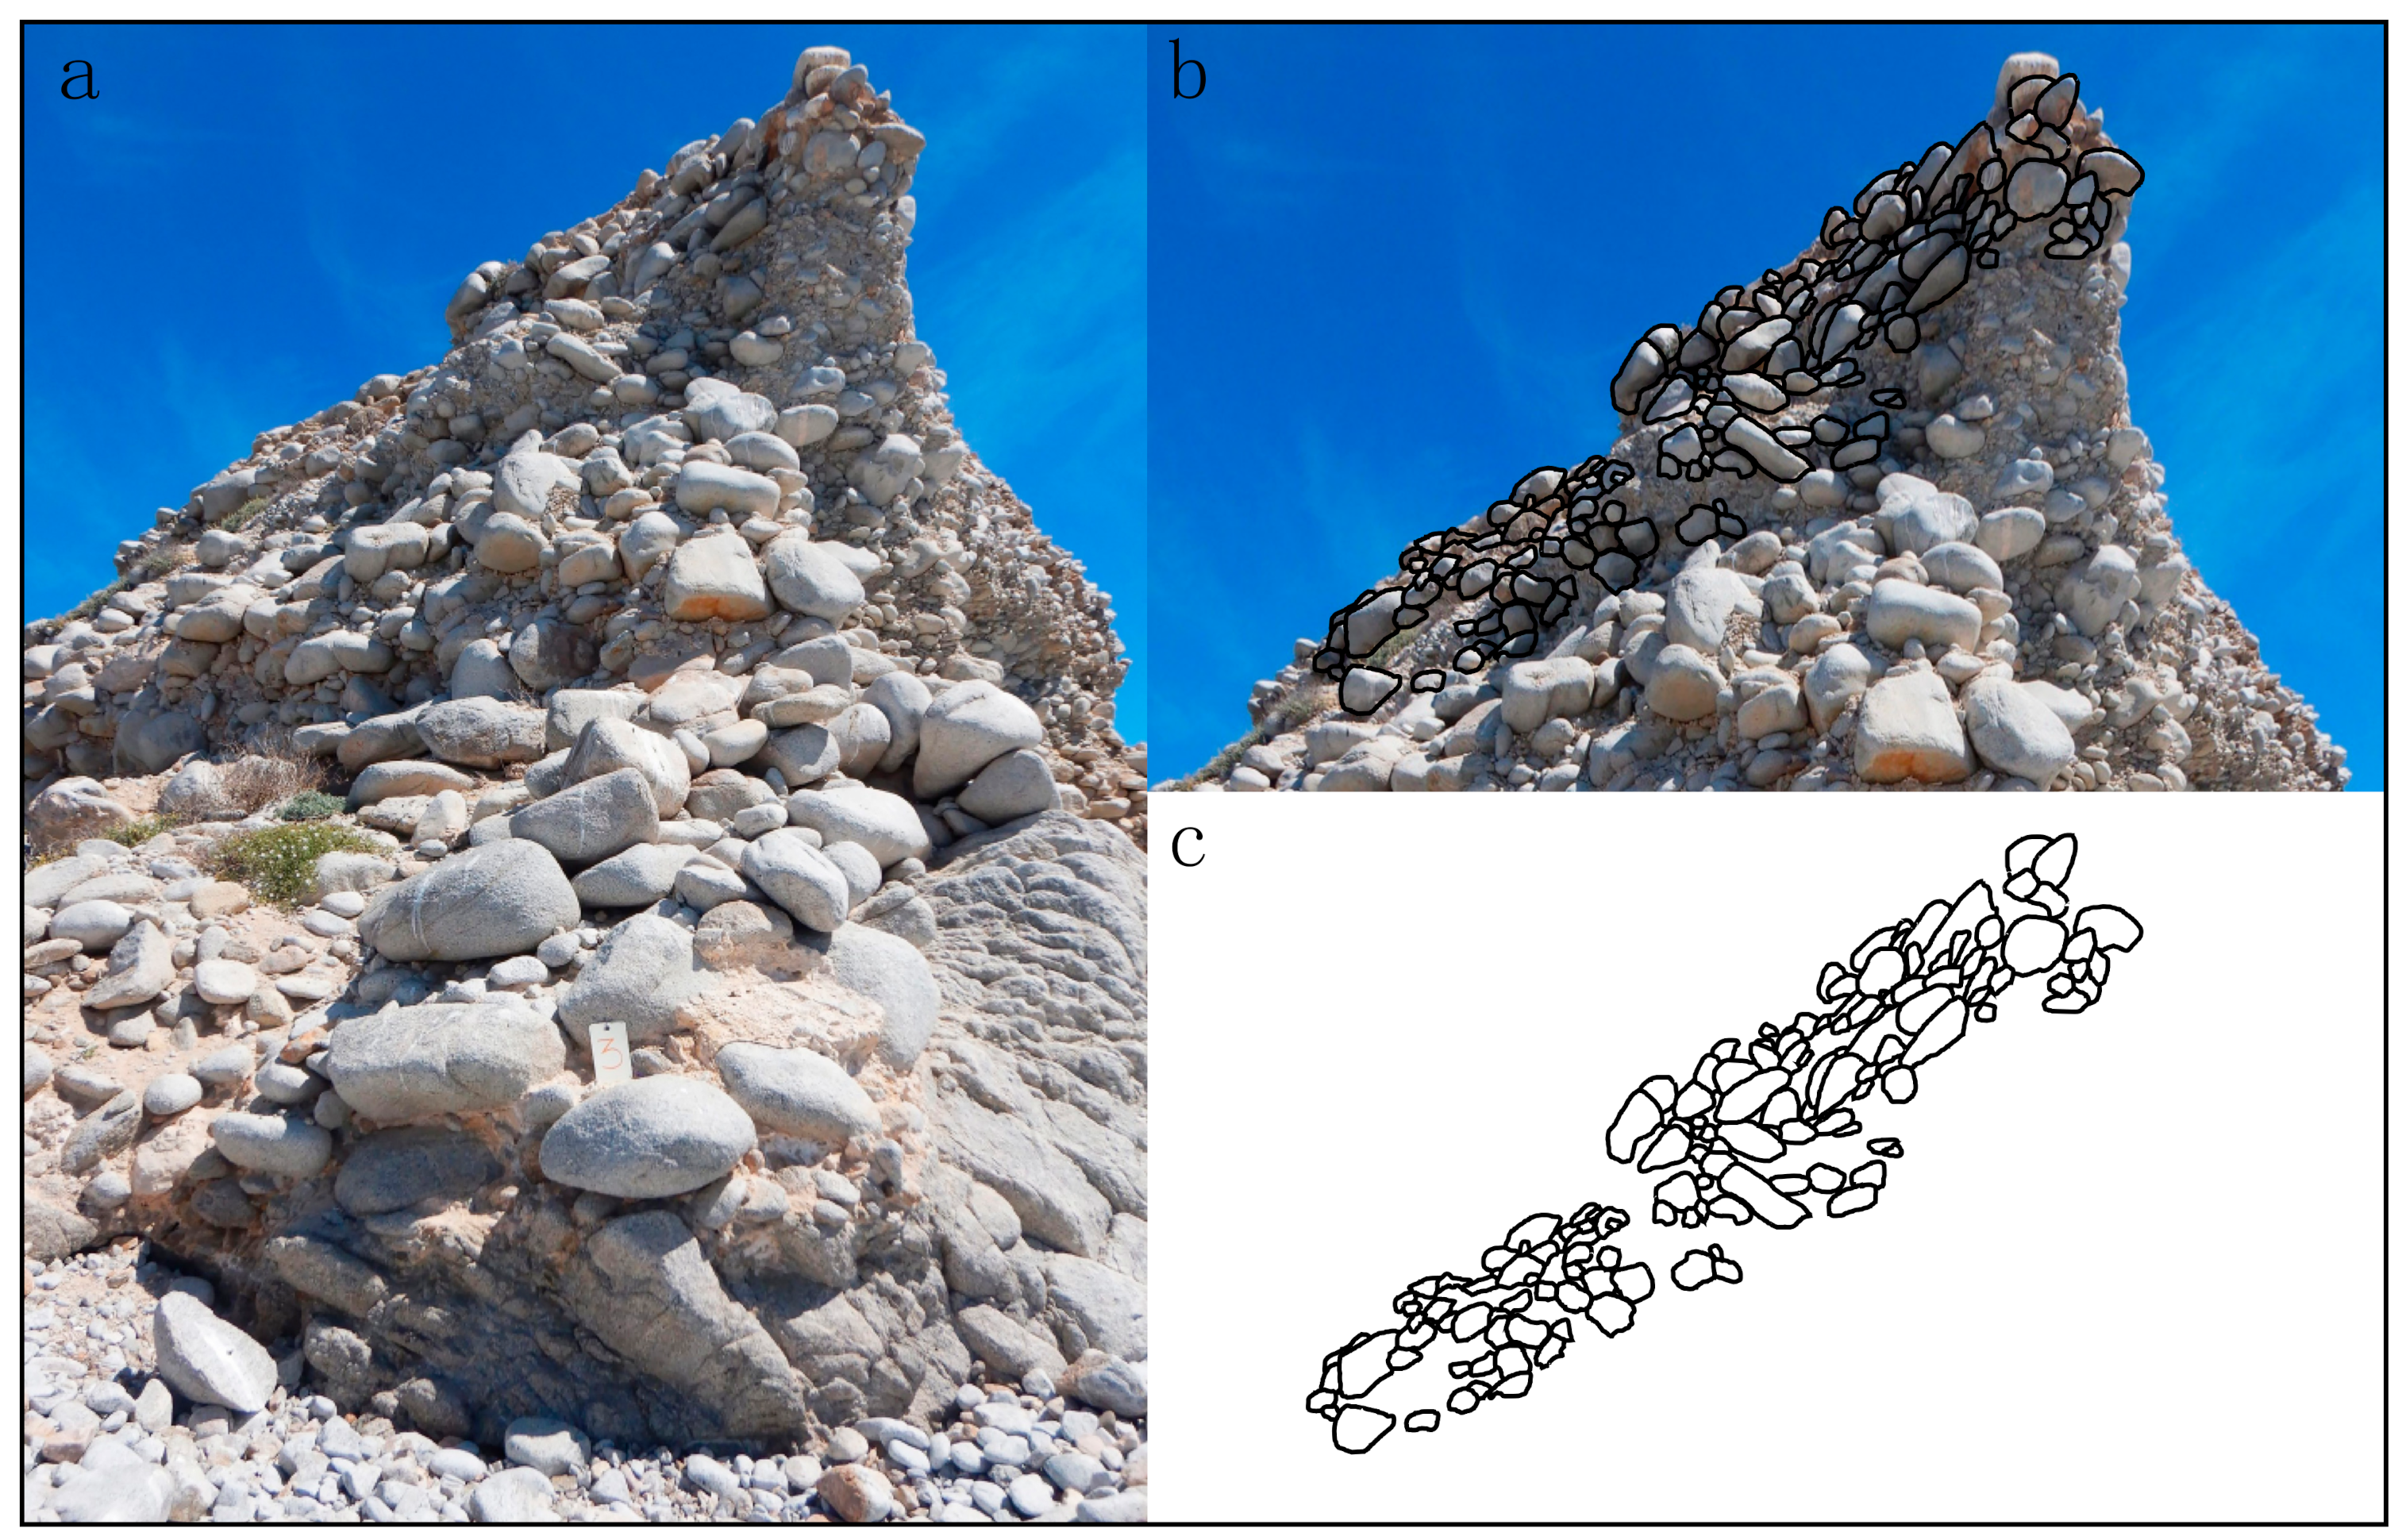
4.4. Clast Imbrication

Clast orientation or imbrication within the boulder deposit on Isla San Diego varies according to outcrop exposure, as observed on two vertical planes that intersect perpendicular to one another. One is parallel to the island’s long axis along the eastern shore (Figure 2b and Figure 3a). The other crosses through the island’s southern tip (Figure 3b). Both show direct contact of eroded boulders with underlying granodiorite basement rocks where the conglomerate attains a maximum elevation of 8 m above sea level. The unconformity surface traced parallel to the island’s axis is flat lying with a slight gain in elevation rising to the northeast. In this view (Figure 2b), a change in clast size from boulders to large cobbles begins above a reactivation surface that follows a minor indentation in the cliffs obscured by shadows. Shape analyses indicate that a preponderance of clasts from the basal part of the deposit are ellipsoidal or roughly fusiform in shape (Figure 4), but a small amount of imbrication is detected only below the reactivation surface (Figure 2b). The unconformity surface exposed in the plane crossing the tip of the island (Figure 3b) is more irregular with a dip or swale in the center, but crude layering in the overlying boulder deposit is increasingly inclined with distance above the unconformity. Based on photographic evidence supplemental to Figure 3b, evidence for imbrication is detected in the upper part of the deposit (Figure 7), where this is shown by transfer of outline tracings (Figure 7a,b) and isolated for clearer viewing (Figure 7c). Due to the partial collapse of clasts at the island’s tip, relationships among those in the basal part of the deposit are less clear. However, the orientation of clasts from the upper part of the deposit (Figure 7c) reveals a pattern of imbrication from northeast to southwest.

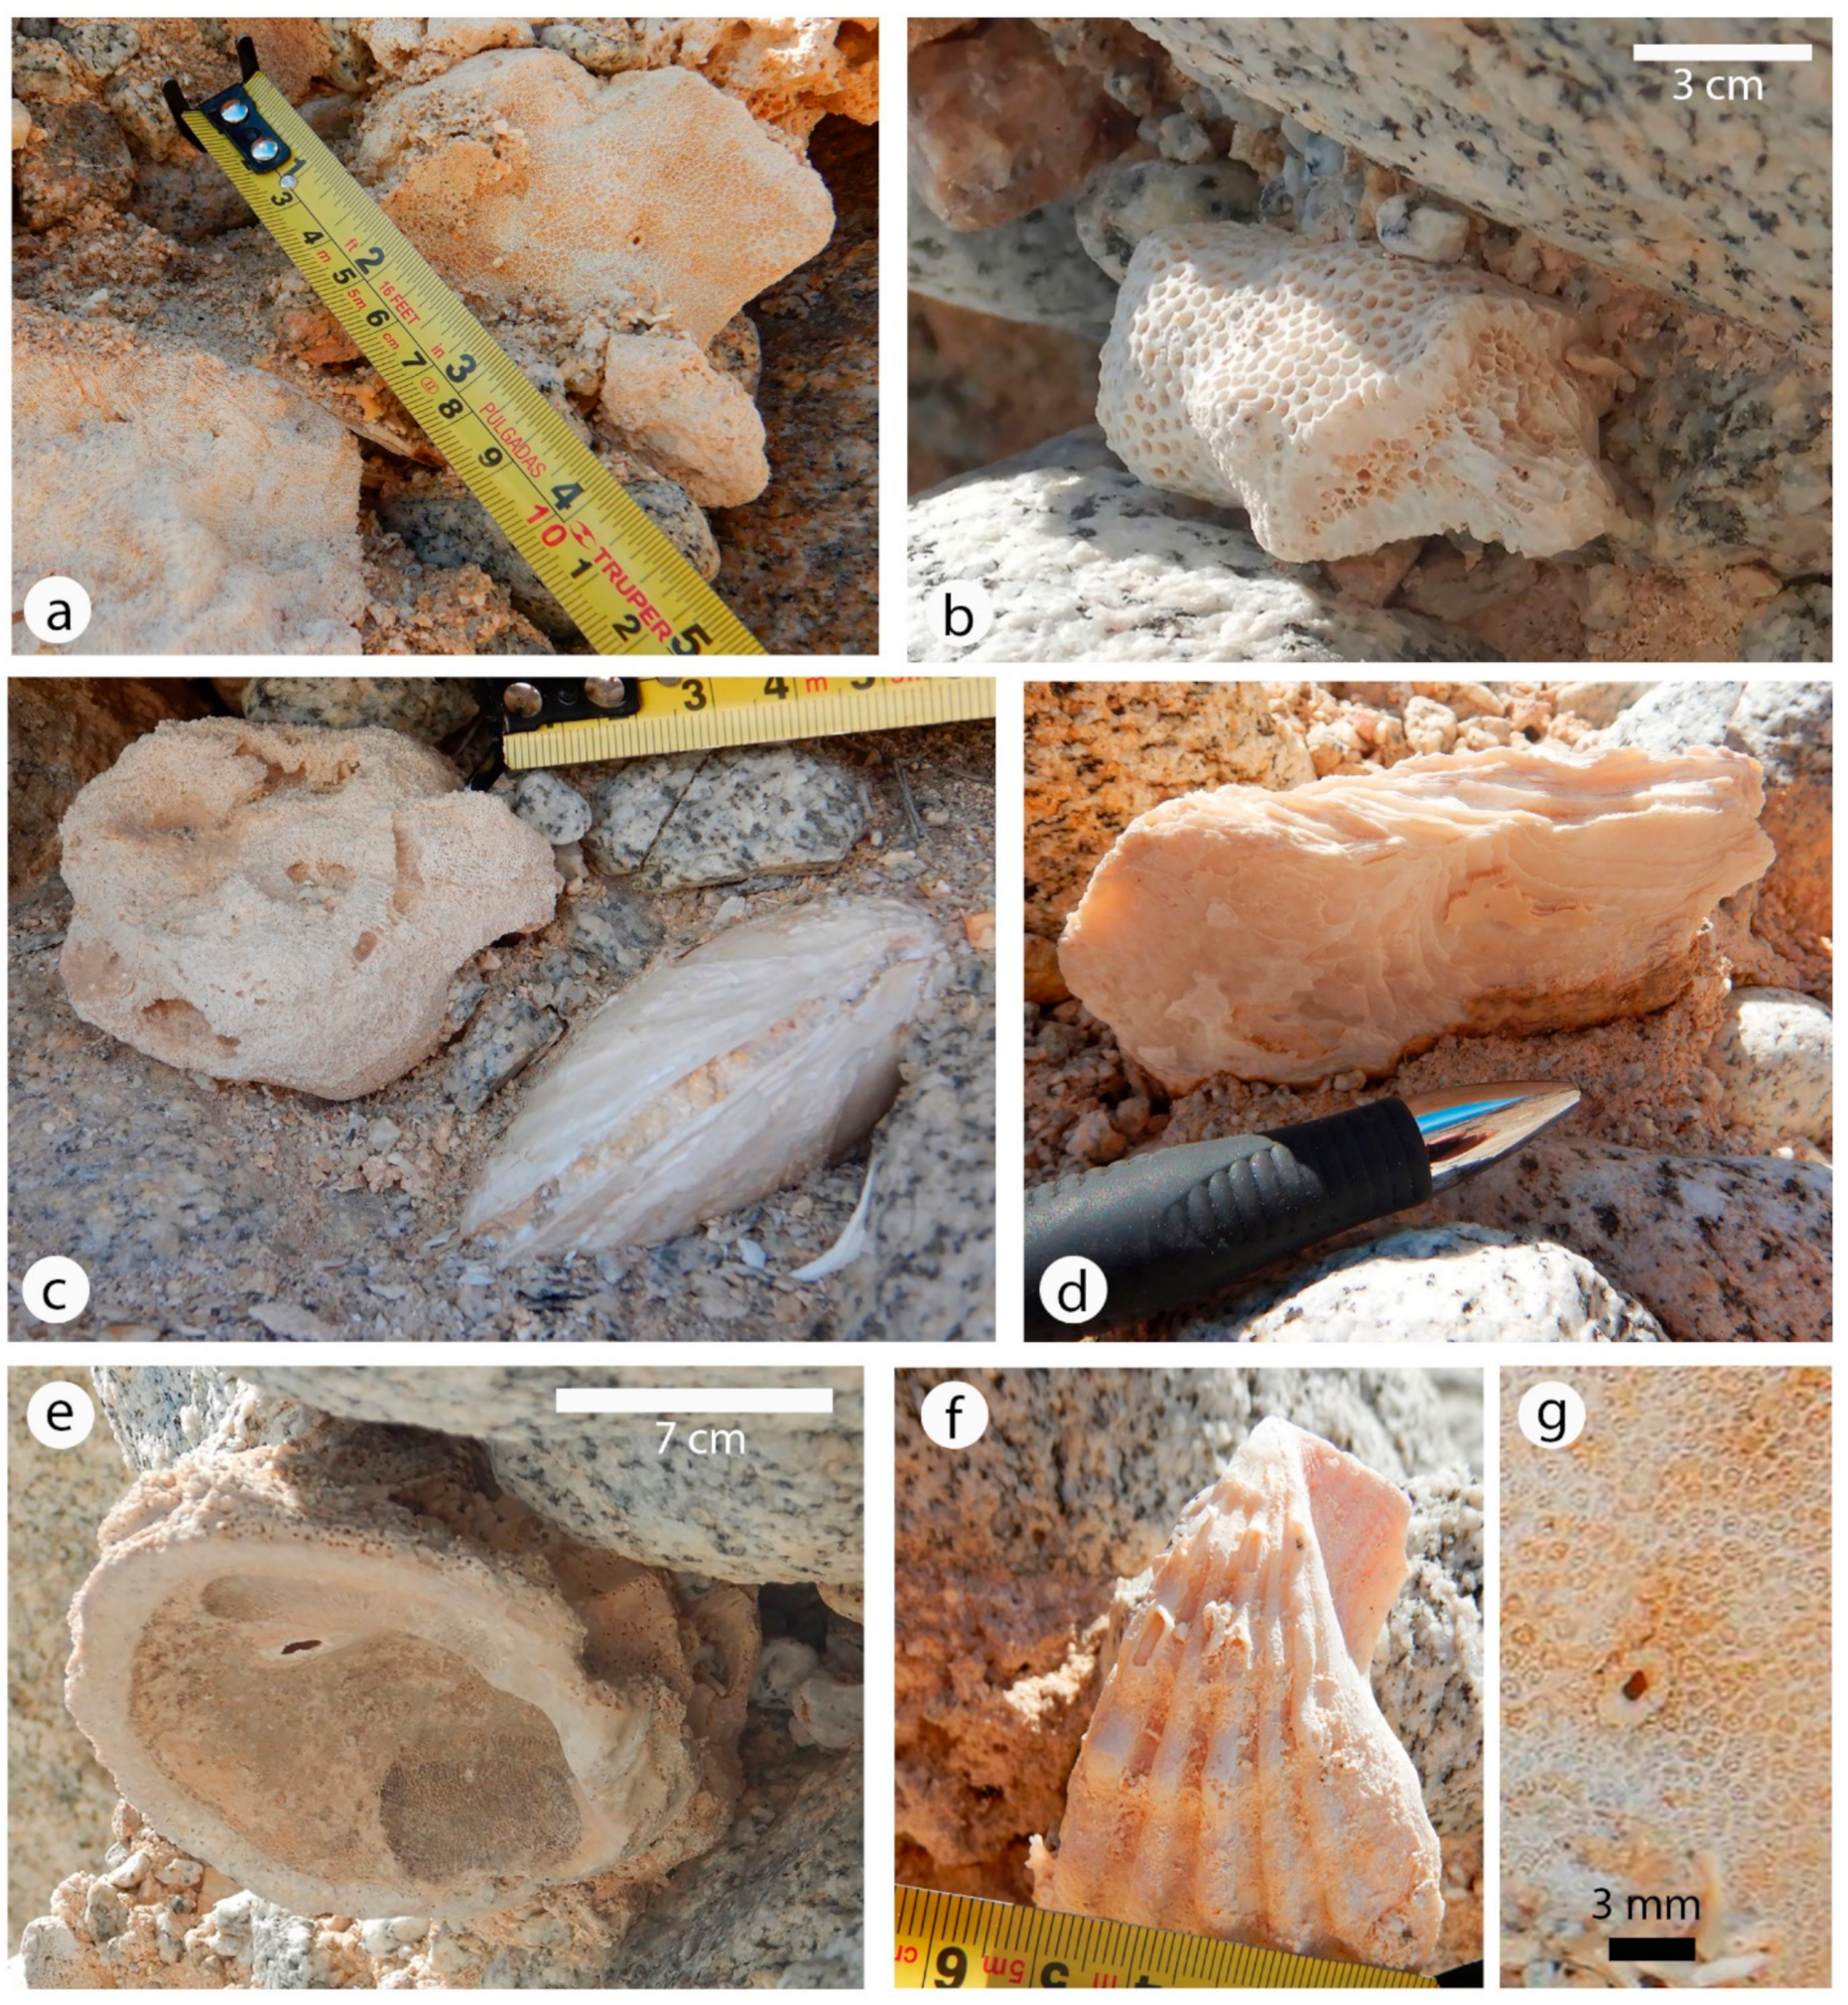
4.5. Fossil Fauna with Inferences on Age and Water Depth

A mixed fauna of three fossil corals, four bivalves, a single gastropod, and a coral-boring barnacle is preserved among the granodiorite cobbles and boulders on Isla San Diego (Table 1). None of the fossils occur as encrustations attached to individual cobbles or boulders. With possible exceptions among certain bivalves, they qualify as organic clasts that became secondarily incorporated within the conglomerate.
Representative fossils are illustrated by field photos (Figure 8). Two kinds of corals are illustrated: Porites panamensis (Figure 8a) and Pocillopora elegans (Figure 8b), respectively. Articulated bivalves are rarely found as fossils within the boulder beds, with the exception of Codakia distinguenda (Figure 8c), which may have grown in place in cavities among boulders after their deposition. Very thick but heavily eroded shell fragments belonging to a species of oyster (Figure 8d) indicate that shell fragmentation normally occurred prior to burial in the conglomerate. The large and heavily calcified shell of Spondylus calcifer (Figure 8e) is preserved intact but disarticulated. The large pecten Lyropecten subnodosus (Figure 8f) is likewise disarticulated and also broken. The only trace found of fossil gastropods is the distinctive operculum belonging to Turbo fluctuosus. Of ecological note, one of the Porites fossils observed in the boulder deposit at Station 4 (Figure 7a) is host to the boring barnacle Hesareusia durhami (Figure 8g). The same relationship between coral host and barnacle is known from the Pleistocene reef complex preserved intact on Isla Cerralvo [23].
Fossil mollusks from the Gulf of California occupy a wide range of geological ages through the Pliocene and Pleistocene, but the corals are more nuanced. In a detailed survey of localities throughout Baja California and associated gulf islands [24], 35 out of 47 collection sites include the species Porities panamensis, most of which are dated as Late Pleistocene in age. Pocillopira elegans is reported previously from only a single locality, dated as Late Pleistocene [24]. A definitive age determination requires radiometric testing for lead isotopes not within the scope of this paper. Uncertain assignments of P. panamensis to a mid-Pleistocene age and older Pliocene times are limited to marine terraces or other inland localities well elevated by tectonic uplift above present-day sea level. The absence of marine terraces on Isla San Diego supports a Late Pleistocene age for the fossil fauna. Alone, the fossil corals denote shallow-water conditions, but the related fossil mollusks add additional support of an intertidal to the shallow subtidal origin of the mixed fauna that lived nearby.
Global sea level during the last Pleistocene interglacial period (Marine Isotope Substage 5e) was at its highest, calculated to have stood between 4 m and 6 m higher than today on the basis of changes in oxygen isotopes of planktonic foraminifera and other criteria [25,26]. In that case, the granodiorite rocks at the south end of Isla San Diego presently exposed above sea level would have been submerged and development of the overlying boulder deposit would have occurred in very shallow water, where an infusion of a thin limestone binding matrix insured stabilization.

4.6. Storm Intensity as Function of Estimated Wave Height

Clast sizes and maximum boulder volumes drawn from the six sample stations are summarized in Table 2, allowing for direct comparison of average values for all clasts, as well as values for the largest clasts in each sample based on Equations (1) and (2) derived from the work of Nott [20] and Pepe et al. [22].
The Nott formula [20], provided in Equation (1), yields an average wave height of 3.1 m for the extraction of joint-bound blocks from granodiorite sea cliffs exposed at Isla San Diego, as tabulated for sample stations 1 to 6. A much larger value for a wave height of 8.0 m is calculated from the average of the largest single blocks of granodiorite recorded from the six stations based on the application of the same equation. The more sensitive to clast length from the short axis, the more sophisticated Equation (2) applied by Pepe et al. [22] yields values that are slightly lower for the estimated average wave height with a difference of 30 cm. On the other hand, the application of Equation (2) yields a higher value by a half meter for the average of the largest boulders, compared to that of Equation (1). Notably, the value for the maximum wave height for the six largest boulders based on Equation (1) is 2.5 times higher than the computed average for all 200 clasts. The difference is nearly 3.0 times greater comparing the maximum wave height for the same six boulders with the computed average for all 200 clasts based on Equation (2). Clearly, the pressure of extreme wave impact against the shore is necessary to loosen and dislodge the largest joint-bound blocks of granodiorite preserved in the Pleistocene cliff line on Isla San Diego, as characterized by the enormous block at Station 1 estimated to weigh nearly two metric tons (Table 1, Table A1)

4.7. Holocene Ridge Offshore Isla San Diego

A distinct feature in the geomorphology of Isla San Diego is the pointed beach at the island’s southwestern tip that extends offshore along an underwater ridge (Figure 9). Aerial photos reveal shallow, aquamarine waters above the ridge, indicating its extension for a distance of 1.4 km on a compass heading of 224 degrees (S 55° W). Exploration by kayak over the first 250 m offshore confirms that the ridge is formed by loose cobbles and large boulders. Observed at different times under different sea conditions, it is notable that the smaller clasts shift in location, whereas the large boulders remain fixed on the ridge. How far and to what depth the boulder train extends before changing to gravel and sand toward the distal end is unknown.

5. Discussion

5.1. Inclined Boulder Beds and Imbrication Pattern as Mitigating Factors

Conglomerate beds at the southern terminus of Isla San Diego (Figure 3b) suggest crude layering with a 30° dip to the northwest. The contact with underlying granodiorite makes it difficult to know for certain if the entire island has been tilted due to tectonics or if the fracture pattern in the granodiorite conforms to a pattern with horizontal fractures at right angles to vertical joints, as implied by the small sea caves or grottos eroded under present-day conditions along the island’s eastern shore. The more complicated Equation (2) applied to storm deposits by Pepe et al. [22] requires input on the slope value of the granodiorite bench under attack by storm waves. Introduction of the 30° angle observed in the crude layering of the conglomerate generates negative wave height values. As shown in the original fieldwork by Peppe et al. [22], the inclination of platform rocks is very small (less than 2.5°) on which blocks are potentially subject to plucking by storm waves. In the case of previous work on andesite rocky shores from Isla San Luis Gonzaga in the Gulf of California [6] and basalt rocky shores from Gran Canaria in the Canary Islands [11], it is assumed that the angle of bed slope is only 1° at the pretransport location for joint bound blocks. Herein, the same assumption is made for the granodiorite on the eastern flank of Isla San Diego, which yields results from the application of Equation (2) based on Pepe et al. [22] that are similar to the wave heights obtained by application of Equation (1) following the work of Nott [20], as summarized in Table 1.
In this case, the 30° angle of repose observed in the upper part of the conglomerate is interpreted as the slope acquired by the superimposed deposit spilling over a rocky ridge in shallow water and not related to an earlier structural tilting of the island. The conglomerate layers may be interpreted as the result of overwash at the southern end of the island by storm waves. Today, the maximum elevation between Stations 2 and 6 on opposite shores is 8 m at the top of the conglomerate (Figure 1b). During the Late Pleistocene time (Marine Isotope Substage 5e), the bedrock spur at the island’s south end was easily vulnerable to impact by exceptionally large waves. Although limited in scope, the available evidence for clast imbrication within the Isla San Diego conglomerate is consistent with the arrival of wind-driven waves from the northeast or east related to the shifting northward passage of a hurricane. In further consideration of the tilted layering in its upper part, a geometric solution for the true thickness of the deposit perpendicular to the dip angle amounts to about 4 m with the reactivation surface located roughly in the middle. The implication of the reactivation surface is that a second phase took place in storm energy, or that a separate storm event occurred sometime after the passage of the first event.

5.2. Significance of the Fossil Fauna from Isla San Diego

A strong latitudinal bias is reported in a comprehensive survey of the stony corals now living in the Gulf of California with 38 species occurring in the southern (or lower) part of the gulf, out of which only 16 have an extended range into the northern (or upper) part of the gulf [27]. In contrast, only three stony corals are limited to the upper Gulf of California with no representatives in the lower gulf. The disparity in today’s geographic distribution is strongly related to the north–south temperature gradient. Pleistocene coral reefs are well preserved at several locations throughout the Gulf of California as far north as latitude 28° (Figure 1). The species Porites panamensis is ubiquitous in Upper Pleistocene coral reefs throughout the peninsular shores and gulf islands of Baja California Sur [24], and this coral species is the primary component. For example, P. panamensis is the principal component of Upper Pleistocene reefs on Isla Cerralvo [23], located 120 km farther to the southeast from Isla San Diego in the lower Gulf of California (Figure 1a). The north–south distance between the two islands is a full degree of latitude. In addition to P. panamensis (Figure 7a), the occurrence of Pocillopora elegans (Figure 7b), together with Pavona gigantea (Figure 7c), suggests all three were part of a former reef community that no longer persists around the island.

5.3. Maine Circulation and Recent Hurricanes in the Region of Isla San Diego

On an annual basis from November to May, strong winds capable of generating large-scale wave trains travel from north to south over the entire length of the Gulf of California, but lighter winds typically blow in the opposite direction under the influence of a semi-monsoonal pattern of atmospheric circulation during the spring and summer times [28]. Winds out of the north set up long-shore currents that may be responsible for delivering granodiorite gravel and perhaps even some cobbles from the flanks of Isla San Diego to the linked underwater ridge. In contrast, the lighter southerly winds probably are cable of shifting only pebbles.
The threat of hurricanes affecting the lower Gulf of California is reviewed in prior studies on storm deposits at Ensenada Almeja north of Loreto [4], Arroyo Blanco on Isla del Carmen west of Loreto [3] Puerto Escondido south of Loreto [5], and especially on Isla Cerralvo east of La Paz [23] (see Figure 1a for geographic relationships). Between September 1996 and September 2019, six named hurricanes (Fausto, Marty, Ignacio, John, Odile, and Lorena) entered the Gulf of California after originating farther south off the mainland coast of Mexico around Acapulco (Figure 1a). Storm rotation is counter-clockwise and as winds intensify during the northward passage, the greatest impact is expected to come from wind-driven waves pushing east to west out of the storm’s northeast quarter. Eye-witness accounts of coastal wave surge during hurricane events in the Gulf of California are not common, but the published account of the Holocene storm beds at Ensenada Almeja includes a video clip of the 9 m storm surge against the rocky shore on nearby Ensenada San Basilio during Hurricane Odile [4]. Storm waves pushed by winds streaming from east to west during the passage of the same event farther south at Isla San Diego can be expected to have caused a surge that topped over the low-lying southern end of the island.
The 2015 hurricane season was unusually active [29], and Hurricane Patricia was a Category 5 event with wind speeds of 346 km/h that took an unexpected easterly turn north of Acapulco to strike the village of Cuixmala below the opening to the Gulf of California (Figure 1a). It remains one of the largest storms recorded in the eastern Pacific basin and the strongest yet to strike western Mexico. With a diameter of 2400 km, the storm’s outer wind bands already swept across the tip of the Baja California Peninsula before the center veered eastward. Had the storm continued onward in its expected track to the northeast and gained strength from warmer waters in the Gulf of California, major damage from storm surge was certain to have occurred. Isla San Diego is one of those remote spots in the lower Gulf of California that would have experienced the full impact of wave shock against its east-facing shores and likely overwash of eroded materials across the bedrock at the island’s southern tip.
Research based on the tagging of larger boulders from the conglomerate on Isla San Diego and its related submarine ridge would be instrumental in documenting the role of future hurricanes as a source of ongoing erosion. As part of a potentially larger project, the same monitoring program could be undertaken for the Pleistocene and Holocene storm deposits at Isla del Carmen [3], Ensenada Almeja [4], Puerto Escondido [5], and Isla San Luis Gonzaga [6]. The relevance of such a program is underscored by the record-breaking early start to the eastern Pacific hurricane season with the formation of tropical storm Andres located 960 km south of the tip of the Baja California Peninsula on 9 May 2021 [30]. The head start of the hurricane season in this part of the world portends the consequences of increased global warming.

5.4. Comparison with Storm Deposits Elsewhere in the Gulf of California

Variations in density among rock types studied so far from Pleistocene and Holocene boulder beds around the Gulf of California range from 1.86 g/cm3 for limestone, 2.16 g/cm3 for the banded rhyolite, and as much as 2.55 g/cm3 for andesite based on different localities [3,4,5,6]. Estimates for the average wave height based on the average weight of sampled boulders taking rock density into account vary between 4.3 m to 5.7 m from locality to locality. However, when the largest boulders from each of four localities previously studied are taken into account, wave heights necessary for dislodgment from joint-bound basement rocks fall between 9.8 and more than 13 m. By comparison, the granodiorite samples from Isla San Diego register average wave heights rather smaller, between 2.9 and 3.1 m, based on the average of average estimates from six sample stations. However, the largest single granodiorite boulder measured on the island is estimated to weigh nearly two metric tons and to have required a wave height between 10.6 and 11.4 m to achieve dislodgement (Table 1). In this regard, the maximum wave shock that affected Isla San Diego during Pleistocene time is not out of the ordinary for the localities studied elsewhere in the Gulf of California. In terms of future hurricane events certain to strike the lower Gulf of California, an interesting prospect would be to tag some of the largest granodiorite boulders on the shallow ridge extending southwest of the island to see if movement occurs following the next major storm. Likewise, it could be interesting to tag some of the cobbles at the top of the crudely layered conglomerate beds currently at an elevation of 8 m to see if the next major storm creates waves capable of washing over that part of the island.

5.5. Comparison with Storm Deposits Elsewhere in the North Atlantic Ocean

Studies on boulder beds from the Pleistocene of Gran Canaria in the Canary Islands [11] and the Pleistocene and Holocene of Santa Maria Island in the Azores [10], as well as the Holocene of north Norway [12], follow the same format as those in Mexico’s the Gulf of California using the triangular plots after Sneed and Folk [16] to appraise boulder shape and the same equations after Nott [20] and Peppe et al. [22] to estimate wave heights. Basalt boulders from El Copnfital Beach on Gran Canaria register a rock density of 2.84 g/cm3, whereas those from Santa Maria Island in the Azores were treated as having an even higher rock density of 3.0 g/cm3. Holocene beach cobbles and boulders on Leka Island in the subarctic of Norway were assigned an even higher rock density of 3.32 g/cm3 associated with low-grade chromite ore [12]. All these rock densities from island localities in the North Atlantic Ocean surpass those for limestone, banded rhyolite, and andesite found at localities in the Gulf of California. Other things being equal in terms of volume, it requires a larger wave to extract a block of denser material such as basalt from a rocky shoreline than for material much less dense such as limestone. Based on the average weight and rock density of all basalt clasts measured from Gran Canaria, wave heights were 4.5 m, whereas based only on the largest boulders from each sample station, the maximum wave height was more than twice that value at 11 m. The results for basalt clasts from Santa Maria Island in the Azores were significantly less in both categories with an average weight from all sample stations, amounting to 2.6 m, whereas the maximum wave height based on the single largest boulder from each sample station amounted to 5.1 m. For storm deposits from Norway’s Leka Island, the average results for cobbles and boulders derived from chromite ore from three sample stations estimated wave heights between 3.6 and 4.3 m. However, the average wave heights based on the single largest boulders from those stations yielded values for wave heights between 5.1 and 6.7 m. A comparison with the North Atlantic data on this basis puts the results from Isla San Diego closest in the range of values obtained from the Canary Islands. Essentially, storms of hurricane strength reaching the Gulf of California are no less severe in terms of their erosional effect than those in the northeastern Atlantic Ocean.

6. Conclusions

Study of the cobble–boulder deposits from Isla San Diego in Mexico’s lower Gulf of California offers the following insights based on mathematical equations for estimation of Late Pleistocene wave heights from major storms in the same region:
  • Consolidated cobbles and boulders studied from six sample stations with Upper Pleistocene conglomerate exhibit evidence of high-energy erosion from granodiorite exposed along the rocky shoreline of Isla San Diego in Mexico’s lower Gulf of California. Evidence of clast imbrication indicates that a major storm had an impact with wave surge against the island’s eastern shore;
  • The average estimated volume at 66,536 cm3 and the average weight of individual granodiorite cobbles and boulders at 100 kg from a total of 200 samples suggest that wave heights of 3 m are responsible for their derivation from the adjacent and joint-bound body of parent rock. However, the largest igneous boulder from among all six sample sites is estimated to weigh two metric tons and may have been moved by a wave of extraordinary height around 10 m. Alternately, smaller waves may have gradually loosened this block from its parent body until the force of gravity entrained it within the conglomerate;
  • Compared to other localities in the Gulf of California where sea cliffs composed of igneous rocks such as andesite or banded rhyolite shed Holocene boulders, the granodiorite from Isla San Diego includes a larger fraction of elongated boulders that were more bar-like in form when originally loosened from the parent sea cliffs;
  • At a higher rock density than local limestone or rhyolite at 1.86 g/cm3 and 2.16 g/cm3, respectively, granodiorite at 2.52 g/cm3 required more wave energy for shore erosion. However, the difference between the measured rock density of local andesite only slightly exceeds that for local granodiorite and made little difference;
  • Fossils recovered from granodiorite conglomerate on Isla San Diego expand the range distribution of reef-dwelling corals such as Pocillopoora and Povona farther northward than previously known. Otherwise, fossil representatives among the mollusks are typical of faunas more widely attributed Marine Isotope Substage 5e throughout the Gulf of California.

Author Contributions

M.E.J. was responsible for conceptualization and methodology of the project as a contribution to the Special Issue in the Journal of Marine Sciences and Engineering devoted to “Evaluation of Boulder Deposits Linked to Late Neogene Hurricane Events.” G.C. was responsible for validation during field work at the site in May 2020 and March 2021. R.G.-F. was responsible for software applications and formal analysis. J.L.-V. was responsible for compilation of resources. All authors have read and agreed to the published version of the manuscript.

Funding

This project received no outside funding.

Institutional Review Board Statement

Not applicable.

Informed Consent Statement

Not applicable.

Data Availability Statement

All data are available in the published manuscript.

Acknowledgments

M.E.J. is grateful to Jay Racela (Environmental Lab, Williams College) for help with the experimental calculation of density for the granodiorite sample from the lower Gulf of California. Three readers contributed peer reviews with useful comments that led to the improvement of this contribution.

Conflicts of Interest

The authors declare no conflict of interest.

Appendix A

Table A1. Quantification of cobble and boulder sizes, volume, and estimated weight from Station 1 near the south end of Isla San Diego. The density of granite at 2.52 g/cm3 is applied uniformly in order to calculate wave height for each boulder on the basis of competing equations. Abbreviation: EWH = estimated wave height. Coordinates 25.11.7009 N and 110.42.0833 W.
SampleLong
Axis
(cm)
Intermediate
Axis (cm)
Short
Axis
(cm)
Volume
(cm3)
Adjust
to 80%
Weight
(kg)
EWH
Nott [20] (m)
EWH
Pepe et al. [22]
(m)
11187531274,350219,4805539.75.8
224207336026886.82.01.3
3795332133,984107,1872706.56.0
439342127,84622,277563.23.9
540302833,60026,880683.35.2
668532382,89266,3141675.64.3
768431646,78437,427945.63.0
812011070924,000739,20018639.913.1
965432981,05564,8441635.45.4
1043.5321825,05620,045513.63.4
1132211280646451162.62.2
12292614.510,9338746222.42.7
1368552386,02068,8161735.64.3
1441341419,51615,613393.42.6
1564331531,68025,344645.32.8
16906726156,780125,4243167.44.9
1717148190415233.81.41.5
183126118866709317.92.62.1
1915112.54133300.81.20.5
2012124.56485181.31.00.8
2110.510.533312650.70.90.6
2212812561976,000780,800196810.611.4
23726867328,032262,4266615.912.5
24161436725381.41.30.6
2550482764,80051,8401314.15.0
2618167201616134.11.51.3
27131246244991.31.10.7
283016.51469305544142.52.6
2920126144011522.91.71.1
3018166.5187214983.81.51.2
Average47.9637.6620.13111,34989,079224.03.23.0
Table A2. Quantification of cobble and boulder sizes and volume with estimated weight from Station 2 near the south end of Isla San Diego. The density of granite at 2.52 g/cm3 is applied uniformly in order to calculate wave height for each boulder on the basis of competing equations. Abbreviation: EWH = estimated wave height. Coordinates 25.11.6713 N and 110.42.1023 W.
SampleLong
Axis
(cm)
Intermediate
Axis (cm)
Short
Axis
(cm)
Volume
(cm3)
Adjust
to 80%
Weight
(kg)
EWH
Nott [20] (m)
EWH
Pepe et al. [22]
(m)
123.51212338427076.81.92.2
2151191485118831.21.7
33129.51110,0608048202.62.1
419137172913833.51.61.3
5169.54.56845471.41.30.8
613.5978516801.71.11.3
716.514.58179814383.61.41.5
8181482016161341.51.5
92621949143913102.11.7
1021108168013443.41.71.5
11342715.514,22911,38328.72.82.9
1243321723,39218,7144763.63.2
131710.58.5151712143.11.41.6
1420.5139239919194.81.71.7
1516833843070.81.30.6
1634333033,66026.92867.92.85.6
1733311616,36813,094332.73.0
18292496264501112.62.41.7
1940363651,84041,4721053.36.7
20624538106,02084,8162145.17.1
2159282439,64831,714804.94.5
2216.51348586861.71.40.7
2315.5135.511088872.21.31.0
24121156605281.31.00.9
2526.5191575536042152.22.8
269832161730.40.70.6
271412.5712259802.51.21.3
2810976305041.30.81.3
29169.546084861.21.30.7
30503912.524,37519,500494.12.3
313119.51060454836122.61.9
3228156252020165.12.31.1
338.55.541821500.40.70.7
3412.5977886301.61.01.3
3523195218517484.41.60.9
Average24.518.011.010,665776333.81.91.9
Table A3. Quantification of cobble and boulder sizes, volume, and estimated weight from Station 3 at the south end of Isla San Diego. The density of granite at 2.52 g/cm3 is applied uniformly in order to calculate wave height for each boulder on the basis of competing equations. Abbreviation: EWH = estimated wave height. Coordinates 25.11.6426 N and 110.42. 2518 W.
SampleLong
Axis
(cm)
Intermediate
Axis (cm)
Short
Axis
(cm)
Volume
(cm3)
Adjust
to 80%
Weight
(kg)
EWH
Nott [20] (m)
EWH
Pepe et al. [22]
(m)
1686130124,44099,5522515.65.6
21912.56142511402.91.61.1
320166.5208016644.21.71.2
452362648,67238,938984.34.9
518.5166.5192415393.91.51.2
6635434115,66892,5342335.26.3
752362648,67238,938984.34.9
861252233,55026,840685.04.1
926.5201368905512142.22.4
1032.516.51264355148132.72.2
112720105400432010.92.21.9
121013837.5143,925115,1402908.37.0
13353314.516,74813,398342.92.7
14624543.5121,36597,0922455.18.1
1551382344,57435,659904.24.3
1618.513.510.5262220985.31.52.0
17151210180014403.61.21.9
1812659.550374,850299,85075610.49.3
1920.5191350644051101.72.4
20715428102,35285,8822165.95.2
2149221718,32614,661374.03.2
2217.5136136510922.81.41.1
2328271712,85210,282262.33.2
2410.5854203360.80.90.9
25211812.5472537809.51.72.3
2612.57.55.55164131.01.01.0
271311.5811969572.41.11.5
2811.5743222580.71.00.7
2916.5148184814783.71.41.5
301163.52311850.50.90.7
3156292337,35224,882754.64.3
3219134.591827346191.60.8
3314136.511839462.41.21.2
3415128144011522.91.21.5
352825.51392827426192.32.4
Average36.024.3216.037,39129,88475.72.82.8
Table A4. Quantification of cobble and boulder sizes, volume, and estimated weight from Station 4 at the south end of Isla San Diego. The density of granite at 2.52 g/cm3 is applied uniformly in order to calculate wave height for each boulder on the basis of competing equations. Abbreviation: EWH = estimated wave height. Coordinates 25.11.6463 N and 110.42. 2586 W.
SampleLong
Axis
(cm)
Intermediate
Axis (cm)
Short
Axis
(cm)
Volume
(cm3)
Adjust
to 80%
Weight
(kg)
EWH
Nott [20] (m)
EWH
Pepe et al. [22]
(m)
166493097,02077,6161965.55.6
246361423,18418,547473.82.6
34126.51415,21112,169313.42.6
4302114.591357308182.52.7
541.53611.517,18113,745353.42.1
670.55229106,31485,0512145.85.4
757212023,94019,152484.73.7
833.52813.512,66310,130262.82.5
93029.51412,3909912252.52.6
105036.51425,55020,440524.12.6
1160.53319.538,93231,145785.03.6
1252372242,32833,862854.34.1
131512.58.5159412753.21.21.6
141135553329,395263,5166649.39.9
1555323256,32045,0561144.56.0
163428985686854172.81.7
174336.52336,09928,879733.64.3
181913.57179614363.61.61.3
19634935108,04586,4362185.26.5
201612.59.5190015203.81.31.8
2191.57417.5118,49394,7942397.63.3
226542.51952,48841,9901065.43.5
23893532.5101,23880,9902047.46.1
24554222.551,97541,5801054.54.2
253115.511.555264421112.62.1
2640.515.59.55,9644,771123.31.8
2764443598,56078,8481995.36.5
28281918.598427874202.33.5
2956.5351325,70820,566524.72.4
301396.57616081.51.11.2
311610711208962.31.31.3
3219.5129.5222317784.51.61.8
33984726119,75695,8052418.14.9
3419.51711364729177.41.42.1
3557.55644141,680113,3442864.88.2
Average48.032.019.3148,75839,00798.03.73.4
Table A5. Quantification of cobble and boulder sizes, volume, and estimated weight from Station 5 at the south end of Isla San Diego. The density of granite at 2.52 g/cm3 is applied uniformly in order to calculate wave height for each boulder on the basis of competing equations. Abbreviation: EWH = estimated wave height. Coordinates 25.11.6494 N and 110.42.2551 W.
SampleLong
Axis
(cm)
Intermediate
Axis (cm)
Short
Axis
(cm)
Volume
(cm3)
Adjust
to 80%
Weight
(kg)
EWH
Nott [20] (m)
EWH
Pepe et al. [22] (m)
148.540.52039,28531,42879.84.03.7
2643323.549,63239,7061005.34.4
3693128.560,96248,7691235.75.3
4363520.525,83020,664523.03.8
573432578,47562,7801586.04.7
62522.51373135850152.12.4
733231291087286182.72.2
8363611.514,9044923303.02.1
9137.576835461.41.11.3
10217.56.5102481921.71.2
1114138.5154712383.11.21.6
1249.54319.541,50633,205844.13.6
1319.51710.53481278571.62.0
1449.5292231,58125,265644.14.1
1531305465037209.42.60.9
161196.56445151.30.91.2
179.5875324261.10.81.3
1831.5301615,12012,096302.63.0
19423814.523,14218,514473.52.7
2045452244,55035,640903.74.1
2163402665,52052,4161325.24.9
2267362253,06442,451075.54.1
23635329.598,50178,8001995.25.5
24403016.519,80015,840403.33.1
252819.51476446115152.32.6
2684.558.528138,411110,7292797.05.2
2763392863,50450,8031285.25.2
2878.56225121,67597,3402456.54.7
29654638113,62090,8962295.47.1
3029289.577146171162.41.8
31100.545.543196,628157,3033968.38.0
32373216.519,53615,629393.13.1
336629.52854,51643,613405.55.2
345845.52463,33650,6691284.84.5
3532238.562565005132.61.6
Average45.5832.2418.7343,39133,45683.43.63.3
Table A6. Quantification of cobble and boulder sizes, volume, and estimated weight from Station 6 at the south end of Isla San Diego. The density of granite at 2.52 g/cm3 is applied uniformly in order to calculate wave height for each boulder on the basis of competing equations. Abbreviation: EWH = estimated wave height. Coordinates 25.11.6802 N and 110.42.2417 W.
SampleLong
Axis
(cm)
Intermediate
Axis (cm)
Short
Axis
(cm)
Volume
(cm3)
Adjust
to 80%
Weight
(kg)
EWH
Nott [20] (m)
EWH
Pepe et al. [22] (m)
1755827117,45093,9602386.25.0
269331431,87825,502645.72.6
350453578,75063,0001594.16.5
464.53935.589,30071,4401805.36.6
5302413.597207776202.52.5
625.5141449983998102.12.6
760382659,28047,4241205.04.9
867421953,46642,7731085.53.5
953.5282537,45029,960754.44.7
1019.5188280822465.71.61.5
11733520.552,37841,9021066.03.8
1263542585,05068,0401715.24.7
138556.519.593,64974,9191894.73.6
147643.53099,18079,3442006.35.6
156340.51948,47938,783985.23.5
162726.511.582286583172.22.1
1735.5221410,9348747222.92.6
18494115.531,14024,912634.02.9
1920.512.512307524606.21.72.2
20645324.583,10466,4831685.34.6
2120.515.58.5270121615.41.71.6
22111066605281.30.91.1
2333.5222014,74011,792302.83.7
24574136.585,30168,2401724.76.8
254338.51931,45525,164633.63.5
2622.5226.5321825746.51.91.2
2753411226,07620,861534.42.2
283822.51613,68010,944283.13.0
294119.512.599947995203.42.3
3059492675,16660,1331524.94.9
Average48.333.519.042,11033,68885.03.22.9

References

  1. Carreño, A.L.; Helenes, J. Geology and ages of the islands. In Island Biogeography of the Sea of Cortés; Case, T.J., Cody, M.L., Ezcurra, E., Eds.; Oxford University Press: Oxford, UK, 2002; pp. 14–40. [Google Scholar]
  2. Backus, D.H.; Johnson, M.E.; Ledesma-Vazquez, J. Peninsular and island rocky shores in the Gulf of California. In Atlas of Coastal Ecosystems in the Western Gulf of California; Johnson, M.E., Ledesma-Vazquez, J., Eds.; University Arizona Press: Tucson, AZ, USA, 2009; pp. 11–27. ISBN 978-0-8165-2530-0. [Google Scholar]
  3. Johnson, M.E.; Ledesma-Vázquez, J.; Guardado-Grance, R. Coastal geomorphology of a Holocene hurricane deposit on a Pleistocene marine terrace from Isla Carmen (Baja California Sur, Mexico). J. Mar. Sci. Eng. 2018, 6, 108. [Google Scholar] [CrossRef] [Green Version]
  4. Johnson, M.E.; Guardado-France, R.; Johnson, E.M.; Ledesma-Vázquez, J. Geomorphology of a Holocene hurricane deposit eroded from rhyolite sea cliffs on Ensenada Almeja (Baja California Sur, Mexico). J. Mar. Sci. Eng. 2019, 7, 193. [Google Scholar] [CrossRef] [Green Version]
  5. Johnson, M.E.; Johnson, E.M.; Guardado-France, R.; Ledesma-Vázquez, J. Holocene hurricane deposits eroded as coastal barriers from andesite sea cliffs at Puerto Escondido (Baja California Sur, Mexico). J. Mar. Sci. Eng. 2020, 8, 75. [Google Scholar] [CrossRef] [Green Version]
  6. Guardada-France, R.; Johnson, M.E.; Ledesma-Vázquez, J.; Santa Rosa-del Rio, M.A.; Herrera-Gutiérrez, Á. Multiphase storm deposits eroded from andesite sea cliffs on Isla San Luis Gonzaga (Northern Gulf of California Mexico). J. Mar. Sci. Eng. 2020, 8, 525. [Google Scholar] [CrossRef]
  7. Lumbier, M.M. Algunos datos sobre las islas Mexicanas para contribuir al studio de sur recursos naturalas. Anales del Instituo Geoloógico de México 1919, 7, 29. [Google Scholar]
  8. Lorang, M.S. A wave-competence approach to distinguish between boulder and megaclast deposits due to storm waves versus tsunamis. Mar. Geol. 2011, 283, 90–97. [Google Scholar] [CrossRef]
  9. May, S.M.; Engel, M.; Brill, D.; Squire, P.; Scheffers, A.; Kelletat, D. Coastal hazards from tropical cyclones and extratropical winter storms based on Holocene storm chronologies. In Coastal World Heritage Sites; Finkl, C.W., Ed.; Springer Nature: Berlin, Germany, 2012; Volume 6, pp. 557–585. [Google Scholar]
  10. Kennedy, A.B.; Mori, N.; Zhang, Y.; Yasuda, T.; Chen, S.E.; Tajima, Y.; Pecor, W.; Toride, K. Observations and modeling of coastal boulder transport and loading during Super Typhoon Haiyan. Coast. Eng. J. 2016, 58, 164004–1–164004–25. [Google Scholar] [CrossRef]
  11. Scheffers, A.; Kelletat, D. Megaboulder movement by superstorms: A geomorphological approach. J. Coast. Res. 2020, 36, 844–856. [Google Scholar] [CrossRef]
  12. Ávila, S.P.; Johnson, M.E.; Rebelo, A.C.; Baptista, L.; Melo, C.S. Comparison of modern and Pleistocene (MIS 5e) coastal boulder deposits from Santa Maria Island (Azores Archipelago, NE Atlantic Ocean). J. Mar. Sci. Eng. 2020, 9, 138. [Google Scholar] [CrossRef]
  13. Galindo, I.; Johnson, M.E.; Martín-González, E.; Romero, C.; Vegas, J.; Melo, C.S.; Ávila, S.P.; Sánchez, N. Late Pleistocene boulder slumps eroded from a basalt shoreline at El Confital Beach on Gran Canaria (Canary Islands, Spain). J. Mar. Sci. Eng. 2020, 9, 138. [Google Scholar] [CrossRef]
  14. Johnson, M.E. Holocene boulder beach eroded from chromite and dunite sea cliffs at Støpet on Leka Island (Northern Norway). J. Mar. Sci. Eng. 2020, 8, 644. [Google Scholar] [CrossRef]
  15. Ledesma-Vázquez, J.; Johnson, M.E.; Gonzalez-Yajimovich, O.; Santamaría-del-Angel, E. Gulf of California geography, geological origins, oceanography, and sedimentation patterns. In Atlas of Coastal Ecosystems in the Western Gulf of California; Johnson, M.E., Ledesma-Vazquez, J., Eds.; University Arizona Press: Tucson, AZ, USA, 2009; pp. 1–10. ISBN 978-0-8165-2530-0. [Google Scholar]
  16. Gastil, R.G.; Kimbrough, D.L.; Kimbrough, J.M. The Sierra San Pedro Mártir zoned pluton, Baja California, Mexico. In Peninsular Ranges Batholith, Baja California and Southern California: Geological Society of America Memoirs; Morton, D.M., Miller, F.K., Eds.; Geological Society of America: Boulder, CO, USA, 2014; Volume 211, pp. 739–758. [Google Scholar]
  17. Olvera, M.C.; Aceves, J.S.; Rendøn, C.; Valiente, C.; Acosta, M.L.L.; Rodríguez, B. La política ambiental Mexicana y la conservación del ambiente en Baja California Sur. Gaceta Ecológica 2004, 70, 45–56. [Google Scholar]
  18. Wentworth, C.K. A scale of grade and class terms for clastic sediments. J. Geol. 1922, 27, 377–392. [Google Scholar] [CrossRef]
  19. Sneed, E.D.; Folk, R.L. Pebbles in the lower Colorado River of Texas: A study in particle morphogenesis. J. Geol. 1958, 66, 114–150. [Google Scholar] [CrossRef]
  20. Nott, J. Waves, coastal bolder deposits and the importance of pre-transport setting. Earth Planet. Sci. Lett. 2003, 210, 269–276. [Google Scholar] [CrossRef]
  21. Nandasena, N.A.K.; Paris, R.; Tanaka, N. Reassessment of hydrodynamic equations: Minimum flow velocity to initiate boulder transport by high energy events (storms, tsunamis). Mar. Geol. 2011, 281, 70–84. [Google Scholar] [CrossRef]
  22. Pepe, F.; Corradino, M.; Parrino, N.; Besio, G.; Presti, V.L.; Renda, P.; Calcagnile, L.; Quarta, G.; Sulli, A.; Antonioli, F. Boulder coastal deposits at Favignana Island rocky coast (Sicily, Italy): Litho-structural and hydrodynamic control. Geomorphology 2018, 303, 191–209. [Google Scholar] [CrossRef]
  23. Tierney, P.W.; Johnson, M.E. Stabilization role of crustose coralline algae during Late Pleistocene reef development on Isla Cerralvo, Baja California Sur (Mexico). J. Coast. Res. 2012, 28, 244–254. [Google Scholar] [CrossRef]
  24. López-Pérez, R.A. Fossil corals from the Gulf of California, México: Still a depauperate fauna but it bears more species than previously thought. Proc. Calif. Acad. Sci. 2008, 59, 503–519. [Google Scholar]
  25. Harmon, R.S.; Mitterer, R.M.; Kriausakul, N.; Land, L.S.; Schwarcz, H.P.; Garrett, P.; Larson, G.J.; Vacher, H.L.; Rowe, M. U-series and amino acid racemization geochronology of Bermuda—Implications for eustatic sea level fluctuation over the past 250,000 years. Palaeogeogr. Palaeoclimatol. Palaeoecol. 1983, 44, 41–70. [Google Scholar] [CrossRef]
  26. Rohling, E.J.; Grant, K.; Hemleben, C.H.; Siddall, M.; Hoogakker, B.A.A.; Bolshaw, M.; Kucera, M. High rates of sea-level rise during the last interglacial period. Nat. Geosci. 2008, 1, 38. [Google Scholar] [CrossRef]
  27. Redyes-Bonilla, H.; López-Pérez, R.A. Corals and coral-reef communities in the Gulf of California. In Atlas of Coastal Ecosystems in the Western Gulf of California; Johnson, M.E., Ledesma-Vazquez, J., Eds.; University Arizona Press: Tucson, AZ, USA, 2009; pp. 43–57. ISBN 978-0-8165-2530-0. [Google Scholar]
  28. Merrifield, M.A.; Winant, C.D. Shelf-circulation in the Gulf of California: A description of the variability. J. Geophys. Res. 1989, 94, 133–160. [Google Scholar] [CrossRef]
  29. Avila, L. The 2015 eastern North Pacific hurricane season: A very active year. Weatherwise 2016, 69, 36–42. [Google Scholar] [CrossRef]
  30. Travis, C. Earliest Tropical Storm on Record Forms in East Pacific. Available online: https://www.accuweather.com (accessed on 19 May 2021).
Figure 1. Mexico’s Baja California Peninsula and Isla San Diego: (a) map showing the boundary between the United States and Mexico as well as the boundary between the northern and southern states of Baja California and Baja California Sur (dashed lines), together with towns on the Baja California Peninsula and key spots or islands including Ángel de la Guarda (AG), Punta San Antonio (PA), Carmen (Ca), Santa Catalina (SC), Cerralvo (Ce) and San Diego (box with asterisk); (b) enlarged map of Isla San Diego in the lower Gulf of California, showing the location of Stations 1 to 6 where cobbles and boulders of eroded granodiorite were measured for this study.
Jmse 09 00555 g001
Figure 2. South end of Isla San Diego (lower Gulf of California: (a) view showing part of the shallow-water ridge composed of loose cobbles and boulders of eroded granodiorite oriented S 55° W off the island; (b) southwest end of the island showing small sea caves eroded in granodiorite basement rocks overlain by Pleistocene conglomerate.
Jmse 09 00555 g002
Figure 3. Sample stations on the southeast side and southern tip of Isla San Diego: (a) sample Stations 1 and 2 occur at 375 m and 350 m north of the island’s southern tip (red circles are 2 m in diameter); (b) sample Station 3 is located at the far southwestern tip of Isla San Diego (red oval is 0.5 m wide).
Jmse 09 00555 g003
Figure 4. Set of triangular Sneed–Folk diagrams used to appraise variations in cobble and boulder shapes sampled along the Upper Pleistocene paleoshore on Isla San Diego in the lower Gulf of California ((af), Stations 1–6).
Jmse 09 00555 g004
Figure 5. Set of bar graphs used to contrast variations in the maximum size of clast axes from six samples at Isla San Diego in the lower Gulf of California: (a) bar graphs from Station 1; (b) bar graphs from Station 2; (c) bar graphs from Station 3; (d) bar graphs from Station 4; (e) bar graphs from Station 5; (f) bar graphs from Station 6. Dashed line (offset to represent 26.6 mm) marks the boundary between large cobbles and small boulders.
Jmse 09 00555 g005
Figure 6. Set of bar graphs used to contrast variations in the intermediate size of clast axes from six samples at Isla San Diego in the lower Gulf of California: (a) bar graphs from Station 1; (b) bar graphs from Station 2; (c) bar graphs from Station 3; (d) bar graphs from Station 4; (e) bar graphs from Station 5; (f) bar graphs from Station 6. Dashed line (offset to represent 26.6 mm) marks the boundary between large cobbles and small boulders.
Jmse 09 00555 g006
Figure 7. Photographic evidence for clast imbrication: (a) view overlooking sample Station 3 at the southern tip of Isla San Diego; (b) upper part of the conglomerate deposit at the same locality, tracing the outline of boulders; (c) drawing of the tracing isolated for clarity.
Jmse 09 00555 g007
Figure 8. Upper Pleistocene fossils from the granodiorite conglomerate at Isla San Diego: (a) filling among boulders that includes the coral Porites panamensis (ruler for scale); (b) broken branch from the coral Pocillopora elegans (approximately 3 cm in diameter); (c) articulated bivalve (Codakia distinguenda) with ruler for scale; (d) fragment of a thick-shelled oyster (pen tip for scale;) (e) inside surface of a disarticulated valve belonging to Spondylus calcifer (approximately 7 cm in width); (f) broken shell belonging to the species Lyropecten subnodosus (ruler for scale); (g) detail from Figure 7a showing the surface opening of the barnacle Hexacreusia durhami (approximately 3 mm in diameter).
Jmse 09 00555 g008
Figure 9. View in the shadow of cliff-forming granodiorite boulders at the tip of Isla San Diego looking to the southwest across the beach and major extension of a submarine ridge composed of loose cobbles and boulders (see also Figure 2a viewed from the opposite direction).
Jmse 09 00555 g009
Table 1. Summary list of marine invertebrate fossils from the Upper Pleistocene boulder beds on Isla San Diego correlated with Marine Isotope Substage 5e.
PhylumClassSpeciesPhylumClassSpecies
CoelenterataAnthozoaPorites panamensisMolluscaBivalviaCodakia distinguenda
Pocillopora elegans Lyropecten subnodosus
Povona gigantea Ostrea sp.
Spondylus calcifer
ArthropodaGastropoda
Cirripedia
Turbo fluctuosus
Hexacreusia durhami
Table 2. Summary data from Appendix A (Table A1, Table A2, Table A3, Table A4, Table A5 and Table A6) showing maximum bolder size and estimated weight compared to the average values for sampled boulders from each of the transects together with calculated values for wave heights estimated as necessary for boulder–beach mobility. Abbreviations: EAWH = estimated average wave height, EMWH = estimated maximum wave height.
San Diego
Station
Number of
Samples
Average Boulder
Volume (cm3)
Average
Boulder
Weight (kg)
EAWH (m)
Nott [20]
EAWH
(m)
Pepe et al. [22]
Max. Boulder Volume (cm3)Max. Boulder Weight (kg)EMWH (m)
Nott [20]
EMWH
(m)
Pepe et al. [22]
13089,0792243.23.0780,800196810.611.4
235776333.81.91.984,8162145.17.1
33529,88475.72.82.8299,85075610.49.3
43539,007983.73.4263,5166649.39.9
53533,45683.43.63.3157,3033968.38.0
63033,688853.22.993,9602386.25.0
Average33.3366,5361003.12.9280,0417068.08.5
Publisher’s Note: MDPI stays neutral with regard to jurisdictional claims in published maps and institutional affiliations.

