
Local Tree Diversity Suppresses Foliar Fungal Infestation and Decreases Morphological but Not Molecular Richness in a Young Subtropical Forest

 ,
,  ,
,  ,
,
Abstract
:1. Introduction
2. Materials and Methods
2.1. Study Location and Leaf Sampling
2.2. Foliar Fungal Screening and Species Identification
2.3. DNA High-Throughput Sequencing
2.4. Bioinformatics Analysis
2.5. Data Analysis
3. Results
3.1. Fungal Community Composition and Species Specialisation
3.2. Tree Species Diversity of the Local Neighbourhood Effect
3.3. Effects of the Proportion of Target and Non-Target Tree Species in the Local Neighbourhood
3.4. Comparison of Foliar Fungal Community Composition Identification Methods
4. Discussion
5. Conclusions
Supplementary Materials
Author Contributions
Funding
Institutional Review Board Statement
Informed Consent Statement
Data Availability Statement
Acknowledgments
Conflicts of Interest
References
- Boyd, I.L.; Freer-Smith, P.H.; Gilligan, C.A.; Godfray, H.C.J. The consequence of tree pests and diseases for ecosystem services. Science 2013, 342. [Google Scholar] [CrossRef]
- Giraud, T.; Gladieux, P.; Gavrilets, S. Linking the emergence of fungal plant diseases with ecological speciation. Trends Ecol. Evol. 2010, 25, 387–395. [Google Scholar] [CrossRef] [PubMed] [Green Version]
- Fisher, M.C.; Henk, D.A.; Briggs, C.J.; Brownstein, J.S.; Madoff, L.C.; McCraw, S.L.; Gurr, S.J. Emerging fungal threats to animal, plant and ecosystem health. Nature 2012, 484, 186–194. [Google Scholar] [CrossRef]
- Alexander, H.M. Disease in natural plant populations, communities, and ecosystems: Insights into ecological and evolutionary processes. Plant Dis. 2010, 94, 492–503. [Google Scholar] [CrossRef] [PubMed] [Green Version]
- Balmelli, G.; Simeto, S.; Altier, N.; Marroni, V.; Diez, J.J. Long term losses caused by foliar diseases on growth and survival of Eucalyptus globulus in Uruguay. New For. 2013, 44, 249–263. [Google Scholar] [CrossRef]
- Hunter, G.C.; Crous, P.W.; Carnegie, A.J.; Wingfield, M.J. Teratosphaeria nubilosa, a serious leaf disease pathogen of Eucalyptus spp. in native and introduced areas. Mol. Plant Pathol. 2009, 10, 1–14. [Google Scholar] [CrossRef]
- Gamliel, A. High Consequence Plant Pathogens. 2008, 25–36. [Google Scholar] [CrossRef]
- Dobson, A.; Crawley, M. Pathogens and the structure of plant communities. Trends Ecol. Evol. 1994, 9, 393–398. [Google Scholar] [CrossRef]
- Rottstock, T.; Joshi, J.; Kummer, V.; Fischer, M. Higher plant diversity promotes higher diversity of fungal pathogens, while it decreases pathogen infection per plant. Ecology 2014, 95, 1907–1917. [Google Scholar] [CrossRef] [PubMed] [Green Version]
- Scherber, C.; Eisenhauer, N.; Weisser, W.W.; Schmid, B.; Voigt, W.; Fischer, M.; Schulze, E.D.; Roscher, C.; Weigelt, A.; Allan, E.; et al. Bottom-up effects of plant diversity on multitrophic interactions in a biodiversity experiment. Nature 2010, 468, 553–556. [Google Scholar] [CrossRef]
- Knops, J.M.H.; Tilman, D.; Haddad, N.M.; Naeem, S.; Mitchell, C.E.; Haarstad, J.; Ritchie, M.E.; Howe, K.M.; Reich, P.B.; Siemann, E.; et al. Effects of plant species richness on invasion dynamics, disease outbreaks, insect abundances and diversity. Ecol. Lett. 1999, 2, 286–293. [Google Scholar] [CrossRef]
- Mitchell, C.E.; Tilman, D.; Groth, J.V. Effects of grassland plant species diversity, abundance, and composition on foliar fungal disease. Ecology 2002, 83, 1713–1726. [Google Scholar] [CrossRef]
- Nilsson, R.H.; Larsson, K.H.; Taylor, A.F.S.; Bengtsson-Palme, J.; Jeppesen, T.S.; Schigel, D.; Kennedy, P.; Picard, K.; Glöckner, F.O.; Tedersoo, L.; et al. The UNITE database for molecular identification of fungi: Handling dark taxa and parallel taxonomic classifications. Nucleic Acids Res. 2019, 47, D259–D264. [Google Scholar] [CrossRef] [PubMed]
- Navrátilová, D.; Tláskalová, P.; Kohout, P.; Dřevojan, P.; Fajmon, K.; Chytrý, M.; Baldrian, P. Diversity of fungi and bacteria in species-rich grasslands increases with plant diversity in shoots but not in roots and soil. FEMS Microbiol. Ecol. 2018, 95, 1–10. [Google Scholar] [CrossRef] [PubMed] [Green Version]
- Pautasso, M.; Holdenrieder, O.; Stenlid, J. Susceptibility to Fungal Pathogens of Forests Differing in Tree Diversity. For. Divers. Funct. 2005, 176, 263–289. [Google Scholar] [CrossRef]
- Hantsch, L.; Braun, U.; Scherer-Lorenzen, M.; Bruelheide, H. Species richness and species identity effects on occurrence of foliar fungal pathogens in a tree diversity experiment. Ecosphere 2013, 4, 1–12. [Google Scholar] [CrossRef] [Green Version]
- Haas, S.E.; Hooten, M.B.; Rizzo, D.M.; Meentemeyer, R.K. Forest species diversity reduces disease risk in a generalist plant pathogen invasion. Ecol. Lett. 2011, 14, 1108–1116. [Google Scholar] [CrossRef]
- Hantsch, L.; Bien, S.; Radatz, S.; Braun, U.; Auge, H.; Bruelheide, H. Tree diversity and the role of non-host neighbour tree species in reducing fungal pathogen infestation. J. Ecol. 2014, 102, 1673–1687. [Google Scholar] [CrossRef]
- Nguyen, D.; Boberg, J.; Cleary, M.; Bruelheide, H.; Hönig, L.; Koricheva, J.; Stenlid, J. Foliar fungi of Betula pendula: Impact of tree species mixtures and assessment methods. Sci. Rep. 2017, 7, 1–11. [Google Scholar] [CrossRef] [PubMed] [Green Version]
- Vacher, C.; Vile, D.; Helion, E.; Piou, D.; Desprez-Loustau, M.L. Distribution of parasitic fungal species richness: Influence of climate versus host species diversity. Divers. Distrib. 2008, 14, 786–798. [Google Scholar] [CrossRef]
- Keesing, F.; Holt, R.D.; Ostfeld, R.S. Effects of species diversity on disease risk. Ecol. Lett. 2006, 9, 485–498. [Google Scholar] [CrossRef] [PubMed]
- Hantsch, L.; Braun, U.; Haase, J.; Purschke, O.; Scherer-Lorenzen, M.; Bruelheide, H. No plant functional diversity effects on foliar fungal pathogens in experimental tree communities. Fungal Divers. 2014, 66, 139–151. [Google Scholar] [CrossRef]
- Chen, L.; Zhou, S. A combination of species evenness and functional diversity is the best predictor of disease risk in multihost communities. Am. Nat. 2015, 186, 755–765. [Google Scholar] [CrossRef]
- Mommer, L.; Cotton, T.E.A.; Raaijmakers, J.M.; Termorshuizen, A.J.; van Ruijven, J.; Hendriks, M.; van Rijssel, S.Q.; van de Mortel, J.E.; van der Paauw, J.W.; Schijlen, E.G.W.M.; et al. Lost in diversity: The interactions between soil-borne fungi, biodiversity and plant productivity. New Phytol. 2018, 218, 542–553. [Google Scholar] [CrossRef] [Green Version]
- Ostfeld, R.S.; Keesing, F. The function of biodiversity in the ecology of vector-borne zoonotic diseases. Can. J. Zool. 2000, 78, 2061–2078. [Google Scholar] [CrossRef]
- Hersh, M.H.; Vilgalys, R.; Clark, J.S. Evaluating the impacts of multiple generalist fungal pathogens on temperate tree seedling survival. Ecology 2012, 93, 511–520. [Google Scholar] [CrossRef] [PubMed]
- Nguyen, D.; Boberg, J.; Ihrmark, K.; Stenström, E.; Stenlid, J. Do foliar fungal communities of Norway spruce shift along a tree species diversity gradient in mature European forests? Fungal Ecol. 2016, 23, 97–108. [Google Scholar] [CrossRef] [Green Version]
- Jorge, L.R.; Prado, P.I.; Almeida-Neto, M.; Lewinsohn, T.M. An integrated framework to improve the concept of resource specialisation. Ecol. Lett. 2014, 17, 1341–1350. [Google Scholar] [CrossRef] [PubMed]
- Redman, R.S.; Dunigan, D.D.; Rodriguez, R.J. Fungal symbiosis from mutualism to parasitism: Who controls the outcome, host or invader? New Phytol. 2001, 151, 705–716. [Google Scholar] [CrossRef] [Green Version]
- Gilbert, G.S.; Webb, C.O. Phylogenetic signal in plant pathogen-host range. Proc. Natl. Acad. Sci. USA 2007, 104, 4979–4983. [Google Scholar] [CrossRef] [Green Version]
- Barrett, L.G.; Kniskern, J.M.; Bodenhausen, N.; Zhang, W.; Bergelson, J. Continua of specificity and virulence in plant host-pathogen interactions: Causes and consequences. New Phytol. 2009, 183, 513–529. [Google Scholar] [CrossRef] [PubMed]
- Civitello, D.J.; Cohen, J.; Fatima, H.; Halstead, N.T.; Liriano, J.; McMahon, T.A.; Ortega, C.N.; Sauer, E.L.; Sehgal, T.; Young, S.; et al. Biodiversity inhibits parasites: Broad evidence for the dilution effect. Proc. Natl. Acad. Sci. USA 2015, 112, 8667–8671. [Google Scholar] [CrossRef] [Green Version]
- Roscher, C.; Schumacher, J.; Foitzik, O.; Schulze, E.D. Resistance to rust fungi in Lolium perenne depends on within-species variation and performance of the host species in grasslands of different plant diversity. Oecologia 2007, 153, 173–183. [Google Scholar] [CrossRef] [PubMed]
- Moore, S.M.; Borer, E.T. The influence of host diversity and composition on epidemiological patterns at multiple spatial scales. Ecology 2012, 93, 1095–1105. [Google Scholar] [CrossRef] [Green Version]
- Mundt, C.C.; Sackett, K.E.; Wallace, L.D. Landscape heterogeneity and disease spread: Experimental approaches with a plant pathogen. Ecol. Appl. 2011, 21, 321–328. [Google Scholar] [CrossRef] [PubMed]
- Vidal, T.; Saint-Jean, S.; Lusley, P.; Leconte, M.; Ben Krima, S.; Boixel, A.L.; de Vallavieille-Pope, C. Cultivar mixture effects on disease and yield remain despite diversity in wheat height and earliness. Plant Pathol. 2020, 69, 1148–1160. [Google Scholar] [CrossRef]
- Schuldt, A.; Hönig, L.; Li, Y.; Fichtner, A.; Härdtle, W.; von Oheimb, G.; Welk, E.; Bruelheide, H. Herbivore and pathogen effects on tree growth are additive, but mediated by tree diversity and plant traits. Ecol. Evol. 2017, 7, 7462–7474. [Google Scholar] [CrossRef]
- García-Guzmán, G.; Trejo, I.; Sánchez-Coronado, M.E. Foliar diseases in a seasonal tropical dry forest: Impacts of habitat fragmentation. For. Ecol. Manage. 2016, 369, 126–134. [Google Scholar] [CrossRef]
- Keesing, F.; Belden, L.K.; Daszak, P.; Dobson, A.; Harvell, C.D.; Holt, R.D.; Hudson, P.; Jolles, A.; Jones, K.E.; Mitchell, C.E.; et al. Impacts of biodiversity on the emergence and transmission of infectious diseases. Nature 2010, 468, 647–652. [Google Scholar] [CrossRef]
- Huber, L.; Gillespie, T.J. Modeling leaf wetness in relation to plant disease epidemiology. Annu. Rev. Phytopathol. 1992, 30, 553–577. [Google Scholar] [CrossRef]
- Spear, E.R.; Coley, P.D.; Kursar, T.A. Do pathogens limit the distributions of tropical trees across a rainfall gradient? J. Ecol. 2015, 103, 165–174. [Google Scholar] [CrossRef]
- Cheng, C.; Gao, X.; Feng, B.; Sheen, J.; Shan, L.; He, P. Plant immune response to pathogens differs with changing temperatures. Nat. Commun. 2013, 4, 1–9. [Google Scholar] [CrossRef] [Green Version]
- Velásquez, A.C.; Castroverde, C.D.M.; He, S.Y. Plant–Pathogen Warfare under Changing Climate Conditions. Curr. Biol. 2018, 28, R619–R634. [Google Scholar] [CrossRef] [PubMed] [Green Version]
- Pangga, I.B.; Hanan, J.; Chakraborty, S. Climate change impacts on plant canopy architecture: Implications for pest and pathogen management. Eur. J. Plant Pathol. 2013, 135, 595–610. [Google Scholar] [CrossRef]
- Darcy, J.L.; Swift, S.O.I.; Cobian, G.M.; Zahn, G.L.; Perry, B.A.; Amend, A.S. Fungal communities living within leaves of native Hawaiian dicots are structured by landscape-scale variables as well as by host plants. Mol. Ecol. 2020, 29, 3103–3116. [Google Scholar] [CrossRef] [PubMed]
- Ramegowda, V.; Senthil-Kumar, M. The interactive effects of simultaneous biotic and abiotic stresses on plants: Mechanistic understanding from drought and pathogen combination. J. Plant Physiol. 2015, 176, 47–54. [Google Scholar] [CrossRef] [Green Version]
- Pandey, P.; Irulappan, V.; Bagavathiannan, M.V.; Senthil-Kumar, M. Impact of combined abiotic and biotic stresses on plant growth and avenues for crop improvement by exploiting physio-morphological traits. Front. Plant Sci. 2017, 8, 1–15. [Google Scholar] [CrossRef] [Green Version]
- Király, L.; Hafez, Y.M.; Fodor, J.; Király, Z. Suppression of tobacco mosaic virus-induced hypersensitive-type necrotization in tobacco at high temperature is associated with downregulation of NADPH oxidase and superoxide and stimulation of dehydroascorbate reductase. J. Gen. Virol. 2008, 89, 799–808. [Google Scholar] [CrossRef]
- Wang, Y.; Bao, Z.; Zhu, Y.; Hua, J. Analysis of temperature modulation of plant defense against biotrophic microbes. Mol. Plant-Microbe Interact. 2009, 22, 498–506. [Google Scholar] [CrossRef] [Green Version]
- Achuo, E.A.; Prinsen, E. Influence of drought, salt stress and abscisic acid on the resistance of tomato to. Plant Pathol. 2006, 178–186. [Google Scholar] [CrossRef]
- Gupta, A.; Dixit, S.K.; Senthil-Kumar, M. Drought stress predominantly endures arabidopsis thaliana to pseudomonas syringae infection. Front. Plant Sci. 2016, 7. [Google Scholar] [CrossRef] [Green Version]
- Burgess, T.I.; Scott, J.K.; Mcdougall, K.L.; Stukely, M.J.C.; Crane, C.; Dunstan, W.A.; Brigg, F.; Andjic, V.; White, D.; Rudman, T.; et al. Current and projected global distribution of Phytophthora cinnamomi, one of the world’s worst plant pathogens. Glob. Chang. Biol. 2017, 23, 1661–1674. [Google Scholar] [CrossRef] [PubMed] [Green Version]
- Schulz, B.; Guske, S.; Dammann, U.; Boyle, C. Endophyte-host interactions. II. Defining symbiosis of the endophyte-host interaction. Symbiosis 1998, 25, 213–227. [Google Scholar]
- Rodriguez, R.J.; White, J.F.; Arnold, A.E.; Redman, R.S. Fungal endophytes: Diversity and functional roles: Tansley review. New Phytol. 2009, 182, 314–330. [Google Scholar] [CrossRef] [PubMed]
- Zhou, S.L.; Yan, S.Z.; Liu, Q.S.; Chen, S.L. Diversity of Endophytic Fungi Associated with the Foliar Tissue of a Hemi-Parasitic Plant Macrosolen cochinchinensis. Curr. Microbiol. 2014, 70, 58–66. [Google Scholar] [CrossRef]
- Dupont, P.Y.; Eaton, C.J.; Wargent, J.J.; Fechtner, S.; Solomon, P.; Schmid, J.; Day, R.C.; Scott, B.; Cox, M.P. Fungal endophyte infection of ryegrass reprograms host metabolism and alters development. New Phytol. 2015, 208, 1227–1240. [Google Scholar] [CrossRef]
- Zhou, D.; Hyde, K.D. Host-specificity, host-exclusivity, and host-recurrence in saprobic fungi* *Paper presented at the Asian Mycological Congress 2000 (AMC 2000) incorporating the 2nd Asia-Pacific Mycological Congress on Biodiversity and Biotechnology, and held at the Univer. Mycol. Res. 2001, 105, 1449–1457. [Google Scholar] [CrossRef]
- Higgins, K.L.; Arnold, A.E.; Coley, P.D.; Kursar, T.A. Communities of fungal endophytes in tropical forest grasses: Highly diverse host- and habitat generalists characterized by strong spatial structure. Fungal Ecol. 2014, 8, 1–11. [Google Scholar] [CrossRef]
- Murali, T.S.; Suryanarayanan, T.S.; Venkatesan, G. Fungal endophyte communities in two tropical forests of southern India: Diversity and host affiliation. Mycol. Prog. 2007, 6, 191–199. [Google Scholar] [CrossRef]
- Huang, W.Y.; Cai, Y.Z.; Hyde, K.D.; Corke, H.; Sun, M. Biodiversity of endophytic fungi associated with 29 traditional Chinese medicinal plants. Fungal Divers. 2008, 33, 61–75. [Google Scholar]
- Ko, T.W.K.; Stephenson, S.L.; Bahkali, A.H.; Hyde, K.D. From morphology to molecular biology: Can we use sequence data to identify fungal endophytes? Fungal Divers. 2011, 50, 113–120. [Google Scholar] [CrossRef]
- Fernandes, I.; Pereira, A.; Trabulo, J.; Pascoal, C.; Cássio, F.; Duarte, S. Microscopy- or DNA-based analyses: Which methodology gives a truer picture of stream-dwelling decomposer fungal diversity? Fungal Ecol. 2015, 18, 130–134. [Google Scholar] [CrossRef]
- U’Ren, J.M.; Dalling, J.W.; Gallery, R.E.; Maddison, D.R.; Davis, E.C.; Gibson, C.M.; Arnold, A.E. Diversity and evolutionary origins of fungi associated with seeds of a neotropical pioneer tree: A case study for analysing fungal environmental samples. Mycol. Res. 2009, 113, 432–449. [Google Scholar] [CrossRef]
- Gao, X.X.; Zhou, H.; Xu, D.Y.; Yu, C.H.; Chen, Y.Q.; Qu, L.H. High diversity of endophytic fungi from the pharmaceutical plant, Heterosmilax japonica Kunth revealed by cultivation-independent approach. FEMS Microbiol. Lett. 2005, 249, 255–266. [Google Scholar] [CrossRef] [Green Version]
- Horisawa, S.; Yoshida, M.; Umezawa, K.; Wada, T.; Abe, H.; Doi, S.; Samejima, M.; Momohara, I. Diversity and community structure of wood-inhabiting fungi found in Japanese wooden houses analyzed by the next-generation sequencing. J. Wood Sci. 2017, 63, 369–378. [Google Scholar] [CrossRef]
- Saine, S.; Ovaskainen, O.; Somervuo, P.; Abrego, N. Data collected by fruit body- and DNA-based survey methods yield consistent species-to-species association networks in wood-inhabiting fungal communities. Oikos 2020, 1–11. [Google Scholar] [CrossRef]
- Kwaśna, H.; Bateman, G.L.; Ward, E. Determining species diversity of microfungal communities in forest tree roots by pure-culture isolation and DNA sequencing. Appl. Soil Ecol. 2008, 40, 44–56. [Google Scholar] [CrossRef] [Green Version]
- Allen, T.R.; Millar, T.; Berch, S.M.; Berbee, M.L. Culturing and direct DNA extraction find different fungi from the same ericoid mycorrhizal roots. New Phytol. 2003, 160, 255–272. [Google Scholar] [CrossRef]
- Siddique, A.B.; Khokon, A.M.; Unterseher, M. What do we learn from cultures in the omics age? High-throughput sequencing and cultivation of leaf-inhabiting endophytes from beech (Fagus sylvatica L.) revealed complementary community composition but similar correlations with local habitat conditions. MycoKeys 2017, 20, 1–16. [Google Scholar] [CrossRef] [Green Version]
- Dissanayake, A.J.; Purahong, W.; Wubet, T.; Hyde, K.D.; Zhang, W.; Xu, H.; Zhang, G.; Fu, C.; Liu, M.; Xing, Q.; et al. Direct comparison of culture-dependent and culture-independent molecular approaches reveal the diversity of fungal endophytic communities in stems of grapevine (Vitis vinifera). Fungal Divers. 2018, 90, 85–107. [Google Scholar] [CrossRef]
- Jayawardena, R.S.; Purahong, W.; Zhang, W.; Wubet, T.; Li, X.H.; Liu, M.; Zhao, W.; Hyde, K.D.; Liu, J.H.; Yan, J. Biodiversity of Fungi on Vitis vinifera L. Revealed by Traditional and High-Resolution Culture-Independent Approaches; Springer: Dodlerk, The Netherlands, 2018; Volume 90, ISBN 0123456789. [Google Scholar]
- Parmar, S.; Li, Q.; Wu, Y.; Li, X.; Yan, J.; Sharma, V.K.; Wei, Y.; Li, H. Endophytic fungal community of Dysphania ambrosioides from two heavy metal-contaminated sites: Evaluated by culture-dependent and culture-independent approaches. Microb. Biotechnol. 2018, 11, 1170–1183. [Google Scholar] [CrossRef]
- Heklau, H.; Schindler, N.; Buscot, F.; Eisenhauer, N.; Ferlian, O.; Prada Salcedo, L.D.; Bruelheide, H. Mixing tree species associated with arbuscular or ectotrophic mycorrhizae reveals dual mycorrhization and interactive effects on the fungal partners. Ecol. Evol. 2020. [Google Scholar]
- Huang, Y.; Chen, Y.; Castro-Izaguirre, N.; Baruffol, M.; Brezzi, M.; Lang, A.; Li, Y.; Härdtle, W.; von Oheimb, G.; Yang, X.; et al. Impacts of species richness on productivity in a large-scale subtropical forest experiment. Science 2018, 363, 80–83. [Google Scholar] [CrossRef] [Green Version]
- Bruelheide, H.; Nadrowski, K.; Assmann, T.; Bauhus, J.; Both, S.; Buscot, F.; Chen, X.Y.; Ding, B.; Durka, W.; Erfmeier, A.; et al. Designing forest biodiversity experiments: General considerations illustrated by a new large experiment in subtropical China. Methods Ecol. Evol. 2014, 5, 74–89. [Google Scholar] [CrossRef] [Green Version]
- Yang, X.; Haerdtle, W. Establishment success in a forest biodiversity and ecosystem functioning experiment in subtropical China (BEF-China) Establishment success in a forest biodiversity and ecosystem functioning experiment in subtropical China (BEF-China). Eur. J. For. Res. 2013, 132, 593–606. [Google Scholar] [CrossRef]
- Bai, J.; Lü, G.; Yu, L.; Liu, W.; Zhou, Y.; Sun, J.; Liang, J.; Luo, F. Flora Fungorum Sinicorum, Sphaeropsidales, Phoma, Phyllosticta; Science Press: Beijing, China, 2003; Volume 15, p. 2003. [Google Scholar]
- Braun, U.; Cook, R. Taxonomic Manual of the Erysiphales (Powdery Mildews); CBS-KNAW Fungal Biodiversity Centre: Utrecht, The Netherlands, 2012. [Google Scholar]
- Kiffer, E.; Morelet, M. The Deuteromycetes, Mitotic Fungi, Classification and Generic Keys; Science Publishers: Enfield, CT, USA, 2000. [Google Scholar]
- Nag Raj, T. Coelomycetous Anamorphs with Appendage-Bearing Conidia; Mycologue Publications: Waterloo, Belgium, 1993. [Google Scholar]
- Seifert, K.; Morgan-Jones, G.; Gams, W.; Kendrick, B. The Genera of Hyphomycetes; CBS Biodiversity Series 9; CBS-KNAW Fungal Biodiversity Centre: Utrecht, The Netherlands, 2011. [Google Scholar]
- Sutton, B. The Coelomycetes. Fungi Imperfecti with Pycnidia, Acervuli and Stromata; Commonwealth Mycological Institute: Richmond Keew, UK, 1980. [Google Scholar]
- Tai, F. Sylloge Fungorum Sinicorum; Science Press, Academia Sinica: Beijing, China, 1973. [Google Scholar]
- Braun, U.; Bien, S.; Hönig, L.; Heuchert, B. Periconiella liquidambaricola. Mycotaxon 2015, 130, 253–258. [Google Scholar] [CrossRef]
- Braun, U.; Bien, S. Tubakia chinensis sp. nov. and a key to the species of the genus Tubakia. Schlechtendalia 2014, 28, 23–28. [Google Scholar]
- Martin, M. Cutadapt removes adapter sequences from high-throughput sequencing reads. EMBnet. J. 2013, 17. [Google Scholar] [CrossRef]
- Rognes, T.; Flouri, T.; Nichols, B.; Quince, C.; Mahé, F. VSEARCH: A versatile open source tool for metagenomics. PeerJ 2016, 2016, 1–22. [Google Scholar] [CrossRef] [PubMed]
- Nguyen, N.H.; Song, Z.; Bates, S.T.; Branco, S.; Tedersoo, L.; Menke, J.; Schilling, J.S.; Kennedy, P.G. FUNGuild: An open annotation tool for parsing fungal community datasets by ecological guild. Fungal Ecol. 2016, 20, 241–248. [Google Scholar] [CrossRef]
- Kuznetsova, A.; Brockhoff, P.B.; Christensen, R.H.B. lmerTest Package: Tests in Linear Mixed Effects Models. J. Stat. Softw. 2017, 82. [Google Scholar] [CrossRef] [Green Version]
- Dormann, C.F.; Frund, J.; Bluthgen, N.; Gruber, B. Indices, Graphs and Null Models: Analyzing Bipartite Ecological Networks. Open Ecol. J. 2009, 2, 7–24. [Google Scholar] [CrossRef]
- Cappelli, S.L.; Pichon, N.A.; Kempel, A.; Allan, E. Sick plants in grassland communities: A growth-defense trade-off is the main driver of fungal pathogen abundance. Ecol. Lett. 2020, 23, 1349–1359. [Google Scholar] [CrossRef] [PubMed]
- Trogisch, S.; Schuldt, A.; Bauhus, J.; Blum, J.A.; Both, S.; Buscot, F.; Castro-Izaguirre, N.; Chesters, D.; Durka, W.; Eichenberg, D.; et al. Toward a methodical framework for comprehensively assessing forest multifunctionality. Ecol. Evol. 2017, 7, 10652–10674. [Google Scholar] [CrossRef] [Green Version]
- Mihaljevic, J.R.; Joseph, M.B.; Orlofske, S.A.; Paull, S.H. The scaling of host density with richness affects the direction, shape, and detectability of diversity-disease relationships. PLoS ONE 2014, 9. [Google Scholar] [CrossRef] [PubMed] [Green Version]
- Vega, F.E.; Simpkins, A.; Aime, M.C.; Posada, F.; Peterson, S.W.; Rehner, S.A.; Infante, F.; Castillo, A.; Arnold, A.E. Fungal endophyte diversity in coffee plants from Colombia, Hawai’i, Mexico and Puerto Rico. Fungal Ecol. 2010, 3, 122–138. [Google Scholar] [CrossRef]
- Hawksworth, D.L. Global species numbers of fungi: Are tropical studies and molecular approaches contributing to a more robust estimate? Biodivers. Conserv. 2012, 21, 2425–2433. [Google Scholar] [CrossRef]
- Barhoom, S.; Sharon, A. Bcl-2 proteins link programmed cell death with growth and morphogenetic adaptations in the fungal plant pathogen Colletotrichum gloeosporioides. Fungal Genet. Biol. 2007, 44, 32–43. [Google Scholar] [CrossRef] [PubMed]
- Weir, B.S.; Johnston, P.R.; Damm, U. The Colletotrichum gloeosporioides species complex. Stud. Mycol. 2012, 73, 115–180. [Google Scholar] [CrossRef] [Green Version]
- Wu, B.; Hussain, M.; Zhang, W.; Stadler, M.; Liu, X.; Xiang, M. Current insights into fungal species diversity and perspective on naming the environmental DNA sequences of fungi. Mycology 2018, 10, 127–140. [Google Scholar] [CrossRef] [Green Version]
- Nilsson, R.H.; Ryberg, M.; Abarenkov, K.; Sjökvist, E.; Kristiansson, E. The ITS region as a target for characterization of fungal communities using emerging sequencing technologies. FEMS Microbiol. Lett. 2009, 296, 97–101. [Google Scholar] [CrossRef]
- Huang, W.; Cai, Y.; Surveswaran, S.; Hyde, K.; Corke, H.; Sun, M. Molecular phylogenetic identification of endophytic fungi isolated from three Artemisia species. Fungal Divers. 2009. [Google Scholar]
- Broissin-Vargas, L.M.; Snell-Castro, R.; Godon, J.J.; González-Ríos, O.; Suárez-Quiroz, M.L. Impact of storage conditions on fungal community composition of green coffee beans Coffea arabica L. stored in jute sacks during 1 year. J. Appl. Microbiol. 2018, 124, 547–558. [Google Scholar] [CrossRef] [PubMed]
- Lauber, C.L.; Zhou, N.; Gordon, J.I.; Knight, R.; Fierer, N. Effect of storage conditions on the assessment of bacterial community structure in soil and human-associated samples. FEMS Microbiol. Lett. 2010, 307, 80–86. [Google Scholar] [CrossRef] [PubMed] [Green Version]


| Response Variables | ||||||||||||
|---|---|---|---|---|---|---|---|---|---|---|---|---|
| (a) Fungal Richness | (b) Fungal Infestation | (c) OTU Richness | (d) Pathogen OTU Richness | |||||||||
| Predictor Variables | F Value | p Value | AIC | F Value | p Value | AIC | F Value | p Value | AIC | F Value | p Value | AIC |
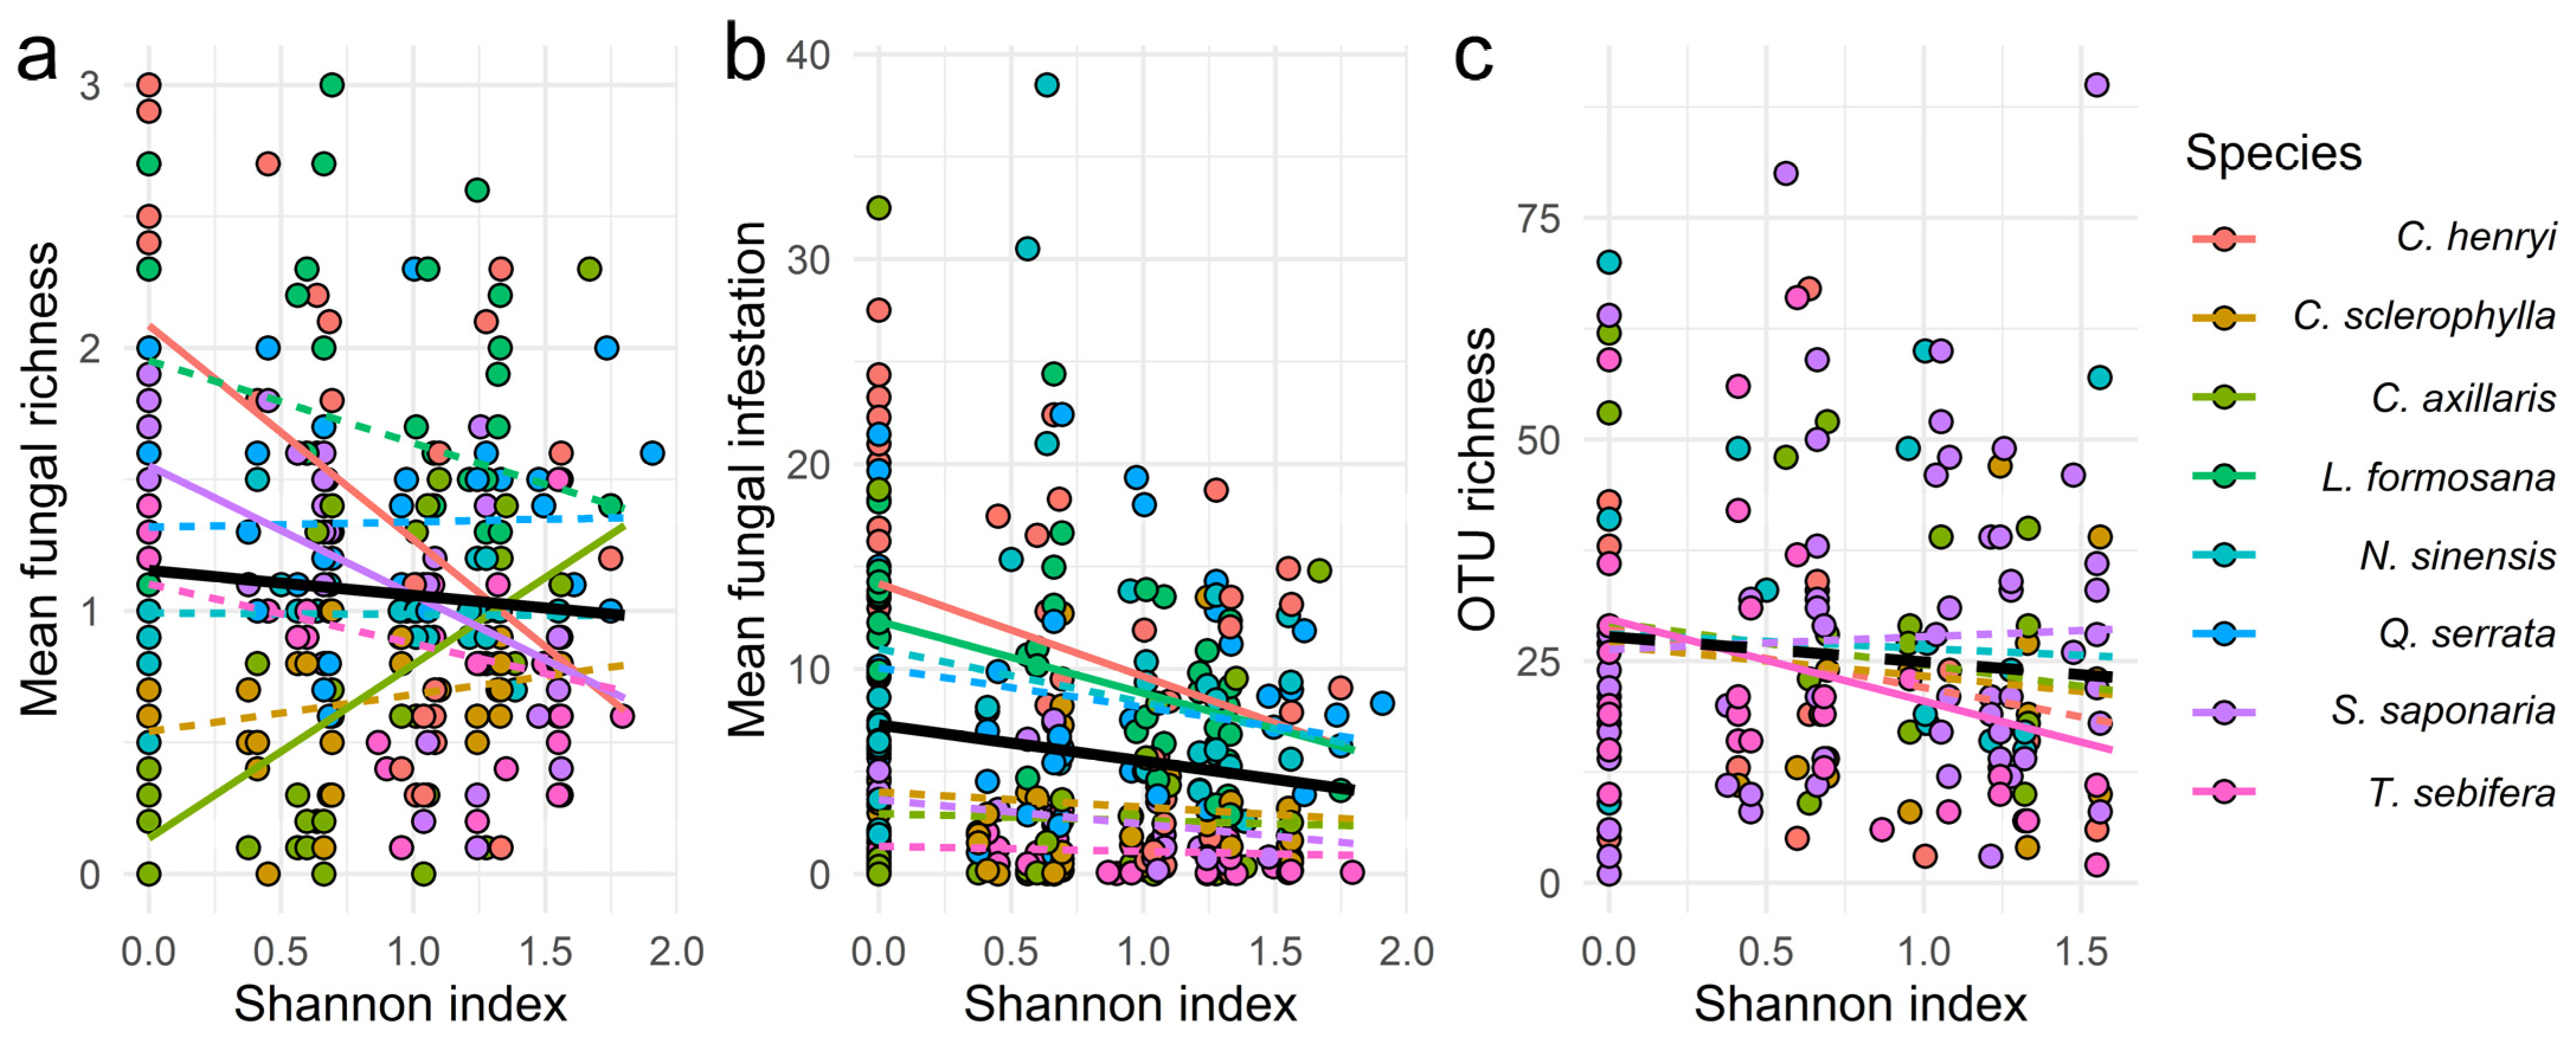
| Shannon div. | 4.82 | 0.0331 | 376.7 | 8.59 | 0.0042 | 1943.4 | 3.62 | 0.0645 | 1483.6 | 3.98 | 0.0517 | 1038.4 |
| Sp. | 18.35 | <0.0001 | 8.81 | <0.0001 | 1.43 | 0.2418 | 0.74 | 0.5975 | ||||
| Sp. × Shannon div. | 8.93 | <0.0001 | 1.96 | 0.0635 | 1.84 | 0.1262 | 1.45 | 0.2194 | ||||
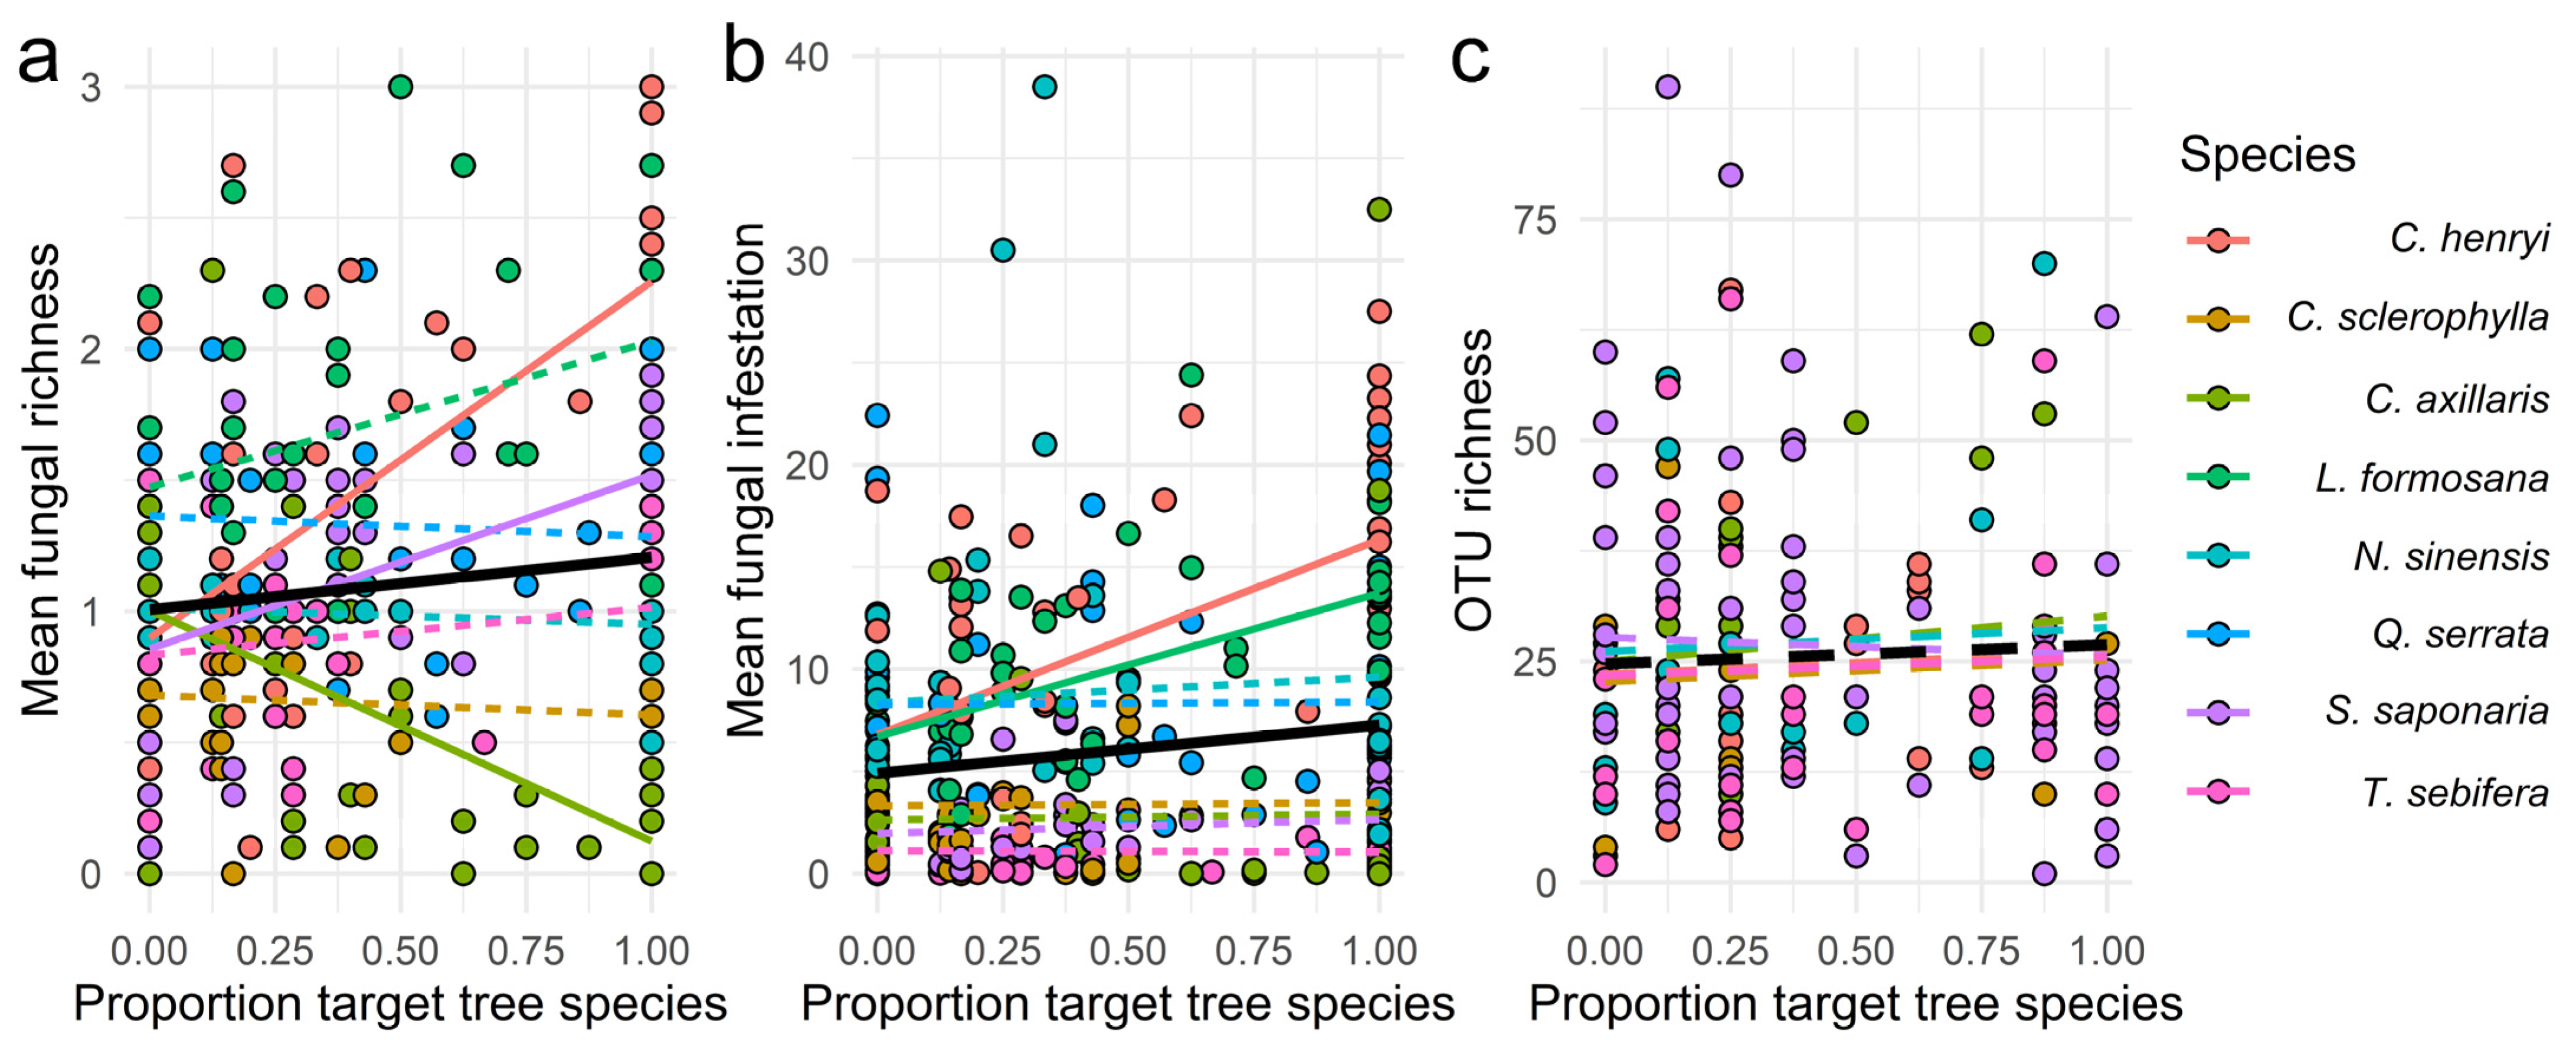
| Proportion of target tree | 6.39 | 0.0138 | 368.6 | 6.05 | 0.0154 | 1934 | 1.16 | 0.2875 | 1487.7 | 2.35 | 0.1310 | 1038.9 |
| Sp. | 8.07 | <0.0001 | 7.64 | <0.0001 | 1.16 | 0.3346 | 2.68 | 0.0264 | ||||
| Sp. × Proportion of target tree | 10.94 | <0.0001 | 3.42 | 0.0025 | 1.06 | 0.4023 | 1.53 | 0.2005 | ||||
| Response Variables | |||||||||||||
|---|---|---|---|---|---|---|---|---|---|---|---|---|---|
| (a) Mean Fungal Richness | (b) Mean Fungal Infestation | (c) OTU Richness | (d) Pathogen OTU Richness | ||||||||||
| Predictor Variables | Tree Species | Slope | Lower.CL | Upper.CL | Slope | Lower.CL | Upper.CL | Slope | Lower.CL | Upper.CL | Slope | Lower.CL | Upper.CL |
| Shannon div. | C. henryi | −0.8956 | −1.2200 | −0.5716 | −7.0420 | −10.880 | −3.2080 | −11.550 | −29.740 | 6.6400 | −3.5205 | −8.8400 | 1.8000 |
| C. sclerophylla | 0.1232 | −0.2050 | 0.4515 | −0.1020 | −3.9900 | 3.7910 | 5.2100 | −9.8200 | 20.240 | 0.0964 | −4.3700 | 4.5610 | |
| C. axillaris | 0.7420 | 0.4370 | 1.0467 | 0.5120 | −3.1000 | 4.1270 | −16.630 | −36.710 | 3.4500 | −4.7956 | −10.810 | 1.2190 | |
| L. formosana | −0.2835 | −0.5950 | 0.0282 | −4.4210 | −8.1300 | −0.7150 | _ | _ | _ | _ | _ | _ | |
| N. sinensis | −0.0088 | −0.3300 | 0.3127 | −1.9670 | −5.7800 | 1.8490 | −2.2600 | −18.170 | 13.650 | −0.0387 | −4.7000 | 4.6200 | |
| Q. serrata | 0.0645 | −0.2200 | 0.3489 | 0.1520 | −3.2100 | 3.5150 | _ | _ | _ | _ | _ | _ | |
| S. saponaria | −0.5462 | −0.8550 | −0.2377 | −2.6540 | −6.3000 | 0.9920 | 4.0500 | −7.0700 | 15.170 | 1.0171 | −2.3200 | 4.3520 | |
| T. sebifera | −0.2655 | −0.5780 | 0.0475 | −0.6080 | −4.3300 | 3.1140 | −16.380 | −31.590 | −1.1700 | −4.6167 | −9.1100 | −0.1220 | |
| Proportion of target tree | C. henryi | 1.5033 | 1.0258 | 1.9810 | 12.334 | 6.8000 | 17.870 | 5.4200 | −22.770 | 33.600 | 2.3690 | −5.4480 | 10.180 |
| C. sclerophylla | −0.0516 | −0.5797 | 0.4760 | −0.4090 | −6.5700 | 5.7500 | −1.9700 | −29.900 | 25.970 | 0.9990 | −7.0560 | 9.0500 | |
| C. axillaris | −0.9588 | −1.3567 | −0.5610 | 0.3180 | −4.3000 | 4.9400 | 24.290 | −3.7600 | 52.340 | 8.1890 | 0.1990 | 16.180 | |
| L. formosana | 0.4794 | −0.0368 | 0.9960 | 8.6380 | 2.6300 | 14.640 | _ | _ | _ | _ | _ | _ | |
| N. sinensis | −0.1039 | −0.6348 | 0.4270 | −1.0230 | −7.2200 | 5.1700 | 14.330 | −19.010 | 47.680 | 4.6770 | −4.8760 | 14.230 | |
| Q. serrata | −0.1692 | −0.6083 | 0.2700 | −2.0440 | −7.1400 | 3.0500 | _ | _ | _ | _ | _ | _ | |
| S. saponaria | 0.7642 | 0.2779 | 1.2510 | 0.9010 | −4.7300 | 6.5300 | −10.060 | −28.950 | 8.8200 | −3.8130 | −9.2600 | 1.6300 | |
| T. sebifera | 0.2105 | −0.2979 | 0.7190 | 0.2640 | −5.6600 | 6.1800 | 2.4700 | −20.880 | 25.830 | 1.6460 | −5.0890 | 8.3800 | |
Publisher’s Note: MDPI stays neutral with regard to jurisdictional claims in published maps and institutional affiliations. |
© 2021 by the authors. Licensee MDPI, Basel, Switzerland. This article is an open access article distributed under the terms and conditions of the Creative Commons Attribution (CC BY) license (http://creativecommons.org/licenses/by/4.0/).
Share and Cite
Saadani, M.; Hönig, L.; Bien, S.; Koehler, M.; Rutten, G.; Wubet, T.; Braun, U.; Bruelheide, H. Local Tree Diversity Suppresses Foliar Fungal Infestation and Decreases Morphological but Not Molecular Richness in a Young Subtropical Forest. J. Fungi 2021, 7, 173. https://0-doi-org.brum.beds.ac.uk/10.3390/jof7030173
Saadani M, Hönig L, Bien S, Koehler M, Rutten G, Wubet T, Braun U, Bruelheide H. Local Tree Diversity Suppresses Foliar Fungal Infestation and Decreases Morphological but Not Molecular Richness in a Young Subtropical Forest. Journal of Fungi. 2021; 7(3):173. https://0-doi-org.brum.beds.ac.uk/10.3390/jof7030173
Chicago/Turabian StyleSaadani, Mariem, Lydia Hönig, Steffen Bien, Michael Koehler, Gemma Rutten, Tesfaye Wubet, Uwe Braun, and Helge Bruelheide. 2021. "Local Tree Diversity Suppresses Foliar Fungal Infestation and Decreases Morphological but Not Molecular Richness in a Young Subtropical Forest" Journal of Fungi 7, no. 3: 173. https://0-doi-org.brum.beds.ac.uk/10.3390/jof7030173