1. Introduction
Genome-wide association studies (GWAS) play a critical role in identifying many loci for common diseases [
1] as well as complex traits [
2]. Over the past decade, the rapid increase in the number of GWAS provides an extraordinary opportunity to examine the potential impact of common and rare genetic variants on complex diseases [
3]. Two independent GWAS may identify two different single nucleotide polymorphisms (SNPs) in the same gene or region that are both significantly associated with the trait of interest [
4]. When determining whether these two signals are independent in GWAS, epistasis and SNP by SNP interactions are often not considered.
Epistasis is defined as the interaction between different genes or SNPs and refers to the departure from independence of the effect of different genetic loci on the disease or trait of interest [
5,
6]. There is a complex relationship with epistasis and linkage disequilibrium (LD) [
7,
8]. Multiple unobserved functional polymorphisms can lead to genotyped SNPs that do not properly represent the causal variants [
9] and high order LD can lead to spurious statistical epistatic associations [
10]. Strong LD may suggest that detected epistasis between pairs of SNPs in different association studies need to be interpreted with caution [
9,
10].
Given epistasis, it is important to consider SNP by SNP interactions when determining whether genetic signals in GWAS are considered independent. For example, if an SNP is associated with the trait of interest in a GWAS, an investigator may want to determine if this SNP is an independent signal or purely the result of a correlated SNP that was previously associated with the trait of interest. In order to determine if the two signals are independent, the most popular approaches are to fit a regression of the trait of interest with the novel SNP conditional on the previously identified SNP and/or calculate LD between the two SNPs.
Through simulation studies, we examined the impact of SNP by SNP interactions when determining whether two signals are independent in a GWAS. We have created the R package, called gxgRC, which implements these simulation studies for user specified parameters. In addition, we considered the role of SNP by SNP interactions when determining independence of signals for SNPs in the ARG1 gene and bronchodilator response in genetic association studies of asthma.
2. Materials and Methods
In the following simulation scenarios, we examined the impact of SNP by SNP interactions when determining the independence of two SNPs by regressing the trait of interest Y with the SNP
X1 conditional on the SNP
X2. We generated 1000 subjects for 5000 simulations using a significance level of 5*10
−8. SNP
X1 is generated from a binomial distribution with a binary genetic coding (i.e., dominant or recessive model) and
P(
X1 = 1) = 0.5. SNP
X2 is generated from a logistic regression based on
X1 such that:
where
and
. While
X1 and
X2 assume a binary genetic coding for simplicity, the results are generalizable to an additive genetic coding (i.e.,
Xj = 0, 1, 2 for j = 1, 2). The continuous outcome
Y is generated from a normal distribution with a variance of 1 and a mean such that
where
0,
or 0,
or 0, and
βI varies from 0.3 to 1 by 0.05. We considered additional simulation scenarios for different values for
,
in Equation (1) and
0,
,
in Equation (2). However, we observed similar results to the presented simulations scenarios; therefore, the results are not shown here.
After the data were simulated using Equations (1) and (2), we then fit 3 algorithms and tested the following null hypotheses for each algorithm:
Algorithm 0: Fitting , we tested to determine if the SNP is associated with the trait of interest Y.
Algorithm 1: Fitting to determine if the SNP is associated with the trait of interest Y conditional on the SNP .
Algorithm 2: Fitting , we tested to determine if there is an interaction of the 2 SNPs on the trait of interest Y.
Then, we determined when the following scenarios were true.
Scenario 1: Rejected Algorithm 0 , Algorithm 1 , and Algorithm 2 .
Scenario 2: Rejected Algorithm 0 and Algorithm 1 , but failed to reject for Algorithm 2.
Scenario 3: Rejected Algorithm 0 and Algorithm 2 , but failed to reject for Algorithm 1.
Scenario 4: Rejected Algorithm 0 , but failed to reject H0 for Algorithms 1 and 2.
Scenario 5: Failed to reject Algorithm 0
3. Results
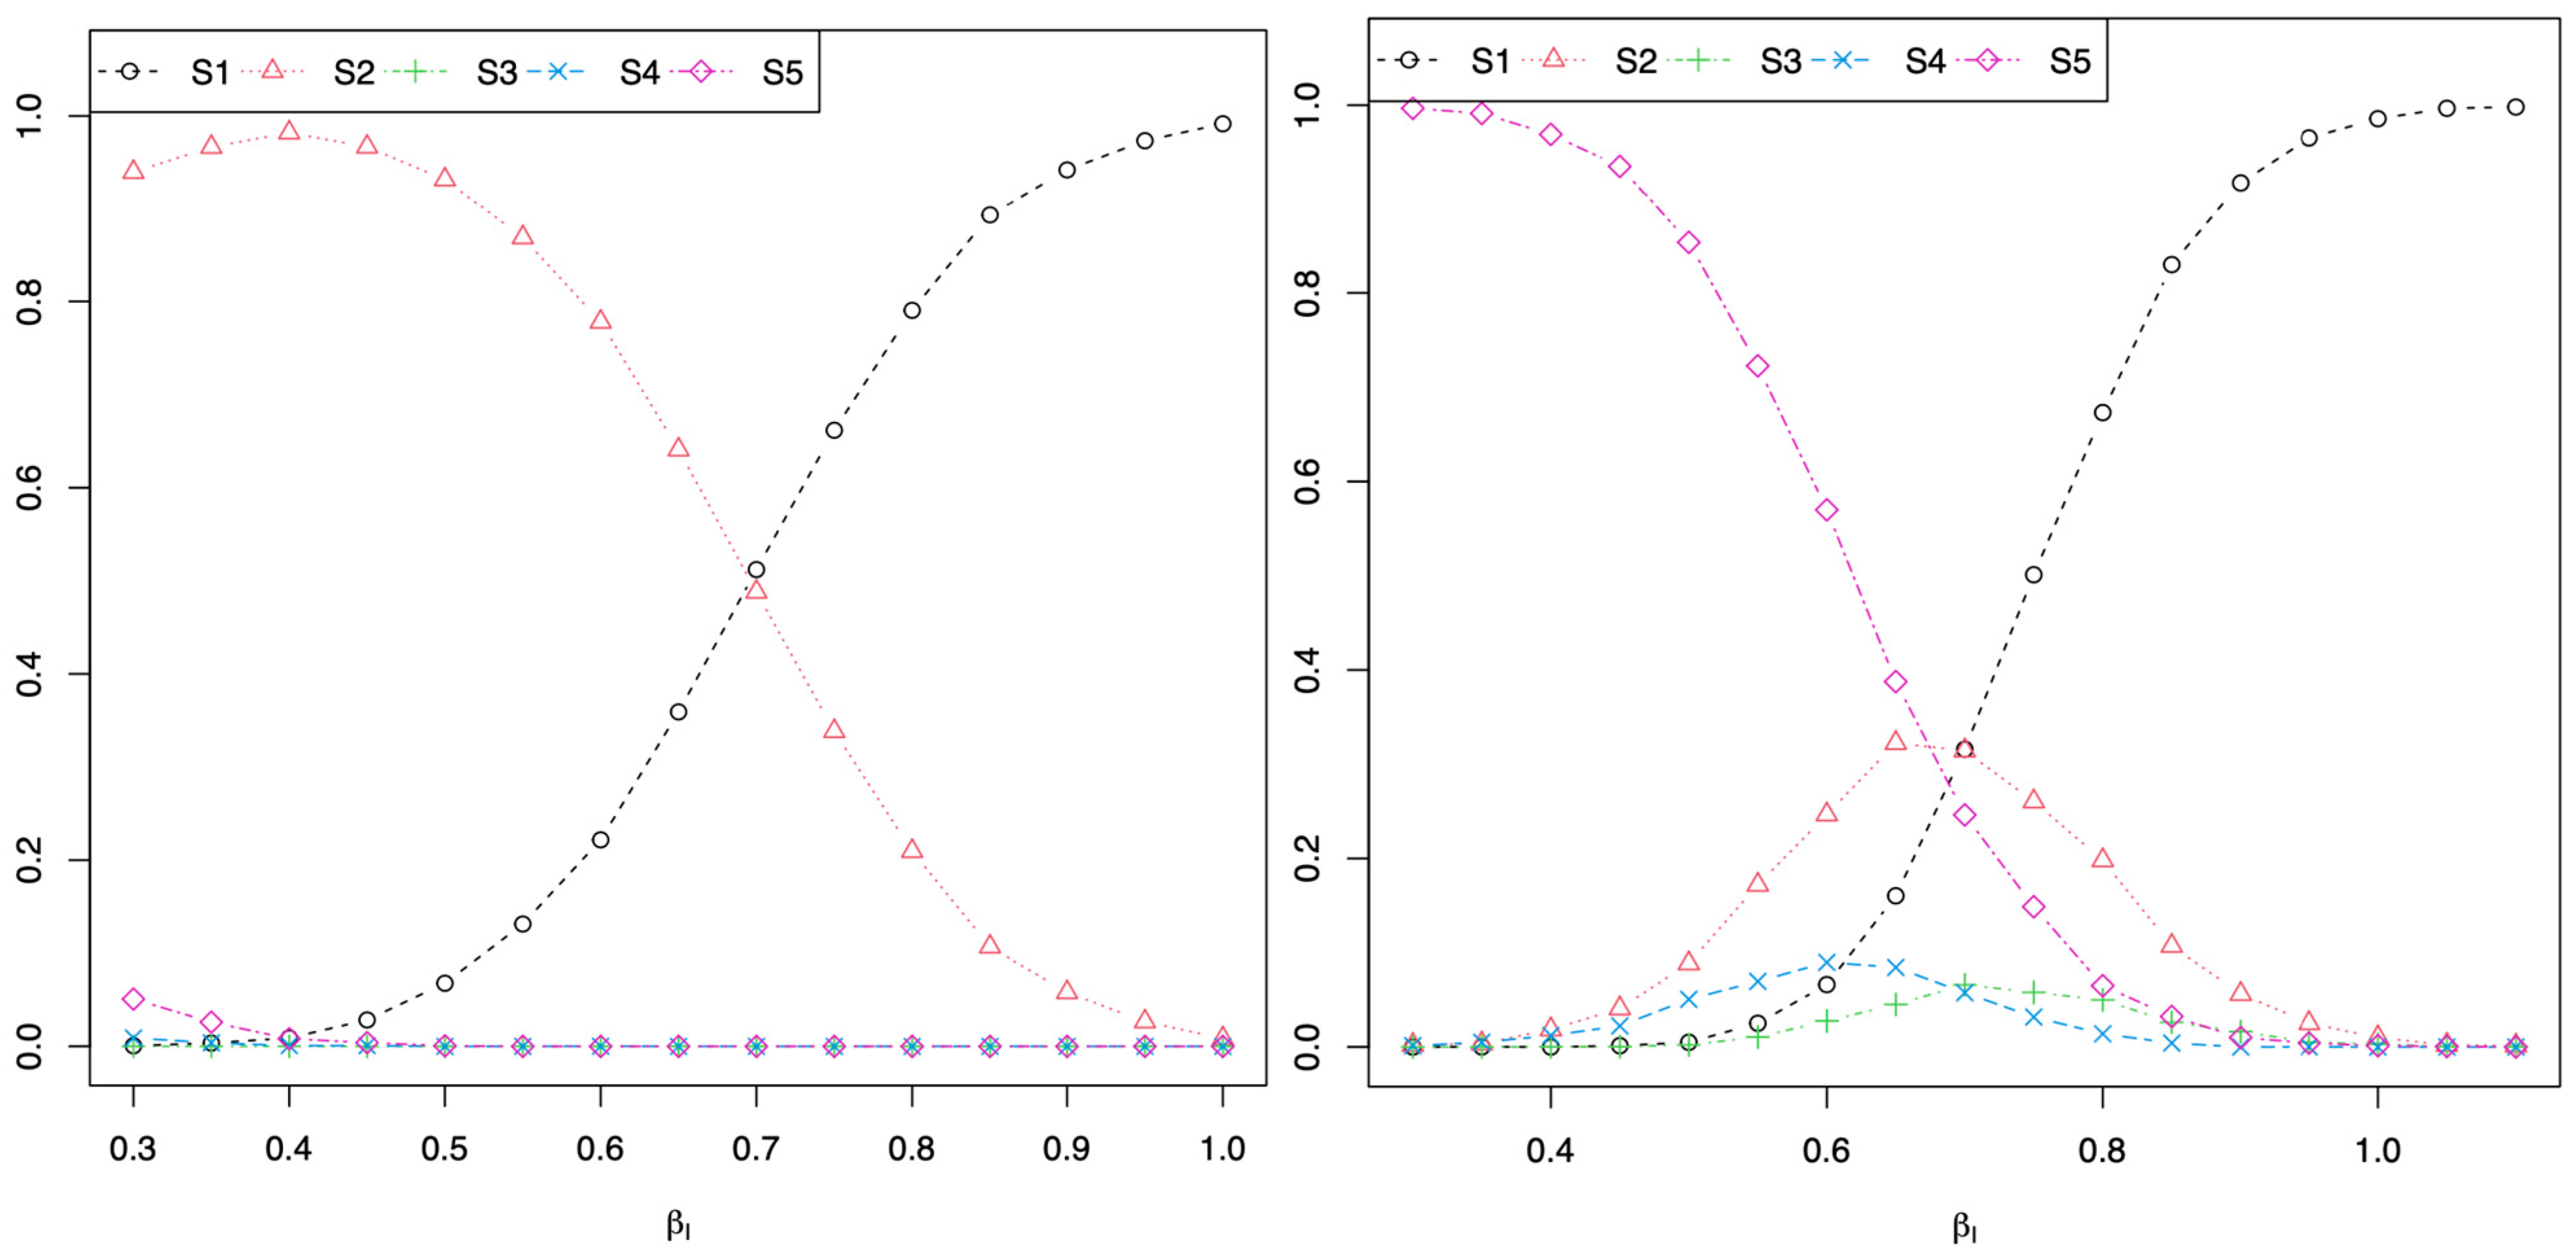
In
Figure 1,
and
in Equation (2) for the plot on the left and
and
in Equation (2) for the plot on the right. For both plots and simulations, when a stronger interaction between the two SNPs is generated (i.e.,
βI closer to 1 in Equation (2)), the majority of simulations concluded scenario 1: rejecting Algorithm 0
, Algorithm 1
, and Algorithm 2
. These simulations show that there can be a significant association between the SNP
and the trait of interest Y in Algorithm 0, and the SNP
is still significantly associated with the trait of interest Y when conditioning on the SNP
in Algorithm 1. However, there is a significant interaction between the two SNPs in Algorithm 2. This shows that if a researcher were to use Algorithm 1 to conclude that the two SNPs are independent since the SNP
is significantly associated with the trait of interest Y conditional on the SNP
, a false conclusion would be reached because there is a significant interaction of the two SNPs on the trait Y in Algorithm 2 and as generated by the data using Equation (2), such that
. These simulations demonstrate that it is not sufficient to consider independence of two genetic signals by considering Algorithm 1:
. One needs to also consider if there is a significant SNP by SNP interaction by fitting Algorithm 2:
and testing
.
4. Data Analysis
To illustrate the effect of SNP by SNP interactions when determining conditional independence of genetic signals, we considered SNPs in chromosome 6 [
ARG1], which has previously been associated with bronchodilator response (BDR) in asthma [
11]. In the CAMP (
N = 560) [
12], CARE (
N = 206) [
13,
14], and LODO (
N = 126) [
15] cohorts, we used weighted least squares regression to examine the conditional effect of four SNPs in the
ARG1 gene on BDR among subjects of European ancestry (total
N = 892) adjusting for cohort, age, sex, body mass index (BMI) as a categorical variable (obese, overweight, vs. normal/underweight), and genetic ancestry. We picked these covariates based on other studies of BDR [
16,
17,
18], as BDR has been found to differ depending on age [
19,
20], sex [
21] and BMI [
22]. Three of these SNPs are common variants that have previously been associated with BDR (rs2781659, rs2781663, rs2781665) [
11] and one SNP (rs185631674) is a rare variant in the region.
Based on previous studies [
11], rs2781659 had the most significant association with BDR in
AGR1. In our cohorts, rs2781659 was associated with BDR adjusting for cohort, age, sex, BMI as a categorical variable (obese, overweight, vs. normal/underweight), and genetic ancestry (minor allele frequency (MAF) = 0.32, Beta = −0.15, sd = 0.05,
p-value = 0.0037). In order to determine if the association of rs2781659 with BDR is independent of the other three SNPs, we considered the following algorithms:
Algorithm 1:
Algorithm 2: and
where C is a vector of the covariates: cohort, age, sex, BMI as a categorical variable (obese, overweight, vs. normal/underweight), and genetic ancestry.
As seen in
Table 1, the association between rs2781659 and BDR was still significant when conditioning on rs2781663 (
p = 0.003) and rs185631674 (
p = 0.004) but not when conditioning on rs2781665 (
p = 0.78). The SNP by SNP interaction on BDR was marginally significant for rs2781663 (
p = 0.06) and rs2781665 (
p = 0.06), and significant for rs185631674 (
p = 0.03). However, rs2781659 is in LD with rs2781663 (
r2 = 0.995) and rs2781665 (
r2 = 0.891) and rs185631674 is a rare variant in a study with a small sample size (
N = 892).
This shows that if a researcher were to only consider Algorithm 1, where the association of rs2781659 with BDR is still significant conditioning on rs2781663 and rs185631674, the researcher would falsely conclude that there is more than one independent genetic signal with BDR. This false conclusion would not be reached with the SNP by SNP interaction considered in Algorithm 2 as well as the LD as measured by r2. This also shows that special consideration needs to be given to rare variants.
5. Discussion
Through simulation studies and a data analysis of SNPs in
ARG1 with BDR, we demonstrate that it is not sufficient to consider independence of two genetic signals by considering Algorithm 1:
. One needs to also consider whether there is a significant SNP by SNP interaction by fitting Algorithm 2:
and testing
and/or calculating an estimate of LD, such as
r2 or D’. Also, prior knowledge, for example protein–protein interactions or biological pathways, should be considered when examining SNP by SNP interactions [
23].
There are some potential limitations for our simulation studies and data analysis. For the data analysis, all subjects are of European origin. A more diverse population could provide varying results, which should be considered for future analyses. Additionally, our data analysis considered genetic association studies of asthma but there is opportunity to explore the role of SNP by SNP interactions in conditional analyses by examining other diseases or traits. The sample size for the data analysis was relatively moderate (
n = 892). Since the power to detect an interaction is substantially smaller than detecting a main effect, it should be noted that a larger sample size may be needed or the study may be underpowered to detect SNP by SNP interactions. While we have only presented two simulation studies here, we have created an R package on Github called gxgRC (
https://github.com/SharonLutz/gxgRC (accessed on 12 December 2020)) [
24] to generate similar simulations based on user input.
Understanding the role of epistasis and SNP by SNP interactions is important for the development of pharmacogenetic tests and personalized medicine. To date, studies in asthma pharmacogenetics have not resulted in clinical practice changes; however, exploring the role of SNP by SNP interactions has the potential to increase the likelihood of translatable findings.
Author Contributions
Conceptualization, S.M.L. and C.L.; methodology, S.M.L.; software, S.M.L.; formal analysis, K.V.; writing—original draft preparation, S.M.L. and R.W.; writing—review and editing, S.M.L., R.W., K.V., M.-L.M., M.M., J.E.S., C.L. and A.C.W.; supervision, S.M.L., A.C.W. and C.L. All authors have read and agreed to the published version of the manuscript.
Funding
This research was funded by the Eunice Kennedy Shriver National Institute of Child Health and Human Development grant number R01HD085993. S.M.L. was supported by K01HL125858. M.M. was supported by R01HL139634.
Institutional Review Board Statement
All study procedures were approved by the respective Institutional Review Boards of each consortium and the Brigham and Women’s Hospital.
Informed Consent Statement
Informed consent was obtained from all subjects involved in the studies.
Data Availability Statement
Conflicts of Interest
The authors have no conflicts of interests to disclose.
References
- Castaldi, P.J.; Dy, J.; Ross, J.; Chang, Y.; Washko, G.R.; Curran-Everett, D.; Williams, A.; Lynch, D.A.; Make, B.J.; Crapo, J.D.; et al. Cluster analysis in the COPDGene study identifies subtypes of smokers with distinct patterns of airway disease and emphysema. Thorax 2014, 69, 415–422. [Google Scholar] [CrossRef] [PubMed] [Green Version]
- Nicolae, D.L.; Gamazon, E.; Zhang, W.; Duan, S.; Dolan, M.E.; Cox, N.J. Trait-associated SNPs are more likely to be eQTLs: Annotation to enhance discovery from GWAS. PLoS Genet. 2010, 6, e1000888. [Google Scholar] [CrossRef]
- Hindorff, L.A.; Sethupathy, P.; Junkins, H.A.; Ramos, E.M.; Mehta, J.P.; Collins, F.S.; Manolio, T.A. Potential etiologic and functional implications of genome-wide association loci for human diseases and traits. Proc. Natl. Acad. Sci. USA 2009, 106, 9362–9367. [Google Scholar] [CrossRef] [PubMed] [Green Version]
- Hind, J.; Lisboa, P.; Hussain, A.; Al-Jumeily, D. A Novel Approach to Detecting Epistasis using Random Sampling Regularisation. IEEE/ACM Trans. Comput. Biol. Bioinform 2019. [Google Scholar] [CrossRef] [PubMed] [Green Version]
- Cordell, H.J. Epistasis: What it means, what it doesn’t mean, and statistical methods to detect it in humans. Hum. Mol. Genet. 2002, 11, 2463–2468. [Google Scholar] [CrossRef] [Green Version]
- Li, P.; Guo, M.; Wang, C.; Liu, X.; Zou, Q. An overview of SNP interactions in genome-wide association studies. Breifings Funct. Genom. 2014, 14, 143–155. [Google Scholar] [CrossRef] [PubMed] [Green Version]
- Platt, A.; Vilhjálmsson, B.J.; Nordborg, M. Conditions under which genome-wide association studies will be positively misleading. Genetics 2010, 186, 1045–1052. [Google Scholar] [CrossRef] [Green Version]
- Zan, Y.; Forsberg, S.K.G.; Carlborg, Ö. On the Relationship Between High-Order Linkage Disequilibrium and Epistasis. G3 2018, 8, 2817–2824. [Google Scholar] [CrossRef] [Green Version]
- Wood, A.R.; Tuke, M.A.; Nalls, M.A.; Hernandez, D.G.; Bandinelli, S.; Singleton, A.B.; Melzer, D.; Ferrucci, L.; Frayling, T.M.; Weedon, M.N. Another explanation for apparent epistasis. Nature 2014, 514, E3–E5. [Google Scholar] [CrossRef] [PubMed]
- de Los Campos, G.; Sorensen, D.A.; Toro, M.A. Imperfect Linkage Disequilibrium Generates Phantom Epistasis (& Perils of Big Data). G3 2019, 9, 1429–1436. [Google Scholar] [CrossRef] [Green Version]
- Litonjua, A.A.; Lasky-Su, J.; Schneiter, K.; Tantisira, K.G.; Lazarus, R.; Klanderman, B.; Lima, J.J.; Irvin, C.G.; Peters, S.P.; Hanrahan, J.P.; et al. ARG1 is a novel bronchodilator response gene: Screening and replication in four asthma cohorts. Am. J. Respir. Crit. Care Med. 2008, 178, 688–694. [Google Scholar] [CrossRef] [PubMed] [Green Version]
- The Childhood Asthma Management Program (CAMP). Design, rationale, and methods. Childhood Asthma Management Program Research Group. Control. Clin. Trials 1999, 20, 91. [Google Scholar] [CrossRef]
- Sorkness, C.A.; Lemanske, R.F., Jr.; Mauger, D.T.; Boehmer, S.J.; Chinchilli, V.M.; Martinez, F.D.; Strunk, R.C.; Szefler, S.J.; Zeiger, R.S.; Bacharier, L.B.; et al. Long-term comparison of 3 controller regimens for mild-moderate persistent childhood asthma: The Pediatric Asthma Controller Trial. J. Allergy Clin. Immunol. 2007, 119, 64–72. [Google Scholar] [CrossRef]
- Zeiger, R.S.; Szefler, S.J.; Phillips, B.R.; Schatz, M.; Martinez, F.D.; Chinchilli, V.M.; Lemanske, R.F., Jr.; Strunk, R.C.; Larsen, G.; Spahn, J.D.; et al. Response profiles to fluticasone and montelukast in mild-to-moderate persistent childhood asthma. J. Allergy Clin. Immunol. 2006, 117, 45–52. [Google Scholar] [CrossRef] [PubMed]
- American Lung Association Asthma Clinical Research Centers. Clinical trial of low-dose theophylline and montelukast in patients with poorly controlled asthma. Am. J. Respir. Crit. Care Med. 2007, 175, 235–242. [Google Scholar] [CrossRef] [PubMed]
- Spear, M.L.; Hu, D.; Pino-Yanes, M.; Huntsman, S.; Eng, C.; Levin, A.M.; Ortega, V.E.; White, M.J.; McGarry, M.E.; Thakur, N.; et al. A genome-wide association and admixture mapping study of bronchodilator drug response in African Americans with asthma. Pharmacogenom. J. 2019, 19, 249–259. [Google Scholar] [CrossRef] [PubMed]
- Mak, A.C.Y.; White, M.J.; Eckalbar, W.L.; Szpiech, Z.A.; Oh, S.S.; Pino-Yanes, M.; Hu, D.; Goddard, P.; Huntsman, S.; Galanter, J.; et al. Whole-Genome Sequencing of Pharmacogenetic Drug Response in Racially Diverse Children with Asthma. Am. J. Respir. Crit. Care Med. 2018, 197, 1552–1564. [Google Scholar] [CrossRef]
- Sordillo, J.E.; McGeachie, M.; Lutz, S.M.; Lasky-Su, J.; Tantisira, K.; Tsai, C.H.; Dahlin, A.; Kelly, R.; Wu, A.C. Longitudinal analysis of bronchodilator response in asthmatics and effect modification of age-related trends by genotype. Pediatr. Pulmonol. 2019, 54, 158–164. [Google Scholar] [CrossRef]
- Wu, A.C.; Tantisira, K.; Li, L.; Schuemann, B.; Weiss, S.; Childhood Asthma Management Program Research Group. Repeatability of response to asthma medications. J. Allergy Clin. Immunol. 2009, 123, 385–390. [Google Scholar] [CrossRef] [Green Version]
- McGeachie, M.J.; Yates, K.P.; Zhou, X.; Guo, F.; Sternberg, A.L.; Van Natta, M.L.; Wise, R.A.; Szefler, S.J.; Sharma, S.; Kho, A.T.; et al. Patterns of Growth and Decline in Lung Function in Persistent Childhood Asthma. N. Engl. J. Med. 2016, 374, 1842–1852. [Google Scholar] [CrossRef] [PubMed]
- Tuomisto, L.E.; Ilmarinen, P.; Lehtimäki, L.; Tommola, M.; Kankaanranta, H. Immediate bronchodilator response in FEV1 as a diagnostic criterion for adult asthma. Eur. Respir. J. 2019, 53. [Google Scholar] [CrossRef] [PubMed]
- McGarry, M.E.; Castellanos, E.; Thakur, N.; Oh, S.S.; Eng, C.; Davis, A.; Meade, K.; LeNoir, M.A.; Avila, P.C.; Farber, H.J.; et al. Obesity and bronchodilator response in black and Hispanic children and adolescents with asthma. Chest 2015, 147, 1591–1598. [Google Scholar] [CrossRef] [PubMed] [Green Version]
- Fang, G.; Wang, W.; Paunic, V.; Heydari, H.; Costanzo, M.; Liu, X.; Liu, X.; Vandersluis, B.; Oately, B.; Steinbach, M.; et al. Discovering genetic interactions bridging pathways in genome-wide association studies. Nat. Commun. 2019, 10, 1–18. [Google Scholar] [CrossRef] [PubMed] [Green Version]
- GitHub—SharonLutz/gxgRC. Available online: https://github.com/SharonLutz/gxgRC (accessed on 12 December 2020).
| Publisher’s Note: MDPI stays neutral with regard to jurisdictional claims in published maps and institutional affiliations. |
© 2021 by the authors. Licensee MDPI, Basel, Switzerland. This article is an open access article distributed under the terms and conditions of the Creative Commons Attribution (CC BY) license (http://creativecommons.org/licenses/by/4.0/).


 and
and 
