
Decreased Tongue Pressure Associated with Aging, Chewing and Swallowing Difficulties of Community-Dwelling Older Adults in Taiwan

 , , , ,
Abstract
:1. Introduction
2. Methods
2.1. Study Design and Population
2.1.1. Study Design
2.1.2. Sample Size
2.1.3. Sample Selection and Randomization
2.1.4. Ethical Approval
2.2. Data Collection Methods
2.2.1. Questionnaire Interview and Swallowing Assessment
2.2.2. Oral Examination
2.2.3. Tongue Pressure Measurement
2.3. Statistical Analysis
3. Results
4. Discussion
5. Conclusions
Author Contributions
Funding
Data Availability Statement
Conflicts of Interest
References
- Lin, Y.Y.; Huang, C.S. Aging in Taiwan: Building a Society for Active Aging and Aging in Place. Gerontologist 2016, 56, 176–183. [Google Scholar] [CrossRef] [PubMed] [Green Version]
- National Development Council. Population Projections for the R.O.C. (Taiwan): 2020~2070. Available online: https://www.ndc.gov.tw/en/cp.aspx?n=2E5DCB04C64512CC (accessed on 18 May 2021).
- Hsu, H.C.; Chen, C.F. LTC 2.0: The 2017 reform of home- and community-based long-term care in Taiwan. Health Policy 2019, 123, 912–916. [Google Scholar] [CrossRef] [PubMed]
- Tamine, K.; Ono, T.; Hori, K.; Kondoh, J.; Hamanaka, S.; Maeda, Y. Age-related changes in tongue pressure during swallowing. J. Dent. Res. 2010, 89, 1097–1101. [Google Scholar] [CrossRef] [PubMed]
- Castell, M.V.; Sánchez, M.; Julián, R.; Queipo, R.; Martín, S.; Otero, Á. Frailty prevalence and slow walking speed in persons age 65 and older: Implications for primary care. BMC Fam. Pract. 2013, 14, 86. [Google Scholar] [CrossRef] [Green Version]
- Fei, T.; Polacco, R.C.; Hori, S.E.; Molfenter, S.M.; Peladeau-Pigeon, M.; Tsang, C.; Steele, C.M. Age-related differences in tongue-palate pressures for strength and swallowing tasks. Dysphagia 2013, 28, 575–581. [Google Scholar] [CrossRef] [Green Version]
- Park, J.S.; Oh, D.H.; Chang, M. Comparison of maximal tongue strength and tongue strength used during swallowing in relation to age in healthy adults. J. Phys. Ther. Sci. 2016, 28, 442–445. [Google Scholar] [CrossRef] [Green Version]
- Wang, T.G.; Chen, S.Y.; Lian, Y.N.; Huang, S.F. Swallowing Disorder in the Elderly of a Taipei Community. J. Formos. Med. Assoc. 2001, 5, 523–529. [Google Scholar]
- Lin, L.C.; Wu, S.C.; Chen, H.S.; Wang, T.G.; Chen, M.Y. Prevalence of impaired swallowing in institutionalized older people in Taiwan. J. Am. Geriatr. Soc. 2002, 50, 1118–1123. [Google Scholar] [CrossRef]
- Hiramatsu, T.; Kataoka, H.; Osaki, M.; Hagino, H. Effect of aging on oral and swallowing function after meal consumption. Clin. Interv. Aging 2015, 10, 229–235. [Google Scholar]
- Hara, K.; Tohara, H.; Kenichiro, K.; Yamaguchi, K.; Ariya, C.; Yoshimi, K.; Nakane, A.; Minakuchi, S. Association between tongue muscle strength and masticatory muscle strength. J. Oral Rehabil. 2019, 46, 134–139. [Google Scholar] [CrossRef]
- Nicosia, M.A.; Hind, J.A.; Roecker, E.B.; Carnes, M.; Doyle, J.; Dengel, G.A.; Robbins, J. Age effects on the temporal evolution of isometric and swallowing pressure. J. Gerontol. A Biol. Sci. Med. Sci. 2000, 55, 634–640. [Google Scholar] [CrossRef]
- Pizzorni, N.; Ginocchio, D.; Bianchi, F.; Feroldi, S.; Vedrodyova, M.; Mora, G.; Schindler, A. Association between maximum tongue pressure and swallowing safety and efficacy in amyotrophic lateral sclerosis. Neurogastroenterol. Motil. 2020, 32, e13859. [Google Scholar] [CrossRef] [Green Version]
- Higa, C.; Mori, T.; Hiraoka, A.; Takeda, C.; Kuroki, A.; Yoshikawa, M.; Yoshida, M.; Tsuga, K. Five-year change in maximum tongue pressure and physical function in community-dwelling elderly adults. J. Dent. Sci. 2020, 15, 265–269. [Google Scholar] [CrossRef] [PubMed]
- Yamanashi, H.; Shimizu, Y.; Higashi, M.; Koyamatsu, J.; Sato, S.; Nagayoshi, M.; Kadota, K.; Kawashiri, S.; Tamai, M.; Takamura, N. Validity of maximum isometric tongue pressure as a screening test for physical frailty: Cross-sectional study of Japanese community-dwelling older adults. Geriatr. Gerontol. Int. 2018, 18, 240–249. [Google Scholar] [CrossRef] [PubMed]
- Adams, V.; Mathisen, B.; Baines, S.; Lazarus, C.; Callister, R. A systematic review and meta-analysis of measurements of tongue and hand strength and endurance using the Iowa Oral Performance Instrument (IOPI). Dysphagia 2013, 28, 350–369. [Google Scholar] [CrossRef]
- Utanohara, Y.; Hayashi, R.; Yoshikawa, M.; Yoshida, M.; Tsuga, K.; Akagawa, Y. Standard values of maximum tongue pressure taken using newly developed disposable tongue pressure measurement device. Dysphagia 2008, 23, 286. [Google Scholar] [CrossRef]
- Arakawa, I.; Igarashi, K.; Imamura, Y.; Müller, F.; Abou-Ayash, S.; Schimmel, M. Variability in tongue pressure among elderly and young healthy cohorts: A systematic review and meta-analysis. J. Oral Rehabil. 2021, 48, 430–448. [Google Scholar] [CrossRef] [PubMed]
- Fujishima, I.; Fujiu-Kurachi, M.; Arai, H.; Hyodo, M.; Kagaya, H.; Maeda, K.; Mori, T.; Nishioka, S.; Oshima, F.; Ogawa, S. Sarcopenia and dysphagia: Position paper by four professional organizations. Geriatr. Gerontol. Int. 2019, 19, 91–97. [Google Scholar] [CrossRef] [Green Version]
- Luchesi, K.F.; Kitamura, S.; Mourão, L.F. Management of dysphagia in Parkinson’s disease and amyotrophic lateral sclerosis. Codas 2013, 25, 358–364. [Google Scholar] [CrossRef] [Green Version]
- Center for Survey Research, Research Center for Humanities and Social Sciences, Academia Sinica. The Typology of Townships in Taiwan 2014. Available online: https://survey.sinica.edu.tw/research/document/01_2_2014.pdf (accessed on 18 May 2021).
- Adam, A.M. Sample size determination in survey research. J. Sci. Res. Rep. 2020, 26, 90–97. [Google Scholar] [CrossRef]
- Krejcie, R.V.; Morgan, D.W. Determining sample size for research activities. Educ. Psychol. Meas. 1970, 30, 607–610. [Google Scholar] [CrossRef]
- Liu, H.Y.; Chen, C.C.; Hu, W.C.; Tang, R.C.; Chen, C.C.; Tsai, C.C.; Huang, S.T. The impact of dietary and tooth-brushing habits to dental caries of special school children with disability. Res. Dev. Disabil. 2010, 31, 1160–1169. [Google Scholar] [CrossRef] [PubMed]
- Belafsky, P.C.; Mouadeb, D.A.; Rees, C.J.; Pryor, J.C.; Postma, G.N.; Allen, J.; Leonard, R.J. Validity and reliability of the Eating Assessment Tool (EAT-10). Ann. Otol. Rhinol. Laryngol. 2008, 117, 919–924. [Google Scholar] [CrossRef] [PubMed]
- Minakuchi, S.; Tsuga, K.; Ikebe, K.; Ueda, T.; Tamura, F.; Nagao, K.; Furuya, J.; Matsuo, K.; Yamamoto, K.; Kanazawa, M.; et al. Oral hypofunction in the older population: Position paper of the Japanese Society of Gerodontology in 2016. Gerodontology 2018, 35, 317–324. [Google Scholar] [CrossRef] [PubMed]
- Oguchi, K.; Saitoh, E.; Mizuno, M.; Baba, M.; Okui, M.; Suzuki, M. The repetitive saliva swallowing test (RSST) as a screening test of functional dysphagia. (1). Normal values of RSST. Jpn. J. Rehabil. Med. 2000, 37, 375–382. [Google Scholar] [CrossRef]
- World Health Organization. Oral Health Surveys-Basic Methods, 5th ed.; World Health Organization: Geneva, Switzerland, 2013. [Google Scholar]
- Hsu, K.J.; Lee, H.E.; Wu, Y.M.; Lan, S.J.; Huang, S.T.; Yen, Y.Y. Masticatory factors as predictors of oral health-related quality of life among elderly people in Kaohsiung City, Taiwan. Qual. Life Res. 2014, 23, 1395–1405. [Google Scholar] [CrossRef]
- Maekawa, K.; Ikeuchi, T.; Shinkai, S.; Hirano, H.; Ryu, M.; Tamaki, K.; Yatani, H.; Kuboki, T.; Kimura-Ono, A.; Kikutani, T.; et al. Number of functional teeth more strongly predicts all-cause mortality than number of present teeth in Japanese older adults. Geriatr. Gerontol. Int. 2020, 20, 607–614. [Google Scholar] [CrossRef] [PubMed]
- Suma, S.; Naito, M.; Wakai, K.; Naito, T.; Kojima, M.; Umemura, O.; Yokota, M.; Hanada, N.; Kawamura, T. Tooth loss and pneumonia mortality: A cohort study of Japanese dentists. PLoS ONE 2018, 13, e0195813. [Google Scholar] [CrossRef] [Green Version]
- Liu, H.Y.; Chen, C.H.; Kuo, C.H.; Feng, M.C.; Chen, J.H.; Wang, H.W.; Chen, K.C.; Lin, C.L. A Novel Tongue Pressure Measurement Instrument with Wireless Mobile Application Control Function and Disposable Positioning Mouthpiece. Diagnostics (Basel) 2021, 11, 489. [Google Scholar] [CrossRef]
- Junior, H.V.M.; Tavares, J.C.; Magalhães, A.A.B.; Galvão, H.C.; Ferreira, M.A.F. Characterization of tongue pressure in the elderly. Audiol. Commun. Res. 2014, 19, 375–379. [Google Scholar]
- Vanderwegen, J.; Guns, C.; Van Nuffelen, G.; Elen, R.; De Bodt, M. The influence of age, sex, bulb position, visual feedback, and the order of testing on maximum anterior and posterior tongue strength and endurance in healthy Belgian adults. Dysphagia 2013, 28, 159–166. [Google Scholar] [CrossRef] [PubMed]
- Morita, K.; Tsuka, H.; Kato, K.; Mori, T.; Nishimura, R.; Yoshida, M.; Tsuga, K. Factors related to masticatory performance in healthy elderly individuals. J. Prosthodont. Res. 2018, 62, 432–435. [Google Scholar] [CrossRef] [PubMed]
- Satake, A.; Kobayashi, W.; Tamura, Y.; Oyama, T.; Fukuta, H.; Inui, A.; Sawada, K.; Ihara, K.; Noguchi, T.; Murashita, K. Effects of oral environment on frailty: Particular relevance of tongue pressure. Clin. Interv. Aging 2019, 14, 1643. [Google Scholar] [CrossRef] [Green Version]
- Hara, K.; Tohara, H.; Kobayashi, K.; Yamaguchi, K.; Yoshimi, K.; Nakane, A.; Minakuchi, S. Age-related declines in the swallowing muscle strength of men and women aged 20–89 years: A cross-sectional study on tongue pressure and jaw-opening force in 980 subjects. Arch. Gerontol. Geriatr. 2018, 78, 64–70. [Google Scholar] [CrossRef]
- Van Ravenhorst-Bell, H.A.; Mefferd, A.S.; Coufal, K.L.; Scudder, R.; Patterson, J. Tongue strength and endurance: Comparison in active and non-active young and older adults. Int. J. Speech Lang. Pathol. 2017, 19, 77–86. [Google Scholar] [CrossRef]
- Namasivayam, A.M.; Steele, C.M.; Keller, H. The effect of tongue strength on meal consumption in long term care. Clin. Nutr. 2016, 35, 1078–1083. [Google Scholar] [CrossRef] [PubMed]


| Variable | Total | Without CSD | With CSD | p-Value | |||
|---|---|---|---|---|---|---|---|
| n | (%) | n | (%) | n | (%) | ||
| Total | 1000 | 369 | (36.90) | 631 | (63.10) | ||
| Gender | |||||||
| Male | 215 | (21.50) | 79 | (21.41) | 136 | (21.55) | 0.9574 |
| Female | 785 | (78.50) | 290 | (78.59) | 495 | (78.45) | |
| Age group | |||||||
| 60–64 yrs | 132 | (13.20) | 80 | (21.68) | 52 | (8.24) | <0.001 |
| 65–69 yrs | 261 | (26.10) | 137 | (37.13) | 124 | (19.65) | |
| 70–74 yrs | 222 | (22.20) | 75 | (20.32) | 147 | (23.30) | |
| 75–79 yrs | 181 | (18.10) | 44 | (11.92) | 137 | (21.71) | |
| 80–84 yrs | 119 | (11.90) | 26 | (7.05) | 93 | (14.74) | |
| ≥85 yrs | 85 | (8.50) | 7 | (1.90) | 78 | (12.36) | |
| Education level | |||||||
| Less than primary school | 145 | (14.50) | 27 | (7.32) | 118 | (18.70) | <0.001 |
| Primary school | 354 | (35.40) | 95 | (25.74) | 259 | (41.04) | |
| Junior or senior high school | 334 | (33.40) | 148 | (40.11) | 186 | (29.48) | |
| University or above | 167 | (16.70) | 99 | (26.83) | 68 | (10.78) | |
| Marital status | |||||||
| Married | 345 | (34.50) | 101 | (27.37) | 244 | (38.67) | <0.001 |
| Single | 655 | (65.50) | 268 | (72.63) | 387 | (61.33) | |
| Discretionary income | |||||||
| Sufficient | 921 | (92.10) | 353 | (95.66) | 568 | (90.02) | 0.0014 |
| Insufficient | 79 | (7.90) | 16 | (4.34) | 63 | (9.98) | |
| Chronic disease | |||||||
| No | 322 | (32.20) | 151 | (40.92) | 171 | (27.10) | <0.001 |
| Yes | 678 | (67.80) | 218 | (59.08) | 460 | (72.90) | |
| Functional natural teeth | |||||||
| 0–9 teeth | 236 | (23.60) | 236 | (37.40) | <0.001 | ||
| 10–19 teeth | 186 | (18.60) | 186 | (29.48) | |||
| ≥20 teeth | 578 | (57.80) | 369 | (100.00) | 209 | (33.12) | |
| Functional teeth | |||||||
| 0–9 teeth | 19 | (1.90) | 19 | (3.01) | <0.001 | ||
| 10–19 teeth | 52 | (5.20) | 52 | (8.24) | |||
| ≥20 teeth | 929 | (92.90) | 369 | (100.00) | 560 | (88.75) | |
| EAT-10 score | |||||||
| <3 | 849 | (84.90) | 369 | (100.00) | 480 | (76.07) | <0.001 |
| ≥3 | 151 | (15.10) | 151 | (23.93) | |||
| RSST times | |||||||
| <3 | 200 | (20.00) | 200 | (31.70) | <0.001 | ||
| ≥3 | 800 | (80.00) | 369 | (100.00) | 431 | (68.30) | |
| Variable | N | Total | p-Value | Without CSD | p-Value | With CSD | p-Value | |||
|---|---|---|---|---|---|---|---|---|---|---|
| Mean | SD | Mean | SD | Mean | SD | |||||
| Total | 1000 | 27.18 | 13.22 | 0.125 | 30.63 | 11.77 | 25.17 | 13.61 | <0.001 | |
| TP range (Q1–Q3) a | (18.10–36.00) | (22.25–39.25) | (15.40–33.60) | |||||||
| Gender | ||||||||||
| Male | 215 | 28.41 | 13.71 | 0.125 | 32.54 | 12.03 | 0.104 | 26.01 | 14.10 | 0.416 |
| Female | 785 | 26.85 | 13.07 | 30.11 | 11.67 | 24.94 | 13.47 | |||
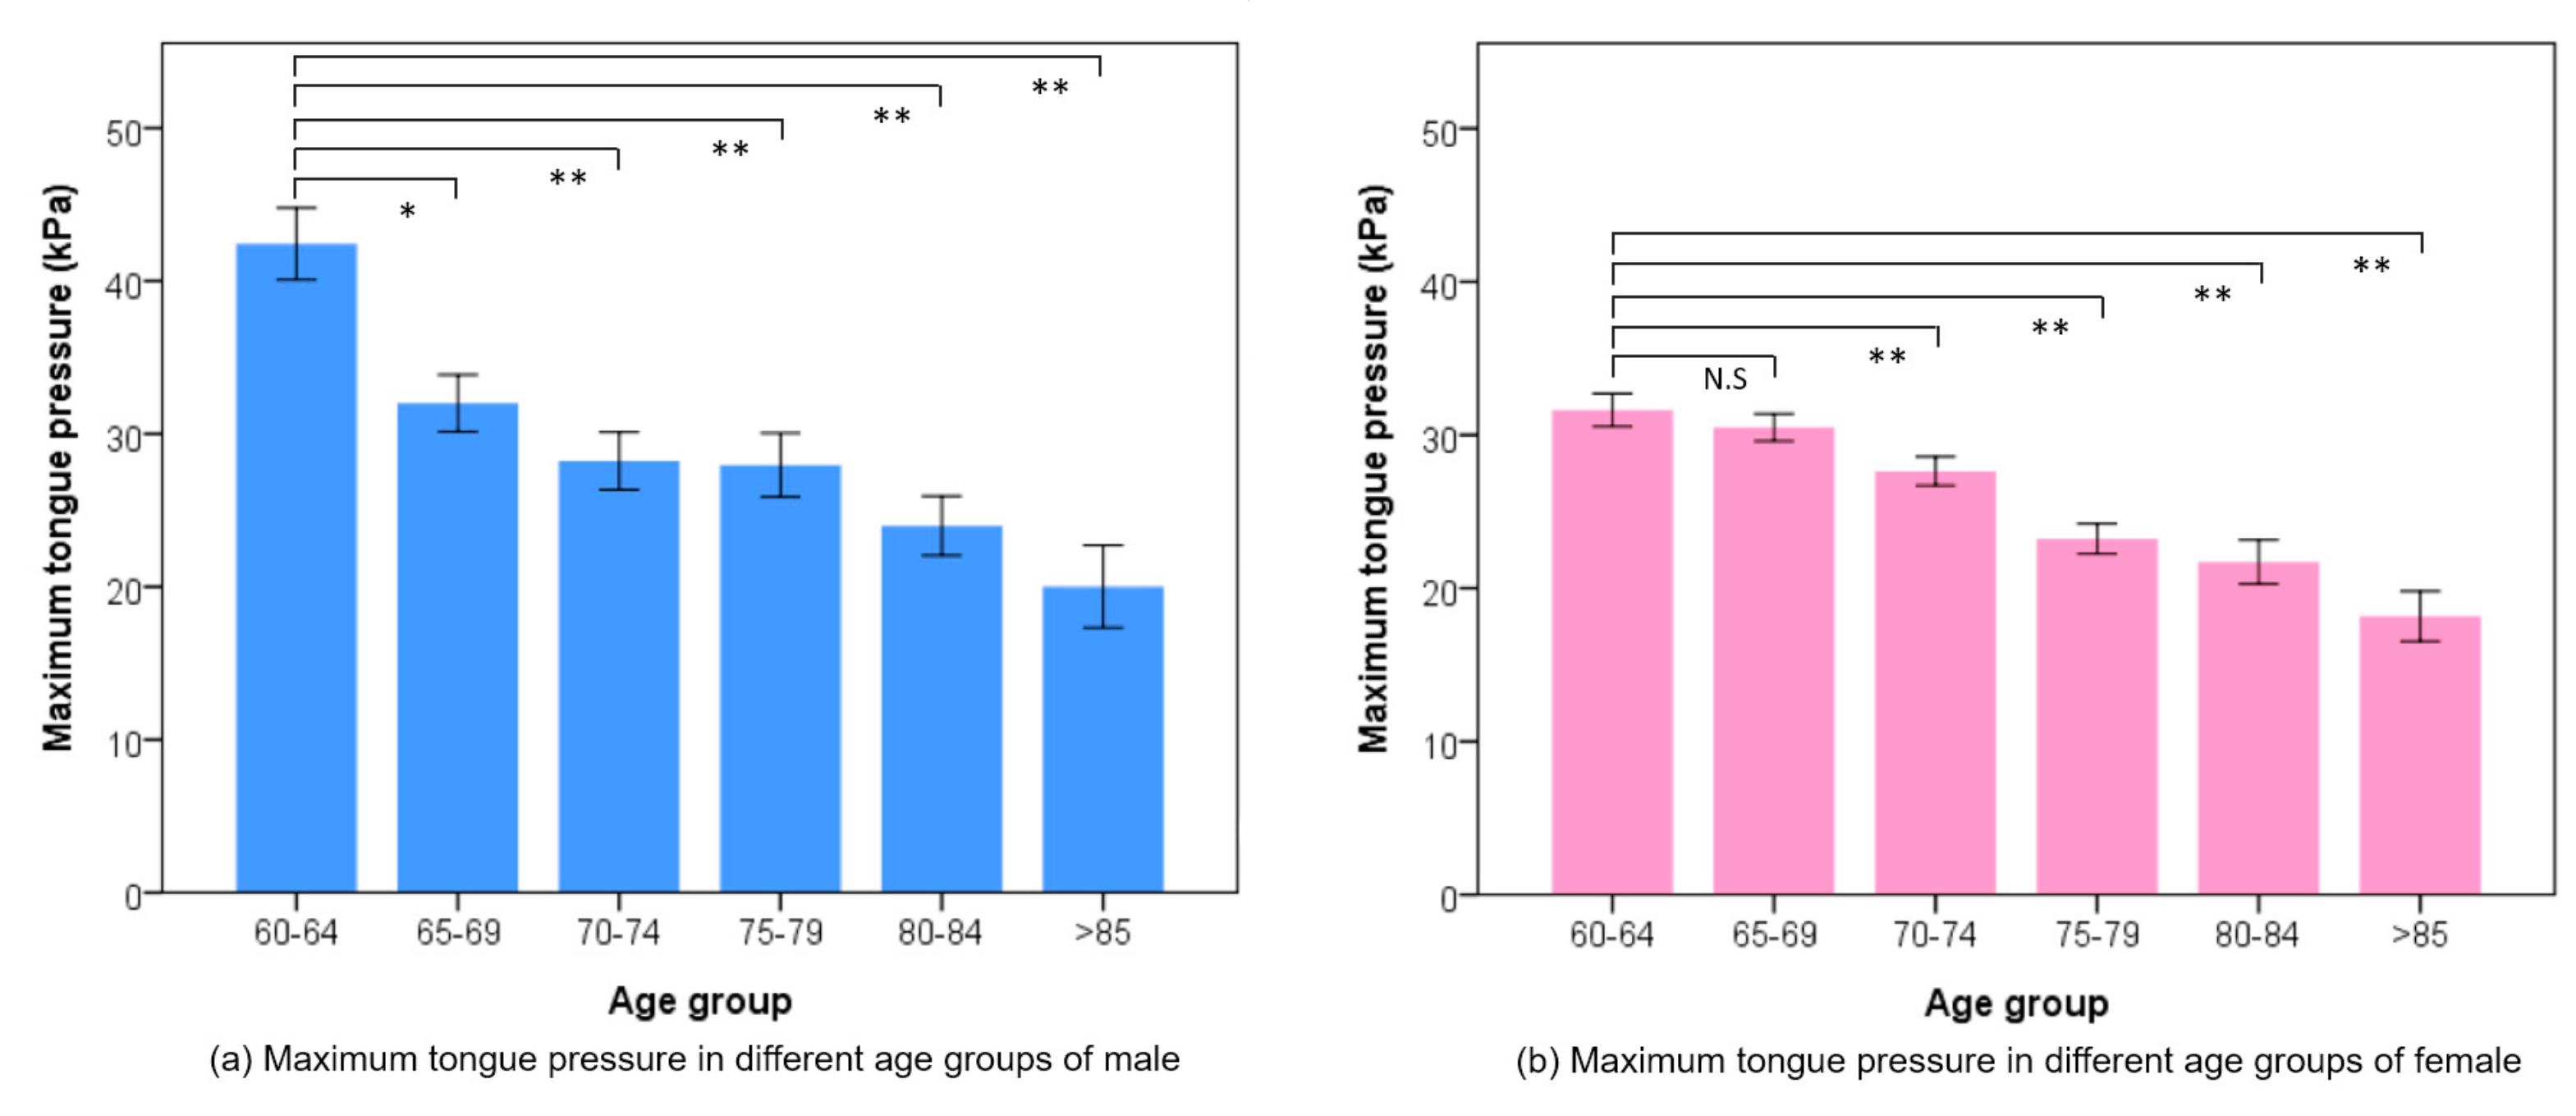
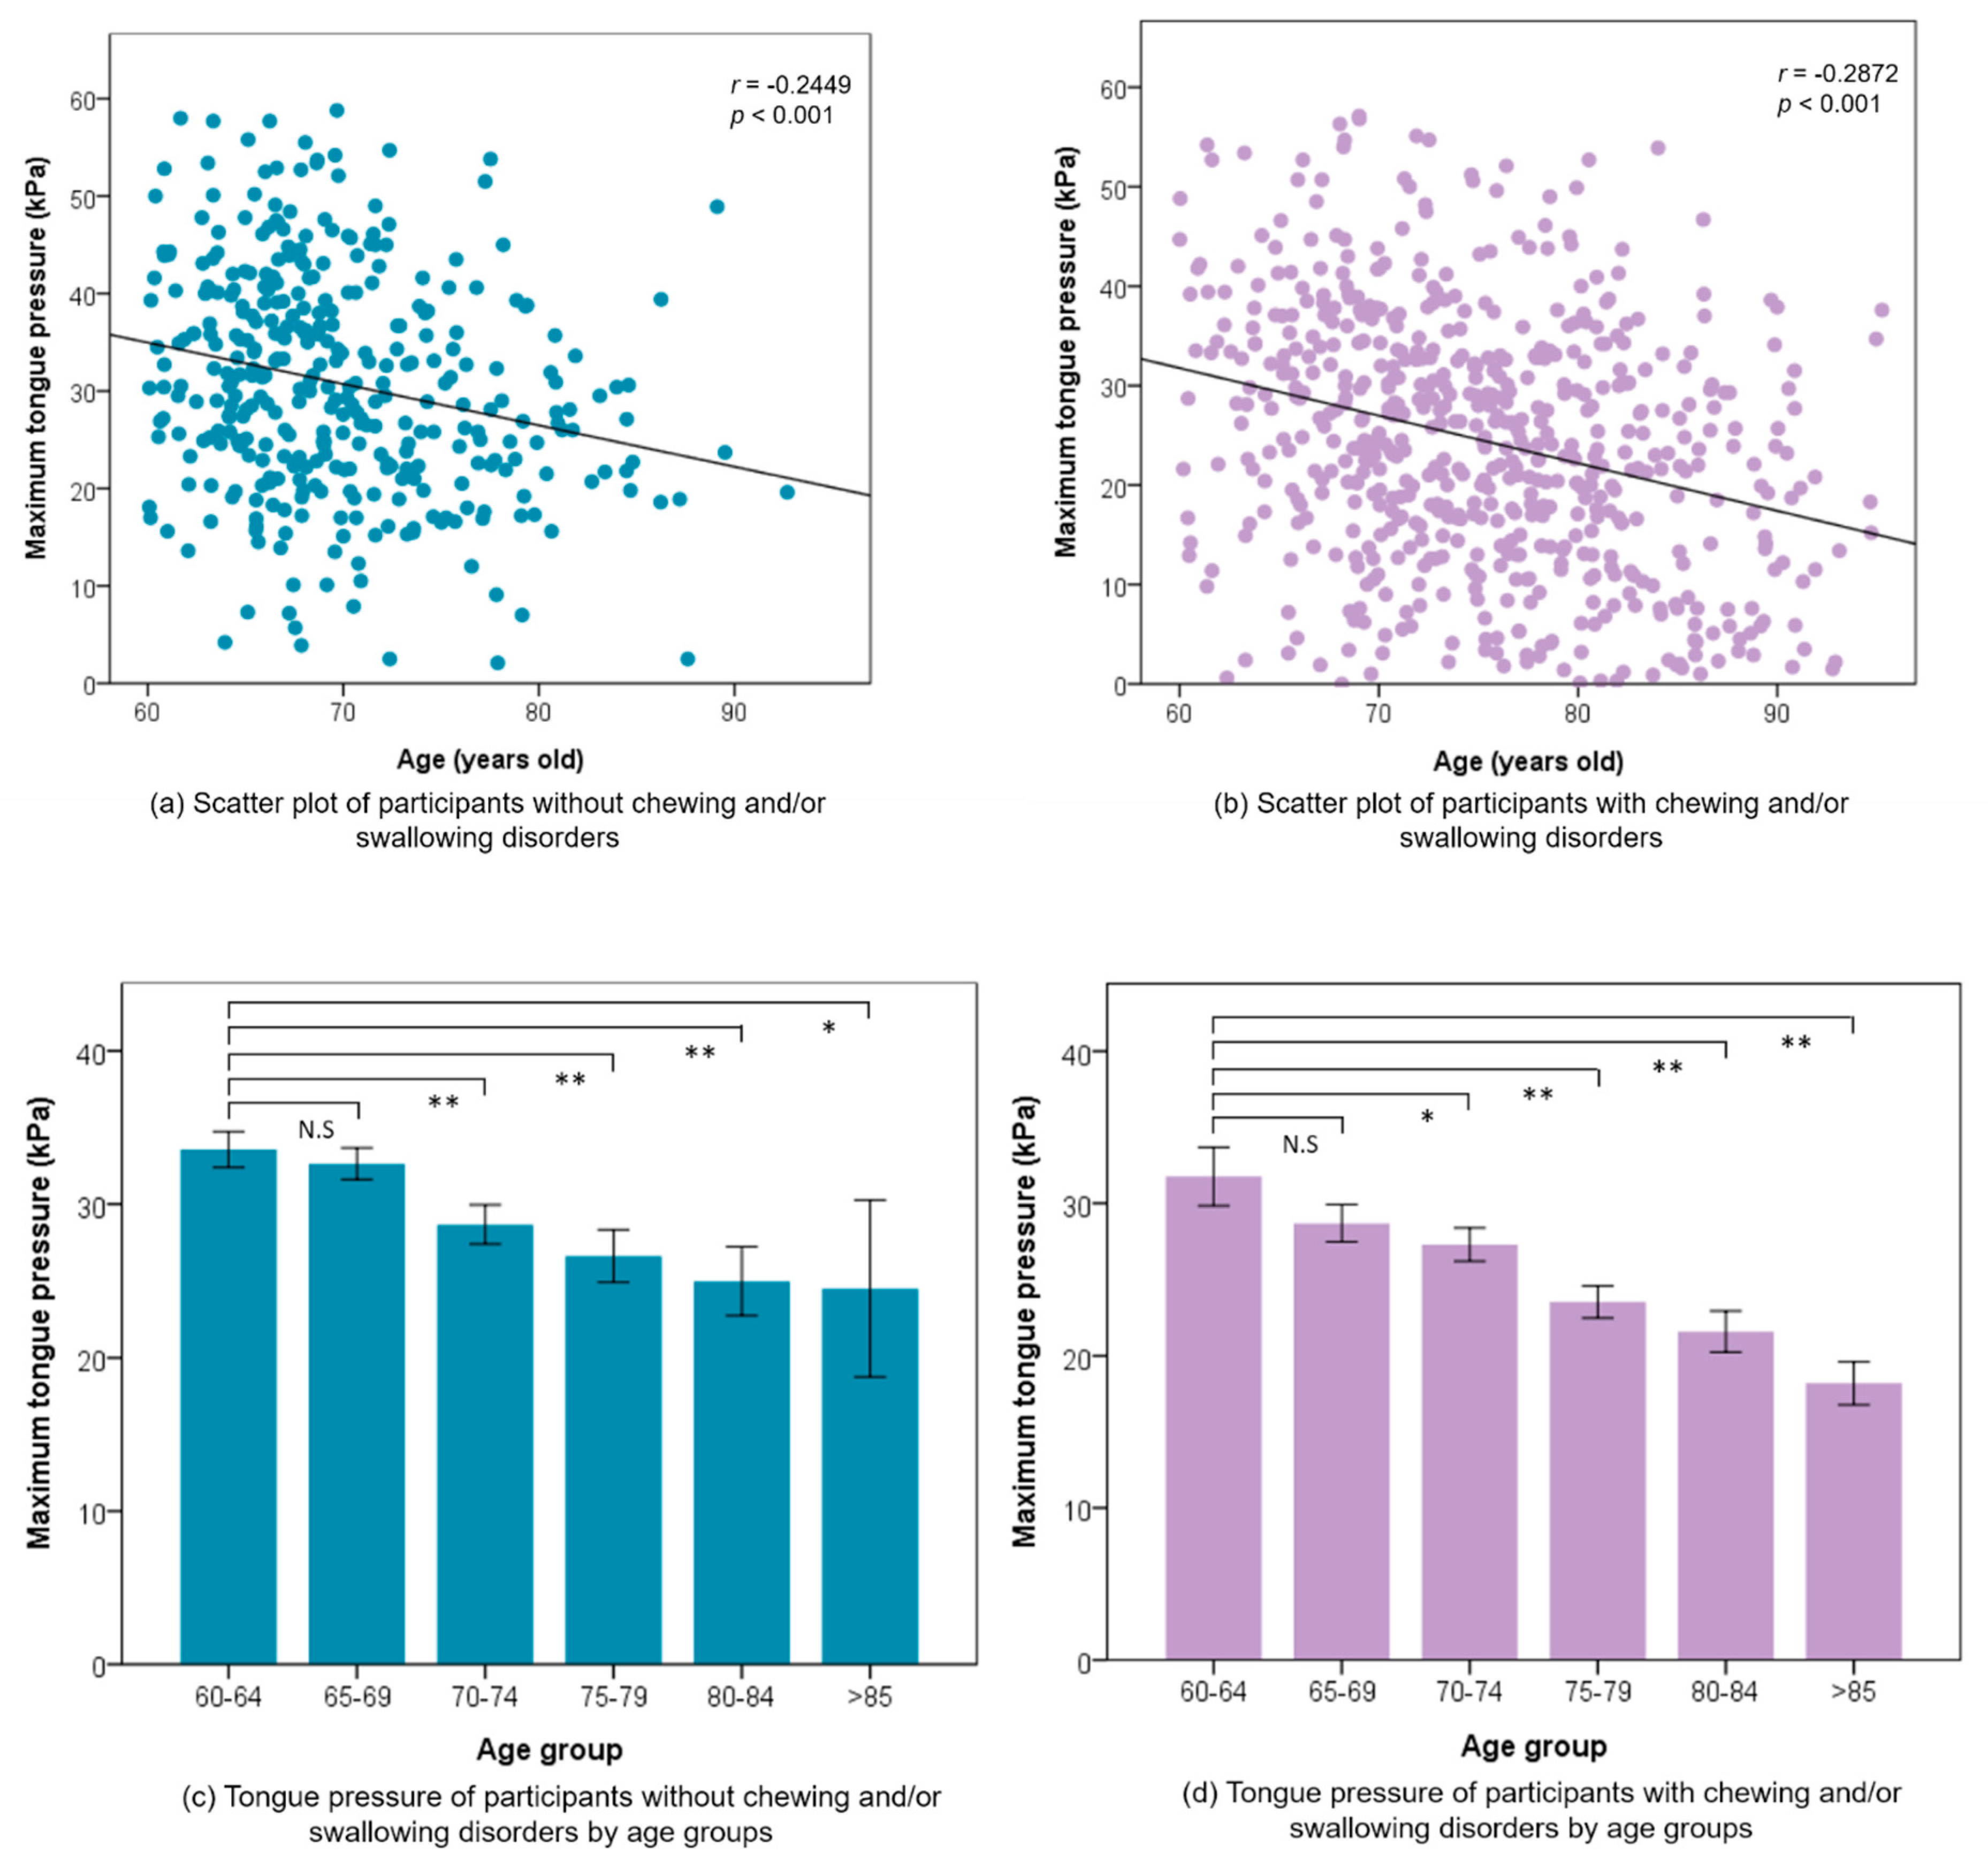
| Age group | ||||||||||
| 60–64 yrs | 132 | 32.85 | 11.93 | <0.001 | 33.56 | 10.53 | <0.001 | 31.76 | 13.84 | <0.001 |
| 65–69 yrs | 261 | 30.77 | 12.89 | 32.64 | 12.10 | 28.71 | 13.46 | |||
| 70–74 yrs | 222 | 27.78 | 12.57 | 28.69 | 10.91 | 27.32 | 13.35 | |||
| 75–79 yrs | 181 | 24.30 | 12.20 | 26.65 | 11.32 | 23.55 | 12.42 | |||
| 80–84 yrs | 119 | 22.34 | 12.76 | 25.00 | 11.47 | 21.60 | 13.05 | |||
| ≥85 yrs | 85 | 18.72 | 12.77 | 24.51 | 15.23 | 18.20 | 12.51 | |||
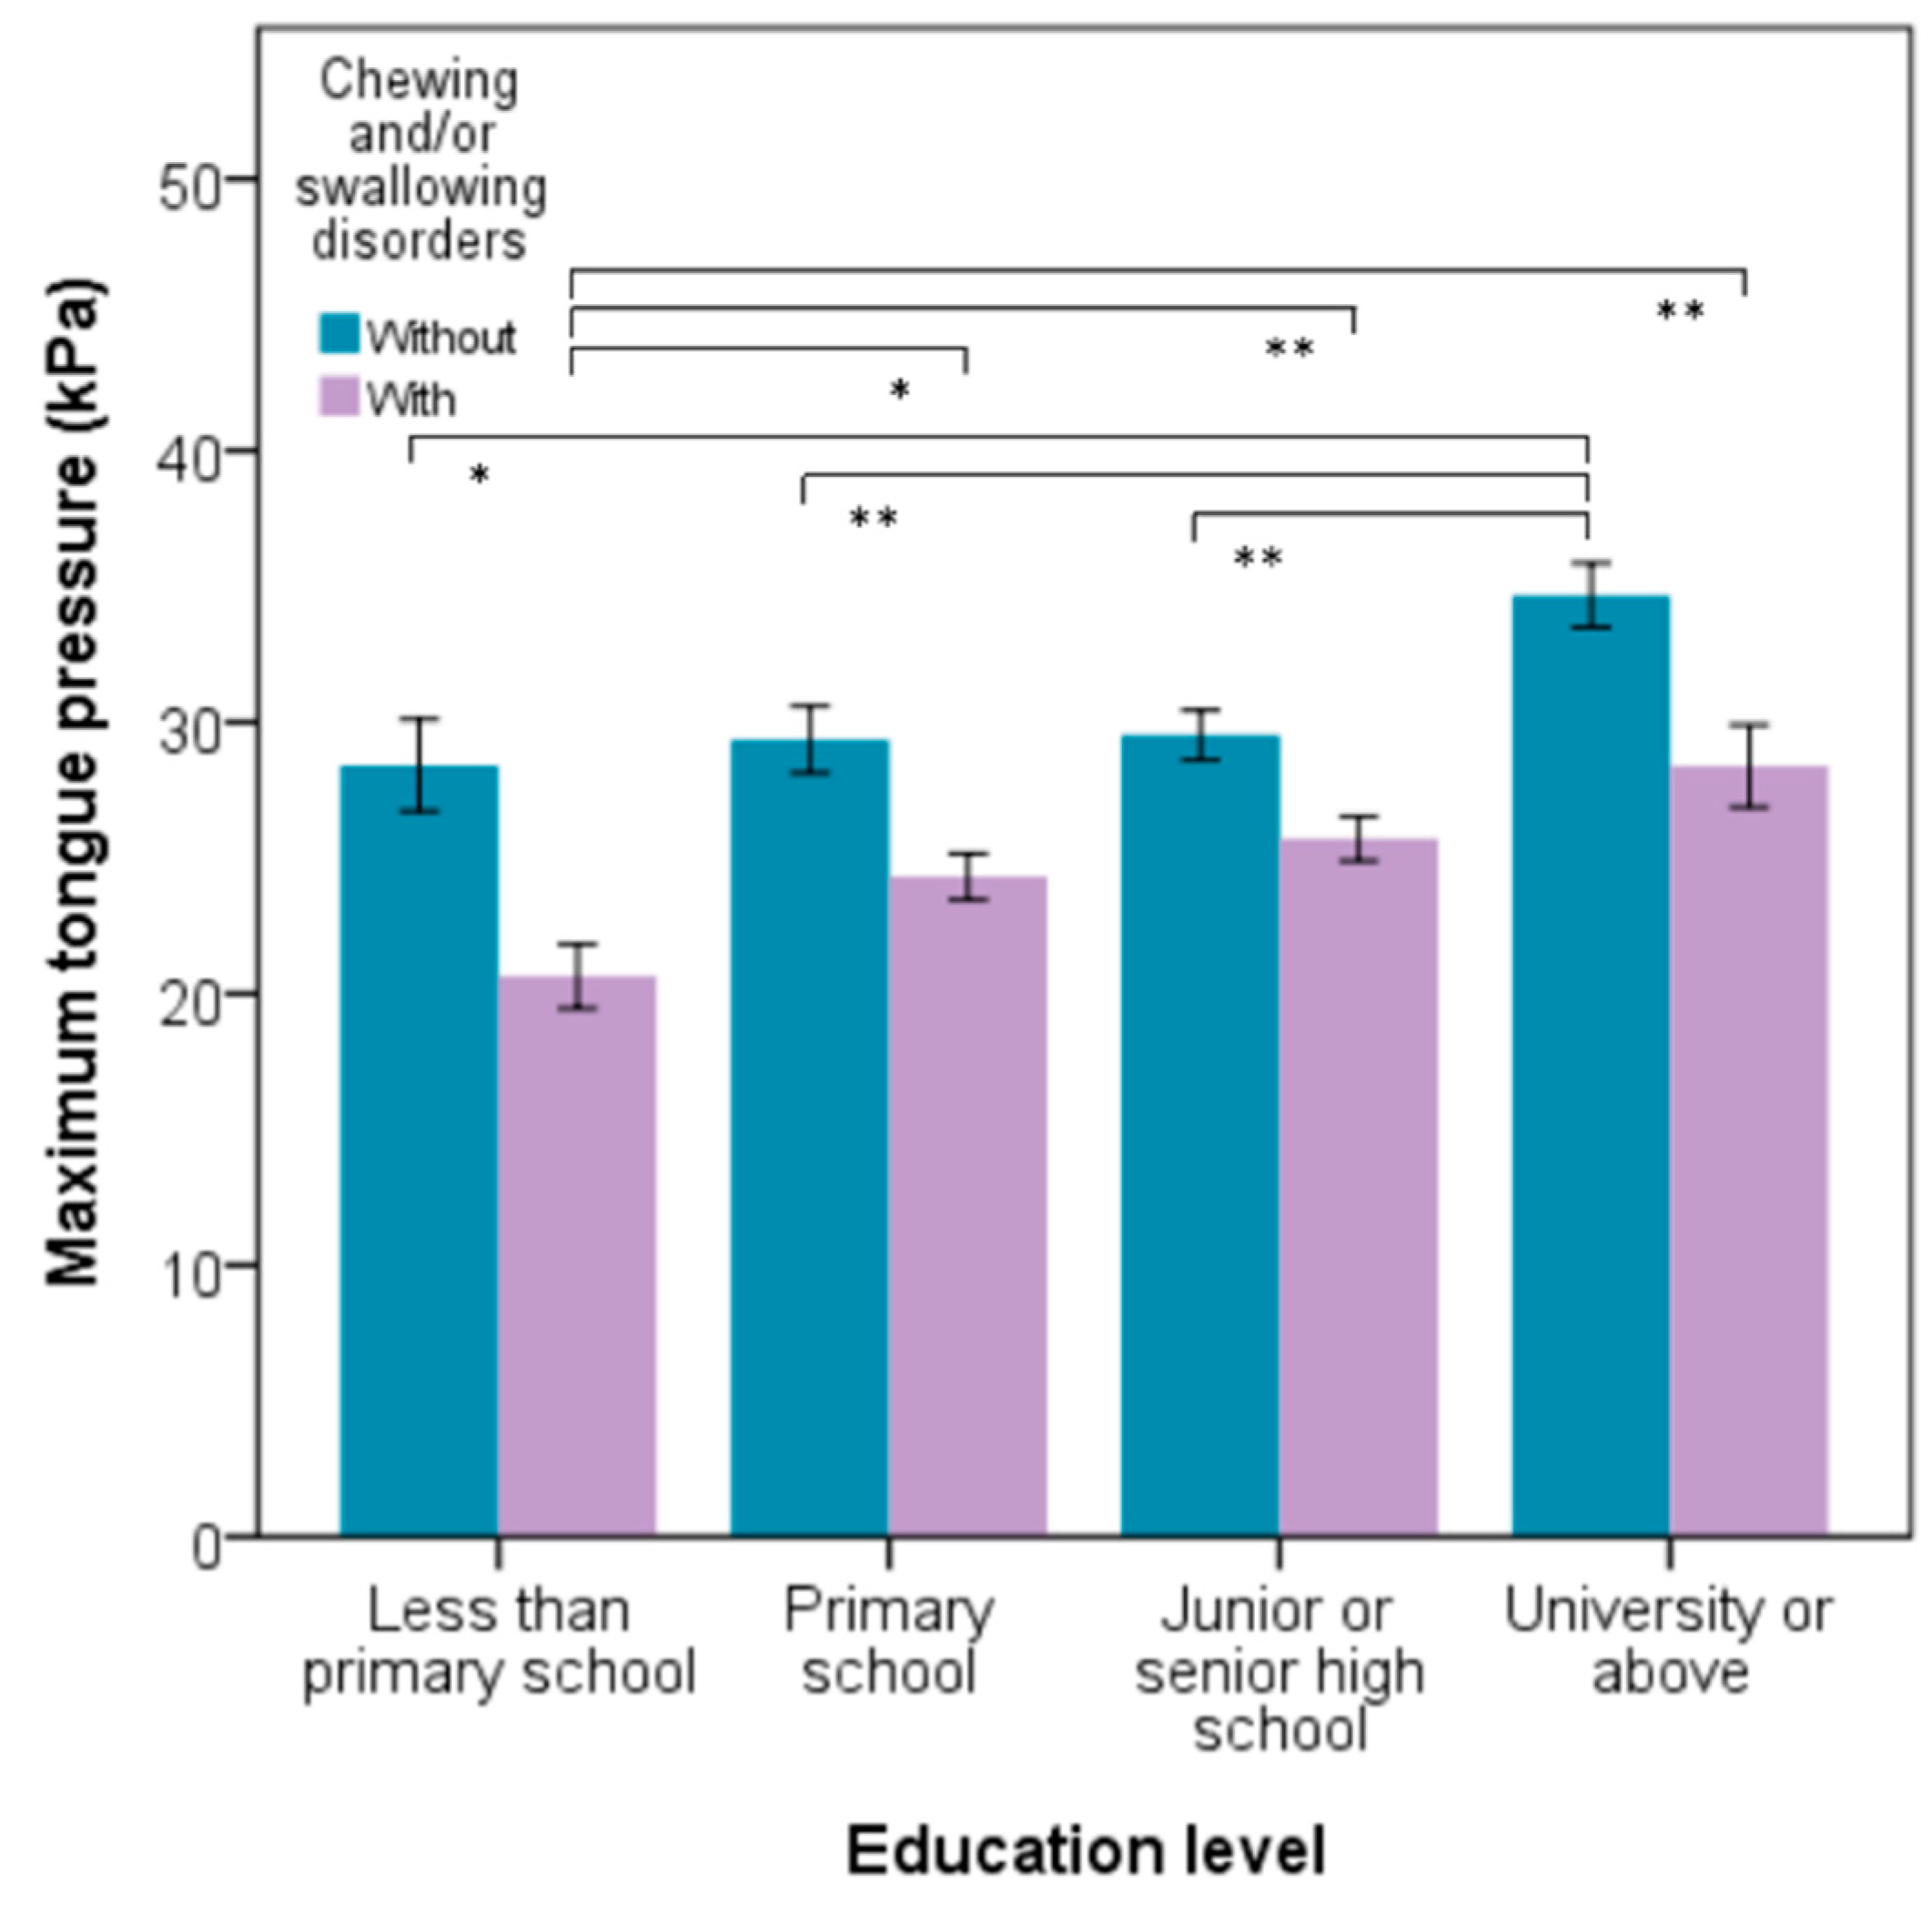
| Education level | ||||||||||
| Less than primary school | 145 | 22.64 | 13.17 | <0.001 | 28.41 | 8.86 | 0.001 | 21.32 | 13.66 | 0.001 |
| Primary school | 354 | 26.19 | 14.04 | 29.03 | 12.29 | 25.14 | 14.52 | |||
| Junior or senior high school | 334 | 27.55 | 11.60 | 29.36 | 11.35 | 26.10 | 11.63 | |||
| University or above | 167 | 32.51 | 12.75 | 34.67 | 11.78 | 29.37 | 13.54 | |||
| Marital status | ||||||||||
| Married | 345 | 25.48 | 13.43 | 0.003 | 28.76 | 11.95 | 0.062 | 24.12 | 13.79 | 0.124 |
| Single | 655 | 28.08 | 13.03 | 31.33 | 11.65 | 25.83 | 13.46 | |||
| Discretionary income | ||||||||||
| Sufficient | 921 | 27.28 | 13.10 | 0.423 | 30.63 | 11.75 | 0.980 | 25.20 | 13.47 | 0.848 |
| Insufficient | 79 | 26.04 | 14.58 | 30.70 | 12.61 | 24.86 | 14.90 | |||
| Chronic disease | ||||||||||
| No | 322 | 27.17 | 12.64 | 0.988 | 30.09 | 11.40 | 0.467 | 24.60 | 13.14 | 0.520 |
| Yes | 678 | 27.19 | 13.49 | 31.00 | 12.03 | 25.38 | 13.78 | |||
| Functional natural teeth | ||||||||||
| 0–9 teeth | 236 | 23.19 | 14.98 | <0.001 | 23.19 | 14.98 | 0.018 | |||
| 10–19 teeth | 186 | 26.32 | 13.58 | 26.32 | 13.58 | |||||
| ≥20 teeth | 578 | 29.09 | 11.90 | 30.63 | 11.77 | 26.38 | 11.66 | |||
| Functional teeth | ||||||||||
| 0–9 teeth | 19 | 20.03 | 14.13 | 0.022 | 20.03 | 14.13 | 0.237 | |||
| 10–19 teeth | 52 | 24.81 | 13.53 | 24.81 | 13.53 | |||||
| ≥20 teeth | 929 | 27.46 | 13.14 | 30.63 | 11.77 | 25.38 | 13.58 | |||
| EAT-10 score | ||||||||||
| <3 | 849 | 27.94 | 12.95 | <0.001 | 30.63 | 11.77 | 25.87 | 13.44 | 0.020 | |
| ≥3 | 151 | 22.93 | 13.93 | 22.93 | 13.93 | |||||
| RSST times | ||||||||||
| <3 | 200 | 27.94 | 12.95 | <0.001 | 24.20 | 14.77 | 0.244 | |||
| ≥3 | 800 | 22.93 | 13.93 | 30.63 | 11.77 | 25.62 | 13.02 | |||
| Variable | N | Total | p-Value | N | Without CSD | p-Value | N | With CSD | p-Value | |||
|---|---|---|---|---|---|---|---|---|---|---|---|---|
| Mean | SD | Mean | SD | Mean | SD | |||||||
| Ability to eat | ||||||||||||
| Completely by themselves | 985 | 27.31 | 13.19 | 0.017 | 365 | 30.63 | 11.82 | 0.942 | 62 | 25.35 | 13.57 | 0.013 |
| Partially assisted by parents/caregivers | 15 | 19.09 | 12.67 | 4 | 30.20 | 7.43 | 11 | 15.05 | 11.87 | |||
| Appetite | ||||||||||||
| Good | 808 | 27.93 | 13.19 | <0.001 | 321 | 31.30 | 11.63 | 0.014 | 487 | 25.71 | 13.68 | 0.080 |
| Satisfactory | 163 | 24.69 | 12.96 | 45 | 26.40 | 12.12 | 118 | 24.04 | 13.26 | |||
| Poor | 29 | 20.37 | 12.18 | 3 | 21.83 | 3.64 | 26 | 20.20 | 12.84 | |||
| Types of diet | ||||||||||||
| General diet, rice | 914 | 28.18 | 12.98 | <0.001 | 363 | 30.79 | 11.70 | 0.112 | 551 | 26.46 | 13.49 | <0.001 |
| Soft diet, rice porridge | 62 | 17.15 | 11.06 | 5 | 20.42 | 14.57 | 57 | 16.86 | 10.82 | |||
| Liquid diet | 24 | 15.01 | 10.68 | 1 | 21.90 | . | 23 | 14.71 | 10.82 | |||
| Duration of meal time | ||||||||||||
| <16 min | 636 | 28.06 | 13.40 | 0.006 | 238 | 30.94 | 11.99 | 0.493 | 398 | 26.33 | 13.91 | 0.005 |
| ≥16 min | 364 | 25.66 | 12.77 | 131 | 30.06 | 11.38 | 233 | 23.18 | 12.86 | |||
| Feel taking longer time to eat a meal than before | ||||||||||||
| Obviously | 38 | 20.03 | 12.50 | <0.001 | 6 | 29.58 | 9.01 | 0.883 | 32 | 18.23 | 12.35 | 0.006 |
| Slightly | 173 | 25.46 | 13.79 | 37 | 29.82 | 12.44 | 136 | 24.27 | 13.94 | |||
| No | 789 | 27.91 | 13.00 | 326 | 30.74 | 11.76 | 463 | 25.91 | 13.46 | |||
| Variable | Estimate | SE | t Ratio | p-Value | 95%CI | R2 | |
|---|---|---|---|---|---|---|---|
| (Lower, | Upper) | ||||||
| Total participants | |||||||
| Gender | |||||||
| Female (vs. Male) | −3.01 | 0.97 | −3.11 | 0.002 | (−4.90, | −1.11) | 0.127 |
| Age group | |||||||
| 65–69 yrs (vs. 60–64 yrs) | −2.28 | 1.33 | −1.72 | 0.086 | (−4.88, | 0.32) | |
| 70–74 yrs (vs. 60–64 yrs) | −5.42 | 1.37 | −3.96 | <0.001 | (−8.10, | −2.73) | |
| 75–79 yrs (vs. 60–64 yrs) | −8.53 | 1.43 | −5.99 | <0.001 | (−11.33, | −5.74) | |
| 80–84 yrs (vs. 60–64 yrs) | −10.49 | 1.58 | −6.64 | <0.001 | (−13.58, | −7.39) | |
| ≥85 yrs (vs. 60–64 yrs) | −13.28 | 1.77 | −7.50 | <0.001 | (−16.75, | −9.81) | |
| Functional natural teeth (Teeth) | 0.20 | 0.09 | 2.22 | 0.027 | (0.02, | 0.38) | |
| EAT-10 (Score) | −0.43 | 0.12 | −3.52 | 0.001 | (−0.67, | −0.19) | |
| Participants without CSD | |||||||
| Gender | |||||||
| Female (vs. Male) | −2.53 | 1.57 | −1.61 | 0.11 | (−5.61, | 0.55) | 0.101 |
| Age group | |||||||
| 65–69 yrs (vs. 60–64 yrs) | −1.34 | 1.61 | −0.83 | 0.41 | (−4.49, | 1.82) | |
| 70–74 yrs (vs. 60–64 yrs) | −5.39 | 1.91 | −2.83 | 0.00 | (−9.12, | −1.66) | |
| 75–79 yrs (vs. 60–64 yrs) | −7.11 | 2.20 | −3.23 | 0.00 | (−11.43, | −2.79) | |
| 80–84 yrs (vs. 60–64 yrs) | −8.72 | 2.68 | −3.26 | 0.00 | (−13.96, | −3.47) | |
| ≥85 yrs (vs. 60–64 yrs) | −9.25 | 4.52 | −2.05 | 0.04 | (−18.11, | −0.39) | |
| Education level | |||||||
| Less than primary school (vs. University or above) | −4.32 | 1.52 | −2.84 | 0.00 | (−7.30, | −1.33) | |
| Primary school (vs. University or above) | −3.04 | 1.76 | −1.73 | 0.09 | (−6.48, | 0.41) | |
| Junior or senior high school (vs. University or above) | −2.46 | 2.66 | −0.93 | 0.35 | (−7.68, | 2.75) | |
| Participants with CSD | |||||||
| Gender | |||||||
| Female (vs. Male) | −2.22 | 1.27 | −1.75 | 0.081 | (−4.70, | 0.27) | 0.100 |
| Age group | |||||||
| 65–69 yrs (vs. 60–64 yrs) | −3.13 | 2.14 | −1.46 | 0.145 | (−7.34, | 1.07) | |
| 70–74 yrs (vs. 60–64 yrs) | −4.66 | 2.10 | −2.22 | 0.027 | (−8.77, | −0.55) | |
| 75–79 yrs (vs. 60–64 yrs) | −8.40 | 2.12 | −3.97 | <0.001 | (−12.55, | −4.25) | |
| 80–84 yrs (vs. 60–64 yrs) | −10.26 | 2.26 | −4.55 | <0.001 | (−14.69, | −5.84) | |
| ≥85 yrs (vs. 60–64 yrs) | −13.02 | 2.35 | −5.53 | <0.001 | (−17.63, | −8.40) | |
| EAT-10 (Score) | −0.37 | 0.13 | −2.80 | 0.005 | (−0.63, | −0.11) | |
| Variable | Total | Total | Without CSD | With CSD | ||||||||||||
|---|---|---|---|---|---|---|---|---|---|---|---|---|---|---|---|---|
| COR a | 95%CI | p-Value | AOR b | 95%CI | p-Value | AOR b | 95%CI | p-Value | AOR b | 95%CI | p-Value | |||||
| (Lower, | Upper) | (Lower, | Upper) | (Lower, | Upper) | (Lower, | Upper) | |||||||||
| Gender | ||||||||||||||||
| Female (vs. Male) | 1.18 | (0.87, | 1.60) | 0.277 | 1.44 | (1.04, | 1.98) | 0.026 | 1.82 | (1.06, | 3.21) | 0.032 | 1.25 | (0.84, | 1.87) | 0.265 |
| Age group | ||||||||||||||||
| 65–69 yrs (vs. 60–64 yrs) | 0.56 | (0.42, | 0.74) | <0.001 | 1.54 | (0.98, | 2.43) | 0.062 | 1.40 | (0.77, | 2.61) | 0.276 | 1.71 | (0.88, | 3.44) | 0.121 |
| 70–74 yrs (vs. 60–64 yrs) | 0.92 | (0.68, | 1.24) | 0.588 | 2.30 | (1.46, | 3.66) | <0.001 | 2.97 | (1.51, | 5.97) | 0.002 | 1.90 | (0.99, | 3.75) | 0.059 |
| 75–79 yrs (vs. 60–64 yrs) | 1.77 | (1.20, | 2.64) | 0.004 | 3.95 | (2.33, | 6.79) | <0.001 | 3.36 | (1.34, | 8.60) | 0.010 | 3.65 | (1.88, | 7.33) | <0.001 |
| 80–84 yrs (vs. 60–64 yrs) | 1.87 | (1.35, | 2.62) | <0.001 | 4.01 | (2.48, | 6.55) | <0.001 | 4.28 | (1.97, | 9.59) | <0.001 | 3.89 | (1.91, | 8.16) | <0.001 |
| ≥85 yrs (vs. 60–64 yrs) | 3.16 | (1.94, | 5.33) | <0.001 | 6.61 | (3.58, | 12.57) | <0.001 | 7.54 | (1.48, | 56.18) | 0.022 | 6.21 | (2.91, | 13.80) | <0.001 |
| Education level | ||||||||||||||||
| Less than primary school (vs. University or above) | 1.73 | (1.21, | 2.50) | 0.003 | 1.55 | (1.04, | 2.32) | 0.034 | 1.83 | (1.03, | 3.29) | 0.040 | ||||
| Primary school (vs. University or above) | 1.34 | (1.03, | 1.74) | 0.027 | 1.56 | (1.03, | 2.36) | 0.036 | 1.58 | (0.82, | 3.05) | 0.171 | ||||
| Junior or senior high school (vs. University or above) | 0.88 | (0.67, | 1.14) | 0.326 | 1.53 | (0.90, | 2.60) | 0.115 | 1.43 | (0.54, | 3.77) | 0.471 | ||||
| Functional natural teeth <20 | ||||||||||||||||
| Yes (vs. No) | 1.86 | (1.34, | 2.60) | <0.001 | ||||||||||||
| EAT-10 score ≥3 | ||||||||||||||||
| Yes (vs. No) | 1.88 | (1.32, | 2.69) | 0.001 | 1.49 | (1.03, | 2.19) | 0.037 | 1.37 | (0.93, | 2.03) | 0.118 | ||||
Publisher’s Note: MDPI stays neutral with regard to jurisdictional claims in published maps and institutional affiliations. |
© 2021 by the authors. Licensee MDPI, Basel, Switzerland. This article is an open access article distributed under the terms and conditions of the Creative Commons Attribution (CC BY) license (https://creativecommons.org/licenses/by/4.0/).
Share and Cite
Liu, H.-Y.; Chen, J.-H.; Hsu, K.-J.; Yao, C.-T.; Chen, P.-H.; Hsiao, S.-Y.; Lin, C.-L. Decreased Tongue Pressure Associated with Aging, Chewing and Swallowing Difficulties of Community-Dwelling Older Adults in Taiwan. J. Pers. Med. 2021, 11, 653. https://0-doi-org.brum.beds.ac.uk/10.3390/jpm11070653
Liu H-Y, Chen J-H, Hsu K-J, Yao C-T, Chen P-H, Hsiao S-Y, Lin C-L. Decreased Tongue Pressure Associated with Aging, Chewing and Swallowing Difficulties of Community-Dwelling Older Adults in Taiwan. Journal of Personalized Medicine. 2021; 11(7):653. https://0-doi-org.brum.beds.ac.uk/10.3390/jpm11070653
Chicago/Turabian StyleLiu, Hsiu-Yueh, Jen-Hao Chen, Kun-Jung Hsu, Ching-Teng Yao, Ping-Ho Chen, Szu-Yu Hsiao, and Chun-Li Lin. 2021. "Decreased Tongue Pressure Associated with Aging, Chewing and Swallowing Difficulties of Community-Dwelling Older Adults in Taiwan" Journal of Personalized Medicine 11, no. 7: 653. https://0-doi-org.brum.beds.ac.uk/10.3390/jpm11070653