
Has the Propensity to Pay Dividends Declined? Evidence from the US Banking Sector

School of Finance, Jiangxi University of Finance and Economics, Nanchang 330013, China
*
Author to whom correspondence should be addressed.
J. Risk Financial Manag. 2021, 14(3), 103; https://0-doi-org.brum.beds.ac.uk/10.3390/jrfm14030103
Submission received: 31 January 2021
/
Revised: 24 February 2021
/
Accepted: 26 February 2021
/
Published: 5 March 2021
(This article belongs to the Special Issue Advances in Banking and Finance)
Abstract
:This article examines the propensity to pay dividends in the U.S banking sector during 1973–2014. Although the propensity to pay dividends has been declining over the 52 years of our sample period, banks are consistently more likely to pay dividends than non-financial firms. Using the coefficients from logit models estimated early in the sample period to forecast the percentage of dividend payers in each subsequent year, we conclude that there has been a decline in the likelihood of paying dividends in the banking sector. However, the decline started from a very high level as compared to that of the non-banking sectors. In addition, the variables taken from the non-financial firm literature do not explain the difference between the actual and expected percentage of dividend payers in the banking sector. We also conduct exploratory analyses with bank-specific variables. Although newly included variables are significantly related to the likelihood of paying dividends, they do not explain the declining propensity to pay dividends in the banking sector.
1. Introduction
In an important paper, Fama and French (2001) show that the propensity of non-financial firms to pay dividends has been declining markedly in recent decades. The declining propensity remains after controlling for the changing characteristics of publicly traded firms. Fama and French (2001), consistent with most studies on dividend policy, exclude financial institutions from their sample. As a result, the question regarding whether the propensity to pay dividends has declined in the banking sector remains unanswered.
We attempt to answer the question by applying the methodology of Fama and French (2001) to a sample of banks taken from Bank Compustat over during 1963–2014. The results show that dividends have been declining over the sample period of 1973–2014 in the banking sector. However, the pattern differs substantially from that found by Fama and French (2001) for non-financial firms. Moreover, banks remain much more likely to pay dividends than non-financial firms.
Bank dividend policy might differ from that in non-financial firms for several reasons. First, bank financial statements are notoriously opaque (Flannery 1998). As a result, signaling of financial statement quality can be an important motive for paying dividends by banks (Boldin and Leggett 1995; Kauko 2014). This concept of signaling is somewhat different from the cash flow signaling from the traditional dividend signaling models, where dividends provide signals about the future cash flows of the firm (Bhattacharya 1979; John and Williams 1985; Miller and Rock 1985). In the banking context, dividends are paid to certify current financial information.
Second, regulation exerts considerable influence on bank dividend policy. Banks are required to reduce or eliminate dividends if the banks are approaching the minimum capital levels. The regulatory constraints combined with the procyclical nature of bank regulation make bank dividend policy particularly sensitive to economic conditions.1 For example, during economic downturns, banks usually increase their allowance substantially for loan loss. The increased provision for loan loss, in turn, reduces net income, which puts heavy pressure on banks’ capital ratios. If a bank falls below the minimum ratios, it is certain to receive much more regulatory attention. Hence, during economic downturns, bank management may reduce or eliminate dividends either voluntarily or under regulatory pressure. The result of this dynamic could be procyclical bank dividend payouts.
Our findings confirm that bank dividend policy differs from that of non-financial firms. First, banks are much more likely to pay dividends than non-financial firms during our sample period of 1973–2014. For the first 20 years of our sample, over 90% of banks paid dividends, while at the end of our sample period, approximately 74% paid dividends. This contrasts with a high of 66.5% and a low of 20.8% dividend payers in the non-financial firms. Second, there has been a slight decline in the percentage of bank dividend payers over our sample period. The difference between the actual and expected percentage of payers declines during recessions, while increases during economic expansions, which differs from Fama and French (2001), where there is a monotonic decline in the non-banking sectors.
For our empirical tests, we follow the methodology of Fama and French (2001). We first estimate logit regressions on the determinants of the likelihood of paying dividends during 1963–1978, a period before a noticeable decline in dividend payers. We then use the coefficients from the logit model to predict the percentage of dividend payers in each year subsequent using the characteristics in that year. In our baseline logit models, we use potential determinants of dividends similar to those in Fama and French (2001). Our logit regression results show that bank dividend policy differs from that of non-financial firms. While a negative relationship is found between the likelihood of paying dividends and both the investment opportunities and current growth rate for non-financial firms, such relationships depend heavily on the sample periods for banks. Based on our baseline models, the predicted percentage of dividend payers is over 85%, which is significantly higher than the actual percentage. Similar to Fama and French (2001), the propensity to pay dividends has been declining in the banking sector. However, the decline started at a very high level compared to that for non-financial firms.
We further include variables that are shown to be important determinants of the likelihood of paying dividends to the baseline logit specification. In particular, we add proxies for firm maturity (DeAngelo et al. 2006) and risk (Hoberg and Prabhala 2009). We find that these variables are significant determinants of bank dividend policy, and the relations are in the same direction as that found for non-financial firms. However, in contrast to the findings for non-financial firms, the inclusion of these variables does not reduce the gap between predicted and actual dividend payer percentages. In other words, these variables do not explain the declining propensity to pay in the banking sector. Lastly, we add leverage to the baseline models, given that banks are highly leveraged and bank regulators closely monitor the capital levels. However, the inclusion of this variable does not help explain the declining propensity to pay, either. The predicted percentage of dividends payers remains higher than the actual percentage.
This study makes the following contributions to the existing literature. First, we extend the study of Fama and French (2001) by elucidating banks’ propensity to pay dividends over a 52-year sample period. While prior studies concentrate mainly on the determinants of dividend policies (DeAngelo et al. 2006; Hoberg and Prabhala 2009), limited studies have investigated the trend of dividend-paying in the banking sector or comparing it with the non-financial sectors. We document that banks are more likely to pay dividends than non-financial firms. However, the propensity to pay has been declining over our sample period. In contrast to the non-financial firms, the decline is erratic in the banking sector. Second, our findings add to the literature on the determinants of the likelihood of paying dividends by financial intermediaries (Filbeck and Mullineaux 1993; Abreu and Gulamhussen 2013). We split our sample periods and find that the explanatory power of the determinants depends heavily on the sample periods for banks. We also completement these studies by showing that firm maturity, risk, and leverage are significantly related to the propensity to pay.
2. Literature Review
There is a very large literature examining dividend policy of non-financial firms. In this section, we limit our review to studies that are directly relevant. The foundational paper for our study is Fama and French (2001). Using a sample of non-financial firms from 1963 to 1998, they document a “disappearing dividend” phenomenon. The percentage of dividend payers has declined precipitously over their sample period. They show that this decline can be partially explained by the changing characteristics of publicly traded firms. After controlling for the changing characteristics, there is still a significant decline in the propensity to pay dividends for non-financial firms.
Subsequent to Fama and French (2001), a number of studies identify additional factors that are related to the propensity to pay dividends. DeAngelo et al. (2006) conduct an empirical examination of the “maturity hypothesis” of Grullon et al. (2002). They introduce proxies for firm maturity: The ratios of earned capital to total assets and earned capital to total equity, and find highly significant relations between firm maturity and dividend payouts. Hoberg and Prabhala (2009) examine the impact of risk on the disappearing dividend puzzle. They find that risk explains about 40% of the declining propensity to pay dividends in non-financial sectors, with risky firms less likely to pay dividends.
In the banking literature, several studies examine the determinants of bank dividend policy, including signaling (Filbeck and Mullineaux 1993; Boldin and Leggett 1995; Abreu and Gulamhussen 2013), agency costs (Collins et al. 1994; Dickens et al. 2002), risk (Dickens et al. 2002; Kanas 2013), and tax policy (Casey and Dickens 2000). A few papers use the Fama and French (2001) factors in their investigations (Al-Khasawneh et al. 2012; Abreu and Gulamhussen 2013), and they find similar results as that of Fama and French (2001).
Notably, the Global Financial Crisis made the systemic vulnerability more palpable. Under such circumstances, banks might pay more attention to the signaling considerations to avert any notions of going illiquid (see, for example, Acharya et al. 2017a, 2017b; Floyd et al. 2015). In addition, how much a firm pays and the means of paying matter a lot to sway the sentiments of investors and stakeholders (Farre-Mensa et al. 2014). Managers have noted that they would, in most cases, refrain from cutting down on dividend payments to avoid being perceived as unhealthy, even though they might need to adopt retrenchment strategies to achieve such a purpose. This means that positive NPV capital projects may be relegated but not dividend payments (Brav et al. 2005). Dividends are associated with the mammoth transfer of wealth and value. Although repurchases have become preferable among non-financial firms (Farre-Mensa et al. 2014), dividends remain resilient over time in the banking sector, including the financial crisis period. For example, Floyd et al. (2015) show that dividends remain the most popular way of transferring wealth during the financial crisis of 2007–2008.
There is an increasing body of literature in this area from the international perspective. For example, Fortia and Schiozerb (2015) exploit an exogenous shock to the asset opaqueness and perception of risks of Brazilian banks caused by the global financial turmoil of 2008. The findings favor the imposition of limits on bank dividends, given that the banks’ need to signal their financial health through dividends during crises intensifies the procyclical effects of bank capital on lending. Onali et al. (2016) examine bank dividends from the perspective of CEO power and government monitoring using a sample of European banks. They find that CEO power has a negative impact on dividend payout ratios and on performance, suggesting that entrenched CEOs do not have incentives to increase payout ratios. Government ownership and the presence of a government official on the board of directors, also reduce banks’ payout ratios. More recently, Pinto and Rastogi (2019) find that size, profitability, and interest coverage ratios have a significant positive relation to dividend policy. Furthermore, business risk and debt reveal a significantly negative relation with dividends. Mustafa et al. (2020) use a sample of four Asian emerging economies and document a negative and significant impact of women on boards and in family businesses upon dividend announcement.
Although previous studies identify numerous factors that are associated with bank dividend policies, we are not aware of studies in the banking literature that include measures of firm maturity, leverage, or recessionary periods, all of which we find are related to bank dividend policy. More importantly, we are not aware of any studies that examine whether the propensity to pay dividends has declined in the banking sector.
3. Data and Methodology
3.1. Data
Our bank financial data comes from Bank Compustat, and stock data from CRSP. Our sample period is from 1973 to 2014. Similar to Fama and French (2001), we use 1973 to 1988 as the baseline and examine the trend of banks’ propensity to pay dividends from the baseline period.
Table 1 provides the number of observations and percentage of dividend payers in the sample in five-year increments (only the last chunk is for seven years). We include the trend of dividend-paying in Figure 1. Although the percentage of dividend payers declines over our sample period, there are notable differences between Figure 1 and the results reported by Fama and French (2001).2 First, the percentage of dividend payers is much higher in the banking sector. For the first 10 years of our sample period, over 90% of banks pay dividends. Even at low points during the early 1990s, over 70% pay dividends. By contrast, Fama and French report a peak of 66.5% in 1978 and a low of 20.8% paying dividends at the end of their sample period. (Fama and French 2001, p. 4). The second difference is that in Fama and French’s (2001) sample, the decline is relatively consistent from year to year. In the banking sector, the decline occurs in fits and starts. At the end of our sample, there is again a strong rebound underway.
In this figure, we plot the actual percentage of banks that pay dividends out of the total number of banks in the sample for each year t.
Table 2 provides the descriptive statics for the key variables in the sample. For easy comparison of our results to Fama and French (2001), we use a similar variable notation. Specifically, At is total book assets at the end of year t; Et/At is the ratio of EBIT in year t to total book assets at the end of year t; Yt/BEt, is the ratio of net income in year t to book equity at the end of year t; Lt/At is the ratio of the total book liabilities to total book assets at the end of year t; dAt/At is the change in assets from the end of year t − 1 to t scaled by assets at the end of year t; Vt/At is the ratio of the book value of liabilities plus the market value of equity at the end of year t to total book assets at the end of year t. Since the distribution of many of the variables is highly skewed, all the variables are winsorized at the 1% level.
NYP (New York Stock Exchange percentiles) is the percentile of market capitalization in NYSE (New York Stock Exchange) firms; At ($M) is total book assets at the end of year t; Vt/At is the ratio of the book value of liabilities plus the market value of equity at the end of year t to total book assets at the end of year t; dAt/At is the change in assets from the end of year t-1 to t scaled by assets at the end of year t; Et/At is the ratio of EBIT in year t to total book assets at the end of year t; Lt/At is the ratio of the total book liabilities to total book assets at the end of year t; Yt/BEt is the ratio of net income in year t to book equity at the end of year t; REt/BEt is the ratio of retained earnings in year t to book equity at the end of year t; REt/At is the ratio of retained earnings in year t to total book assets at the end of year t; TEt/At is the ratio of the total equity in year t to total book assets at the end of year t; Risk is the proxy for measuring the risk of the respective bank.
Additional variables included in this study are firm maturity (REt/BEt, i.e., retained earnings over the book equity at the end of each year t), risk (the standard deviation of annual excess stock returns), an indicator variable for the recessionary periods, and leverage (TEt/At, i.e., total equity over total assets at the end of year t).
3.2. Methodology
Our research design closely follows Fama and French (2001). The first step is to develop a model with factors determining whether a bank is likely to pay dividends. Our dependent variable is a dummy variable that equals 1 if the bank paid dividends in year t and 0 otherwise. We then estimate multivariate logit regression of the form:
For our baseline model, we follow closely the variables used by Fama and French (2001). Profitability is represented by Et/At (the ratio of aggregate earnings before interest to aggregate assets). To account for current growth, we include dAt/At (change in assets scaled by assets). Investment opportunities are represented by Vt/At (the ratio of the market value of assets to their book value, a proxy for Tobin’s Q). Size is measured by market capitalization using the New York Stock Exchange percentiles (NYP).
Subsequently, we add a fifth term to the baseline specification (denoted by X in Equation 1). Specifically, we draw on the literature and add the following two controls: A proxy for firm maturity following DeAngelo et al. (2006), and a measure of risk (the standard deviation of annual excess stock returns) following Hoberg and Prabhala (2009). Given that banks are very highly leveraged, we also include a proxy for leverage. Moreover, since the economy is bound to have recessions and booms, we further include an indicator for the recessionary periods.
Then we use the coefficients from the logit models estimated in the 1973–1988 period to estimate the predicted percentage of dividend payers in each subsequent year. The difference between the predicted percentage and the actual percentage is an indicator of the degree to which the propensity to pay dividends declines in the banking sector after controlling for characteristics of dividend payers.
For yet another exploration, we use the same extended set of explanatory variables to estimate OLS (ordinary least square) models. The dependent variable, in this case, is the payout ratio, measured as total dividends scaled by net income. We again follow the Fama and French (2001) methodology to see how the OLS baseline model for during 1973–1988 predicts the incidence of dividend payments. We depict the graphical illustration of our OLS estimates to show the difference between the expected percentage of dividend payers and the actual. Empirically, we use two estimation and predication models (with/without Vt/At) for robustness.
4. Results
4.1. Baseline Results
Table 3 provides the results of our baseline model on the determinants of the likelihood of a bank paying dividends. Following Fama and French (2001), we estimate two models—one includes Vt/At as a regressor and one without. The results make it clear that the determinants of the likelihood of paying dividends differ from those in non-financial companies. Fama and French (2001) find that growth opportunities, proxied by Vt/At, are negatively related to the likelihood of paying dividends. In our full sample period and all the subperiods, the coefficients for growth opportunities are significantly positive, suggesting that banks that have high growth opportunities are more likely to pay dividends. Consistent with Fama and French (2001), our coefficient for current growth (dAt/At) is negative and significant for the full sample period (1973–2014) and for during 2008–2014. In line with non-financial sectors, profitability (Et/At) and size are also positively related to the likelihood of paying dividends in the banking sector. We further notice that the coefficients of our determinants vary at different subsample periods, indicating that the explanatory power of these variables changes over time. For example, the coefficients for Vt/At vary from 3.407 during the sample period of 1989–1999 to 30.151 during the sample period of 1973–1988, suggesting that growth opportunities play a more significant role during 1973–1988 than other periods in predicting the likelihood of a bank paying dividends.
In Table 4, we turn to the main question of our study: Has the propensity to pay dividend declined in the banking sector? We use the coefficients from the baseline logit models estimated from the period 1973–1988 to estimate the predicted percentage of banks that should pay dividends in each year from 1989 onwards. The difference between expected and actual is negative, suggesting that the actual propensity to pay dividends is higher in the banking sector. There are rare instances when it is not happening. For example, the difference is positive in no single year when using both proxies for the growth opportunities. However, when we drop the growth rate of assets, the difference is positive during the periods of 1991–94 and 2011–13. This is strikingly different from Fama and French (2001), where the difference is increasingly positive, suggesting that industrials are less prone and the propensity to pay has been declining over time. On the contrary, the propensity to pay is erratic in the banking sector, and banks are more inclined to pay dividends.
4.2. Extended Models with Variables from the Dividend Literature
The difference between our baseline model results and the results for non-financial firms in Fama and French (2001) raise doubts about the applicability of the model to the banking sector. In an attempt to address these concerns, we add to the baseline model some additional potential determinants drawn from the dividend literature.
Table 5 shows that after the inclusion of additional controls, the basic premise of Fama and French (2001) is still valid. Size and profitability are still strong determinants of banks’ likelihood of paying dividends. In addition, the proxies for maturity and risk are significantly positive, which are consistent with DeAngelo et al. (2006) and Hoberg and Prabhala (2009). The recessionary indicator coefficient is significantly positive for the full sample and for the last subperiod of 2008–2014, suggesting that banks are also more likely to pay dividends during recessions. It signifies the patronizing role played by the banking sector. Leverage is positively significant at a 10% level when we include both proxies for growth opportunities (i.e., Vt/At and dAt/At), but when we drop Vt/At, it becomes insignificant. Therefore, we find mild evidence that highly leveraged banks are more likely to pay dividends when growth opportunities are higher. The coefficient for leverage is significantly positive during 1989–1999, but strongly negative during 2008–2014. One possible explanation is that highly leveraged banks reduce their dividend payments out of the fear that they might go bankrupt during the financial crisis period. However, this phenomenon requires more investigation by further dissecting the sample into the banks with their weighted average of the leverage. As this is out of the scope of this study, we leave it to future discussions.
In Table 6, we find that the propensity to pay is higher during recessionary periods or the times of financial and economic turbulence. Specifically, the difference between expected and actual percentages of banks paying dividends is negative during the early 1990s, then the late 1990s, and it is significantly negative for the financial crisis period of 2007–2009, then the magnitude tapers off and finally becomes positive from 2011 onwards. The pattern is robust after dropping Vt/At. This phenomenon renders fair credence to our story that banks use dividends to signal their financial health and their cash flows.
4.3. Robustness Tests
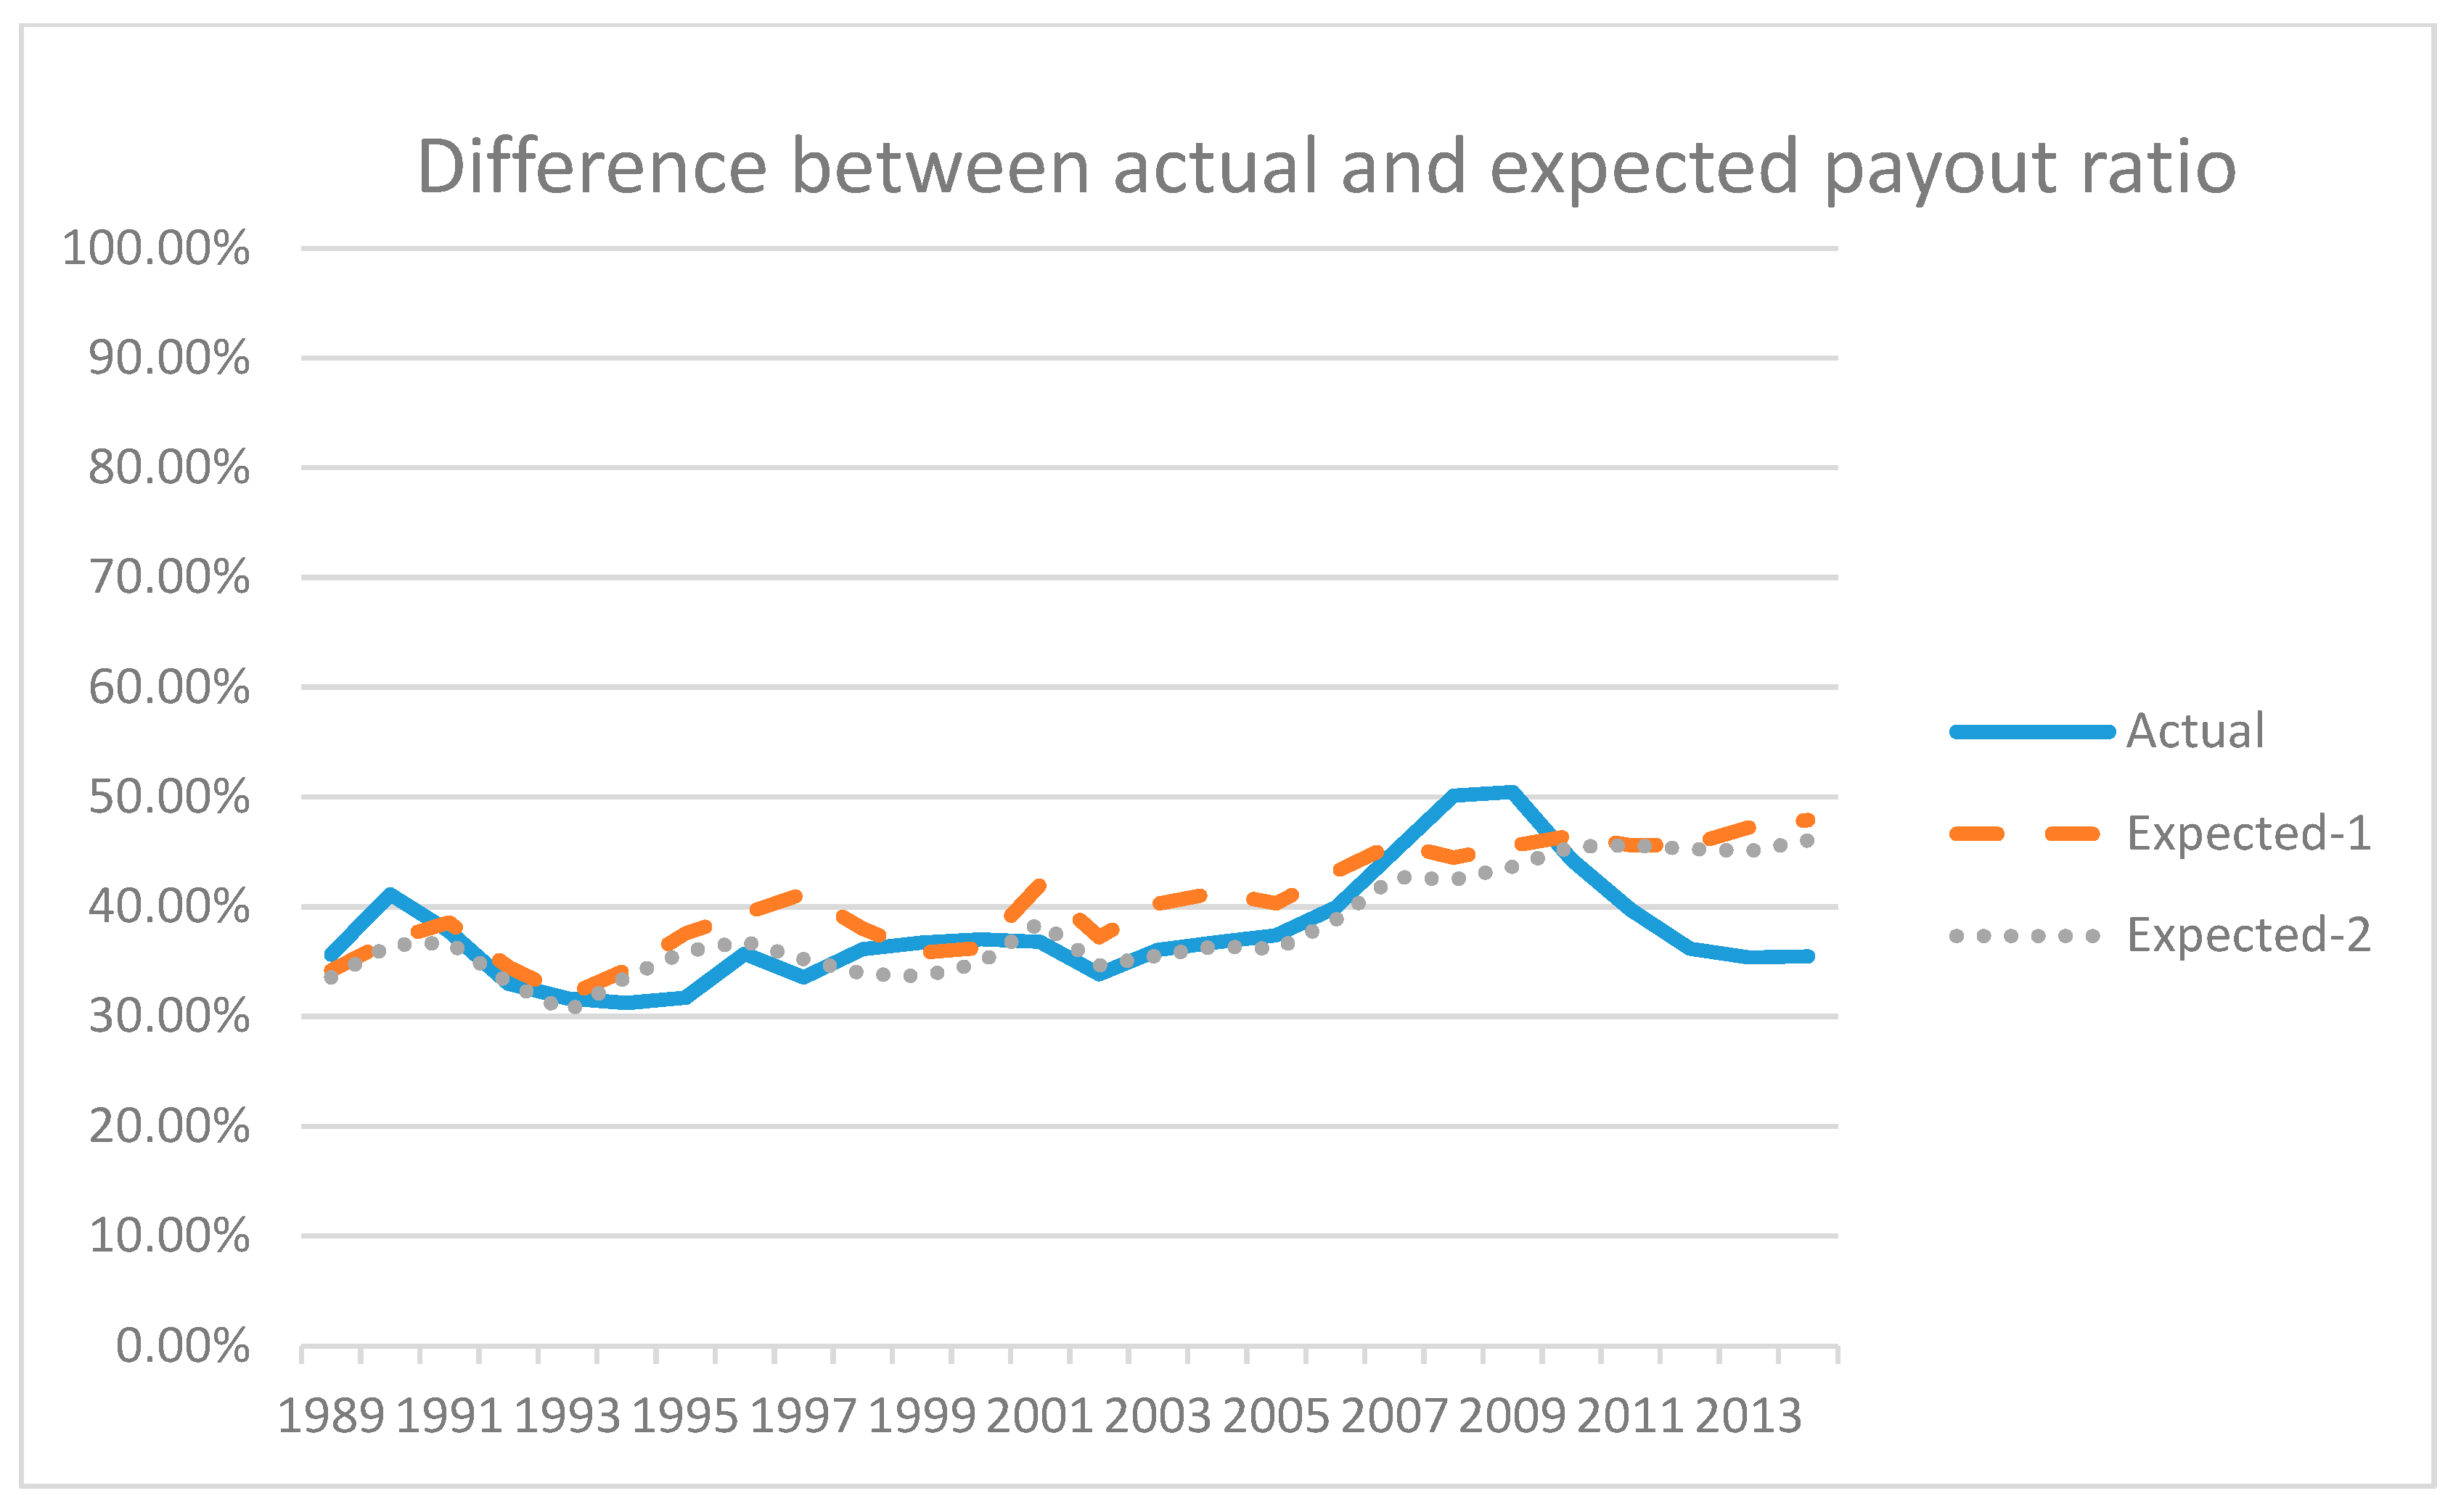
As a robustness test, we use banks’ payout ratios as the dependent variable, and re-estimate the models used in Table 3. The results are reported in Table 7. We find that the results are in line with Table 5 except that profitability is negatively related to payout ratios. In other words, banks with high profitability are more likely to pay dividends, but the payout ratios are negatively related to banks’ net income. Also, for the full sample period, firm maturity is no longer significant, suggesting that mature firms do not necessarily have higher payout ratios. Leverage and recession are significantly positive at 1%, indicating that highly leveraged banks have lower payout ratios and banks have higher payout ratios during the recessionary periods. Moreover, we report a comparison of the actual and expected dividend payout ratio in Figure 2. Dividend payout ratios remain below the expected rate for most of our sample period, which echoes our previous statement that dividends have been declining over time.
In this figure, we plot the actual percentage of banks that pay dividends out of the total number of banks in the sample for each year t along with the expected percentage calculated based on the coefficient estimates from OLS regressions in Table 7. The baseline coefficient estimates are calculated using 1973–1988. The expected-1 line in the figure indicates the difference between the actual percentage and expected percentage while using both Vt/At and dAt/At. The expected-2 line in the figure indicated the difference between the actual percentage and expected percentage while using only dAt/At.
In Table 8, we see that the pattern is consistent with our previous notion that during recessionary periods, the difference between expected and actual is negative. When including both Vt/At and dAt/At, the difference is negative for 1989–1990, then 1999–2000, and for 2008–2009. After dropping Vt/At, the overall picture is the same, indicating that our results are robust.
5. Conclusions
Most studies on dividend policy exclude financial institutions. In this paper, we partially fill this gap in the literature by examining the propensity to pay dividends in the banking sector. In particular, we apply the methodology of Fama and French (2001) to a sample of banks over during 1973–2014. We find several differences in the propensity to pay between banks and non-financial firms. Whereas, Fama and French (2001) report a monotonic decline in the propensity to pay for non-financial firms, we find an erratic pattern with only a moderate decline in banks’ propensity to pay dividends during our sample period. In addition, banks are more willing to pay dividends than non-financial firms.
In addition, we find that variables taken from the non-financial firm literature (investment opportunities, growth, profitability, maturity, and risk) are significantly related to the likelihood of a bank paying dividends. We also find that high leveraged banks are associated with a higher propensity to pay dividends, and banks are more likely to pay dividends during a recession. The explanatory power of our variables varies during different sample periods, suggesting that factors that explain the propensity to pay dividends are not stationary in the banking sector. Our results are robust when using payout ratios as the alternative measure for dividends.
Author Contributions
S.L.: Conceptualization, Methodology. Q.W.: Supervision, Validation, Writing, Reviewing and Editing. J.D.: Data curation, Visualization, Investigation. S.P.: Software. All authors have read and agreed to the published version of the manuscript.
Funding
We acknowledge financial support from The MOE (Ministry of Education in China) Project of Humanities and Social Sciences (20YJA790062), Jiangxi Province Social Science Planning Project (19YJ12), Jiangxi Province education department key science and technology project (GJJ180245), Humanities and Social Sciences Key Research Base Project of Universities in Jiangxi Province (Project No. JD18094), and National Science Foundation Project (71661008). The APC is funded by Jiangxi University of Finance and Economics.
Institutional Review Board Statement
Not applicable.
Informed Consent Statement
Not applicable.
Conflicts of Interest
The authors declare no conflict of interest.
References
- Abreu, José Filipe, and Mohamed Azzim Gulamhussen. 2013. Dividend Payouts: Evidence from U.S. Bank Holding Companies in the Context of the Financial Crisis. Journal of Corporate Finance 22: 54–65. [Google Scholar] [CrossRef]
- Acharya, Viral. V., Hanh T. Le, and Hyun Song Shin. 2017a. Bank capital and dividend externalities. Review of Financial Studies 30: 988–1018. [Google Scholar] [CrossRef]
- Acharya, Viral. V., Lasse H. Pedersen, Thomas Philippon, and Matthew Richardson. 2017b. Measuring systemic risk. Review of Financial Studies 30: 2–47. [Google Scholar] [CrossRef]
- Al-Khasawneh, Jamal, Mohammad Shariff, and Khalid Al-Zubi. 2012. Propensity to Pay Dividends: Evidence from US Banking Sector. International Journal of Economics and Finance 4: 130–41. [Google Scholar] [CrossRef]
- Athanasoglou, Panayiotis P., Ioannis Daniilidis, and Manthos D. Delis. 2014. Bank Procyclicality and Output: Issues and Policies. Journal of Economics and Business 72: 58–83. [Google Scholar] [CrossRef] [Green Version]
- Bhattacharya, Sudipto. 1979. Imperfect Information, Dividend Policy, and ‘The Bird-in-the-Hand’ Fallacy. Bell Journal of Economics 10: 259–70. [Google Scholar] [CrossRef] [Green Version]
- Boldin, Robert, and Keith Leggett. 1995. Bank Dividend Policy as a Signal of Bank Quality. Financial Services Review 4: 1–8. [Google Scholar] [CrossRef]
- Brav, Alon, John R. Graham, Campbell R. Harvey, and Roni Michaely. 2005. Payout policy in the 21st century. Journal of Financial Economics 77: 483–527. [Google Scholar] [CrossRef]
- Casey, K. Michael, and Ross N. Dickens. 2000. The Effects of Tax and Regulatory Changes on Commercial Bank Dividend Policy. Quarterly Review of Economics and Finance 40: 279–93. [Google Scholar] [CrossRef]
- Collins, M. Cary, David W. Blackwell, and Joseph F. Sinkey Jr. 1994. Financial Innovation, Investment Opportunities, and Corporate Policy Choices for Large Bank Holding Companies. Financial Review 29: 223–47. [Google Scholar] [CrossRef]
- DeAngelo, Harry, Linda DeAngelo, and René M. Stulz. 2006. Dividend Policy and the Earned/Contributed Capital Mix: A Test of the Life-cycle Theory. Journal of Financial Economics 81: 227–54. [Google Scholar] [CrossRef]
- Dickens, Ross N., K. Michael Casey, and Joseph A. Newman. 2002. Bank Dividend Policy: Explanatory Factors. Quarterly Journal of Business and Economics 41: 3–12. [Google Scholar]
- Fama, Eugene F., and Kenneth R. French. 2001. Disappearing Dividends: Changing Firm Characteristics or Lower Propensity to Pay? Journal of Financial Economics 60: 3–43. [Google Scholar] [CrossRef]
- Farre-Mensa, Joan, Roni Michaely, and Martin Schmalz. 2014. Payout Policy. Annual Review of Financial Economics 6: 75–134. [Google Scholar] [CrossRef]
- Filbeck, Greg, and Donald J. Mullineaux. 1993. Regulatory Monitoring and the Impact of Bank Holding Company Dividend Changes on Equity Returns. Financial Review 28: 403–15. [Google Scholar] [CrossRef]
- Flannery, Mark J. 1998. Using Market Information in Prudential Bank Supervision: A Review of the U.S. Empirical Evidence. Journal of Money, Credit & Banking 30: 273–305. [Google Scholar]
- Floyd, Eric, Nan Li, and Douglas J. Skinner. 2015. Payout Policy through the Financial crisis: The Growth of Repurchases and the Resilience of Dividends. Journal of Financial Economics 118: 299–316. [Google Scholar] [CrossRef]
- Fortia, Cristiano, and Rafael F. Schiozerb. 2015. Bank dividends and signaling to information-sensitive depositors. Journal of Banking and Finance 56: 1–11. [Google Scholar] [CrossRef]
- Grullon, Gustavo, Roni Michaely, and Bhaskaran Swaminathan. 2002. Are Dividend Changes a Sign of Firm Maturity? Journal of Business 75: 387–424. [Google Scholar] [CrossRef] [Green Version]
- Hoberg, Gerard, and Nagpurnanand R. Prabhala. 2009. Disappearing Dividends, Catering, and Risk. Review of Financial Studies 22: 79–116. [Google Scholar] [CrossRef]
- John, Kose, and Joseph Williams. 1985. Dividends, Dilutions, and Taxes: A Signaling Equilibrium. Journal of Finance 40: 1053–70. [Google Scholar] [CrossRef]
- Kanas, Angelos. 2013. Bank Dividends, Risk, and Regulatory Regimes. Journal of Banking and Finance 37: 1–10. [Google Scholar] [CrossRef]
- Kauko, Karlo. 2014. Does opaqueness make equity capital expensive for banks? Revista de Economia del Rosario 17: 203–27. [Google Scholar] [CrossRef] [Green Version]
- Miller, Merton. H., and Kevin Rock. 1985. Dividend Policy under Asymmetric Information. Journal of Finance 40: 1031–51. [Google Scholar] [CrossRef]
- Mustafa, Adeel, Abubakr Saeed, Muhammad Awais, and Shahab Aziz. 2020. Board-Gender Diversity, Family Ownership, and Dividend Announcement: Evidence from Asian Emerging Economies. Journal of Risk and Financial Management 13: 62. [Google Scholar] [CrossRef] [Green Version]
- Onali, Enrico, Ramilya Galiakhmetova, Philip Molyneux, and Giuseppe Torluccio. 2016. CEO power, Government Monitoring, and Bank Dividends. Journal of Financial Intermediation 27: 89–117. [Google Scholar] [CrossRef] [Green Version]
- Pinto, Geetanjali, and Shailesh Rastogi. 2019. Sectoral Analysis of Factors Influencing Dividend Policy: Case of an Emerging Financial Market. Journal of Risk and Financial Management 12: 110. [Google Scholar] [CrossRef] [Green Version]
| 1 | See Athanasoglou et al. (2014) for a recent review of the procyclicality of banking regulation. |
| 2 | Fama and French (2001) exclude financial institutions from their sample. |
Figure 1.
Actual percentage of banks that pay dividends for each year t.

Figure 2.
Difference between the actual and expected payout ratios.


Table 1.
Counts and percentages of banks in the sample counts of observations in Bank Compustat in year t. Dividend payers are firms who pay a dividend in year t.
Table 1.
Counts and percentages of banks in the sample counts of observations in Bank Compustat in year t. Dividend payers are firms who pay a dividend in year t.
| Counts of Firms | All Firms | Dividend Payers | Percentages |
|---|---|---|---|
| 1973–1977 | 696 | 652 | 93.68% |
| 1978–1982 | 853 | 812 | 95.19% |
| 1983–1987 | 952 | 849 | 89.18% |
| 1988–1992 | 1229 | 1036 | 84.30% |
| 1993–1997 | 2951 | 2464 | 83.50% |
| 1998–2002 | 3204 | 2805 | 87.55% |
| 2003–2007 | 2940 | 2550 | 86.73% |
| 2008–2014 | 3385 | 2476 | 73.15% |
| Total | 16,210 | 13,644 | 84.17% |
Table 2.
Selected descriptive statistics.
| N | Mean | Std. Dev. | Min | Max | |
|---|---|---|---|---|---|
| NYP | 16,203 | 4.6192 | 5.5068 | 0.0000 | 19.000 |
| Vt/At | 16,203 | 1.0297 | 0.0617 | 0.9298 | 1.2508 |
| dAt/Att | 16,203 | 0.0863 | 0.1131 | −0.2225 | 0.4742 |
| Ett/At | 16,203 | 0.0070 | 0.0083 | −0.0373 | 0.0229 |
| Lt/At | 16,203 | 0.9092 | 0.0370 | 0.7764 | 0.9679 |
| Yt/BEt | 16,203 | 0.0724 | 0.1361 | −0.5799 | 0.2449 |
| At ($B) | 16,203 | 17.8686 | 78.2748 | 0.0899 | 668.04 |
| REt/ BEt | 16,203 | 0.4212 | 0.4127 | −1.0172 | 1.1225 |
| REt/At | 16,203 | 0.0394 | 0.0359 | −0.0780 | 0.1330 |
| TEt/At | 16,203 | 0.0878 | 0.0337 | 0.0321 | 0.2236 |
| Risk | 16,203 | 0.0226 | 0.0136 | 0.0074 | 0.0859 |
Table 3.
Baseline logit regressions. This table provides results of logit regressions of the determinants of the likelihood a bank will pay dividends. The dependent variable equals one in year t if the bank pays dividends in year t and zero otherwise. The independent variables are profitability (Et/At), the growth rate of assets (dAt/At), NYP is the percentile of market capitalization in NYSE (New York Stock Exchange) firms, and the market-to-book ratio (Vt/At). T-statistics are reported in the parentheses. ***, **, and * indicate statistical significance at the 1%, 5%, and 10% level, respectively.
| 1973–2014 | 1973–2014 | 1973–1988 | 1973–1988 | 1989–1999 | 1989–1999 | 2000–2014 | 2000–2014 | |
|---|---|---|---|---|---|---|---|---|
| Intercept | −3.6663 *** | 0.8564 *** | −29.0848 *** | 0.0155 | −2.9807 *** | 0.4147 *** | −2.8859 *** | 0.9644 *** |
| (−5.65) | (17.69) | (−9.19) | (0.11) | (−2.61) | (5.70) | (−3.55) | (23.70) | |
| NYP | 0.1753 *** | 0.1942 *** | 0.3477 *** | 0.4107 *** | 0.2043 *** | 0.2196 *** | 0.1198 *** | 0.1343 *** |
| (19.72) | (22.14) | (11.25) | (13.97) | (12.23) | (13.47) | (11.98) | (13.52) | |
| Vt/At | 4.6021 *** | 30.1516 *** | 3.4075 *** | 3.8302 *** | ||||
| (6.99) | (9.22) | (2.97) | (4.74) | |||||
| dAt/At | −1.4116 *** | −1.2963 *** | 1.4887 * | 0.6883 | −0.1166 | 0.0023 | −2.4180 *** | −2.3186 *** |
| (−6.55) | (−6.02) | (1.79) | (0.85) | (−0.31) | (0.01) | (−8.62) | (−8.28) | |
| Et/At | 73.4226 *** | 78.3936 *** | 48.5868 *** | 59.1547 *** | 83.8876 *** | 87.9231 *** | 71.5836 *** | 76.2474 *** |
| (23.64) | (25.41) | (4.34) | (5.18) | (13.20) | (13.89) | (18.89) | (20.50) | |
| Time Effect | Yes | Yes | Yes | Yes | Yes | Yes | Yes | Yes |
| Pseudo-R square | 26.06% | 25.60% | 47.08% | 40.49% | 25.54% | 25.29% | 22.77% | 22.38% |
| # of Obs. | 16,203 | 16,203 | 2703 | 2703 | 5184 | 5184 | 8316 | 8316 |
Table 4.
Expected percentage of dividend payers versus actual payers based on baseline model. In this table, we apply the coefficients from the logit regressions in Table 3 estimated over the period 1973–1988 to the variable values in each year 1989–2014 to estimate the expected percentage of dividend payers in each year. We also show the actual percentage of dividend payers in each year to calculate the difference between the actual and expected percentages of dividend payers.
| Vt/At and dAt/At | dAt/At | ||||||
|---|---|---|---|---|---|---|---|
| Firms | Payer | Actual | Expected | Difference | Expected | Difference | |
| 1973–1988 | 2703 | 2486 | 91.97% | ||||
| 1989 | 254 | 222 | 87.40% | 78.32% | −9.09% | 86.34% | −1.06% |
| 1990 | 257 | 224 | 87.16% | 77.17% | −9.99% | 84.60% | −2.56% |
| 1991 | 257 | 213 | 82.88% | 73.02% | −9.86% | 85.39% | 2.51% |
| 1992 | 259 | 205 | 78.99% | 65.08% | −13.91% | 89.38% | 10.39% |
| 1993 | 256 | 216 | 84.38% | 78.82% | −5.55% | 90.68% | 6.31% |
| 1994 | 664 | 509 | 76.66% | 48.64% | −28.02% | 77.40% | 0.74% |
| 1995 | 699 | 579 | 82.81% | 53.12% | −29.69% | 77.88% | −4.93% |
| 1996 | 677 | 583 | 86.12% | 58.62% | −27.50% | 78.30% | −7.82% |
| 1997 | 655 | 577 | 88.09% | 62.65% | −25.45% | 81.22% | −6.87% |
| 1998 | 589 | 527 | 89.47% | 64.10% | −25.38% | 81.85% | −7.62% |
| 1999 | 621 | 548 | 88.23% | 61.50% | −26.72% | 79.57% | −8.65% |
| 2000 | 691 | 601 | 86.98% | 59.70% | −27.27% | 77.73% | −9.24% |
| 2001 | 655 | 565 | 86.24% | 60.92% | −25.32% | 77.56% | −8.68% |
| 2002 | 648 | 564 | 87.02% | 63.90% | −23.12% | 79.20% | −7.82% |
| 2003 | 638 | 559 | 87.62% | 67.05% | −20.57% | 78.17% | −9.45% |
| 2004 | 595 | 524 | 88.07% | 69.19% | −18.88% | 76.91% | −11.16% |
| 2005 | 580 | 503 | 86.72% | 71.43% | −15.30% | 76.81% | −9.91% |
| 2006 | 574 | 495 | 86.24% | 72.88% | −13.36% | 75.52% | −10.72% |
| 2007 | 553 | 469 | 84.81% | 71.41% | −13.40% | 71.40% | −13.41% |
| 2008 | 548 | 456 | 83.21% | 66.56% | −16.65% | 66.10% | −17.11% |
| 2009 | 525 | 386 | 73.52% | 67.25% | −6.28% | 58.12% | −15.41% |
| 2010 | 496 | 333 | 67.14% | 66.62% | −0.52% | 63.92% | −3.22% |
| 2011 | 475 | 312 | 65.61% | 63.96% | −1.65% | 68.85% | 3.24% |
| 2012 | 458 | 318 | 69.43% | 64.34% | −5.09% | 73.13% | 3.70% |
| 2013 | 449 | 326 | 72.61% | 65.52% | −7.09% | 74.91% | 2.31% |
| 2014 | 434 | 345 | 79.49% | 68.54% | −10.96% | 77.56% | −1.93% |
Table 5.
Logit regressions with additional variables. This table provides results of logit regressions of the determinants of the likelihood a bank will pay dividends. The dependent variable equals one in year t if the bank pays dividends in year t and zero otherwise. The independent variables are: Profitability (Et/At), growth rate of assets (dAt/At), percentile of market capitalization in NYSE firms (NYP), and market-to-book ratio (Vt/At). Other variables from the literature are also added. T-statistics are reported in the parentheses. ***, **, and * indicate statistical significance at the 1%, 5%, and 10% level, respectively.
| 1973–2014 | 1973–2014 | 1973–1988 | 1973–1988 | 1989–1999 | 1989–1999 | 2000–2014 | 2000–2014 | |
|---|---|---|---|---|---|---|---|---|
| Intercept | −2.9086 *** | 0.7871 *** | −5.5167 | 2.7199 *** | −5.3538 *** | 1.4042 *** | −1.8306 ** | 1.2325 *** |
| (−4.26) | (4.55) | (−1.13) | (4.31) | (−4.34) | (4.87) | (−2.08) | (6.21) | |
| NYP | 0.1148 *** | 0.1285 *** | 0.2570 *** | 0.2643 *** | 0.1163 *** | 0.1472 *** | 0.0994 *** | 0.1105 *** |
| (13.12) | (14.86) | (8.18) | (8.50) | (6.84) | (8.76) | (9.38) | (10.63) | |
| Vt/At | 3.6834 *** | 8.6022 * | 6.7973 *** | 3.0005 *** | ||||
| (5.60) | (1.71) | (5.61) | (3.59) | |||||
| dAt/At | −1.1986 *** | −1.0821 *** | 1.5066 * | 1.5825 * | −0.3422 | −0.0059 | −1.9369 *** | −1.8592 *** |
| (−5.23) | (−4.74) | (1.72) | (1.80) | (−0.84) | (−0.01) | (−6.53) | (−6.29) | |
| Et/At | 28.4330 *** | 32.8168 *** | 4.7862 | 7.2129 | 37.3416 *** | 47.2735 *** | 17.1903 *** | 21.0961 *** |
| (7.87) | (9.26) | (0.35) | (0.53) | (5.17) | (6.67) | (3.74) | (4.73) | |
| REt/BEt | 1.4917 *** | 1.5351 *** | 0.8073 *** | 1.1796 *** | 0.9221 *** | 0.9542 *** | 2.0061 *** | 2.0141 *** |
| (22.95) | (23.65) | (2.79) | (5.92) | (8.00) | (8.29) | (20.07) | (20.15) | |
| Risk | −54.97 *** | −54.59 *** | −100.40 *** | −95.914 *** | −62.14 *** | −56.83 *** | −52.72 *** | −53.53 *** |
| (−20.63) | (−20.50) | (−7.57) | (−7.52) | (−12.74) | (−12.17) | (−15.28) | (−15.56) | |
| TEt/At | 1.3526 * | 1.0933 | −0.4520 | −0.4641 | 11.2783 *** | 11.5086 *** | −2.6279 ** | −3.0447 *** |
| (1.51) | (1.22) | (−0.07) | (−0.08) | (6.25) | (6.18) | (−2.41) | (−2.82) | |
| Recession | 5.3146 *** | 5.0219 *** | 0.2751 | 0.1682 | 0.4922 | −0.4343 | 3.5626 *** | 3.6155 *** |
| (11.45) | (10.91) | (0.35) | (0.21) | (0.58) | (−0.52) | (7.71) | (7.84) | |
| Time Effect | Yes | Yes | Yes | Yes | Yes | Yes | Yes | Yes |
| Pseudo-R squared | 37.80% | 37.53% | 55.34% | 55.13% | 36.89% | 36.03% | 35.99% | 35.79% |
| # of Obs. | 16,203 | 16,203 | 2703 | 2703 | 5184 | 5184 | 8316 | 8316 |
Table 6.
Expected percentage of dividend payers versus actual payers based on models in Table 5. In this table, we apply the coefficients from the logit regressions in Table 5 estimated over the period 1973–1988 to the variable values in each year 1989–2014 to estimate the expected percentage of dividend payers in each year. We also show the actual percentage of dividend payers in each year to calculate the difference between the actual and expected percentages of dividend payers.
| Vt/At and dAt/At | dAt/At | ||||||
|---|---|---|---|---|---|---|---|
| Firms | Payer | Actual | Expected | Difference | Expected | Difference | |
| 1973–1988 | 2703 | 2486 | 91.97% | ||||
| 1989 | 254 | 222 | 87.40% | 84.92% | −2.49% | 82.91% | −4.49% |
| 1990 | 257 | 224 | 87.16% | 79.03% | −8.13% | 77.70% | −9.46% |
| 1991 | 257 | 213 | 82.88% | 78.54% | −4.34% | 75.89% | −6.99% |
| 1992 | 259 | 204 | 78.76% | 82.63% | 3.87% | 79.14% | 0.38% |
| 1993 | 256 | 216 | 84.38% | 91.07% | 6.69% | 89.98% | 5.60% |
| 1994 | 664 | 509 | 76.66% | 75.15% | −1.50% | 73.78% | −2.88% |
| 1995 | 699 | 579 | 82.83% | 80.95% | −1.88% | 78.35% | −4.48% |
| 1996 | 677 | 583 | 86.12% | 86.69% | 0.58% | 83.57% | −2.55% |
| 1997 | 655 | 577 | 88.09% | 90.88% | 2.78% | 84.38% | −3.71% |
| 1998 | 589 | 527 | 89.47% | 85.81% | −3.66% | 81.42% | −8.05% |
| 1999 | 621 | 548 | 88.24% | 83.06% | −5.18% | 80.93% | −7.31% |
| 2000 | 691 | 601 | 86.98% | 76.62% | −10.36% | 76.07% | −10.90% |
| 2001 | 655 | 565 | 86.26% | 86.67% | 0.41% | 83.73% | −2.53% |
| 2002 | 648 | 564 | 87.04% | 89.63% | 2.59% | 87.20% | 0.16% |
| 2003 | 638 | 559 | 87.62% | 93.44% | 5.82% | 88.88% | 1.26% |
| 2004 | 595 | 524 | 88.07% | 93.67% | 5.61% | 89.17% | 1.11% |
| 2005 | 580 | 503 | 86.72% | 93.62% | 6.90% | 89.70% | 2.98% |
| 2006 | 574 | 495 | 86.24% | 94.17% | 7.93% | 90.55% | 4.31% |
| 2007 | 553 | 469 | 84.81% | 88.07% | 3.26% | 85.41% | 0.60% |
| 2008 | 548 | 456 | 83.21% | 51.55% | −31.67% | 51.75% | −31.47% |
| 2009 | 525 | 386 | 73.52% | 44.16% | −29.36% | 44.60% | −28.93% |
| 2010 | 496 | 333 | 67.14% | 60.95% | −6.19% | 61.56% | −5.57% |
| 2011 | 475 | 312 | 65.68% | 67.85% | 2.17% | 69.56% | 3.88% |
| 2012 | 458 | 318 | 69.43% | 78.00% | 8.57% | 78.21% | 8.77% |
| 2013 | 449 | 326 | 72.61% | 85.73% | 13.12% | 83.98% | 11.38% |
| 2014 | 434 | 345 | 79.49% | 90.20% | 10.70% | 88.81% | 9.31% |
Table 7.
OLS (ordinary least square) regressions of the determinants of the payout ratio. This table provides results of OLS regressions of the determinants of the payout ratio. The dependent variable equals total dividend over income (following Farre-Mensa et al. 2014). The independent variables are: Profitability (Et/At), growth rate of assets (dAt/At), percentile of market capitalization in NYSE firms (NYP), and market-to-book ratio (Vt/At). Other variables from the literature are also added. Standard errors are clustered at the firm level. T-statistics are reported in the parentheses. ***, **, and * indicate statistical significance at the 1%, 5%, and 10% level, respectively.
| 1973–2014 | 1973–2014 | 1973–1988 | 1973–1988 | 1989–1999 | 1989–1999 | 2000–2014 | 2000–2014 | |
|---|---|---|---|---|---|---|---|---|
| Int | −0.2249 *** | 0.3307 *** | −0.0806 | 0.4724 *** | −0.3031 *** | 0.3587 *** | −0.1024 | 0.3347 *** |
| (−2.68) | (16.64) | (−0.38) | (10.25) | (−3.08) | (14.26) | (−0.97) | (13.07) | |
| NYP | 0.0038 *** | 0.0051 *** | −0.0008 | −0.0005 | 0.0070 *** | 0.0091 *** | 0.0036 *** | 0.0045 *** |
| (4.92) | (7.01) | (−0.66) | (−0.37) | (6.91) | (9.75) | (3.42) | (4.51) | |
| Vt/At | 0.5772 *** | 0.5800 *** | 0.6998 *** | 0.4544 *** | ||||
| (6.59) | (2.47) | (6.83) | (4.19) | |||||
| dAt/At | −0.2626 *** | −0.2294 *** | −0.2099 *** | −0.1848 *** | −0.0979 *** | −0.0490 * | −0.3744 *** | −0.3491 *** |
| (−12.32) | (−10.88) | (−5.57) | (−5.18) | (−3.50) | (−1.72) | (−11.45) | (−10.77) | |
| Et/At | −15.99 *** | −12.11 *** | −27.29 *** | −25.43 *** | −19.9261 *** | −14.42 *** | −12.6530 *** | −9.4681 *** |
| (−16.28) | (−13.37) | (−7.37) | (−8.11) | (−12.71) | (−10.74) | (−10.19) | (−7.88) | |
| REt/BEt | −0.0103 | −0.0016 | −0.0309 | −0.0062 | −0.0502 ** | −0.0411 ** | 0.0041 | 0.0060 |
| (−0.84) | (−0.13) | (−1.35) | (−0.31) | (−2.55) | (−2.14) | (0.22) | (0.32) | |
| Risk | −1.8361 *** | −1.7984 *** | −2.5241 * | −2.3915 * | −1.4596 *** | −0.9434 * | −1.5823 *** | −1.6691 *** |
| (−4.98) | (−4.91) | (−1.84) | (−1.77) | (−2.62) | (−1.69) | (−3.21) | (−3.39) | |
| TEt/At | 1.4400 *** | 1.3488 *** | 2.4099 *** | 2.3282 *** | 2.0558 *** | 1.8500 *** | 1.2174 *** | 1.1769 *** |
| (12.21) | (11.55) | (4.45) | (4.42) | (12.76) | (11.38) | (7.78) | (7.59) | |
| Recession | 0.1922 *** | 0.1881 *** | 0.0324** | 0.0213 | −0.0061 | −0.0265 * | 0.1833 *** | 0.1847 *** |
| (10.35) | (10.25) | (2.23) | (1.47) | (−0.40) | (−1.75) | (9.39) | (9.43) | |
| Time Effect | Yes | Yes | Yes | Yes | Yes | Yes | Yes | Yes |
| Adj. R squared | 17.23% | 15.72% | 28.00% | 27.41% | 21.30% | 18.75% | 14.99% | 14.05% |
| # of Obs. | 12,599 | 12,599 | 2383 | 2383 | 4036 | 4036 | 6180 | 6180 |
Table 8.
Expected percentage of dividend payers versus actual payers based on OLS regressions in Table 7. In this table, we apply the coefficients from the OLS regressions in Table 7 estimated over the period 1973–1988 to the variable values in each year 1989–2014 to estimate the expected payout ratio in each year. We also show the actual percentage of dividend payers in each year to calculate the difference between the actual and expected percentages of dividend payers.
| Vt/At and dAt/At | dAt/At | ||||||
|---|---|---|---|---|---|---|---|
| Firm | Payout Firm | Payout Ratio | Expected | Difference | Expected | Difference | |
| 1973–1988 | 2703 | 2451 | 41.21% | ||||
| 1989 | 254 | 160 | 35.66% | 34.20% | −1.46% | 33.57% | −2.09% |
| 1990 | 257 | 138 | 41.12% | 36.96% | −4.16% | 36.52% | −4.61% |
| 1991 | 257 | 135 | 37.77% | 38.56% | 0.78% | 36.73% | −1.05% |
| 1992 | 259 | 154 | 33.01% | 34.54% | 1.54% | 33.09% | 0.09% |
| 1993 | 256 | 216 | 31.65% | 31.92% | 0.27% | 30.47% | −1.17% |
| 1994 | 664 | 512 | 31.24% | 34.26% | 3.02% | 33.62% | 2.38% |
| 1995 | 699 | 572 | 31.72% | 37.56% | 5.85% | 35.92% | 4.21% |
| 1996 | 677 | 556 | 35.70% | 39.40% | 3.70% | 36.83% | 1.12% |
| 1997 | 655 | 559 | 33.58% | 41.20% | 7.62% | 35.22% | 1.65% |
| 1998 | 589 | 508 | 36.16% | 37.99% | 1.83% | 33.91% | −2.24% |
| 1999 | 621 | 526 | 36.75% | 35.81% | −0.94% | 33.68% | −3.08% |
| 2000 | 691 | 574 | 37.04% | 36.26% | −0.78% | 34.89% | −2.16% |
| 2001 | 655 | 538 | 36.81% | 42.01% | 5.20% | 38.61% | 1.80% |
| 2002 | 648 | 548 | 33.86% | 37.24% | 3.38% | 34.65% | 0.79% |
| 2003 | 638 | 538 | 36.09% | 40.29% | 4.21% | 35.56% | −0.52% |
| 2004 | 595 | 492 | 36.79% | 41.31% | 4.52% | 36.41% | −0.38% |
| 2005 | 580 | 483 | 37.40% | 40.30% | 2.90% | 36.15% | −1.24% |
| 2006 | 574 | 478 | 39.92% | 43.19% | 3.27% | 38.80% | −1.13% |
| 2007 | 553 | 404 | 45.05% | 45.76% | 0.71% | 42.72% | −2.33% |
| 2008 | 548 | 246 | 50.14% | 44.48% | −5.67% | 42.46% | −7.69% |
| 2009 | 525 | 223 | 50.45% | 45.56% | −4.90% | 43.67% | −6.79% |
| 2010 | 496 | 290 | 44.28% | 46.49% | 2.21% | 45.48% | 1.20% |
| 2011 | 475 | 321 | 39.73% | 45.61% | 5.88% | 45.62% | 5.89% |
| 2012 | 458 | 341 | 36.19% | 45.64% | 9.45% | 45.26% | 9.07% |
| 2013 | 449 | 343 | 35.38% | 47.21% | 11.84% | 45.08% | 9.71% |
| 2014 | 434 | 361 | 35.49% | 47.90% | 12.41% | 46.05% | 10.56% |
Publisher’s Note: MDPI stays neutral with regard to jurisdictional claims in published maps and institutional affiliations. |
© 2021 by the authors. Licensee MDPI, Basel, Switzerland. This article is an open access article distributed under the terms and conditions of the Creative Commons Attribution (CC BY) license (http://creativecommons.org/licenses/by/4.0/).
Share and Cite
MDPI and ACS Style
Lai, S.; Wang, Q.; Du, J.; Pi, S. Has the Propensity to Pay Dividends Declined? Evidence from the US Banking Sector. J. Risk Financial Manag. 2021, 14, 103. https://0-doi-org.brum.beds.ac.uk/10.3390/jrfm14030103
AMA Style
Lai S, Wang Q, Du J, Pi S. Has the Propensity to Pay Dividends Declined? Evidence from the US Banking Sector. Journal of Risk and Financial Management. 2021; 14(3):103. https://0-doi-org.brum.beds.ac.uk/10.3390/jrfm14030103
Chicago/Turabian StyleLai, Shaojie, Qing Wang, Jiangze Du, and Shuwen Pi. 2021. "Has the Propensity to Pay Dividends Declined? Evidence from the US Banking Sector" Journal of Risk and Financial Management 14, no. 3: 103. https://0-doi-org.brum.beds.ac.uk/10.3390/jrfm14030103