
What Problem Is Post-Crisis QE Trying to Solve?

1
Board, Association of Americans Resident Overseas (AARO), 75006 Paris, France
2
School of Economics, Faculty of Arts and Social Sciences, Camperdown, Sydney, NSW 2006, Australia
*
Author to whom correspondence should be addressed.
J. Risk Financial Manag. 2022, 15(2), 40; https://0-doi-org.brum.beds.ac.uk/10.3390/jrfm15020040
Submission received: 29 September 2021
/
Revised: 3 January 2022
/
Accepted: 5 January 2022
/
Published: 18 January 2022
(This article belongs to the Special Issue The Financial System in a Post COVID-19 World)
Abstract
:What problem the Fed and other central banks are solving by printing money and letting interest rates fall to zero is the focus of this paper. This activity does not appear to affect nominal GDP or inflation prior to COVID, and yet central bank liabilities have continued to rise. This suggests the presence of rising cash demand that has prevented excess cash and inflation pressures from emerging. While there was some hope that quantitative easing would be a new instrument in addition to interest rates as far as monetary policy goals were concerned, this has not proved to be the case. Instead, banking system demand for central bank liabilities keeps rising as an endogenous response to the changed business models of banks forced on them by post-crisis re-regulation and extremely low interest rates. These ideas were tested with cointegration and error correction econometric techniques. Examples of the growing risk of leverage and counterparty risks in this disequilibrium process are provided.
1. Introduction
Almost two decades ago, Goodfriend (2002) pointed out that were the Fed to pay interest on bank reserves, it would set a floor for the Fed Funds rate. By so doing, this would create an additional policy instrument in Quantitative Easing (QE). The Fed could keep printing money to achieve more lending without piercing the interest rate floor due to arbitrage (see also Bernanke and Reinhart 2004). The Fed began to pay interest on reserves in 2008 and commenced the first of what would be a series of QE policies.1 If there is no changing bank stock demand for central bank liabilities that banks must hold, then excess balances would emerge. Eventually these would be lent, spilling into demand and inflation—the additional instrument of policy.
While banks cannot get rid of the nominal Fed liabilities, they would do so in real terms through rising prices. This paper argues, however, that there is a demand for central bank reserves which has prevented this from happening. Moreover, it argues that bank regulation has incentivised a shift in the business models of banks towards their interaction with shadow banking in the post-2008 era. The approach to policy appears to be unstable by both promoting and accommodating this business model shift. If it were not accommodated, interest rate outcomes inconsistent with (i.e., above) what the Fed was trying to achieve would emerge.
The period post the global crisis and prior to COVID (2007–2019) needs to be distinguished from 2020 and 2021. This is because the latter years have both (i) the on-going structural business model change aspect that is the focus of this paper; and (ii) an additional complication of Treasury funding of the Cares Act and subsequent support for the economy (See for example Office of Management and Budget 2021). The issue about inflation in 2020–2021 arises because of the unprecedented rise and subsequent run-down of the Treasury General Account at the Federal Reserve causing monetary aggregates in the hands of the non-bank private sector to rise sharply unlike prior QE episodes. This issue is left for future research.
The next section sets out the motivation for the paper and the gap it is addressing vis-a-vis the literature. Section 3 provides an overview of monetary developments since the financial crisis of 2008 with a focus on QE. It identifies key elements, some regulatory, that have generated this very large rise in cash reserves. It presents this alongside some of the parallel developments in bank and shadow bank business models to which this has given rise.
Section 4 provides a simple theoretical explanation of these developments. It calls attention to what appear to be disequilibrating interactions between monetary policy and the banking system. It explores the issues empirically with a cointegration and error correction modelling framework. Section 5 examines the lack of inflation and equity market bubbles during 2007–2019 as being consistent with the presence of a rising demand for reserves—i.e., the absence of excess reserves spilling into these variables. Section 6 examines some of the system-wide risks that may be emerging and the difficulty there may be in reversing the current approach to policy. The example of the Credit Suisse and Archegos episode in 2021 is used as an example. The final section concludes with a summary and future research possibilities.
2. Motivation and Literature Review
Much of the academic literature from Diamond and Dybvig (1983) to the present day has treated the demand for liquidity in a narrowly defined banking system: banks take deposits and lend longer term. A sudden withdrawal of deposits may cause healthy banks with illiquid assets to fail. Cash is held to manage these risks. There are stronger and larger banks versus weaker and smaller banks. An interbank market is formed, and the discount window of the central bank plays a last resort role.
Complications arise in the post-2008 period because QE has made cash abundant. When reserves are scarce, banks contact each other, and banks with excess reserves lend to those with deficient reserves, negotiating the rate bilaterally. With abundant reserves they don’t need to lend to each other—the interbank market doesn’t function as before.
From the perspective of central bank operations, empirical studies of cash demand are most often part of a model of the Fed Funds market, focusing on daily operations and settlement (Afonso and Lagos 2015; Afonso and Lester 2018). Other studies focus on a broader concept of liquidity requirements of which central bank reserves are only one part. The ‘liquidity’ of assets and liabilities are attributed, and a weighting scheme is imposed for an aggregate concept. The Fed Funds rate is one of the drivers of bank’s management of this liquidity (For example, Berger and Bouwman 2017).
At the mechanical accounting level banks are the residual holders of all base money not held by the public in the form of cash. In this sense the banking system cannot get rid of the excess cash unless it does a transaction with the central bank (at the authority’s discretion). If there is no demand for central bank money, individual banks can always get rid of excess cash in real terms by lending it for spending decisions or exchange rate transactions. Central bank money would ‘slosh’ from bank-to-bank, loans and monetary aggregates would expand in addition to central bank money (as with the traditional credit multiplier). Inflation would rise and the exchange rate would fall (augmenting the inflation pressure). The real value of base money would fall.
However, during the post-crisis period prior to COVID2, monetary aggregates, the US dollar exchange rate and inflation have been remarkably stable.3 In this period central banks like the Fed were trying to keep interest rates low. If they had to expand central bank money at unprecedented rates to achieve this goal, there must have been a rising demand for central bank money for reasons that need to be explored. To our knowledge there is little literature focused on this issue.
In this paper the banking system considered is one that has undergone substantial structural change in response to re-regulation post-2008. It has seen reduced avenues for earnings growth from traditional consumer banking and a greatly increased cost for banks using their own balance sheets in risk taking securities businesses.
This changed environment for global systemically important banks (GSIBs)4 came about via three key factors: (1) stronger regulation of these banks that run the global derivatives and securities lending businesses, making it too costly to keep large open risk positions on their balance sheets or in Variable Interest Entities (VIE’s, or linked off-balance sheet structures); (2) low interest rates post-2008 that make net interest income a poor avenue for bank profit growth, and which make deposits less interesting for investors (who seek higher returns in structured products and other higher risk investments); and (3) an unregulated environment for shadow banks that could play a larger role in risk-taking in areas where banks once dominated.
The line between shadow banks and banks has become blurred, and banks have responded accordingly with profit growth considerations in mind. The business model of GSIBs today does not resemble the business model of much of the theoretical banking literature. GSIBs in advanced countries focus less on consumer banking and more on institutional client services. The institutional clients are hedge funds, mutual funds, insurance companies, and high net worth families outside of the banking system. GSIBs focus on fees, commissions and spreads with these institutional clients and the multiple re-use of securities (notably through collateralised counterparty transactions involving rehypothecation and securities lending). Banks aim for minimal direct exposure to more costly open risk positions. Instead, they facilitate the shift in such activities (higher risk exposure) to the shadow bank sector.
For example, Citigroup in 2020 had a $2.2tn balance sheet (with only $1.3tn in deposits on the liability side and $650bn in loans). However, its business is associated with a notional value of derivatives of some $40tn which, with netting, shows up as miniscule exposure on the balance sheet. Its re-pledgeable collateral businesses continue to grow strongly. Between 2008 and 2020, Citi’s cumulated net income from its consumer bank was $60.7bn, while that from its institutional client group was some $133.9bn. Citi’s collateral holdings grew from $576bn in 2008 to $1.14tn in 2020. These collateral amounts (such as posted for initial margins) form the basis of derivative exposures of vastly greater amounts mostly with counterparties in the shadow bank sector. Leverage in the system rises (See Blundell-Wignall et al. 2008 for a general discussion of how these issues led to the 2008 Crisis).
With derivatives netting and accounting practices very little of these amounts are recorded on consolidated bank balance sheets. They show up in smaller items such as brokerage receivables and payables. Nevertheless, movements in receivables and payables will depend on how institutions in rehypothecation and securities lending chains perform. The growth in these businesses in the new regulatory and low interest rate environment exposes Citi (and other GSIBs) to both credit and mismatch risks.
These businesses require increasing amounts of cash for three principal reasons: (1) banks have great uncertainty about how their counterparties will perform and need to be able to settle their liabilities in all market conditions; (2) counterparties have uncertainty about the bank and the nature of its dealings with other businesses so that cash holdings help the bank to maintain confidence in its business model; and (3) new regulatory requirements force banks to hold more cash as the size and complexity of their businesses grow (discussed further below).
We do not find a discussion of the demand for cash generated by this shift in business models in most of the academic literature. One relevant theoretical paper does see banks holding cash because they need to maintain market confidence in their activities, which is consistent with the discussion here (Calomiris et al. 2015). However, this paper too is discussing the issue within the context of a narrowly considered banking system without looking at new business models and the increasingly blurred line between banks and shadow banks. In another theoretical paper Guzman and Stiglitz (2020) suggest a better way to understand deep downturns like the 2008 financial crisis is to think of the economy experiencing a constant evolution, marked by uncertainty and learning in the face of macroeconomic inconsistencies—processes which may be disequilibrating. This is certainly the way the present authors think about re-regulation, bank business model shifts and QE policies (See Guzman and Stiglitz 2020).
As far as we know, this is the first attempt to look at the demand for central bank liabilities through the prism of these issues.
3. The Crisis, Re-Regulation Business and Model Changes
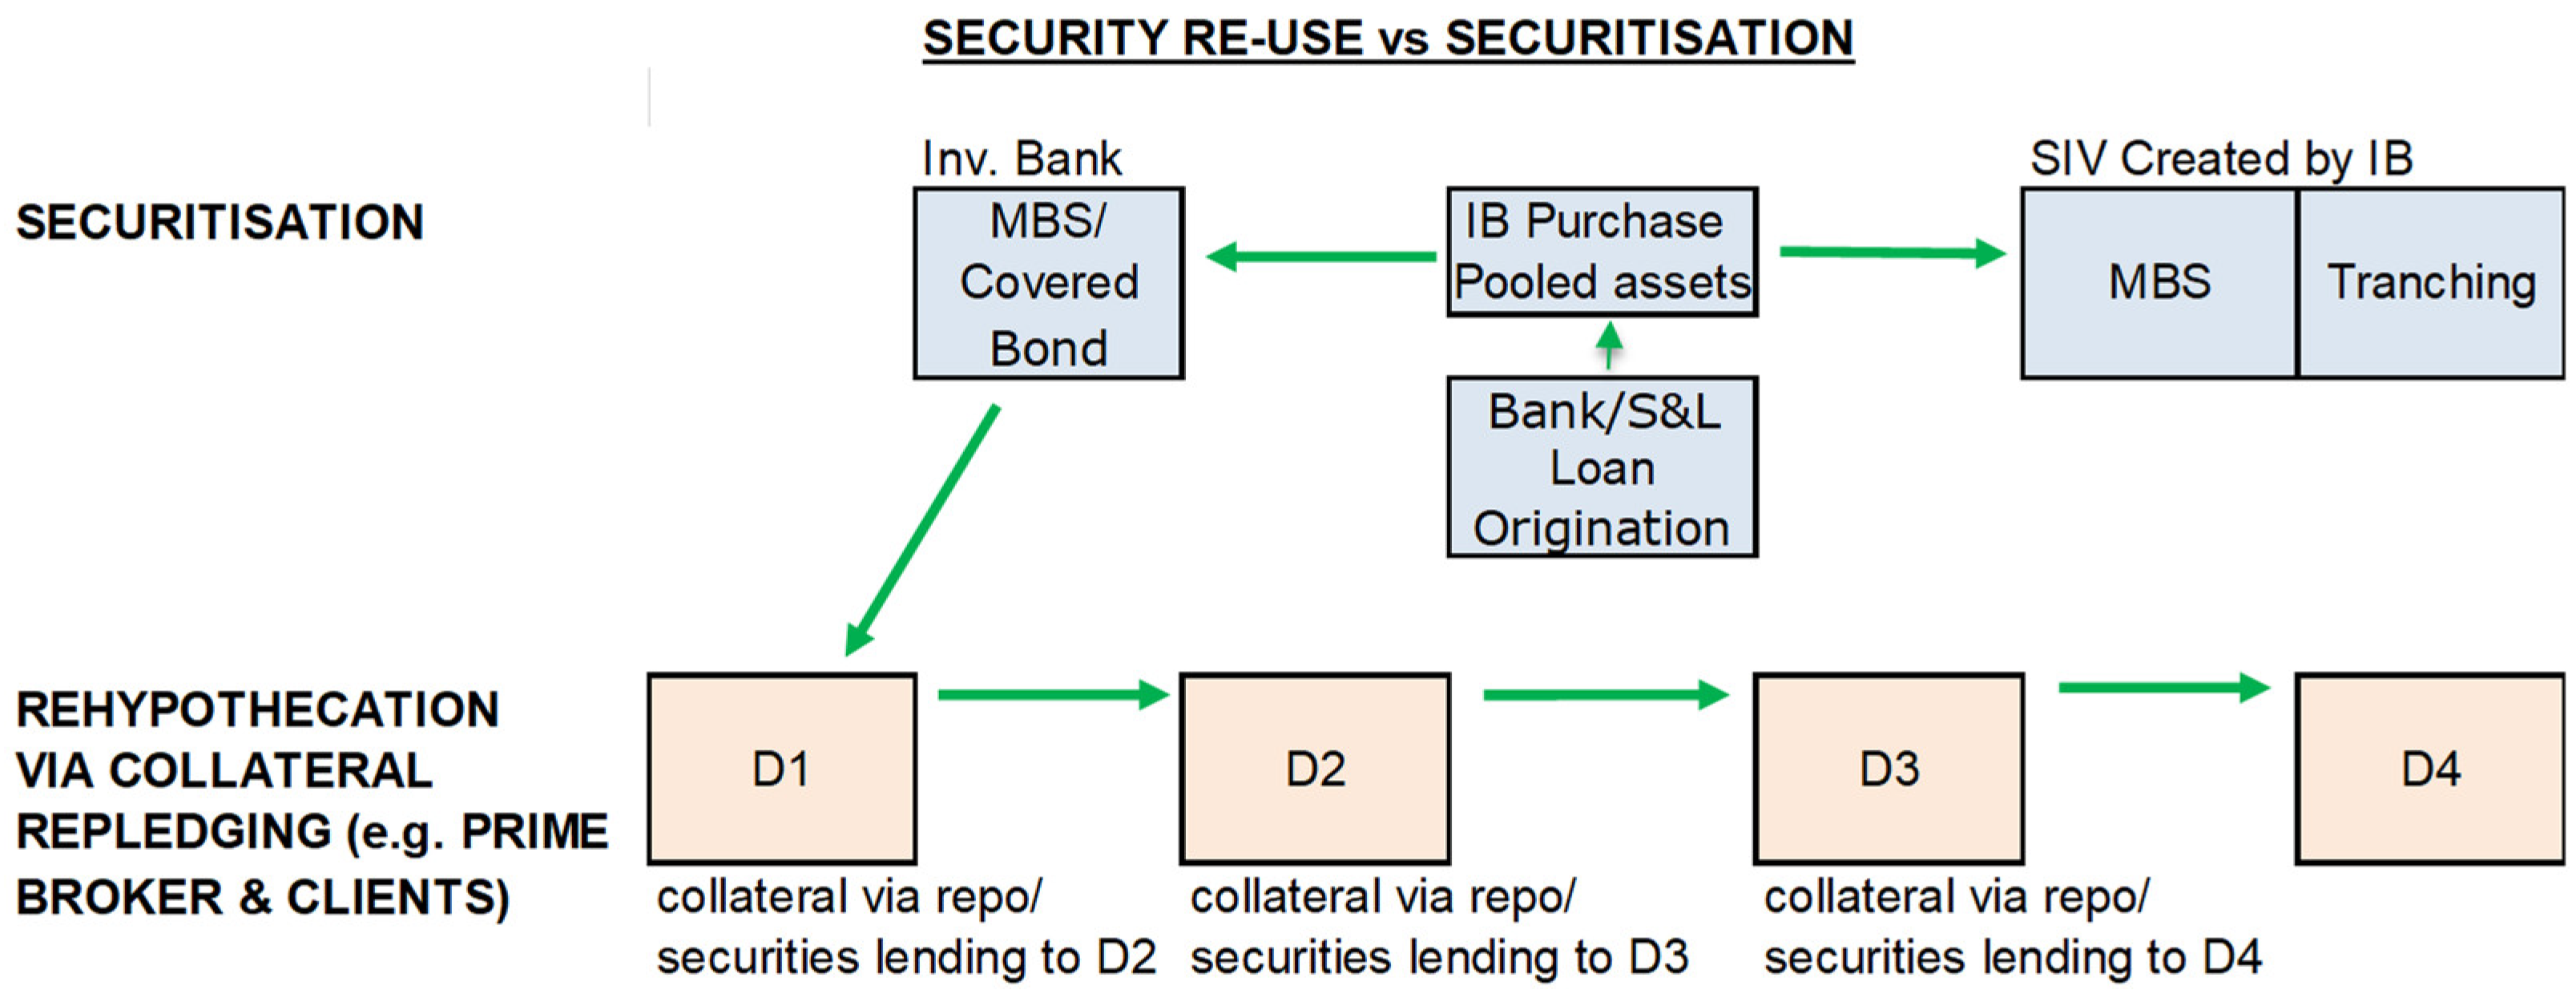
A key driver of the 2008 crisis was securitization, shown schematically in the top panel of Figure 1. In this example, a bank or a Saving & Loan (S&L) originates loans and sells (“distributes”) them to an investment bank (IB). The IB, in turn, securitizes these by pooling them in a special purpose entity (SPE) which is insulated from taxation of the pool’s income (by enabling legislation in the United States allowing corporate structures in tax havens). Slices, or “tranches” of the securities were ordered in terms of their seniority and sold to investors. This creates a “waterfall” effect, with owners of least senior equity and mezzanine tranches fully absorbing any losses from the first loan defaults, and owners of the most senior, usually AAA, tranches hit last of all. The bank normally agreed to service the securitised instruments sold to other institutions.
Cash or synthetic Collateralized Debt Obligations (CDOs), often based in the Cayman Islands, could also package a wider range of assets than residential mortgages, such as credit card debt and commercial real estate.
Once all tranches of a securitisation issue were sold the vehicles could be classified as Qualifying Special Purpose Entities (QSPEs) and excluded from the balance sheet. Where banks retained a financial interest and/or an element of control (or remained exposed through contractual agreements), the vehicles were classified as VIEs.
During the Crisis problems arose as VIE losses flowed through to investment banks, and reputational issues created pressures to rescue QSPEs. Furthermore, insurers from whom investment banks bought (under-priced) credit default swaps as devices to enhance the credit quality of securitisations (notably AIG and monoline insurers) could not honour their commitments without government support. With a large part of the risk in the entire system transferred to these insurers their ex ante insolvency threatened to collapse the entire financial system.
Another element of the Crisis was the use of securities as collateral for repurchase agreement (Repo) borrowing to take advantage of spread opportunities related to the different regulatory and tax treatments of securities between jurisdictions and between different issuers.5 For example, Bank A lends to Bank (B) with collateral of a high-yield security and buys a Credit Default Swaps (CDS) from Bank (C) to reduce its risk weighting under Basel rules. Bank (C) is looking to add premiums to other products it sells. That bank hedges its exposure with a non-bank financial institution (like an insurer not covered by Basel bank rules), reducing its exposure to regulation and increasing the business of the insurer.
Rehypothecation also played a key role in the Crisis (shown in the bottom panel of Figure 1). In the United States broker/dealer re-use of incoming collateral is limited to 140% of a loan from another institution, but this does not apply to banks and such rules were generally absent in Europe.6 Key features of the crisis were the collapse in valuations of collateral and subprime mortgage defaults. The uncertainty about credit valuation shifts saw both increased rates in the interbank market and haircuts on the use of collateral.7 In the end the lack of trust was so high that the interbank market froze, and the Fed had to come in with the QE1 expansion and a policy of low interest rates. At first this could be justified by the lender-of last-resort role of the central bank in a major crisis—a role with a long tradition in central banking (Bagehot [1873] 1962). However, this was not reversed and the subsequent QE2 and QE3 exercises have little in common with that history.
At the same time ex ante defaults of multiple institutions required government intervention on a massive scale to prevent a cascading collapse. To prevent a crisis of this sort from ever happening again, policies were announced to recapitalise and re-regulate the financial system.8
3.1. Capital Adequacy
The 2008 financial crisis occurred because risk was under-priced in business segments that are based on counterparty positions—essentially derivatives, securities lending and Security Funding Transactions (SFTs). The Basel Committee on Banking Supervision (BCBS) focused mainly on capital adequacy regulations.
The changes to Basel risk weights, new leverage ratio requirements, capital buffers and tougher rules for GSIBs depending on their perceived level of vulnerability were the centrepiece of these reforms. These capital rules, together with securitisation reforms, stress testing, exposure limits, outright bans and reporting requirements have made leverage, and open counterparty positions more expensive for banks and their broker/dealer subsidiaries.9
3.2. Liquidity Regulation
The Liquidity Coverage Ratio (LCR) requires banks to hold much more cash and other high quality liquid assets. The United States separates the stringency of this regulation according to a number of factors, notably, size, cross-jurisdiction activity, risk-weighted short-term wholesale funding, and non-bank asset holdings. Parameters reflect the nature of the organisation (e.g., a large derivatives investor) and off-balance-sheet counterparty exposures. Four categories are identified, with category “I” the most stringent and “IV” the least. Category I consists of the GSIBs and their Depository Institution subsidiaries. These are large complex institutions that dominate counterparty business activity. Categories II-IV include Intermediate Holding Companies (IHC’s), the subsidiaries of foreign banking organisations that are also GSIBs. Category II captures firms with assets greater than USD 700bn, or (critically) cross-jurisdictional activity greater that USD 75bn.10
The LCR requires such institutions to hold high quality liquid assets (HQLA) that could cover projected cash outflows minus inflows for 30 days of high market stress. GSIB business has been increasing in precisely the areas where the LCR requirements bite the most harshly.
3.3. Resulting Shifts in Business Models
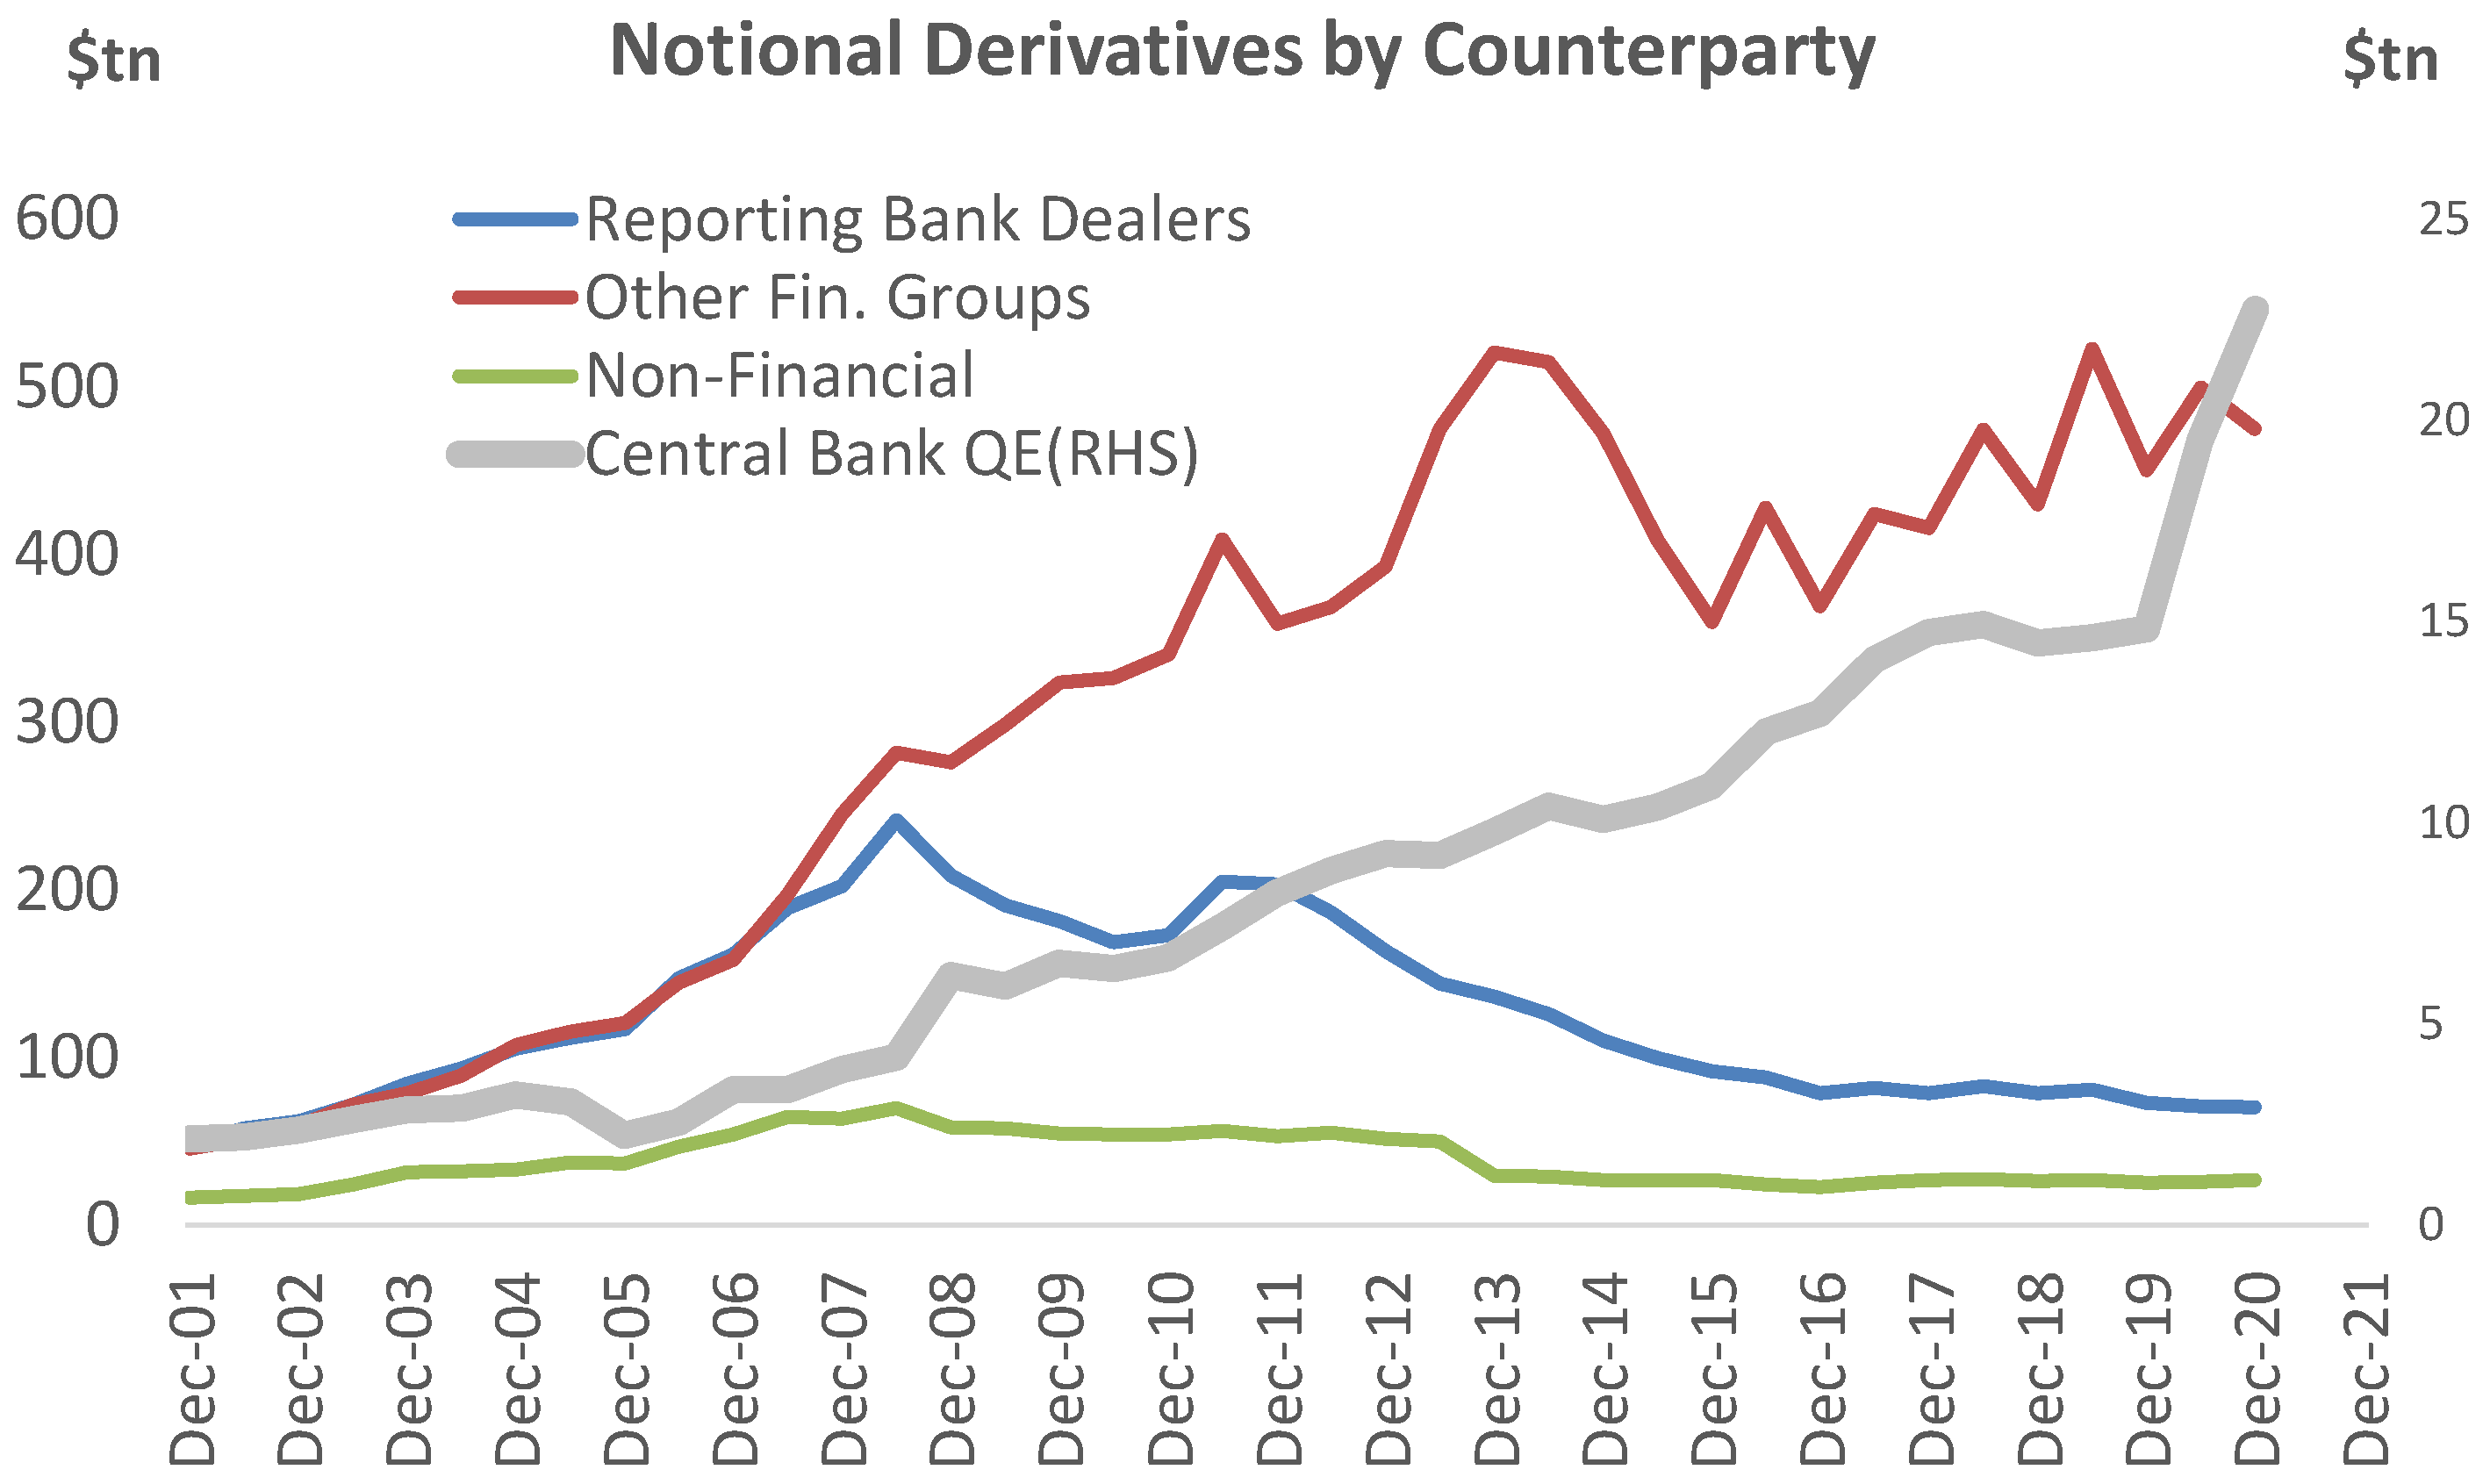
The trends that have emerged following these changes are quite remarkable. Figure 2 shows derivative contracts being shifted away from other bank broker/dealer counterparties towards financial groups where sits (for example) the hedge fund industry. Most of this shift was completed by 2016. Banks hold fewer structured products on their balance sheet and carry out no proprietary trading in the United States due to the Dodd-Frank ban. Instead, they act as intermediaries for shadow banks that increasingly hold them. The notional value of derivatives attributed to bank counterparties has fallen by 70% since the crisis (the blue line) while that for non-bank financial institutions has continued to expand (the red line), a natural outcome of the regulatory arbitrage process.
The balance sheet of four central banks (the US Fed, the ECB, the BOJ, and the BOE) in US dollars is also shown in Figure 2. As the bank and non-bank financial derivatives lines have diverged, the amount of cash banks demand to hold at central banks has increased in line. The surge in central bank liabilities since 2020, bringing the latest figure to USD 23tn, is due to the response to COVID. However, even before COVID cash outstanding had reached USD 15tn, which compares to USD 3.3tn in 2006, an amount that had been quite sufficient to ensure adequate liquidity in the interbank market at the time.
In the case of the United States, Fed liabilities sat steadily in the range of 5–6% of GDP between 1980 and 2007. QE1 took this ratio to 15% following the crisis, and QE2 and QE3 took it to 25% by October 2014.
4. Non-Stationary Demand and Supply and Cointegration Tests
The upshot of the above discussion is that an unintended consequence of the Crisis and financial re-regulation and monetary policy that followed appears to be a series of disequilibrating interactions with the financial system. The hope that QE and interest rate policy could be separated because the demand for cash would be stable and become infinitely elastic at the interest rate on reserves appears not to be consistent with the facts. Market responses to the incentives created by the interaction of monetary policy and re-regulation have required successive increases in central bank money to sustain the low interest rate policy.
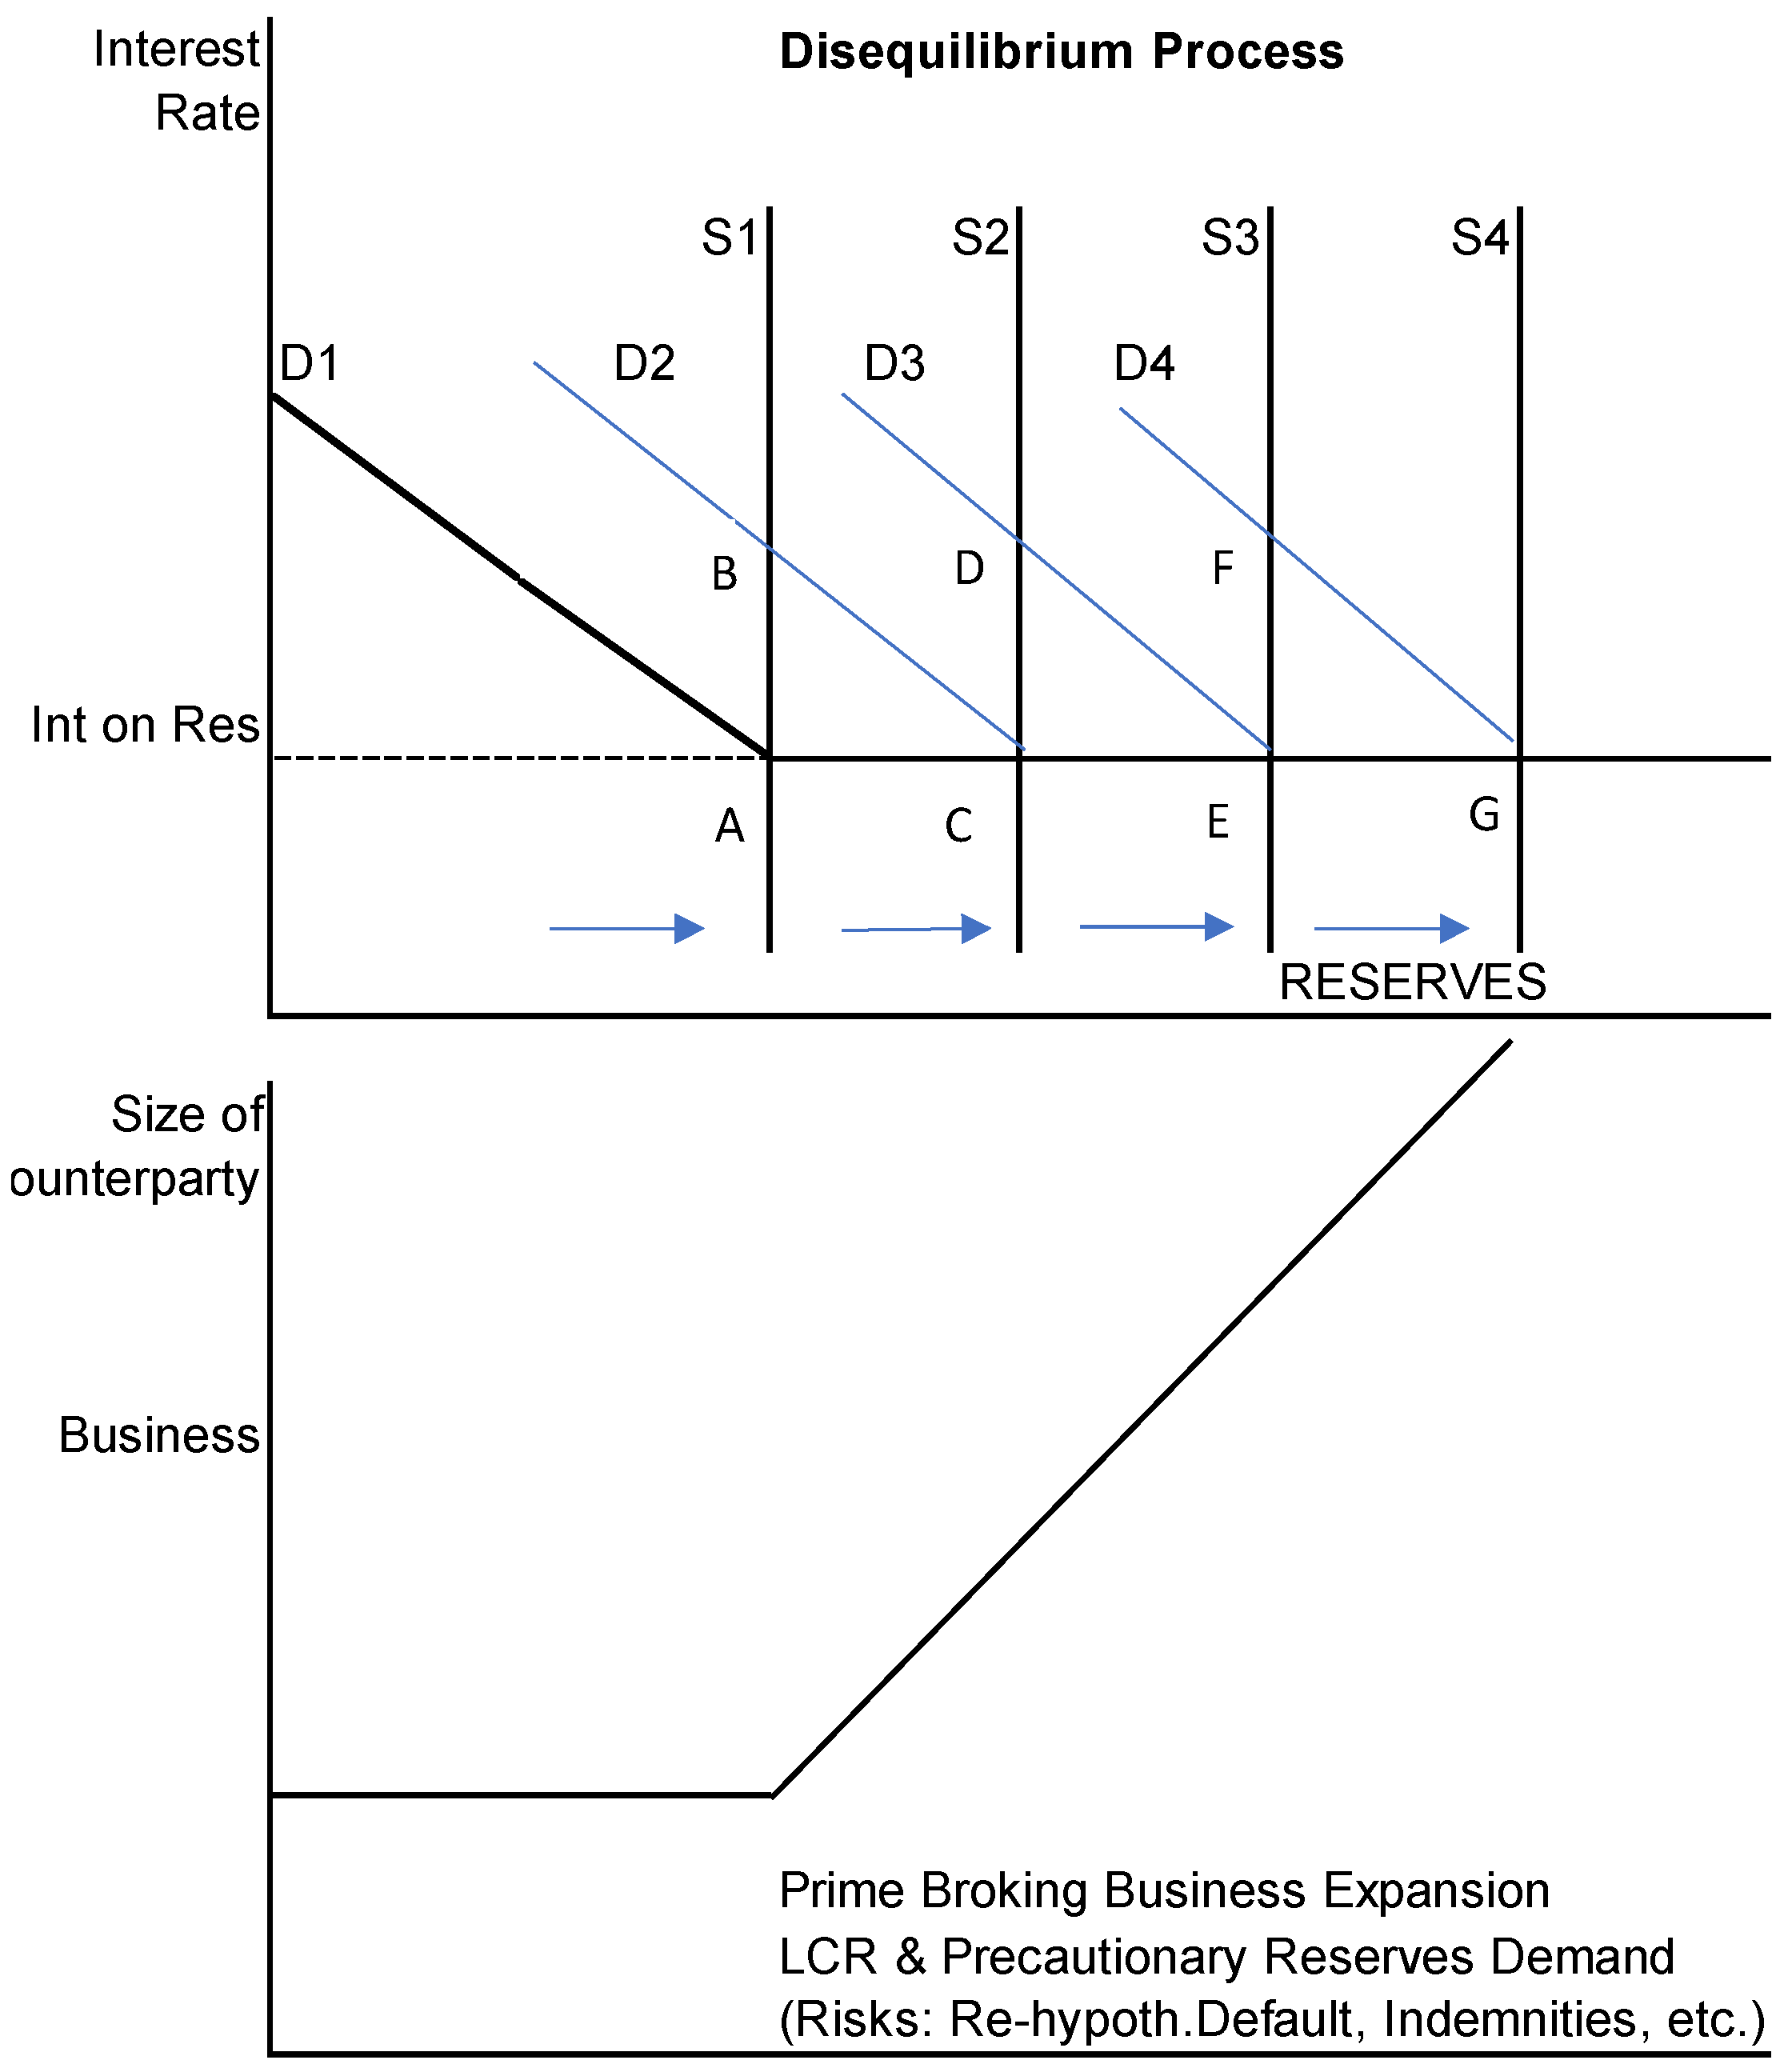
Figure 3 shows hypothetical demand and supply curves for cash reserves at the central bank. If the demand curve D1 were stable, then shifting the supply curve to intersection with the elastic part of the curve at the interest rate on reserves would indeed allow QE to be directed at other objectives—for example, lending, nominal GDP, and the currency. However, if the demand curve were moving to the right (D2, D3, D4), say in response to financial activity elsewhere in the system, then rates in the interbank market would rise. There would be flow-on effects to security price volatility, collateral values, and margin calls in derivatives contracts, unless the central bank supply curve moved in line (S2, S3, S4). This appears to be what has been happening to generate QE2 and QE3. When pressure points like B, D and F arise the Fed appears eventually to respond, shifting supply so that equilibrium moves to C, E, and G. The bottom panel of Figure 3 represents the size of the counterparty business building up with the lightly regulated non-bank financial sector. The size and complexity of this business has grown (as shown earlier) and has become increasingly complex. As a consequence it is vulnerable to interest rates rises if not accommodated by the central bank.
It is important to repeat that the most important risks in this type of financial system (leverage due to low rates, collateral valuation shifts, liquidity shortage in the face of margin calls, and counterparty defaults) cannot be destroyed by regulating banks and providing them with their liquidity needs on demand (See Blundell-Wignall et al. 2012). Instead, risks are shifted to the less regulated part of the financial system. Central banks risk being locked into the demand for cash that arises from this business model shift. If it doesn’t provide bank liquidity needs arising from its dealing with non-banks (both precautionary and required by regulation) interest rates rise (contrary to central bank policy) and risks increased volatility in the financial system.11
The risk for banks gets larger with the size of this business.12 As noted earlier, the evolution of business models towards a greater focus on institutional clients involving the re-use of unencumbered collateral (cash and Treasury bonds) in rehypothecation and securities lending chains has increased complexity and uncertainty.13 The default of any player in the chain will require the bank parent to have access to the cash (or other cash-like securities) to meet its own obligations. Consequently, bank demand for cash will rise in line with the growth of counterparty business in the non-bank financial sector in a similar non-stationary manner. Indeed, regulations enforce this form of precautionary demand.
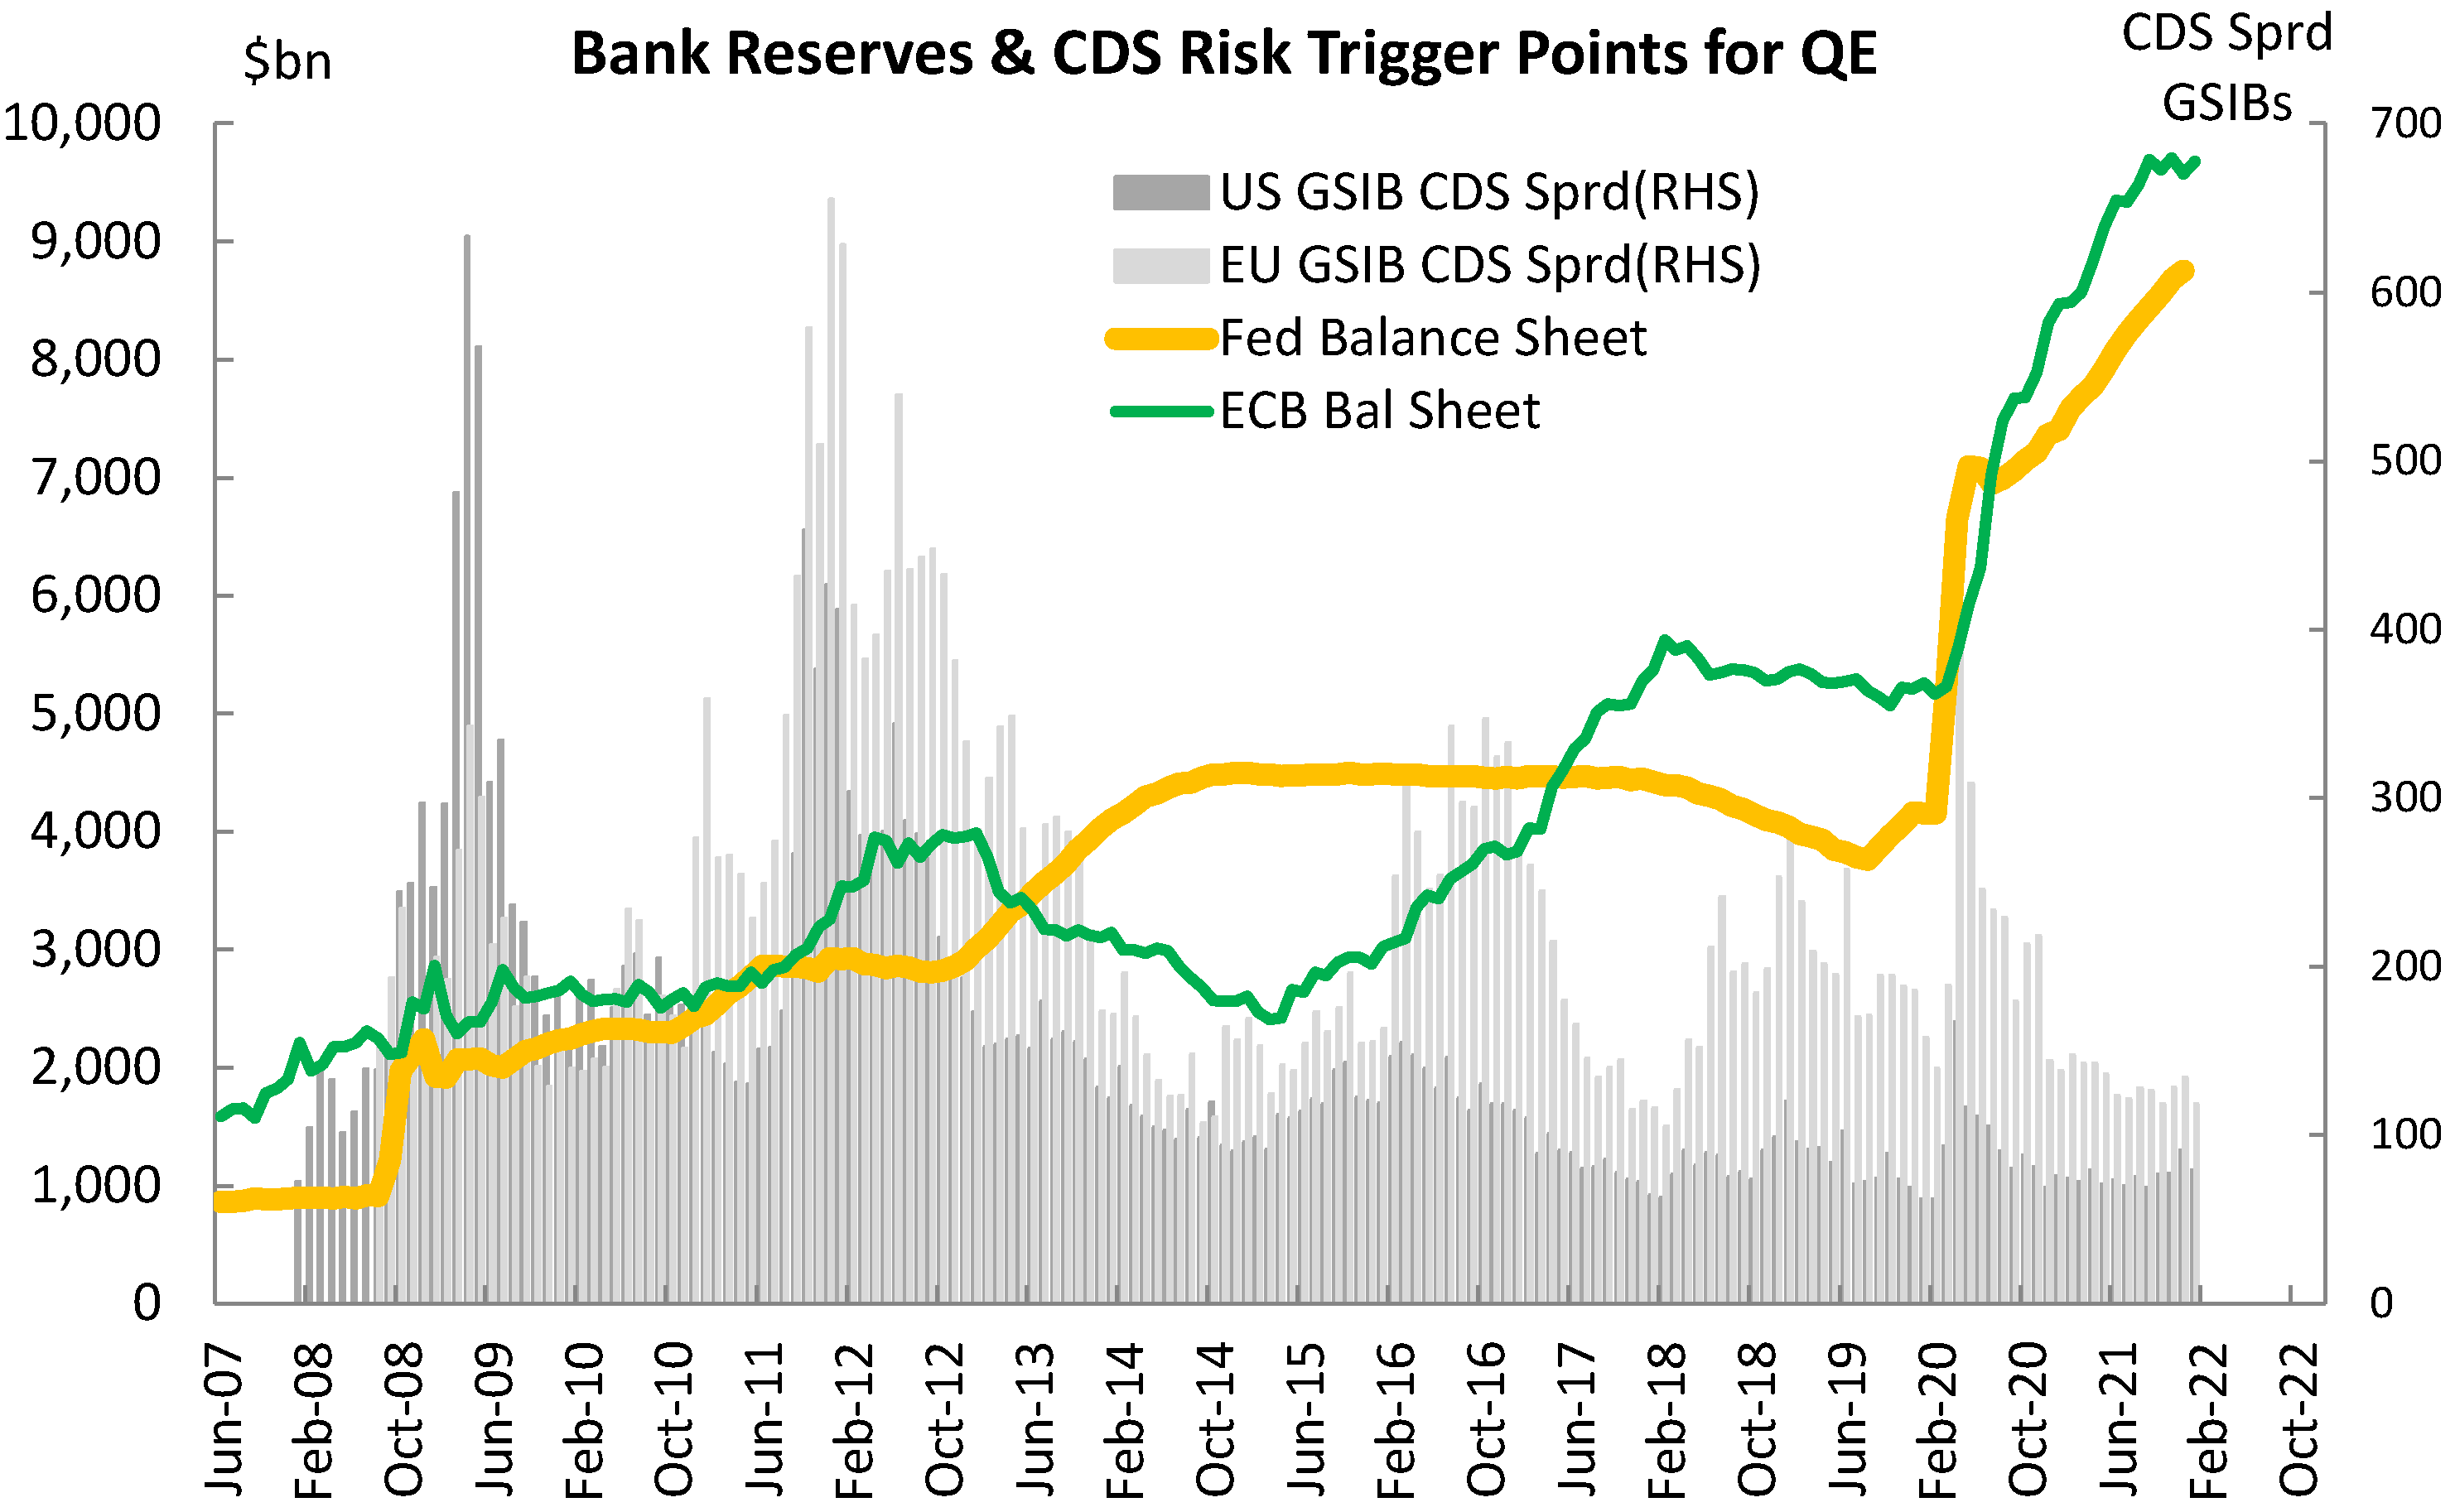
One illustration of this pressure and central bank reactions is illustrated by bank CDS spreads. GSIB risk as measured by average CDS spreads and central bank QE responses are shown in Figure 4. US bank risk was prominent in QE1 to QE3. Subsequently, events in the more vulnerable European GSIBs have flow-on effects to their US counterparts, with whom they are closely linked in counterparty trading.
Testing This Complexity and Accommodation Hypothesis on US Data
To test the hypothesis that the demand for bank reserves is driven by the size of the derivative counterparty business via the complex interconnections discussed earlier, the US data is analysed within a cointegration framework.14 This modelling strategy follows the Engle-Granger two-step procedure, This requires first testing the reserves and derivatives variables to see if the null hypothesis of a unit root can be rejected. If this hypothesis cannot be rejected, the 2-step procedure consists of first estimating the cointegrating vector and then testing for cointegration with the lagged residuals from this equation. The Dickey Fuller test (Dickey and Fuller 1979) shows that the null hypothesis of unit roots cannot be rejected for the bank reserves and derivatives variables (see Table 1).
Cointegration implies that a linear combination of the non-stationary variables (defined by the cointegrating vector) is stationary. The second step uses the lagged residuals to test for cointegration using the error correction model (that cash reserves revert towards the long-run equilibrium defined by these variables) (Engle and Granger 1991).
If a levels relationship exists, the demand for banking system reserves should be cointegrated with the evolution of the notional value derivatives (mostly with shadow banks), the cost of Fed Funds, and a measure of risk. This allows for a levels demand for central bank money related to these variables.15 The cointegration equation is shown in Equation (1).
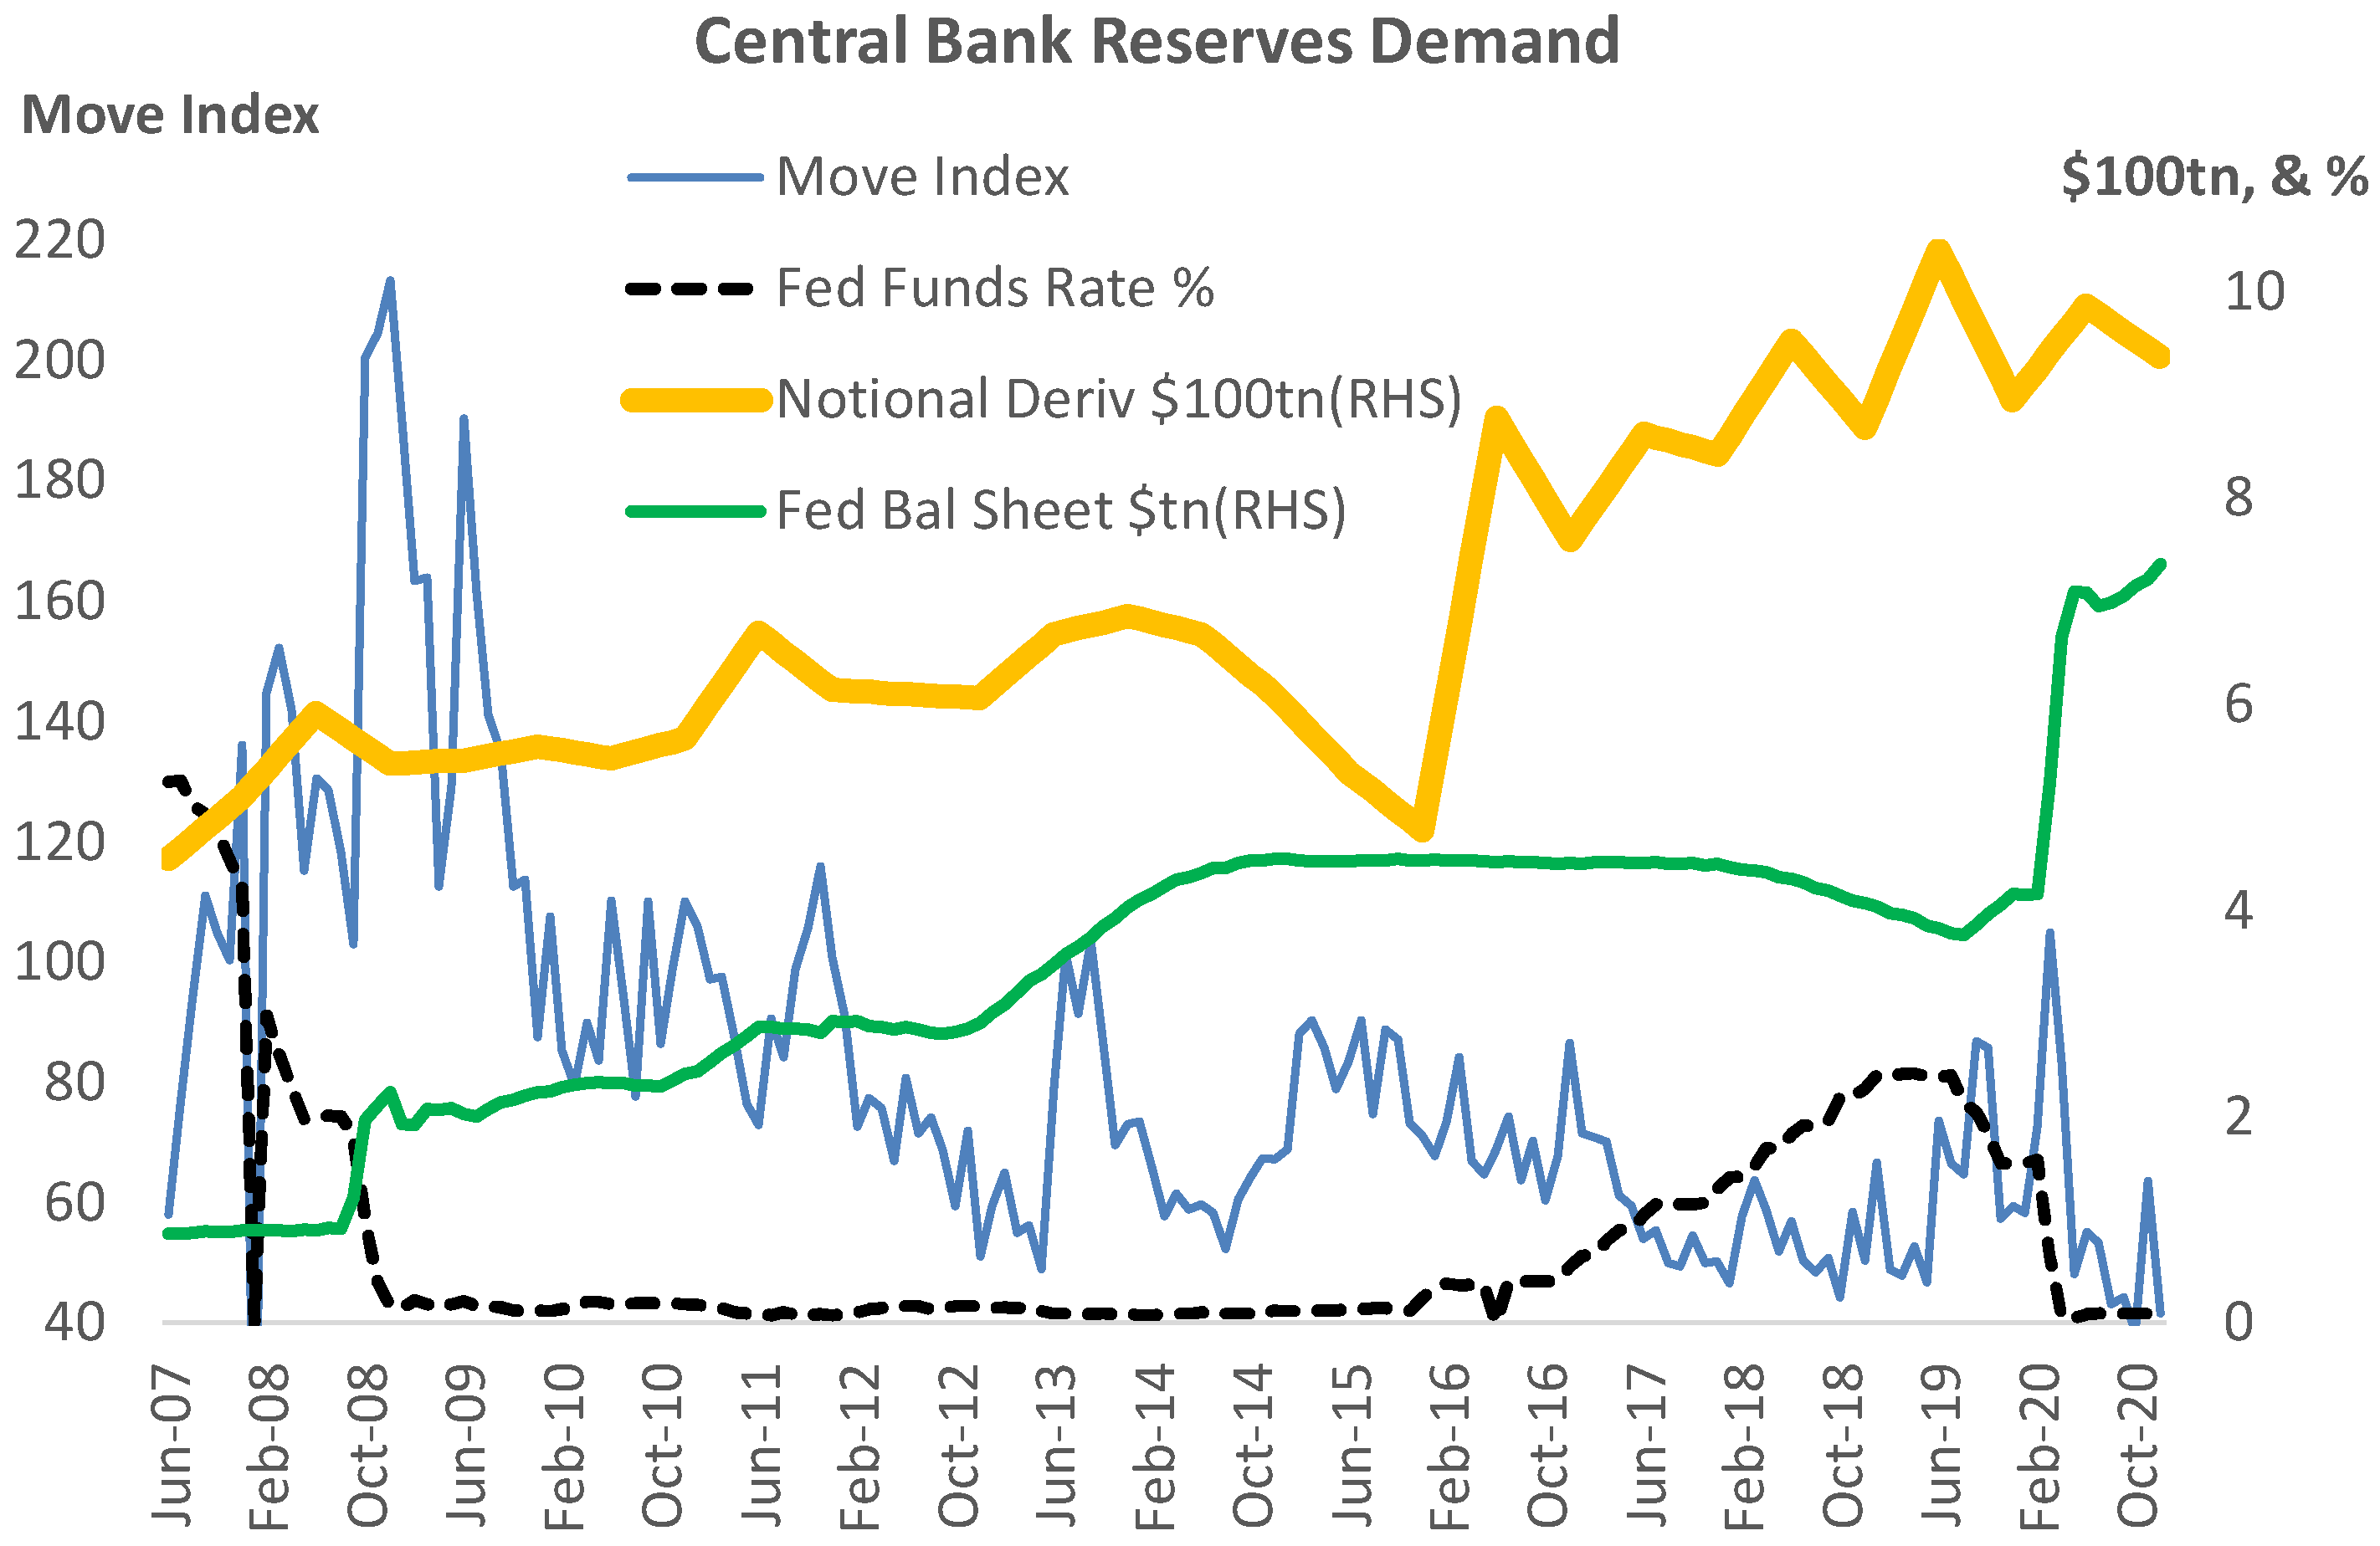
where: (R) is the size of liabilities of the Federal Reserve system; (DERIV) is interpolated BIS data on the notional value of global derivatives; FFunds is the Fed funds rate; MOVE is an index measure of the volatility of movements in US Treasuries16 (yield volatility implied by current prices of one-month over-the-counter options on 2-year, 5-year, 10-year and 30-year Treasuries); and DERIV CCP is the notional value of derivatives cleared with central counterparties used as a dummy variable for this structural shift. The expected signs are α, δ > 0 and β, λ < 0.
logR(t) = Intercept + αlog(DERIV(t)) + β(FFunds(t)) + λ(MOVE(t)) + δ(DERIV CCP(t) + ɛ(t))
The notional value of global derivatives was chosen for this study because only GSIBs have the size and sophistication to participate in these activities in the United States, Europe and the United Kingdom.17 They are highly interconnected with each other, so that the collapse of a GSIB in one jurisdiction would spread to counterparties in others. As a result, the QE policies of the Federal Reserve should not be thought of as independent of global derivatives and leverage outside United States borders.
There is no necessary causality implied in the cointegrating vector. The test for cointegration (and causality) is based on an error correction model of the form:
where the expected signs are a < 0, and b > 0. One lag of the dependent variable was sufficient to deal with autocorrelation.
ΔlogR(t) = Intercept + a(ɛ(t − 1)) + b(ΔlogR)(t − 1)
The sample period was June 2007 to December 2019, reflecting the start of the crisis and the new approach to policy and regulation that followed, breaking with all prior history on the policy framework. The period to 2019 was chosen to avoid confounding the results with the impact of the Treasury actions in implementing the Affordable Care Act and similar payments under the Biden Administration.
The results are set out in Table 1, and the basic data are shown in Figure 5. This simple model is well supported by the data.18 The long-run relationship appears to be adequately captured by the variables in Equation (1), and the error correction model is well supported by the data and consistent with the idea that the demand for central bank reserves adjusts towards the long-run equilibrium level defined by the cointegrating vector.
Note that when risk, as measured by the MOVE index is falling, counterparty business tends to expand and is associated with increased requirements for cash and vice versa. Thus the 2014 tapering announcement saw a temporary halt to counterparty business expansion. As the MOVE index subsequently declined19, counterparty business expanded once more, but was not readily accommodated by the Federal Reserve and the Fed Funds rate began to rise. As stress in the bond market began to rise in the middle of 2019 (before COVID) the Fed relented and began cutting rates. This accelerated in early 2020 once COVID concerns added stress to the markets, a period associated with substantial balance sheet expansion by the Federal Reserve and Treasury actions to support the private sector20.
5. The Economic System Response to QE
This view of changing GSIB demand for cash related to the response to regulations and other policies seems more consistent with the facts than the idea that QE policy is separately directed towards better macroeconomic activity outcomes. If the purpose of the low interest rates and the QE policies needed to sustain them was to encourage a revival of activity and inflation with transmission via lending, wealth effects and the exchange rate, it has proved something of a failure in the 13 years from 2007–2019.
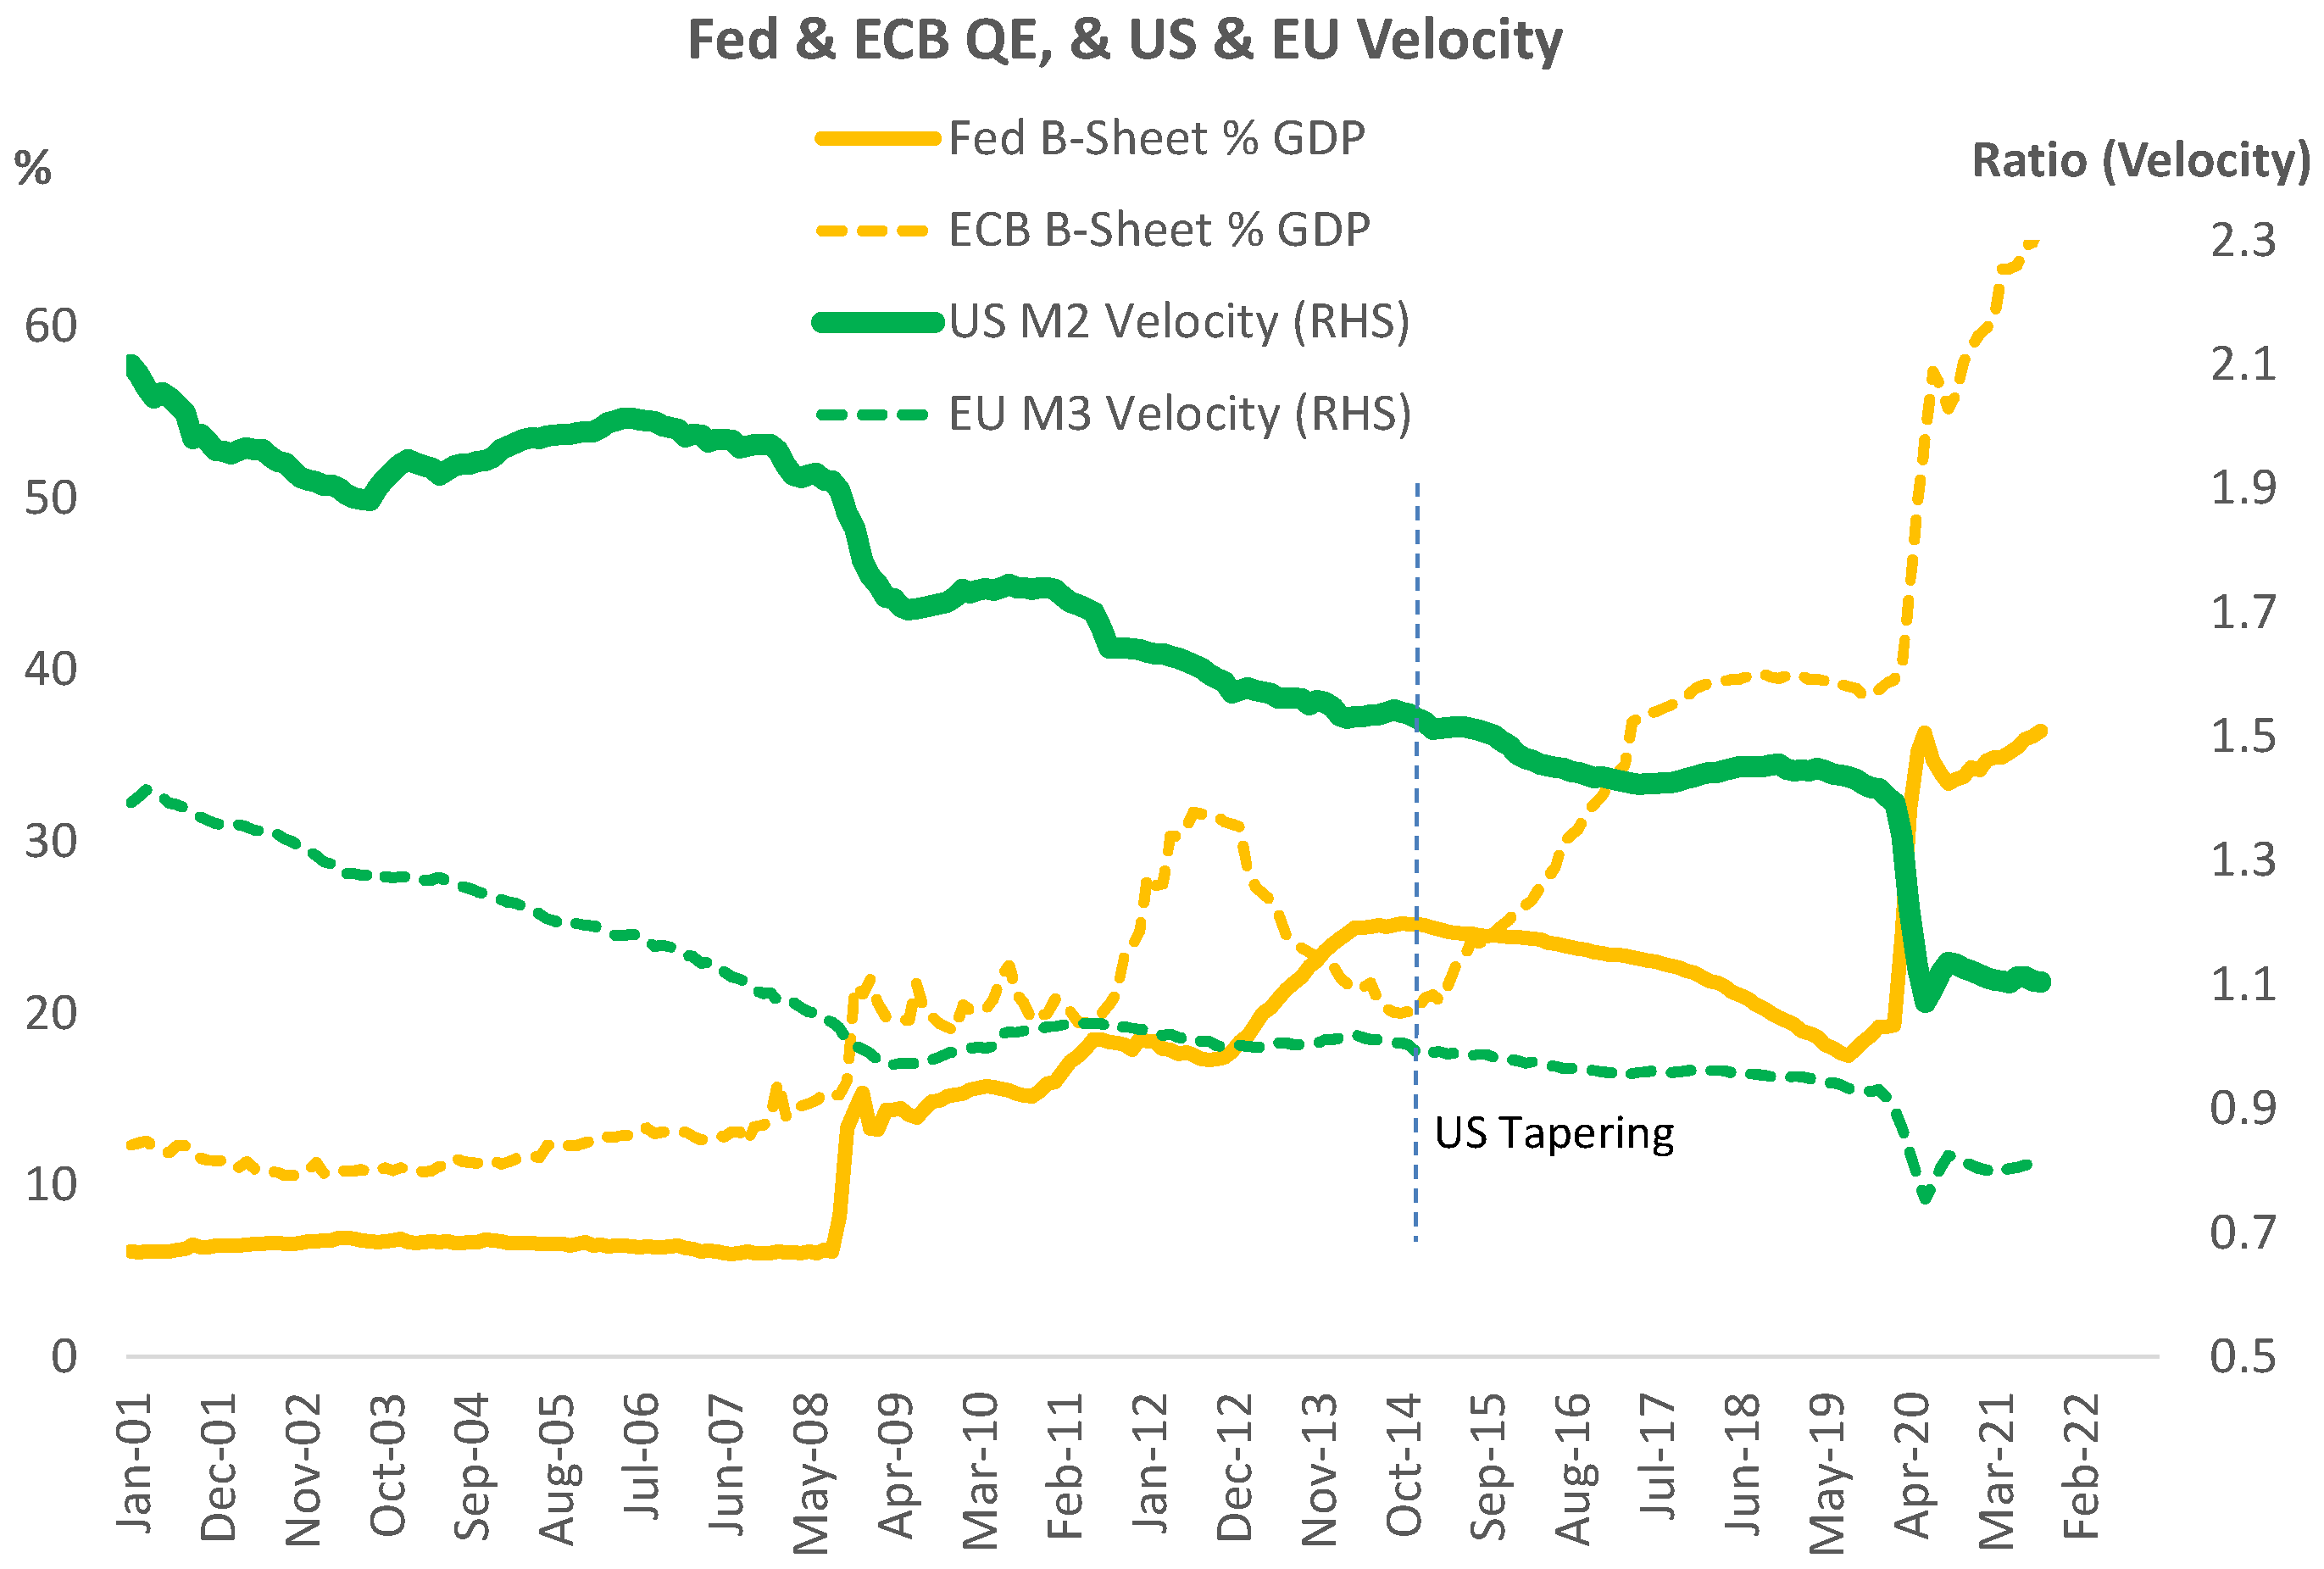
Figure 6 shows the Fed and ECB balance sheets as a share of GDP and M2/3 velocity. Figure 7 shows the annual percentage change for broader monetary aggregates. With QE1 in 2008 the Fed and the ECB were solving the problem of jammed up liquidity. The ECB’s efforts to preserve the euro during the Greek crisis around 2011 are visible in the data. However, much of the subsequent ratcheting up of cash relative to the economy (Q2 and Q3) had little impact on nominal GDP and inflation prior to 2020. Euro Area monetary growth was in the 0–5% range, while in the US after 2012 it averaged 5.5% p.a. for seven years. M2 velocity fell 11% in the US in 2008 and by 10% in the Euro Area. Subsequent QE’s have seen a continuous down trend in velocity21. This is more consistent with increased demand for cash as the crisis receded and regulatory reform began.
With the COVID crisis, very large monetary and fiscal support has resulted in large cash injections and to sharper increases in the growth of monetary aggregates that can be spent by the non-bank sector22. These are now beginning to reverse again as support packages come to an end.
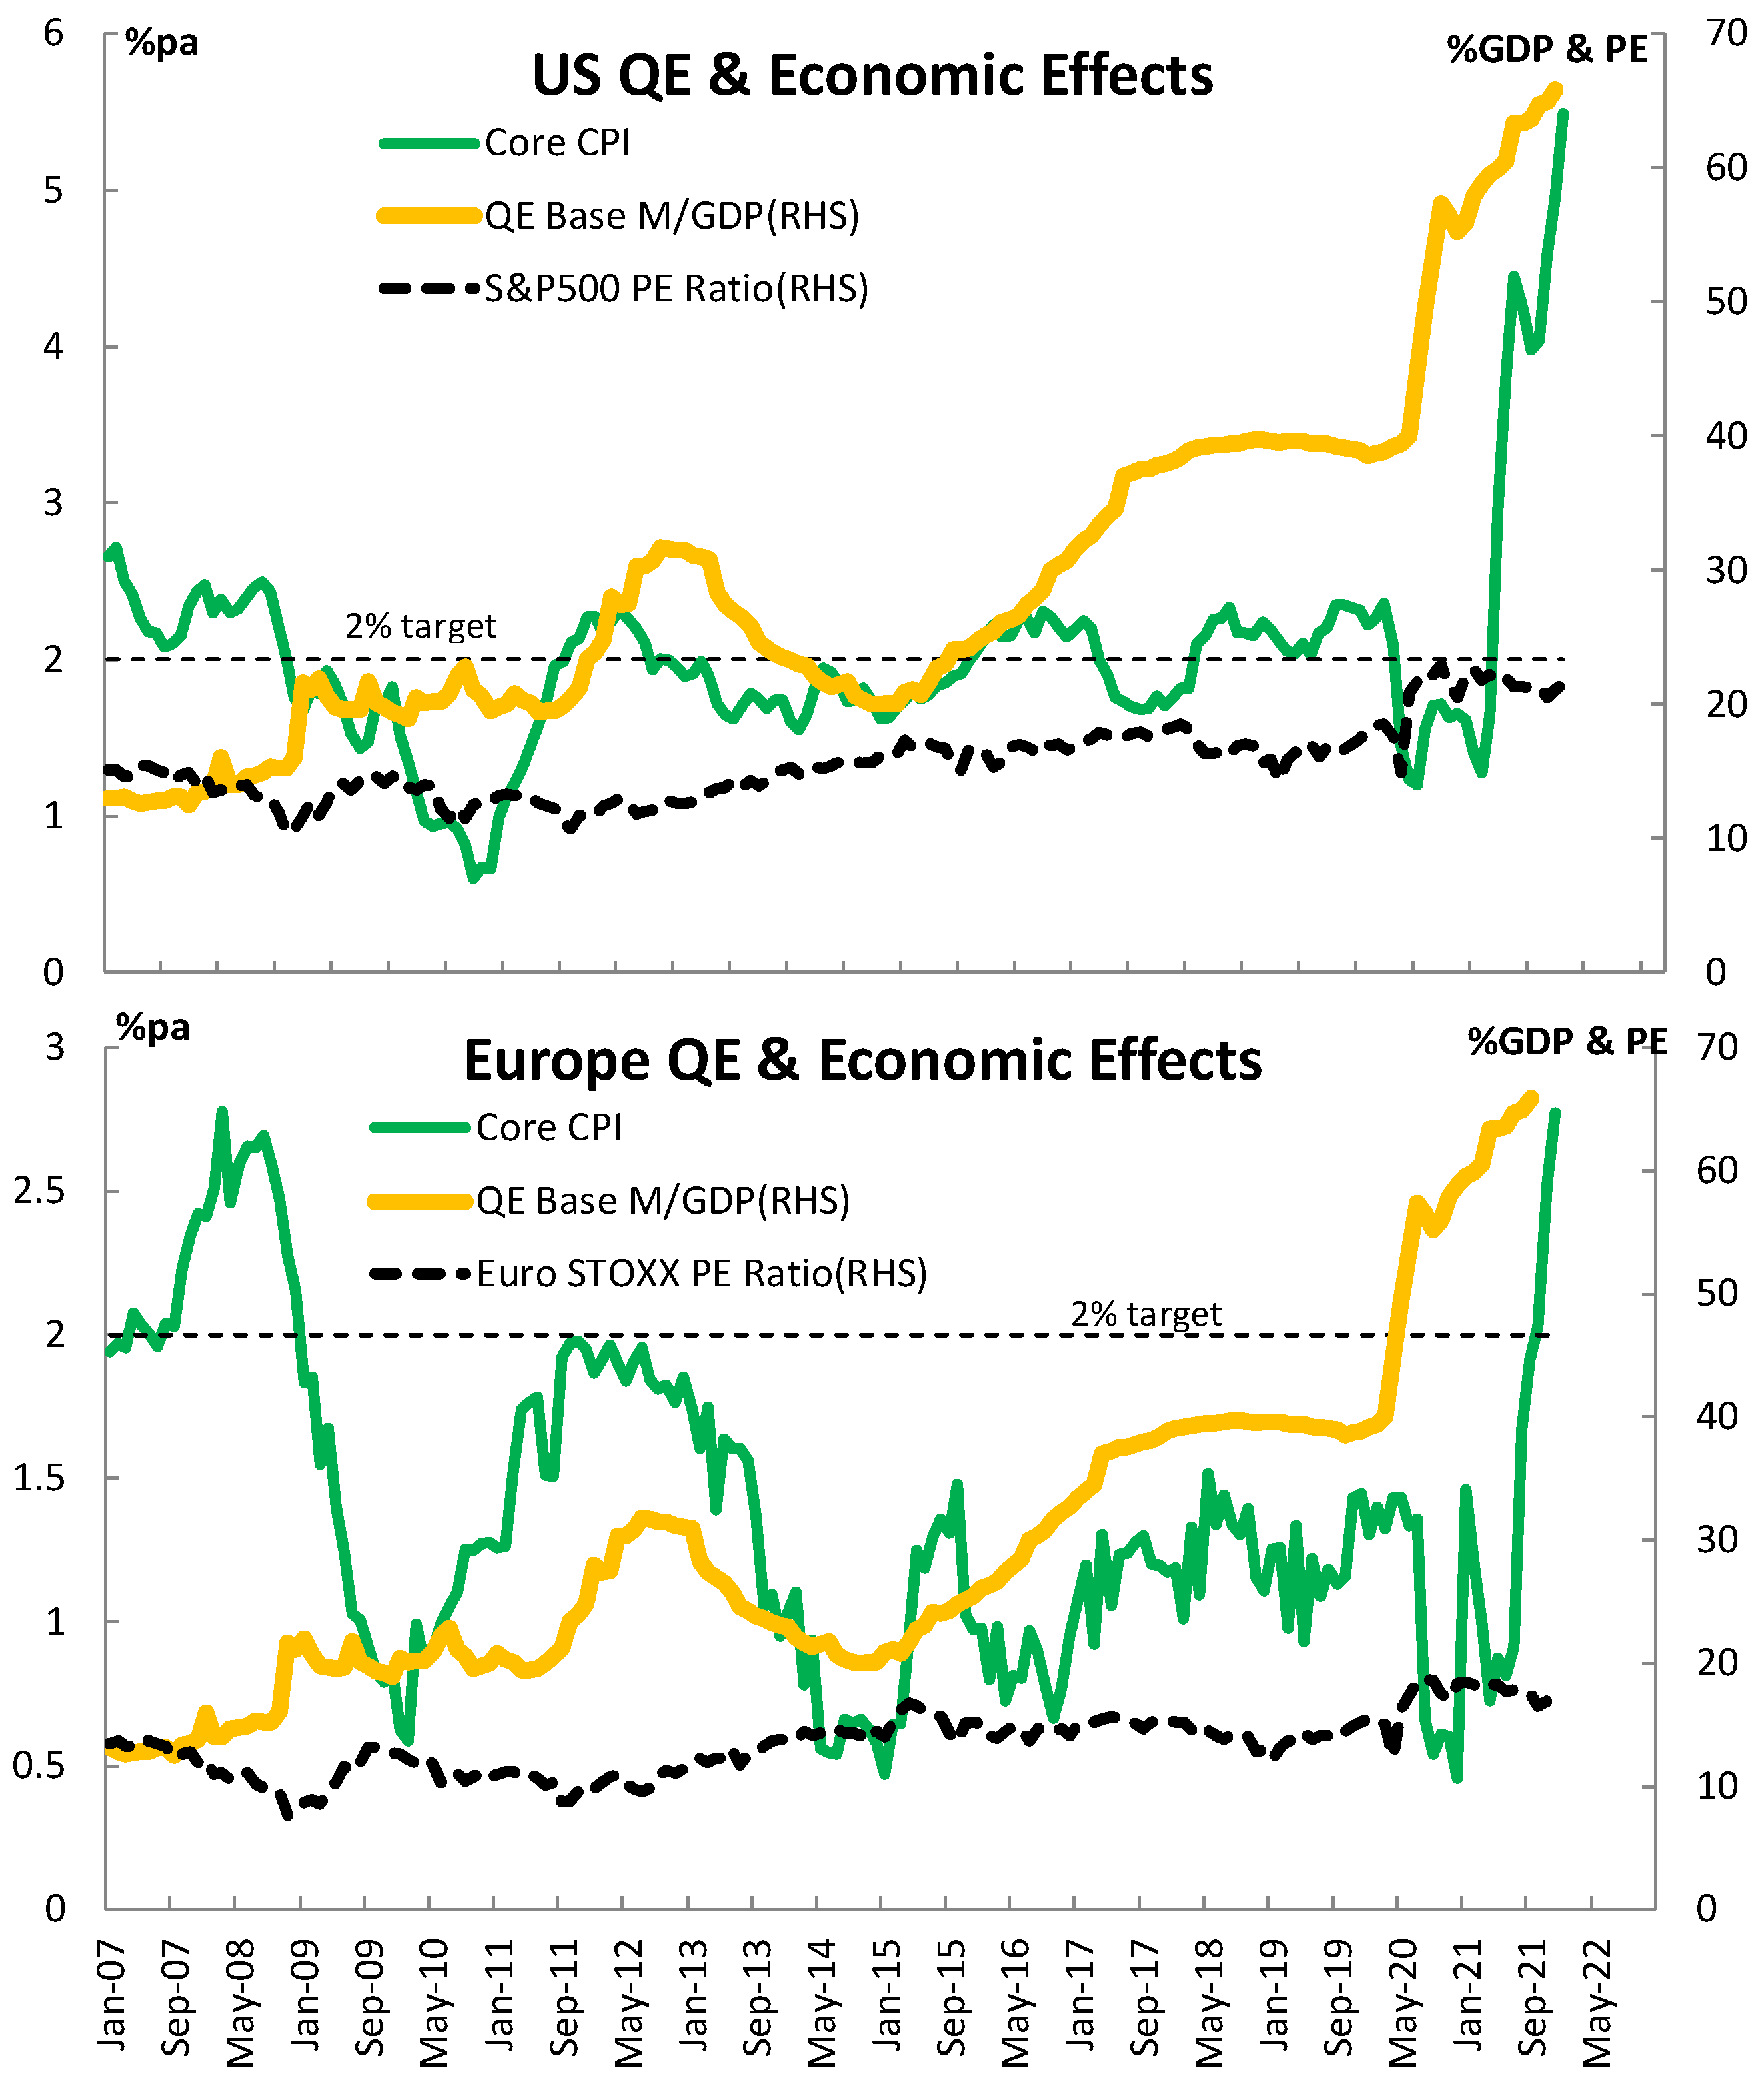
Figure 8 shows US inflation in the top panel and EU inflation in the bottom panel. There is no impact on inflation prior to the COVID period in either country despite the QE policies in both. Similar comments apply to the stock market PE ratio also shown. Following the sell-off during the global crisis in 2008, PE ratios have reverted towards their historical averages of around 15. Like inflation, the main impact on stock market PE’s occurs after the monetary expansions associated with QE policy in 2020–2021.
Monetary financing of the government (as would occur if the Treasury borrowed directly from the Fed to write its COVID cheques) is taboo in modern central banking. However, operations in the market can have the same effect. The Treasury can borrow on the open market (mainly from institutions via primary dealers) and deposit the proceeds in the Treasury General Account at the Fed. This was used for COVID policy implementation. These initial deposits would have helped contain the extent to which the Fed balance sheet increase in 2020 was composed of bank reserves. This would have led to greater downward pressure on interest rates. In mid-2020 and early 2021, Treasury cheques were sent out to households, essentially transferring institutional cash to transactions accounts of ordinary citizens (affecting M1 and M2 as shown in Figure 7). The banks of these ordinary citizens would also obtain claims on the Fed, and bank reserves would thus rise, unless offset by Fed monetary policy transactions (which were duly implemented)23. As these household funds (M1/M2) were spent demand rose in circumstances of supply chain disruption. Inflation was one of the outcomes. These issues were not present in the period prior to 2020 focused on in this study.
Traditionally, Germany tends to avoid fiscal expansion and the issue deficit bonds to the degree to which there may be demand in Europe. Its current account surplus and capital inflows from other European countries (that want to hold safe German assets) is not matched by any equal German demand to acquire foreign assets. With no exchange rates to adjust supply and demand, the gap is plugged via official financing between central banks (known as Target 2 balances). The risks associated with government bond collateral in such a system are more complex than in the United States, and it is likely that the ECB has had to play a greater role in achieving its targets within this system. These European issues remain a topic for future research.
The above economic observations for the period prior to 2020 are consistent with the theory tested in this paper. If there was little impact on lending, the stock market PE and inflation from 2007–2019, there must have been other factors that increased the demand for cash preventing spill-over into lending and inflation pressures prior to COVID. These business model shift factors are also present in 2020–2021, but events have been dominated by Treasury and Fed responses to the COVID crisis. Studies that include these more complex interactions will need to await more data24.
The demand for reserves model has not been tested against European data. Nevertheless, the European Central Bank (ECB) seems to believe that it too is well placed to supply the cash reserves required by banks. As a share of GDP, its QE policies have been larger than those of the Fed. This may be due to the euro crisis. European GSIBs were also subject to the same regulatory changes and business model transitions. However, unlike the United States, there is no single fiscal authority and government bonds carry much more risk than those of the US Treasury.
6. Reversing QE and Interest Rate Objectives Present Challenges
The unstable nature of the interactions between policies and bank business model shifts carries with it important risks (See also Singh 2016). Once business models based on these avenues for profit growth become established, they are difficult to reverse. This was illustrated by US attempts to normalise monetary policy in recent years.
For broker/dealers the basic moving part for profits is counterparty business and the re-use of securities as collateral for multiple transactions. If lending securities and cash collateral can earn above zero, then increasing the volume of such activities increases the return on equity. However, it also carries the risk of greater contagion when counterparties default.
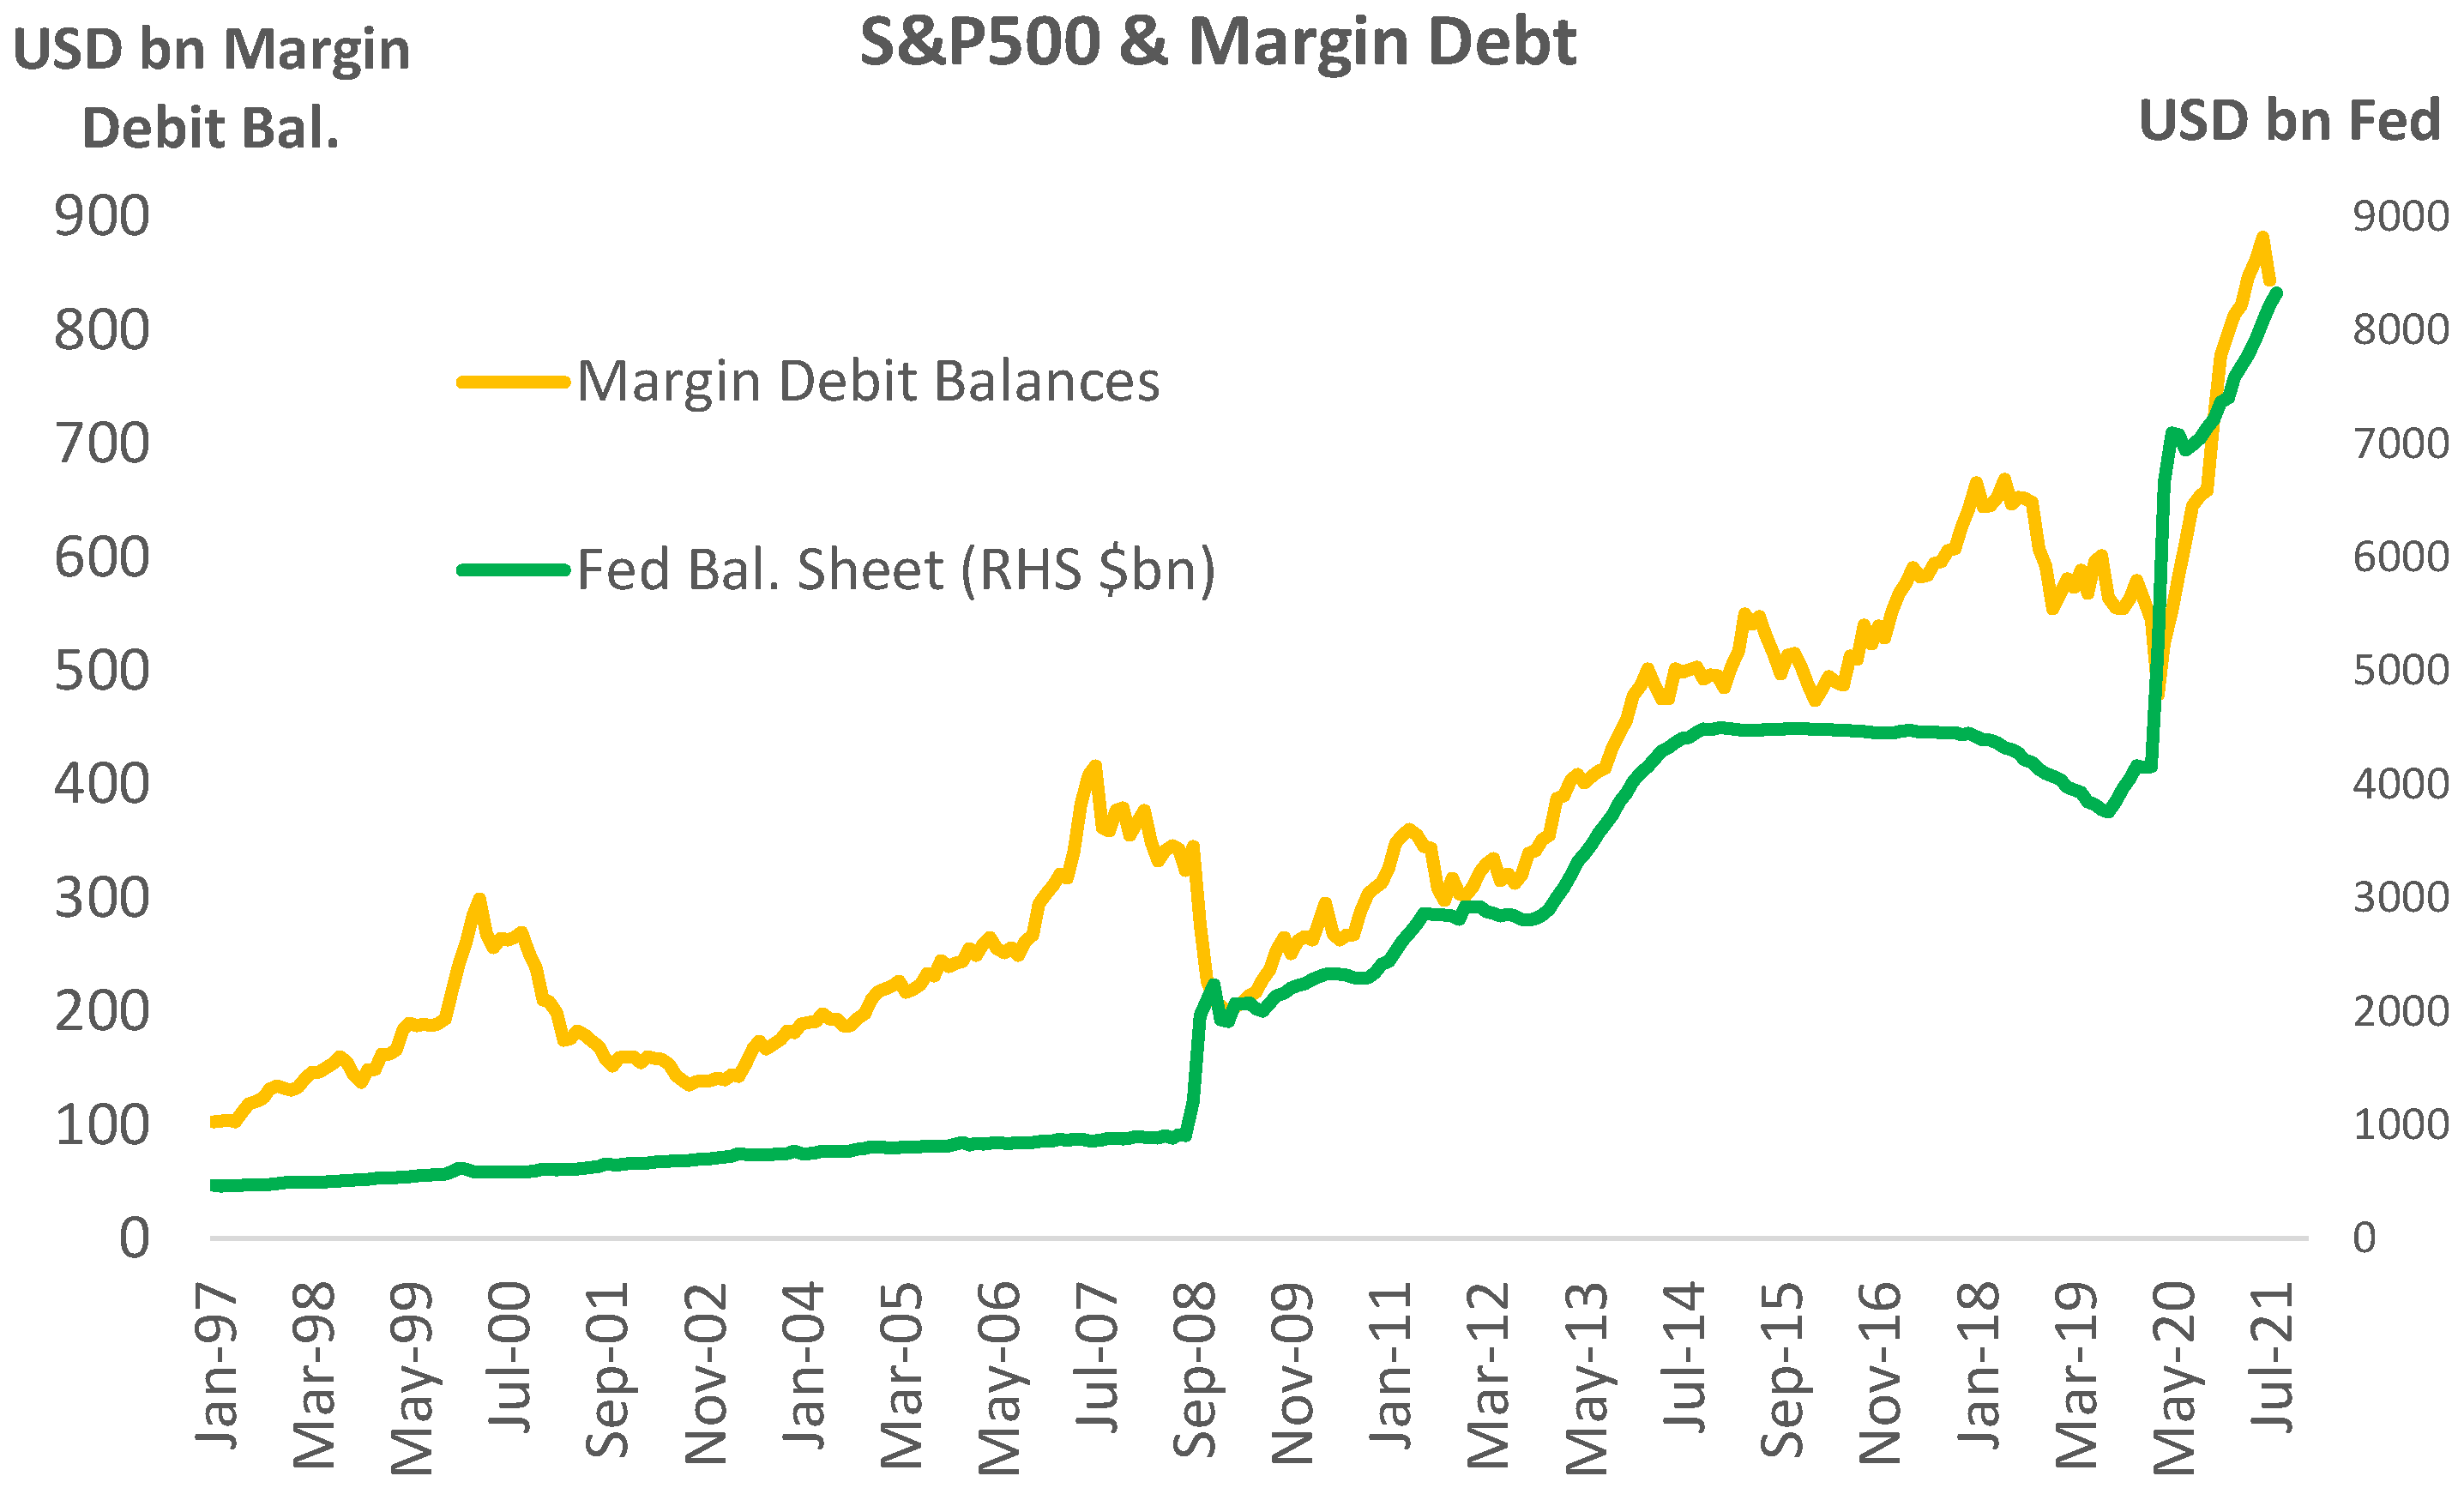
The leverage in the system is very high. US Reg-T states that dealers can lend 50% of the value of a security to a customer in a margin account (see Figure 9 for margin debt and QE) and can re-lend her collateral (the stock position) up to 140% of the loan extended. The velocity of collateral increases. It can be used and re-pledged multiple times. Lending and rehypothecation creates a credit pyramid with all participants depending on others to meet their commitments.
Broker/dealers could impose more severe haircuts on re-using collateral if they wanted to restrain volume, but they have no incentive to do so, especially if central banks are willing to buy illiquid securities when collateral values wobble.
The Archegos Saga
Instead of focusing on risks with GSIB business models after the 2008 crisis, regulators and central banks focused on updating capital and liquidity requirements for banks. However, as noted earlier, leverage risk cannot be destroyed in this way, it is simply shifted to shadow banks.
The Archegos saga illustrates that loss channels, such as the credit valuation shifts with derivative counterparties that were so damaging in 2008, remain present. That this incident occurred without a major reversal of monetary policy is cause for concern. Such events may become more widespread contingent upon future policy normalisation.
Archegos became involved with Total Return Swaps (TRS). With this product an investment bank, here Credit Suisse (CS), agrees to pay an investor, here Archegos, the return on a portfolio of stocks, providing credit to the investor for its exposure. CS held the stocks as a hedge so there should have been no primary market risk. In return CS received the net present value of the funding leg plus a guarantee in the event of any losses on the stocks it holds (via margin calls when needed). So, with the hedge, it looked a lot like a simple security funding transaction.
However, this did not prove to be the case because the securities leg of the deal (the stocks) price at current market value and the deal entails counterparty risk.
In the event the stocks fell sharply in value. The stock position was leveraged, a synthetic exposure that generated cash margin calls beyond what Archegos was able to pay. As a result, CS had to sell the stocks, as did other banks (JP Morgan, Goldman Sachs, Morgan Stanley and Nomura) to close-out similar positions. Some of the banks moved faster than others and the slowest to move, CS and Nomura, ended up absorbing more of the losses.
It is reported that CS will take a loss of USD 4.7bn. According to the CS Annual Report for 2020, its equity net of goodwill was CHF 38.5bn, or USD 41.6bn. So, CS losses for a deal that seemed to have no primary risk before the event ended up destroying 11% of its capital due to a small transaction with a family group that no one had ever heard of.
This is reminiscent of the little financial services firm that AIG once owned in London—lightly regulated with little capital, much like the hedge fund industry today. Like Archogos, AIG Financial Products mis-priced the risks and regulators had little transparency into what was happening.
CS used to be a simpler commercial bank until it bought into the First Boston investment bank during the junk bond crisis. It eventually acquired all of it. In recent years such systemically important bank holding companies have outperformed those more weighted to traditional banking. CS net interest income has been falling, whereas its commissions, fees and trading revenue have been rising. A good 2/3 of its net revenue of USD 24bn came from this source in 2020.
The allure is irresistible. CS reports a mere USD 27bn in derivatives on its balance sheet, where leverage rules are calculated. However, the notional value of the derivatives with which it is associated is some USD 22tn25. Small spreads on large notional contracts and trading skills are very attractive in a zero-rate world.
The basic problem is interconnectedness. Were a correlated set of shocks sufficient to wipe out 100% of the capital of just one systemic bank a new crisis would likely follow.
7. Concluding Remarks and Future Research
This paper has sought to show that since 2008 the regulatory and monetary policies adopted have accelerated a shift in bank business models that has created a demand for central bank money. Part of this demand has been mandated by the LCR, requiring banks to hold more liquid assets depending on size and complexity. However, this demand is also endogenous. Banks hold cash because they need to maintain market confidence in their activities. This appears to be consistent with the data, with bank reserves appearing to be cointegrated with the sizes of their counterparty businesses, and the cost of Fed Funds and market risk. It was argued that this approach appeared to be an unstable interaction: regulatory and monetary policies induce business model shifts that policy makers subsequently need to accommodate with further changes in policy. Reversing this situation could prove to be difficult.
Three avenues for future research deserve attention.
First, the sudden increase in US inflation in 2021 has taken authorities by surprise. This could be due to the form QE has taken in this period. Government spending involving cash payments to households and companies feeds directly into spending and may be well in excess of cash demand of a prudential business model nature discussed in this paper. The real value of Fed liabilities would be reduced via inflation.
A second avenue of research would be to test these ideas more thoroughly on the European data. There the one-sized-fits-all approach to monetary policy combined with multiple government bond markets may be more challenging.
Third, the different levels of regulation between banks and shadow banks is generating a shift of risk away from the former, which were the epicentre of the 2008 crisis, and towards the latter, where problems may arise in the future. There is need for better and more timely shadow bank data and more analysis of the regulatory requirements in that sector.
The view of the present authors is that the current approach to monetary and regulatory policy risks creating an environment likely to contribute to a new financial crisis.
Ex ante saving and investment imbalances emerge in the global economy, and real interest rates and exchange rates adjust to bring about ex post balance. Central banks, in carrying out their functions of nominal anchor and lender-of-last-resort, can push interest rates away from those consistent with saving and investment fundamentals. However, the longer they do so, the more unintended consequences follow in the forms of leverage, asset price trends, and ultimately inflation. Central banks in a well-functioning economy should adjust policy rates to be consistent with longer-run fundamentals in the end. If not, crises tend to bring about rebalancing in more unpleasant ways.
The prerequisites for an upward adjustment of real interest rates are falling into place. China is likely to become a lower global saver due to demographic trends and its shift towards domestic demand. Global investment in infrastructure led by the United States will soon be under way requiring more saving. The sooner central banks normalize monetary policy and regulators decide what to do with shadow banks, the sooner the level of cash and the size and complexity of counterparty business will settle at a more sustainable level.
Author Contributions
Both authors contributed equally to conceptualization, methodology, use of software and writing. All authors have read and agreed to the published version of the manuscript.
Funding
This research received no external funding.
Informed Consent Statement
Not applicable.
Data Availability Statement
All publicly available data: Refinitiv Eikon, US Federal Reserve, Bank for International Settlements, FINRA.
Acknowledgments
The authors are grateful to Stephen Grenville and several anonymous referees for comments that have improved this paper. All errors, however, remain our own.
Conflicts of Interest
Paul Atkinson is on the board of directors of the Association of Americans Resident Overseas (AARO) and is a former editor of the OECD Economic Outlook. Adrian Blundell-Wignall is a former Director of the OECD and Adjunct Professor at Sydney University. The authors declare no conflict of interest.
| 1 | The Financial Services Regulatory Relief Act of 2006 granted the authority. It was implemented from late 2008. |
| 2 | Government spending to support demand under COVID involves a very different mechanism for the expansion of central bank liabilities compared to the earlier QE episodes. |
| 3 | Other than bilateral exchange rates with the United Kingdom and Europe affected in the 2016–2017 Brexit responses. |
| 4 | https://www.fsb.org/wp-content/uploads/P231121.pdf (accessed on 23 November 2021). |
| 5 | See Blundell-Wignall et al. (2018, pp. 72–77) for a detailed explanation of how these regulatory and tax arbitrages work. Tax arbitrage was and remains a key incentive factor in the structuring of financial products. Investment banks can tailor products to the tax status of investors and different tax regimes applying to different securities. Spreads are captured by shorting some securities to go long others depending on the presence of advantageous tax wedges. Derivatives play a key role in taking advantage of these opportunities. |
| 6 | SEC rule 15c3-3. |
| 7 | See Gorton and Metrick (2013) for an analysis of this process. |
| 8 | Post-crisis regulatory reform and its impact on these businesses are discussed in Blundell-Wignall and Atkinson (2015), Blundell-Wignall et al. (2018), and Bank for International Settlements (BIS 2018). |
| 9 | See Blundell-Wignall et al. (2018) for a full historical discussion of the history of securitisation, derivatives the crisis and the regulatory aftermath. |
| 10 | This only applies to the US subsidiaries of global banks which have to form an IHC. It does not apply to its consolidated assets of foreign banks. |
| 11 | For example, when rates rise, fixed rate payer contracts fall in value, generating out-of-the-money margin calls. While broker/dealers may hedge their position versus each other (or a central clearing party) in-the-money clients and their banks will be exposed to the default of an out-of-the-money institution. |
| 12 | The risk and illiquidity of the products involved, implicit leverage, counterparty default risk and any indemnities that are offered by bank subsidiaries (from custody and lending agents businesses). |
| 13 | |
| 14 | Cointegration analyses non-stationary variables (unit roots) where the long-run cointegrating vector of parameters defines an equilibrium between them. They will tend to revert towards each other in equilibrium. |
| 15 | A number of studies examine this issue without allowing for long-run adjustment. For example, Berger and Bouwman (2017) and Robinson and Nasser (2013). Failure to allow for the levels relationship—key to the subject addressed in this paper—misses the key dynamics if such a relationship exists. |
| 16 | Global bonds price off Treasuries, the global liquid risk free security. |
| 17 | The BIS provides a list of GSIB banks. |
| 18 | The R2 of 0.52 is high for this differenced form of the model. |
| 19 | Undoubtedly helped by ECB QE operations in 2015 and 2016. |
| 20 | The post 2019 data is explicitly excluded to focus on the business model change issue which is the focus of this study. |
| 21 | |
| 22 | See Clarida et al. (2021) for a complete summary of all the support measures. It is not strictly correct to refer to the COVID period as QE4, since the central banks balance sheet is being affected by both monetary policy and fiscal policy interactions unlike previous QE episodes. |
| 23 | |
| 24 | In particular derivatives data. This will become available for 2021 only by mid 2022. Ideally, data that includes the full inflation cycle (sustained or transitory) would be required. |
| 25 | For some reason CS reports under US GAAP which allows more netting than IFRS. As concerns the leverage ratio rules for Basel III, derivatives are included at replacement cost at the netting set level (netting out offsetting trades subject to novation which are legally enforceable) less any cash variation margins that are received plus those that are paid. This has the effect of reducing the exposure measure for the leverage ratio. |
References
- Afonso, Gara, and Ricardo Lagos. 2015. Trade Dynamics and the Market for Federal Funds. Econometrica 83: 263–313. [Google Scholar] [CrossRef] [Green Version]
- Afonso, Roc Armenter, and Benjamin Lester. 2018. A Model of the Federal Funds Market: Yesterday, Today and Tomorrow. FRBNY, Staff Reports No. 840. February. Available online: https://ssrn.com/abstract=3128821 (accessed on 1 January 2022).
- Bagehot, Walter. 1962. Lombard Street, a Description of the Money Market. Reprint. Homewood: Richard D. Irwin. First published 1873. [Google Scholar]
- Bank for International Settlements (BIS). 2018. Structural Changes in Banking After the Crisis. CGFS Papers, No 60. Basel: Bank for International Settlements. [Google Scholar]
- Berger, Allen N., and Christa H. S. Bouwman. 2017. Banks Liquidity Creation, Monetary Policy and Financial Crises. Journal of Financial Stability 30: 139–55. [Google Scholar] [CrossRef]
- Bernanke, Ben S., and Vincent R. Reinhart. 2004. Conducting Monetary Policy at Very Low Short-Term Interest Rates. American Economic Review 94: 85–90. [Google Scholar] [CrossRef] [Green Version]
- Blundell-Wignall, Adrian, and Paul E. Atkinson. 2015. Basel Regulation Needs to be Rethought in the Age of Derivatives, Part I. In Post-Crisis Banking Regulation: Evolution of Economic Thinking as It Happened on Vox. Edited by Jon Danielsson. London: Centre for Economic Policy Research. [Google Scholar]
- Blundell-Wignall, Adrian, Paul E. Atkinson, and Caroline Roulet. 2012. The Business Models of Large Interconnected Banks and the Lessons of the Financial Crisis. National Institute Economic Review 221: R31–R43. Available online: https://0-www-cambridge-org.brum.beds.ac.uk/core/journals/national-institute-economic-review/article/abs/business-models-of-large-interconnected-banks-and-the-lessons-of-the-financial-crisis/F248CAA7D5EE810C346460F4352977E0 (accessed on 1 January 2022). [CrossRef] [Green Version]
- Blundell-Wignall, Adrian, Paul E. Atkinson, and Caroline Roulet. 2018. Globalisation and Finance at the Crossroads. Cham: Palgrave MacMillan. [Google Scholar]
- Blundell-Wignall, Adrian, Paul E. Atkinson, and Se Hoon Lee. 2008. The Current Financial Crisis: Causes and Policy Issues. OECD Journal: Financial Market Trends 2008: 1–21. [Google Scholar] [CrossRef]
- Calomiris, Charles W., Florien Heider, and Marie Hoerova. 2015. A Theory of Bank Liquidity Requirements. Washington, DC: IMF(mimeo). [Google Scholar]
- Clarida, Richard, Burcu Duygan-Bump, and Chiara Scotti. 2021. COVID-19 Crisis and the Federal Reserve’s Policy Response; Finance and Economics Discussion Series 2021-35; Washigton, DC: Federal Reserve Board.
- Diamond, Douglas W., and Philip H. Dybvig. 1983. Bank Runs, Deposit Insurance, and Liquidity. Journal of Political Economy 91: 401–19. [Google Scholar] [CrossRef]
- Dickey, David, and Wayne Fuller. 1979. Distribution of the Estimators for Autoregressive Time Series with a Unit Root. Journal of the American Statistical Association 74: 427–31. [Google Scholar]
- Engle, Robert, and Clive Granger, eds. 1991. Cointegration and Error Correction: Representation, Estimation, and Testing. In Long Run Economic Readings in Cointegration. New York: Oxford University Press, pp. 81–113. [Google Scholar]
- Goodfriend, Marvin. 2002. Interest on Reserves and Monetary Policy. Economic Policy Review 8: 77–84. [Google Scholar]
- Gorton, Gary, and Andrew Metrick. 2013. Securitised Banking and the Run on Repo. Journal of Financial Economics 104: 425–51. [Google Scholar] [CrossRef] [Green Version]
- Guzman, Martin, and Joseph E. Stiglitz. 2020. Towards a Dynamic Disequilibrium Theory with Randomness. Oxford Review of Economic Policy 36: 621–74. [Google Scholar] [CrossRef]
- Infante, Sebastian. 2018. The Ins and Outs of Collateral Re-use. Fed Notes, December 21. [Google Scholar]
- Krugman, Paul. 2021. Return of the Monetary Cockroaches. New York Times. May 13. Available online: https://www.nytimes.com/2021/05/13/opinion/cryptocurrency-inflation.html (accessed on 14 May 2021).
- Logan, Lori. 2021. Monetary Policy Implementation: Adapting to a New Environmemt; Remarks Before the Money Marketeers of New York University, October. New York: Federal Reserve Bank of New York.
- Office of Management and Budget. 2021. Mid-Session Review. Budget of the US Government, Fiscal Year 2022. August 27. Available online: https://www.govinfo.gov/content/pkg/BUDGET-2022-MSR/pdf/BUDGET-2022-MSR.pdf (accessed on 1 January 2022).
- Robinson, Richard, and Marwan El Nasser. 2013. Decomposing US Money Supply Changes since the Financial Crisis. Journal of Financial Studies 1: 3–44. [Google Scholar] [CrossRef] [Green Version]
- Singh, Manmohan. 2016. Collateral Flows and Balance Sheet Space. Journal of Financial Market Infrastructures 5: 65–82. [Google Scholar]
- Singh, Manmohan, and James Aitken. 2010. The (Sizable) Role of Rehypothecation in the Shadow Banking System. IMF Working Paper, WP/10/172. Washington, DC: International Monetary Fund. [Google Scholar]
Figure 1.
Securitisation and Collateral Chains. Source: Authors’ representation. See also Blundell-Wignall et al. (2018); Infante (2018); Singh and Aitken (2010).
Figure 1.
Securitisation and Collateral Chains. Source: Authors’ representation. See also Blundell-Wignall et al. (2018); Infante (2018); Singh and Aitken (2010).

Figure 2.
The global notional value of derivatives by counterparty and the summed balance sheets of the Fed, the BoJ, the ECB and the BoE. Source: BIS.
Figure 2.
The global notional value of derivatives by counterparty and the summed balance sheets of the Fed, the BoJ, the ECB and the BoE. Source: BIS.

Figure 3.
Supply and Demand for Cash and their Interaction with Financial Sector Counterparty Business. Source: Authors’ representation.
Figure 3.
Supply and Demand for Cash and their Interaction with Financial Sector Counterparty Business. Source: Authors’ representation.

Figure 4.
Fed, ECB & Counterparty Risk of GSIBs Measured by CDS Spreads. Source: BIS, & Refinitiv Eikon.
Figure 4.
Fed, ECB & Counterparty Risk of GSIBs Measured by CDS Spreads. Source: BIS, & Refinitiv Eikon.

Figure 5.
The Fed Balance Sheet, Derivatives, Fed Funds and the Move Index. Source: BIS and Refinitiv Eikon.
Figure 5.
The Fed Balance Sheet, Derivatives, Fed Funds and the Move Index. Source: BIS and Refinitiv Eikon.

Figure 6.
Central Bank Balance Sheets and Broad Money Velocity. Source: Refinitiv Eikon, & US Federal Reserve.
Figure 6.
Central Bank Balance Sheets and Broad Money Velocity. Source: Refinitiv Eikon, & US Federal Reserve.

Figure 7.
Money Supply. Source: Refinitiv Eikon.

Figure 8.
Economic Impacts of QE. Source: Refinitiv Eikon.

Figure 9.
The Fed Balance Sheet Margin Debt. Source: FINRA, US Federal Reserve.


Table 1.
Testing Bank Demand for Reserves Model.
| Cointegration Vector: Dependent Variable Log Bank Reserves at Fed | ||||
| (Monthly June 2007–December 2019) | ||||
| Coefficients | Standard Error | t Stat | p-value | |
| Intercept | 7.9742 | 1.489 | 5.356 | 0.0000 |
| Log Deriv Total Notional | 0.3955 | 0.212 | 1.864 | 6.4 × 10⁻² |
| Fed Funds Rate | −0.2552 | 0.017 | −14.905 | 4.0 × 10⁻³¹ |
| Log MOVE | −0.5426 | 0.067 | −8.082 | 2.2 × 10⁻¹³ |
| Log DERIV CCP Notional | 0.0523 | 0.0165 | 3.1703 | 0.0019 |
| R2 0.89 | Std Error 0.222 | NOBS. 151 | ||
| Error Correction Model: Dependent Variable Dlog Bank Reserves | ||||
| (Monthly July 2007–December 2019) | ||||
| Coefficients | Standard Error | t Stat | p-value | |
| Intercept | 0.0056 | 0.004 | 1.584 | 0.1153 |
| Lagged Residuals | −0.0668 | 0.016 | −4.231 | 4.1 × 10⁻⁵ |
| Δlog RES(−1) | 0.4791 | 0.070 | 6.876 | 0.00000 |
| R2 0.54 | Std Error 0.042 | NOBS. 150 | ||
| Unit Root Tests: Augmented Dickey-Fuller Statistic * | ||||
| Bank Reserves Variable | −2.89 | to December 2019 | ||
| Derivatives Variable | −1.89 | to December 2019 | ||
* The null hypothesis of a unit root critical value for rejection (without trend) is −3.46 at the 1% level for NOBS 250. Source: Author’s calculations.
Publisher’s Note: MDPI stays neutral with regard to jurisdictional claims in published maps and institutional affiliations. |
© 2022 by the authors. Licensee MDPI, Basel, Switzerland. This article is an open access article distributed under the terms and conditions of the Creative Commons Attribution (CC BY) license (https://creativecommons.org/licenses/by/4.0/).
Share and Cite
MDPI and ACS Style
Atkinson, P.; Blundell-Wignall, A. What Problem Is Post-Crisis QE Trying to Solve? J. Risk Financial Manag. 2022, 15, 40. https://0-doi-org.brum.beds.ac.uk/10.3390/jrfm15020040
AMA Style
Atkinson P, Blundell-Wignall A. What Problem Is Post-Crisis QE Trying to Solve? Journal of Risk and Financial Management. 2022; 15(2):40. https://0-doi-org.brum.beds.ac.uk/10.3390/jrfm15020040
Chicago/Turabian StyleAtkinson, Paul, and Adrian Blundell-Wignall. 2022. "What Problem Is Post-Crisis QE Trying to Solve?" Journal of Risk and Financial Management 15, no. 2: 40. https://0-doi-org.brum.beds.ac.uk/10.3390/jrfm15020040