
Networking for Cloud Robotics: The DewROS Platform and Its Application


Department of Electrical Engineering and Information Technology, University of Naples Federico II, Via Claudio 21, 80125 Naples, Italy
*
Author to whom correspondence should be addressed.
J. Sens. Actuator Netw. 2021, 10(2), 34; https://0-doi-org.brum.beds.ac.uk/10.3390/jsan10020034
Submission received: 3 May 2021
/
Revised: 7 June 2021
/
Accepted: 8 June 2021
/
Published: 14 June 2021
(This article belongs to the Special Issue State-of-the-Art in Sensor and Actuator Networks: Current Status and Future Possibilities)
Abstract
:With the advances in networking technologies, robots can use the almost unlimited resources of large data centers, overcoming the severe limitations imposed by onboard resources: this is the vision of Cloud Robotics. In this context, we present DewROS, a framework based on the Robot Operating System (ROS) which embodies the three-layer, Dew-Robotics architecture, where computation and storage can be distributed among the robot, the network devices close to it, and the Cloud. After presenting the design and implementation of DewROS, we show its application in a real use-case called SHERPA, which foresees a mixed ground and aerial robotic platform for search and rescue in an alpine environment. We used DewROS to analyze the video acquired by the drones in the Cloud and quickly spot signs of human beings in danger. We perform a wide experimental evaluation using different network technologies and Cloud services from Google and Amazon. We evaluated the impact of several variables on the performance of the system. Our results show that, for example, the video length has a minimal impact on the response time with respect to the video size. In addition, we show that the response time depends on the Round Trip Time (RTT) of the network connection when the video is already loaded into the Cloud provider side. Finally, we present a model of the annotation time that considers the RTT of the connection used to reach the Cloud, discussing results and insights into how to improve current Cloud Robotics applications.
1. Introduction
Cloud Robotics aims to create a new generation of robots, in which at least some of the resources, in terms of computing, memory, and storage, are provided by external Data Centers (i.e., in Cloud). At present, robotic systems are generally equipped with an increasing number of sensing units to make them increasingly autonomous. Processing the data from such sensors can be very resource-demanding [1] (e.g., for the analysis of high-resolution videos captured by the HD cameras). The Cloud can then be used to offload these heavy tasks. The wide availability of computational and storage resources appears to be almost unlimited. Additionally, the necessary management effort for provision is minimal. For these reasons, Cloud is a very beneficial addition to the Robotics field. However, some tasks cannot be offloaded because of elements such as timing requirements (i.e., tasks that operate on a milli- or microsecond time scale). Distributed solutions are, therefore, necessary where the computation and storage are spread among the robot, the network device close to it, and the Cloud. This architecture has been recently proposed under the term Dew Robotics [2].
In this paper, we present a platform for Dew Robotics based on ROS [3], the most spread software environment for robots, and called DewROS. We first present its design and implementation. After this, we concentrate on the application of DewROS in a real use-case, in the context of a European Project called SHERPA [4,5]. This project aims to develop a mixed-ground and aerial robotic platform for Search and Rescue (SAR) operations in alpine environments. In this context, a human operator collaborates with a heterogeneous robotic system to rescue survivor victims after avalanches. The robotic team is composed of unmanned aerial vehicles (UAVs) with different characteristics and equipped with different types of sensor, in order to retrieve information from the rescue scene and assist the rescuer during a mission. Moreover, slowly moving robots called rover are also part of the team and occupy a central position in the team topology. Thanks to DewROS, we enabled the in-Cloud storage and processing of high-resolution images and videos captured by Unmanned Aerial Vehicles (UAVs) for the automatic detection of interesting situations such as landslides and the presence of living beings in certain areas. Before discussing DewROS framework, we briefly report the results of our previous work on Cloud Robotics in hazardous environments (see [5]), in which different network technologies are analyzed to define those most suitable for Cloud Robotics in a remote and hostile environment. In this previous paper, we introduced the possibility of using Cloud Computing for the Sherpa project. In this work, we take a step forward by designing a system that can realize this vision, and we test it with real Cloud services according to the Dew Robotics vision.
In particular, in this paper, we report on the design, implementation, and testing of DewROS in a controlled environment. After this, a real application is introduced. In particular, a large experimental campaign using different Internet access technologies is presented, including a real satellite one, and two real Cloud services. For this scope, more than 600 annotation video labeling experiments were performed with Google Cloud Video Intelligence service and Amazon Recognition; videos with different characteristics such as the video location, size, length, label detection mode, etc., were considered. The goal of this study is to identify the aspects that have the smallest and the largest impact on the performance of the Cloud Robotics system. For example, this study demonstrates that the video duration has a much smaller impact with respect to the video size: videos with a duration up to about 70 s can be analyzed in a comparable time to videos of 3 s. Fixing the duration and doubling the video size can almost double the processing time. Moreover, we show how the response time of the Cloud service is unexpectedly dominated by the Round Trip Time (RTT), even if the video to be analyzed is already at the provider side. We uncover similar interesting results through reverse-engineering the API used to access the Cloud service, and introduce a simple model of the annotation time as a function of the RTT of the connection used to reach the Cloud.
2. Related Works
The concept of Service Oriented Architecture was introduced in Cloud Robotics [6]. The architecture proposed in this work provides benefits in terms of the flexibility, extensibility, and reusability of the modules available in the Cloud and used by robots. The proposal is tested in simulation. On a very related note, in [7], a Service Oriented Architecture was employed to develop a Robot-as-a-Service platform. This platform allows for the composition of various robot-related tasks through different programming languages commonly used for service-oriented computing, such as Java and C#.
Connected robots have been a hot research topic in recent years [8,9,10,11]. Researchers have presented robots using 802.11 n or 900 MHz OFDM technologies [8], wireless sensors and actuators networks [9], a meeting channel to interconnect mobile robots [10], and solutions to handle node failure in case of mobile communications [11]. More recently, Cloud Robotics has attracted a lot of attention from the research community, with several scientific papers presenting surveys of this novel research topic [12,13,14]. These papers contain interesting results, for example, evidencing the needto assess the performance of the network, and the characteristics of the Cloud for Cloud Robotics research.
Research papers considering the use of Cloud Robotics in novel and interesting application scenarios have recently been proposed [15,16]. Liu et al. [17] propose the use of Cloud to process videos captured from Robots. They devised and implemented a system including a Robot Operating System (ROS) and a Cloud service for image/video processing. They preliminarily evaluated the performance of their system. Agostinho et al. [18] proposed a Cloud computing system for robotics applications. The system is based on roles, to which Virtual Machines (VMs) in the Cloud are assigned. A scheduling system is also proposed for VM operations.
A software framework for Cloud Robotics based on ROS was recently presented in [19]. This framework allows for communication between ROS nodes and Cloud-offloaded tasks. However, the proposed software architecture has not been validated. Other software platforms for Cloud Robotics have also been presented, even more recently [20]. They are mainly concerned with task scheduling and compared with traditional computation approaches. A very interesting Cloud Robotics platform is Rapyuta [21], an ROS-integrated platform, which is able to offload more than 3000 ROS packages in the Cloud, in a very simple way. Unfortunately, the originally open-source platform seems to be discontinued and a startup is currently carrying out the project.
Robot grasping based on the Google object recognition engine has been proposed by Kehoe et al. [22]. The authors implemented a real prototype and presented initial experiments. Arumugam et al. [23] proposed the DAvinCi system for Cloud Robotics in the service area. Their system is based on the Hadoop cluster, with ROS as the messaging framework. They implemented a FastSLAM algorithm and evaluated the performance in terms of map-build execution times using Hadoop clusters.
Considering our application domain, autonomous and semi-autonomous UAVs have been extensively used in different service and industrial application fields [24,25,26]. Relating to the SHERPA scenario, references [27,28] demonstrate the ability of a human rescuer to orchestrate a multi-robot aerial system which is able to generate a large amount of multimedia data. Many research projects are pursuing cloud robotics developments, ranging from computing resources to systems architecture, like in the RoboEarth project, which envisioned a World Wide Web for robots: a giant network and database repository where robots can share information and learn about their behavior and environment from each other [29]. Cloud Robotics could lead to a strong improvement in the robots’ performance; for this reason, the fast integration of these new technologies is occurring, as demonstrated by recent successful applications in the field of environmental monitoring [30], manufacturing [31], and infrastructure inspection and maintenance [32]. As previously stated, we already considered the adoption of Could Robotics techniques for the SHERPA project [5], analyzing different network technologies in order to find the most suitable one for alpine Search and Rescue domains.
Table 1 shows a comparison with the available literature, discussed above, evidencing the main distinguishing characteristics of our work. In particular, the main contribution of this work are represented by the definition of a new platform for Dew Robotics, and an experimental study to assess the effectiveness and performance of Cloud and networking solutions. To the best of our knowledge, the proposed platform represents the first one available for Dew Robotics. We expect to see more platforms in the literature in the near future, and we will perform a detailed comparison with them when they are available. Regarding the available related works, we also use the real satellite Internet access provided by one of the largest European operators. In addition to this, we used Cloud services from Google and Amazon to extract salient information from a set of videos collected by UAV, employed in S&R (Search&Rescue) missions. Several network performance indicators are discussed and evaluated.
3. DewROS: Our Dew Robotics Platform
The unstoppable proliferation of IoT devices and the rapid progress in robotics and networking technologies has led to the evolution of the Cloud Robotics paradigm towards more flexible models, namely, Fog and Dew Robotics [2]. They promote smarter use of all the systems, such as end, edge and cloud devices, involved in the provision of a service, to meet the different application requirements. Cloud robotics proposes moving robot brains in the Cloud to make them perform better, act smarter, and learn faster. Robots can access a shared pool of potentially unlimited cloud resources through a network connection, which moves data between them and remote servers.
On the other hand, a fault in or a temporary lack of availability of the network might compromise the execution of a crucial task; for example, obstacles and interference can limit the range and the strength of a wireless network signal. Moreover, a network with sudden latency spikes might lead to failure in a real-time task. Therefore, not all robotic tasks are meant to be offloaded to the Cloud, but some of them need different application requirements to be completed. For instance, the aerial vehicles of the SHERPA team can cover significant distances, so they can temporarily leave the wireless network range and no longer communicate with the other units of the robotic platform, including the ground rover, used as a bridge to the Cloud. The drones of the SHERPA team must be able to detect a collision with the environmental elements with no network coverage, running a local algorithm, and relying on their onboard resources. Any task requiring short reaction times should be not delegated to the Cloud, because the unpredictable behavior of the network might lead to its failure.
The key concept of Fog Computing and, therefore, of Fog Robotics, is to extend the Cloud paradigm by ensuring that a subset of the requested remote service is available when it is closer to the end-user, e.g., in the edge network devices. This model involves the design of large-scale distributed applications and systems, in which the proximity of fog nodes, with their greater storage and computation abilities and lower power consumption constraints, represents a crucial factor for the reduction in network latency. The closer the stored data and computations are to the end-user, the smaller the response time. For instance, the ground rover of the SHERPA team plays the role of a Fog node, which can temporarily store the massive amount of visual data captured by the drones before processing or support some of their tasks, such as route re-planning after a collision is avoided. However, a reliable network connection is still needed, at least until the Fog nodes, to use their services.
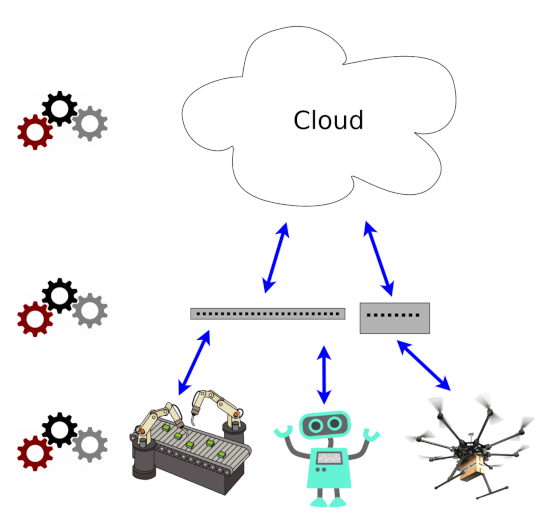
The other key factors considered in this work are system reliability and resilience. Indeed, decomposing remote services in micro-services, provided closer to the user and independent of a fully functional network, allow for a higher resilience to be achieved. In this case, the system can still operate, even if it works in a degraded fashion, i.e., providing fewer features. Dew robotics, as shown in Figure 1, further enhances these ideas, by proposing the wider distribution of the micro-services towards the end-user devices and the robots, which perform at an increasingly higher rate over time. As Figure 1 shows, in the Dew Computing architecture, the processing is performed in the Cloud, in the Fog, and at the end-user device, which can be one of several possible types. More information about the different kinds of architecture, along with their pros and cons, have recently been presented in the literature [2].
General Idea
In this work, a three-tier platform for Dew Robotics built on the top of ROS is defined. In this section, we present the general architecture and related components. After presenting the SHERPA use case in the next section, we will describe how DewROS has been adapted to the proposed use case.
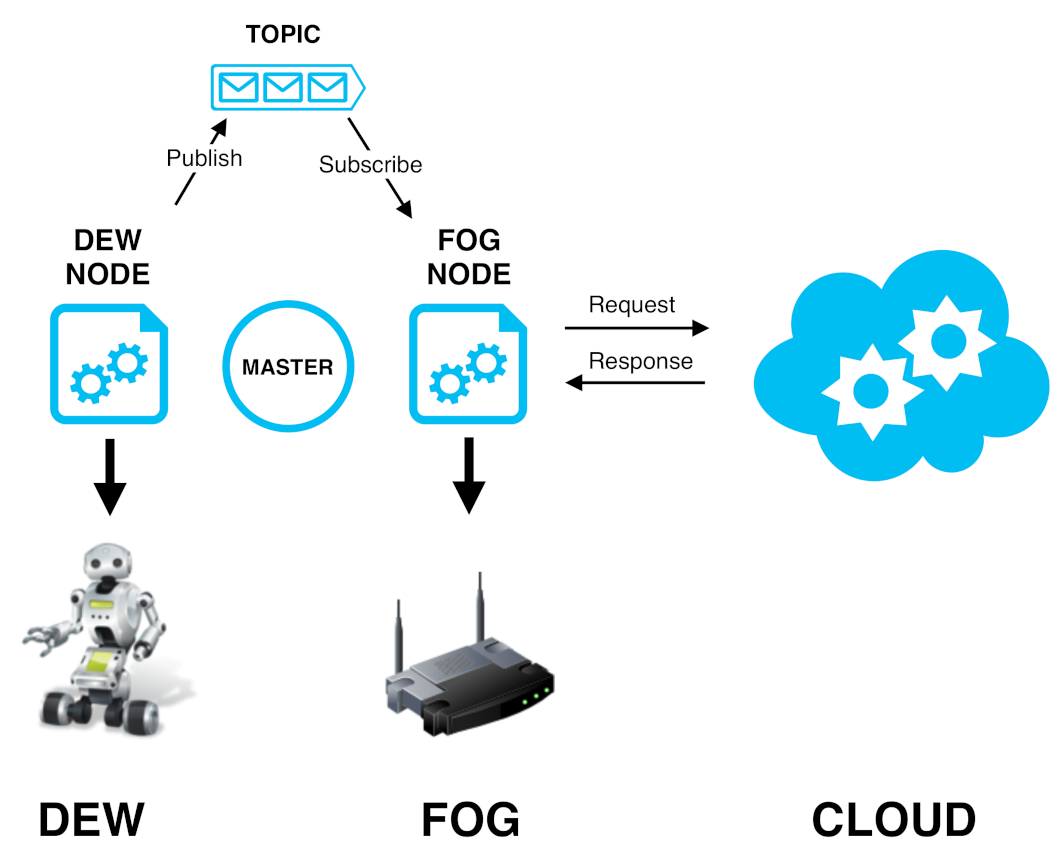
ROS provides, among others, an inter-process communication mechanism based on the publish-s-ubscribe pattern. It allows for the design of distributed applications, whose components, namely ROS nodes, cooperate efficiently by exchanging messages through the use of strongly typed message queues, known as topics. The ROS master in Figure 2 acts as a registration service for the ROS nodes of the graph, tracking their information, such as subscribed topics and exposed services, and enabling them to locate each other and communicate in a peer-to-peer fashion. The first layer of our platform, namely, the Dew node, resides on the robot. It has limited onboard resources in most cases, due to the weight constraints and the necessity of moving freely to perform several operations involving sensor data acquisition and lightweight computations. The Fog node represents the second tier of the architecture, located in proximity to dew nodes. It can be deployed on a component with increased computational and storage abilities compared to robots, as well as fewer power consumption constraints, such as network edge devices connected to the electrical power grid. The fog layer can provide closer support to all the Dew nodes’ activities requiring more predictable service delays but no immediate reaction. The communication between fog and dew nodes follows, as mentioned above, the publish–subscribe model with topics, and can be unidirectional or bidirectional, depending on the specific use case. As depicted in Figure 2, the fog node is the component of our platform that is responsible for interacting with the Cloud layer, so it knows the rules of properly communicate with it and can access the cloud services through the APIs provided. Moreover, the edge devices are equipped with enough hardware resources to store and preprocess the sensing data coming from the dew nodes, as well as the results coming from the cloud layer.
4. Our Use Case: The SHERPA Project
The goal ofthe SHERPA project is to perform S&R operations in hazardous environments with the assistance of a team of robots. In this context, different aerial and ground robotic platforms assist human operators in accomplishing the rescue mission. The SHERPA team is mainly composed of a set of small- and large-scale aerial robots with different abilities and a ground rover which is able to transport weighted objects and endowed with higher computation capabilities. The introduction of cloud computing in the SHERPA projects allow the robots to delegate the majority of their tasks to cloud resources, improving the overall performance of the mission, and helping the robot in the elaboration of the huge amount of data generated by onboard sensors (image elaboration, object detection, scene interpretation, etc.). Each robot in the team is able to generate various types of multimedia data, which are exploited to accomplish the rescue mission. In particular, the video and images gathered by the robots’ camera sensor must be analyzed to detect the presence of avalanche victims or potential risks to human operators, while the GPS and localization information of each robot is used to plan and execute the rescue mission.
Considering the critical issues related to SHERPA project domain, it is crucial to choose the best network configuration in terms of performance and accessibility to allow robots to use cloud services. In this context, network performance is typically evaluated by considering three main parameters: bitrate (the transmission speed), latency (the time elapsed from when the packet is sent to when it arrives at destination), and loss (which defines how many packets do not reach their destination) [33,34]. Additional parameters must be considered to properly choose the network configuration, related to the operating conditions of the networks, e.g., if it has to work outdoors or indoors, and its coverage in both cases. The most appealing network technologies for the SHERPA domain are the IEEE 802.11 wireless LAN, the Mobile Cellular, the WiMAX, and the Satellite Network. Among these, considering the results presented in the literature [5], the most efficient and effective solution seems to be represented by the satellite technology. This could provide the SHERPA team with sure coverage in the whole alpine area (as well as everywhere else, in case the SHERPA team has to be employed in other scenarios).
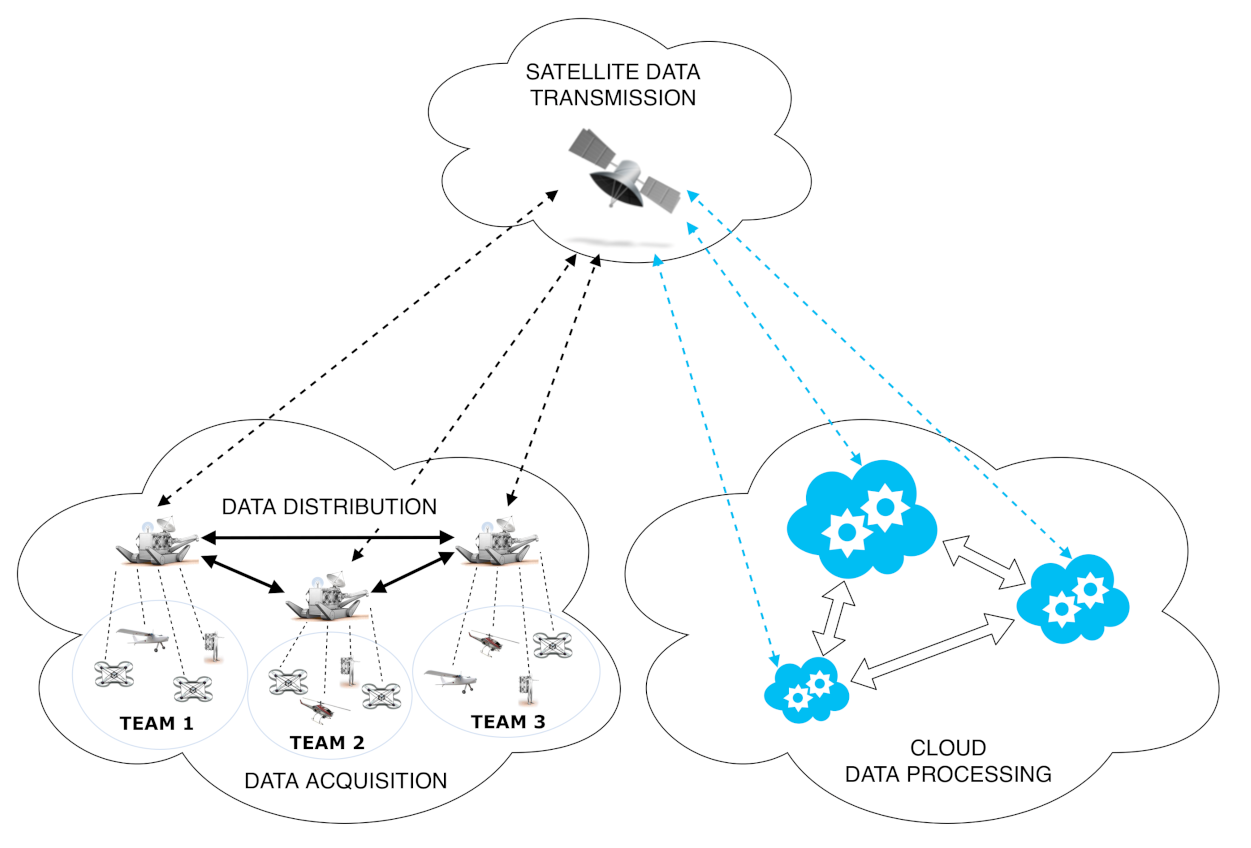
In this context, communication with the cloud can be managed by a single central element called sherpa box, with fewer requirements in terms of mobility, while each actor of the SHERPA team would send the data that require Cloud computation, analysis, or storage in the sherpa box, which will act as a relay to the Cloud. The box will then act as a gateway to the Internet for the SHERPA team, moving slowly, to follow possible major shifts in the team, remaining in a central position with respect to the team’s operating zone. The proposed network architecture is depicted in Figure 3. The figure shows how the robots interact among themselves through a local network, and how such network of robots can then interact with applications located in a Cloud using the sherpa box as a relay. The next section describes the customization and usage of DewROS in the SHERPA domain.
5. DewROS for SHERPA
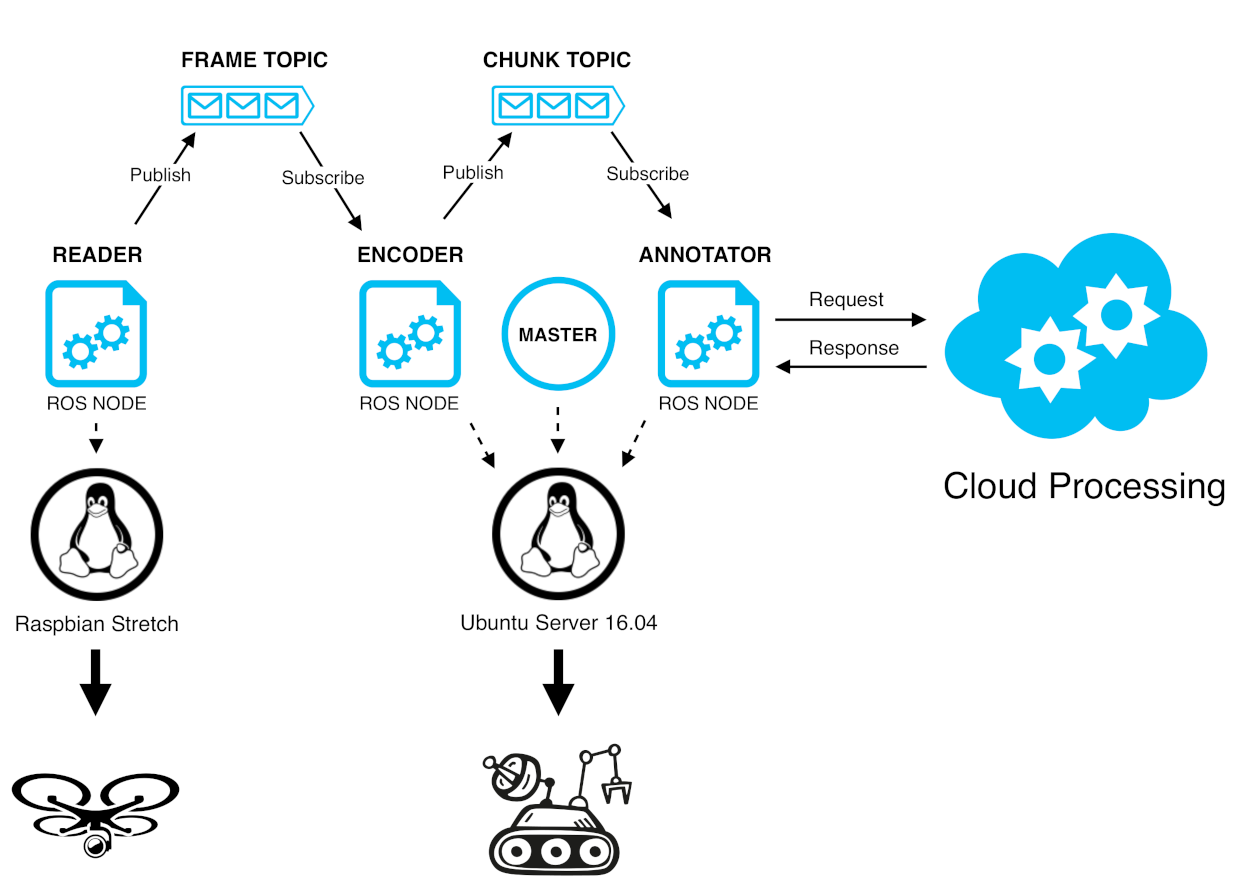
Dew Computing (DC) represents a paradigm model to transfer the core concept of Cloud Computing with the end devices ability to enable a ubiquitous, pervasive, and convenient, ready-to-go, plug-in facility-empowered personal network that includes a Single-Super-Hybrid-Peer P2P communication link [35,36,37]. In this work, a three-tier platform, based on the general architecture described previously and suitable for the SHERPA case is deployed. The three ROS nodes depicted in Figure 4 can run on different robots and communicate with each other through wireless network technology, such as a WiFi network, using the ground rover as an access point.
Several tools have been used for this DewROS instance, such as the software library OpenCV, used to manipulate an input video stream, Google Cloud Video Intelligence, and Amazon Rekognition, used to automatically extract semantic data from video files and ROS, as the underlying robotic framework of the platform. As shown in Figure 4, the first tier, the Reader, is a dew node deployed on the drone of the SHERPA team, which captures an input video stream from a generic video device and sends the related frames to the second tier of the platform through a topic which is able to transmit image messages, named Frame Topic in Figure 4. It uses the OpenCV VideoCapture methods to grab and decode the frames of an input video stream, so that they can be processed one by one.
The remaining two ROS nodes of our platform, the Encoder and the Annotator are part of the Fog tier and are deployed on the ground rover so that they can use its onboard resources to execute medium-weight tasks. The ROS master, which is another process-consuming resource, has been allocated on the rover, the leader of the robotic platform. The Encoder, previously subscribed to the Frame Topic, will obtain and compress the retrieved images with a chosen codec, writing them in a sequence of video segments, called video chunks. Once a chunk is completed, the Encoder publishes its name in the Chunk Topic, so that the Annotator will be aware of this event and prepared to interact with the Cloud service. Hence, Annotator sends an annotation request to Google Videointelligence or Amazon Rekognition for every completed chunk and waits for the results, then writes the received labels into a text file.
The labels resulting from this process might be further processed to generate alarms when matching specific items or, more generally, evidence of human presence. In this context, cloud-based solutions for video annotation represent an excellent choice in terms of the precision, time required, and overall performance. The cloud services involved in this analysis rely on pre-trained machine learning models and computer vision techniques to automatically recognize a vast number of objects, places, and actions in stored videos. Moreover, these models require a lot of computational power to produce, and are improved and updated over time as new concepts are introduced. The video-processing work is resource-intensive because it requires the retrieval of relevant information within the entire video, analyzing each frame individually, and is scaled to reduce delays as much as possible. However, from the perspective of service resilience, a fog computing-based approach can also be considered [38]. A fog annotator may replace our cloud-based annotators in case of network issues and provide the same service, even with reduced performance. The architecture of DewROS is highly flexible to accommodate different deployment strategies.
6. Experimental Evaluation
For the tests, the architecture of the new SHERPA system reported in Figure 3 was reproduced in our laboratory environment. In particular, a laptop was used to mimic the drone capturing the video. Then, a small server was used for the ground rover, and Cloud Video Intelligence (CVI ) provided by Google or Amazon Rekognition (AR) were considered as the Cloud services for annotating videos. The laptop is connected to the server via a WLAN, while the server accesses the Internet and the Cloud services via the different WAN under test, described in detail below. The impact of WLAN on the the performance of the system has been found to be negligible with respect to the impact of the WAN, which was then investigated further. CVI and AR use machine learning and computer vision algorithms to extract metadata related to the entities and actions detected in a video file, in the form of labels. Every label or tag is associated with a list of frames, with each one having a grade of confidence and a time offset from the first frame of the video. A study to find out whether and how the video file resolution affects the quality has been conducted, in terms of confidence and pertinence, and the number of labels returned by the cloud service.
It is important to understand the necessity of adopting the maximum available resolution to achieve the best results. This is directly related to the upload bitrate requirements defined for the chosen network technology. Furthermore, the time required for the annotation of different videos, with different characteristics and different Internet connections, were analyzed, and factors that influence most the new SHERPA system’s performance were identified. Finally, further investigations into the delay issues experimented in the response time were performed, examining the application protocol of CVI while making an annotation request.
6.1. Tools and Methodology
In this section, the methodology and tools used for our experimental analysis are presented. Regarding the Cloud services provided by Google and Amazon, the client can send an annotation request for a video stored locally or in the Cloud, obtaining a list of annotations with their level of confidence. The following label detection modes are available for CVI: Unspecified Mode—coarse-grained labels extraction, providing contextual information at the level of the entire video, seen as a single large segment; Shot Mode—provides contextual information at the shot level, so that every label can be detected in multiple video segments; Frame Mode—fine-grained label extraction, providing contextual information at the frame level; Shot&Frame Mode—this includes all the previously described label detection modes.
At first, the labels obtained from the cloud services at four different resolutions of the same input video are analyzed to find out whether and how this factor influences the outcomes. To perform an extensive assessment, three videos have been considered, labeled as A, B, C, each one downloaded at the maximum resolution 1080p and scaled down to 720p, 360p, and 240p. In this context, the labels obtained at different video resolutions have been compared in terms of quantity, confidence level, and pertinence. In particular, the label associated with a video is classified as non-pertinent if it is clearly out of context, namely, if it has nothing to do with the entities seen in the video. Moreover, the level of confidence indicates how certain the service is about the detected entity. This expresses the probability that the service would return the same label if it analyses the same video several times.
Afterward, the behavior of the network connection used to reach the Cloud Video intelligence platform was analyzed, studying the CVI response time of label detection requests with different test parameters. To validate the performance of the satellite technology, the satellite network (SAT) was compared with two other Internet connections: one from the University of Naples Federico II, using a Gigabit Ethernet for local connectivity and part of the Garr/Geant network, and a residential broadband connection using FTTH from one of the main Telecom Operators in Italy, respectively defined as UNI and HOME.
Regarding the label detection modes, the Unspecified and Shot&Frame label detection modes were considered as the most simple and most difficult label detection tasks. In addition, five video duration values and sizes were considered, in order to evaluate the effect of these variables on the CVI response time. In particular, three different sizes were considered for each video type. Namely, small (2.1 MB), medium (8.8 MB) and large (23.7 MB) and two different lengths, namely Short (3 s) and Long (71 s). Finally, the videos that need to be analyzed were placed on the host connected through the network under test, as well as directly onto GCS. Each test case considered in this section is represented by a specific combination of these parameters and replicated 10 times, obtaining a total of 600 observations. The considered variables are reported in Table 2.
The observations were taken on several consecutive days, at different times. The basic performance parameters of the network connections under test are shown in Table 3. The values are measured using python-version of Ookla speed test, speedtest-cli, with Ubuntu Linux 16.04. Furthermore, several traffic traces using Wireshark were captured while making the API call to CVI, and varying the video size, length, and label detection mode. The capture process was repeated five times for every specific combination of these factors. Then, every trace was manually inspected to detect the similarities and differences. The purpose of this analysis is to extract a common interaction pattern between the client and server from the traffic traces, to find out whether the response time is also due to the application protocol of the cloud service.
6.2. Analysis of Labels Detected
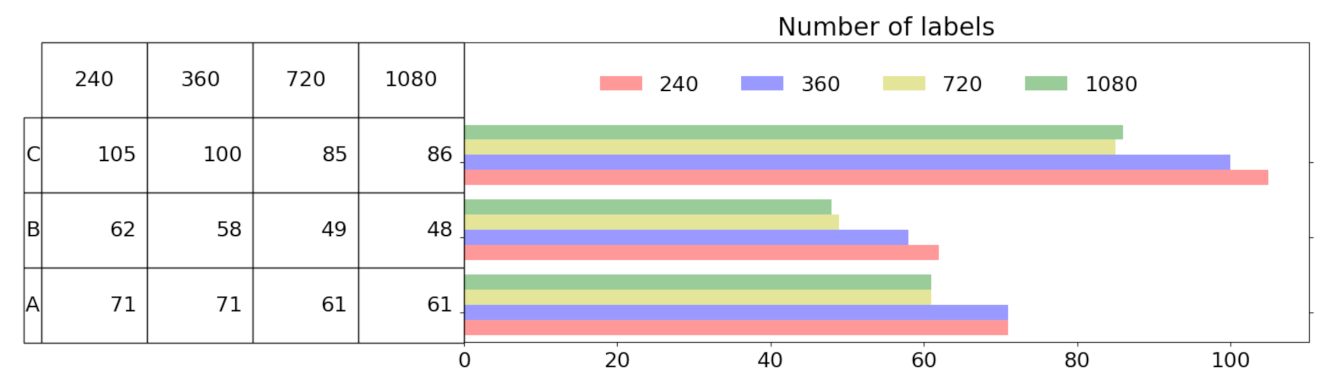
We begin by examining the effect of the video resolution on the label detection feature of CVI and AR, using three videos, all representing avalanche scenarios and converted to High Definition (1080p and 720p) and Standard Definition (360p and 240p) resolutions. As depicted in Figure 5 for CVI, a trend can be distinguished in the number of labels found at different resolutions, i.e., the lower the resolution, the higher the number of labels. There are some reasons that can explain this tendency.
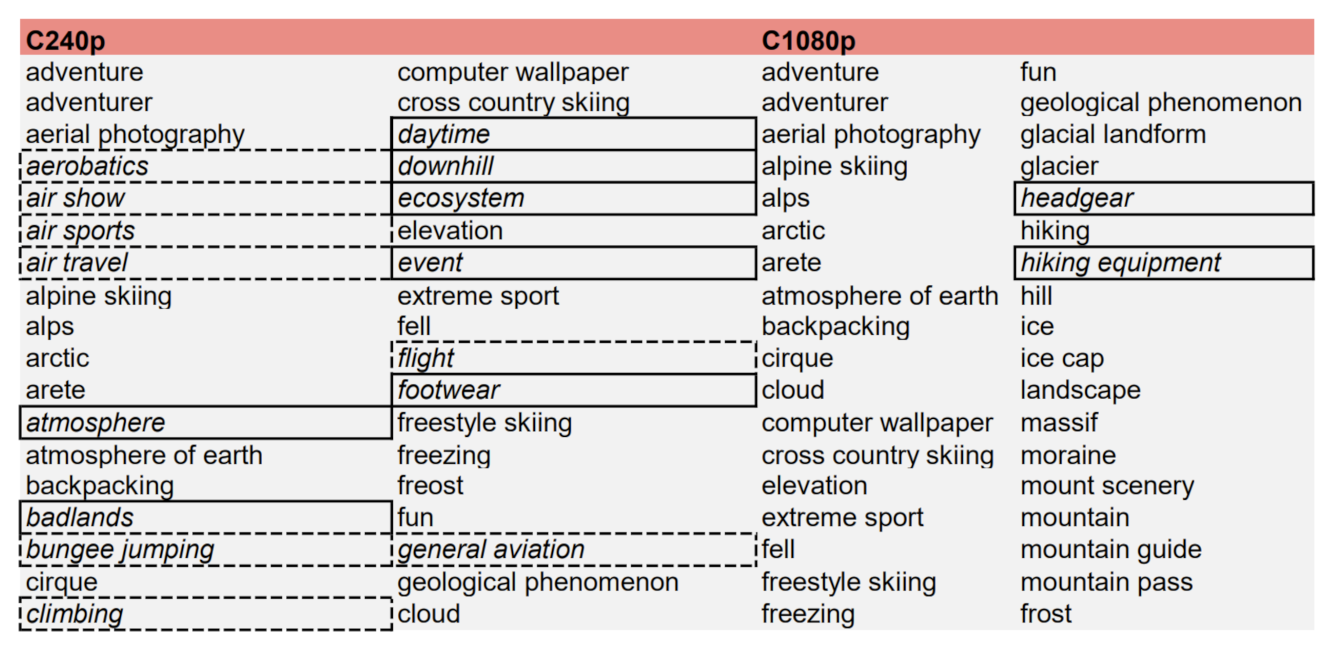
The cloud service can generate many non-pertinent labels for each erroneous entity detected in a video, namely, an object or an action that does not appear in the video. Moreover, there is a higher probability that CVI returns more erroneous labels on low-resolution videos than on high-resolution ones. This has been investigated by extracting the labels in the Shot & Frame mode from the three videos A, B, and C, and inspecting them manually. A striking case of the above considerations is represented in Figure 6, where the labels returned by CVI for video C, with the lowest and the highest considered resolution, are reported. The labels that appear in only one resolution are represented by boxes with solid borders, while the non-pertinent ones are represented by dashed borders.It can be noticed that the service confuses the skiing action at high speed on a white background with parachuting, returning about 15 labels associated with that error. The erroneous labels decrease gradually with increasing resolution until they disappear completely at 1080p.
Another element influencing the number of labels obtained is that low-resolution videos contain more irrelevant labels, namely, labels not adding useful information, or those quite similar to others. In conclusion, the higher number of labels obtained at lower resolutions could be due to both non-pertinent labels associated with incorrect interpretations of video contents and irrelevant labels. However, video C represents a case in point, where the cloud service fails to detect an entity in the background. In the other two videos, it seems that the resolution is not determinant of the success of the task, since erroneous detection or labels adding valuable information at higher resolutions rather than at lower ones cannot be found.
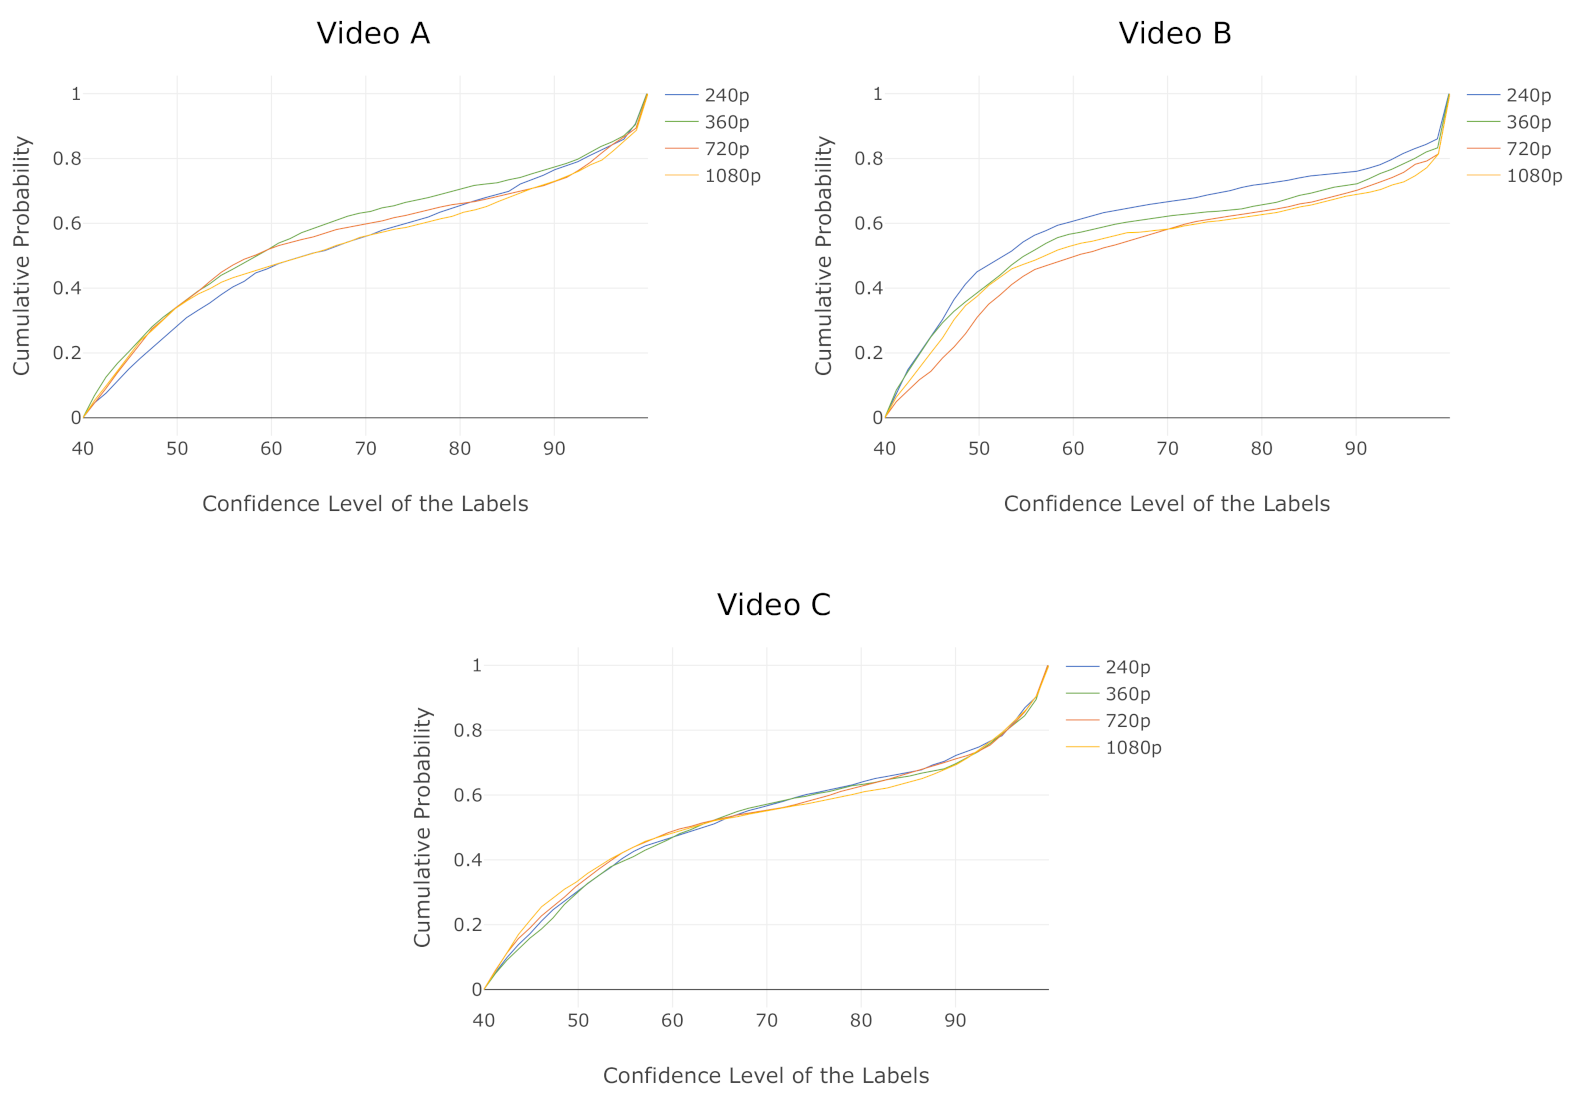
The impact of the video resolution on the confidence level of the labels was then analyzed. As described previously, the result of an annotation request is a list of labels and, for each of them, the video frames, the time it refers to and the level of confidence of such labels are also reported. Two opposite effects can be expected, depending on the pertinence of the returned labels. On one side, the level of confidence can decrease with the increasing resolution because the service becomes less certain of erroneous detection. However, the level of confidence can increase with increasing resolution because the service has a sharper view of the proper entities in the video. The trend observed in the last case is that the confidence of the proper labels remains almost unchanged, increasing the resolution.
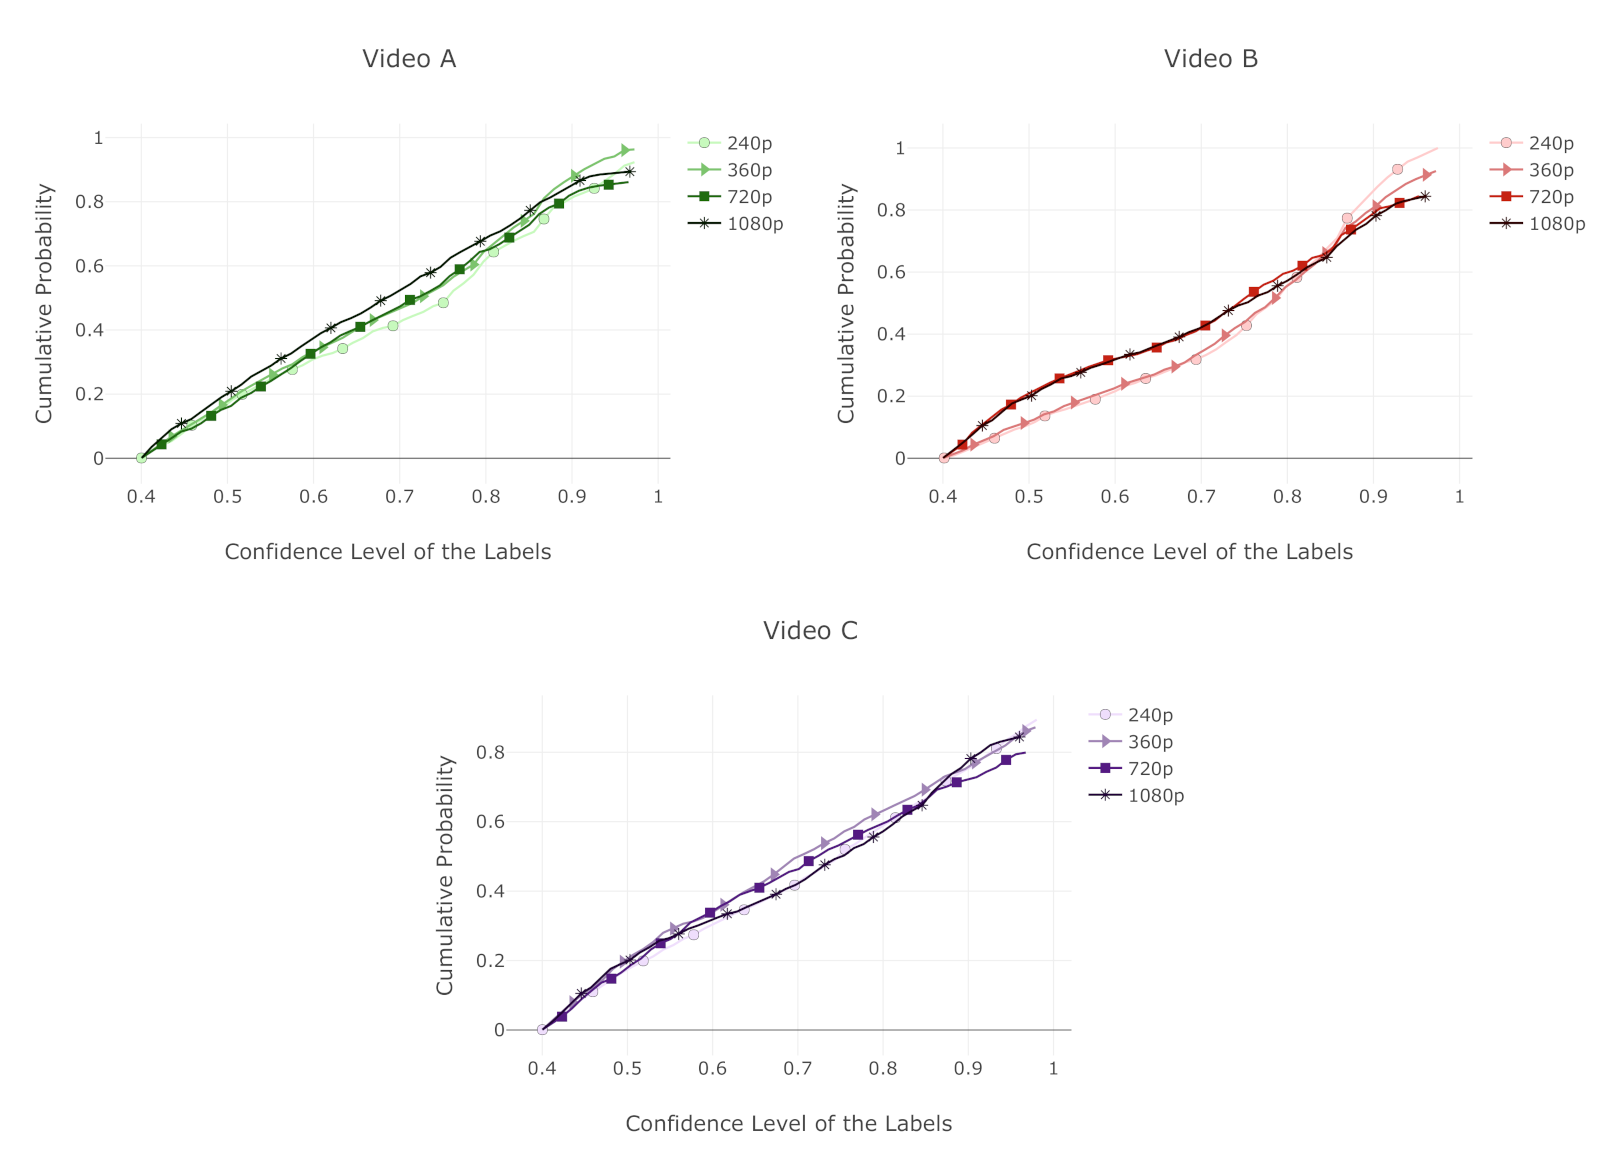
The labels related to each video, together with the confidence level of the frames, were extracted. Then, an Empirical Cumulative Distribution Function (ECDF) of these values was calculated. The plots in Figure 7 depict the distributions of the confidence levels obtained for a specific video at the four considered resolutions with CVI.
For video B, a clear separation between the HD and SD pairs of distributions can be observed, until a confidence level of is reached. Before that value, the observations from the SD distributions show confidence values which are slightly higher than the ones from the HD pair. Indeed, of the observations from the SD distributions exhibit confidence values higher than versus the of the HD ones. As mentioned before, more irrelevant labels from low-resolution videos, often with high confidence values, were obtained. For instance, labels referring to general elements, such as “extreme sports” or “ecosystem”, appear in many frames of the video with high confidence values, which fill the upper part of the distribution. This explains the trend observed in the A and B videos, where the HD distributions show lower confidence values than the SD ones. This trend seems to be reverted in video C, because several erroneous labels with confidence values in the interval awere detected, which disappear at the maximum resolution. Those values fill the lower part of the SD distributions, causing an upward shift in the corresponding ECDF curve. The shape of the curves at different resolutions is similar in all three videos, except for B, where it is possible to observe more pronounced differences between HD and SD than in the other cases.
In conclusion, there is a balance between the proper labels, whose confidence level tends to increase with the resolution, and the erroneous labels, whose confidence values decrease with increasing resolution. Moreover, more irrelevant labels were obtained in the low-resolution videos. However, clear improvements were not observed in the confidence level of the proper labels with increasing resolution.
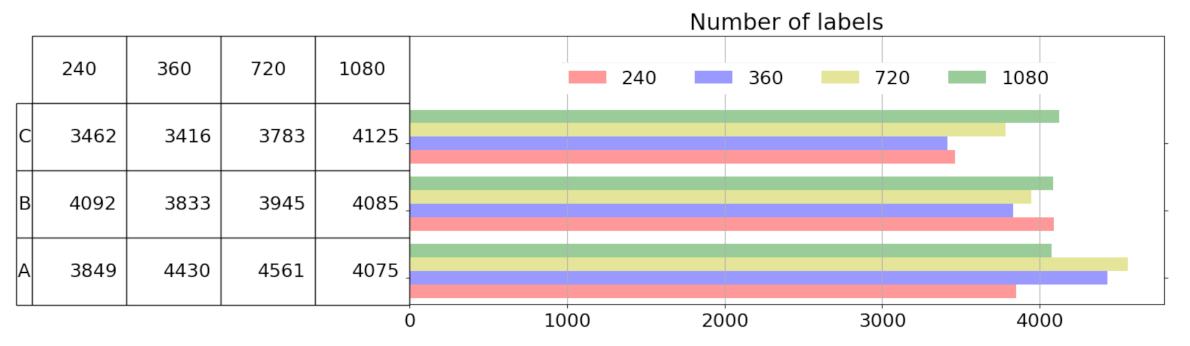
The same analysis was performed on the same three videos with AR to evaluate the impact of the video resolution on the quality and quantity of labels and obtain a comparison between the two services. The number of labels obtained is much higher than CVI because, in this case, the entire label hierarchy for each object detected is returned. The video resolution does not affect the number of labels received because it is not possible to identify a specific trend, as shown in Figure 8.
We then examined how the video resolution influences the level of confidence of the labels, with the same procedure used in the CVI case. Figure 9 shows the empirical cumulative distribution function of the level of confidence associated with each label, obtained at different video resolutions, using AR.
The CDF curves obtained for different resolutions show similar shapes. The largest difference can be observed in video B, where the CDFs show a significant slope change from the confidence level of . Therefore, of observations have a confidence level included in the from 0.40 to 0.55 range and lower dispersion. For confidence values larger than , the distributions are almost flat, which implies a higher dispersion. In this area, the differences between the four distributions are more pronounced. For instance, of observations have confidence values larger than at the resolution of 1080p, and then at 240p.
Generally, higher values of confidence with increasing resolution were observed with AR with respect to CVI. On the other side, the confidence values of CVI are higher than the ones obtained from AR. For example, considering the video B, the median values from AR and CVI are, respectively, and ca for the SD resolutions. Moreover, with CVI, only of observations have smaller confidence values than , versus of AR, in the case of SD curves in video B. This trend is less evident when comparing the other two videos with their counterparts.
6.3. Analysis of Response Time
Factors influencing the response time of CVI are investigated in this section. CVI was selected for this analysis because it presents the best results in terms of the detected labels.
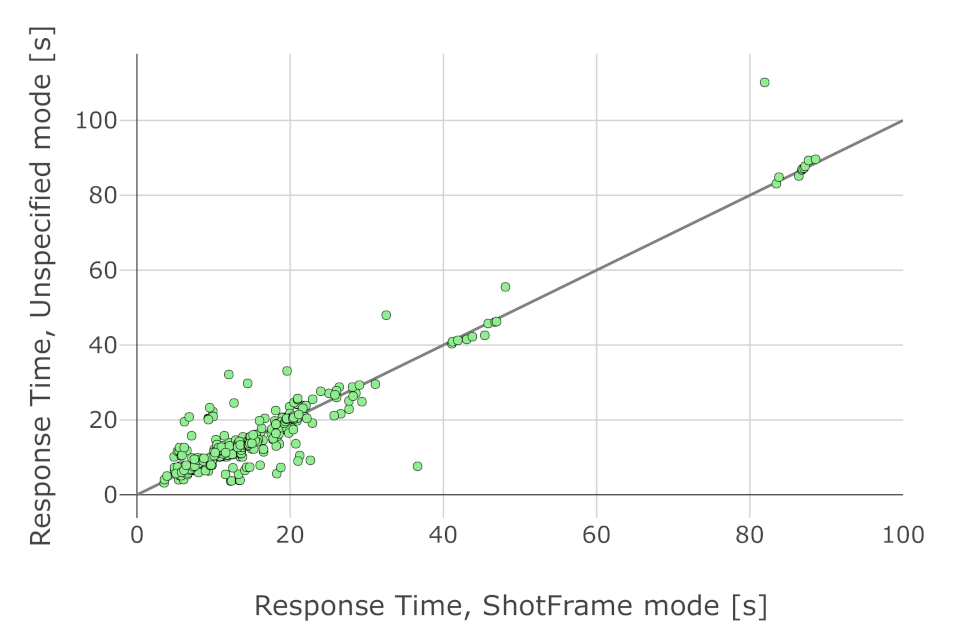
Results related to the time required by CVI as a function of the label detection mode requested are analyzed first. Figure 10 reports the relationship between the response time of Shot&Frame and Unspecified detection modes, respectively. A single sample in this figure represents the response time of CVI for a particular video, with a particular combination of all test parameters (e.g., video location, video size, video length). The scatter plot compares the response time of CVI under the two label detection modes conditions, fixing all the other variables.
As shown in Figure 10, the requested label detection mode has no significant impact on the response time of the request. The observations are close to the bisector of the first quadrant (grey line in Figure 10) and distributed around (over and under) it. Therefore, it can be assumed that there is no significant difference between the response times for these label detection modes. For this reason, in the following experiments, the label detection mode will not be considered.
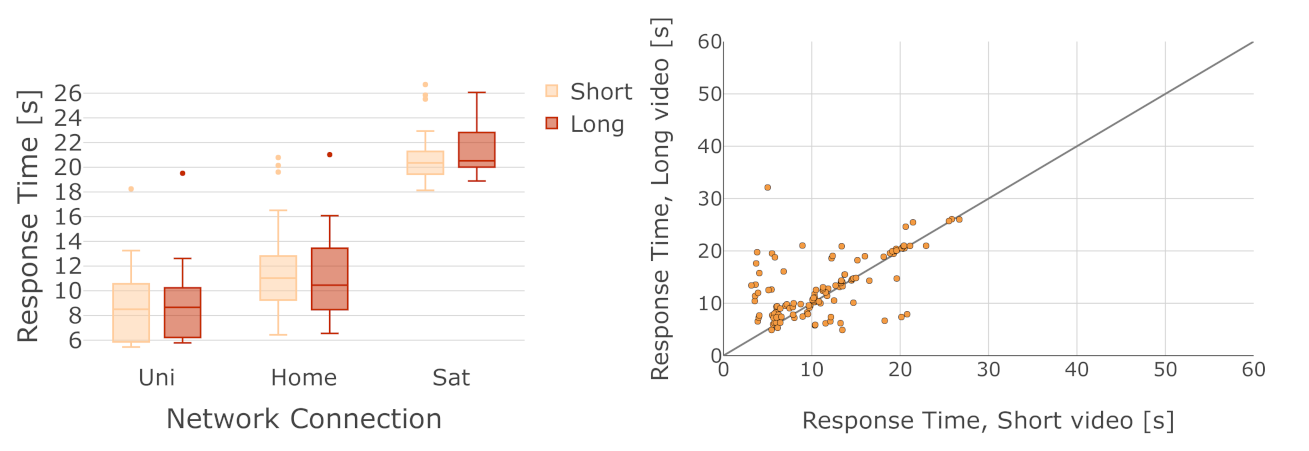
We now analyze the impact of the video length on the response time of an annotation request. Figure 11 (left) reports such time using the three networks under test and videos with very different lengths (3 s and 71 s) and the same size (about 2 MB). Two important behaviors can be seen in this figure: (i) the lower the connection speed, the higher the response time, and (ii) the two lengths are processed in about the same time by CVI. The former behavior is more expected and mainly due to the time required to upload the video on the Cloud. The latter is less expected. This may suggest that the response time is not strongly impacted by the video length.
A scatter plot to validate the last consideration was considered, in which observations with the same combination of variables, except the video length, are coupled together. The resulting plot of Short vs. Long is reported in Figure 11 (right). The figure shows that the points are generally very close to the bisector and randomly distributed around it. This confirms that there is no significant difference between the time required for the annotation of videos of different lengths but the same size.
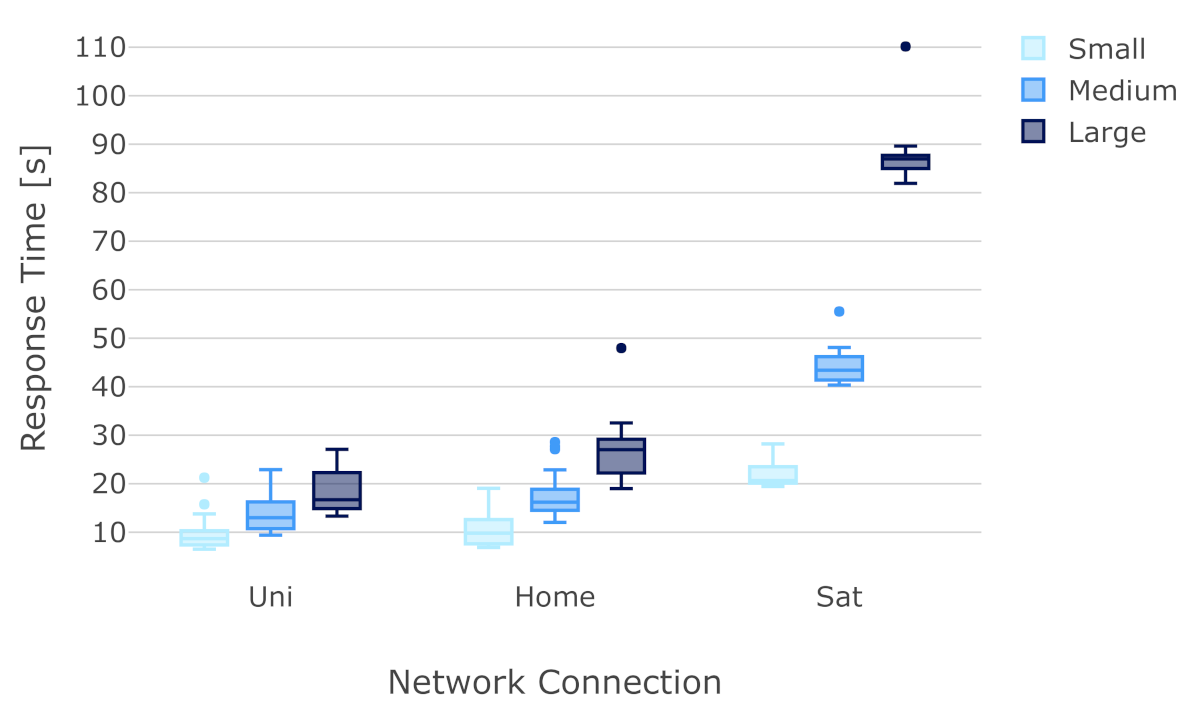
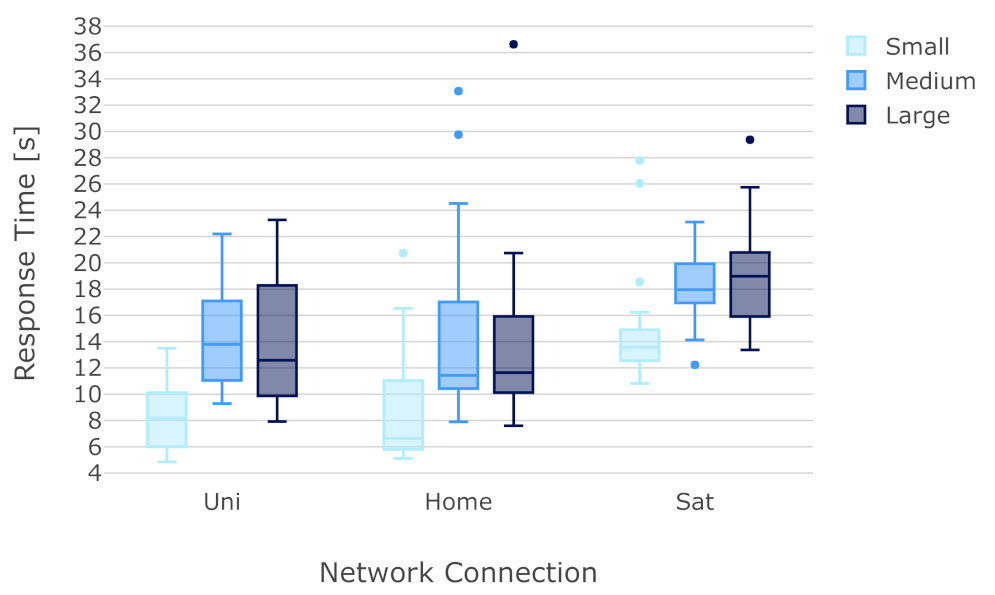
In the following, consideration of the video size will be made. In Figure 12, the response time obtained for the three Internet connections, using Small, Medium, and Large videos, all located at the client side, is reported. The figure evidences very large differences among the Internet connections and video sizes. The variation in the samples (e.g., the extension of the box plots) is interesting, as it tends to decrease with the increase in the response time. The mean of such a parameter, instead, is in clear inverse proportion to the nominal upload speeds of the Internet connections under test (see Table 3 for reference values). The lower the upload speed and the larger the file size, the larger the response time (and its variation). This could easily be due to the fact the video file must be sent to Google servers first and then annotated.
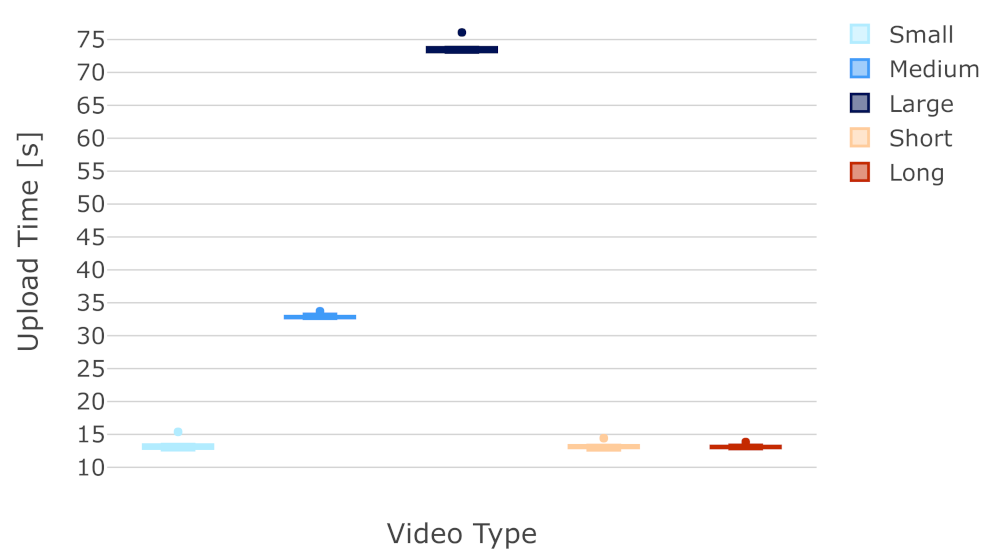
To further investigate this important issue, the contribution of the file upload has been isolated. It is worth noting that the API available for interacting with CVI—through the function annotate_video(features, video_context, input_content)—performs all the actions (upload, if needed, and annotation request/response) in a single call. The call requires information about the video file that will be analyzed, its location, what type of analysis is requested, etc. To isolate the video upload contribution, we used the API for the file upload in a previously created bucket on GCS—through the function upload_from_filename(source_file_name)—and measured the time required for this task. Figure 13 reports such a time for the satellite Internet connection. The figure evidences the high times needed with this connection and the clear dependence on the file size. The upload time with a video of size 24 MB is about 73 s, which implies a throughput of about 2.5 Mbps. This throughput value is smaller than the one measured with speedtest-cli (reported in Table 3), but relates to a real case study and is, therefore, much more realistic for real-world application. Comparing these results with the ones from Figure 12, it can be noticed that the upload time can comprise about of the total average response time for this video (88 s) reported in Figure 12.
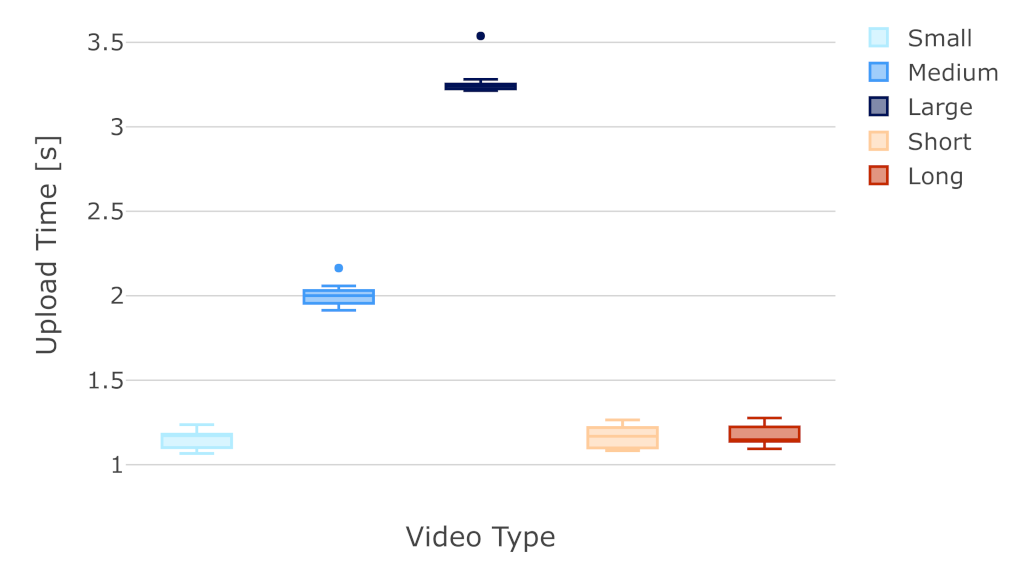
We next compare this with the fastest Internet connection. Figure 14 shows the upload times of the UNI network connection. For the UNI network, the upload time with a video of size 24 MB is about s, which implies a throughput of about 60 Mbps towards the Google server in the Cloud. Comparing these values with the ones from Figure 12, it is possible to see that the upload time for the UNI network is only of the response time for this video (about 15 s).
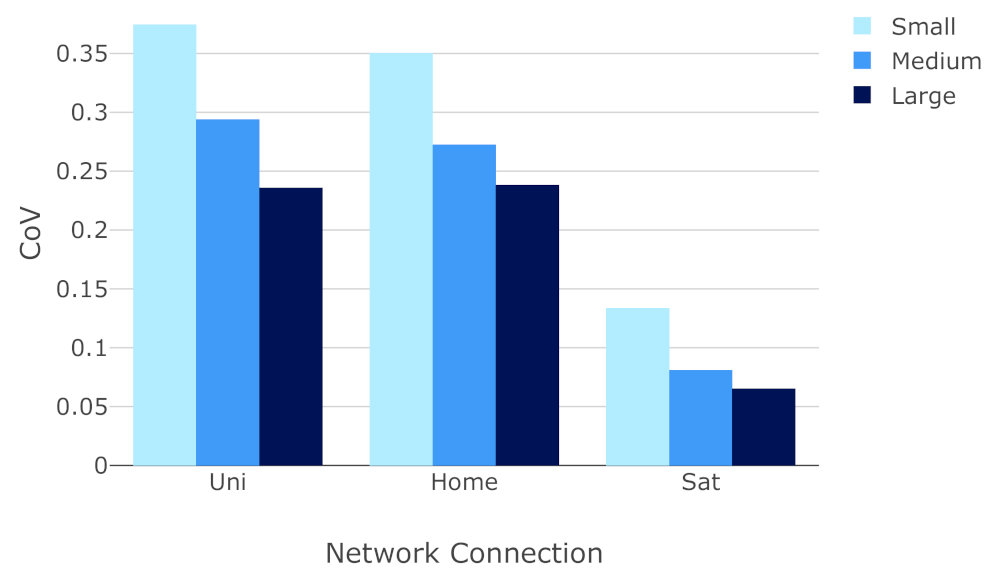
The other aspect that calls for further investigation is the variability observed in the boxes in Figure 14. We, therefore, examined the coefficient of variation (CoV), calculated as the ratio of the sample standard deviation to the sample mean. The CoV is reported in Figure 15. A trend can be observed related to the two variables of video size and Internet connection. In particular, the larger the video file size and lower the upload speed of the specific connection, the lower the coefficient of variation and, therefore, the dispersion in that sample. Further analyses revealed that the difference between these values is mainly because the variation in the response time for different requests is almost constant and independent of the mean, where values are, instead, very different, as a function of the several variables considered.
The time taken to upload the video on the Cloud can reach about of the total CVI response time for the satellite and up to for the UNI. The remaining part of the response time, the one not related to video upload, was then analyzed to understand how it is dependent on the variables under control. The same API (through the function annotate_video(features, video_context, input_content)) was used, but with videos which were already loaded onto the Cloud. Figure 16 reports the obtained results. In this case, the difference between the distributions is smaller than in the previous case and the difference between the medians in every connection is in the range of 5 s. Here, it can be observed that large- and medium-sized videos need more time for analysis with respect to small ones, with all the Internet connections. This is different from what occurred with video length and implies that CVI response time depends much more on the volume of bytes than on the number of frames to be analyzed. The higher response times obtained by SAT with all the videos was less expected.
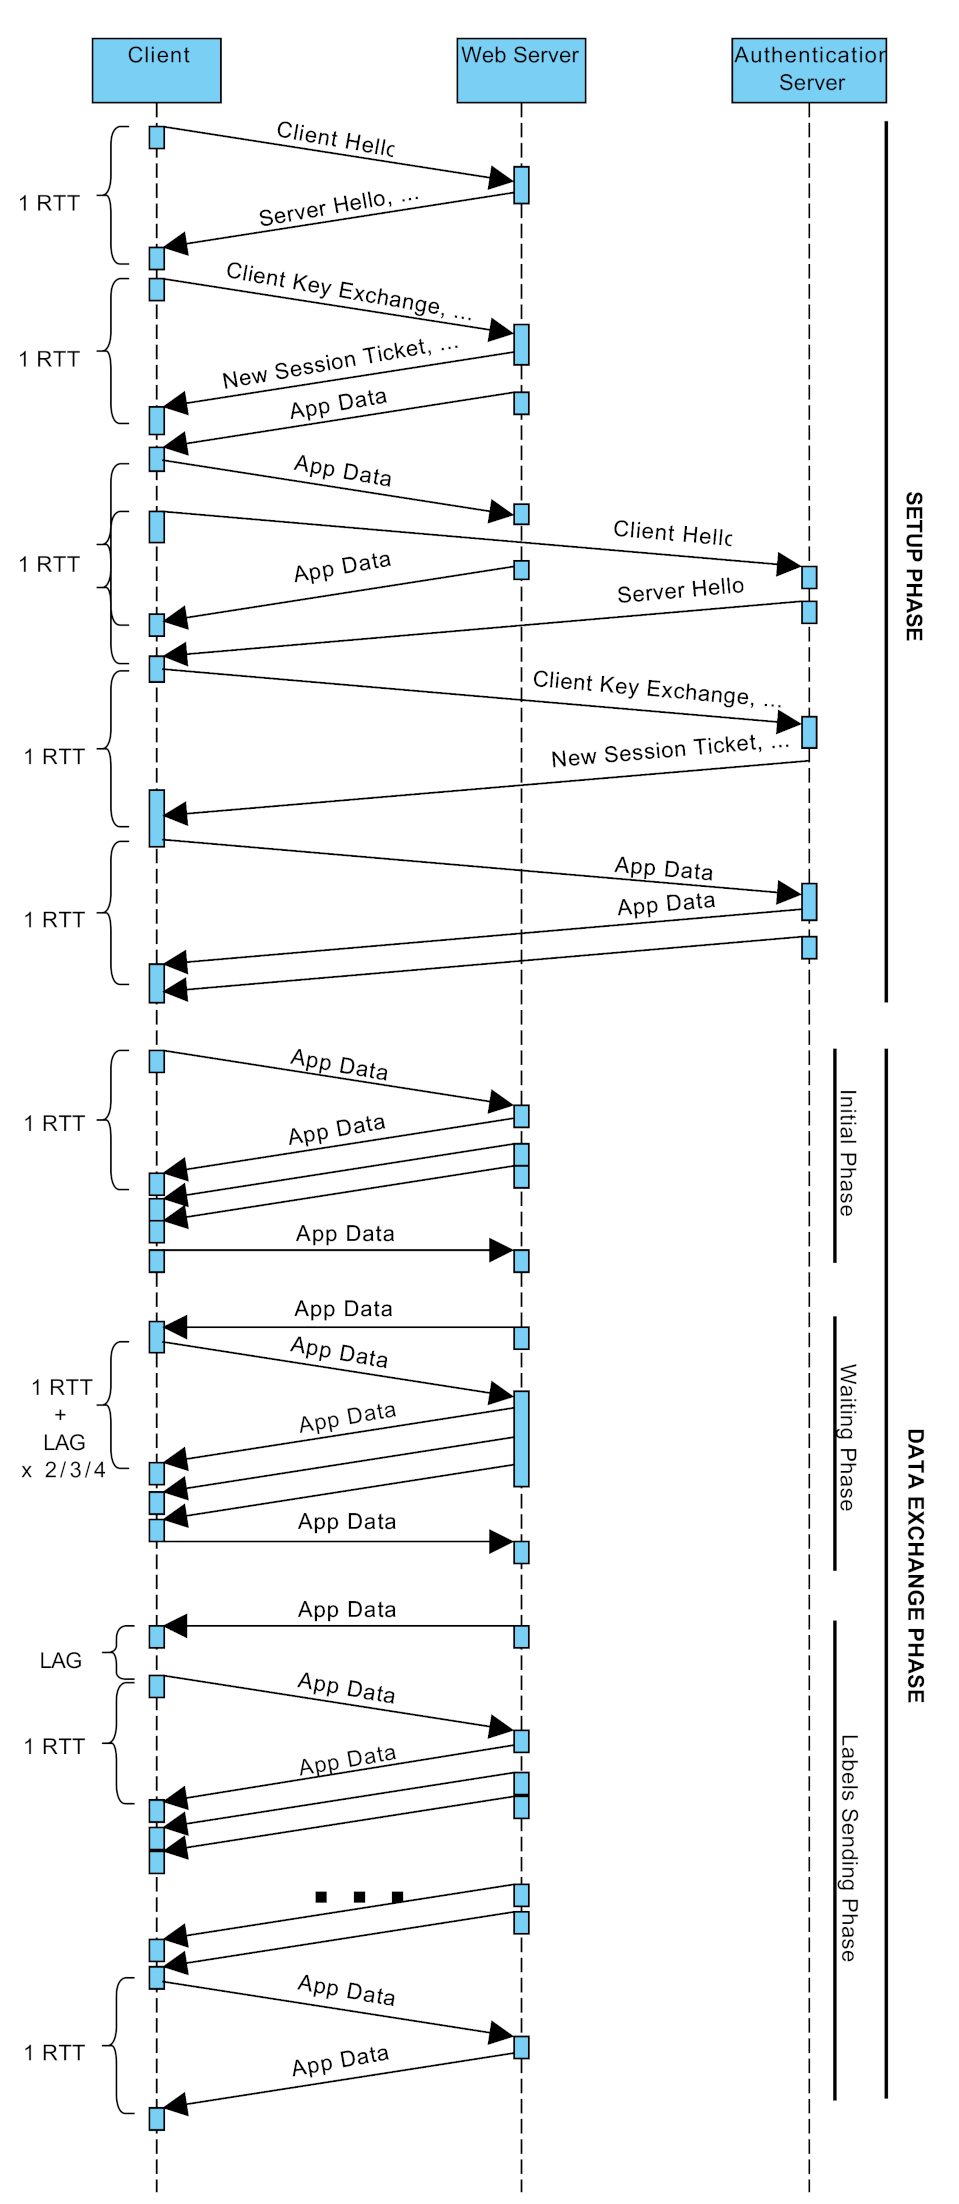
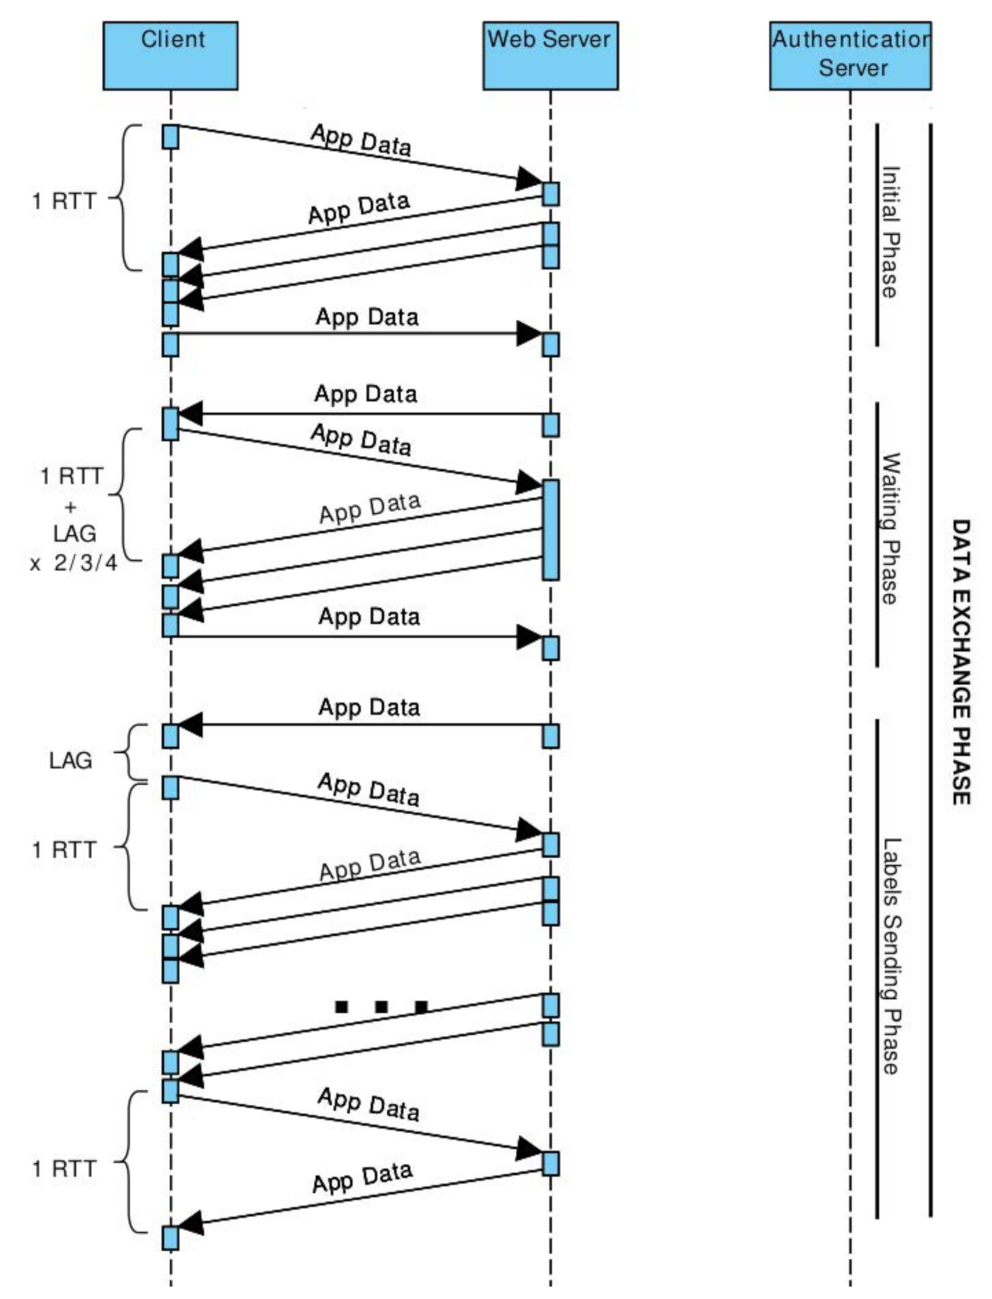
We looked further into this unexpected outcome, examining the application protocol implemented by CVI. Using several Wireshark packet traces, varying the label detection mode, the length and size of our videos, all of which were already uploaded on GCS, were obtained. Then, the trace files were manually inspected to extract the client–server interaction pattern triggered after an annotation request. The application-level packets exchanged between client and server are encrypted with the TLSv1.2 protocol; their content is not accessible, so the sequence diagram notes rely on assumptions based on other information, such as domain names obtained from DNS responses. In the sequence diagram reported in Figure 17 and Figure 18, the TLS conversations needed to extract relevant information regarding the communication delays are shown.
In this context, two parallel TLS sessions are established between the client and the Google server. The first one is established with a web server, while the second one is established with an authentication server. Moreover, we focused on the request–response patterns, where the client must wait for the server response before sending the next message, called “ping-pong”.
In this context, there are several steps that need to be taken before the results are sent to the client in the form of labels. For every request–response, one or more RTT should be considered, which have a massive influence on the server response time. The total number of RTTs for one video annotation request is between 10 and 12. However, this fluctuation is related to the number of RTTs in the textit“Waiting Phase”, which appears to be independent of the type of request. Moreover, some additional terms of client-side lag, which are not related to the network delay, and so are almost similar for every connection, are evidenced.
This analysis led to expressing the annotation time , namely, the amount of time elapsed between the annotation request and the reception of the labels by the client, with this formula
where, as mentioned previously, the random variable takes all the lag components into account, mostly client-side, not related to the network delay.
At this point, the purpose is to validate the previous equation, comparing the differences between the response variables related to each connection under test with the ones coming from the formula, expressed in terms of RTTs. Thus, assuming that “HOME” and “UNI” connections are similar in terms of RTT, only the second one will be considered in the calculations
If we consider the term to be very close to zero on average, the result of the equation is a number in this range:
In conclusion, the difference between the RTTs is reflected in the server response time, as well as when the video file is stored server-side. In addition, the SAT connection RTT is one order of magnitude higher than the other two connections, resulting in a slower server response time.
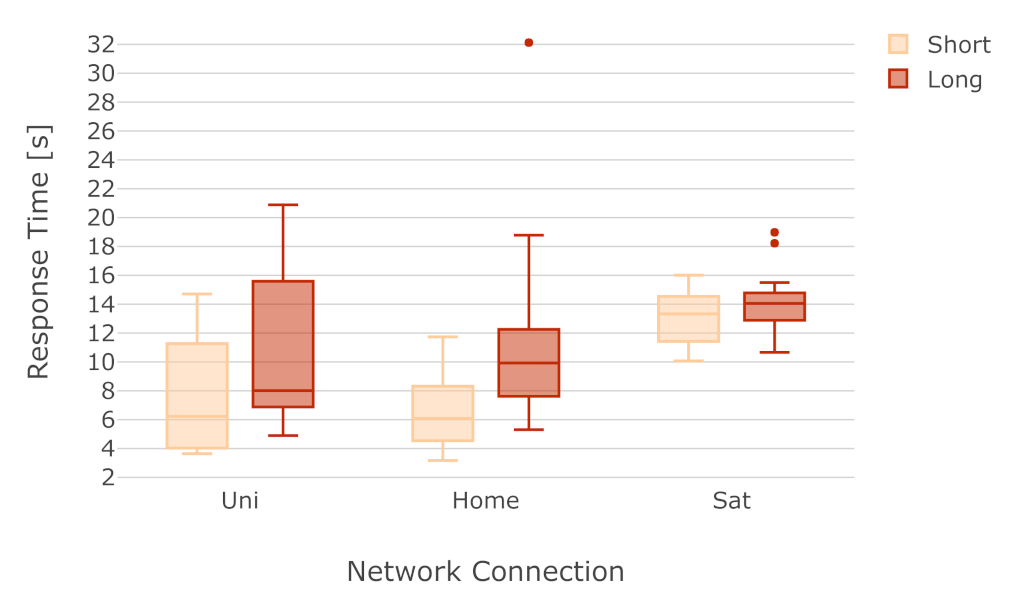
Finally, how the video length impacts the response time in the case of videos which were already loaded on the Cloud has been considered. The results reported in Figure 19 evidence that the video length has a very small effect on the response time, when comparing a video of 3 s with one of 71 s. If we look at the satellite connection, where the distributions are quite similar, the maximum deviation between the medians is about 3 s.
7. Discussion and Conclusions
Cloud Robotics is emerging as a very promising research field and requires stronger competencies in Cloud Computing and Networking. In this paper, we provided a few contributions in this important research area, in terms of a platform that we developed for real applications and experimental analysis, which was performed thanks to its application in a real use case. The platform we developed is called DewROS and is based on the Dew Robotics paradigm—where the computations are split among the robot, more powerful devices close to it, and the Cloud—and on the Robot Operating System. This allows it to be deployed on real robots using ROS and talk to real Cloud services by Google and Amazon. We described the design and implementation choices backing DewROS and tested them in a real use case, provided by a European Research Project called SHERPA. SHERPA focuses on search and rescue in hostile environments using a fleet of robots (drones and rovers). Thanks to DewROS, we enhanced SHERPA with Cloud services and performed a large experimental campaign with the aim of studying the possibility of performing video annotation in the Cloud using Google and Amazon services. Our experiments allow us to understand the effect of several variables, such as video size, length, network connection performance and Cloud service, on the time and quality of the annotations performed in the Cloud. We have shown that label detection mode and video length do not have a significant impact on the response time of Google Cloud Video Intelligence. We have also seen that this is not true for the byte size of the video to be analyzed. Furthermore, we have observed that the Internet connection characteristics currently in use have a high impact on the response time, and this also occurs when the video is already available in the Cloud. Moreover, we discovered and modeled the impact of the Round Trip Time of the network connection used to reach the Cloud on the video annotation time, even if videos are already available in the Cloud. We believe that this paper provides important and currently missing contributions to the research field of Cloud Robotics.
Author Contributions
Conceptualization, A.B.; Data curation, R.D.V.; Funding acquisition, B.S. and G.V.; Investigation, A.B. and R.D.V.; Resources, J.C.; Supervision, A.B., B.S. and G.V.; Writing–original draft, R.D.V.; Writing–review & editing, A.B. and J.C. All authors have read and agreed to the published version of the manuscript.
Funding
This work was partially supported by MIUR through the “ICT for Health” project, Dipartimento di Eccellenza (2018–2022) “Ingegneria Elettrica e delle Tecnologie dell’Informazione” and by Cisco Systems through the Sponsored Research Agreement “Research Project for Industry 4.0”.
Informed Consent Statement
Not applicable.
Data Availability Statement
The data underlying this article will be shared on reasonable request from the corresponding author.
Conflicts of Interest
The authors declare no conflict of interest.
Abbreviations
The following abbreviations are used in this manuscript:
| RTT | Round Trip Time |
| ROS | Robot Operating System |
| VM | Virtual Machine |
| UAV | Unmanned Aerial Vehicle |
| S&R | Search and Rescue |
| IoT | Internet of Things |
| API | Application Program Interface |
| Wi-Fi | Wireless Fidelity or IEEE 802.11 |
| P2P | Peer-to-Peer |
| OpenCv | Open Computer Vision |
| GPS | Global Positioning System |
| CVI | Cloud Video Intelligence |
| AR | Amazon Rekognition |
| FTTH | Fiber To The Home |
| HD | High Definition |
| SD | Standard Definition |
| DC | Dew Computing |
| WLAN | IEEE 802.11 wireless LAN |
| WAN | Wide Area Network |
| GCS | Google Cloud Storage |
References
- Aceto, G.; Botta, A.; Pescape, A.; Westphal, C. Efficient Storage and Processing of High-Volume Network Monitoring Data. IEEE Trans. Netw. Serv. Manag. 2013, 10, 162–175. [Google Scholar] [CrossRef]
- Botta, A.; Gallo, L.; Ventre, G. Cloud, Fog, and Dew Robotics: Architectures for next generation applications. In Proceedings of the the Seventh IEEE International Conference on Mobile Cloud Computing, Services, and Engineering (IEEE Mobile Cloud 2019), Newark, CA, USA, 4–9 April 2019. [Google Scholar]
- ROS. Robot Operating System. Available online: http://www.ros.org (accessed on 11 June 2021).
- Marconi, L.; Melchiorri, C.; Beetz, M.; Pangercic, D.; Siegwart, R.; Leutenegger, S.; Carloni, R.; Stramigioli, S.; Bruyninckx, H.; Doherty, P.; et al. The SHERPA project: Smart collaboration between humans and ground-aerial robots for improving rescuing activities in alpine environments. In Proceedings of the 2012 IEEE International Symposium on Safety, Security, and Rescue Robotics (SSRR), College Station, TX, USA, 5–8 November 2012; pp. 1–4. [Google Scholar] [CrossRef]
- Botta, A.; Cacace, J.; Lippiello, V.; Siciliano, B.; Ventre, G. Networking for Cloud Robotics: A case study based on the Sherpa Project. In Proceedings of the International Conference on Cloud and Robotics ICCR2017, Saint Quentin, France, 23 November 2017. [Google Scholar]
- Du, Z.; He, L.; Chen, Y.; Xiao, Y.; Gao, P.; Wang, T. Robot Cloud: Bridging the power of robotics and cloud computing. Future Gener. Comput. Syst. 2017, 74, 337–348. [Google Scholar] [CrossRef]
- Du, Z.; Garcà a-Acosta, M.; Chen, Y. Robot as a Service in Cloud Computing. In Proceedings of the IEEE Fifth International Symposium on Service-Oriented System Engineering, Nanjing, China, 4–5 June 2010; IEEE Computer Society: Los Alamitos, CA, USA, 2010; pp. 151–158. [Google Scholar] [CrossRef]
- Thompson, E.A.; McIntosh, C.; Isaacs, J.; Harmison, E.; Sneary, R. Robot communication link using 802.11n or 900MHz OFDM. J. Netw. Comput. Appl. 2015, 52, 37–51. [Google Scholar] [CrossRef]
- Curiac, D.I. Towards wireless sensor, actuator and robot networks: Conceptual framework, challenges and perspectives. J. Netw. Comput. Appl. 2016, 63, 14–23. [Google Scholar] [CrossRef]
- Hadid, N.; Guitton, A.; Misson, M. Exploiting a meeting channel to interconnect mobile robots. J. Netw. Comput. Appl. 2012, 35, 1436–1445. [Google Scholar] [CrossRef]
- Akkaya, K.; Senturk, I.F.; Vemulapalli, S. Handling large-scale node failures in mobile sensor/robot networks. J. Netw. Comput. Appl. 2013, 36, 195–210. [Google Scholar] [CrossRef]
- Wan, J.; Tang, S.; Yan, H.; Li, D.; Wang, S.; Vasilakos, A.V. Cloud robotics: Current status and open issues. IEEE Access 2016, 4, 2797–2807. [Google Scholar] [CrossRef]
- Hu, G.; Tay, W.P.; Wen, Y. Cloud robotics: Architecture, challenges and applications. IEEE Netw. 2012, 26, 21–28. [Google Scholar] [CrossRef]
- Kehoe, B.; Patil, S.; Abbeel, P.; Goldberg, K. A survey of research on cloud robotics and automation. IEEE Trans. Autom. Sci. Eng. 2015, 12, 398–409. [Google Scholar] [CrossRef]
- Angelopoulos, G.; Baras, N.; Dasygenis, M. Secure Autonomous Cloud Brained Humanoid Robot Assisting Rescuers in Hazardous Environments. Electronics 2021, 10, 124. [Google Scholar] [CrossRef]
- Wang, Y.; Wang, W.; Liu, D.; Jin, X.; Jiang, J.; Chen, K. Enabling Edge-Cloud Video Analytics for Robotics Applications. In Proceedings of the IEEE International Conference on Computer Communications, Virtual Conference, 10–13 May 2021. [Google Scholar]
- Liu, B.; Chen, Y.; Blasch, E.; Pham, K.; Shen, D.; Chen, G. A holistic cloud-enabled robotics system for real-time video tracking application. In Future Information Technology; Springer: Berlin/Heidelberg, Germany, 2014; pp. 455–468. [Google Scholar]
- Agostinho, L.; Olivi, L.; Feliciano, G.; Paolieri, F.; Rodrigues, D.; Cardozo, E.; Guimaraes, E. A Cloud Computing Environment for Supporting Networked Robotics Applications. In Proceedings of the 2011 IEEE Ninth International Conference on Dependable, Autonomic and Secure Computing, Sydney, Australia, 12–14 December 2011; pp. 1110–1116. [Google Scholar] [CrossRef]
- Miratabzadeh, S.A.; Gallardo, N.; Gamez, N.; Haradi, K.; Puthussery, A.R.; Rad, P.; Jamshidi, M. Cloud robotics: A software architecture: For heterogeneous large-scale autonomous robots. In Proceedings of the 2016 World Automation Congress (WAC), Rio Grande, PR, USA, 31 July–4 August 2016; pp. 1–6. [Google Scholar] [CrossRef]
- Liu, J.; Zhou, F.; Yin, L.; Wang, Y. A Novel Cloud Platform For Service Robots. IEEE Access 2019, 7, 182951–182961. [Google Scholar] [CrossRef]
- Mohanarajah, G.; Hunziker, D.; D’Andrea, R.; Waibel, M. Rapyuta: A Cloud Robotics Platform. IEEE Trans. Autom. Sci. Eng. 2015, 12, 481–493. [Google Scholar] [CrossRef] [Green Version]
- Kehoe, B.; Matsukawa, A.; Candido, S.; Kuffner, J.; Goldberg, K. Cloud-based robot grasping with the google object recognition engine. In Proceedings of the 2013 IEEE International Conference on Robotics and Automation, Karlsruhe, Germany, 6–10 May 2013; pp. 4263–4270. [Google Scholar] [CrossRef] [Green Version]
- Arumugam, R.; Enti, V.R.; Bingbing, L.; Xiaojun, W.; Baskaran, K.; Kong, F.F.; Kumar, A.S.; Meng, K.D.; Kit, G.W. DAvinCi: A cloud computing framework for service robots. In Proceedings of the 2010 IEEE International Conference on Robotics and Automation, Anchorage, AK, USA, 3–7 May 2010; pp. 3084–3089. [Google Scholar] [CrossRef]
- Cacace, J.; Finzi, A.; Lippiello, V.; Loianno, G.; Sanzone, D. Aerial Service Vehicles for Industrial Inspection: Task Decomposition and Plan Execution. In Recent Trends in Applied Artificial Intelligence. In Proceedings of the 26th International Conference on Industrial, Engineering and Other Applications of Applied Intelligent Systems, IEA/AIE 2013, Amsterdam, The Netherlands, 17–21 June 2013; pp. 302–311. [Google Scholar] [CrossRef] [Green Version]
- Waharte, S.; Trigoni, N. Supporting Search and Rescue Operations with UAVs. In Proceedings of the 2010 International Conference on Emerging Security Technologies, EST ’10, Canterbury, UK, 6–7 September 2010; IEEE Computer Society: Washington, DC, USA, 2010; pp. 142–147. [Google Scholar] [CrossRef]
- Goodrich, M.A.; Cooper, J.L.; Adams, J.A.; Humphrey, C.; Zeeman, R.; Buss, B.G. Using a Mini-UAV to Support Wilderness Search and Rescue Practices for Human-Robot Teaming. In Proceedings of the IEEE International Conference on Safety, Security and Rescue Robotics, Rome, Italy, 22–26 September 2007. [Google Scholar]
- Cacace, J.; Finzi, A.; Lippiello, V.; Furci, M.; Mimmo, N.; Marconi, L. A control architecture for multiple drones operated via multimodal interaction in search & rescue mission. In Proceedings of the 2016 IEEE International Symposium on Safety, Security, and Rescue Robotics (SSRR), Lausanne, Switzerland, 23–27 October 2016; pp. 233–239. [Google Scholar] [CrossRef]
- Cacace, J.; Caccavale, R.; Finzi, A.; Lippiello, V. Attentional multimodal interface for multidrone search in the Alps. In Proceedings of the 2016 IEEE International Conference on Systems, Man, and Cybernetics (SMC), Budapest, Hungary, 9–12 October 2016; pp. 1178–1183. [Google Scholar] [CrossRef]
- Waibel, M.; Beetz, M.; Civera, J.; D’Andrea, R.; Elfring, J.; Gálvez-López, D.; Häussermann, K.; Janssen, R.; Montiel, J.M.M.; Perzylo, A.; et al. RoboEarth. IEEE Robot. Autom. Mag. 2011, 18, 69–82. [Google Scholar] [CrossRef] [Green Version]
- Bogue, R. Robots for monitoring the environment. Ind. Robot. Int. J. 2011, 38, 560–566. [Google Scholar] [CrossRef]
- Wang, L. Wise-ShopFloor: An Integrated Approach for Web-Based Collaborative Manufacturing. IEEE Trans. Syst. Man Cybern. Part C 2008, 38, 562–573. [Google Scholar] [CrossRef]
- Pouliot, N.; Montambault, S. LineScout Technology: From inspection to robotic maintenance on live transmission power lines. In Proceedings of the 2009 IEEE International Conference on Robotics and Automation, Kobe, Japan, 12–17 May 2009; pp. 1034–1040. [Google Scholar] [CrossRef]
- Persico, V.; Marchetta, P.; Botta, A.; Pescape, A. On Network Throughput Variability in Microsoft Azure Cloud. In Proceedings of the 2015 IEEE Global Communications Conference (GLOBECOM), San Diego, CA, USA, 6–10 December 2015; pp. 1–6. [Google Scholar] [CrossRef]
- Botta, A.; Emma, D.; Pescapé, A.; Ventre, G. Systematic performance modeling and characterization of heterogeneous IP networks. J. Comput. Syst. Sci. 2006, 72, 1134–1143. [Google Scholar] [CrossRef] [Green Version]
- Ray, P.P. An Introduction to Dew Computing: Definition, Concept and Implications. IEEE Access 2018, 6, 723–737. [Google Scholar] [CrossRef]
- Ray, P.P. Minimizing dependency on internetwork: Is dew computing a solution? Trans. Emerg. Telecommun. Technol. 2019, 30, e3496. [Google Scholar] [CrossRef] [Green Version]
- Sojaat, Z.; Skalaa, K. The dawn of Dew: Dew Computing for advanced living environment. In Proceedings of the 2017 40th International Convention on Information and Communication Technology, Electronics and Microelectronics (MIPRO), Opatija, Croatia, 22–26 May 2017; pp. 347–352. [Google Scholar]
- Cao, Y.; Xu, Z.; Qin, P.; Jiang, T. Video Processing on the Edge for Multimedia IoT Systems. arXiv 2018, arXiv:1805.04837. [Google Scholar]
Figure 1.
The Dew Robotics concept.

Figure 2.
General three-tier architecture of our Dew Robotics Platform based on ROS.

Figure 3.
Topology of the SHERPA network with the Cloud.

Figure 4.
Three-tier architecture of our Dew Robotics Platform based on ROS and for Sherpa.

Figure 5.
Number of labels obtained at different video resolutions for CVI.

Figure 6.
Comparison of labels at 240p and 1080p resolutions for the video C: differing ones in italic, solid border, and non pertinent in italics, dashed borders.
Figure 6.
Comparison of labels at 240p and 1080p resolutions for the video C: differing ones in italic, solid border, and non pertinent in italics, dashed borders.

Figure 7.
Empirical cumulative distribution function of the confidence level associated with the labels at different video resolutions for CVI in three different videos: A, B and C.
Figure 7.
Empirical cumulative distribution function of the confidence level associated with the labels at different video resolutions for CVI in three different videos: A, B and C.

Figure 8.
Number of labels obtained at different resolutions for AR.

Figure 9.
Empirical cumulative distribution function of the confidence level associated with the labels at different video resolutions for AR in three different videos: A, B and C.
Figure 9.
Empirical cumulative distribution function of the confidence level associated with the labels at different video resolutions for AR in three different videos: A, B and C.

Figure 10.
Scatter plot of the CVI response time of two label detection modes, Unspecified and Shot&Frame, fixing all the other variables.
Figure 10.
Scatter plot of the CVI response time of two label detection modes, Unspecified and Shot&Frame, fixing all the other variables.

Figure 11.
Response time using the UNI, HOME and SAT network connections, in case of video files hosted locally on the client, with different video lengths (short and long) and the same size.
Figure 11.
Response time using the UNI, HOME and SAT network connections, in case of video files hosted locally on the client, with different video lengths (short and long) and the same size.

Figure 12.
Response time using the UNI, HOME and SAT network connections, in case of locally hosted video files, with different sizes (small, medium and large).
Figure 12.
Response time using the UNI, HOME and SAT network connections, in case of locally hosted video files, with different sizes (small, medium and large).

Figure 13.
Upload Time Distributions for each video type using the satellite (SAT) Internet connection.
Figure 13.
Upload Time Distributions for each video type using the satellite (SAT) Internet connection.

Figure 14.
Upload Time Distributions for each video type using the University (UNI) Internet connection.
Figure 14.
Upload Time Distributions for each video type using the University (UNI) Internet connection.

Figure 15.
Coefficient of Variation calculated using all the video types and connections using locally hosted video files.
Figure 15.
Coefficient of Variation calculated using all the video types and connections using locally hosted video files.

Figure 16.
Response time using the UNI, HOME and SAT network connections, in case of a pre-loaded video on Google Cloud Service server, with different size (small, medium and large).
Figure 16.
Response time using the UNI, HOME and SAT network connections, in case of a pre-loaded video on Google Cloud Service server, with different size (small, medium and large).

Figure 17.
Sequence Diagram: API RTTs Analysis, setup phase.

Figure 18.
Sequence Diagram: API RTTs Analysis, data exchange phase.

Figure 19.
Response time using the UNI, HOME and SAT network connections, in case of a pre-loaded video on Google Cloud Service server, with different video lengths (short and long).
Figure 19.
Response time using the UNI, HOME and SAT network connections, in case of a pre-loaded video on Google Cloud Service server, with different video lengths (short and long).


Table 1.
Comparing DewROS with related work.
| Platform | ROS-Enabled | Cloud | Edge | Video | Experimental | Search |
|---|---|---|---|---|---|---|
| Support | Support | Processing | Validation | and Rescue | ||
| Liu et al. [17] | ✓ | ✓ | ✗ | ✓ | ✓ | ✗ |
| Agostinho et al. [18] | ✗ | ✓ | ✓ | ✗ | ✓ | ✗ |
| Miratabzadeh et al. [19] | ✓ | ✓ | ✓ | ✗ | ✗ | ✗ |
| Liu et al. [20] | ✗ | ✓ | ✗ | ✗ | ✓ | ✗ |
| Mohanarajah et al. [21] | ✓ | ✗ | ✗ | ✗ | ✓ | ✗ |
| Kehoe et al. [22] | ✓ | ✓ | ✗ | ✓ | ✓ | ✗ |
| Arumugam et al. [23] | ✓ | ✓ | ✗ | ✗ | ✓ | ✗ |
| Waibel et al. [29] | ✓ | ✓ | ✗ | ✓ | ✓ | ✗ |
| Cacace et al. [24] | ✓ | ✗ | ✗ | ✗ | ✗ | ✓ |
| Waharte et al. [25] | ✗ | ✗ | ✓ | ✗ | ✗ | ✓ |
| Goodrich et al. [26] | ✗ | ✗ | ✓ | ✗ | ✗ | ✓ |
| Cacace et al. [27] | ✓ | ✗ | ✓ | ✗ | ✗ | ✓ |
| Cacace et al. [28] | ✓ | ✗ | ✓ | ✗ | ✗ | ✓ |
| Wang [31] | ✗ | ✗ | ✓ | ✗ | ✓ | ✗ |
| DewROS | ✓ | ✓ | ✓ | ✓ | ✓ | ✓ |
Table 2.
Details of the variables considered in the experiments.
| Network Connection | Label Detection Mode | Video Type | Video Location | |
|---|---|---|---|---|
| Size | Length | |||
| University Ethernet (UNI) | Unspecified | Small (2.1 MB—52 s) | Short (2.1 MB—3 s) | Local (LOC) |
| Residential FTTH (HOME) | Shot & Frame | Medium (8.8 MB—53 s) | Long (2.2 MB—71 s) | Google Cloud Storage (GCS) |
| Satellite (SAT) | Large (23.7 MB—55 s) | |||
Table 3.
Network connections under tests.
| Network | Upload Bandwidth | Download Bandwidth |
|---|---|---|
| UNI | 90 Mbps | 90 Mbps |
| HOME | 20 Mbps | 180 Mbps |
| SAT | 3 Mbps | 9 Mbps |
Publisher’s Note: MDPI stays neutral with regard to jurisdictional claims in published maps and institutional affiliations. |
© 2021 by the authors. Licensee MDPI, Basel, Switzerland. This article is an open access article distributed under the terms and conditions of the Creative Commons Attribution (CC BY) license (https://creativecommons.org/licenses/by/4.0/).
Share and Cite
MDPI and ACS Style
Botta, A.; Cacace, J.; De Vivo, R.; Siciliano, B.; Ventre, G. Networking for Cloud Robotics: The DewROS Platform and Its Application. J. Sens. Actuator Netw. 2021, 10, 34. https://0-doi-org.brum.beds.ac.uk/10.3390/jsan10020034
AMA Style
Botta A, Cacace J, De Vivo R, Siciliano B, Ventre G. Networking for Cloud Robotics: The DewROS Platform and Its Application. Journal of Sensor and Actuator Networks. 2021; 10(2):34. https://0-doi-org.brum.beds.ac.uk/10.3390/jsan10020034
Chicago/Turabian StyleBotta, Alessio, Jonathan Cacace, Riccardo De Vivo, Bruno Siciliano, and Giorgio Ventre. 2021. "Networking for Cloud Robotics: The DewROS Platform and Its Application" Journal of Sensor and Actuator Networks 10, no. 2: 34. https://0-doi-org.brum.beds.ac.uk/10.3390/jsan10020034
Note that from the first issue of 2016, this journal uses article numbers instead of page numbers. See further details here.