
NOMA Clustering for Improved Multicast IoT Schemes


1
STRS Laboratory, INPT, Rabat 10100, Morocco
2
Communication Systems Department, INPT, Rabat 10100, Morocco
*
Author to whom correspondence should be addressed.
J. Sens. Actuator Netw. 2022, 11(2), 26; https://0-doi-org.brum.beds.ac.uk/10.3390/jsan11020026
Submission received: 16 March 2022
/
Revised: 5 May 2022
/
Accepted: 11 May 2022
/
Published: 23 May 2022
Abstract
:In the context of future ultra-dense mobile networks, spectrum and energy efficiencies (SE and EE) are critical measures in designing efficient systems for the sixth-generation (6G) of wireless networks. Recognized for their benefits in increasing SE and EE, non-orthogonal multiple access (NOMA) and device-to-device (D2D) communications are combined in this work to present a new NOMA-based D2D scheme increasing the performance in terms of SE and EE. The users in the proposed scheme are split into coalitions. Coalition heads are served in NOMA directly from the base stations, while the other users within the coalitions get the service through D2D links. We investigate the system’s SE and EE for different mobility patterns, and we discuss optimal system configurations with the help of Monte Carlo simulations. The obtained results show that the proposed system exhibits a better performance compared to conventional OMA and NOMA models, especially in low mobility contexts.
1. Introduction
The ever-increasing number of connected devices and the continuous demand of higher data rates are the main drivers for the emergence of new wireless communication technologies from the first to the fourth generation.
Since 2019, the fifth generation (5G) of wireless communication has been commercialized and deployed in several countries. 5G represents a technological breakthrough with respect to the previous communication networks. It uses revolutionary technologies (e.g., higher frequencies, network function virtualization (NFV), software defined networking (SDN), and network slicing), in addition to evolutionary ones (e.g., massive multiple-input and multiple-output (MIMO)) to make a significant improvement in energy efficiency, enhancing connectivity and reliability, reducing latency, and achieving gigabits per second speeds. Although 5G was designed to support Internet-of-Things applications through ultra-reliable low-latency communications (URLLC) and massive machine-type communications (MTC), it is arguable whether it can cope with the rapid proliferation of ultimately new Internet-of-Everything (IoE) applications, which are expected to increase by 12% yearly [1]. A forecast study reported by the International Telecommunication Union demonstrates that the volume of mobile data will continue to grow at an exponential rate, reaching up to 5 zettabytes per month in 2030 [2]. These figures urge he introduction of the next generation of wireless networks, 6G, which is envisioned to realize the next generation connectivity, driven by the evolution from connected everything to connected intelligence, thus enabling “Human-Thing-Intelligence” interconnectivity [1]. Compared to 5G, in 6G, the energy efficiency is expected to be 10–100 times, the spectrum efficiency 5–10 times, the connection density 10 times and the capacity is expected to be 10,000 times of 5G systems [3].
Besides the revolutionary new services and technologies, efficient next-generation multiple access (NGMA) techniques and D2D communication will be essential for 6G to support the above-mentioned targets.
Non-orthogonal multiple access (NOMA), as an NGMA, has proven its performance compared to the traditional orthogonal multiple access (OMA) technologies in terms of improving the bandwidth utilization and efficient allocation of resources [4,5,6,7]. It was presented as key technology in implementing 6G networks [8,9].
On the other hand, D2D communications technology was widely advocated for increasing the cellular capacity, improving the user throughput and extending the battery lifetime of user equipments. The concept is to exploit the physical proximity of user equipments or devices, and enable them to communicate directly with each other over a D2D link. In the context of 6G, thanks to the THz band, the communication between two nearby UEs will be near real-time [8]. References [10,11] have envisioned the role of D2D communications and enumerated a number of potential solutions associated with 6G, in terms of mobile edge computing, network slicing, and NOMA cognitive networking, to construct an efficient implementation of intelligent future network systems.
In this work, we propose a NOMA-D2D system configuration for IoT applications. We focus, particularly, on multicast services to disseminate data to end devices. Indeed, multicasting is an efficient mechanism for IoT or machine-type applications (e.g., IoT applications in agriculture, control and monitoring in industry, and information broadcasting in multimedia or vehicular applications), and can help in reducing the required bandwidth, increasing resource efficiency, and reducing transmission costs. With the aim to provide an efficient approach to implementing a NOMA-D2D system, we split the users into coalitions. Coalition heads are connected directly to the serving base station in a NOMA fashion, while the other users within a coalition construct a transmission tree over the D2D links to obtain the service. We investigate the system’s performance from both spectral and energy efficiency points of view, and we analyze the optimal system configurations with the help of simulations results.
The rest of the paper is organized as follows. We review the state of the art related to works considering D2D and NOMA schemes in Section 2. In Section 3, we present the system model, the NOMA pairing scheme, the coalitions formation mechanism, and the transmission tree algorithms. We analyze the system’s spectral and energy efficiencies in Section 4, and we illustrate the obtained performance with different simulation results, including a comparison with classical NOMA and OMA systems, in Section 5. Section 6 concludes the paper.
2. Related Works
Many recent research studies have considered combining NOMA and D2D communications techniques with the objective of exploiting their potential benefits in improving system throughput, energy and spectrum efficiencies. A taxonomical classification and comparison of the different approaches to the implementation of NOMA-based D2D schemes was proposed in [12]. Other works, such as [13], used a game theoretic approach to improve the rate of weak users in D2D-NOMA contexts or, as in [14], to maximize the system sum rate by optimizing sub-channel and power allocations. In [15], Wang et al. studied the resource allocation problem and the tradeoff between spectral efficiency (SE) and energy efficiency (EE) for downlink traffic in power domain—NOMA and D2D based heterogeneous cloud radio access networks (H-CRANs) for 5G. Hmila et al. in [16] considered an optimization-based model for multicast device-to-device (MD2D) communications, where the cellular users (CUs) communicate in an orthogonal fashion with the base station, while the D2D users use NOMA in the transmission and can share the same channels with other CUs or D2D transmitters. They also investigated the rate and energy efficiency of the network through a dynamic power control algorithm. With the objective of maximizing the network throughput by investigating a joint resource allocation problem of user clustering, power control, and D2D mode selection, the authors in [17] considered a NOMA-D2D system where D2D users can reuse the resources in cellular networks or share the unlicensed band with WiFi users. In [18], the authors investigated the advantage of employing NOMA in D2D communications, where D2D pairs are clustered with content demanders. Each D2D transmitter communicates with its corresponding receiver, while simultaneously, communicates with a demander via NOMA technique. D2D pairs communicate in overlay. The authors in this work were interested in improving the physical layer security of D2D users by employing this NOMA D2D scheme. Sun and Xu [19] approached the traffic offloading problem by employing NOMA-enabled D2D and unlicensed access technologies. The objective here is to maximize the total achievement rate of the D2D network, while ensuring the capacity of cellular and WiFi systems.
Compared to other works in the literature, our proposed model presents the following contributions:
- In our proposed design, the base station (BS) resources are split among limited selected users, which communicate in a NOMA fashion with the serving BS, in order to improve the system spectrum efficiency and increase the rate of the selected users users (and hence, the system sum rate).
- The rest of the users join different D2D coalitions where the coalitions’ heads are the previously selected users from the BS. Within the coalitions, the D2D users get the service over their best D2D link using short range communications for higher individual and system sum rate. This can be further upgraded, especially in 6G context, where the THz and mmWave bands should be used.
- Due to reusing the same resources, the underlying D2D communications may cause high interference to cellular users, and thus reduce the network throughput. To alleviate this issue, we consider connecting D2D users in out-band mode using available licensed or unlicensed spectrum. We consider that the signaling functions for D2D communications are insured centrally at the BS or via an other defined equipment in the network.
- The proposed system uses low complexity algorithms which can provide a dynamic network configuration adapted to IoT new services based on different users’ profiles and applications.
- Based on Monte-Carlo simulations, we demonstrate that the proposed system model outperforms the traditional OMA and NOMA models, in terms of spectrum efficiency and energy efficiency, especially in low mobility users’ profiles.
3. System Model and Problem Formulation
3.1. System and Channel Models
We consider a downlink system, where a NOMA-capable base station sends multicast data to N D2D-enabled end nodes labelled as {UE, UE,…,UE}. For clear understanding, we list the notations of this paper in Table 1.
In the orthogonal mode, the uses N orthogonal channels to send the same message to the N users during the multicast phase [20]. Such a configuration is resource consuming and inefficient, especially in the context of ultra-dense 6G scenarios, and, thanks to the signal superposition in the power domain NOMA for example, the system can be optimized. However, as the number of end users increases, defining NOMA-clusters and computing the corresponding power allocation coefficients brings significant computing and system complexity.
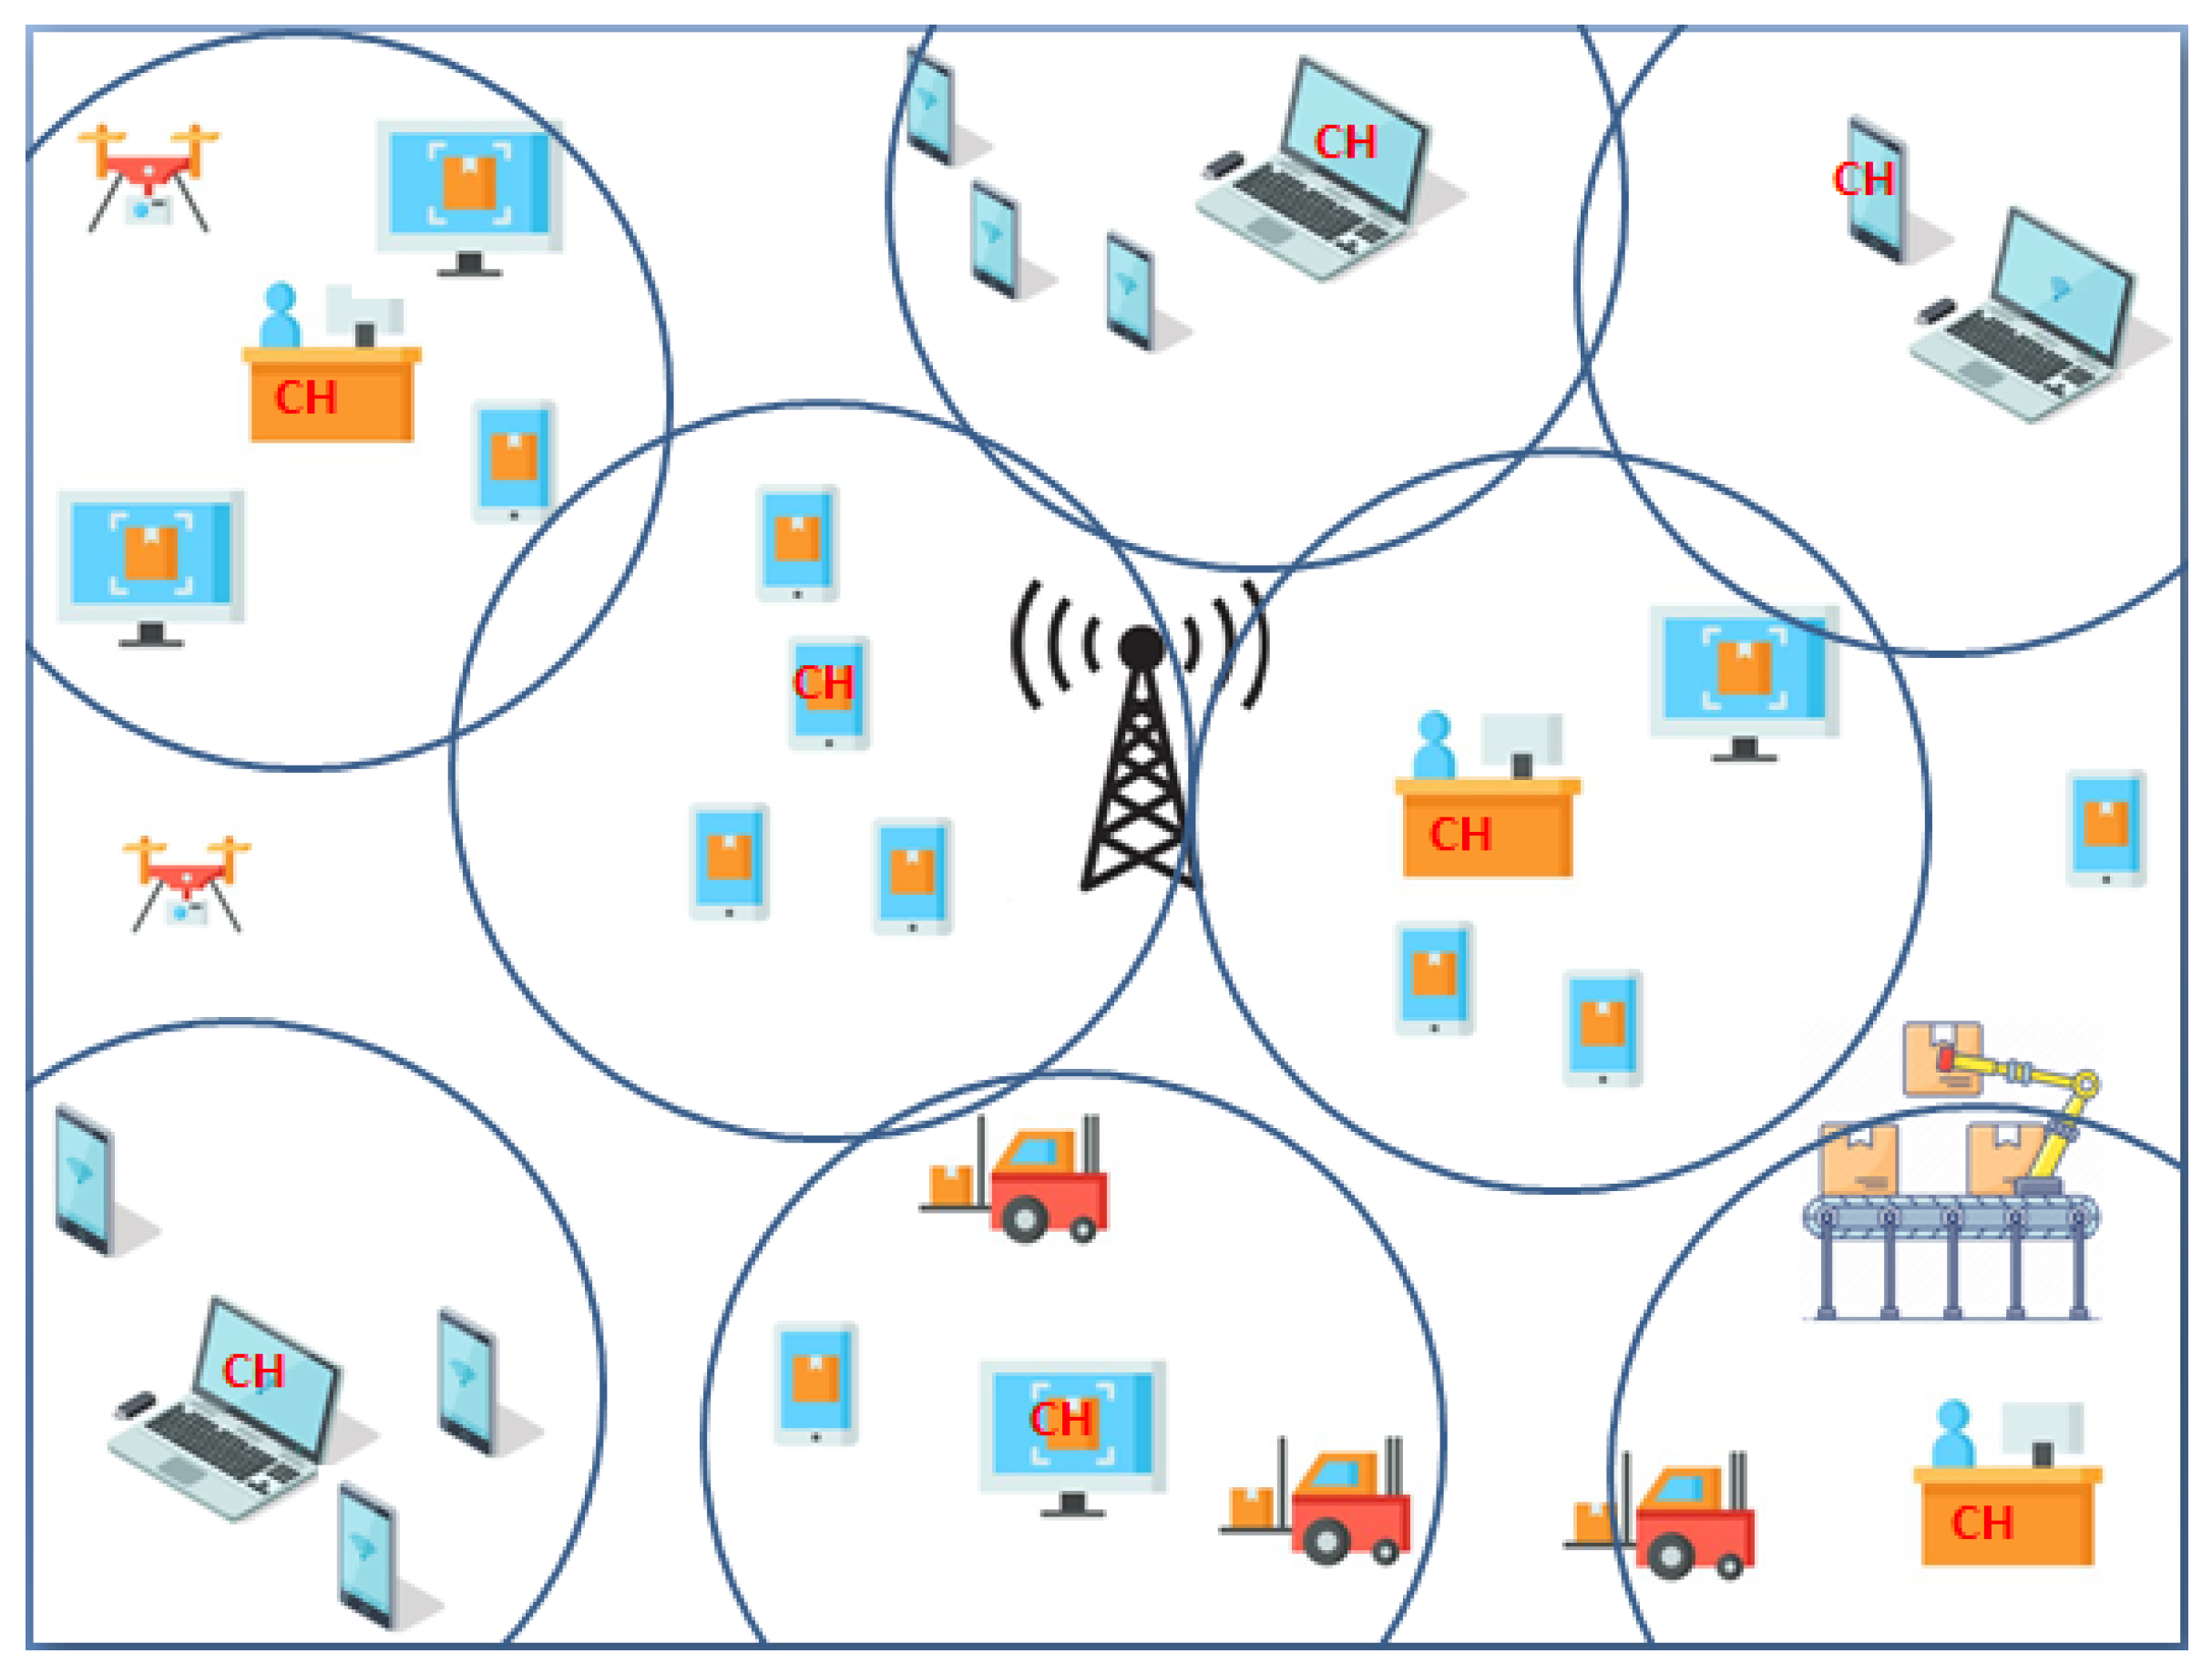
Our model is based on the concept of “coalitions”, we illustrate it in Figure 1 and define it as follows:
- First, according to the procedure that we detail in Section 3.2, the base station selects a sub-group of users, referred to as “heads”, which will be served in a NOMA mode;
- Second, clusters of users (i.e., coalitions) are formed around these heads according to the procedure detailed in Section 3.3, then, a transmission tree is constructed as described in Section 3.4 to establish D2D paths through the coalition head and connecting all the users within the coalition so they can be reached and served.
We also note that, at the end of the coalition formation stage, users that are left outside of all coalitions (referred to as “lone” users) are served by the directly, in an OMA mode to avoid additional computation time at the level at this stage.
Hence, bandwidth resources at the are shared among cellular users only (i.e., coalition heads and lone users), with an objective of maximizing the system rate and SE. The rest of the users, associated to coalitions, get the service via D2D links in an out-band mode, and are, thus, not impacting the resources, nor influencing the cellular users rate through interferences.
We assume that the global channel state information (CSI) is available at the , and that all channels are assumed to be independent but not necessarily identically distributed. We consider that the users , , are ordered according to their noise-normalized global channel gains, i.e., , where , and the instantaneous channel coefficients are modeled following a zero-mean, unit-variance, Rayleigh distribution, is the distance between and , and is the path loss exponent. is the power spectral density of the zero-mean additive white Gaussian noise (AWGN), assumed the same over all channels.
On the other hand, we denote by the channel gain between and . It is modeled similarly to as . Where are modeled following a zero-mean, unit-variance, Rayleigh distribution, is the distance between and , and is the path loss exponent.
In the considered context, we assume that the relative speed between the nodes and the is not considerable. Thus, the coherence times of the different fading channels are assumed to be long enough to span over the execution time of the proposed algorithms.
3.2. Selection of Coalition Heads and NOMA Pairing
In this first phase, the selection of users who will be leading the coalitions is carried out. These users will be served by the BS in NOMA fashion. With the objective of maximizing the sum rate of NOMA users and hence, the system sum rate, we choose the NOMA pairs optimally as is [21] and we calculate the optimal NOMA power coefficients similarly to [6]. The selects “best” users (), based on their channel gains, to be paired in NOMA fashion with “worst” users. We denote the obtained pairs, respectively, by , ,…, .
The formed NOMA pairs are designated as coalition heads , .
3.3. Formation of Coalitions
In the remainder, and without loss of generality, are denoted using indices from 1 to M, in the order of their respective channel gains to the . is the coalition of around , and denotes the set of all coalition heads.
At the end of phase 1, the shares the list of the selected coalition heads with all the remaining multicast users.
Each evaluates the channel quality of all D2D links to all announced , and joins the coalition by the with which it has the best link. When there is no reachable coalition head, a tries to connect to the best neighbor among its reachable D2D neighbors that are already members of a coalition, and joins the same coalition as that neighbor. We consider that a D2D link exists between and if , where is a predefined threshold that will be discussed later. The number of tentative connections is set by the based on the cell parameters, and the maximum acceptable end-to-end transmission delay.
At the end of phase 2, the summarizes the state of all , updates the established list of coalitions, and identifies the list of lone users. The latter will be served directly by the during the transmission phase. We define as the set of lone users with l as its cardinal.
Algorithm 1 summarizes the steps of the coalitions formation.
| Algorithm 1 Coalitions Formation. |
Initialization:
Phase 1: Coalition Heads selection
Phase 2: Coalitions formation
Phase 3: Non Connected users
Return () and |
3.4. Construction of D2D Transmission Trees
To exclude all the considerations that are out of the scope of this paper, we consider that within the coalitions, all users are involved in a trust-based cooperative mode.
To alleviate the notations, we drop the index referring to the coalition and its coalition head in this subsection, i.e., denotes the coalition around a given .
The objective at this stage is to establish a path reaching every in , and connecting it to the via . Specifically, we construct a transmission tree over the D2D connections by choosing, for each , the best route that will maximize its transmission rate.
We describe the transmission construction steps as follows and in Algorithm 2:
- We sort in in a descending order, with regards to their channel gains with the . We index them as: . For notational reasons, we refer to the as .
- We define as the number of connected D2D users to (). is the maximum number of users that the can serve simultaneously.
- Each user of the coalition connects to its most preferred D2D user having a lower index:
- -
- First, connects to the .
- -
- For , connects to from , such as is having the best D2D link with and is not saturated (i.e., ).
| Algorithm 2 Transmission Tree Construction. |
Input:
Initialization:
Construction of the transmission tree:
end if end for end for Return Transmission tree. |
At the end of the transmission tree construction, multicast messages are routed through to all .
In the following, we will evaluate the performance of the proposed approach in terms of spectral efficiency and energy efficiency.
4. Spectrum and Energy Efficiency Analysis
4.1. Sum Rate
In this subsection, we calculate the system’s sum rate as a base framework for our analysis. We denote by R and , respectively, the instantaneous and the average rates. We start by defining the rate of the users connected to the cellular system (i.e., to , including users in coalition and lone users), then we evaluate the rate of the D2D users.
Accordingly, the cellular users sum rate can be written as
where is the rate of all coalition heads, and is the rate of lone users not connected to any coalition, served by the in an OMA mode. The factor is used to account only for the ratio of time used to route data; excluding the time used to complete the coalition formation stage. We define T as the coherence time [22] over which the fading channel remains invariant. , is the symbol duration, and u is the total number of symbols per block. Hence, we can write , with the number of symbols used during the coalition formation stage.
We assume that perfect successive interference cancellation (SIC) is performed at the user level, the sum rate of coalition heads is written as:
with and being the signal-to-interference-plus-noise ratios (SINRs) of the i-th NOMA pair , is the bandwidth assigned to a NOMA pair or a lone user, given by , with B the total available bandwidth at , and l the number of lone users. The total transmission power of is as well equally partitioned among the NOMA pairs and the l lone users, i.e., , and are the optimal power coefficients for the i-th NOMA pair (with ).
On the other hand, for the lone users, the sum rate can be expressed as
Similarly, we write the rate of a D2D user within a given coalition as
with the channel gain of the D2D link between and its source transmitter, and the D2D transmit power. The factor is used to account for the ration of channel use needed to form the coalition and the transmission tree of that given coalition (denoted by ), i.e., .
Finally, the expression of the system’s average sum rate is
4.2. Spectrum Efficiency
Spectral efficiency (SE) is a measure of how efficiently a limited frequency spectrum is utilized. It refers to the information rate that can be transmitted over a given bandwidth in a specific communication system.
For our system model, we write
with B being the assigned bandwidth.
4.3. Energy Efficiency
Energy efficiency (EE), commonly defined as the number of bits that can be transmitted per energy unit, is an important criterion for designing green wireless systems. In general, it can be expressed as
with the transmit power and is a constant circuit power consumed by the relevant electronic devices.
In the proposed scheme, and with the adopted notations, we have
with , , and being, respectively, the circuit power at , the transmit power at the k-th D2D user, and the constant circuit power of D2D users.
The detailed expressions of and can be easily deduced from the provided formulas and the expressions of the average rates given in Section 4.1.
5. Numerical Results
In this section, we first provide an illustration, established by simulation, of the coalition formation steps for a given system condition. Next, we simulate the system SE and EE for different speed figures presented in comparison with classical multicast OMA and NOMA models. Finally, we simulate the system measures for different number of coalitions.
Simulations are executed in MATLAB using the relevant necessary packages and functions.
5.1. Simulation Parameters
We consider a system of N users distributed, in a cellular area with the at the center, according to a two-dimensional homogeneous Poisson point process (PPP) with density . The surface of the cellular area is square meters, and we consider that the D2D coverage area is the same for all users, and is supposed to be a circle of 35 meters radius.
The transmit power is dBm, the transmit power of D2D user is dBm, and is assumed to be the same for all users, the circuit powers for and the users are W and W, respectively. The path loss exponents vary between and 2, and the Rayleigh channel parameter varies between 2 and 3.
We summarize in Table 2 the parameters used to perform the different simulations.
5.2. Coalitions Formation
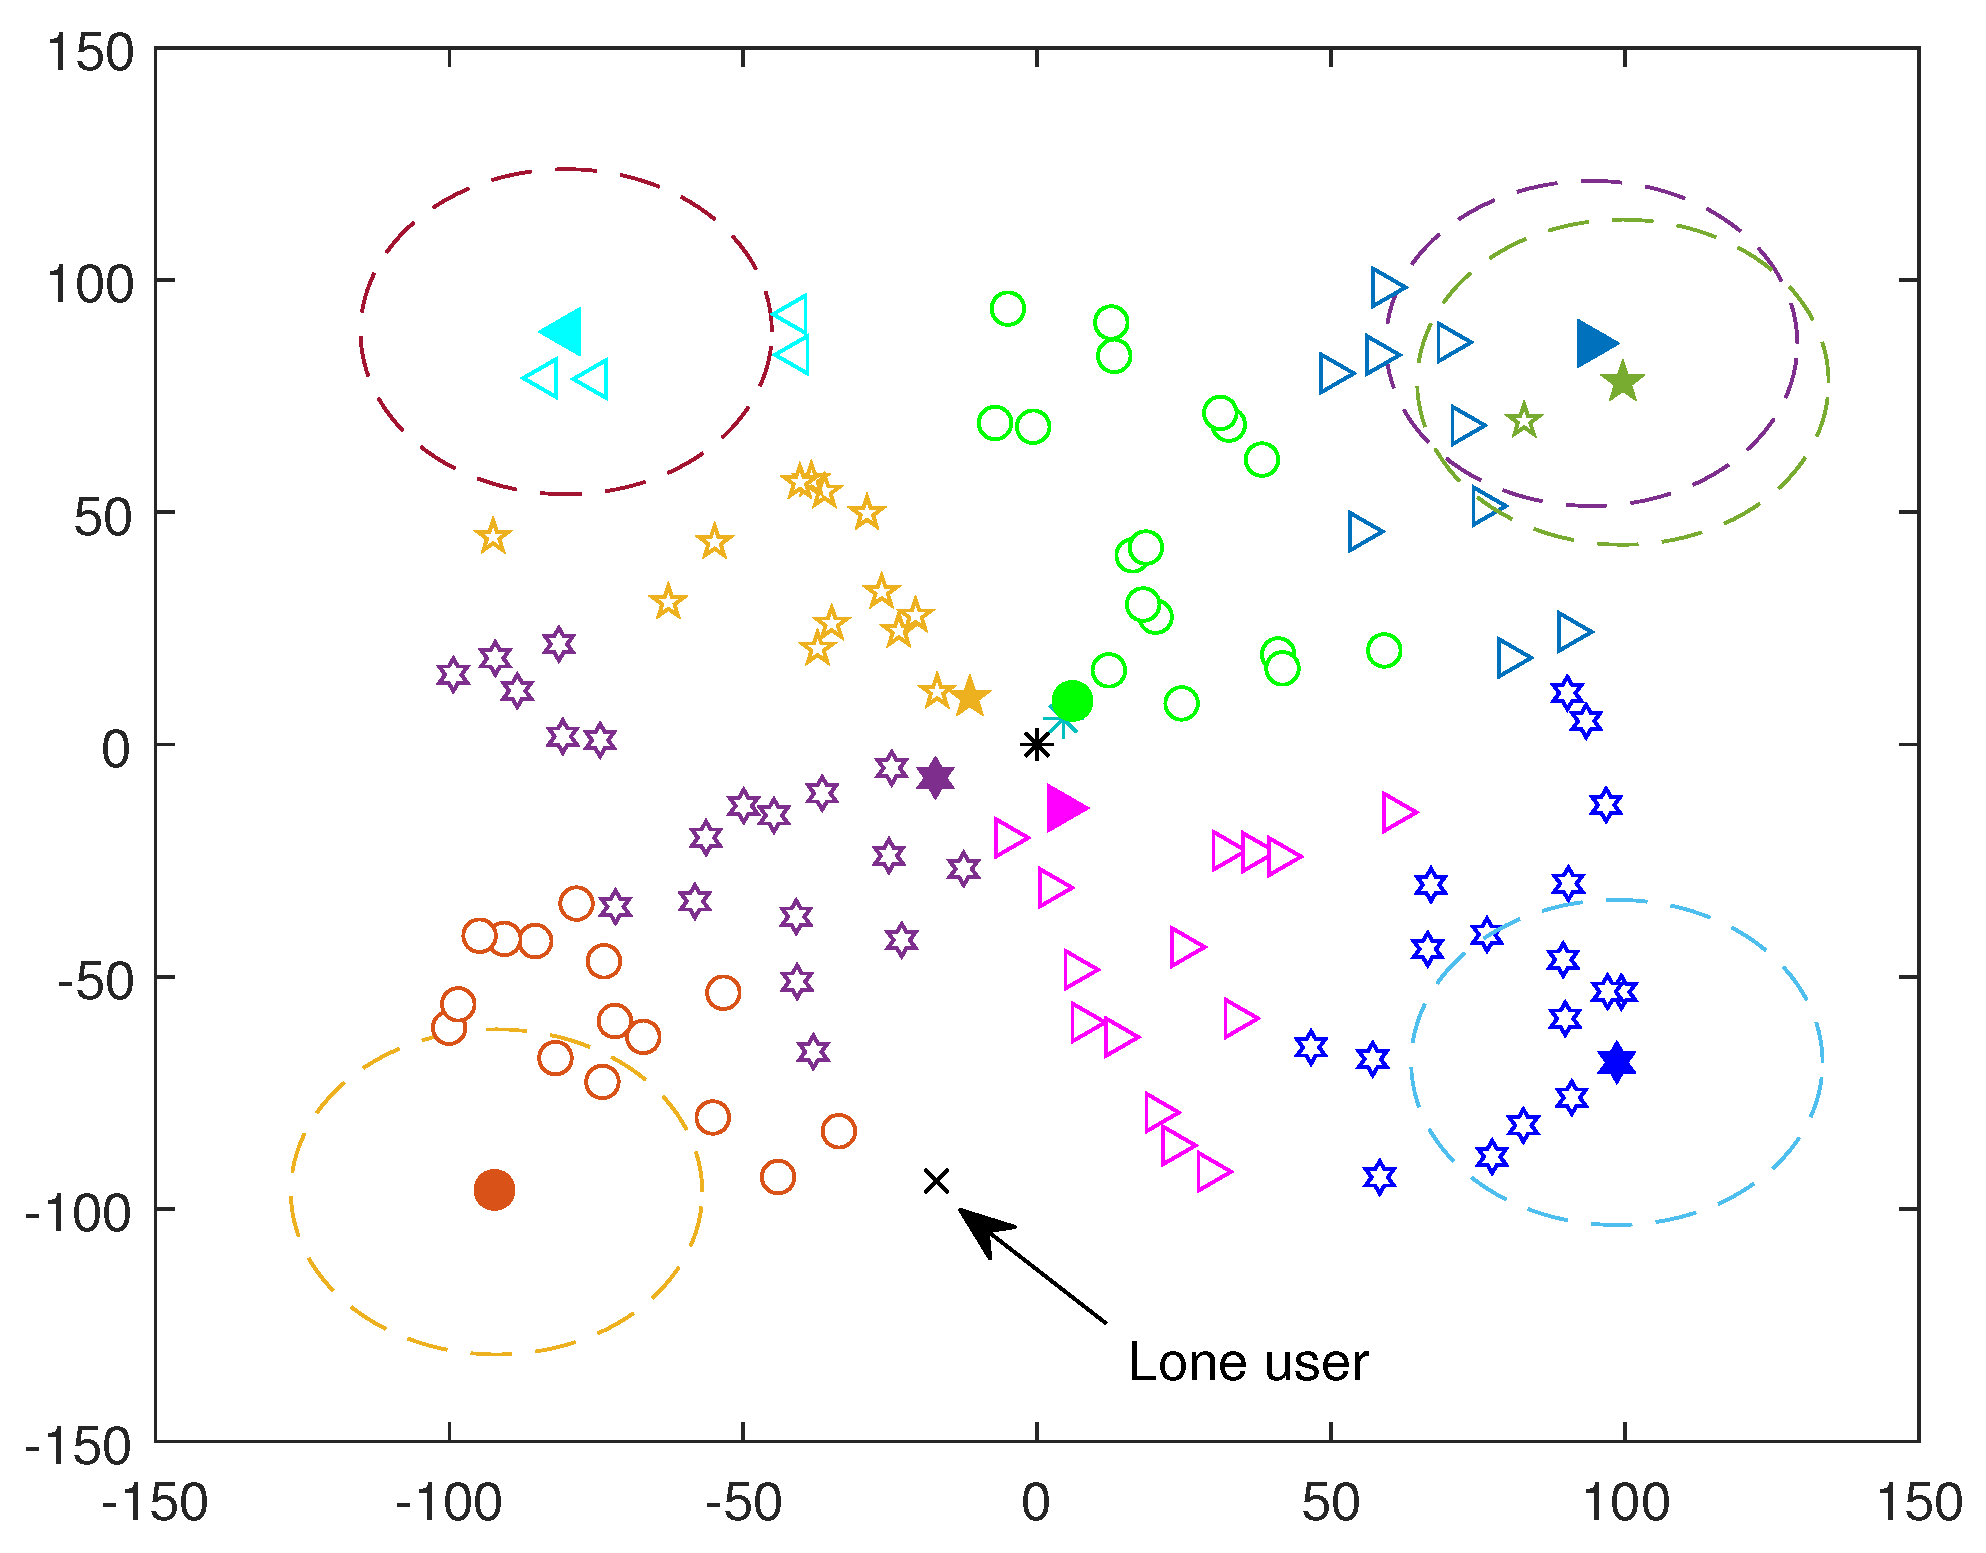
In this subsection, we take (), and we consider that the number of coalition heads is .
We illustrate in Figure 2 and Figure 3 the coalitions’ formation stage when executing one iteration of the algorithm and when executing a second one, respectively. Users are randomly distributed in the cell area. The distances in the figures are in meters. First, the coalition heads are selected and marked using different color and mark. Then, coalitions are formed as described in Algorithm 1. Users in the same coalition are marked using the same color and mark as their coalition head (which can be distinguished by their bigger mark size and colored marker face). We provide an indication about the D2D coverage area for some coalition heads by drawing circles to show how the algorithm works.
We observe in the figures that the coalition heads are located next to the and at the cell edges. This configuration allows to encircle the rest of the users in the cell. In the first tentative connection, D2D users connects to the nearest coalition head or neighbor as described in Algorithm 2. Coalitions are, hence, formed leaving some users “disconnected”. In a second tentative connection, these users join the coalition of their preferred neighbor as in Algorithm 2. We remark from Figure 3 that after two tentative connections, only one user is left “disconnected” in this system configuration, who will be detected and connected to the .
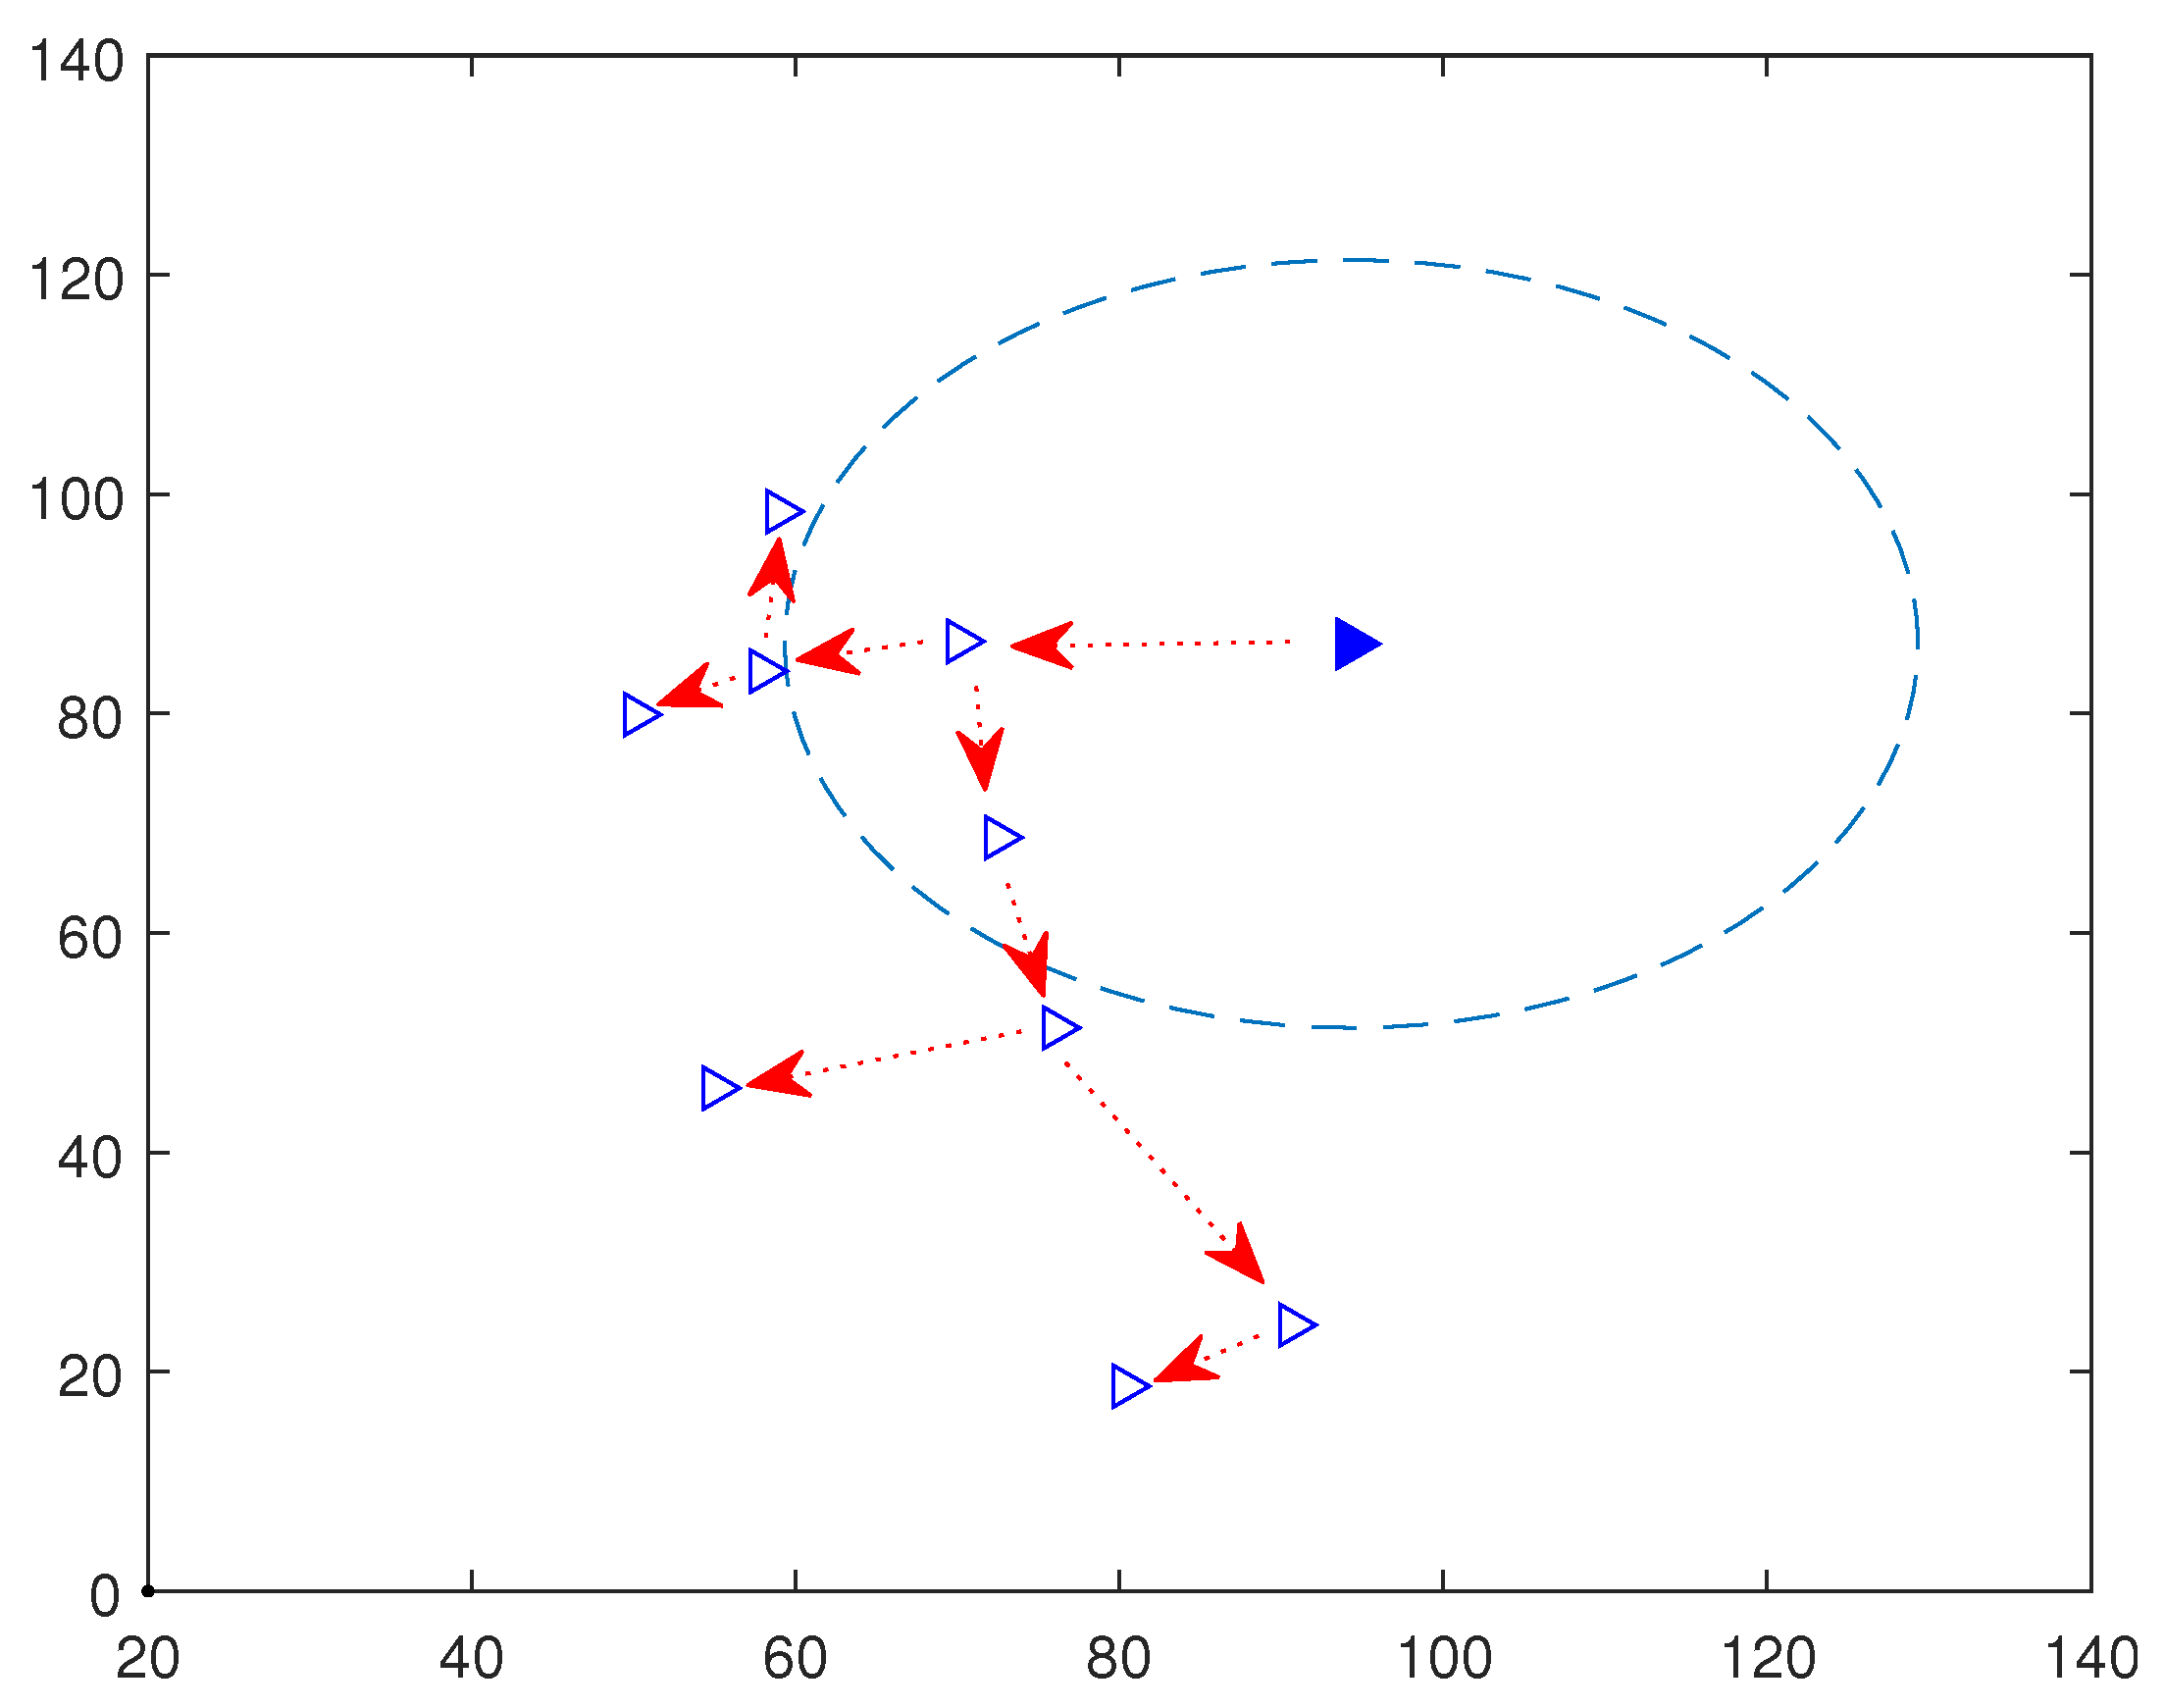
In order to see how Algorithm 2 works, we focus on the coalition number 9 and we draw the resulting transmission tree connecting the D2D users. We observe from Figure 4 that each user is relying on its best D2D link to maximize its rate. As stated previously, we do not take into account the generated delay due to the multi-hop in the transmission tree construction, as we are considering, in our model, IoT application not sensitive to this measure.
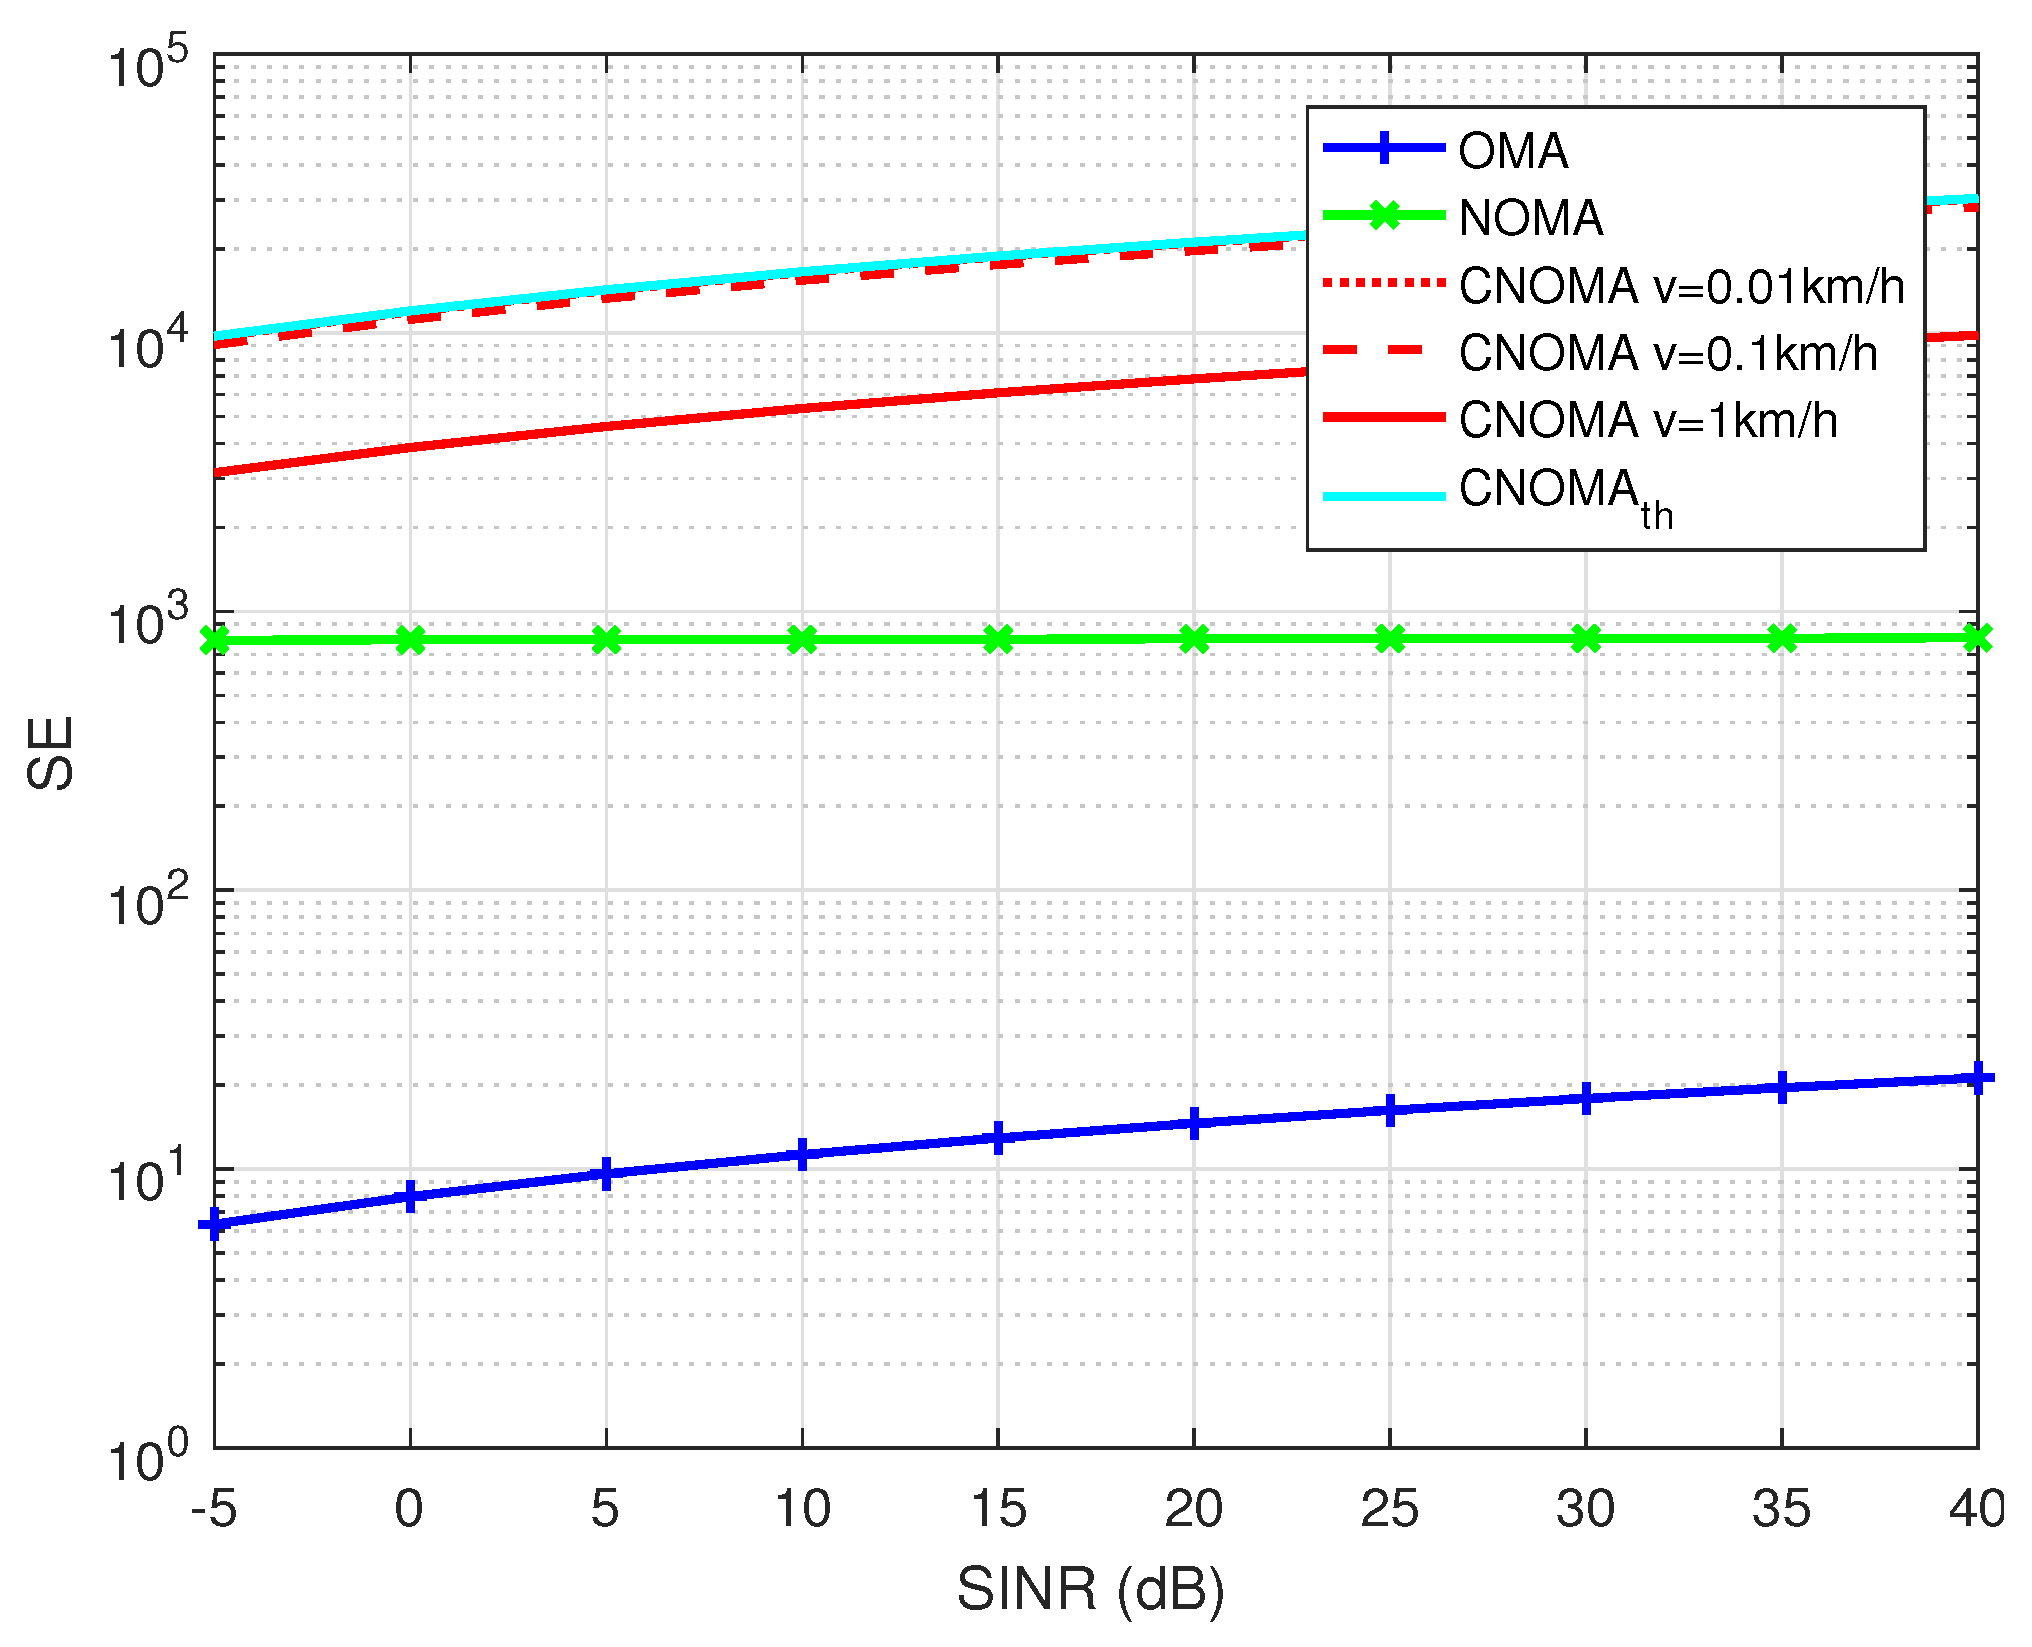
5.3. SE and EE Simulations
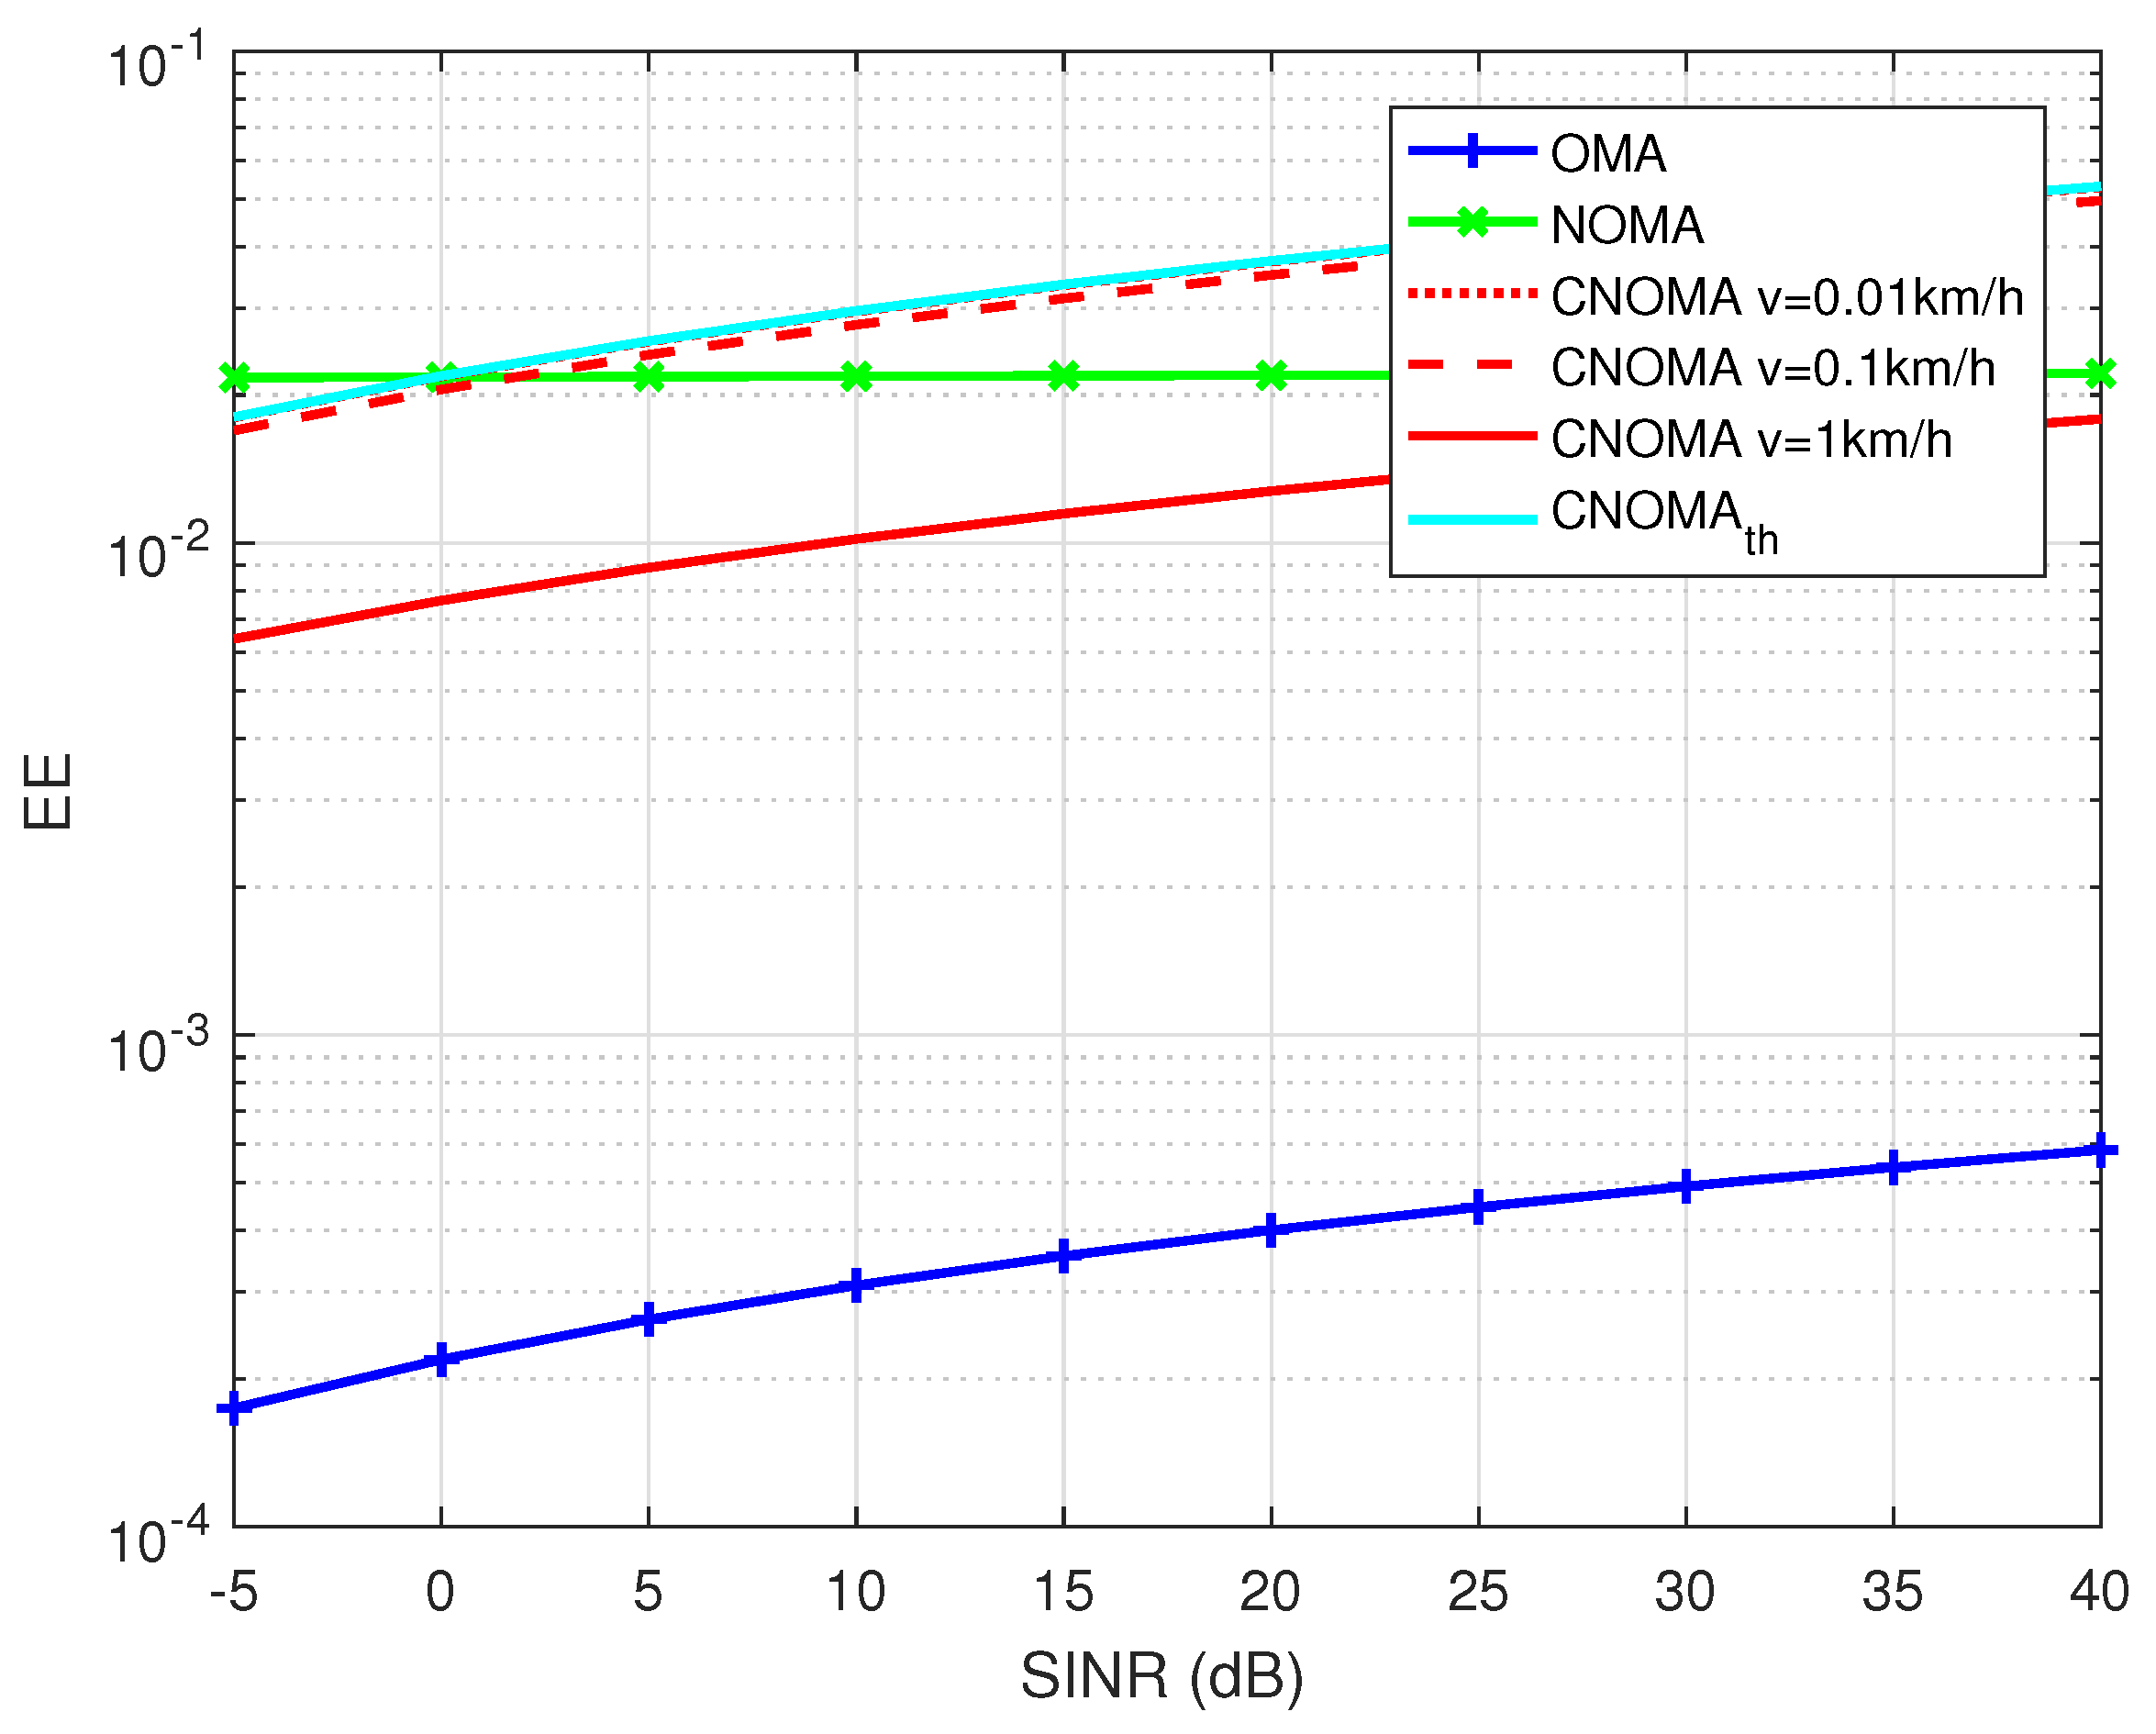
We compare the system spectral and energy efficiency with OMA and NOMA models for different signal to noise ratio (SNR) values and for different users’ speed profiles km/h, km/h and km/h, representing different cases of coherence time values.
In this simulations, we consider () and 60 coalitions. Users join the coalitions as described in Algorithm 1 in one tentative connection. We present the SE and EE results in Figure 5 and Figure 6, respectively.
We compare the simulation results and the outcome of the formed coalitions with the theoretical values, for a quasi-static mobility scenario.
The proposed NOMA-D2D scheme is better than the multicast NOMA and OMA models, in terms of system SE and EE, especially for low mobility profiles. However, for medium and high mobility figures, the EE of the proposed system is worst than NOMA one due to the high rhythm of channel change versus the consumed time needed in the execution of the coalition algorithms. Though, the proposed system remains better than OMA for all considered speed profiles.
5.4. Optimal Number of Coalitions
In this subsection, we analyze the impact of the number of coalitions on the system performance.
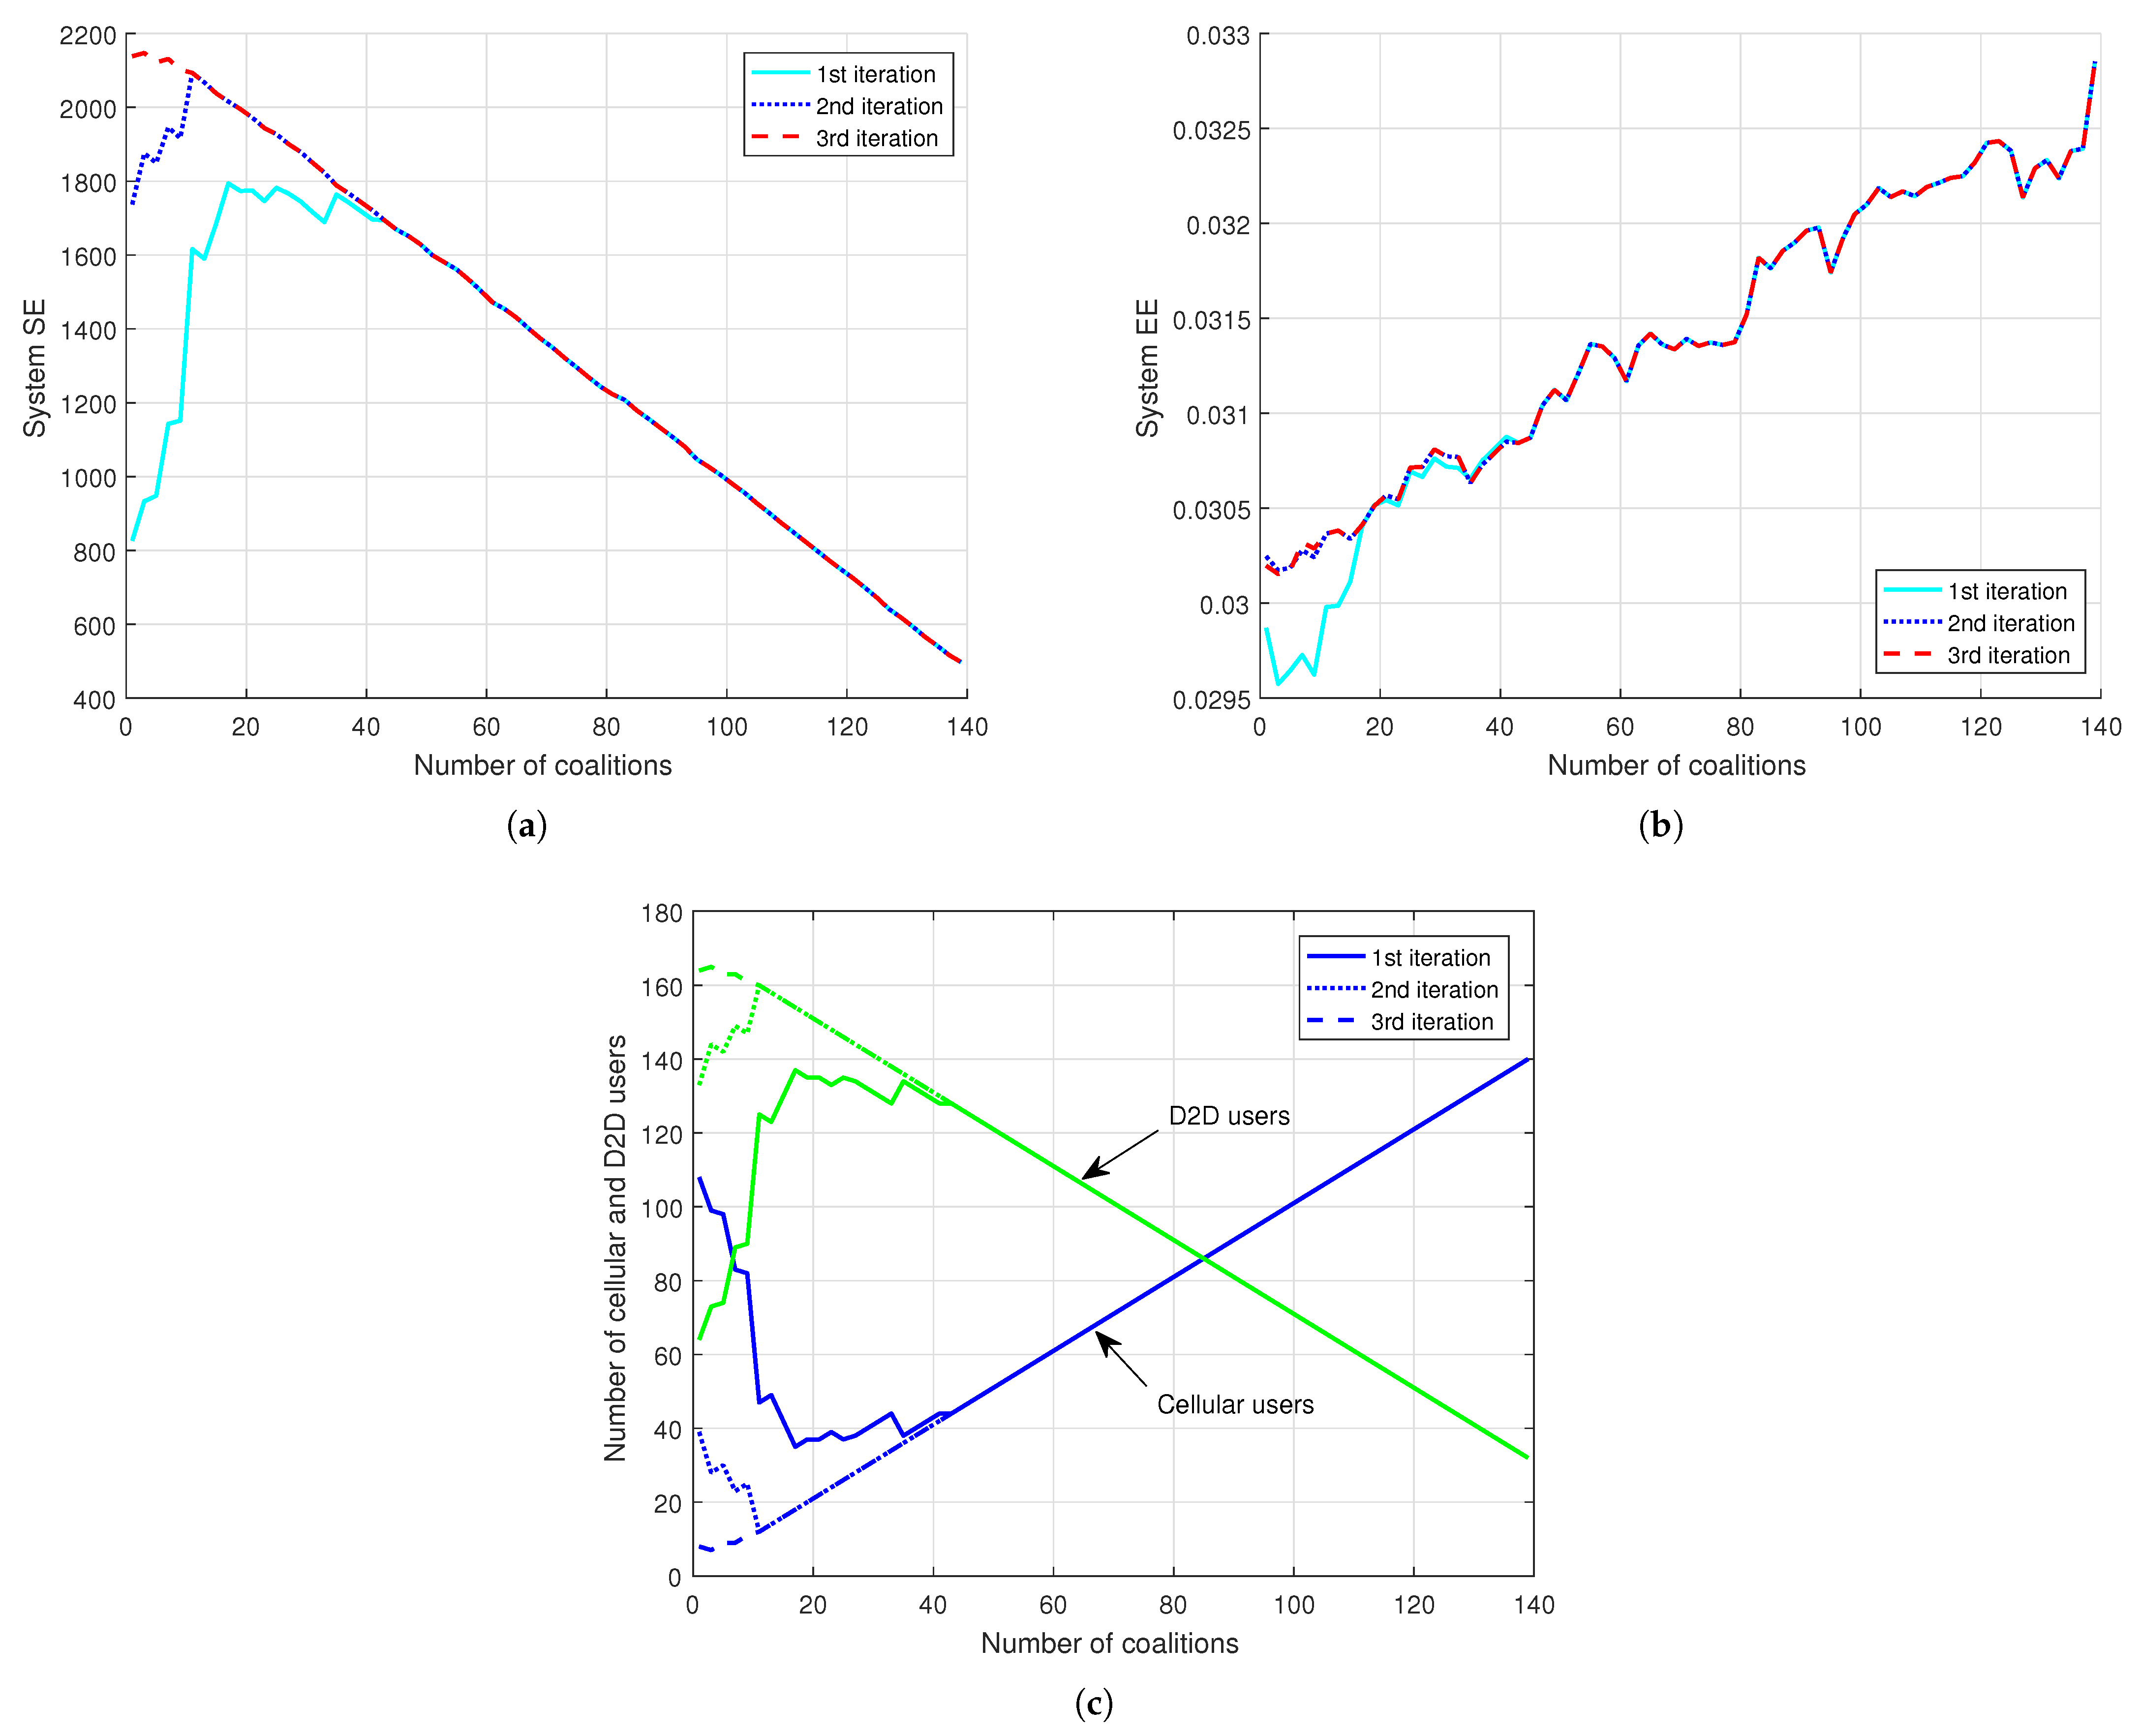
For a given configuration of ( users), we illustrate the evolution of the system SE and EE according to the number of coalitions in Figure 7. We consider different iteration cases of Algorithm 2; one tentative connection, two tentative connections, and three tentative connections. We also provide the number of cellular and D2D users for each case of M.
From the figures, we observe that the overall shape of the SE function is similar to the evolution of the D2D users and is decreasing versus the number of coalitions. Indeed, when the number of coalitions increases, the number of D2D users in the system decreases, hence the system sum rate decreases as we are loosing the D2D proximity advantage. On the other hand, more cellular users get access to the spectrum resources. As consequence, the system SE decreases together with the number of D2D users as the number of coalitions increases.
On the other side, as we are assuming that the power budget remains the same regardless of the number of connected users, the consumed power at the D2D users reduces the EE of the system when the number of the D2D users increases. This is explaining the shape of the EE curve in Figure 7b.
However, as we are increasing the number of coalitions by , the increase in the system EE remain relatively small, as we are talking about an order of , versus a decrease in the system SE with an order of . This is showing the gain in terms of SE which the proposed coalition approach is offering.
A second observation from the figures is regarding the impact of the number of iterations on the system configuration; after a certain value of M (42 coalitions), the system becomes stable as regards to the number of iterations; i.e., we get the same system configuration, in terms of D2D users, after the first tentative connection; more iterations will not change the configuration. This is due to the fact that when the density of coalition heads is low, users will need more tentative connections to reach a through their D2D neighbors. When the density of is large, users can find a in their D2D coverage area and join a coalition from the first tentative connection. In case of low coalition head density in the system, allowing more tentative connections will help saving the resources and increase the system SE. However, the size of coalitions will increase, which means there will be more delay in the transmission and more use of the devices’ resources.
We must highlight that for designing an optimal system, an efficient number of coalitions must be selected based on the number of users, their computing and energy capacities, their mobility patterns and the total accepted delay in the transmission. Indeed, with a fewer number of coalitions, the number of D2D users inside each coalition is higher and hence the delay in transmission is more important. On the other side, for high number of coalitions, the channel uses needed to execute the coalition formation algorithm is more important and can take more than one block (one coherence time). We can suggest, as direction to manage to this concern, splitting the cell into several partitions, based on users’ geographical position or mobility profiles, and run the proposed algorithms inside each partition.
6. Conclusions
In this paper, we presented a NOMA-D2D system based on the concept of coalitions. First, the coalition heads were identified and served in NOMA mode by the base station. In the second step, the other users joined the different coalitions and formed a transmission tree using their best D2D link with the members of the same group.
The proposed system presents great benefits, in terms of system SE, compared to NOMA and OMA systems. From the simulations, we observed an increase of up to 10-times the system SE compared to NOMA system and up to 1000-times compared to OMA one.
In low mobility patterns, the proposed system can achieve better results than conventional NOMA and OMA systems in terms of system energy efficiency. However, due to the additional time consumed during the coalition and the transmission tree formation stages, the energy efficiency of the system decreases compared to NOMA in high mobility contexts.
We finally discussed how to optimally design the system in terms of selecting efficiently the number of coalition heads based on the system conditions and the relevant IoT use cases. The proposed system can be further investigated and developed to improve the system spectral and energy efficiency; splitting the cell into smaller sectors can be one of the directions.
Author Contributions
Conceptualization, R.E., M.R.E.F. and M.B.; formal analysis, R.E., M.R.E.F. and M.B.; investigation, R.E.; writing—original draft preparation, R.E.; writing—review and editing, M.R.E.F. and M.B.; visualization, R.E.; supervision, M.R.E.F. and M.B. All authors have read and agreed to the published version of the manuscript.
Funding
This research received no external funding.
Conflicts of Interest
The authors declare no conflict of interest.
Abbreviations
The following abbreviations are used in this manuscript:
| 6G | 6th Generation of wireless networks |
| D2D | Device-to-Device |
| NOMA | Non-Orthogonal Multiple Access |
| OMA | Orthogonal Multiple Access |
| SE | Spectrum Efficiency |
| EE | Energy Efficiency |
| IoT | Internet Of Things |
| NGMA | Next-Generation Multiple Access |
| 3GPP | 3rd Generation Partnership Project |
| BS | Base Station |
| UE | User Equipment |
| CU | Cellular User |
| CH | Coalition Head |
| SIC | Successive Interference Cancellation |
References
- Bariah, L.; Mohjazi, L.; Muhaidat, S.; Sofotasios, P.C.; Kurt, G.K.; Yanikomeroglu, H.; Dobre, O.A. A prospective look: Key enabling technologies, applications and open research topics in 6G networks. IEEE Access 2020, 8, 174792–174820. [Google Scholar] [CrossRef]
- IMT Traffic Estimates for the Years 2020 to 2030. Rep. ITU-R M.2370-0. 2015. Available online: https://www.itu.int/pub/r-rep-m.2370 (accessed on 10 March 2022).
- You, X.; Wang, C.X.; Huang, J.; Gao, X.; Zhang, Z.; Wang, M.; Liang, Y.C. Towards 6G wireless communication networks: Vision, enabling technologies, and new paradigm shifts. Sci. China Inf. Sci. 2021, 64, 110301. [Google Scholar] [CrossRef]
- Wang, C.L.; Chen, J.Y.; Chen, Y.J. Power allocation for a downlink non-orthogonal multiple access system. IEEE Wirel. Commun. Lett. 2016, 5, 532–535. [Google Scholar] [CrossRef]
- Zhu, J.; Wang, J.; Huang, Y.; He, S.; You, X.; Yang, L. On optimal power allocation for downlink non-orthogonal multiple access systems. IEEE J. Sel. Areas Commun. 2017, 35, 2744–2757. [Google Scholar] [CrossRef] [Green Version]
- Elouafadi, R.; Benjillali, M. On Optimal Power Allocation for Downlink NOMA Transmissions under PHY QoS Constraints. In Proceedings of the 15th International Wireless Communications and Mobile Computing Conference (IWCMC), Tangier, Morocco, 24–28 June 2019; pp. 1606–1611. [Google Scholar]
- Wang, X.; Wang, J.; He, L.; Song, J. Spectral efficiency analysis for downlink NOMA aided spatial modulation with finite alphabet inputs. IEEE Trans. Veh. Technol. 2017, 66, 10562–10566. [Google Scholar] [CrossRef]
- Shahraki, A.; Abbasi, M.; Piran, M.; Taherkordi, A. A comprehensive survey on 6G networks: Applications, core services, enabling technologies, and future challenges. arXiv 2021, arXiv:2101.12475. [Google Scholar]
- Makki, B.; Chitti, K.; Behravan, A.; Alouini, M.S. A survey of NOMA: Current status and open research challenges. IEEE Open J. Commun. Soc. 2020, 1, 179–189. [Google Scholar] [CrossRef] [Green Version]
- Zhang, S.; Liu, J.; Guo, H.; Qi, M.; Kato, N. Envisioning device-to-device communications in 6G. IEEE Netw. 2020, 34, 86–91. [Google Scholar] [CrossRef] [Green Version]
- Zhang, S.; Zhang, H.; Song, L. Beyond D2D: Full dimension UAV-to-everything communications in 6G. IEEE Trans. Veh. Technol. 2020, 69, 6592–6602. [Google Scholar] [CrossRef] [Green Version]
- Elouafadi, R.; Benjillali, M. Cooperative NOMA-based D2D communications: A survey in the 5G/IoT context. In Proceedings of the 19th IEEE Mediterranean Electrotechnical Conference (MELECON), Marrakech, Morocco, 2–7 May 2018; pp. 132–137. [Google Scholar]
- Elouafadi, R.; El Fenni, M.R.; Benjillali, M. A game theoretical approach to D2D underlaying downlink NOMA networks. In Proceedings of the 6th International Conference on Wireless Networks and Mobile Communications (WINCOM), Marrakech, Morocco, 16–19 October 2018; pp. 1–6. [Google Scholar]
- Zhao, J.; Liu, Y.; Chai, K.K.; Chen, Y.; Elkashlan, M. Joint subchannel and power allocation for NOMA enhanced D2D communications. IEEE Trans. Commun. 2017, 65, 5081–5094. [Google Scholar] [CrossRef]
- Wang, J.; Song, X.; Dong, L. Resource Allocation and EE-SE Tradeoff for H-CRAN with NOMA-Based D2D Communications. KSII Trans. Internet Inf. Syst. 2020, 14, 1837–1860. [Google Scholar]
- Hmila, M.; Fernández-Veiga, M.; Rodríguez-Pérez, M.; Herrería-Alonso, S. Non-orthogonal multiple access for unicast and multicast D2D: Channel assignment, power allocation and energy efficiency. Sensors 2021, 21, 3436. [Google Scholar] [CrossRef] [PubMed]
- Le, M.; Pham, Q.V.; Kim, H.C.; Hwang, W.J. Enhanced Resource Allocation in D2D Communications with NOMA and Unlicensed Spectrum. IEEE Syst. J. 2021. [Google Scholar] [CrossRef]
- Alibeigi, M.; Taherpour, A.; Gazor, S. Improving Secrecy Rate and Social Welfare by NOMA Technique in D2D Communications Network. IEEE Trans. Green Commun. Netw. 2021. [Google Scholar] [CrossRef]
- Sun, M.; Xu, X.; Tao, X.; Zhang, P.; Leung, V.C. NOMA-based D2D-enabled traffic offloading for 5G and beyond networks employing licensed and unlicensed access. IEEE Trans. Wirel. Commun. 2020, 19, 4109–4124. [Google Scholar] [CrossRef]
- 3GPP TS 23.246, Version 16.1.0; Architecture and Functional Description; Multimedia Broadcast/Multicast Service (MBMS): 2019. Available online: https://portal.3gpp.org/desktopmodules/Specifications/SpecificationDetails.aspx?specificationId=829 (accessed on 10 March 2022).
- Zhu, L.; Zhang, J.; Xiao, Z.; Cao, X.; Wu, D.O. Optimal user pairing for downlink non-orthogonal multiple access (NOMA). IEEE Wirel. Commun. Lett. 2018, 8, 328–331. [Google Scholar] [CrossRef]
- Proakis, J.G.; Salehi, M. Digital Communications; McGraw-Hill: New York, NY, USA, 2001. [Google Scholar]
Figure 1.
Illustration of the system model.

Figure 2.
Coalition formation: users and 10 coalitions; only one tentative connection.

Figure 3.
Coalition formation: users and 10 coalitions; 2 tentative connections.

Figure 4.
Transmissiontree of coalition number 9.

Figure 5.
SE comparison between OMA, NOMA and proposed cooperative NOMA. and .

Figure 6.
EE comparison between OMA, NOMA and proposed cooperative NOMA. and .

Figure 7.
Proposed cooperative NOMA vs. number of coalitions. (a) System’s SE; (b) System’s EE; (c) Evolution of the number of D2D and cellular users.
Figure 7.
Proposed cooperative NOMA vs. number of coalitions. (a) System’s SE; (b) System’s EE; (c) Evolution of the number of D2D and cellular users.


Table 1.
List of Notations.
| Symbol | Definition |
|---|---|
| The set of D2D-enabled nodes | |
| N | Total number of nodes |
| M | Number of Coalition heads () |
| Set of UEs forming a coalition around | |
| Set of all coalition heads | |
| Channel gain between and the base station | |
| Channel gain between nodes i and j | |
| Maximum number of users that can serve | |
| Number of connected D2D users to | |
| Set of Lone users | |
| l | Number of Lone users |
| R | Instantaneous rate |
| Average rate | |
| T | Coherence time |
| Symbol time | |
| Energy efficiency | |
| Spectrum efficiency |
Table 2.
Simulation Parameters.
| Parameter | Value |
|---|---|
| Cell area | sqm |
| Radius of D2D coverage area | 35 m |
| BS transmit power P | 40 dBm |
| D2D transmit power | 20 dBm |
| BS circuit power | W |
| Devices circuit power | W |
| Path loss exponents | Between and 2 |
| Rayleigh channel parameters | Between 2 and 3 |
| Minimum rate | 1 bit/s/Hz |
| Network density | () |
| Number of coalitions | and |
| Speed profiles | km/h |
Publisher’s Note: MDPI stays neutral with regard to jurisdictional claims in published maps and institutional affiliations. |
© 2022 by the authors. Licensee MDPI, Basel, Switzerland. This article is an open access article distributed under the terms and conditions of the Creative Commons Attribution (CC BY) license (https://creativecommons.org/licenses/by/4.0/).
Share and Cite
MDPI and ACS Style
Elouafadi, R.; Raiss El Fenni, M.; Benjillali, M. NOMA Clustering for Improved Multicast IoT Schemes. J. Sens. Actuator Netw. 2022, 11, 26. https://0-doi-org.brum.beds.ac.uk/10.3390/jsan11020026
AMA Style
Elouafadi R, Raiss El Fenni M, Benjillali M. NOMA Clustering for Improved Multicast IoT Schemes. Journal of Sensor and Actuator Networks. 2022; 11(2):26. https://0-doi-org.brum.beds.ac.uk/10.3390/jsan11020026
Chicago/Turabian StyleElouafadi, Rajaa, Mohammed Raiss El Fenni, and Mustapha Benjillali. 2022. "NOMA Clustering for Improved Multicast IoT Schemes" Journal of Sensor and Actuator Networks 11, no. 2: 26. https://0-doi-org.brum.beds.ac.uk/10.3390/jsan11020026
Note that from the first issue of 2016, this journal uses article numbers instead of page numbers. See further details here.