Online Reviews and Product Sales: The Role of Review Visibility


Department of Management, Public University of Navarre, 31006 Pamplona, Spain
*
Author to whom correspondence should be addressed.
J. Theor. Appl. Electron. Commer. Res. 2021, 16(4), 638-669; https://0-doi-org.brum.beds.ac.uk/10.3390/jtaer16040038
Submission received: 23 November 2020
/
Revised: 22 December 2020
/
Accepted: 31 December 2020
/
Published: 5 January 2021
Abstract
:When studying the impact of online reviews on product sales, previous scholars have usually assumed that every review for a product has the same probability of being viewed by consumers. However, decision-making and information processing theories underline that the accessibility of information plays a role in consumer decision-making. We incorporate the notion of review visibility to study the relationship between online reviews and product sales, which is proxied by sales rank information, studying three different cases: (1) when every online review is assumed to have the same probability of being viewed; (2) when we assume that consumers sort online reviews by the most helpful mechanism; and (3) when we assume that consumers sort online reviews by the most recent mechanism. Review non-textual and textual variables are analyzed. The empirical analysis is conducted using a panel of 119 cosmetic products over a period of nine weeks. Using the system generalized method of moments (system GMM) method for dynamic models of panel data, our findings reveal that review variables influence product sales, but the magnitude, and even the direction of the effect, vary amongst visibility cases. Overall, the characteristics of the most helpful reviews have a higher impact on sales.
1. Introduction
Online consumer reviews are a type of electronic word-of-mouth (eWOM) communication that can be defined as “peer-generated product evaluations posted on the company’s or a third party’s websites” [1]. Academics and practitioners have highlighted the importance of online reviews for both consumers and companies. A study by the consultancy firm BrigthLocal [2] reveals that 82% of consumers read online reviews when evaluating a business, and 76% trust online reviews as much as personal recommendations. Besides, the same study reveals that including online reviews on the retailer website makes the searchers see the business as more trustworthy. Academic literature has also highlighted the power of online reviews to predict different types of consumer behavior such as information adoption decisions [3,4,5], purchase intentions [6,7,8], and product sales in product categories such as hardware, books, movies, and hotels [9,10,11,12,13,14]. Some studies have also focused on exploring online reputation and image by analyzing product features revealed at online reviews [15], and others have studied review texts to uncover product features and sentiments [16]. When exploring the role of online reviews to predict product sales, previous literature has implicitly assumed that every review for a product has the same probability of being viewed by consumers, so every review has been considered as equally influential in the consumer purchase decision. However, literature in decision-making has revealed that consumers usually face information overload situations in online environments, due to a large amount of information available [17,18], as it might happen when dealing with a high volume of online reviews. In these complex environments, consumers cannot evaluate every single online review available for each product, and instead, they are likely to adopt selective processing strategies to reduce the cognitive effort of managing a big volume of information. For instance, the report from [2] reveals that, on average, consumers read a maximum of 10 online reviews before making a decision, which means that consumers are likely to base their decision only on a subset of all reviews. In the same line, information processing theories, especially the accessibility-diagnosticity theory by Feldman and Lynch [19], claim that the likelihood of using a piece of information for making a choice depends both on its accessibility and its diagnosticity. Therefore, this theory might suggest that more accessible or visible online reviews are likely to be more used by consumers to make a choice.
In this research, we explore the relationship between online reviews and product sales by incorporating the notion of review visibility, which approaches the accessibility dimension of the accessibility-diagnosticity theory by Feldman and Lynch [19]. In line with other scholars [9,20,21,22], product sales information is proxied in this study by the sales rank of products at the online retailer, which is obtained by web-scraping the web store. Review visibility captures the rank order of online reviews for a product when using two important sorting mechanisms: Most helpful and most recent. Online retailers show in their product web pages online reviews sorted by a specific default mechanism, which might vary between online retailers. Thus, even if consumers do not sort online reviews by themselves, reviews are already shown in a default sorting rank, many times in chronological order, in the way that some of them are more visible than others. Therefore, depending on the way consumers organize online reviews, some of them might have a greater impact on consumer decisions than others. The diagnosticity of online reviews depends on the characteristics of the information contained in online reviews. To approach the diagnosticity dimension of online reviews, we use two sets of review variables. The first set contains those review non-textual variables most used in previous literature: Volume, rating and rating_inconsistency, which reflects the difference between each individual review rating and the product average rating. The second set includes three variables that summarize the textual content of online reviews for each product: Analytic, authentic, and clout. These three summary variables are extracted from the last version of the text mining program Linguistic Inquiry and Word Count (LIWC) developed by Pennebaker et al. [23].
Thus, the objective of this research is to study the impact of review non-textual and textual features on product sales in three cases of review visibility: (1) When every online review for a product is assumed to have the same probability of being viewed; (2) when we assume that consumers sort online reviews for a product by the most helpful mechanism, so most helpful reviews are more likely to be viewed and (3) when we assume that consumers sort online reviews for a product by the most recent mechanism, in the way that most recent online reviews are more likely to be viewed.
To carry out the empirical analysis, we collected data from a US cosmetics online retailer. Data belongs to the category of “blush” products, and it was collected on a weekly basis over nine weeks between the 21 December 2016 and 17 February 2017. A panel data methodology was adopted to carry out the estimations.
The rest of the paper is structured as follows: First, the theoretical background and conceptual model are presented. Then, the data and research methodology are explained. Afterward, the discussion of results, followed by a general discussion about theoretical and managerial implications, is developed. Finally, the last section shows the main limitations and areas for future research.
2. Theoretical Background and Conceptual Model
2.1. Influence of Online Reviews on Product Sales
A great deal of literature has explored how the two main factors of online reviews, volume (number of online comments to the product or service) and valence or product average rating (average rating star given to a product), influence product sales [9,10,11,13,24]. However, the effect of these features on product sales are not unanimously clear. Most previous studies have revealed that a greater volume of online reviews of a product leads to an increase in product sales [9,13,25,26,27], since a higher number of online reviews generates more product awareness and increases the perception of the product quality [25]. As stated by Hennig-Thurau and Wiertz [13], the volume might communicate how many people find the product interesting. However, there are also studies that reveal that the volume of online reviews is not only a precursor of product sales, but also an outcome [25], so this dual relationship might be considered to get to good estimations.
The effect of product rating on product sales remains less clear in the literature, which shows mixed results. Consumers usually associate positive online reviews with a better expected quality of the product, which leads to a positive attitude towards the product; while negative ratings are seen as complaints or denigration of the product, which leads to an unfavorable attitude towards the product [27,28]. Some studies find that higher product ratings are positively related to product sales [9,10,11,29]; others reveal that the effect of rating on product sales is not significant [25,27]. The effect of product rating on sales also has been explored using other rating measures, such as rating variance, rating inconsistency, and proportion of positive and negative reviews. However, no consensus has been reached. Chevalier and Mayzlin [9] found that the greater the fraction of five-star reviews for books at Amazon.com, the better the sales rank of the book, whereas the higher the fraction of one-star reviews, the worse the sales rank of the book. Liu [27] analyzed the impact of online reviews on box office revenues and found that, both the fraction of one-star and five-star reviews were no significant in explaining box office revenues. In terms of review variance, Wang, Liu, and Fang [30] found a negative impact of review variance on box office revenues. Moreover, in a movie context, Chintagunta et al. [10] did not find a significant impact of variance on box office revenues. Furthermore, Sun [22] stated that a higher standard deviation of Amazon.com ratings for books leads to higher relative sales only when the average product rating is low. Therefore, more research is needed to get a clearer understating of the effect of both product average rating and volume of online reviews on product sales.
A smaller stream of literature has explored the impact of review textual features on product sales. The study of narrative and its persuasion power has been widely explored in several research domains, such as communication, psychology, and marketing. Tausczik and Pennebaker [31] claim that the words we use in daily life reflect who we are and the social relationships we are in, so language is the way in which people express their internal thoughts and emotions. Overall, studies on narrative persuasion have concluded that message characteristics have a strong power over different types of consumer behavior, such as purchase intention [32], conversion rates [33], liking and commenting brand posts [34], and social media rebroadcasting [35]. However, so far, a relatively small number of scholars have explored the influence of review textual features on consumers’ purchasing decisions. Although historically, the analysis of the text was complex, slow, and costly, the development of high-speed computers and new statistical methods has helped companies and researchers to go one step further in the study of texts and language [31,36]. Therefore, scholars are increasingly paying attention to the study of the text of online reviews [10,34,37,38]. Most scholars exploring review text have focused on studying text sentiment (positive vs. negative). For example, Hu, Koh, and Reddy [39], Liang, Li, Yang, and Wang [37], and Li et al. [11] claim that more positive comments on the product lead to higher sales. Tang, Fang, and Wang [38] reveal that neutral comments in terms of sentiment also impact product sales, and this impact depends on the amount of mixed and indifferent neutral comments and their relative strength. However, the effect of other review textual factors on product sales remains quite underexplored. For example, Yazdani et al. [40] incorporates the role of three textual dimensions, adopted from Pennebaker et al. [23], to explore the effect of text on product sales: Affective content, social content, and informal language content. They find that product sales are positively influenced by reviews with higher affective and social content and by those that use more informal language. Overall, we observe that studies exploring review textual features usually conclude that the text of reviews influences consumer behavior and product sales. Therefore, not only non-textual aspects of online reviews (e.g., product average rating and volume) should be considered, but also review textual features. In our research, both non-textual and textual review features are incorporated to explore the effect of online reviews on product sales in three different cases of review visibility.
When exploring the effect of online reviews on product sales, many papers have relied on sales-rankings as a proxy of actual product sales [9,20,21,22]. The main reason is that Chevalier and Goolsbee [41] found that for Amazon.com, the relationship between ln(sales) and ln(sales ranks) is approximately linear. Our study also uses sales-rankings as a proxy of product sales.
2.2. Decision-Making and Information Processing in the Online Environment: The Role of Review Visibility
A wide range of literature exploring the relationship between online reviews and different types of consumer behavior, such as information adoption decisions and purchase intention, have usually taken dual processes theories, mainly the Elaboration Likelihood Model (ELM) by Petty and Cacioppo [42] and the heuristic-systematic model (HSM) by Chaiken [43] as their theoretical foundation [4,44,45,46,47,48,49,50,51]. The two models offer similar mechanisms to explain individuals’ information processing strategies [50]. Thus, the central route in the ELM and the systematic processing in the HSM, claim that consumers use high cognitive effort to elaborate information, and they actively attempt to comprehend and evaluate the message’s arguments. On the other hand, the peripheral route in the ELM and the heuristic processing in the HSM indicate that individuals exert comparatively little effort in judging the message, and instead of processing the argumentation, they might rely on accessible information, such as the source’s identity and other non-content cues before deciding to adopt the message [43]. In an online reviews’ context, consumers might use the central or systematic processing to understand the text of online reviews, which requires higher cognitive effort. Consumers are likely to use the peripheral or heuristic processing to evaluate non-textual features of reviews, which requires less involvement and effort [49]. As claimed by Chaiken [43], dual processes can occur concurrently, so consumers can engage in both processes along the decision-making process. In fact, SanJosé-Cabezudo, Gutiérrez-Arranz, and Gutiérrez-Cillán [52] claimed that in an online context, both processes act jointly and significantly impact consumers attitudes and intentions.
Due to the growth of the internet, not only do more consumers articulate themselves online, but also search costs are lower than in offline situations [53]. Therefore, when consumers evaluate online reviews to make purchase decisions, they might be confronted by too much information, which results in information overload situations [6]. In this scenario, consumers should select which online reviews to evaluate, since it is very difficult for them to evaluate all available reviews. It is well-known in the decision-making and information processing literature that in complex environments, individuals are often unable to evaluate all available alternatives because humans have limited information processing capacity [17]. For example, previous research in psychology has revealed that the span of information processing for humans is between five and nine chunks [54]. In cognitive science, a familiar unit or chunk is defined as “a collection of elements having strong associations with one another, but weak associations with elements within other chunks” [55]. In an online reviews context, Liu and Karahanna [56] revealed that consumers read on average, seven reviews before making a decision. The evidence to believe that the accessibility or visibility of online reviews plays an important role in consumer decision-making is also grounded in some information processing theories. In particular, the accessibility-diagnosticity theory [19] states that the probability that any piece of information will be adopted as an input for making a choice depends on the accessibility of that input, the accessibility of the alternative inputs, and the diagnosticity or perceived relevance of the input [57,58]. This theory conveys that the use of information to make choices varies positively with the accessibility of the information. Holding constant the accessibility and diagnosticity of alternative inputs, any factor that influences the accessibility of input affects its adoption [59]. The accessibility dimension of the accessibility-diagnosticity theory helps consumers to reduce the cognitive effort needed when evaluating information in the online environment. In this line, Slovic [60] suggests that consumers tend to use only the information that is explicitly displayed, and they will use it in the form it is displayed because that behavior reduces the cognitive effort required to process information [61].
As claimed by Aljukhadar et al. [53], in complex choice situations, consumers are selective in acquiring and processing product information. According to Payne [62], humans adapt their decision-making to specific situations and environments. For instance, Shugan [63] described them as “cognitive misers”, who strive to reduce the amount of cognitive effort associated with decision-making. One way of dealing with complex decision environments, when alternatives are numerous and difficult to compare, is to use decision support systems, which are computer’ based technologies designed to assist individuals in making a decision. Decision support systems include decision aids that perform information processing tasks, such as search in a database or sort objects by some criterion. Individuals are usually good at selecting variables that are relevant in their decision-making process, but weak at retaining large amounts of information [18]. Therefore, to help consumers deal with information overload situations, online retailers usually provide decision aids, such as sorting, in their online review system. These aids allow consumers to reduce their review processing load by choosing those online reviews they want to read, and the order of review presentation they prefer [64]. As claimed by Häubl and Trifts [18], decision aids have strong favorable effects on both the quality and the efficiency of purchase decisions, since they have the potential to change the way consumers search for product information and make purchase decisions.
2.3. Conceptual Model and Hypotheses Development
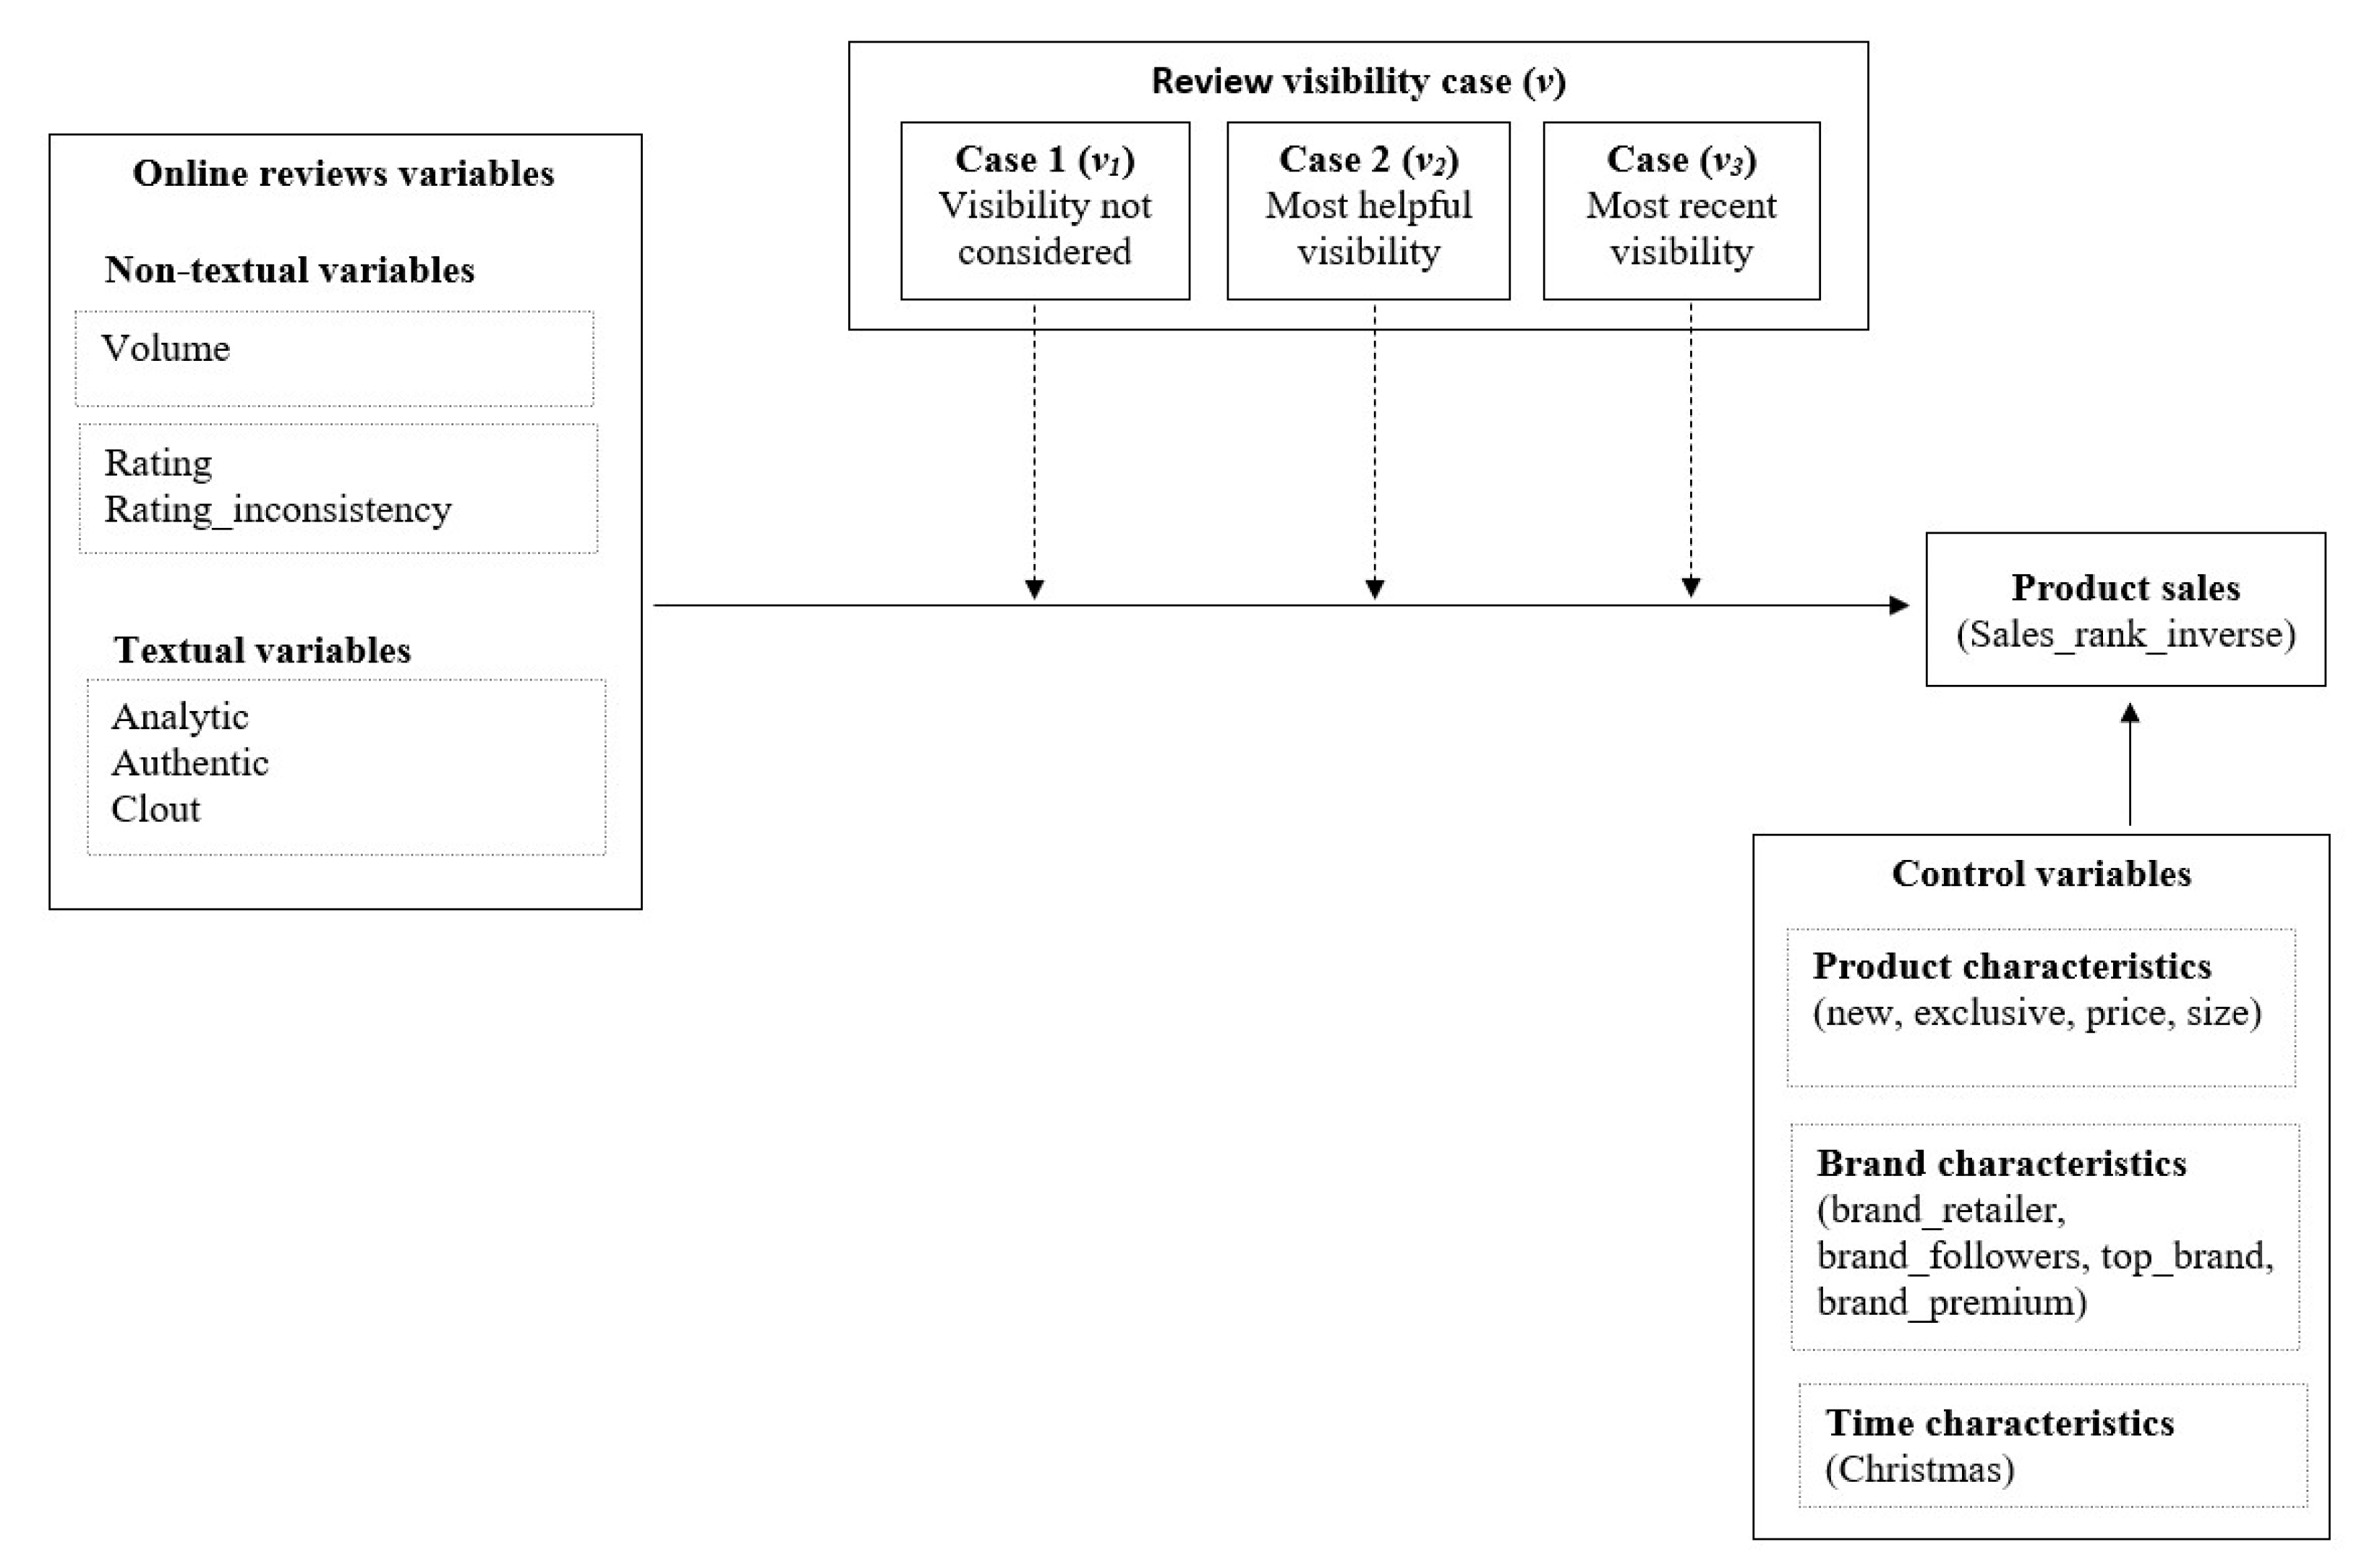
Figure 1 shows the conceptual model proposed in this research. Grounded on the accessibility-diagnosticity theory [19], the main objective of this research is to explore the effect of review non-textual and textual variables on product sales in three independent cases of review visibility. First, when every online review for a product is assumed to have the same probability of being viewed by consumers (traditional approach in the literature); second, when we assume that consumers sort online reviews for a product by the most helpful mechanism, and third, when we assume that consumers sort online reviews for a product by the most recent mechanism, which is the default order in which online reviews are displayed on the online retailer.
The selection of these two sorting mechanisms to approach review visibility in this study is due to several reasons. On the one hand, we explore the visibility when sorting by most helpful online reviews because literature has pointed out the influential effect of review helpfulness on consumer decision-making, and it has been considered as a sign of review quality and diagnosticity [1,20,65]. There is evidence that consumers experience the “wisdom of the crowd” effect when evaluating online reviews [56,66]. This effect refers to the belief that the aggregation of many people’s judgments is a better approximation to the truth than an individual judgment. Thus, if consumers see that many other consumers have voted a review as helpful, they might be more likely to adopt that information since they consider it as more diagnostic and reliable. In this line, Zhou and Guo [66] revealed that consumers tend to experience a social, informational influence, due to the tendency of prospective consumers to conform to previous consumers’ opinions. For instance, if prospective consumers know that many other consumers have already bought the product or that other consumers have highly rated the product, they might be more likely to select it as a promising alternative, and they might have a better attitude towards the product [46,64]. Liu and Karahanna [56] found in an experiment that when sorting by most helpful and most recent options were available, 70 percent of consumers in their sample sorted online reviews in Amazon.com by the “most helpful” mechanism, while 30 percent sorted them by the “most recent” criterion. As stated by Singh et al. [67], since most helpful reviews have higher exposure to consumers, they normally become even more helpful, due to a social influence effect. Lee, Hu, and Lu [68] and Saumya et al. [69] also state in their research that those reviews in top positions in the ranking by “most helpful” are more likely to be evaluated by consumers. On the other hand, review visibility when sorting by most recent is also explored since it is one of the most relevant factors consumers pay attention to when they evaluate reviews. Previous literature has pointed out the importance of information recency in consumer behavior. For example, Westerman et al. [70] highlighted the relevancy of recency in explaining source credibility in online environments. In the same line, Fogg et al. [71] found that consumers associate websites that update information more frequently with higher credibility. Other scholars, such as Levinson [72], claim that social networks’ hallmark is the immediacy of messages, which is one of the factors that make them more credible for consumers. In an online reviews context, the consultancy company BrightLocal [2] revealed that recency was the most important factor of online reviews for consumers when judging a business, ahead of factors, such as review rating and text sentiment. The study reveals that recency was the most important factor for 58 percent of consumers and 40 percent of them said that they online evaluate those reviews that are two weeks old or less. A possible explanation is that consumers want to know up-to-date information about those businesses, products, and services they are interested in. Since they can be modified over time, consumers are interested in knowing how the business, the product, or the service performs at present. However, the most recent sorting mechanism might not only be relevant, due to the role of the date itself—but also because it is the default review sorting mechanism at the online retailer. As defined by Brown and Krishna [73], a default can be interpreted as an option that the individual receives to the extent that he does not willingly decide on something else. Existing literature supports the idea that consumers are biased by default. For example, Johnson et al. [74] claim that consumers consider defaults to reduce the cognitive effort required to make a decision. In this line, information processing theories reveal that many consumers usually adopt the information that is readily available to reduce the cognitive effort associated with decision-making [18,75]. Slovic [60] suggested that consumers tend to use only the information that is explicitly displayed, and they will use it in the form it is displayed because that behavior reduces the cognitive effort required to process information [61]. Herrmann et al. [76] also claimed that defaults influence decision-making behavior even when consumers do not actually select the default option. Thus, review visibility when sorting by most recent, which is also the default mechanism at the online retailer explored, is likely to be an important factor in influencing consumer voting decisions.
The diagnosticity of the information provided by online reviews can be described as the perceived ability of the information to provide consumers with relevant product information that helps them to understand and evaluate the quality and performance of the product [59]. Overall, studies have claimed that an input’s diagnosticity depends on whether it enables a decision-maker to discriminate among alternatives, and this depends on the characteristics of the input of information, which is represented by online reviews in our research [62]. We incorporate in our research two sets of review variables to approach the diagnosticity dimension of the theory. Firstly, we include those non-textual variables that previous literature has claimed to influence product sales: volume, rating, and rating_ inconsistency [9,25,77,78,79]. The second set of variables incorporated into our study are some directly related to the review text: analytic, authentic, and clout, which have been quite underexplored in the online reviews’ literature. Textual variables were extracted from online reviews using the text mining tool Linguistic Inquiry and Word Count [80]. Although other review textual features could have been analyzed, we decided to include the so-called summary variables by Pennebaker et al. [23] because they represent a broader picture of what is expressed in the text. Summary variables represent a factor of other textual variables, such as the number of personal pronouns, number of adverbs, prepositions, and negations. As suggested by Ludwig et al. [81], review text communicates specific linguistic styles that allow reviewers to express their thoughts, experiences, and opinions. This linguistic style is then a combination of two different categories of words: Lexical words, which include adjectives, nouns, verbs, and most adverbs and function words, which include prepositions, pronouns, auxiliary verbs, conjunctions, grammatical articles, or particles [82]. The review style may serve as identity-descriptive information that shapes consumers’ evaluations of the review and the product [33]. Social psychology and communication theories show that the way or style in which a person communicates elicits relational perceptions in the communication partner and influences consumer judgments and behaviors [33,83]. The variable analytic represents how well the message is organized and structured in the review. As claimed by Areni [84], constructing compelling arguments have to do with providing statements to support a given set of claims. Structural elements in verbal arguments are joined with connectives, words, or short phrases that link the propositions comprising an argument [84]. These connectives might enhance the comprehension of arguments because they imply the conceptual relationship between the data and claim [85]. In the consumer behavior field, it has been shown that those messages with a more thorough argument structure have a stronger positive impact on consumer beliefs and message acceptance [84,86]. The variable authentic represents the level of subjectivity shown in the text. Earlier scholars in the marketing field have studied how objectivity influences the attitude towards advertising or other promotional communication [87,88]. For example, Holbrook [88] revealed that objective claims are perceived as more credible than subjective claims, and therefore, the message acceptance is higher and also the attitude towards the brand and the buying intentions. Darley and Smith [87] also stated that objective claims are more effective than subjective claims in both print and radio media. In the context of online reviews, some scholars have explored how subjectivity influences the helpfulness of online reviews, which is represented by the number of helpful votes received by online reviews. However, there is not a consensus in the direction of the effects. Some of them have found that subjectivity positively influences review helpfulness [89], others have claimed that those reviews containing a mixture of subjective and objective elements are more helpful [20,90], while others did not find a relationship between subjectivity and review helpfulness [91]. The last textual variable incorporated in our research is clout, which represents the level of self-confidence shown by the reviewer in the review text [23]. In the psychology literature, the level of confidence of the advisor has been found to be important in reducing consumer uncertainty, especially in online settings [92]. Confidence is defined as “the strength with which a person believes that a specific statement, opinion, or decision is the best possible” [92]. The Judge-Advisor System paradigm [92] reveals that high advisor confidence can act as a cue to expertise and can influence the judge to accept the advice. For example, Price and Stone [93] revealed that when financial advisors expressed high confidence about stock forecasts, they were perceived as more knowledgeable and were more frequently chosen. As far as we know, there are no studies exploring the effect of these textual variables, analytic, authentic, and clout, on product sales, but they have been proved to predict different types of outcomes in other fields, such as academic success and deception [94,95,96]. Thus, we are interested in exploring how the selected textual variables influence product sales in each case of review visibility.
Overall, previous literature has considered every review to have the same influence on consumer purchase decisions, but based on the accessibility-diagnosticity theory [19], we posit that those reviews more accessible or visible for consumers are likely to be even more influential in consumer decision-making. Therefore, we expect that first, non-textual and textual features of online reviews influence product sales when considering different review visibility cases (and not only when every review is considered to have the same influence on consumer purchase decisions), and second, that the impact of non-textual and textual features of online reviews on product sales might be different depending on the review visibility case considered, since, for example, the characteristics of most helpful online reviews might be different to those of most recent online reviews. Thus, different sets of online reviews might have different effects on consumer purchase decisions.
Hence, we hypothesize as follows:
Hypothesis 1a (H1a).
Review non-textual features influence product sales considering different cases of review visibility.
Hypothesis 1b (H1b).
Review textual features influence product sales considering different cases of review visibility.
Hypothesis 2a (H2a).
The influence of review non-textual features on product sales is different depending on the review visibility case considered.
Hypothesis 2b (H2b).
The influence of review textual features on product sales is different depending on the review visibility case considered.
3. Methodology
3.1. Data
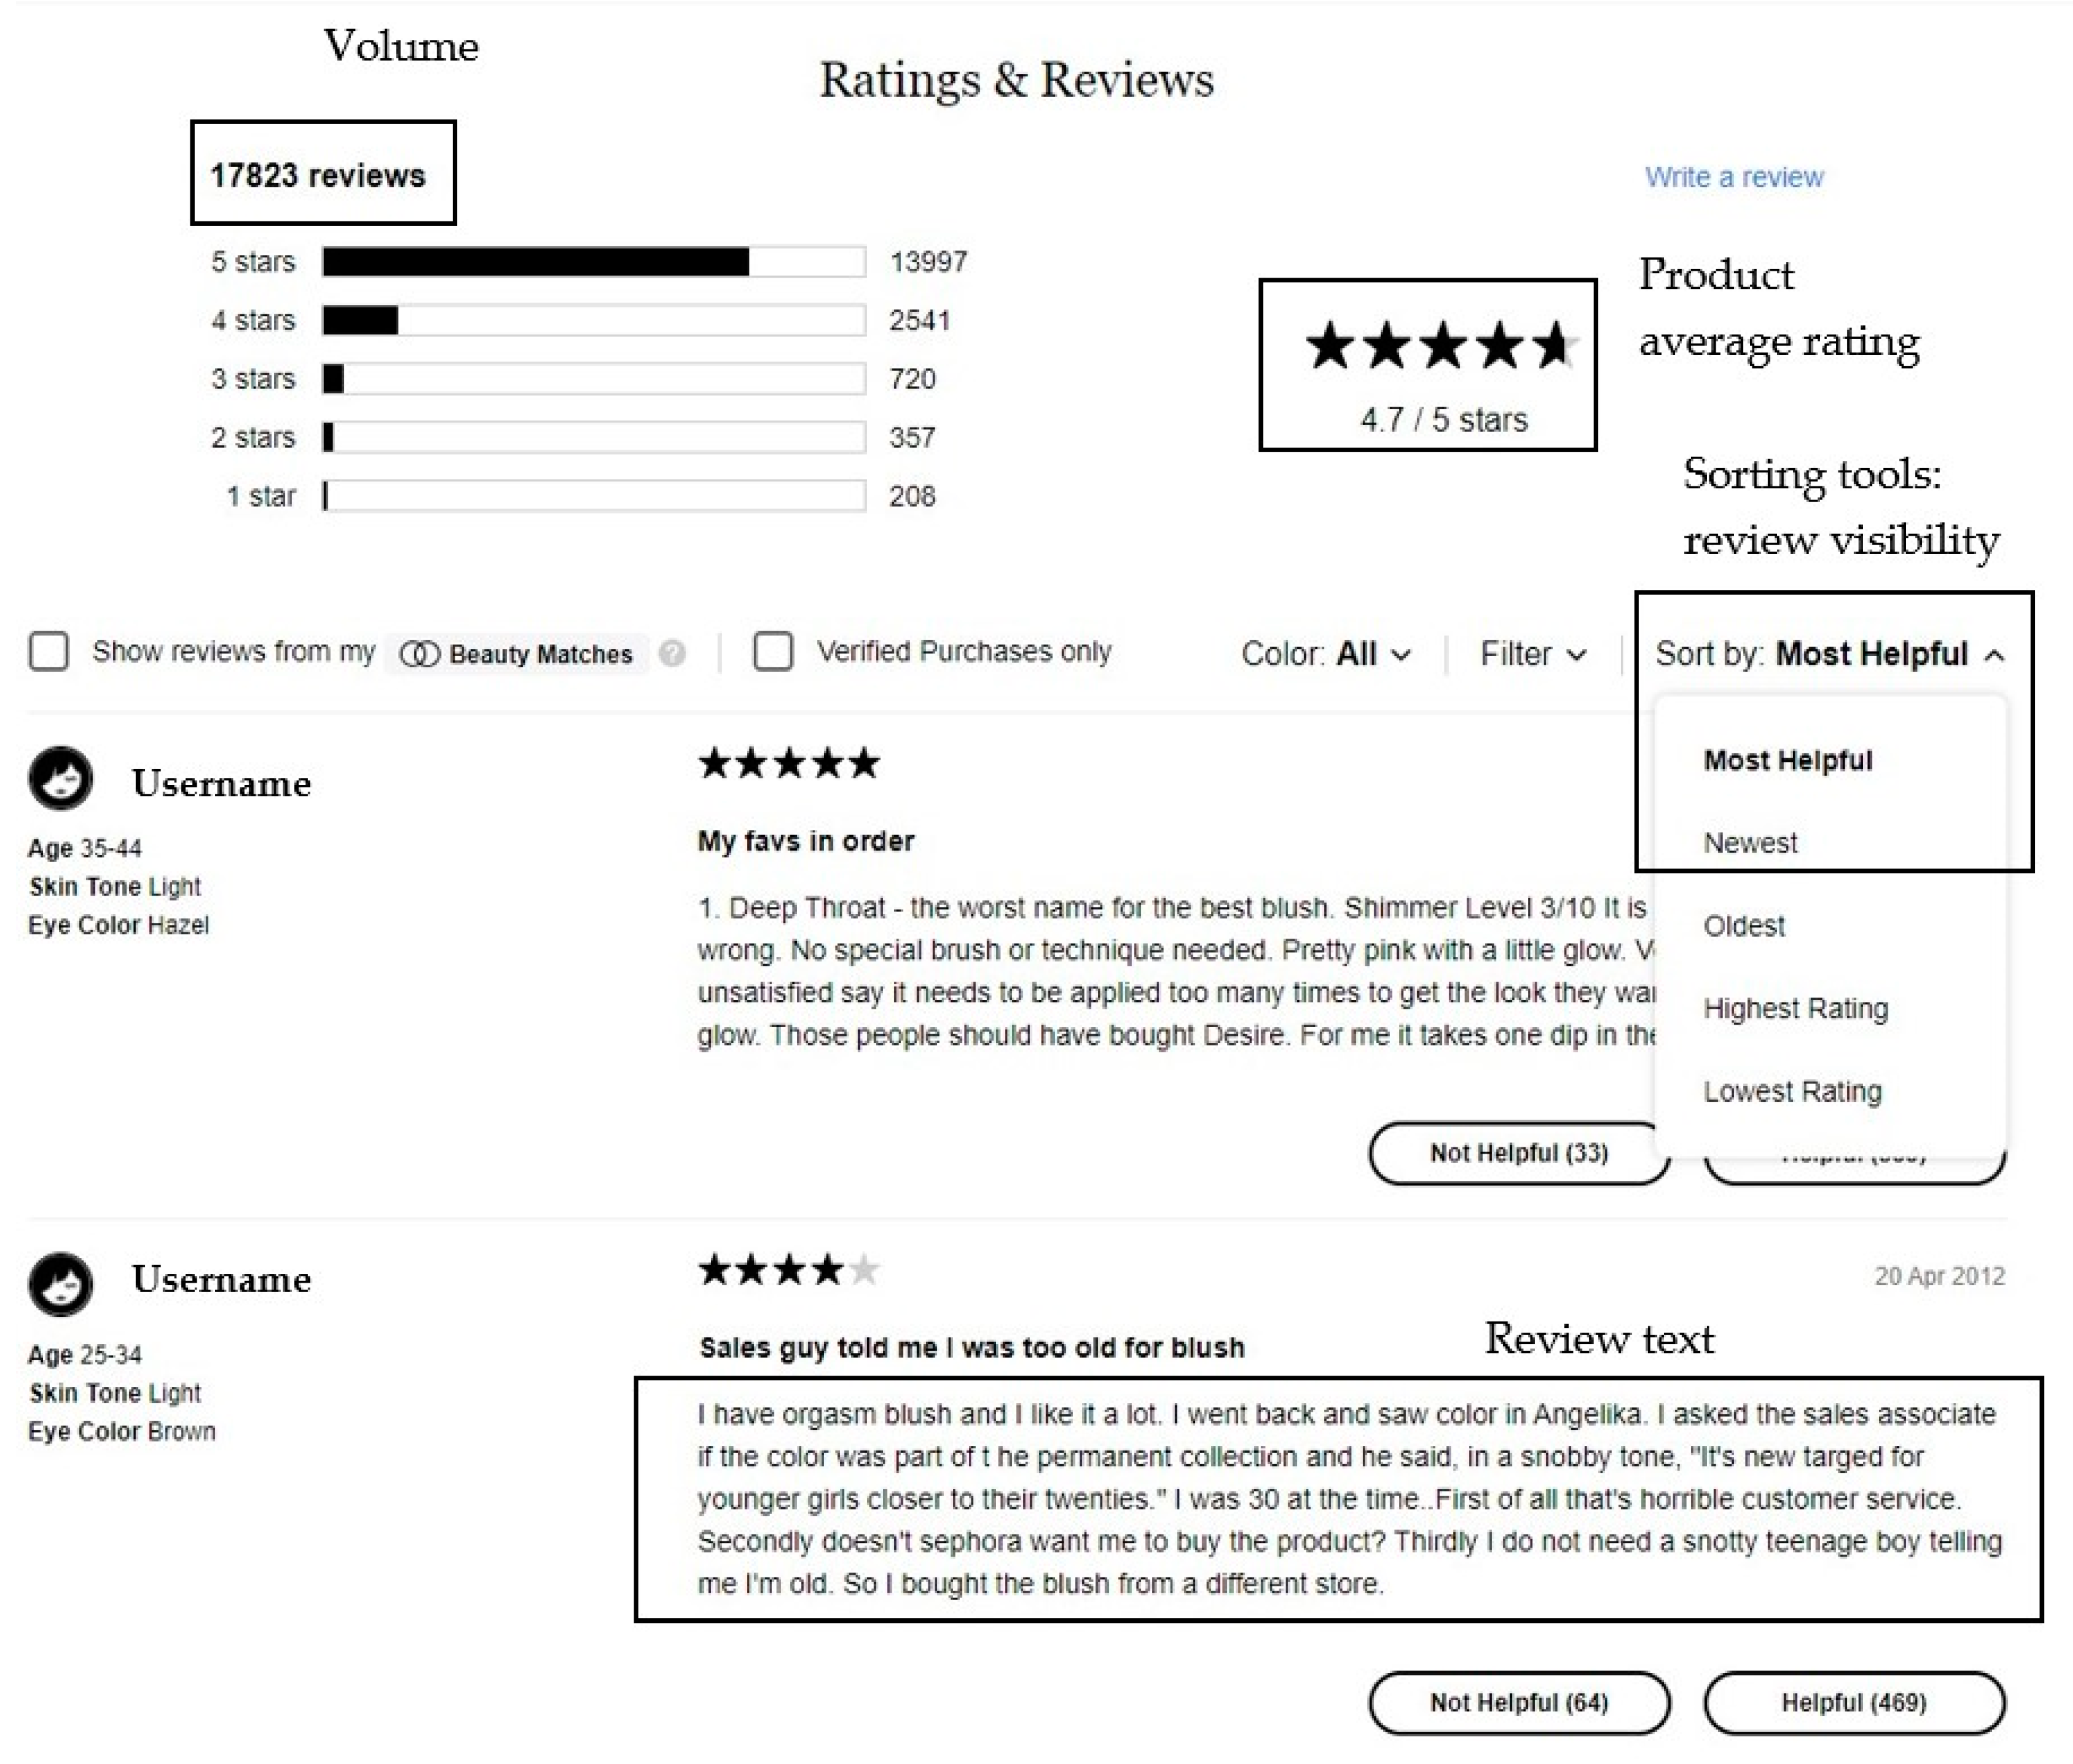
To carry out our research, we collected online consumer reviews from the product category of blush from a popular US cosmetics retailer website, which was placed in the top 50 shopping sites in the US in March 2017 according to Alexa.com. The data was obtained using web-scraping, so a robot was designed to collect the data of interest from the online retailer website. Using web-scraping, the data was stored in a structured format in Excel spreadsheets. Then, the databases were imported to R to conduct the empirical analysis. Figure 2 shows an example of the review information collected from the online retailer for each product. In addition to review-related information, other product information was gathered from the online retailer: brand name, product price, product size, product bestselling ranking, if the product was labeled as “new” and if the product was labeled as “exclusive”. Brand-related information was gathered from external sources: brand number of followers on Instagram [97], brand market share [98], and if the brand is in the category of premium brands [98]. Variables are described in Table 1.
To carry out the empirical analysis, we gathered data in a weekly basis over nine weeks between 21 December 2016 and 17 February 2017. First, we decided to select a relatively small period to ensure that environmental and market factors did not change too much, which allowed us to control for endogeneity, as well as possible in our empirical models. Second, the online retailer made some slight changes in the website design from the 17 February 2017 onwards, so our web-scrapping robot was able to collect complete data until those changes were made. To make sure that a nine-week period was adequate for our empirical research, we consulted some econometric professors, who found the period appropriate for our analyses. Only those products available at the online retailer each of the nine weeks were used to build the panel, resulting in a balanced panel of 119 products and 1071 observations. On each date, we collected between 63,000 and 66,000 online reviews for the whole blush category (cumulative number of reviews of each product at each date), and we had two levels of information: Review-level information and product-level information. Since we were working with a panel of products, review information had to be aggregated to product-level variables. To aggregate review information, we considered the three review visibility cases, shown in the conceptual model in Figure 1.
In the cosmetics industry, sales usually show a seasonality pattern. As revealed by Nielsen [99], some categories of cosmetics, such as perfumes and sun cream, are very seasonal. However, blush can be considered a low seasonal cosmetics category, since these products are usually bought for personal and regular use over the year [99]. Therefore, products in our panel are less likely to be influenced by seasonality patterns not recorded in our database.
3.2. Research Variables
Table 1 shows a description of the research variables considered in this study. We have two sets of explanatory variables. First, independent variables, which are directly related to the diagnosticity of online reviews, such as ln_rating and ln_analytic. Second, control variables, including product features, such as ln_price and ln_size, and brand features, such as ln_brand_followers. Following extant research [27,100], we log-transformed every non-binary variable to smooth the distribution of the variables in the regression and to avoid distorting the estimation by outliers. In this way, estimated coefficients directly represent the elasticity of the variables. In the case of those variables that have zero values, we log-transformed the variables after adding the value of one.
3.2.1. Dependent Variable
The dependent variable in our study is the multiplicative inverse of the sales rank of the product, which is a proxy of product sales. We do not have information about actual product sales, but the online retailer shows a sales rank for each product category, which represents a snapshot of sales (units of product sold) for up to a week. The product sales rank is inversely related to its sales, which means that the first product in the sales rank in a specific product category is the one with the highest sales (in units) during the previous week. On the other hand, high sales ranks values represent lower sales. According to Chevalier and Goolsbee [41], the relationship between the actual volume of sales and the sales rank in Amazon.com is ln(sales) = β0 − β1 × ln(sales_rank), which makes the relationship between ln(sales) and ln(sales_rank) approximately linear. Since sales rank is a log-linear function of sales with a negative slope, we adopt ln_sales_rank_inverse as our dependent variable.
3.2.2. Independent Variables
Every review non-textual and textual variable ln_rating, ln_rating_inconsistency, ln_analytic, ln_authentic, and ln_clout was aggregated to a product level (i) on each specific date (t) depending on the review visibility case (v) to estimate the model in Equation (2). The formula followed to aggregate review variables for each product is as follows:
In Equation (1), Xivt is the product-aggregate variable, Xrt is the review-level variable to be aggregated, r = 1,…, R are the reviews of the product I and w is the review visibility weight based on the review visibility case v: (v1) we assume all reviews have the same probability of being viewed, (v2) we assume consumers sort online reviews by most helpful, so most helpful reviews are more likely to be viewed, (v3) we assume consumers sort online reviews by most recent, so more recent reviews are more likely to be viewed. Volumeit is already an aggregate variable that is not influenced by the review visibility case, since it captures the cumulative number of online reviews for each product at each date. The variable ln_volume is not affected by the review visibility case because it represents the cumulative number of reviews for each product (i) at each date (t).
In case 1, variables were aggregated in the same way as previous literature does, by giving each online review the same probability of being viewed and therefore, the same relative weight when aggregating them at a product level. For example, the product average rating resulting from case 1 is the same as the one provided by the online retailer, since it is the average of every individual review rating for each product. In case 2, review information was aggregated considering the rank order of each individual online review when sorting reviews for each product by the criterion of most helpful. Finally, in case 3, review information was aggregated considering the rank order of each individual online review for each product according to the most recent criterion, which was the predetermined sorting criterion used by the online retailer when data was collected.
In cases 2 and 3, we incorporate the effect of review visibility, which captures the rank order of online reviews when sorting by most helpful and by most recent, respectively. To compute the rank order of online reviews at each case, the approach proposed by Godes and Silva [101] was followed. For example, the following formula was applied to build the rank order of online reviews when sorting by the most recent criterion. Let’s d’ represent the publication date of review r. For each d’, it was formed Sd’ ≡ {r: dr = d’}, which represents the set of reviews for which dr = d’. Then, the variable order was operationalized as order (d´) ≡, where N(Sd) is the cardinality of set Sd. This method assigns the same order to every review with the same publication date. For the rest of the reviews, the order is always 1 plus the number of reviews with more recent publication dates [101]. The same process was followed to order reviews when sorting by most helpful. In this case, for those reviews of the same product sharing the same number of helpful votes, the most recent publication date was the second ordering mechanism at the website, so it was the second ordering criterion used to build the variable order.
In review visibility cases 2 (v2) and 3 (v3), we considered two approaches to build the aggregated review variables. In the first approach (v2.1 and v3.1), we assumed that online reviews have a decreasing probability of being viewed by consumers based on each rank order, order by most helpful in case 2, and order by most recent in case 3. In this first approach, the review visibility weight was operationalized as: w = 1/order. In the second approach (v2.2 and v3.2), we assumed that consumers just read the first five online reviews when sorting by each criterion, because five is the number of online reviews displayed on the first page of the studied cosmetics online retailer when sorting by each criterion. In this case, a weight (w) of 1 was assigned to each of the five first reviews, while the rest of the reviews were given a weight (w) of 0.
Table 2 reports an example to illustrate how we built the ln_rating variable for a product that has a total of 10 online reviews when considering review visibility case 1(v1), where all reviews have the same probability of being viewed, and review visibility case 2 (v2), where most helpful visibility is considered. The example shows the two different weighting approaches used (all the reviews have a decreasing probability of being viewed; only the top five most helpful reviews are viewed). The same process was followed to aggregate review variables in review visibility case v3 (most recent visibility considered). As shown in Table 2, the final product-aggregated variable ln_rating is slightly different at each review visibility case.
3.2.3. Control Variables
Following previous literature, we incorporate to our empirical analysis some variables not related to online reviews to control for the possible effect of products, brands, and time features on product sales [10,12,102,103]. To control for some time features, we include the variable christmas, which is a dummy variable that captures if the collection date is within Christmas. In this way, we want to capture any effect that Christmas might have on specific products of the category.
In terms of product characteristics, we use information about every product feature provided by the online retailer: Price, size, if the product was labeled as “new” and if it was labeled as “exclusive”. The incorporation of product attributes as controls in our model is based on Decker and Trusov [104], who studied consumer preferences from online reviews incorporating the effect of product attributes. In our research, product attributes are adapted to the cosmetics category. The “new” label at the online retailer means either that the product has recently been added to the shopping category or that a new color has been launched for the product. The “exclusive” label means that the product is exclusively sold at the online retailer and at the brand website itself, but consumers cannot buy it at other retailers. We also include the variable ln_price, since the price has been considered as the top attraction for online shoppers [105]. The variable ln_size records the size in grams of the product, and it might be an important product feature in our cosmetics category.
Brands also play an important role in a cosmetics scenario, so we incorporate several variables that control for brands’ characteristics [79]. The variable brand_retailer is a dummy that captures if the product is from the retailer’s private brand. The variable ln_brand_followers records the cumulative number of followers of the brand at Instagram on each date. The number of followers was collected from Socialblade.com. The variable brand_top is a dummy that records if the brand was in the top 10 bestselling brands in the facial make-up category in the US in 2016 [98]. This variable was built to differentiate between strong and weak brands in the whole US market in terms of annual sales in the US in 2016 [98]. The variable brand_premium is a dummy that records if the brand was in the “premium” segment of color cosmetics in the US in 2016 [98]. We included this variable because the annual report from Euromonitor International [98] revealed that the sales of premium color cosmetics brands increased a lot in 2016 with respect to those of mass brands.
3.3. Empirical Model and Estimation
We model the sales equation as follows:
In Equation (2), i represents the product, t represents the time, and v is the review visibility case. The model is independently estimated for each of the review visibility cases. Review variables (ln_rating, ln_rating_inconsistency, ln_analytic, ln_authentic, and ln_clout) differ among review visibility cases, since their aggregation to product-level variables depend on the weighting given to each review based on its visibility. However, neither ln_volume nor control variables (new, exclusive, ln_price, ln_size, brand_retailer, ln_brand_followers, top_brand, and brand_premium) depend on review visibility, since these variables are already at a product-level.
As revealed in previous literature, endogeneity should be considered when exploring the influence of online reviews on product sales because not accounting for it could bias the results [10,40,106]. As in previous papers, endogeneity is an issue in our study, due to several reasons. First, there might be reverse causality between the volume of online reviews and the sales rank of a product, which is our dependent variable. Volume is a variable that represents the interest generated by a product, and it has usually been proved to impact product sales. However, product sales might also impact the number of reviews that products receive, since, as claimed by Hennig-Thurau and Wiertz [13], “success breeds success”. Another important source of endogeneity in our model is the presence of unobserved variables associated with the product and the environment, that can make the regressor to be correlated with the error structure. For example, product promotion strategies are not contemplated in our data and could influence the sales of the product on specific dates. Although we include some control variables trying to account for some product and environmental factors, there might be other unobserved ones that could bias our estimations. Another important issue in our model is the dynamic component of the dependent variable since past sales ranks of the product might influence the current sales rank. Again, “success breeds success” and being in top positions in the bestsellers list might lead to continuing in those top positions, due to a social influence effect [13,56,107].
Considering the panel structure of our data, to account for the dynamic effect of the dependent variable and to be able to correct for endogeneity, we estimate the model using panel data methodology, specifically the system generalized method of moments (system GMM) estimator, pioneered by Arellano and Bover [108] and Blundell and Bond [109]. The system GMM estimator has some advantages over other estimators, such as the ordinary least square (OLS) estimator [110,111]. First, it allows us to control for the individual effect or unobserved heterogeneity, such as the product quality, which might influence the sales of products. By modeling it as individual effects, ηi we can control this heterogeneity in products to avoid biased results. In this line, the error term in our model, εit, is divided into three components: The individual effect, ηi; the time dummies, dt, which allow us to control for the effect of macroeconomic variables on product sales; and the random disturbance, νi. Besides, the system GMM estimator aids to reduce the endogeneity problem. Endogeneity implies that the error term is correlated with some of the explanatory variables, and this correlation violates one of the main assumptions of OLS estimator. This correlation usually occurs, due to two reasons: (1) When important variables are omitted from the model, also called “omitted variable bias” and (2) when the dependent variable is a predictor of the explanatory variable and not only a response to it, referred to as “simultaneity bias” or “reverse causality”. As happens in many studies, many of the explanatory variables may suffer from the endogeneity problem. To deal with this problem, Instrumental Variables (IV) models, such as the Two Stage Least Squares (2SLS) and Three Stage Least Squares (3SLS), have been widely used in previous literature [25,100,112]. However, finding instrumental variables that meet the two conditions required for instruments is very difficult, since they should be correlated with the endogenous explanatory variable, but uncorrelated with the error term of the model. To solve the issue, the GMM estimator provides the solution of using the lagged values of the explanatory variables as instruments for the endogenous variables, since these lags are highly correlated with the regressors that they instrument. Two different GMM estimators can be used, the difference GMM [113] and the system GMM [108,109]. However, the difference GMM suffers the problem of weak instruments, so we use in this research the system GMM, which overcomes that problem. To employ the system GMM procedure, we should indicate those explanatory variables that are likely to be endogenous in our model. We have considered that every review variable, ln_volume, ln_rating, ln_rating_inconsistency, ln_analytic, ln_authentic, ln_clout, and the variable ln_price, might be endogenous in our model, because they might suffer either from “omitted variable bias” or from “simultaneity bias”. The rest of the variables are treated as exogenous, some of them are specific characteristics of the product and the brand collected from the online retailer website (new, exclusive, ln_size, and brand_retailer), and others are brand-specific features collected from external sources (brand_top and brand_premium). In the system GMM model, we estimate two equations: Equation in differences, in which the instruments are the right-hand-side variables in levels, and equation in levels, where the instruments are the right-hand-side variables in differences. To estimate the system GMM model, we used the package xtabond2 in Stata, following Roodman [114]. We transformed to logarithms all the non-binary variables to avoid distorting the estimation by outliers [13]. Besides, all the non-binary variables were standardized to reduce the multicollinearity that might arise in a model with interaction terms [115].
4. Results
4.1. Descriptive Statistics
Table 3 reports the descriptive statistics of the variables used in the research. For a better interpretation, we use the original variables instead of the log-transformed variables. As far as review aggregated variables are concerned, we show in the table the descriptive statistics for each of the review visibility cases. We can observe that descriptive statistics change depending on the review visibility case.
4.2. Model Findings
Table 4 shows the output of the system GMM regression. Five models are presented depending on the case of review visibility assumed and on the weighting approach followed.
We observe that review non-textual and textual variables are significant in every model: ln_volume, ln_rating, ln_rating_inconsistency, ln_analytic, ln_authentic, and ln_clout. The interaction term ln_rating x ln_rating_inconsistency is also significant in every model, so H1a and H1b are supported. Therefore, both review non-textual and textual features influence product sales not only in the traditional case of review visibility (case 1), where every review is assumed to have the same probability of being viewed, but also in the rest of cases (cases 2 and 3), where we assume that consumers sort online reviews either by the most helpful mechanism (case 2) or by the most recent mechanism (case 3).
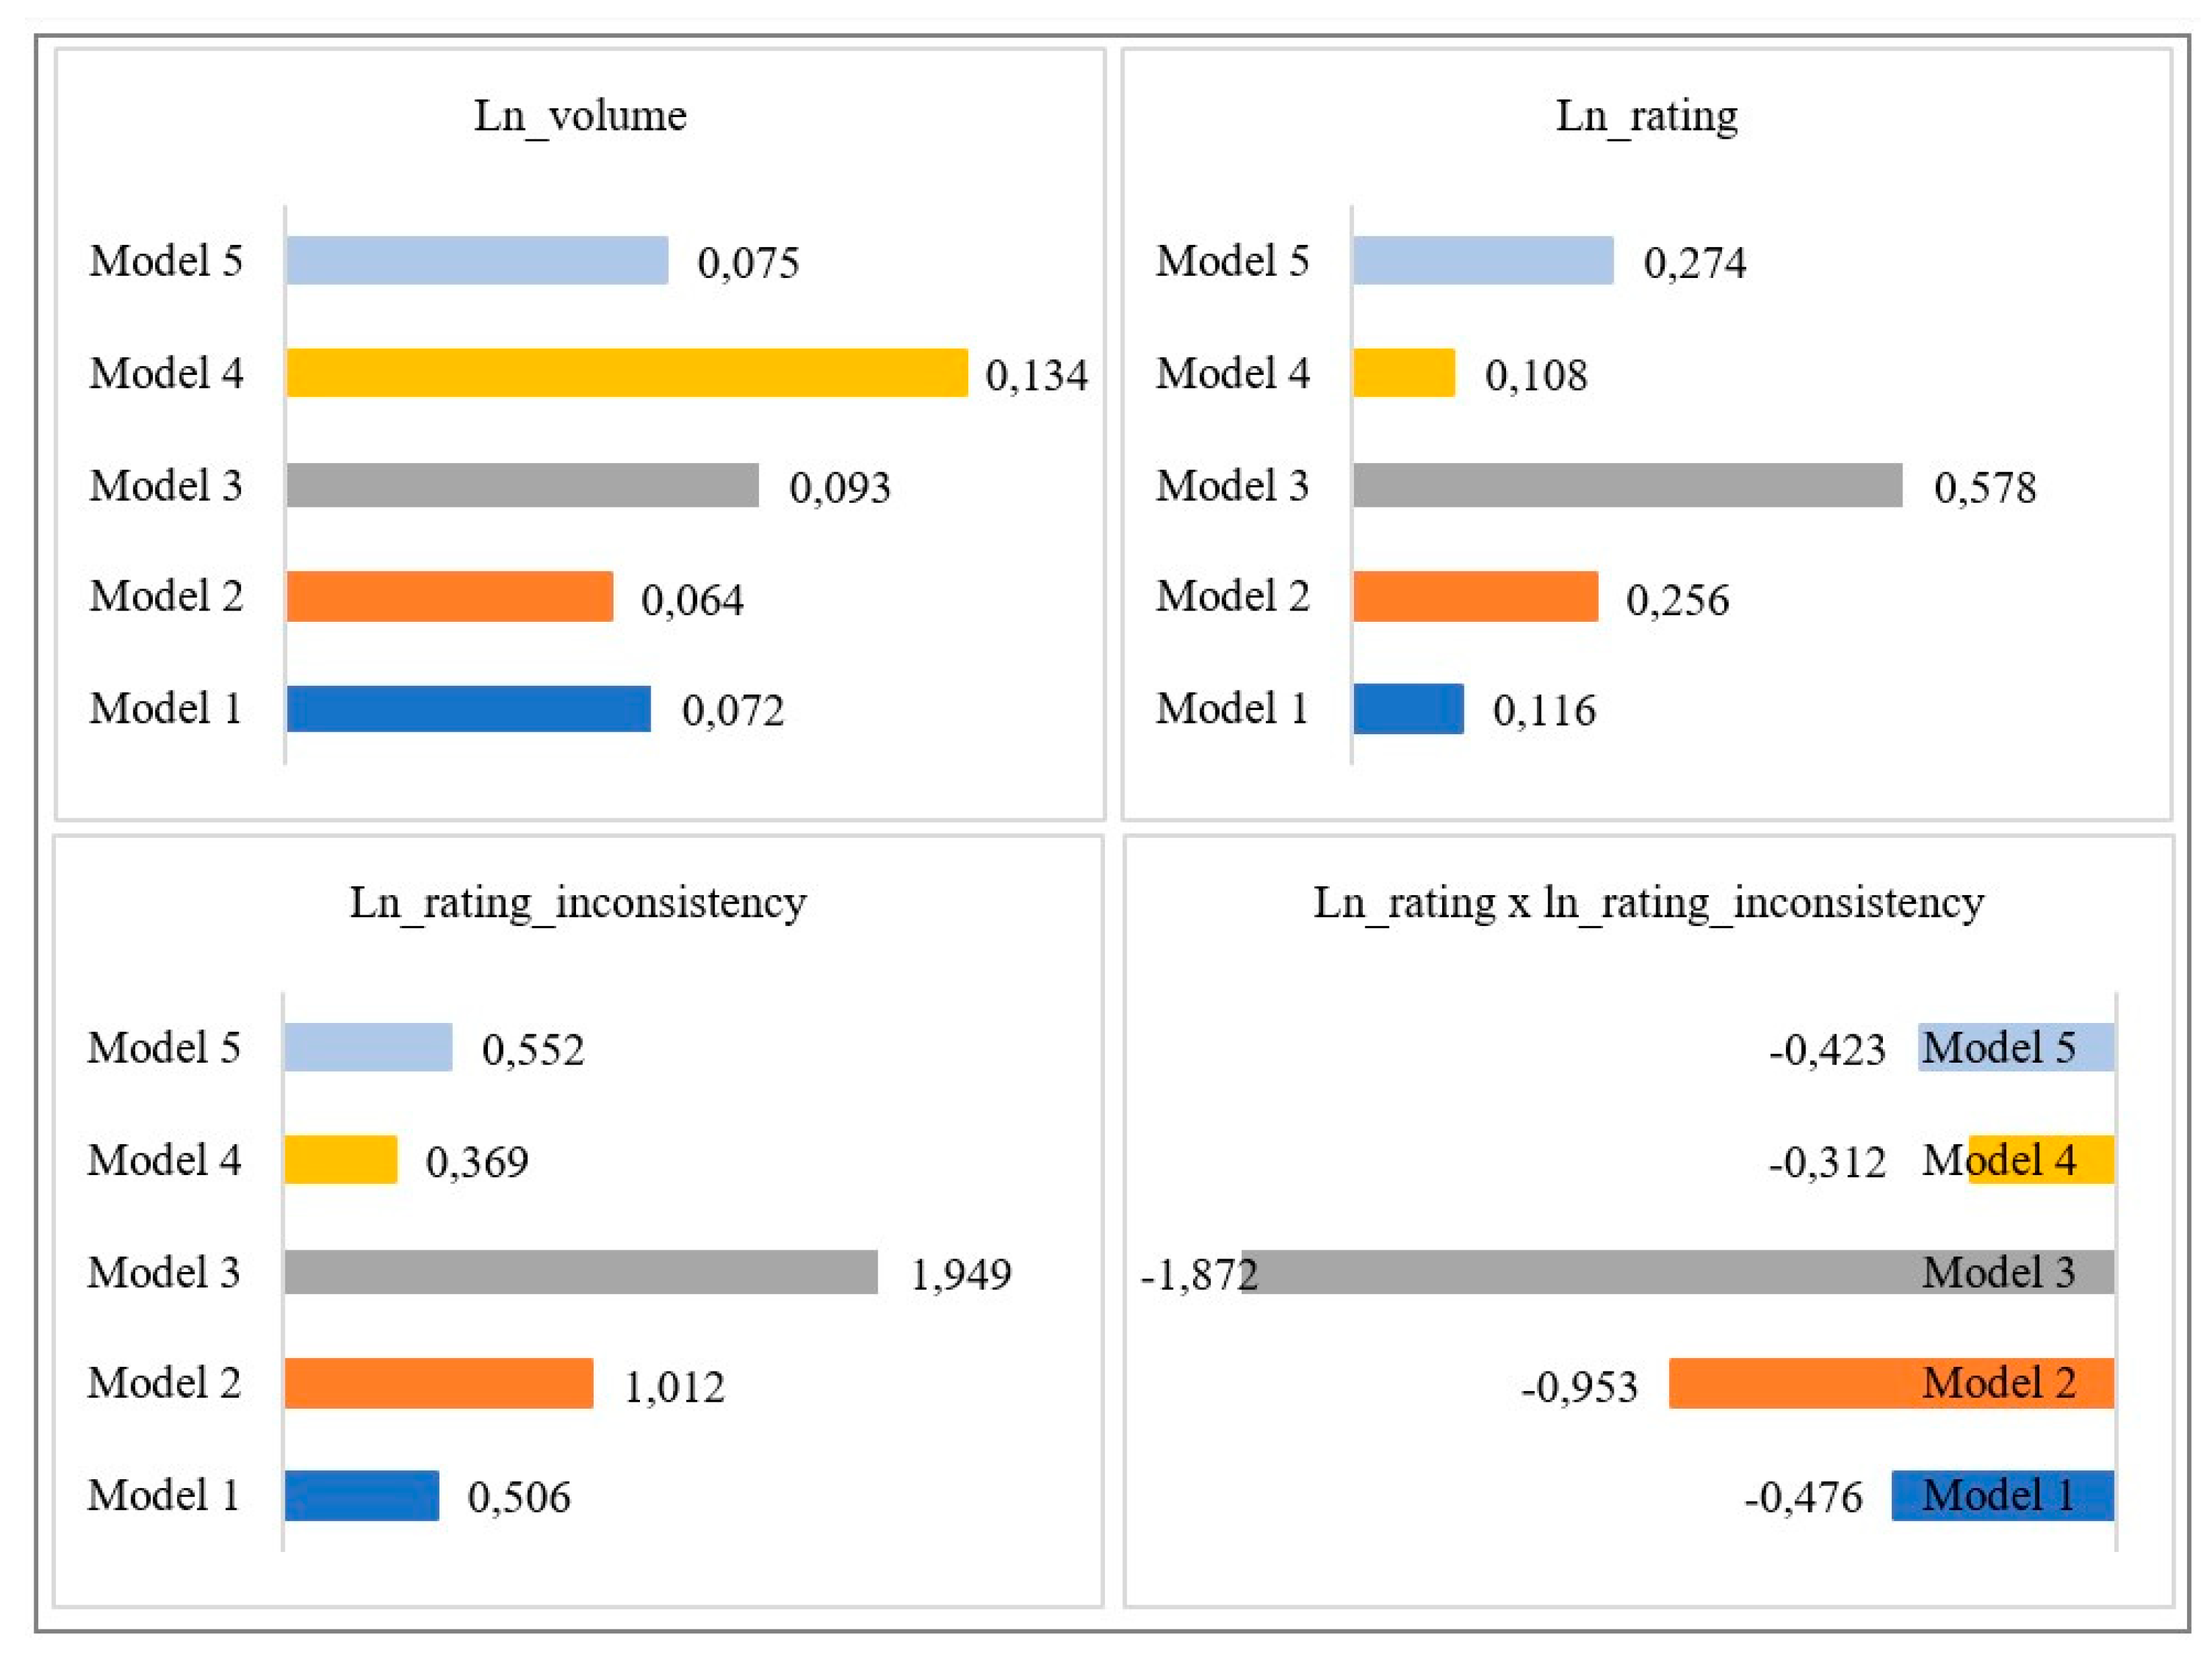
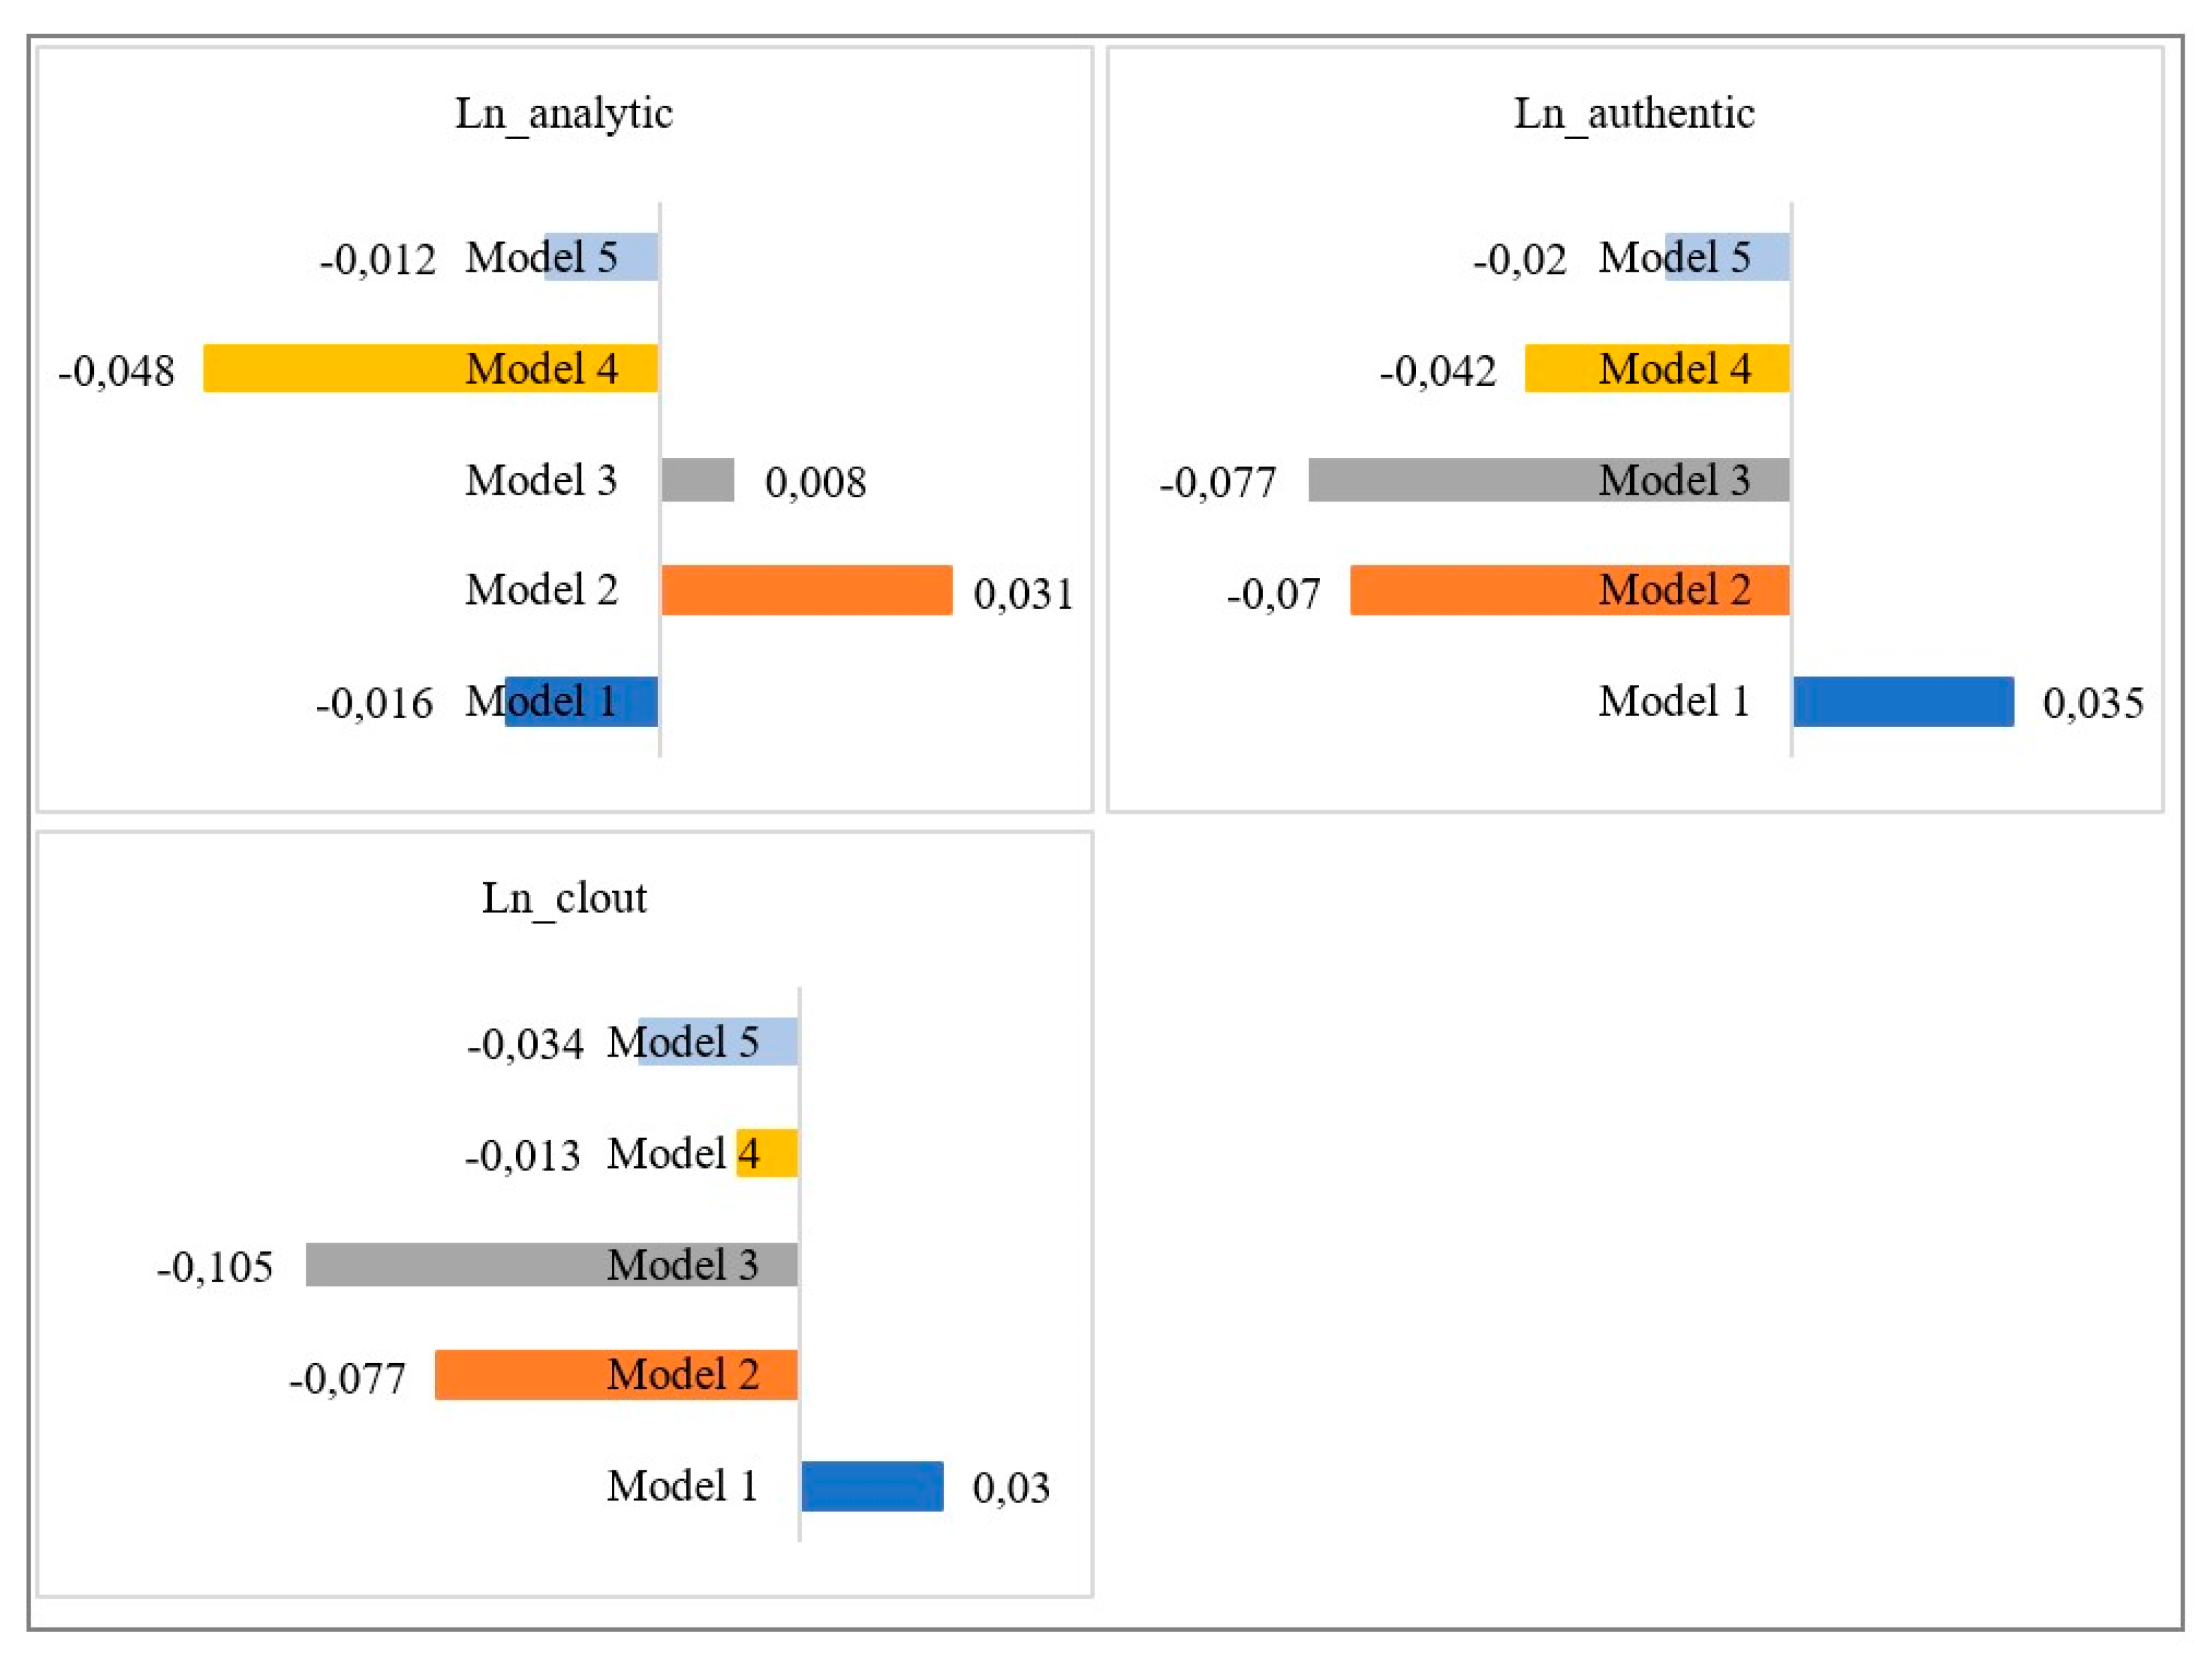
To test H2a and H2b, we should look at the possible differences between review variables coefficients among models. To graphically show the results from models 1 to 5, we represent in Figure 3 and Figure 4 the review non-textual and textual variables coefficients, respectively, in the different models. As far as H2a is concerned, we observe that the coefficient sign of review non-textual variables is the same in every model, while the magnitude changes among models. Therefore, we can support H2a because we observe differences among review visibility cases. H2b is also supported, since the coefficient magnitude, and even the sign, of review textual variables differs among review visibility cases. In fact, we find bigger differences between review visibility cases when dealing with review textual variables.
Differences between review visibility cases have been further explored. First, we observe that when we compare between the two approaches of review visibility within the same case (Model 2 vs. Model 3, and Model 4 vs. Model 5), the approach where we assume that consumers view either the top five most helpful or the top five most recent online reviews (Model 3 and Model 5, respectively) has greater review variable coefficients than those in the approach where we assume consumers view every online review in a decreasing order when sorting either by most helpful or by most recent (Model 2 and Model 4, respectively). These findings might suggest that review features of the top five ranked online reviews (either top five most helpful or top five most recent) have a stronger influence on consumer purchase decisions. Second, we also notice that review variables coefficients are higher in case 2 than in case 3. Therefore, this might indicate that information contained in most helpful online reviews is likely to have a greater impact on consumer purchasing behavior than the information in most recent online reviews. A possible explanation is that consumers might experience a “wisdom of the crowd” effect when they evaluate the most helpful online reviews [56]. This effect refers to the fact that consumers might believe that, since many other consumers have voted the information contained in those reviews as helpful, that information about the product might be a better approximation to the truth, so consumers are more likely to rely on it when making a purchase. Moreover, if we look at case 2, we observe that coefficients are bigger in Model 3 than in Model 2, which might indicate that those top five online reviews have a strong influence on consumers’ purchase behavior. This influence is greater than if we consider every individual online review with its corresponding visibility probability, represented by Model 2. Therefore, these findings might not only suggest that most helpful reviews are more influential than most recent reviews, but also that those online reviews placed on the first page of online reviews of each product have even a greater impact in consumers’ purchase behavior.
Overall, we could say that if we just considered Model 1, in which we assume all reviews have the same probability of being viewed (approach traditionally used in previous literature), we could get to misleading conclusions because the strength, and even the sign, of some effects, is not the same as it is in the other review visibility cases. For example, the coefficient of ln_rating is δ = 0.116 in Model 1, while it is δ = 0.578 in Model 3. Therefore, we observe that the product average rating has a higher impact when we assume that consumers read the top five most helpful reviews of each product. In other words, this might indicate that the impact of the average rating of the five most helpful online reviews is greater than the impact of the overall product average rating of the product. In this line, another pattern we observe is that the effect of the review non-textual variables, ln_rating and ln_rating_inconsistency, and also the interaction term ln_rating x ln_rating_inconsistency is greater (they have a higher coefficient) when we assume that consumers evaluate either the top five most helpful reviews (v2.2) or the top five most recent reviews (v3.2), than when we assume that consumers evaluate every online review following either the most helpful (v2.1) or the most recent rank order (v3.1). However, we cannot observe this pattern in the case of review textual variables.
Concerning the variable l1_ln_sales_rank_inverse, it is positive and significant in every model, which means that the bestselling rank of the previous week positively impacts the bestselling rank of the current week. This confirms the dynamic behavior of the dependent variable in our model. Besides, this finding is even more relevant in our context, where consumers are likely to be influenced by a social influence effect when they are choosing between products within a category. Since consumers believe that many people have bought those products in top positions in the bestselling list, they are likely to continue buying those products, due to the social influence effect [12,59,112]. The variable ln_volume is always positive and significant, so the higher number of online reviews of a product, the more likely the product is in top positions of the bestselling rank. Coefficients for l1_ln_sales_rank_inverse and ln_volume are quite steady amongst models, so it might indicate that the effect of those variables on the sales rank does not depend much on the different cases of review visibility.
Ln_rating is also positive and significant in each model. Therefore, the better the product average rating, the better the bestselling position of the product. This means that regardless of the case of review visibility, the average rating always has a positive impact on the bestselling rank. However, we observe bigger differences in terms of coefficients magnitude. Ln_rating has a stronger impact when it is built considering the most helpful visibility of online reviews (case 2). Therefore, the higher the average rating of most helpful online reviews, the stronger the positive effect of ln_rating on the bestselling rank. It means that when the average rating of those reviews in top positions when sorting by the most helpful criterion is high, it has a greater positive impact on the bestselling ranking. This finding makes sense because it implies that those online reviews in top positions by the most helpful ranking are not only positive (high stars rating), but also, they have been voted as helpful by other consumers, which means that many other consumers have found the information provided by the review useful or diagnostic. On the other hand, the effect of ln_rating when considering review visibility by most recent (v3.1 and v3.2) is also significant, but it is smaller than in case 2. Thus, the product average rating of the most recent online reviews also has a positive effect on the bestselling rank, but the effect is smaller than the one of the most helpful reviews. A possible explanation is that the date itself does not provide any extra information for consumers about the usefulness or diagnosticity of online reviews—it just means that the review has been recently published. However, the number of helpful votes is, by itself, rich information provided by online reviews.
The effect of ln_rating_inconsistency is positive and significant in every model. It means that the higher the difference between each individual review rating and the product average rating, the better the impact on the bestselling rank. Thus, it might be good for products to have online reviews whose ratings are different from the product average rating. This might indicate that those products that have more “extreme” online reviews, are more likely to be in better bestselling positions. A possible reason is that, since most online reviews at the online retailer are very positive (5-star online reviews), it is good for the product to have also negative online reviews. In this way, consumers can know both the positive and negative features of the product. Being aware of both the positive and negative information makes consumers have a better attitude towards the product because they might believe they have more real information than if they have only positive or only negative information. If we compare among models, there are also differences in the magnitude of coefficients. Again, the effect of ln_rating_inconsistency is stronger when we assume that online reviews are sorted by the most helpful criterion (case 2) rather than the most recent criterion (case 3). This might indicate that the presence of both the positive and negative online reviews in top positions of the most helpful ranking has a greater positive impact on the product bestselling ranking. As in the case of the ln_rating, being in top positions in the most helpful rank means that many other consumers have found the information of that online reviews useful or diagnostic. So, both, positive and negative reviews in top positions of that ranking have been useful for consumers, and therefore, prospective consumers find that information more trustworthy and closer to reality. If we had just looked at case 1, we would think that the effect is much stronger than it is when we consider review visibility.
We have also incorporated to the model an interaction term between ln_rating and ln_rating_inconsistency. We observe that in every model the interaction term is negative and significant. This indicates that the effect of ln_rating on ln_sales_rank_inverse is mitigated by ln_rating_inconsistency. In other words, when there is a high difference between individual review ratings, and the product average rating, the effect of the product average rating on the product bestselling rank is reduced. Thus, the presence of “extreme” online reviews makes the ln_rating itself to be less influential on the product bestselling rank. As in previous cases, this relationship is stronger in case 2 than in case 3. Therefore, when the presence of “extreme” reviews in the top most helpful ranking is high, the effect of the average rating of those most helpful online reviews on the product bestselling rank is smaller.
Finally, we observe that the effect of the review textual variables ln_analytic, ln_authentic, and ln_clout is significant in every model, but there are some differences in both sign and magnitude. Ln_analytic has a negative impact in case 1 and case 3, while it is positive in case 2. Having more organized, logical, and hierarchical written online reviews is positive when we are in case 2, where consumers evaluate online reviews based on the most helpful criterion. However, this feature of online reviews has a negative impact on sales when we are in case 1, when we assume that all reviews have the same visibility, and in case 3, when we assume that consumers evaluate online reviews based on the most recent criterion. Thus, we might think that consumer decision-making changes depending on the set of online reviews they view and evaluate. Ln_authentic, and ln_clout positively influence product sales in case 1, but they both have a significant and negative coefficient in the rest of the models. Therefore, if only Model 1 was evaluated, which is the one traditionally used, we might think that first, products with more personal and humble online reviews (high values in ln_authentic) and second, products with online reviews showing high reviewer confidence and leadership (high values in ln_clout) are more likely to be sold. However, we observe the opposite effect if we consider the other review visibility cases. When we assume that all reviews do not have the same probability of being viewed and consumers evaluate reviews based on either the most helpful or more recent criterion, we observe that both ln_authentic and ln_clout negatively influence product sales.
Overall, we observe that just considering one review visibility case (case 1) might lead to biased conclusions, since Model 1′s output differs from the rest of the models. To get a broader picture of the effect of online reviews on product sales, several cases of review visibility should be explored.
4.3. Misspecification Tests and Alternative Panel Data Models
Four misspecifications tests are conducted to check the validity of the models and are reported in Table 5. First, two Wald tests of the joint significance of the reported coefficients (z1) and time dummy variables (z2) are reported, with degrees of freedom in parentheses. The null hypothesis for z1 claims no relationship between the explanatory variables, and the null hypothesis for z2 posit no relationship between time dummy variables. The two Wald tests indicate that there is joint significance of explanatory variables and time dummy variables. Second, the Hansen test verifies the validity of the instruments or, in other words, the lack of correlation between the instruments and the random disturbance of the error term. The null hypothesis is that the instruments are not valid so failure to reject the null hypothesis means that the instruments are valid. We do not reject the null hypothesis, so our instruments are valid. Finally, the AR(2) test [113] was conducted to test the lack of second order serial correlation of the first differenced residuals. The null hypothesis is that the residuals are serially uncorrelated. Therefore, if the null hypothesis is not rejected, it provides evidence that there is no second-order serial correlation and the GMM estimator is consistent. The AR (2) tests in our models indicate that we cannot reject the null hypothesis, so there is no second-order serial correlation and the GMM is consistent. Overall, the four tests indicate that the models are well specified.
There is theoretical and empirical evidence that the system GMM is the panel data model that better controls for unobserved heterogeneity and endogeneity of explanatory variables, so it is the one with less estimation bias [110,111,116]. To explore the output of other commonly used panel data models, which do not control for endogeneity, and to compare it to the system GMM results, we have estimated those models for each case of review visibility. Table 5 reports the output of the different panel data models when we consider case v2.1, where we assume consumers sort online reviews by the most helpful order and all reviews have a decreasing probability of being viewed. In column 1, we show the results of the Ordinal Least Squares (OLS) estimator, and columns 2 and 3 report the results of the Fixed Effects (FE) and Random Effects (RE) estimators. Finally, column 4 shows the output of the adopted system GMM estimator. Focusing on review variables, we observe some differences concerning review numeric variables, but not a clear pattern. For example, ln_rating is significant in every model, but not in the FE model, and ln_rating_inconsistency is significant in the FE and system GMM models, but not in the OLS and RE models. We observe a clearer pattern in terms of review text variables, which are only significant in the system GMM model. Thus, we can conclude that not dealing with endogeneity in our analysis might bias the results. We have estimated every model (OLS, FE, RE, and system GMM) for the rest of the review visibility cases (v1, v2.2, v3.1, and v3.2), and overall, results follow the same pattern as in the discussed case v2.1, shown in Table 5. Comparison tables for each review visibility case are shown in Appendix A (Table A1, Table A2, Table A3 and Table A4).
5. Discussion
In this paper, we propose a conceptual framework to explore the impact of online reviews on product sales. The framework incorporates the role of review visibility when exploring the relationship between online reviews and product sales. We develop the model in a cosmetics context by gathering information about products and online reviews from the whole category of “blush” products on a cosmetic’s online retailer over nine weeks. By comparing four models that incorporate different cases of review visibility to a baseline model, which does not consider the effect of review visibility, we demonstrate that the incorporation of review visibility is important because the magnitude of the results is different from one assumption to another.
5.1. Theoretical Contribution
This study makes a major theoretical contribution. The extant literature on online reviews and product sales assumes that when consumers evaluate online reviews to make a purchase decision, all the available for each product have the same probability of being viewed by consumers. However, decision-making theories [18,62] claim that consumers usually suffer from information overload in complex situations, and they are unable to evaluate all available alternatives. Instead, they usually adopt selective processing strategies to reduce the cognitive effort of managing a big volume of information. In this line, information processing theories, such as the accessibility-diagnosticity theory [19], have highlighted that not only the quality and relevancy of the information (diagnosticity), but also its accessibility influences consumer information adoption decisions. Therefore, we add to previous literature the notion of review visibility, which approaches the concept of accessibility in theory. In line with the decision-making theory [18], we explore review visibility under three main assumptions: when every review of a product has the same probability of being viewed; when consumers sort online reviews by the most helpful mechanism, and most helpful online reviews are more likely to be viewed; finally, when consumers sort reviews by the most recent mechanism (predetermined at the online retailer), in the way that most recent online reviews are more likely to be viewed. Our findings are in line with both theories and reveal that the effect of online reviews on product sales varies depending on what reviews consumers view and evaluate. Different sets of online reviews, such as the most helpful reviews and the most recent reviews, might lead to different consumer decisions, since they provide different types of information. Thus, review visibility should be considered somehow when explaining the relationship between online reviews and product sales.
Another important contribution lies in integrating into the study review non-textual variables, which have been widely studied in previous literature, and review textual variables. Although the literature on review textual content is scarce, we corroborate previous findings showing that not only review non-textual variables are significant in explaining product sales, but also those relating directly to the text.
5.2. Managerial Implications
Our findings have some managerial implications. Firstly, this study corroborates previous literature and industry reports that highlight the power of online reviews to influence product sales. We observe that every review variable incorporated into our analysis has an impact on the product bestselling ranking. This impact is significant independent from the review visibility case considered. Moreover, because review variables also influence product sales in cases where we assume consumers sort online reviews either by the most helpful or by the most recent criterion, managers should pay special attention to those online reviews appearing in top positions. The information contained in those online reviews is going to be influential in prospective consumers, so companies could analyze it to improve the current products or to launch new ones.
Considering that consumers use sorting tools to reduce the cognitive effort of managing big amounts of information, managers could incorporate new sorting mechanisms to help consumers in their decision-making. Having more sorting options would make consumers have a better online consumer experience and would lead to higher customer satisfaction. If more sorting tools available, consumers could select online reviews based on the most preferred criterion. For example, sorting tools based on text and reviewer features could be added. In fact, we observe that when we assume that consumers sort online reviews by the most helpful order (v2.2), those online reviews in top positions (those with more helpful votes) have a greater influence on product sales, since those review variables in our empirical model have the biggest coefficient magnitudes. In line with these findings, the online retailer introduced some changes after we collected the data for the research. For example, they do not longer show online reviews by the predetermined criterion of the most recent order, but by the most helpful criterion. This corroborates our finding revealing that most helpful online reviews are likely to be more influential on consumer shopping behavior.
5.3. Limitations and Future Research
This paper explores the relationship between review non-textual and textual variables and product sales in three different review visibility cases. However, future work could expand the research to other review visibility cases, such as when we assume that consumers sort online reviews by the highest rating or by the lowest rating mechanisms.
In this work, we focus on three review textual variables, which are obtained from the dictionary-based tool LIWC [23], to analyze the effect of review text on product sales. Future research could deepen on the study of review textual features and could incorporate other LIWC variables, such as the use of informal language and the specific motivations (e.g., social status and power) evoked by consumers in the text. However, other (more sophisticated) text mining methods based on machine learning algorithms could be used to uncover other relevant textual aspects of online reviews, such as consumer perceptions and brand image. For example, following the line of Ngo-Ye and Sinha [117], we could analyze review texts to study the influence of reviewer engagement characteristics on product sales. Other reviewer non-textual characteristics, such as reviewer expertise, reviewer reputation, and reviewer identity, could also be assessed. We could also use supervised machine learning methods, as proposed by Vermeer et al. [118], to detect satisfied and dissatisfied consumers from online reviews, with the objective of exploring, for example, if online reviews written by satisfied consumers lead to higher sales and those written by dissatisfied consumers drive lower sales. Another interesting stream of research could also study how online reviews, both non-textual and textual features, influence reviewer perceptions of products or brands over time.
We have carried out the analysis with information about one cosmetics category, blush. More product categories could be added to the analysis to compare between them and analyze differences. It would be also interesting to add more weeks to the analysis to have more time information. Moreover, online reviews from other industries, different from cosmetics, could be analyzed to see if the results could be generalized or if they are industry dependent. In terms of dates, we are dealing with a period that includes the Christmas holidays, in which consumers tend to increase their purchases. Even though blush products are not as stational as other cosmetics, such as perfume, other periods of time could be analyzed and compared.
Author Contributions
Conceptualization, methodology, formal analysis, writing—original draft preparation, M.A.; conceptualization, methodology, writing—Review & editing, supervision, M.A.-U.; conceptualization, methodology, writing—Review & editing, supervision, project administration, funding acquisition, J.C. All authors have read and agreed to the published version of the manuscript.
Funding
This work was supported by the Spanish Ministry of Science and Innovation [grant number ECO2015-65393-R].
Informed Consent Statement
Not applicable.
Data Availability Statement
The data that support the findings of this study are available from the corresponding author upon reasonable request.
Conflicts of Interest
The authors declare no conflict of interest.
Appendix A

Table A1.
All reviews—same probability of being viewed (case v1).
| (1) | (2) | (3) | (4) | |
|---|---|---|---|---|
| OLS | FE | RE | System GMM | |
| L1.ln_sales_rank_inverse | 0.918 *** | 0.644 *** | 0.918 *** | 0.919 *** |
| (0.01) | (0.03) | (0.01) | (0.00) | |
| Ln_volume | 0.058 *** | −0.889 ** | 0.058 *** | 0.072 *** |
| (0.01) | (0.28) | (0.01) | (0.01) | |
| Ln_rating | 0.035 | 0.013 | 0.035 | 0.116 *** |
| (0.02) | (0.08) | (0.02) | (0.00) | |
| Ln_rating_inconsistency | 0.081 | 0.614 * | 0.081 | 0.506 *** |
| (0.15) | (0.26) | (0.15) | (0.02) | |
| Ln_rating x ln_rating_inconsistency | −0.064 | −0.594 * | −0.064 | −0.476 *** |
| (0.15) | (0.26) | (0.15) | (0.02) | |
| Ln_analytic | 0.004 | −0.019 | 0.004 | −0.016 *** |
| (0.01) | (0.06) | (0.01) | (0.00) | |
| Ln_authentic | 0.001 | 0.018 | 0.001 | 0.035 *** |
| (0.01) | (0.05) | (0.01) | (0.00) | |
| Ln_clout | −0.001 | −0.041 | −0.001 | 0.030 *** |
| (0.01) | (0.08) | (0.01) | (0.01) | |
| Christmas | 0.011 | −0.005 | 0.011 | −0.003 |
| (0.04) | (0.04) | (0.04) | (0.00) | |
| New | 0.118 * | 0.217 ** | 0.118 ** | 0.100 *** |
| (0.05) | (0.08) | (0.05) | (0.01) | |
| Exclusive | 0.141 *** | 0.959 *** | 0.141 *** | 0.163 *** |
| (0.03) | (0.21) | (0.03) | (0.01) | |
| Ln_price | 0.039 | 0.000 | 0.039 | 0.321 *** |
| (0.03) | (.) | (0.03) | (0.01) | |
| Ln_size | 0.024 | −0.497 | 0.024 | 0.273 *** |
| (0.02) | (1.58) | (0.02) | (0.01) | |
| Brand_retailer | 0.001 | 0.000 | 0.001 | 0.309 *** |
| (0.05) | (.) | (0.05) | (0.02) | |
| Ln_brand_followers | −0.018 | 0.008 | −0.018 | −0.053 *** |
| (0.01) | (0.07) | (0.01) | (0.00) | |
| Brand_top | −0.004 | 0.000 | −0.004 | 0.057** |
| (0.04) | (.) | (0.04) | (0.02) | |
| Brand_premium | 0.038 | 0.000 | 0.038 | 0.013 |
| (0.03) | (.) | (0.03) | (0.01) | |
| Constant | −0.076 | −0.312 *** | −0.076 | −0.078 *** |
| (0.05) | (0.07) | (0.05) | (0.01) | |
| Observations | 944 | 944 | 944 | 944 |
Notes: All time dummies are included, but not reported in the table to save space. All non-binary variables are standardized. Robust standard errors are shown in parenthesis. p < 0.1, * p < 0.05, ** p < 0.01, *** p < 0.001.
Table A2.
Most helpful visibility—five most helpful reviews are viewed (case v2.2).
| (1) | (2) | (3) | (4) | |
|---|---|---|---|---|
| OLS | FE | RE | System GMM | |
| L1.ln_sales_rank_inverse | 0.913 *** | 0.581 *** | 0.913 *** | 0.767 *** |
| (0.01) | (0.02) | (0.01) | (0.00) | |
| Ln_volume | 0.068 *** | −0.037 | 0.068 *** | 0.093 *** |
| (0.01) | (0.27) | (0.01) | (0.01) | |
| Ln_rating | 0.064 ** | 0.138 | 0.064 ** | 0.578 *** |
| (0.02) | (0.09) | (0.02) | (0.01) | |
| Ln_rating_inconsistency | 0.132 ** | 1.799 *** | 0.132 ** | 1.949 *** |
| (0.05) | (0.24) | (0.05) | (0.01) | |
| Ln_rating x ln_rating_inconsistency | −0.136 ** | −1.618 *** | −0.136 ** | −1.872 *** |
| (0.05) | (0.23) | (0.05) | (0.01) | |
| Ln_analytic | −0.009 | −0.126 * | −0.009 | 0.008 * |
| (0.01) | (0.06) | (0.01) | (0.00) | |
| Ln_authentic | 0.019 | −0.053 | 0.019 | −0.077 *** |
| (0.01) | (0.08) | (0.01) | (0.01) | |
| Ln_clout | 0.008 | 0.093 | 0.008 | −0.105 *** |
| (0.01) | (0.05) | (0.01) | (0.00) | |
| Christmas | 0.015 | 0.016 | 0.015 | 0.015 *** |
| (0.04) | (0.03) | (0.04) | (0.00) | |
| New | 0.128 ** | 0.315 *** | 0.128 ** | 0.352 *** |
| (0.05) | (0.08) | (0.05) | (0.01) | |
| Exclusive | 0.146 *** | 0.803 *** | 0.146 *** | 0.280 *** |
| (0.03) | (0.20) | (0.03) | (0.01) | |
| Ln_price | 0.059 * | 0.000 | 0.059 * | 0.060 *** |
| (0.03) | (.) | (0.03) | (0.01) | |
| Ln_size | 0.037 | −0.648 | 0.037 | 0.061 *** |
| (0.02) | (1.49) | (0.02) | (0.01) | |
| Brand_retailer | 0.024 | 0.000 | 0.024 | 0.255 *** |
| (0.05) | (.) | (0.05) | (0.04) | |
| Ln_brand_followers | −0.021 | 0.011 | −0.021 | −0.053 *** |
| (0.01) | (0.06) | (0.01) | (0.01) | |
| Brand_top | 0.001 | 0.000 | 0.001 | −0.011 |
| (0.04) | (.) | (0.04) | (0.03) | |
| Brand_premium | 0.038 | 0.000 | 0.038 | 0.147 *** |
| (0.03) | (.) | (0.03) | (0.02) | |
| Constant | −0.085 | −0.305 *** | −0.085 | −0.200 *** |
| (0.05) | (0.07) | (0.05) | (0.02) | |
| Observations | 944 | 944 | 944 | 944 |
Notes: All time dummies are included, but not reported in the table to save space. All non-binary variables are standardized. Robust standard errors are shown in parenthesis. p < 0.1, * p < 0.05, ** p < 0.01, *** p < 0.001.
Table A3.
Most recent visibility—all reviews, decreasing probability of being viewed (case v3.1).
| (1) | (2) | (3) | (4) | |
|---|---|---|---|---|
| OLS | FE | RE | System GMM | |
| L1.ln_sales_rank_inverse | 0.920 *** | 0.654 *** | 0.920 *** | 0.937 *** |
| (0.01) | (0.02) | (0.01) | (0.00) | |
| Ln_volume | 0.064 *** | −0.827 ** | 0.064 *** | 0.134 *** |
| (0.01) | (0.25) | (0.01) | (0.01) | |
| Ln_rating | 0.046 * | 0.006 | 0.046 * | 0.108 *** |
| (0.02) | (0.04) | (0.02) | (0.01) | |
| Ln_rating_inconsistency | 0.102 | 0.076 | 0.102 | 0.369 *** |
| (0.10) | (0.17) | (0.10) | (0.03) | |
| Ln_rating x ln_rating_inconsistency | −0.083 | −0.057 | −0.083 | −0.312 *** |
| (0.10) | (0.16) | (0.10) | (0.03) | |
| Ln_analytic | 0.003 | −0.012 | 0.003 | −0.048 *** |
| (0.01) | (0.02) | (0.01) | (0.00) | |
| Ln_authentic | −0.022 | −0.025 | −0.022 | −0.042 *** |
| (0.01) | (0.02) | (0.01) | (0.01) | |
| Ln_clout | −0.021 | −0.019 | −0.021 | −0.013 ** |
| (0.01) | (0.02) | (0.01) | (0.00) | |
| Christmas | 0.014 | −0.000 | 0.014 | 0.008 |
| (0.04) | (0.04) | (0.04) | (0.00) | |
| New | 0.099 * | 0.203 * | 0.099 * | 0.017 * |
| (0.04) | (0.08) | (0.04) | (0.01) | |
| Exclusive | 0.142 *** | 0.983 *** | 0.142 *** | 0.145 *** |
| (0.03) | (0.21) | (0.03) | (0.01) | |
| Ln_price | 0.028 | 0.000 | 0.028 | 0.133 *** |
| (0.03) | (.) | (0.03) | (0.01) | |
| Ln_size | 0.014 | −0.154 | 0.014 | 0.108 *** |
| (0.02) | (1.59) | (0.02) | (0.01) | |
| Brand_retailer | −0.006 | 0.000 | −0.006 | 0.159 *** |
| (0.06) | (.) | (0.06) | (0.03) | |
| Ln_brand_followers | −0.014 | 0.015 | −0.014 | −0.068 *** |
| (0.01) | (0.07) | (0.01) | (0.01) | |
| Brand_top | −0.006 | 0.000 | −0.006 | 0.048 |
| (0.04) | (.) | (0.04) | (0.02) | |
| Brand_premium | 0.032 | 0.000 | 0.032 | 0.007 |
| (0.03) | (.) | (0.03) | (0.01) | |
| Constant | −0.076 | −0.324 *** | −0.076 | −0.070 *** |
| (0.05) | (0.07) | (0.05) | (0.01) | |
| Observations | 944 | 944 | 944 | 944 |
Notes: All time dummies are included, but not reported in the table to save space. All non-binary variables are standardized. Robust standard errors are shown in parenthesis. p < 0.1, * p < 0.05, ** p < 0.01, *** p < 0.001.
Table A4.
Most helpful visibility—five most recent reviews are viewed (case v3.2).
| (1) | (2) | (3) | (4) | |
|---|---|---|---|---|
| OLS | FE | RE | System GMM | |
| L1.ln_sales_rank_inverse | 0.920 *** | 0.660 *** | 0.920*** | 0.942 *** |
| (0.01) | (0.03) | (0.01) | (0.00) | |
| Ln_volume | 0.059 *** | −0.823 *** | 0.059 *** | 0.075 *** |
| (0.01) | (0.24) | (0.01) | (0.01) | |
| Ln_rating | 0.087 *** | 0.069 | 0.087 *** | 0.274 *** |
| (0.02) | (0.04) | (0.02) | (0.01) | |
| Ln_rating_inconsistency | 0.179 ** | 0.144 | 0.179 ** | 0.552 *** |
| (0.07) | (0.11) | (0.07) | (0.04) | |
| Ln_rating x ln_rating_inconsistency | −0.152 ** | −0.116 | −0.152 ** | −0.423 *** |
| (0.06) | (0.09) | (0.06) | (0.03) | |
| Ln_analytic | 0.016 | 0.010 | 0.016 | −0.012 ** |
| (0.01) | (0.02) | (0.01) | (0.00) | |
| Ln_authentic | −0.003 | 0.007 | −0.003 | −0.020 ** |
| (0.01) | (0.02) | (0.01) | (0.01) | |
| Ln_clout | −0.016 | 0.004 | −0.016 | −0.034 *** |
| (0.01) | (0.02) | (0.01) | (0.01) | |
| Christmas | 0.014 | 0.000 | 0.014 | 0.005 |
| (0.04) | (0.04) | (0.04) | (0.00) | |
| New | 0.112 * | 0.200 * | 0.112 * | 0.092 *** |
| (0.04) | (0.08) | (0.04) | (0.01) | |
| Exclusive | 0.148 *** | 0.929 *** | 0.148 *** | 0.186 *** |
| (0.03) | (0.21) | (0.03) | (0.02) | |
| Ln_price | 0.033 | 0.000 | 0.033 | 0.033 * |
| (0.02) | (.) | (0.02) | (0.01) | |
| Ln_size | 0.020 | −0.424 | 0.020 | 0.045 *** |
| (0.02) | (1.59) | (0.02) | (0.01) | |
| Brand_retailer | 0.004 | 0.000 | 0.004 | 0.072 * |
| (0.05) | (.) | (0.05) | (0.03) | |
| Ln_brand_followers | −0.016 | 0.014 | −0.016 | −0.057 *** |
| (0.01) | (0.07) | (0.01) | (0.01) | |
| Brand_top | 0.005 | 0.000 | 0.005 | 0.046 * |
| (0.04) | (.) | (0.04) | (0.02) | |
| Brand_premium | 0.040 | 0.000 | 0.040 | 0.058 *** |
| (0.03) | (.) | (0.03) | (0.02) | |
| Constant | −0.080 | −0.307 *** | −0.080 | −0.107 *** |
| (0.05) | (0.07) | (0.05) | (0.01) | |
| Observations | 944 | 944 | 944 | 944 |
Notes: All time dummies are included, but not reported in the table to save space. All non-binary variables are standardized. Robust standard errors are shown in parenthesis. p < 0.1, * p < 0.05, ** p < 0.01, *** p < 0.001.
References
- Mudambi, S.; Schuff, D. What makes a Helpful online Review? MIS Quart. 2010, 28, 695–704. [Google Scholar]
- BrightLocal Local Consumer Review Survey. 2020. Available online: https://www.brightlocal.com/research/local-consumer-review-survey/ (accessed on 22 April 2020).
- Filieri, R.; McLeay, F.; Tsui, B.; Lin, Z. Consumer perceptions of information helpfulness and determinants of purchase intention in online consumer reviews of services. Inf. Manag. 2018, 55, 956–970. [Google Scholar]
- Cyr, D.; Head, M.; Lim, E.; Stibe, A. Using the elaboration likelihood model to examine online persuasion through website design. Inf. Manag. 2018, 55, 807–821. [Google Scholar]
- Khwaja, M.G.; Zaman, U. Configuring the evolving role of ewom on the consumers information adoption. J. Open Innov. Technol. Mark. Complex. 2020, 6, 125. [Google Scholar]
- Park, D.H.; Lee, J. eWOM overload and its effect on consumer behavioral intention depending on consumer involvement. Electron. Commer. Res. Appl. 2008, 7, 386–398. [Google Scholar]
- Jiménez, F.R.; Mendoza, N.A. Too popular to ignore: The influence of online reviews on purchase intentions of search and experience products. J. Interact. Mark. 2013, 27, 226–235. [Google Scholar]
- Kostyk, A.; Niculescu, M.; Leonhardt, J.M. Less is more: Online consumer ratings’ format affects purchase intentions and processing. J. Consum. Behav. 2017, 16, 434–441. [Google Scholar]
- Chevalier, J.; Mayzlin, D. The Effect of Word of Mouth on Sales: Online Book Reviews. J. Mark. Res. 2006, 43, 345–354. [Google Scholar]
- Chintagunta, P.K.; Gopinath, S.; Venkataraman, S. The Effects of Online User Reviews on Movie Box Office Performance: Accounting for Sequential Rollout and Aggregation Across Local Markets. Mark. Sci. 2010, 29, 944–957. [Google Scholar]
- Li, X.; Wu, C.; Mai, F. The effect of online reviews on product sales: A joint sentiment-topic analysis. Inf. Manag. 2019, 56, 172–184. [Google Scholar]
- Hofmann, J.; Clement, M.; Völckner, F.; Hennig-Thurau, T. Empirical generalizations on the impact of stars on the economic success of movies. Int. J. Res. Mark. 2017, 34, 442–461. [Google Scholar]
- Marchand, A.; Hennig-Thurau, T.; Wiertz, C. Not all digital word of mouth is created equal: Understanding the respective impact of consumer reviews and microblogs on new product success. Int. J. Res. Mark. 2017, 34, 336–354. [Google Scholar]
- Lee, S.; Choeh, J.Y. Using the social influence of electronic word-of-mouth for predicting product sales: The moderating effect of review or reviewer helpfulness and product type. Sustainability 2020, 12, 7952. [Google Scholar]
- Rodríguez-Díaz, M.; Rodríguez-Díaz, R.; Espino-Rodríguez, T. Analysis of the Online Reputation Based on Customer Ratings of Lodgings in Tourism Destinations. Adm. Sci. 2018, 8, 51. [Google Scholar]
- Sun, Q.; Niu, J.; Yao, Z.; Yan, H. Exploring eWOM in online customer reviews: Sentiment analysis at a fine-grained level. Eng. Appl. Artif. Intell. 2019, 81, 68–78. [Google Scholar]
- Beach, L.R. Broadening the definition of decision making: The role of prechoice screening option. Psychol. Sci. 1993, 4, 215–220. [Google Scholar]
- Häubl, G.; Trifts, V. Consumer Decision Making in Online Shopping Environments: The Effects of Interactive Decision Aids Consumer Decision Making in Online Shopping Environments: The Effects of Interactive Decision Aids. Mark. Sci. 2000, 19, 4–21. [Google Scholar]
- Feldman, J.M.; Lynch, J.G. Self-Generated Validity and Other Effects of Measurement on Belief, Attitude, Intention, and Behavior. J. Appl. Psychol. 1988, 73, 421–435. [Google Scholar]
- Archak, N.; Ghose, A.; Ipeirotis, P.G. Deriving the Pricing Power of Product Features by Mining Consumer Reviews. Manag. Sci. 2011, 57, 1485–1509. [Google Scholar]
- Cui, G.; Lui, H.-K.; Guo, X. The Effect of Online Consumer Reviews on New Product Sales. Int. J. Electron. Commer. 2012, 17, 39–58. [Google Scholar]
- Sun, M. How Does the Variance of Product Ratings Matter? Manag. Sci. 2012, 58, 696–707. [Google Scholar] [CrossRef] [Green Version]
- Pennebaker, J.W.; Boyd, R.; Jordan, K.; Blackburn, K. The Development and Psychometric Properties of LIWC2015; University of Texas at Austin: Austin, TX, USA, 2015; pp. 1–22. [Google Scholar]
- Moe, W.W.; Trusov, M. The Value of Social Dynamics in Online Product Ratings Forums. J. Mark. Res. 2011, 48, 444–456. [Google Scholar] [CrossRef]
- Duan, W.; Gu, B.; Whinston, A.B. Do online reviews matter? An empirical investigation of panel data. Decis. Support Syst. 2008, 45, 1007–1016. [Google Scholar] [CrossRef]
- Godes, D.; Mayzlin, D. Using Online Conversations to Study Word-of-Mouth Communication. Mark. Sci. 2004, 23, 545–560. [Google Scholar] [CrossRef] [Green Version]
- Liu, Y. Word of Mouth for Movies: Its Dynamics and Impact on Box Office Revenue. J. Mark. 2006, 70, 74–89. [Google Scholar] [CrossRef]
- Floyd, K.; Freling, R.; Alhoqail, S.; Cho, H.Y.; Freling, T. How Online Product Reviews Affect Retail Sales: A Meta-analysis. J. Retail. 2014, 90, 217–232. [Google Scholar] [CrossRef]
- Dellarocas, C.; Zhang, X.; Awad, N.F. Exploring the value of online product reviews in forecasting sales: The case of motion pictures. J. Interact. Mark. 2007, 21, 23–45. [Google Scholar] [CrossRef]
- Wang, F.; Liu, X.; Fang, E.E. User Reviews Variance, Critic Reviews Variance, and Product Sales: An Exploration of Customer Breadth and Depth Effects. J. Retail. 2015, 91, 372–389. [Google Scholar] [CrossRef]
- Tausczik, Y.R.; Pennebaker, J.W. The Psychological Meaning of Words: LIWC and Computerized Text Analysis Methods. J. Lang. Soc. Psychol. 2010, 29, 24–54. [Google Scholar] [CrossRef]
- Kim, M.; Lennon, S. The Effects of Visual and Verbal Information on Attitudes and Purchase Intentions in Internet Shopping. Psychol. Mark. 2007, 24, 763–785. [Google Scholar] [CrossRef]
- Ludwig, S.; de Ruyter, K.; Friedman, M.; Brüggen, E.C.; Wetzels, M.; Pfann, G. More Than Words: The Influence of Affective Content and Linguistic Style Matches in Online Reviews on Conversion Rates. J. Mark. 2013, 77, 87–103. [Google Scholar] [CrossRef]
- De Vries, L.; Gensler, S.; Leeflang, P.S.H. Popularity of Brand Posts on Brand Fan Pages: An Investigation of the Effects of Social Media Marketing. J. Interact. Mark. 2012, 26, 83–91. [Google Scholar] [CrossRef]
- Zhang, Y.; Moe, W.W.; Schweidel, D.A. Modeling the role of message content and influencers in social media rebroadcasting. Int. J. Res. Mark. 2017, 34, 100–119. [Google Scholar] [CrossRef]
- Chung, C.K.; Pennebaker, J.W. The psychological function of function words. Soc. Commun. Front. Soc. Psychol. 2007, 343–359. [Google Scholar]
- Liang, T.P.; Li, X.; Yang, C.T.; Wang, M. What in Consumer Reviews Affects the Sales of Mobile Apps: A Multifacet Sentiment Analysis Approach. Int. J. Electron. Commer. 2015, 20, 236–260. [Google Scholar] [CrossRef]
- Tang, T.Y.; Fang, E.E.; Wang, F. Is neutral really neutral? The effects of neutral user-generated content on product sales. J. Mark. 2014, 78, 41–58. [Google Scholar] [CrossRef]
- Hu, N.; Koh, N.S.; Reddy, S.K. Ratings lead you to the product, reviews help you clinch it? the mediating role of online review sentiments on product sales. Decis. Support. Syst. 2014, 57, 42–53. [Google Scholar] [CrossRef]
- Yazdani, E.; Gopinath, S.; Carson, S. Preaching to the Choir: The Chasm Between Top-Ranked Reviewers, Mainstream Customers, and Product Sales. Mark. Sci. 2018, 37, 838–851. [Google Scholar] [CrossRef]
- Chevalier, J.A.; Goolsbee, A. Measuring Prices and Price Competition Online: Amazon.com and BarnesandNoble.com. Quant. Mark. Econ. 2003, 1, 203–222. [Google Scholar] [CrossRef]
- Petty, R.E.; Cacioppo, J.T. The elaboration likelihood model of persuasion. Adv. Exp. Soc. Psychol. 1986, 19, 123–205. [Google Scholar]
- Chaiken, S. Heuristic Versus Systematic Information Processing and the Use of Source Versus Message Cues in Persuasion. J. Pers. Soc. Psychol. 1980, 39, 752–766. [Google Scholar] [CrossRef]
- Lin, C.-L.; Lee, S.-H.; Horng, D.-J. The effects of online reviews on purchasing intention: The moderating role of need for cognition. Soc. Behav. Personal. Int. J. 2011, 39, 71–81. [Google Scholar] [CrossRef]
- Park, D.H.; Kim, S. The effects of consumer knowledge on message processing of electronic word-of-mouth via online consumer reviews. Electron. Commer. Res. Appl. 2008, 7, 399–410. [Google Scholar] [CrossRef] [Green Version]
- Filieri, R.; McLeay, F. E-WOM and Accommodation: An Analysis of the Factors That Influence Travelers’ Adoption of Information from Online Reviews. J. Travel Res. 2014, 53, 44–57. [Google Scholar] [CrossRef]
- Park, D.-H.; Lee, J.; Han, I. The Effect of On-Line Consumer Reviews on Consumer Purchasing Intention: The Moderating Role of Involvement. Int. J. Electron. Commer. 2007, 11, 125–148. [Google Scholar] [CrossRef]
- Lee, J.; Park, D.H.; Han, I. The effect of negative online consumer reviews on product attitude: An information processing view. Electron. Commer. Res. Appl. 2008, 7, 341–352. [Google Scholar] [CrossRef]
- Agnihotri, A.; Bhattacharya, S. Online Review Helpfulness: Role of Qualitative Factors. Psychol. Mark. 2016, 33, 1006–1017. [Google Scholar] [CrossRef]
- Ruiz-Mafe, C.; Chatzipanagiotou, K.; Curras-Perez, R. The role of emotions and conflicting online reviews on consumers’ purchase intentions. J. Bus. Res. 2018, 89, 336–344. [Google Scholar] [CrossRef] [Green Version]
- Zhang, K.Z.K.; Zhao, S.J.; Cheung, C.M.K.; Lee, M.K.O. Examining the influence of online reviews on consumers’ decision-making: A heuristic-systematic model. Decis. Support Syst. 2014, 67, 78–89. [Google Scholar] [CrossRef]
- SanJosé-Cabezudo, R.; Gutiérrez-Arranz, A.M.; Gutiérrez-Cillán, J. The Combined Influence of Central and Peripheral Routes in the Online Persuasion Process. CyberPsychol. Behav. 2009, 12, 299–308. [Google Scholar] [CrossRef]
- Aljukhadar, M.; Senecal, S.; Daoust, C.-E. Using Recommendation Agents to Cope with Information Overload. Int. J. Electron. Commer. 2012, 17, 41–70. [Google Scholar] [CrossRef]
- Miller, G.A. The magical number seven, plus or minus two: Some limits on our capacity for processing information. Psychol. Rev. 1956, 63, 81–97. [Google Scholar] [CrossRef] [PubMed] [Green Version]
- Gobet, F.; Lane, P.; Croker, S.; Cheng, P.; Jones, G.; Oliver, I.; Pine, J. Chunking mechanisms in human learning. Trends Cogn. Sci. 2001, 5, 236–243. [Google Scholar] [CrossRef]
- Liu, Q.; Karahanna, E. An agent-based modeling analysis of helpful vote on online product reviews. In Proceedings of the 2015 48th Hawaii International Conference on System Sciences, Kauai, HI, USA, 5–8 January 2015; pp. 1585–1595. [Google Scholar]
- Herr, P.M.; Kardes, F.R.; Kim, J. Effects of Word-of-Mouth and Product-Attribute Information on Persuasion: An Accessibility-Diagnosticity Perspective. J. Consum. Res. 1991, 17, 454. [Google Scholar] [CrossRef]
- Van Hoye, G.; Lievens, F. Social influences on organizational attractiveness: Investigating if and when word of mouth matters. J. Appl. Soc. Psychol. 2007, 37, 2024–2047. [Google Scholar] [CrossRef] [Green Version]
- Lynch, J.G., Jr.; Marmorstein, H.; Weigold, M.F. Choices from Sets Including Remembered Brands: Use of Recalled Attributes and Prior Overall Evaluations. J. Consum. Res. 1988, 15, 169. [Google Scholar] [CrossRef]
- Slovic, P. From Shakespeare to Simon: Speculations and some evidence. Or. Res. Inst. Bull. 1972, 12, 1–19. [Google Scholar]
- Bettman, J.R.; Luce, M.F.; Payne, J.W. Constructive Consumer Choice Processes. J. Consum. Res. 1998, 25, 187–217. [Google Scholar] [CrossRef]
- Payne, J.W. Contingent Decision Behavior. Psychol. Bull. 1982, 92, 382. [Google Scholar] [CrossRef]
- Shugan, S.M. The Cost of Thinking. J. Consum. Res. 1980, 7, 99–111. [Google Scholar] [CrossRef] [Green Version]
- Pang, J.; Qiu, L. Effect of online review chunking on product attitude: The moderating role of motivation to think. Int. J. Electron. Commer. 2016, 20, 355–383. [Google Scholar] [CrossRef]
- Racherla, P.; Friske, W. Perceived “usefulness” of online consumer reviews: An exploratory investigation across three services categories. Electron. Commer. Res. Appl. 2012, 11, 548–559. [Google Scholar] [CrossRef]
- Zhou, S.; Guo, B. The order effect on online review helpfulness: A social influence perspective. Decis. Support Syst. 2017, 93, 77–87. [Google Scholar] [CrossRef]
- Singh, J.P.; Irani, S.; Rana, N.P.; Dwivedi, Y.K.; Saumya, S.; Kumar Roy, P. Predicting the “helpfulness” of online consumer reviews. J. Bus. Res. 2017, 70, 346–355. [Google Scholar] [CrossRef]
- Lee, P.J.; Hu, Y.H.; Lu, K.T. Assessing the helpfulness of online hotel reviews: A classification-based approach. Telemat. Inform. 2018, 35, 436–445. [Google Scholar] [CrossRef]
- Saumya, S.; Singh, J.P.; Baabdullah, A.M.; Rana, N.P.; Dwivedi, Y.K. Ranking online consumer reviews. Electron. Commer. Res. Appl. 2018, 29, 78–89. [Google Scholar] [CrossRef] [Green Version]
- Westerman, D.; Spence, P.R.; Van Der Heide, B. Social Media as Information Source: Recency of Updates and Credibility of Information. J. Comput. Commun. 2014, 19, 171–183. [Google Scholar] [CrossRef] [Green Version]
- Fogg, B.J.; Marshall, J.; Laraki, O.; Osipovich, A.; Varma, C.; Fang, N.; Paul, J.; Rangnekar, A.; Shon, J.; Swani, P.; et al. What makes web sites credible? A report on a large quantitative study. In Proceedings of the SIGCHI Conference on Human Factors in Computing Systems; ACM SIGCHI: New York, NY, USA, 2001; pp. 61–68. [Google Scholar]
- Levinson, P. New New Media; Allyn & Bacon: Boston, MA, USA, 2013; p. 223. [Google Scholar]
- Brown, C.L.; Krishna, A. The skeptical shopper: A metacognitive account for the effects of default options on choice. J. Consum. Res. 2004, 31, 529–539. [Google Scholar] [CrossRef]
- Johnson, E.J.; Bellman, S.; Lohse, G.L. Defaults, Framing and Privacy: Why Opting In-Opting Out. Mark Lett. 2002, 13, 5–15. [Google Scholar] [CrossRef]
- Nazlan, N.H.; Tanford, S.; Montgomery, R. The effect of availability heuristics in online consumer reviews. J. Consum. Behav. 2018, 17, 449–460. [Google Scholar] [CrossRef]
- Herrmann, A.; Goldstein, D.G.; Stadler, R.; Landwehr, J.R.; Heitmann, M.; Hofstetter, R.; Huber, F. The effect of default options on choice-Evidence from online product configurators. J. Retail. Consum. Serv. 2011, 18, 483–491. [Google Scholar] [CrossRef]
- Gu, B.; Park, J.; Konana, P. The Impact of External Word-of-Mouth Sources on Retailer Sales of High-Involvement Products. Inf. Syst. 2012, 23, 182–196. [Google Scholar] [CrossRef]
- Lee, S.; Choeh, J.Y. The interactive impact of online word-of-mouth and review helpfulness on box office revenue. Manag. Decis. 2018, 56, 849–866. [Google Scholar] [CrossRef]
- Ho-Dac, N.N.; Carson, S.J.; Moore, W.L. The Effects of Positive and Negative Online Customer Reviews: Do Brand Strength and Category Maturity Matter? J. Mark. 2013, 77, 37–53. [Google Scholar] [CrossRef] [Green Version]
- Pennebaker, J.W.; Chung, C.K.; Ireland, M.; Gonzales, A.; Booth, R.J. The Development and Psychometric Properties of LIWC2007; LIWC.net: Austin, TX, USA, 2007. [Google Scholar]
- Motyka, S.; Grewal, D.; Aguirre, E.; Mahr, D.; de Ruyter, K.; Wetzels, M. The emotional review–reward effect: How do reviews increase impulsivity? J. Acad. Mark. Sci. 2018, 46, 1032–1051. [Google Scholar] [CrossRef]
- Selkirk, E. The prosodic structure of function words. In Signal to Syntax Bootstrapping from speech to Gramm (early Acquis.); Lawrence Erlbaum Associates Inc.: Hillsdale, MI, USA, 1996; pp. 187–214. [Google Scholar]
- Smith, C.A.; Ellsworth, P.C. Patterns of cognitive appraisal in emotion. J. Personal. Soc. Psychol. 1985, 48, 813–838. [Google Scholar] [CrossRef]
- Areni, C.S. The Effects of Structural and Grammatical Variables on Persuasion: An Elaboration Likelihood Model Perspective. Psychol. Mark. 2003, 20, 349–375. [Google Scholar] [CrossRef]
- Munch, J.M.; Swasy, J.L. Rhetorical question, summarization frequency, and argument strength effects on recall. J. Consum. Res. 1988, 15, 69–76. [Google Scholar] [CrossRef]
- Payan, J.M.; McFarland, R.G. Decomposing Influence Strategies: Argument Structure and Dependence as Determinants of the Effectiveness of Influence Strategies in Gaining Channel Member Compliance. J. Mark. 2005, 69, 66–79. [Google Scholar] [CrossRef] [Green Version]
- Darley, W.K.; Smith, R.E. Advertising Claim Objectivity: Antecedents and Effects. J. Mark. 1993, 57, 100. [Google Scholar] [CrossRef]
- Holbrook, M.B. Beyond Attitude Structure: Toward the Informational Determinants of Attitude. J. Mark. Res. 1978, 15, 545. [Google Scholar] [CrossRef]
- Chen, C.C.; Tseng, Y. De Quality evaluation of product reviews using an information quality framework. Decis. Support Syst. 2011, 50, 755–768. [Google Scholar] [CrossRef]
- Ghose, A.; Ipeirotis, P.G.; Li, B. Designing Ranking Systems for Hotels on Travel Search Engines by Mining User-Generated and Crowdsourced Content. Mark. Sci. 2012, 31, 493–520. [Google Scholar] [CrossRef] [Green Version]
- Liu, J.; Cao, Y.; Lin, C.; Huang, Y.; Zhou, M. Low-quality product review detection in opinion summarization. In Proceedings of the Joint Conference on Empirical Methods in Natural Language Processing and Computational Natural Language Learning (EMNLP-CoNLL), Prague, Czech Republic, 28–30 June 2007; pp. 334–342. [Google Scholar]
- Sniezek, J.A.; Van Swol, L.M. Trust, confidence, and expertise in a judge-advisor system. Organ Behav. Hum. Decis. Process. 2001, 84, 288–307. [Google Scholar] [CrossRef]
- Price, P.C.; Stone, E.R. Intuitive Evaluation of Likelihood Judgment Producers: Evidence for a Confidence Heuristic. J. Behav. Decis. Mak. 2004, 17, 39–57. [Google Scholar] [CrossRef] [Green Version]
- Pennebaker, J.W.; Chung, C.K.; Frazee, J.; Lavergne, G.M.; Beaver, D.I. When small words foretell academic success: The case of college admissions essays. PLoS ONE 2014, 9, 1–10. [Google Scholar] [CrossRef] [Green Version]
- Kacewicz, E.; Pennebaker, J.W.; Davis, M.; Jeon, M.; Graesser, A.C. Pronoun Use Reflects Standings in Social Hierarchies. J. Lang. Soc. Psychol. 2014, 33, 125–143. [Google Scholar] [CrossRef] [Green Version]
- Newman, M.L.; Pennebaker, J.W.; Berry, D.S.; Richards, J.M. Personality and Social Psychology Bulletin Lying Words: Predicting Deception From Linguistic Styles. Personal. Soc. Psychol. Bull. 2003, 29, 665–675. [Google Scholar] [CrossRef]
- Social Blade. 2017. Available online: https://socialblade.com/ (accessed on 22 April 2020).
- Euromonitor International. Colour Cosmetics in the US; Euromonitor International: Chicago, IL, USA, 2017. [Google Scholar]
- Nielsen. The Sweet Smell of Seasonal Success; Nielsen: New York, NY, USA, 2016. [Google Scholar]
- Elberse, A.; Eliashberg, J. Demand and Supply Dynamics for Sequentially Released Products in International Markets: The Case of Motion Pictures. Mark. Sci. 2003, 22, 329–354. [Google Scholar] [CrossRef] [Green Version]
- Godes, D.; Silva, J.C. Sequential and Temporal Dynamics of Online Opinion. Mark. Sci. 2012, 31, 448–473. [Google Scholar] [CrossRef]
- Duan, W.; Gu, B.; Whinston, A.B. The dynamics of online word-of-mouth and product sales-An empirical investigation of the movie industry. J. Retail. 2008, 84, 233–242. [Google Scholar] [CrossRef]
- Zhu, F. Impact of Online Consumer Reviews on Sales: The Moderating Role of Product and Consumer Characteristics. J. Mark. 2010, 74, 133–148. [Google Scholar] [CrossRef]
- Decker, R.; Trusov, M. Estimating aggregate consumer preferences from online product reviews. Int. J. Res. Mark. 2010, 27, 293–307. [Google Scholar] [CrossRef]
- Park, E.J.; Kim, E.Y.; Funches, V.M.; Foxx, W. Apparel product attributes, web browsing, and e-impulse buying on shopping websites. J. Bus. Res. 2012, 65, 1583–1589. [Google Scholar] [CrossRef]
- Xu, P.; Liu, D. Product engagement and identity signaling: The role of likes in social commerce for fashion products. Inf. Manag. 2019, 56, 143–154. [Google Scholar] [CrossRef]
- Cheng, Y.H.; Ho, H.Y. Social influence’s impact on reader perceptions of online reviews. J. Bus. Res. 2015, 68, 883–887. [Google Scholar] [CrossRef]
- Arellano, M.; Bover, O. Another look at the instrumental variable estimation of error-components models. J. Econom. 1995, 68, 29–51. [Google Scholar] [CrossRef] [Green Version]
- Blundell, R.; Bond, S. Initial conditions and moment restrictions in dynamic panel data models. J. Econom. 1998, 87, 115–143. [Google Scholar] [CrossRef] [Green Version]
- Lozano, M.B.; Martínez, B.; Pindado, J. Corporate governance, ownership and firm value: Drivers of ownership as a good corporate governance mechanism. Int. Bus. Rev. 2016, 25, 1333–1343. [Google Scholar] [CrossRef]
- Pindado, J.; Requejo, I.; de la Torre, C. Family control and investment-cash flow sensitivity: Empirical evidence from the Euro zone. J. Corp. Financ. 2011, 17, 1389–1409. [Google Scholar] [CrossRef]
- Forman, C.; Ghose, A.; Wiesenfeld, B. Examining the relationship between reviews and sales: The role of reviewer identity disclosure in electronic markets. Inf. Syst. Res. 2008, 19, 291–313. [Google Scholar] [CrossRef]
- Arellano, M.; Bond, S. Some Tests of Specification for Panel Data: Monte Carlo Evidence and an Application to Employment Equations. Rev. Econ. Stud. 1991, 58, 277. [Google Scholar] [CrossRef] [Green Version]
- Roodman, D. How to do xtabond2: An introduction to difference and system GMM in Stata. Stata J. 2009, 9, 86–136. [Google Scholar] [CrossRef] [Green Version]
- Aiken, L.S.; West, S.G. Multiple Regression: Testing and Interpreting Interactions; Sage: Newcastle Upon Tyne, UK, 1991. [Google Scholar]
- Roodman, D. Practitioners’ corner: A note on the theme of too many instruments. Oxf Bull Econ Stat. 2009, 71, 135–158. [Google Scholar] [CrossRef]
- Ngo-Ye, T.L.; Sinha, A.P. The influence of reviewer engagement characteristics on online review helpfulness: A text regression model. Decis. Support Syst. 2014, 61, 47–58. [Google Scholar] [CrossRef]
- Vermeer, S.A.M.; Araujo, T.; Bernritter, S.F.; van Noort, G. Seeing the wood for the trees: How machine learning can help firms in identifying relevant electronic word-of-mouth in social media. Int. J. Res. Mark. 2019, 36, 492–508. [Google Scholar] [CrossRef]
Figure 1.
Conceptual Model.

Figure 2.
Example of review information collected from the online retailer.

Figure 3.
Non-textual product variables coefficients in system GMM models.

Figure 4.
Textual product variables coefficients in system GMM models.

Table 1.
Research variables.
| Definition | |
|---|---|
| Dependent variable | |
| Ln_sales_rank_inverseit | The natural Log of the multiplicative inverse of the sales rank of product i at time t (1/sales_rankit) |
| Independent variables | |
| Review non-textual variables | |
| Ln_volumeit | The natural Log of the cumulative number of online consumer reviews for product i at time t |
| Ln_ratingivt | The natural Log of the average of ratings for product i at time t considering review visibility case v |
| Ln_rating_inconsistencyivt | The natural Log of the average difference in absolute value between review rating and product average rating for product i at time t considering review visibility case v |
| Review textual variables | |
| Ln_analyticivt | The natural Log of the average of analytical thinking shown in online reviews for product i at time t considering review visibility case v The variable captures the degree to which consumers use words that suggest formal, logical and hierarchical thinking patterns [94]. It is extracted using the text mining tool LIWC [23]. |
| Ln_authenticivt | The natural Log of the average of authenticity shown in online reviews for product i at time t considering review visibility case v The variable captures the degree to which consumers reveal themselves in an authentic or honest way, so their discourse is more personal and humble [96]. It is extracted using the text mining tool LIWC [23]. |
| Ln_cloutivt | The natural Log of the average of clout shown in online reviews for product i at time t considering review visibility case v The variable captures the relative social status, confidence or leadership displayed by consumers through their writing style [95]. It is extracted using the text mining tool LIWC [23]. |
| Control variables | |
| Christmast | Binary variable: 1 if it is between 21 December 2016 and 5 January 2017; 0 otherwise. |
| Newit | Binary variable: 1 if product i at time t had the label of “new”; 0 otherwise |
| Exclusiveit | Binary variable: 1 if product i had the exclusive label at time t; 0 otherwise |
| Ln_priceit | The natural Log of the of the price per gram of product i at time t |
| Ln_sizeit | The natural Log of the of the size in gr of product i at time t |
| Brand_retaileri | Binary variable: 1 if product i´s brand belongs to the retailer private brand; 0 otherwise |
| Ln_brand_followersit | The natural Log of the cumulative number of brand Instagram followers for product i at time t. Data collected from Socialblade.com [97] |
| Brand_topi | Binary variable: 1 if product i´s brand was in the top 10 bestselling brands in the US in 2016; 0 otherwise. Data from Euromonitor International [98] |
| Band_premiumi | Binary variable: 1 if the product i´s brand is was categorized as premium brand in 2016; 0 otherwise. Data from Euromonitor International [98] |
Table 2.
Example of aggregation process of review variables for a specific product i at a specific time t.
Table 2.
Example of aggregation process of review variables for a specific product i at a specific time t.
| Product (i) | Review Rating | Case 1 | Case 2 | ||
|---|---|---|---|---|---|
| Approach 1 (v1) | Review Visibility When Sorting by Most Helpful (Review Rank Order) | Approach 1 (v2.1) | Approach 2 (v2.2) | ||
| All Reviews the Same Probability of Being Viewed | Review Visibility Weight (w) All Reviews Have a Decreasing Probability of Being Viewed When Sorting by Most Helpful (1/Review Rank Order) | Review Visibility Weight (w) Only Reviews in the First Page (top 5) are Viewed When Sorting by Most Helpful | |||
| 1 | 5 | 1 | 1 | 1 | 1 |
| 4 | 1 | 2 | 0.5 | 1 | |
| 3 | 1 | 3 | 0.33 | 1 | |
| 5 | 1 | 4 | 0.25 | 1 | |
| 4 | 1 | 5 | 0.2 | 1 | |
| 3 | 1 | 6 | 0.16 | 0 | |
| 4 | 1 | 7 | 0.14 | 0 | |
| 5 | 1 | 8 | 0.12 | 0 | |
| 1 | 1 | 9 | 0.11 | 0 | |
| 2 | 1 | 10 | 0.1 | 0 | |
| Sum of probabilities | 10 | 2.93 | 5 | ||
| Rating | Rating v1 = 3.6 | Ratingv2.1 = 4.12 | Ratingv2.2 = 4.2 | ||
| ln_rating | Ln 3.6 = 1.28 | Ln 4.12 = 1.42 | Ln 4.2 = 1.44 | ||
Table 3.
Descriptive statistics.
| Variable | N | Mean | SD | Min | Max |
|---|---|---|---|---|---|
| Sales_rank_inverse | 1062 | 68.13 | 39.01 | 1 | 146 |
| Volume | 1062 | 523.18 | 1604.49 | 1 | 16,404 |
| Ratingv1 | 1062 | 4.29 | 0.38 | 2.9 | 5 |
| Ratingv2.1 | 1062 | 4.29 | 0.49 | 1.91 | 5 |
| Ratingv2.2 | 1062 | 4.39 | 0.66 | 1.6 | 5 |
| Ratingv3.1 | 1062 | 4.17 | 0.49 | 2.4 | 5 |
| Ratingv3.2 | 1062 | 4.18 | 0.66 | 2 | 5 |
| Rating_inconsistencyv1 | 1062 | 0.02 | 0.02 | 0 | 0.34 |
| Rating_inconsistencyv2.1 | 1062 | 0.23 | 0.21 | 0 | 1.06 |
| Rating_inconsistencyv2.2 | 1062 | 0.41 | 0.37 | 0 | 2.5 |
| Rating_inconsistencyv3.1 | 1062 | 0.22 | 0.2 | 0 | 1.06 |
| Rating_inconsistencyv3.2 | 1062 | 0.41 | 0.36 | 0 | 2 |
| Analyticv1 | 1062 | 46.16 | 6.02 | 11 | 70.86 |
| Analyticv2.1 | 1062 | 47.06 | 8.43 | 11 | 70.54 |
| Analyticv2.2 | 1062 | 49.52 | 10.94 | 11 | 72.72 |
| Analyticv3.1 | 1062 | 44.44 | 8.86 | 11 | 75.47 |
| Analyticv3.2 | 1062 | 44.02 | 12.10 | 10.02 | 75.33 |
| Authenticv1 | 1062 | 49.96 | 7.71 | 27.39 | 73.34 |
| Authenticv2.1 | 1062 | 49.54 | 10.48 | 19.22 | 76.78 |
| Authenticv2.2 | 1062 | 49.18 | 15.38 | 2.24 | 80.39 |
| Authenticv3.1 | 1062 | 48.69 | 11.43 | 11.94 | 79.90 |
| Authenticv3.2 | 1062 | 49.52 | 15.15 | 7.40 | 92.01 |
| Cloutv1 | 1062 | 27.14 | 5.66 | 8.65 | 64.45 |
| Cloutv2.1 | 1062 | 26.50 | 6.56 | 5.90 | 52.76 |
| Cloutv2.2 | 1062 | 27.29 | 9.77 | 6.64 | 64.45 |
| Cloutv3.1 | 1062 | 26.64 | 7.56 | 7.13 | 72.27 |
| Cloutv3.2 | 1062 | 26.59 | 10.92 | 2.33 | 64.45 |
| Christmas | 1062 | 0.33 | 0.47 | 0 | 1 |
| New | 1062 | 0.08 | 0.27 | 0 | 1 |
| Exclusive | 1062 | 0.27 | 0.44 | 0 | 1 |
| Price | 1062 | 5.63 | 3.87 | 0.35 | 26.25 |
| Size | 1062 | 8.8 | 8.22 | 0.8 | 57 |
| Brand_retailer | 1062 | 0.07 | 0.25 | 0 | 1 |
| Brand_followers | 1062 | 3,512,608 | 3,649,264 | 2837 | 14,000,000 |
| Brand_top | 1062 | 0.09 | 0.29 | 0 | 1 |
| Brand_premium | 1062 | 0.32 | 0.47 | 0 | 1 |
Table 4.
Output of system GMM regression.
| Case 1 (v1) No Visibility Considered | Case 2 (v2) Most Helpful Visibility | Case 3 (v3) Most Recent Visibility | |||
|---|---|---|---|---|---|
| Model 1 | Model 2 | Model 3 | Model 4 | Model 5 | |
| Case v1 | Case v2.1 | Case v2.2 | Case v3.1 | Case v3.2 | |
| All Reviews Same Probability of Being Viewed | All Reviews Decreasing Probability | Five Most Helpful Reviews | All Reviews Decreasing Probability | Five Most Recent Reviews | |
| L1_ln_sales_rank_inverse | 0.919 *** | 0.889 *** | 0.767 *** | 0.937 *** | 0.942 *** |
| (0.00) | (0.00) | (0.00) | (0.00) | (0.00) | |
| Ln_volume | 0.072 *** | 0.064 *** | 0.093 *** | 0.134 *** | 0.075 *** |
| (0.01) | (0.01) | (0.01) | (0.01) | (0.01) | |
| Ln_rating | 0.116 *** | 0.256 *** | 0.578 *** | 0.108 *** | 0.274 *** |
| (0.00) | (0.01) | (0.01) | (0.01) | (0.01) | |
| Ln_rating_inconsistency | 0.506 *** | 1.012 *** | 1.949 *** | 0.369 *** | 0.552 *** |
| (0.02) | (0.03) | (0.01) | (0.03) | (0.04) | |
| Ln_rating x ln_rating_inconsistency | −0.476 *** | −0.953 *** | −1.872 *** | −0.312 *** | −0.423 *** |
| (0.02) | (0.03) | (0.01) | (0.03) | (0.03) | |
| Ln_analytic | −0.016 *** | 0.031 *** | 0.008 * | −0.048 *** | −0.012 ** |
| (0.00) | (0.00) | (0.00) | (0.00) | (0.00) | |
| Ln_authentic | 0.035 *** | −0.070 *** | −0.077 *** | −0.042 *** | −0.020 ** |
| (0.00) | (0.01) | (0.01) | (0.01) | (0.01) | |
| Ln_clout | 0.030 *** | −0.077 *** | −0.105 *** | −0.013 ** | −0.034 *** |
| (0.01) | (0.00) | (0.00) | (0.00) | (0.01) | |
| Christmas | −0.003 | 0.003 | 0.015*** | 0.008 | 0.005 |
| (0.00) | (0.00) | (0.00) | (0.00) | (0.00) | |
| New | 0.100 *** | 0.105 *** | 0.352 *** | 0.017 * | 0.092 *** |
| (0.01) | (0.01) | (0.01) | (0.01) | (0.01) | |
| Exclusive | 0.163 *** | 0.218 *** | 0.280 *** | 0.145 *** | 0.186 *** |
| (0.01) | (0.01) | (0.01) | (0.01) | (0.02) | |
| Ln_price | 0.321 *** | 0.294 *** | 0.060 *** | 0.133 *** | 0.033 * |
| (0.01) | (0.01) | (0.01) | (0.01) | (0.01) | |
| Ln_size | 0.273 *** | 0.256 *** | 0.061 *** | 0.108 *** | 0.045 *** |
| (0.01) | (0.02) | (0.01) | (0.01) | (0.01) | |
| Brand_retailer | 0.309 *** | 0.293 *** | 0.255 *** | 0.159 *** | 0.072 * |
| (0.02) | (0.03) | (0.04) | (0.03) | (0.03) | |
| Brand_followers | −0.053 *** | −0.027 *** | −0.053 *** | −0.068 *** | −0.057 *** |
| (0.00) | (0.00) | (0.01) | (0.01) | (0.01) | |
| Top_brand | 0.057 ** | 0.059 | −0.011 | 0.048 | 0.046 * |
| (0.02) | (0.04) | (0.03) | (0.02) | (0.02) | |
| Brand_premium | 0.013 | 0.036 ** | 0.147 *** | 0.007 | 0.058 *** |
| (0.01) | (0.01) | (0.02) | (0.01) | (0.02) | |
| Constant | −0.078 *** | −0.353 *** | −0.200 *** | −0.070 *** | −0.107 *** |
| (0.01) | (0.02) | (0.02) | (0.01) | (0.01) | |
| Observations | 944 | 944 | 944 | 944 | 944 |
| z1 | 4.1 × 10⁶ (17) | 4.1 × 10⁶ (17) | 5.6 × 10⁷ (17) | 1.7 × 10⁶ (17) | 7.6 × 10⁵ (17) |
| z2 | 63.30 (6) | 47.90 (6) | 109.89 (6) | 133.99 (6) | 47.25 (6) |
| Hansen | 70.19, p = 0.666 | 79.70, p = 0.364 | 82.28, p = 0.291 | 86.86, p = 0.185 | 84.60, p = 0.234 |
| AR (2) | 0.66, p = 0.512 | 0.65, p = 0.518 | 0.40, p = 0.687 | 0.64, p = 0.522 | 0.60, p = 0.548 |
Notes: All time dummies are included, but not reported in the table to save space. The system GMM estimator is the two-step estimator. Robust standard errors are shown in parenthesis. Following Roodman [114], the instrument matrix is collapsed, and we use two lags of the explanatory variables as instruments in the equation in differences and one lag in the equation in levels. Windmeijer correction is not applied to standard errors, so they could be downwards biased. It is not applied because we have a relatively small sample of products, although they represent the complete set of products available at the online retailer in the blush category. p < 0.1, * p < 0.05, ** p < 0.01, *** p < 0.001.
Table 5.
Most helpful visibility—all reviews, decreasing probability of being viewed (case v2.1).
| (1) | (2) | (3) | (4) | |
|---|---|---|---|---|
| OLS | FE | RE | System GMM | |
| L1.ln_sales_rank_inverse | 0.915 *** | 0.643 *** | 0.915 *** | 0.889 *** |
| (0.01) | (0.02) | (0.01) | (0.00) | |
| Ln_volume | 0.063 *** | −0.730 ** | 0.063 *** | 0.064 *** |
| (0.01) | (0.26) | (0.01) | (0.01) | |
| Ln_rating | 0.054 ** | 0.030 | 0.054 ** | 0.256 *** |
| (0.02) | (0.08) | (0.02) | (0.01) | |
| Ln_rating_inconsistency | 0.182 | 0.397 * | 0.182 | 1.012 *** |
| (0.09) | (0.18) | (0.09) | (0.03) | |
| Ln_rating x ln_rating_inconsistency | −0.173 * | −0.322 | −0.173* | −0.953 *** |
| (0.09) | (0.18) | (0.09) | (0.03) | |
| Ln_analytic | −0.004 | −0.071 | −0.004 | 0.031 *** |
| (0.01) | (0.06) | (0.01) | (0.00) | |
| Ln_authentic | −0.003 | −0.066 | −0.003 | −0.070 *** |
| (0.01) | (0.05) | (0.01) | (0.01) | |
| Ln_clout | −0.002 | −0.049 | −0.002 | −0.077 *** |
| (0.01) | (0.06) | (0.01) | (0.00) | |
| Christmas | 0.014 | −0.001 | 0.014 | 0.003 |
| (0.04) | (0.04) | (0.04) | (0.00) | |
| New | 0.112 * | 0.205 * | 0.112 * | 0.105 *** |
| (0.05) | (0.08) | (0.05) | (0.01) | |
| Exclusive | 0.144 *** | 0.945 *** | 0.144 *** | 0.218 *** |
| (0.03) | (0.21) | (0.03) | (0.01) | |
| Ln_price | 0.043 | 0.000 | 0.043 | 0.294 *** |
| (0.03) | (.) | (0.03) | (0.01) | |
| Ln_size | 0.027 | −0.302 | 0.027 | 0.256 *** |
| (0.02) | (1.58) | (0.02) | (0.02) | |
| Brand_retailer | 0.004 | 0.000 | 0.004 | 0.293 *** |
| (0.06) | (.) | (0.06) | (0.03) | |
| Ln_brand_followers | −0.020 | 0.014 | −0.020 | −0.027 *** |
| (0.01) | (0.07) | (0.01) | (0.00) | |
| Brand_top | −0.008 | 0.000 | −0.008 | 0.059 |
| (0.04) | (.) | (0.04) | (0.04) | |
| Brand_premium | 0.038 | 0.000 | 0.038 | 0.036** |
| (0.03) | (.) | (0.03) | (0.01) | |
| Constant | −0.087 | −0.462 * | −0.087 | −0.353 *** |
| (0.06) | (0.19) | (0.06) | (0.02) | |
| Observations | 944 | 944 | 944 | 944 |
Notes: All time dummies are included, but not reported in the table to save space. All non-binary variables are standardized. Robust standard errors are shown in parenthesis. p < 0.1, * p < 0.05, ** p < 0.01, *** p < 0.001.
Publisher’s Note: MDPI stays neutral with regard to jurisdictional claims in published maps and institutional affiliations. |
© 2021 by the authors. Licensee MDPI, Basel, Switzerland. This article is an open access article distributed under the terms and conditions of the Creative Commons Attribution (CC BY) license (http://creativecommons.org/licenses/by/4.0/).
Share and Cite
MDPI and ACS Style
Alzate, M.; Arce-Urriza, M.; Cebollada, J. Online Reviews and Product Sales: The Role of Review Visibility. J. Theor. Appl. Electron. Commer. Res. 2021, 16, 638-669. https://0-doi-org.brum.beds.ac.uk/10.3390/jtaer16040038
AMA Style
Alzate M, Arce-Urriza M, Cebollada J. Online Reviews and Product Sales: The Role of Review Visibility. Journal of Theoretical and Applied Electronic Commerce Research. 2021; 16(4):638-669. https://0-doi-org.brum.beds.ac.uk/10.3390/jtaer16040038
Chicago/Turabian StyleAlzate, Miriam, Marta Arce-Urriza, and Javier Cebollada. 2021. "Online Reviews and Product Sales: The Role of Review Visibility" Journal of Theoretical and Applied Electronic Commerce Research 16, no. 4: 638-669. https://0-doi-org.brum.beds.ac.uk/10.3390/jtaer16040038