
Education Is Entertainment? Zoo Science Communication on YouTube


1
Science Communication Unit, Department of Applied Sciences, Faculty of Health and Applied Sciences, University of the West of England, Bristol BS16 1QY, UK
2
Centre for Research in Animal Behaviour, Psychology, Washington Singer, University of Exeter, Exeter EX4 4QG, UK
3
WWT, Slimbridge Wetland Centre, Slimbridge GL2 7BT, UK
*
Author to whom correspondence should be addressed.
J. Zool. Bot. Gard. 2021, 2(2), 250-264; https://0-doi-org.brum.beds.ac.uk/10.3390/jzbg2020017
Submission received: 29 March 2021
/
Revised: 23 April 2021
/
Accepted: 4 May 2021
/
Published: 11 May 2021
Abstract
:YouTube is the dominant online video-sharing platform and offers zoos an opportunity to engage a vast audience with conservation content. As there is limited research evaluating how zoos currently utilize YouTube, we cataloged and evaluated the content of 20 zoological organizations (focusing on the top 1000 most viewed videos from each channel) from 2006 to 2019. Separately, educational content in a subsample of the most viewed and recently produced videos from three zoo-YouTube channels was catalogued and evaluated for the period 2016 to 2019. We found that channels are becoming more focused on producing entertainment, rather than education-based content and not reflecting the taxonomic diversity of their animals. Videos containing conservation content may not be the most popular with the YouTube audience (making up only 3% of the most viewed videos), but there is evidence that outputs are becoming more conservation orientated, with more conservation-focused videos being produced over time. Zoos may be engaging with large audiences via YouTube, but should carefully consider how they represent different taxonomic classes and how they can create educational material in interesting and accessible forms.

1. Introduction
For the modern zoo, effective public education and conservation of species are two of an institutions’ most important objectives [1,2]. Zoos currently utilize a range of tools for the communication of scientific topics [3]; however, institutions should explore different approaches within their public engagement and communication strategy to expand their reach to a more diverse audience [4]. With more individuals increasingly turning towards online environments to find science content [5], the internet can enable zoos to reach a much broader audience [6]. Many zoos are already regularly engaging with more people than ever before online via social media platforms [7], but whilst there have been academic studies exploring how Twitter [8,9] and Facebook [7] can be harnessed as a public engagement tool, there is a lack of research concerning YouTube, a fundamentally different social media platform that uses a video-based medium.
YouTube was launched in 2005 [10] with the goal of becoming the primary social media platform for uploading, viewing and promoting online videos [11]. Today, YouTube is one of the most successful digital platforms in the world with more than one billion videos watched daily and over two billion logged-in monthly users across 100 different countries [12]. Importantly for this study, animal and environmental science-based content on YouTube is extremely popular, as evident by channels such as ‘Animal Planet’, ‘BBC Earth’ and ‘Brave Wilderness’, which retain more than 29 million subscribers and over 8 billion views [13,14,15].
YouTube offers a genuine opportunity for science communication and public engagement by providing users with access to a wide range of science-focused content [11]; however, few studies have examined how zoos can specifically use YouTube for effective online education. This study aimed to provide foundational research in this area by evaluating how a range of zoo channels are currently utilizing YouTube for online education and engagement.
Firstly, we aimed to evaluate whether certain species are of significantly more interest to the YouTube audience and assess if zoos are appropriately representing different taxonomic classes within their content. Secondly, we aimed to evaluate the educational value of popular and recently produced zoo-YouTube content and review the structure (duration and themes) of such videos.
2. Materials and Methods
2.1. Sample of Zoo-YouTube Channels
A total of 20 popular zoo-YouTube channels were sampled in this study (Table 1) from ten different countries around the world; at the time of writing all are WAZA member institutions and/or members of their regional zoo association/accreditation organization (e.g., AZA, EAZA, SEAZA, ZAA).
Data on species and taxonomic class popularity on YouTube was collected from the 50 highest viewed videos, at the time of data collection, on each of the 20 sampled channels. This sample ranged from 2006 to 2019. Due to each of the channels having a different number of subscribers, used as a measure of audience size, sampling only the 1000 highest viewed videos would have likely caused the data to be biased towards larger channels. Therefore, sampling the 50 highest viewed videos from each of the 20 channels enabled this study to evaluate species and taxonomic class popularity across a range of different audiences, which better represented the content across the YouTube platform.
The YouTube channels that were sampled are presented in an alternative order in the results section, only known to the researchers, in order to anonymize data from individual channels.
Data on educational material, taxonomic class representation and video themes were collected from the 100 most popular and 100 most recent videos, available at the time of data collection, from the ZSL, The Cincinnati Zoo and Botanical Garden and the San Diego Zoo channels. By reviewing the 300 most viewed videos and 300 of the most recently produced videos (ZSL: October 2016–August 2019; Cincinnati: July 2018–August 2019; San Diego: December 2017–August 2019), this study was able to compare the content that is popular with the YouTube audience and the content currently being produced. Due to the time limitations of the project and the nature of video view counts on YouTube altering extremely quickly, only three channels were able to be reviewed; however, these three represented the largest American and British zoo channels on the platform.
2.2. Data Extraction
Extracted data from video content included: Title, Date Posted, Duration, Views, Featured Species, Taxonomic Class, IUCN Classification, Volume of Educational Material and Video Theme.
Video title, upload date, duration (seconds) and view count were recorded directly from the YouTube webpage. Data on the animal species were recorded by common name (including grouping of subspecies as the common name of that species, e.g., ‘giraffe’ for all subspecies of giraffe and closely-related species with the same ecology, e.g., ‘flamingo’ for all species of flamingo). Taxonomic class and IUCN classification were also recorded for each animal record. Videos were coded as ‘Mix’ when more than one of these factors were present and as ‘None’ if none were presented; on the rare occasion when the species could not be discerned from either video content or zoo websites, the video was coded as ‘Unknown’.
The volume of educational material was coded according to the number of information points presented during the video that could be considered as providing a learning opportunity for viewers, i.e., related to an aspect of zoo, biology, ecology, environmental, behavior, conservation or veterinarian science. The theme of the video was coded in relation to the overall subject of the content according to the agreed descriptions (Table 2).
2.3. Data Analysis
Data were analyzed in the statistical program R [16] using RStudio v.3.6.1 [17] and in Minitab v.18. Data for each model were tested for normality and the ‘plot (plot.name)’ function in RStudio was used to view residuals for each model output. Where relevant, r2 values were calculated using the ‘rsq (model name)’ package in RStudio.
2.3.1. What Do Zoos Post about?
To determine any difference in the overall number of posts on each taxonomic class compared to what would be expected from this sample population, a one-factor Chi-squared test was run in Minitab.
To analyze any impact of conservation status on YouTube posts, IUCN threat status was collected for each identifiable species in the sample. A total of 445,122,955 views were recorded for all posts relating specifically to animal content across all 20 zoos. The total number of posts specifically relating to a species within a taxonomic class that had an IUCN threat category was 854 postings. Percentage of posts out of all 854 postings for the IUCN threat level for each taxonomic class was recorded. A multinomial logistic regression, to test whether IUCN status predicted species featured and engagement with the audience, was run in RStudio using the ‘nnet’ package and ‘multinom’ function [18] with P values (generated from Wald z-tests) using the ‘AER’ package and ‘coeftest’ function in RStudio [19]. The final model run was IUCN status ~ Taxonomic class + Total number of views + Total number of views compared to age of the post + individual zoo + geographic location of the zoo.
2.3.2. Does the Nature of the Animal Collection within Each Zoo Influence YouTube Content?
Species diversity was calculated using the 1-Simpson’s Index [20] based on the number of species in each class that make up the overall number of individual species housed by each zoo. A value towards 0 indicates lower diversity and a value towards 1 indicates higher diversity. The collection of each species held at the zoo was gathered from published zoo stock lists and the International Zoo Yearbook (whichever was more current).
To evaluate any relationship between the proportion of each taxonomic class held in all zoos against the proportion of YouTube posts on that class from all zoos combined, a Spearman’s rho correlation was run in Minitab. To further evaluate significant predictors of why some posts may be more popular or why some taxonomic groups may be posted about more, a Poisson regression model was run in RStudio. For all 20 zoos in the main dataset, two Poisson regression models were run to determine what influences the number of views that a YouTube video receives; the predictors that remained the same in both models were the age of the YouTube post, the number of subscribers the YouTube channel has, the annual visitation number for the zoo, the proportion of mammals in the zoo’s animal collection, the total number of species in the zoo’s animal collection, the diversity of species in the zoo’s animal collection, whether the post contained one of the most popular species to post about and the taxonomic class of the animal (including ‘mixed’ if more than one species featured and ‘none’ if the video was not featuring a living animal) in the YouTube post. The two potential outcome variables that were tested were the maximum number of views a post reached (model A) and the number of views per year since posting (model B). For the model with the outcome as the maximum number of views, the number of views per year was included as a predictor. When the outcome was the views per year, the maximum number of views was included as a predictor. The r2 value for model A was 19% and the r2 value for model B was 47%; therefore, model B was used for the final analysis. Factorial plots for the Poisson regression were drawn in Minitab v.18 to assess the direction of each predictor’s influence on the model output along with assessment of Z values in the individual model output.
The final model run (model B) was the number of views per year since posting ~ Age of the YouTube post + the number of subscribers to the YouTube channel + annual visitation for the zoo + the proportion of mammals in the animal collection + total number of species in the collection overall + the diversity of species in the zoo’s animal collection + one of the most popular species to post about included in the video + the taxonomic class of the animal featured in the video + the maximum number of video views.
2.3.3. What Predicts the Number of Educational Points in a YouTube Video?
For the subsample of three zoos only, a Poisson regression model was run in RStudio to predict the number of educational points counted in each of the recent and each of the most popular YouTube videos posted from the subsample of three institutions. The final model run was Educational points ~ Theme of video + Taxonomic class + Duration + Age of the video + Popular or recent + Zoo ID. Post-hoc testing using the ‘pbkrtest’ [21] and ‘emmeans’ package in RStudio [22] was used to determine the direction of any difference between predictors for this model.
3. Results
3.1. Are there Differences in the Representation of Zoo Animals on YouTube?
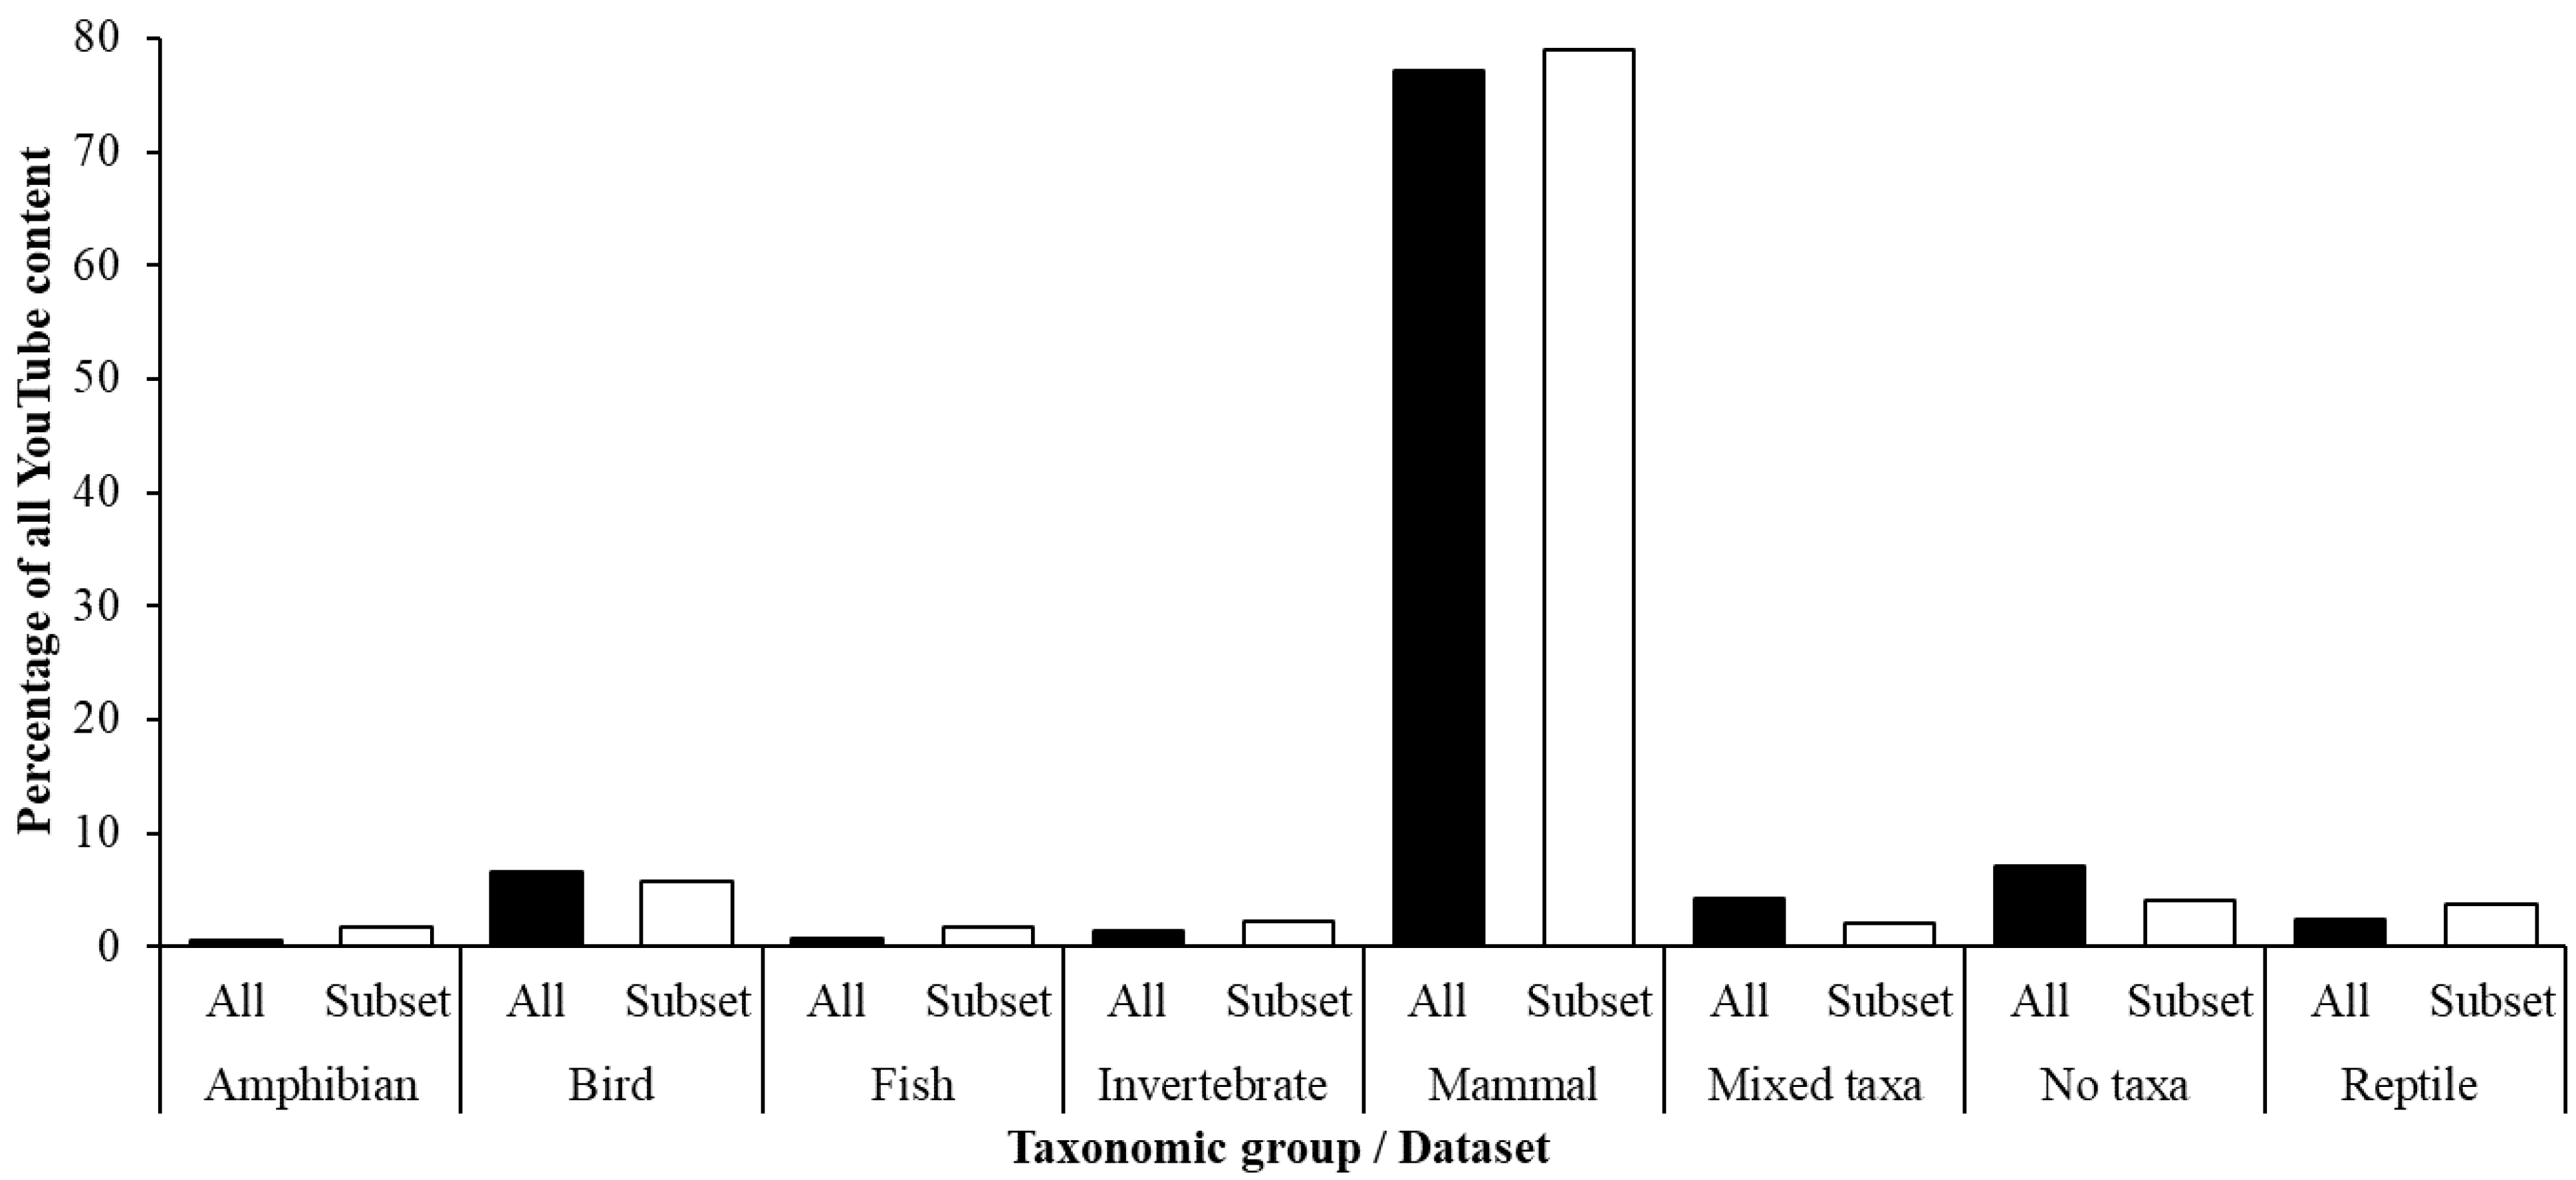
Within both the dataset for all 20 zoological institutions and for the subset of data for three zoos specifically, a disproportionate number of YouTube posts are directed towards mammalian subjects compared to other taxonomic groups (Figure 1).
A significant difference is evident between the number of postings from each zoo on mammals compared to other taxonomic groups and types of post (χ2 = 3862.7; N = 1000; df = 7; p < 0.001). Excluding YouTube content that was not animal-focused and excluding multi-taxa posts (N = 872), the highest number of posts for all 20 zoos are for Carnivora (43%), ungulates (18%), primates (11%), elephants (10%), penguins (3%) and snakes, lizards and tortoises (2.5%). For the subset of three zoos of ‘most popular posts’ for specific animal only videos (N = 278), the six most popular species postings are Carnivora (31%), ungulates (25%), primates (16%), elephants (4%), penguins (4%) and Pilosa (3%).
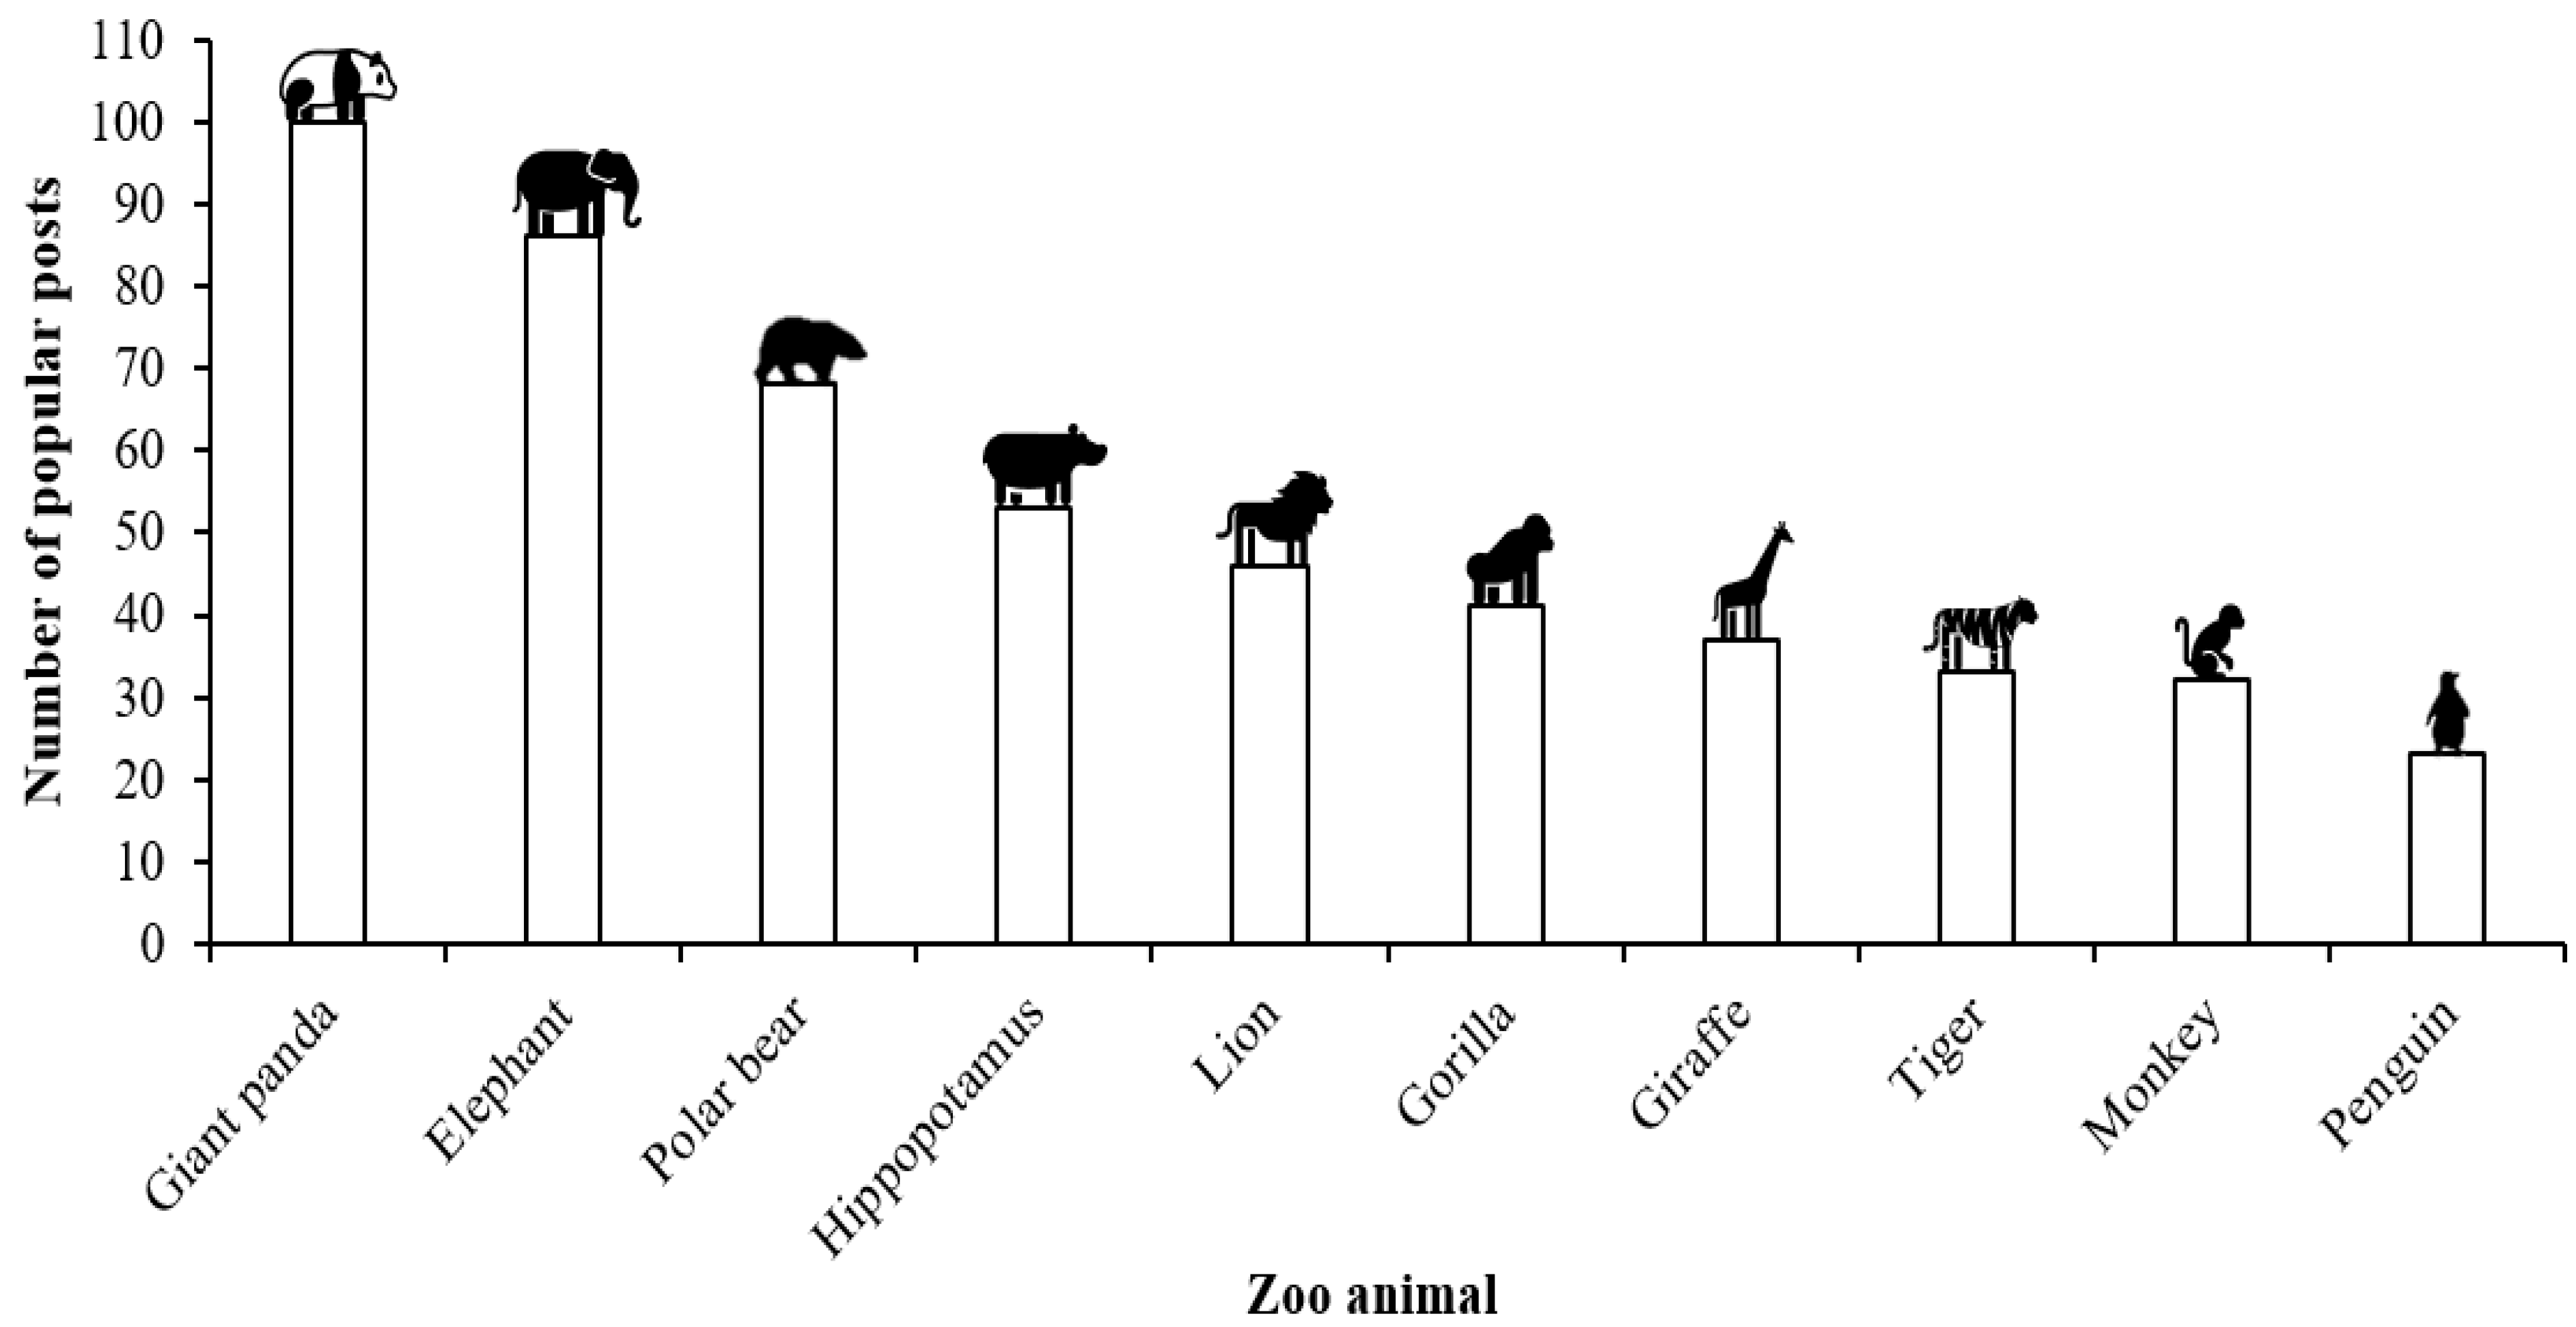
Across the sample of content from 20 YouTube channels, there is interspecies variability regarding the prevalence of different zoo animals within the most viewed content (Figure 2), indicating that certain species are more popular with the YouTube audience than others.
Figure 3 (below) shows no real pattern to the videos posted that feature threatened species: any increases in viewing of specific types of animal may be related to the species held within the zoo’s collection rather than their threat level attracting attention. The logistic regression model output shows that there are significant differences in numbers of posts per IUCN category per taxa present for ‘Endangered’ (estimate = 4.5 ± 0.00000000000171; Z value = 540,000,000,000; p = 0.001), for ‘Least Concern’ (estimate = 4.78 ± 0.000000000000456; Z value = 2,300,000,000,000; p < 0.001), for ‘Near Threatened’ (estimate = 4.0 ± 0.0000000000079; Z value = 760,000,000,000; p < 0.001) and for ‘Vulnerable’ (estimate = 3.2 ± 0.000000000007; Z value = 870,000,000,000; p < 0.001) taxa; however, this is likely influenced by each institutions collection of animals. Although within each IUCN category, there is no significant difference in the maximum views for each post on that category for that species, suggesting that viewers do not preferentially choose to view videos on threatened species.
When zoos house threatened species, these animals feature strongly on their YouTube channels. Giant pandas, African and Asian elephants and polar bears were the most likely to be posted about; however, for maximum views of videos with a threatened species, none of these species featured. The top three highest viewed videos featuring threatened species are (1) giraffe, Giraffa camelopardalis (VU) with 24,512,839 views, (2) bonobo, Pan paniscus (EN) with 16,457,095 views and (3) Galapagos giant tortoise, Chelonoidis nigra species complex (EN) with 10,380,340 views, suggesting the story behind the video may be an influential factor for viewing that content.
3.2. Does the Nature of the Animal Collection within Each Zoo Influence YouTube Content?
Table 3 shows the output from Spearman’s rho correlations of the proportion of each taxonomic class against the proportion of posts from all zoos combined. Significantly fewer posts on amphibians appear on the YouTube pages of these zoos compared to the number of amphibians held in each institution. A significant positive correlation is seen for fish, with an increasing number of posts produced when more fish species are kept. However, this correlation is heavily influenced by four outliers and only four of the 20 YouTube channels contained posts on fish, even though all but one of the sample institutions housed fish as part of the animal collection. When correlating the number of posts against the number of species held, a near-to-significant negative correlation is identified.
The output of Model B (views per year) is highly significant (estimate = 13.99 ± 0.0035; Z value = 4001.3; p < 0.001). The estimates for various predictors are provided in the Table 4. Multiple P values are compared to a corrected Benjamini and Hochberg [23] alpha level of 0.05 and significant Q values are provided.
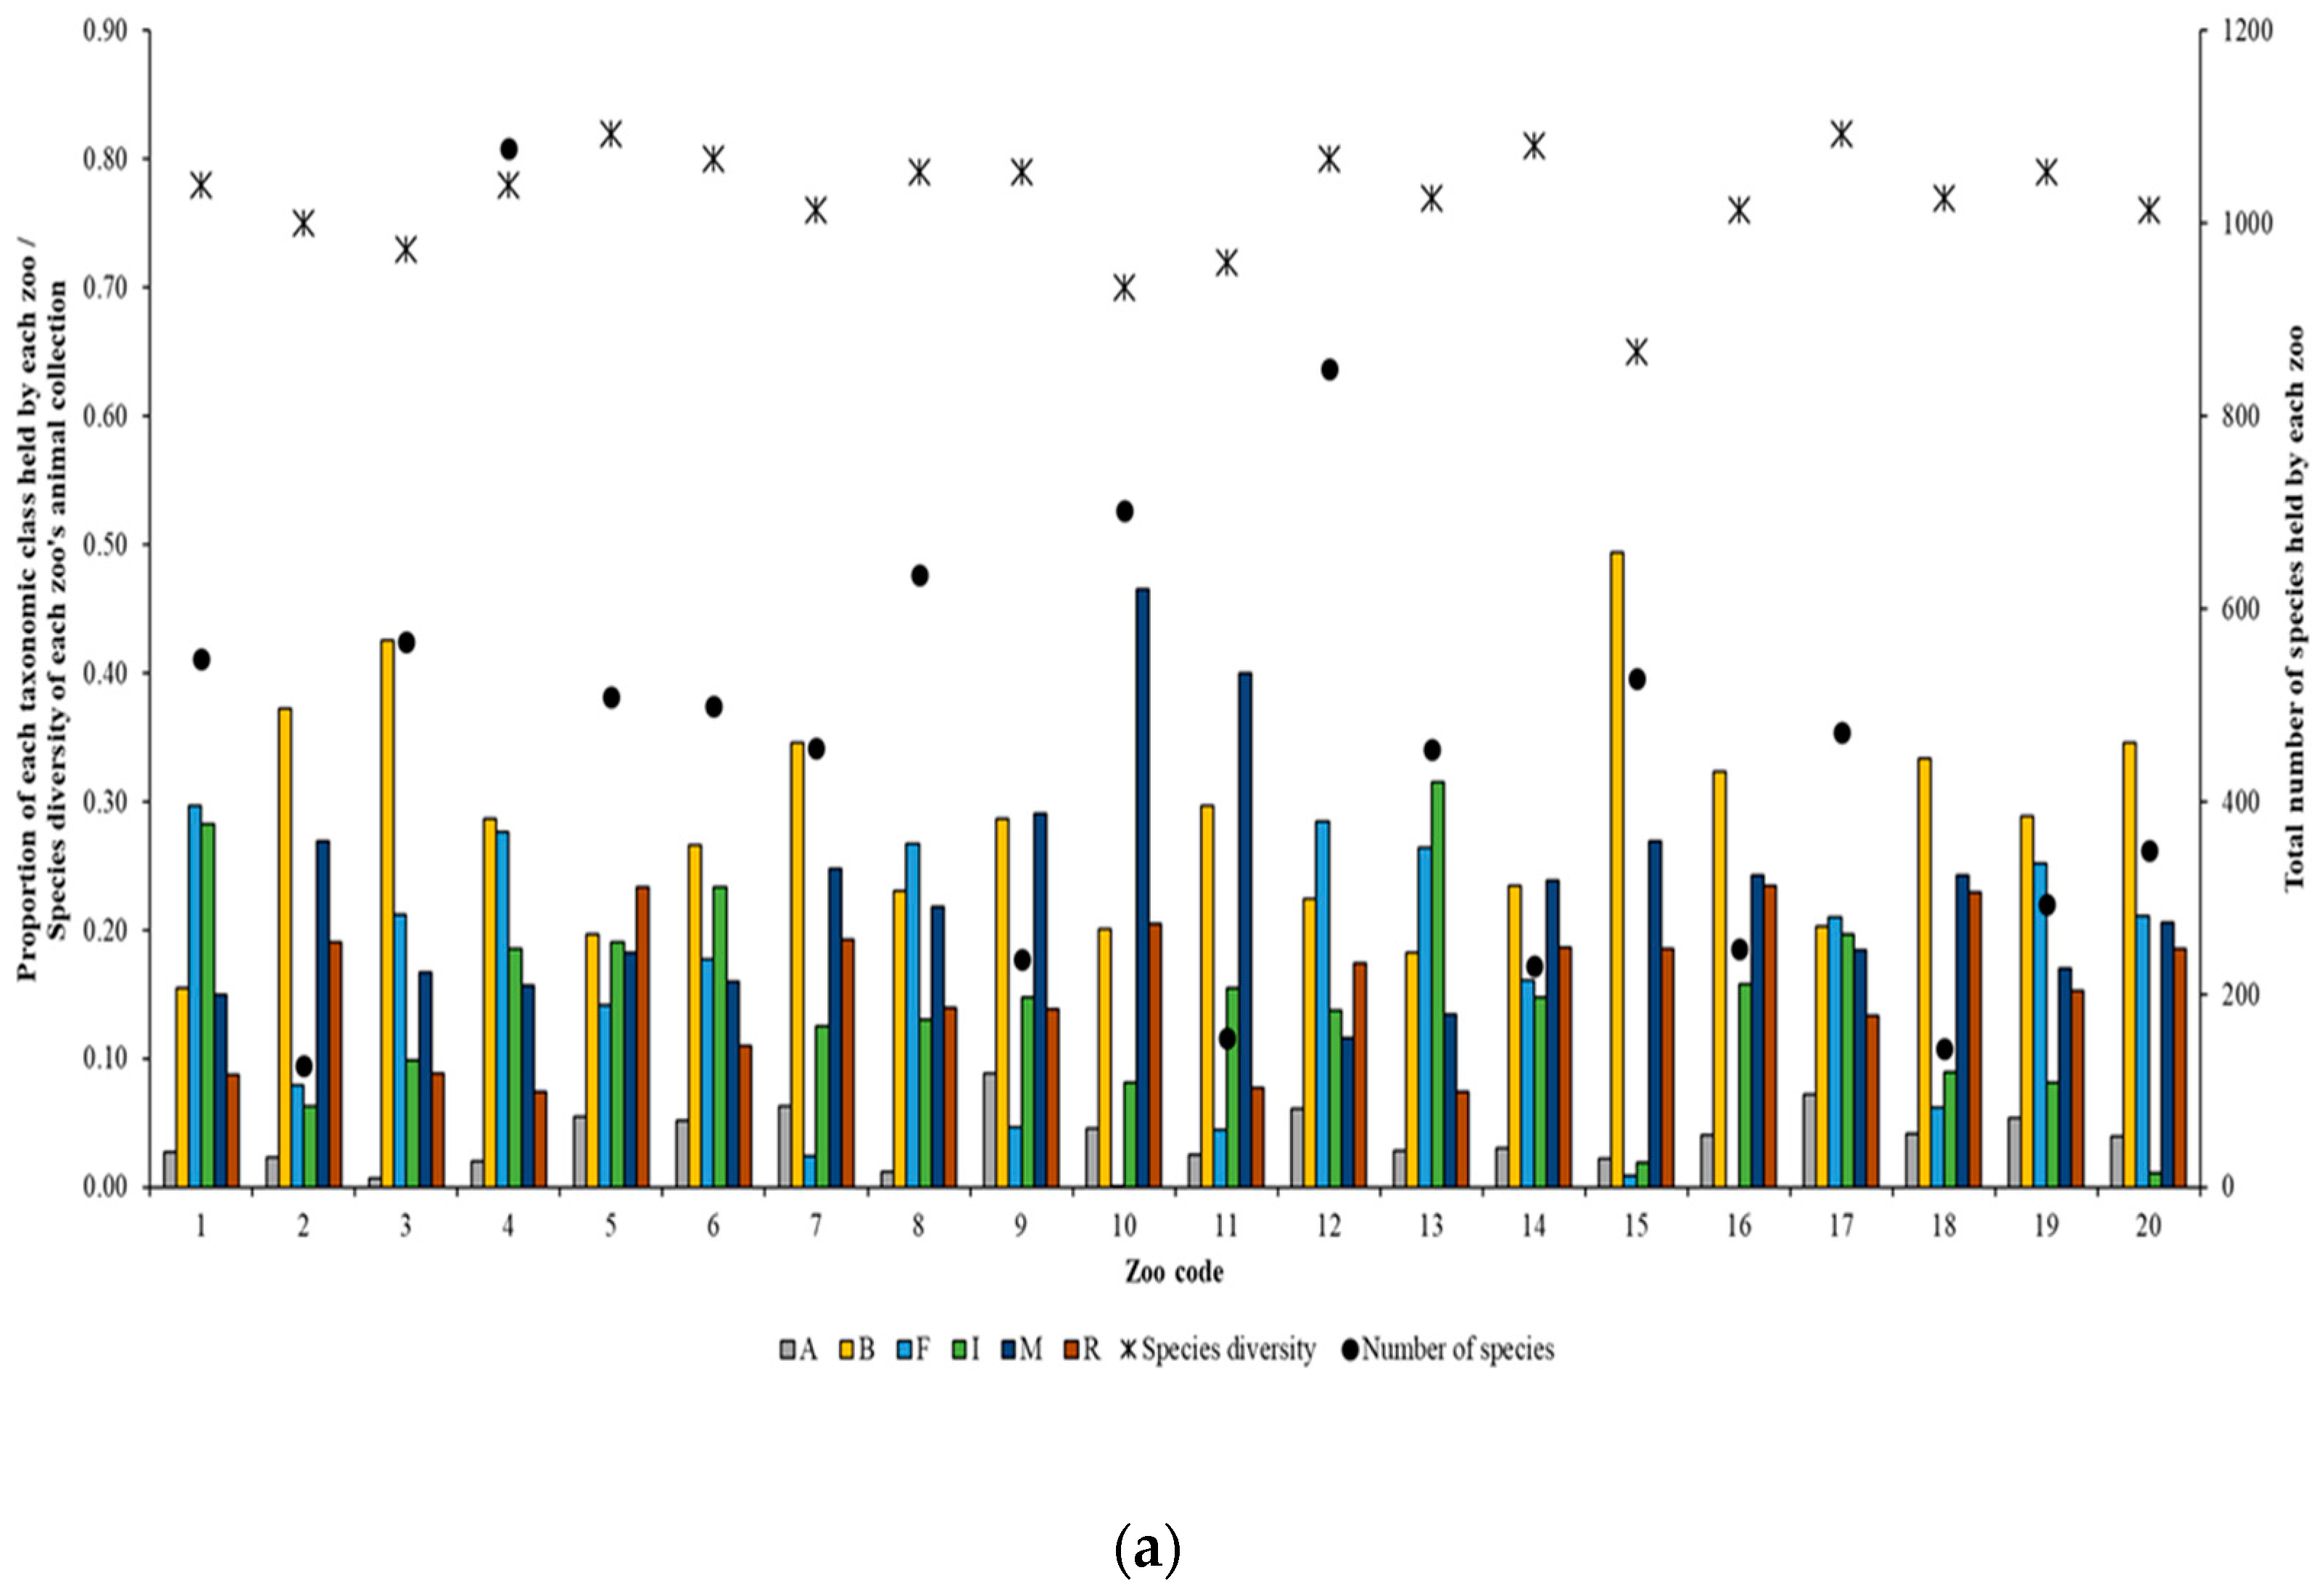
The output from this model shows that videos have a higher number of views when they feature a mammal and that invertebrate and fish posts create less engagement. The proportion of mammals in the zoo’s collection influenced the number of views more strongly-with a higher proportion of mammals leading to more video views than the occurrence of a ‘popular’ species in the post. Zoos with a lower diversity of species had more views of their videos compared to zoos that housed a more diverse collection of animals. This is similar to the effect of the overall number of species at the zoo, with zoos that have a smaller number of species having more engagement with their YouTube videos. Both in-person visitation and number of subscribers to the channel significantly influence number of video views, with model Z values being high for these predictors. The Z value for age is negative, suggesting that as posts get older, the fewer new views they receive. These results are supported by Figure 4a,b which shows that posts featuring mammals are consistently higher than those for other taxonomic groups and regardless of species number or species diversity of the animal collection, mammalian posts still dominate. Interestingly, even for more specialized facilities (e.g., zoo 15 with a large bird collection and zoos 1 and 12 with large fish collections), mammal-focused videos remain the norm.
3.3. What Are Zoos Posting: Now and Then?
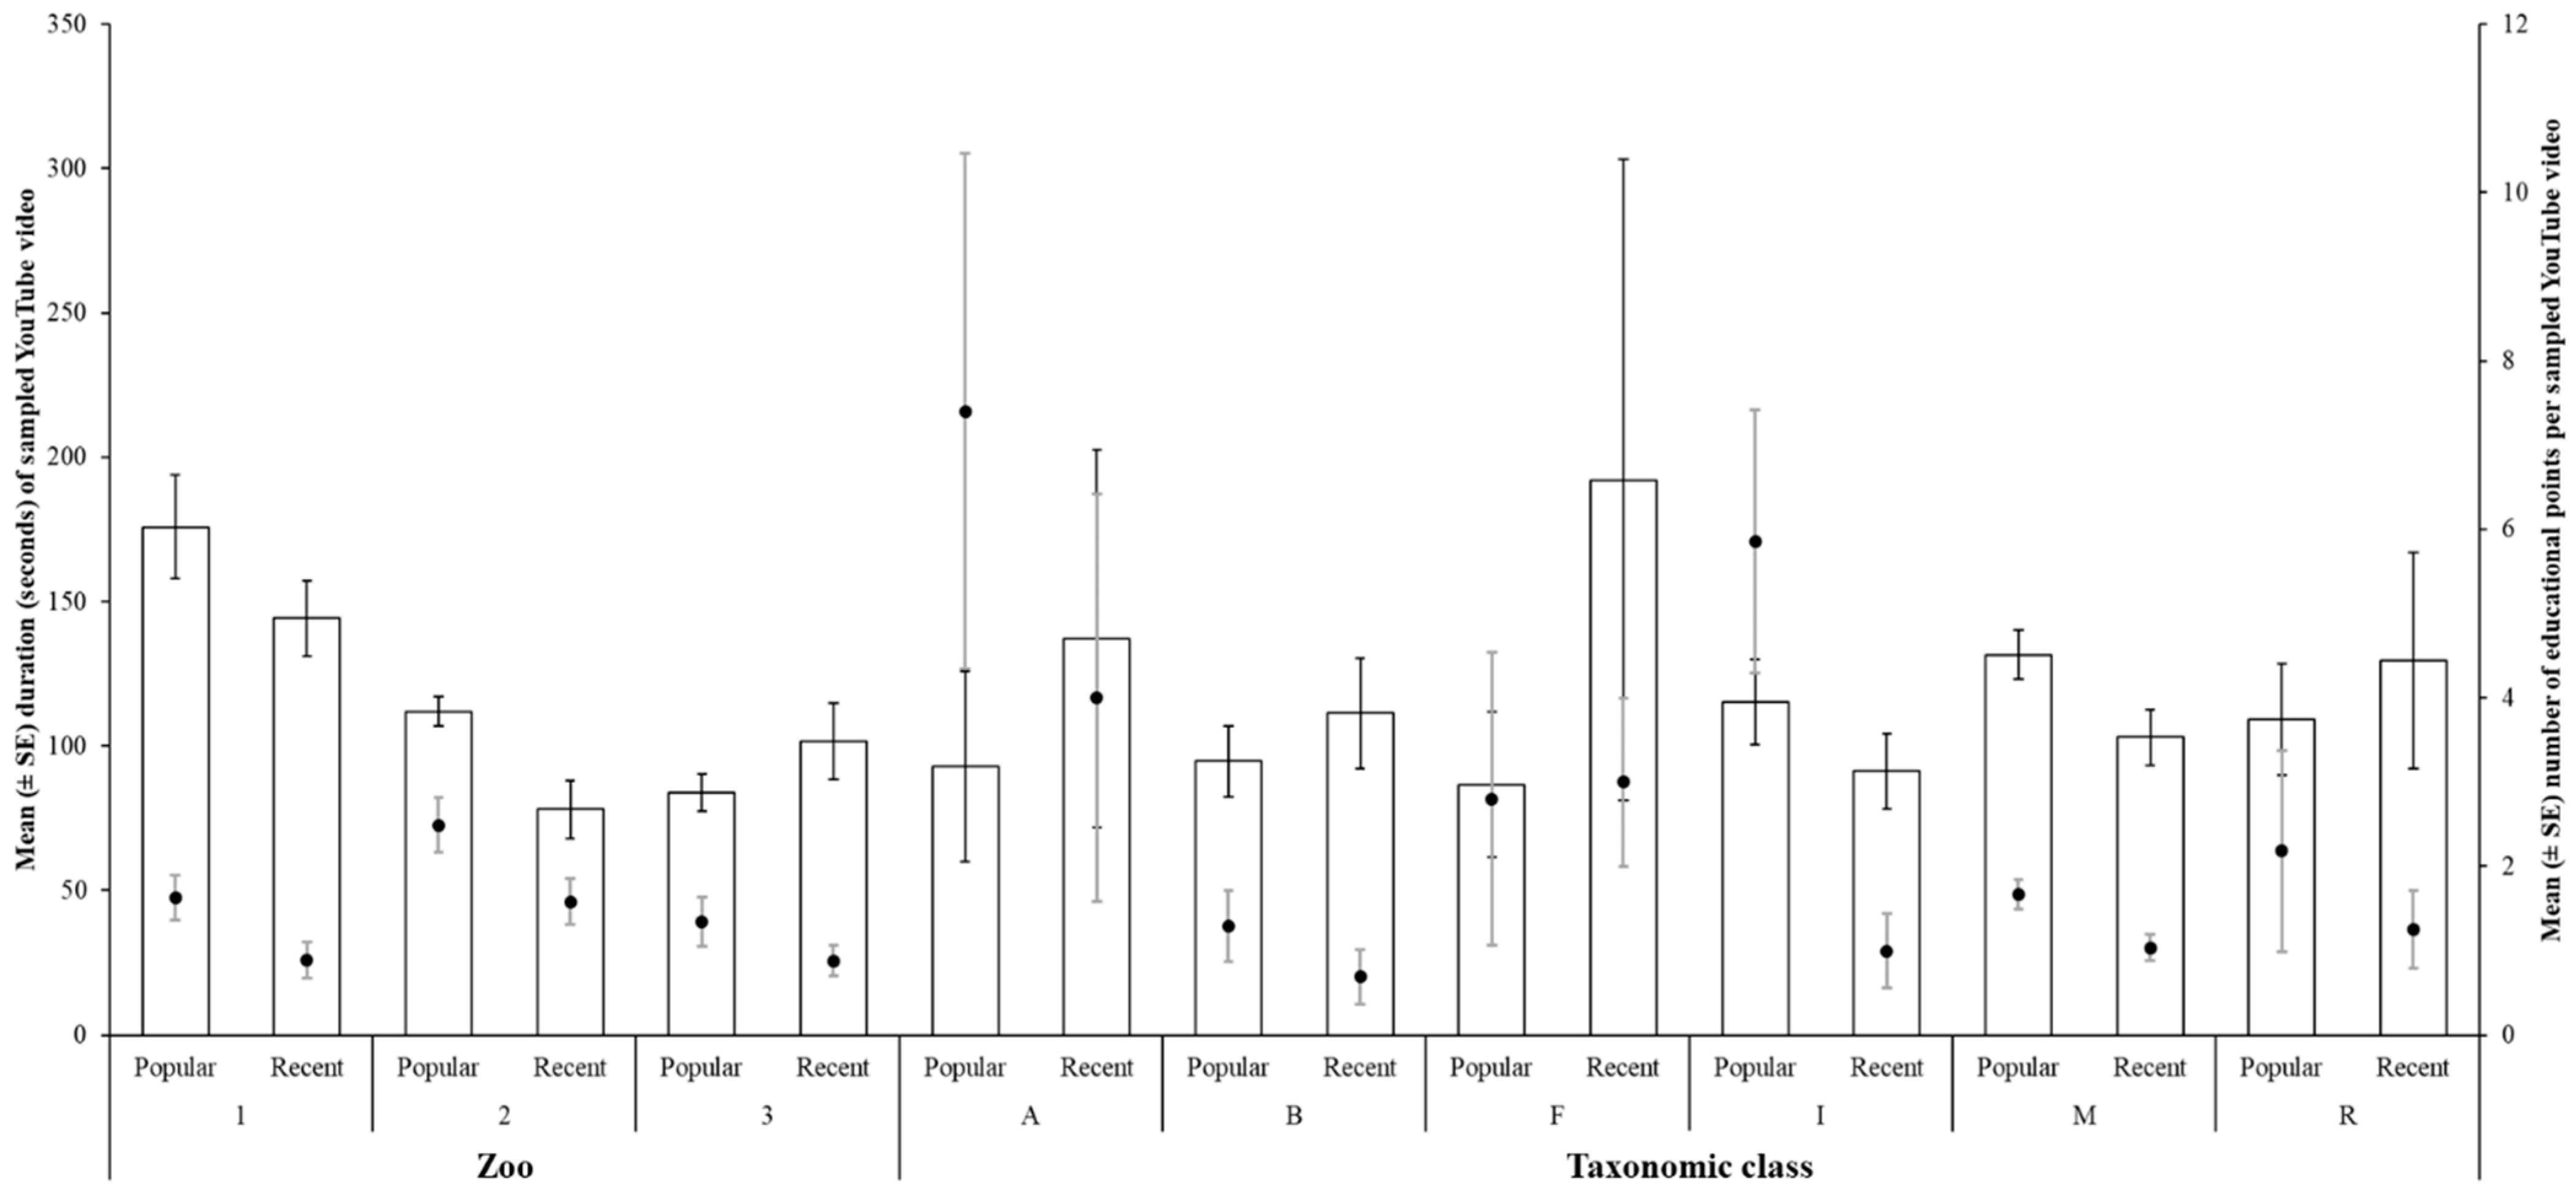
Comparing the 300 most recent postings from the subset of three zoos (2016–2019) against their 300 most popular videos (2006–2019) shows that for two out of the three channels, more recent videos are shorter than those most popular videos from a wider range of years (Figure 5). Likewise, for each sampled zoo, fewer educational points were counted per video compared to the popular category of videos from previous years. When comparing taxonomic groups, these zoos have increased the length of videos relating to amphibians, fish and reptiles over recent years but the educational messaging within these videos has dropped, which is consistent with reduced educational messaging for other taxonomic groups too.
Comparison of the themes posted from these three zoos shows that recent videos focus more on advertising and these videos are longer but contain a limited number of educational points (Table 5). Within the sample of popular content, 3% of videos presented conservation subjects, whereas 13% of recently produced videos were focused on this theme. Videos that highlight conservation stories and details of animal enclosures also saw a large increase in the number of posts and the length of the video over time, which mirrored an increase in the number of educational points presented within conservation-focused content.
Across all three zoos, posts about infant animals accounted for 60% of all popular posts but only 31% of recent posts, showing that zoos are diversifying their YouTube content. A shift in educational messaging towards conservation is also noted, with 40% of educational points being found in videos of infant animals in the set of most popular videos, but 42% of educational messaging being in conservation-focused posts in the set of most recent videos.
3.4. What Predicts the Number of Educational Points in a YouTube Video?
The output from the Poisson regression shows that specific themes, type of animal post, video length and whether the video is in the popular or recent category all significantly affect the number of educational points contained within a YouTube video produced by these three zoos. This was consistent between zoos as there was no significant difference for each institution (estimate = 0.15 ± 0.099; z ratio = 1.482; p = 0.138). Significant predictors of the number of educational points are provided in Table 6. Multiple p values were inputted into a Benjamini and Hochberg [23] correction factor but the significance level still returned as 0.05. The r2 for this model was 72%.
Post-hoc testing showed that popular videos have significantly more educational points in them compared to recent videos (estimate = 0.238 ± 0.115; z ratio = 2.075; p = 0.038). Videos that did not contain a specific animal type contained fewer educational elements than those that focused on specific types of animals at each respective zoo; for example, for amphibians compared to no taxa (estimate = 1.22 ± 0.315; z ratio = 3.865; p = 0.004), for birds compared to no taxa (estimate = 1.33 ± 0.312; z ratio = 4.28; p = 0.001) and invertebrates (estimate = 1.12 ± 0.320; z ratio = 3.51; p = 0.013). Videos about conservation contained more educational information than videos about infant animals (estimate = 0.724 ± 0.136; z ratio = 5.336; p < 0.001).
Videos that focused on presenting a ‘Full Profile’ of zoo animal were more educational in content than those videos that focused on specific individuals of that species (estimate = 3.53 ± 1.012; z ratio = 3.49; p = 0.032), on Infant Animals (estimate = 1.16 ± 0.118; z ratio = 9.837; p < 0.001) or on named individual animals of that species in the zoo (estimate = 0.881 ± 0.213; z ratio = 4.14; p = 0.0028). The last significant theme predictor of educational content was Full Profile videos being more education focused than those videos that detailed members of the zoo’s staff (estimate = 0.941 ± 0.209; z ratio = 4.494; p = 0.0006).
4. Discussion
4.1. Representation of Zoo Animals on YouTube
Zoos may house a diverse collection of animals [24], but they are not representing the diversity of these collections fully on YouTube; particularly, overrepresenting mammals (Figure 1) and underrepresenting amphibians (Table 3). Our results support those of other research that investigated mammal-orientated bias on Facebook [7], suggesting that the overrepresentation of certain animals occurs across different forms of social media. Interestingly, there is also evidence that the online audience has a clear viewing bias towards mammalian species (Figure 4a,b), which could be driving this bias.
Certain species appear to be more popular with YouTube audiences (Figure 2), indicating that users have distinct viewing preferences for online content. This suggests that YouTube could become an effective tool within public engagement programs of favored animals; capitalizing on viewer bias and using favored species as a ‘hook’ to encourage viewers to watch videos that could then promote pro-conservation behaviors. Any interspecies variability could be linked to perceived charisma of the featured species, with seven of our ten most popular animals on YouTube appearing in published lists of ten most charismatic zoo species [25,26].
Previous research has identified that social media could be a valuable tool for engaging people with endangered species conservation [7,27,28]; however, it is unclear whether viewers on YouTube are influenced by conservation status. YouTube may have the potential to expose a vast online audience to environmental issues and provide ready access to important projects, but more research is needed before the platform should be considered as a reliable tool for conservation education.
4.2. Education and Entertainment
The relationship between education and entertainment within the zoo setting has been discussed before [29,30,31,32], but rarely in regard to social media outputs. Despite education being one of the zoo’s primary goals [31,33,34], more recent content on YouTube is becoming less educational and shorter in duration (Figure 5), perhaps indicating a shift away from producing education-focused and towards entertainment-focused content. Interestingly, the most popular zoo content, i.e., the most viewed videos within the sample, contains more educational material and are longer in duration than recently produced videos. Whilst this merits further investigation, these results do suggest that there is a disparity between how the audience and zoo channels value online content, i.e., channels are producing shorter and more entertainment-focused videos, whereas their most popular content with viewers are longer and present more educational material.
The balance between education and entertainment is also highlighted when considering video themes. Conservation-focused content may contain more educational material than infant animal-focused content (Table 6), but videos on infant animals are more popular (Table 5). The public’s preference for infant animals is well-known [35], but we note that infants could act as a ‘hook’ for viewers within more educational content, i.e., zoos could capitalize on the audiences’ natural viewing preferences for infant animals, drawing them into watching videos and then present important conservation information.
4.3. Video Structure
Zoos are encouraged to explore a range of methods for public engagement [4] and this should also apply to the content they produce on social media. Our results demonstrate that a wide variety of videos can be both educational and entertaining to the broader YouTube audience. Specifically, videos that present an in-depth profile of a species were the most educational type of zoo-YouTube content, but this type of video was rarely produced; potentially because zoos may not believe that this would entertain viewers, but more research is needed before this can be identified. Whilst zoos should continue to produce videos that present a range of topics in a variety of different styles, utilizing ‘full profile’ videos could be an effective way for zoos to promote lesser-known species or animals of conservation concern.
4.4. A Changing Focus
As the YouTube platform has evolved over time, so has the content that zoos are producing. Zoos may appear to be moving away from producing education-focused videos (Table 5), but channels are diversifying the content that they are creating (Table 5). Many institutions consider themselves to be ecological organizations at the forefront of public conservation education [31,36] and they should maintain this ambition on social media. Despite the volume of educational material in content appearing to be reducing, videos that specifically focus on conservation are becoming more prevalent and more educational (Table 5). This indicates that zoos are aware that YouTube has the potential to be an effective tool for broadening their conservation education outreach to a wider audience and are slowly modifying their content to be more conservation-oriented.
4.5. Further Extensions and Limitations for this Research
Evaluating the unpopularity of social media posts would be a useful avenue of research extension to provide zoological organizations with information not only on what their online audiences like, but also on what topics they dislike too. Whilst ‘dislike data’ may be more limited overall and potentially more polarized, evaluation of the types of posts and subject trends that cause an online audience to engage in a negative manner is clearly of use to those considering how to best present the conservation and educational messaging of the zoo.
Not only the topic of the post may cause a negative reaction, but also the length of the post too. Longer videos may seem off-putting to some audiences (for example families watching with young children), so evaluation of the average length of the video in conjunction with likes and dislikes may provide insights into how to present information, on specific topics in the manner most likely to encourage positive engagement. It may be that videos below a certain average length are most likely to be viewed in a positive light because they are deemed more accessible.
This project was also conducted in a pre-pandemic YouTube-environment, where the content zoos were producing may have been different to the current online landscape. Subsequently, this research could be used by future studies as a foundation for a comparison between pre- and post-pandemic content, as well as a deeper analysis of the topic, especially involving pro-conservation viewer behaviors. This study was unable to examine the effect of different zoo-YouTube content on the encouragement of such pro-conservation behaviors; however, a more detailed analysis of behavioral outcomes would be beneficial to conservation institutions around the world that use YouTube.
Another avenue for future research specifically involves the popularity of certain zoo species on YouTube. We have identified that specific animals are more popular than others, but have not been able to identify why this disparity exists. A future investigation into species popularity would aid our understanding of the YouTube audience’s preference for zoological content, as well as identifying whether YouTube could become a beneficial tool for conservation projects associated with these favored animals.
5. Conclusions
This study has identified key preferences in the YouTube audiences’ choice of viewing videos on zoological channels. Higher number of views are seen for videos that feature mammals and particularly large charismatic species such as bears and elephants. Postings on YouTube do not necessarily mirror species diversity in animal collections, with lower numbers of posts seen for fish and amphibians compared to the overall number of species housed in these sample institutions, which is particularly concerning when these groups represent the largest proportion of threatened species. Consequently, educational content on YouTube should be diversified more to provide an opportunity for fact-finding and discovery on the part of the audience. With imagination, focus and a coordinated effort to maximize impact for a key animal, zoo output (e.g., conservation awareness) or project (e.g., conservation fundraising/education), YouTube channels could develop into mediums at the forefront of zoo science communication, public behavior change and conservation advocacy.
Author Contributions
Conceptualization, methodology, data collection, writing of the original draft and editing, T.L. Statistical analysis, software and writing review, P.E.R. All authors have read and agreed to the published version of the manuscript.
Funding
This research received no external funding.
Institutional Review Board Statement
Ethical approval for the original research project was provided by the University of the West of England’s Science Communication Unit as part of the postgraduate qualification completed by the lead author in 2021.
Data Availability Statement
Data is available upon reasonable request from the corresponding author.
Acknowledgments
Acknowledgments to Chris Svendsen for inspiring the original original postgraduate research project and Andrew Ridgeway for providing invaluable advice during its early development.
Conflicts of Interest
The authors declare no conflict of interest.
References
- Patrick, P.G.; Matthews, C.E.; Ayers, D.F.; Tunnicliffe, S.D. Conservation and education: Prominent themes in zoo mission statements. J. Environ. Educ. 2007, 38, 53–60. [Google Scholar] [CrossRef]
- Hacker, C.E.; Miller, L.J. Zoo visitor perceptions, attitudes, and conservation intent after viewing African elephants at the San Diego Zoo Safari Park. Zoo Biol. 2016, 35, 355–361. [Google Scholar] [CrossRef]
- Roe, K.; McConney, A.; Mansfield, C.F. How do zoos ‘Talk’ to their general visitors? Do visitors ‘Listen’? A mixed method investigation of the communication between modern zoos and their general visitors. Aust. J. Environ. Educ. 2014, 30, 167–186. [Google Scholar] [CrossRef]
- Thomas, S. Future perspectives in conservation education. Int. Zoo Yearb. 2016, 50, 9–15. [Google Scholar] [CrossRef] [Green Version]
- Brossard, D. New media landscapes and the science information consumer. Proc. Natl. Acad. Sci. USA 2013, 110 (Suppl. 3), 14096–14101. [Google Scholar] [CrossRef] [Green Version]
- Clay, A.W.; Perdue, B.M.; Gaalema, D.E.; Dolins, F.L.; Bloomsmith, M.A. The use of technology to enhance zoological parks. Zoo Biol. 2011, 30, 487–497. [Google Scholar] [CrossRef] [PubMed] [Green Version]
- Rose, P.E.; Hunt, K.A.; Riley, L.M. Animals in an online world; an evaluation of how zoological collections use social media. J. Zoo Aquar. Res. 2018, 6, 57–62. [Google Scholar]
- Bombaci, S.P.; Farr, C.M.; Gallo, H.T.; Mangan, A.M.; Stinson, L.T.; Kaushik, M.; Pejchar, L. Using Twitter to communicate conservation science from a professional conference. Conserv. Biol. 2016, 30, 216–225. [Google Scholar] [CrossRef] [PubMed]
- Light, D.; Cerrone, M. Science Engagement via Twitter: Examining the Educational Outreach of Museums, Zoos, Aquariums and Other Science Organizations. Visit. Stud. 2018, 21, 175–188. [Google Scholar] [CrossRef]
- Burgess, J. YouTube and the formalisation of amateur media. In Amateur Media: Social, Cultural and Legal Perspectives; Taylor & Francis: London, UK, 2013; pp. 53–58. [Google Scholar]
- Amarasekara, I.; Grant, W.J. Exploring the YouTube science communication gender gap: A sentiment analysis. Public Underst. Sci. 2019, 28, 68–84. [Google Scholar] [CrossRef] [PubMed]
- YouTube. Press Global Reach. 2020. Available online: https://www.youtube.com/intl/en-GB/about/press/ (accessed on 13 January 2020).
- Animal Planet. YouTube. 2020. Available online: https://www.youtube.com/c/animalplanet/about (accessed on 13 January 2020).
- BBC Earth. YouTube. 2020. Available online: https://www.youtube.com/c/bbcearth/about (accessed on 13 January 2020).
- Brave Wilderness. YouTube. 2020. Available online: https://www.youtube.com/c/BraveWilderness/about (accessed on 13 January 2020).
- Team R Core. R: A Language and Environment for Statistical Computing 2019; Version 3.5.2; R Foundation for Statistical Computing: Vienna, Austria, 2018. [Google Scholar]
- Team R Core. RStudio: Integrated Development for R 2018; Version 1.1. 463; RStudio Inc.: Boston, MA, USA, 2020; Available online: http://www.rstudio.com (accessed on 27 May 2020).
- Venables, W.N.; Ripley, B.D. Modern Applied Statistics with S; Springer: New York, NY, USA, 2002; Volume 4. [Google Scholar]
- Kleiber, C.; Zeileis, A. Applied Econometrics with R; Springer Science & Business Media: New York, NY, USA, 2008. [Google Scholar]
- Hill, M.O. Diversity and evenness: A unifying notation and its consequences. Ecology 1973, 54, 427–432. [Google Scholar] [CrossRef] [Green Version]
- Halekoh, U.; Højsgaard, S. A kenward-roger approximation and parametric bootstrap methods for tests in linear mixed models–the R package pbkrtest. J. Stat. Softw. 2014, 59, 1–30. [Google Scholar] [CrossRef] [Green Version]
- Lenth, R.; Singmann, H.; Love, J. Emmeans: Estimated Marginal Means, Aka Least-Squares Means. R Package Version 2018, 1. Available online: cran.r-project.org/web/packages/emmeans/index.html (accessed on 27 May 2020).
- Benjamini, Y.; Hochberg, Y. Controlling the false discovery rate: A practical and powerful approach to multiple testing. J. R. Stat. Soc. Ser. B Methodol. 1995, 57, 289–300. [Google Scholar] [CrossRef]
- Gartner, M.C.; Weiss, A. Studying primate personality in zoos: Implications for the management, welfare and conservation of great apes. Int. Zoo Yearb. 2018, 52, 79–91. [Google Scholar] [CrossRef] [Green Version]
- Albert, C.; Luque, G.M.; Courchamp, F. The twenty most charismatic species. PLoS ONE 2018, 13, e0199149. [Google Scholar] [CrossRef] [PubMed] [Green Version]
- Courchamp, F.; Jaric, I.; Albert, C.; Meinard, Y.; Ripple, W.J.; Chapron, G. The paradoxical extinction of the most charismatic animals. PLoS Biol. 2018, 16, e2003997. [Google Scholar] [CrossRef] [PubMed] [Green Version]
- Sullivan, M.; Robinson, S.; Littnan, C. Social media as a data resource for #monkseal conservation. PLoS ONE 2019, 14, e0222627. [Google Scholar]
- Toivonen, T.; Heikinheimo, V.; Fink, C.; Hausmann, A.; Hiippala, T.; Järv, O.; Tenkanen, H.; Di Minin, E. Social media data for conservation science: A methodological overview. Biol. Conserv. 2019, 233, 298–315. [Google Scholar] [CrossRef]
- Gross, M. Can zoos offer more than entertainment? Curr. Biol. 2015, 25, 391–394. [Google Scholar] [CrossRef] [PubMed] [Green Version]
- Roe, K.; McConney, A. Do zoo visitors come to learn? An internationally comparative, mixed-methods study. Environ. Educ. Res. 2015, 21, 865–884. [Google Scholar] [CrossRef]
- Ballantyne, R.; Packer, J. Visitors’ perceptions of the conservation education role of zoos and aquariums: Implications for the provision of learning experiences. Visit. Stud. 2016, 19, 193–210. [Google Scholar] [CrossRef]
- Webber, S.; Carter, M.; Smith, W.; Vetere, F. Interactive technology and human–animal encounters at the zoo. Int. J. Hum. Comput. Stud. 2017, 98, 150–168. [Google Scholar] [CrossRef]
- Patrick, P.G.; Caplow, S. Identifying the foci of mission statements of the zoo and aquarium community. Mus. Manag. Curatorship 2018, 33, 120–135. [Google Scholar] [CrossRef]
- Collins, C.K. Education in the Zoo: A Study of the Relationship between Education, Zoo Visitors and Animal Behaviour. Ph.D. Dissertation, University College, Cork, Ireland, 2018. [Google Scholar]
- Carr, N. An analysis of zoo visitors’ favourite and least favourite animals. Tour. Manag. Perspect. 2016, 20, 70–76. [Google Scholar] [CrossRef]
- Ojalammi, S.; Nygren, N.V. Visitor perceptions of nature conservation at Helsinki zoo. Anthrozoös 2018, 31, 233–246. [Google Scholar] [CrossRef]
Figure 1.
Taxonomic group representation, number of posts (as a percentage) for the sample (black) and subset of zoos each main taxonomic group for all 20 zoos (black) and the subset of three zoos (white-most popular posts only).
Figure 1.
Taxonomic group representation, number of posts (as a percentage) for the sample (black) and subset of zoos each main taxonomic group for all 20 zoos (black) and the subset of three zoos (white-most popular posts only).

Figure 2.
The ten species that featured most frequently in the most viewed (and therefore most popular in this sample) videos across all 20 YouTube channels: Giant panda (100 posts), African and Asian elephant (86 posts), polar bear (68 posts), common and pygmy hippopotamus (53 posts), lion (46 posts), gorilla (41 posts), giraffe (37 posts), tiger (33 posts), monkey (32 posts) and penguin (23 posts).

Figure 3.
Conservation status of content, the percentage of posts on taxa with an IUCN threat level across all 20 zoos compared to the views of that post (as a percentage of all views for all posts featuring that class) against the maximum number of views for a post focusing on a species of that taxonomic class (A = Amphibian, B = Bird, F = Fish, I = Invertebrate, M = Mammal, R = Reptile) with an IUCN threat category (CR = Critically Endangered, EN = Endangered, VU = Vulnerable, NT = Near Threatened, LC = Least Concern).

Figure 4.
(a) Species diversity, the diversity of species and total number of animals held in each zoo’s animal collection compared to the proportion of each taxonomic class held (top graph). A = Amphibian, B = Bird, F = Fish, I = Invertebrate, M = Mammal, R = Reptile. (b) The proportion of all YouTube videos posted about for a specific taxonomic class. Number of species given as black dots and species diversity given as black crosses. A = Amphibian, B = Bird, F = Fish, I = Invertebrate, M = Mammal, R = Reptile.


Figure 5.
Duration and education, the mean duration of YouTube videos (left Y-axis) compared to the mean number of educational points per YouTube video (right Y-axis) for each zoo overall and for each taxonomic class posted about by these three zoos. Mean values ± standard error.
Figure 5.
Duration and education, the mean duration of YouTube videos (left Y-axis) compared to the mean number of educational points per YouTube video (right Y-axis) for each zoo overall and for each taxonomic class posted about by these three zoos. Mean values ± standard error.


Table 1.
Sampled zoo-YouTube channels.
| Zoo-YouTube Channel | Region | Subscribers * | Total Views |
|---|---|---|---|
| ARTIS Amsterdam Royal Zoo | Europe | 50,000 | 30,846,578 |
| Chester Zoo | Europe | 6000 | 3,403,544 |
| Copenhagen Zoo | Europe | 35,000 | 20,147,461 |
| Edinburgh Zoo | Europe | 20,000 | 9,932,246 |
| Zoo und Tierpark Berlin | Europe | 6000 | 3,403,544 |
| ZooParc de Beauval | Europe | 6000 | 10,895,142 |
| ZSL-Zoological Society of London a | Europe | 46,000 | 27,602,288 |
| Brookfield Zoo | North America | 38,000 | 23,483,706 |
| Columbus Zoo and Aquarium | North America | 30,000 | 17,415,837 |
| Dallas Zoo | North America | 14,000 | 12,159,760 |
| Houston Zoo | North America | 30,000 | 14,320,031 |
| Oregon Zoo | North America | 67,000 | 40,127,138 |
| San Diego Zoo | North America | 98,000 | 74,482,771 |
| The Cincinnati Zoo and Botanical Garden | North America | 197,000 | 115,881,113 |
| Wildlife Conservation Society b | North America | 18,000 | 15,302,849 |
| Woodland Park Zoo | North America | 24,000 | 32,420,234 |
| Toronto Zoo | North America | 34,000 | 31,738,217 |
| Taipei Zoo | Asia | 168,000 | 86,765,137 |
| Auckland Zoo | Oceania | 11,000 | 5,134,575 |
| Zoos Victoria | Oceania | 14,000 | 10,964,408 |
* Subscriber count rounded to nearest thousand and correct at time of data collection (2019). a Zoological Society of London YouTube channel encompasses London and Whipsnade Zoo. b Wildlife Conservation Society YouTube channel encompasses the Bronx Zoo, Central Park Zoo, Prospect Park Zoo, Queens Zoo and New York Aquarium.
Table 2.
Video themes presented within zoo-YouTube content.
| Video Theme * | Theme Description |
|---|---|
| Advertisement | Videos presenting information relating to the advertisement of the site i.e., admission discounts, sponsored content or commercials. |
| Behavior | Videos presenting an animal expressing a specific behavior. |
| Compilation | Videos presenting multiple animal species within the same content or from multiple compiled videos. |
| Conservation | Videos presenting associated conservation projects, managed breeding program or a new discovery within the fields of conservation, ecology and animal management. |
| Enclosure | Videos presenting animal enclosures, plans to develop existing enclosures or aspects of enrichment introduced by the zookeepers to enhance the enclosure. |
| Full Profile | Videos presenting multiple topics of information designed to give a comprehensive view of the species, genus, family, order or taxonomic class. |
| Infant Animals | Videos presenting the birth of an animal, infant animals or animals in juvenile stages of development. |
| Named Individuals | Videos presenting an individual zoo animal that has been named in either in the video title or within the duration of content. |
| Work of Zoo Staff | Videos clearly presenting the work of zookeepers, non-husbandry-based zoo roles or veterinary staff. |
* If a video featured multiple themes, the most prevalent theme was listed first and if a theme did not fit the classifications described, they were coded as ‘Other’.
Table 3.
Taxonomic proportion in posts, Spearman’s rho correlation coefficients and p values that compare the proportion of each taxa held across zoos and the number of posts on that taxonomic class.
Table 3.
Taxonomic proportion in posts, Spearman’s rho correlation coefficients and p values that compare the proportion of each taxa held across zoos and the number of posts on that taxonomic class.
| Class | Correlation Coefficient | p Value |
|---|---|---|
| Amphibian | −0.439 | 0.05 * |
| Bird | 0.150 | 0.528 |
| Fish (all) | 0.654 | 0.02 * |
| Fish (four institutions only) | −0.949 | 0.051 |
| Invertebrate | 0.241 | 0.306 |
| Mammal | 0.061 | 0.799 |
| Reptile | −0.159 | 0.503 |
Significant p values are indicated as *.
Table 4.
Predictors of views, the output from a Poisson regression to determine the influence of key post and zoo characteristics on the number of views per year for all sampled posts from the 20 zoo-YouTube channels.
Table 4.
Predictors of views, the output from a Poisson regression to determine the influence of key post and zoo characteristics on the number of views per year for all sampled posts from the 20 zoo-YouTube channels.
| Predictor | Estimate (±SE) | Z Value | p Value | Q Value |
|---|---|---|---|---|
| Age of the post (years since posting) | −0.03 (0.000047) | −6354.9 | <0.001 | 0.0033 |
| Maximum number of views | 0.000000201 (0.000000000010) | 19814.3 | <0.001 | 0.0067 |
| Subscribers to the YouTube channel | 0.0000052 (0.000000003) | 1882.62 | <0.001 | 0.0100 |
| Visitation | 0.00000017 (0.00000000012) | 1353.14 | < 0.001 | 0.0133 |
| Species diversity | −2.99 (0.0033) | −915.70 | <0.001 | 0.0167 |
| Total number of species in the zoo’s animal collection | −0.00031 (0.0000005) | −610.41 | <0.001 | 0.0200 |
| Proportion of mammals in the zoo’s collection | 0.61 (0.0011) | 539.88 | <0.001 | 0.0233 |
| Did the video feature a popular species? | −0.13 (0.00014) | −947.51 | <0.001 | 0.0267 |
| Taxonomic class (Bird) | 0.0348 (0.003) | 13.08 | <0.001 | 0.0300 |
| Taxonomic class (Fish) | −0.59 (0.0044) | −133.04 | <0.001 | 0.0333 |
| Taxonomic class (Invertebrate) | −0.95 (0.0035) | −273.89 | <0.001 | 0.0367 |
| Taxonomic class (Mammal) | 0.198 (0.0026) | 75.69 | <0.001 | 0.0400 |
| Taxonomic class (Reptile) | 0.86 (0.0027) | 324.13 | <0.001 | 0.0433 |
| Taxonomic class (Mixed taxa) | −0.24 (0.0027) | −88.12 | <0.001 | 0.0467 |
| Taxonomic class (non-animal) | 0.405 (0.0026) | 153.53 | <0.001 | 0.0500 |
Table 5.
Themes and education, the number of posts and corresponding sum of educational points and average duration for the combined most popular and most recent YouTube video themes from the subsample of three zoos.
Table 5.
Themes and education, the number of posts and corresponding sum of educational points and average duration for the combined most popular and most recent YouTube video themes from the subsample of three zoos.
| Theme | Category | Posts (Number) | Educational Points (Total) | Duration (Seconds) Mean ± SE |
|---|---|---|---|---|
| Advertisement | Popular | 17 | 13 | 56.59 (14.3) |
| Recent | 30 | 6 | 76.33 (11.7) | |
| Behavior | Popular | 40 | 25 | 87.65 (7.62) |
| Recent | 33 | 23 | 83.52 (7.99) | |
| Compilation | Popular | 3 | 0 | 107.00 (21.9) |
| Recent | 6 | 0 | 76.00 (16.7) | |
| Conservation | Popular | 8 | 26 | 82.63 (23.7) |
| Recent | 40 | 139 | 142.55 (24.5) | |
| Discovery | Popular | 1 | 0 | 65.00 |
| Enclosure | Popular | 12 | 10 | 97.89 (14.4) |
| Recent | 52 | 60 | 125.21 (16.3) | |
| Full Profile | Popular | 23 | 200 | 126.61 (8.66) |
| Recent | 3 | 20 | 83.33 (24.5) | |
| Individual Animals | Popular | 3 | 1 | 336.67 (264) |
| Recent | 3 | 0 | 84.67 (22.7) | |
| Infant Animals | Popular | 179 | 221 | 138.06 (10.2) |
| Recent | 93 | 52 | 104.37 14.3) | |
| Named Individuals | Popular | 7 | 18 | 88.57 (16.7) |
| Recent | 20 | 11 | 77.20 (16.7) | |
| Other | Popular | 1 | 6 | 262.00 |
| Recent | 5 | 7 | 339.00 (155) | |
| Profiles | Popular | 1 | 10 | 251.00 |
| Zoo Staff | Popular | 5 | 16 | 142.00 (14.6) |
| Recent | 14 | 15 | 80.86 (15.1) |
Table 6.
Predictors and education, model output for significant predictors of the number of educational points in YouTube videos for three large zoological collections.
Table 6.
Predictors and education, model output for significant predictors of the number of educational points in YouTube videos for three large zoological collections.
| Predictor | Estimate (±SE) | Z Value | p Value | Q Value |
|---|---|---|---|---|
| Theme (Behavior) | 0.911 (0.301) | 3.030 | 0.002 | 0.0300 |
| Theme (Conservation) | 1.368 (0.230) | 5.202 | <0.001 | 0.0033 |
| Theme (Enclosure) | 0.902 (0.288) | 3.138 | 0.0017 | 0.0267 |
| Theme (Full Profile) | 1.81 (0.270) | 6.710 | <0.001 | 0.0067 |
| Theme (Infant Animals) | 0.644 (0.273) | 2.355 | 0.019 | 0.0467 |
| Theme (Named Individuals) | 0.926 (0.324) | 2.863 | 0.004 | 0.0333 |
| Theme (Profiles) | 1.823 (0.456) | 3.994 | <0.001 | 0.0100 |
| Theme (Zoo Staff) | 0.866 (0.309) | 2.804 | 0.0051 | 0.0433 |
| Taxonomic class (None) | −1.22 (0.315) | −3.865 | <0.001 | 0.0133 |
| Duration of video | 0.019 (0.00021) | 9.252 | <0.001 | 0.0233 |
| Popular or Recent? | 0.038 (0.115) | −2.075 | 0.038 | 0.0500 |
Publisher’s Note: MDPI stays neutral with regard to jurisdictional claims in published maps and institutional affiliations. |
© 2021 by the authors. Licensee MDPI, Basel, Switzerland. This article is an open access article distributed under the terms and conditions of the Creative Commons Attribution (CC BY) license (https://creativecommons.org/licenses/by/4.0/).
Share and Cite
MDPI and ACS Style
Llewellyn, T.; Rose, P.E. Education Is Entertainment? Zoo Science Communication on YouTube. J. Zool. Bot. Gard. 2021, 2, 250-264. https://0-doi-org.brum.beds.ac.uk/10.3390/jzbg2020017
AMA Style
Llewellyn T, Rose PE. Education Is Entertainment? Zoo Science Communication on YouTube. Journal of Zoological and Botanical Gardens. 2021; 2(2):250-264. https://0-doi-org.brum.beds.ac.uk/10.3390/jzbg2020017
Chicago/Turabian StyleLlewellyn, Thomas, and Paul E. Rose. 2021. "Education Is Entertainment? Zoo Science Communication on YouTube" Journal of Zoological and Botanical Gardens 2, no. 2: 250-264. https://0-doi-org.brum.beds.ac.uk/10.3390/jzbg2020017