
Application of the Generalized Thurstone Method for Evaluations of Sports Tournaments’ Results


Department of Mathematics, University of Pannonia, 8200 Veszprém, Hungary
*
Author to whom correspondence should be addressed.
†
These authors contributed equally to this work.
Knowledge 2022, 2(1), 157-166; https://0-doi-org.brum.beds.ac.uk/10.3390/knowledge2010009
Submission received: 9 February 2022
/
Revised: 1 March 2022
/
Accepted: 9 March 2022
/
Published: 14 March 2022
Abstract
:Due to the non-played matches on the grounds of COVID-19 pandemics, the usual evaluation of the results of tournaments is biased. Matches won by default may cause unrealistic results. In this paper, an expedient method, the generalization of Thurstone method for more than two options, is applied. It is able to evaluate the results of the played matches without requiring equal matches’ numbers. This method takes the strength of the opposer into consideration as well. We apply the method for evaluating Handball Champions’ League’s results. We illustrate that it efficiently predicts the results in the future.
1. Introduction
Sport competitions are noble struggles for sportsmen and popular entertainment for viewers. This applies especially to the best tournaments, such as the UEFA Champions’ League or the EHF Handball Champions League. The organizing rules are widely investigated, and new approaches are proposed by researchers [1,2].
The methods of the transaction of the tournaments are set out before the beginning of the competitions. Nowadays, the COVID-19 pandemics has made an impact on the matches, even on the number of matches. Sometimes the matches cannot be played. In case the matches are missed, the points are allocated to the “innocent” side, and this may affect the rankings. To eliminate the impacts of the missed matches, instead of the allocated points, the ratios of the points and the number of played matches might be considered to determine the rankings. However, this method does not take it into consideration which matches are canceled, even though it is an important piece of information. In this paper, such a method is investigated, which can eliminate the effects of the allocated points. Moreover, with its help, the participants of the final phase and the final ranking could also be forecast. Moreover, sometimes the tournament is canceled without the announcement of results. In these cases, it would be particularly important to know the relative strength of all teams because it could be important information for the next season.
The main idea of the evaluation is to consider the result of a match as the result of a paired comparison, which can be found, for example, in [3], constructing a ranking of the top tennis players in the world. Comparisons in pairs are often used in multicriteria decision making, the area of the applications are extremely wide: psychology [4], finance [5], education [6], communication technology [7], politics [8], management [9], economy [10], and so on.
The most frequently used method is AHP (Analytic Hierarchy Process) which is connected to Saaty [11]. The starting point is a pairwise comparison matrix reflecting the ratio of the strengths of the objects on the basis of the results. However, based on a low number of matches played against each other, it is very difficult to find a trustworthy quantity for the mentioned ratio. Moreover, in case of a pairwise comparison matrix, the most frequently used evaluation method is the principal eigenvector method, which requires all the elements in the matrix. If some matches are canceled, this requirement may not hold. In case of incomplete comparisons (i.e., some teams do not play with some others), in [12] Bozóki et al. present an alternative evaluation method, but the construction of the pairwise comparison matrix cannot be avoided. Moreover, the evaluation of the pairwise comparison matrix provides good numerical results only if the results of the matches are consistent. However, in sports, the transitivity does not necessarily hold. Therefore, another method is here suggested, which requires neither a pairwise comparison matrix nor consistency.
The suggested method is the generalized version of the Thurstone method, which is a probabilistic method. Its main idea is to consider the performance of the teams as random quantities. The method, in its first version, was elaborated by Thurstone [13], who applied it to evaluate subjective opinions in psychology. The concept of stochasticity is not far from reality, as the surprising changes in the teams’ performances from matches to matches show.
The Thurstone method has been previously applied to evaluating sports results. A recently published paper [14] applies the Thurstone method to Formula (1) to evaluate the racers. Another publication [15], analyzes the variations of the strengths of sumo competitors based on large amount of data. These papers, as usual, apply two options, win and defeat. This is the case in [16] even in case of football: Tie is handled as one win and one lose. The paper [17] builds the ties into the models and provides some methods for calculating the instantaneous strengths of the teams step by steps. The methods are iterations changing the strengths of the teams by a local gradient, motivated by Elo rating [18].
The paper is organized as follows: after this introduction, in Section 2, the method of evaluation is briefly presented. Section 3 contains the results together with their analysis, comparisons and explanations: in Section 3.1, we can find the results of the evaluations of the group phase in case of the EHF Handball Women Championship with comparisons to the official results. Section 3.2 presents the unified ranking of all teams. Section 3.3 contains predictions for the further phases and their comparisons with the true tournament results. Finally, Section 4 is a short summary of the benefits of the applied method.
2. The Applied Method
Our paper applies a version of the Thurstone method generalized for more than two options allowing winnings, ties and defeats, and it estimates the parameters by maximum likelihood method (ML). The key issue of ML estimation is the existence and the uniqueness of the estimator. For that purpose, we use a theorem proved in [19].
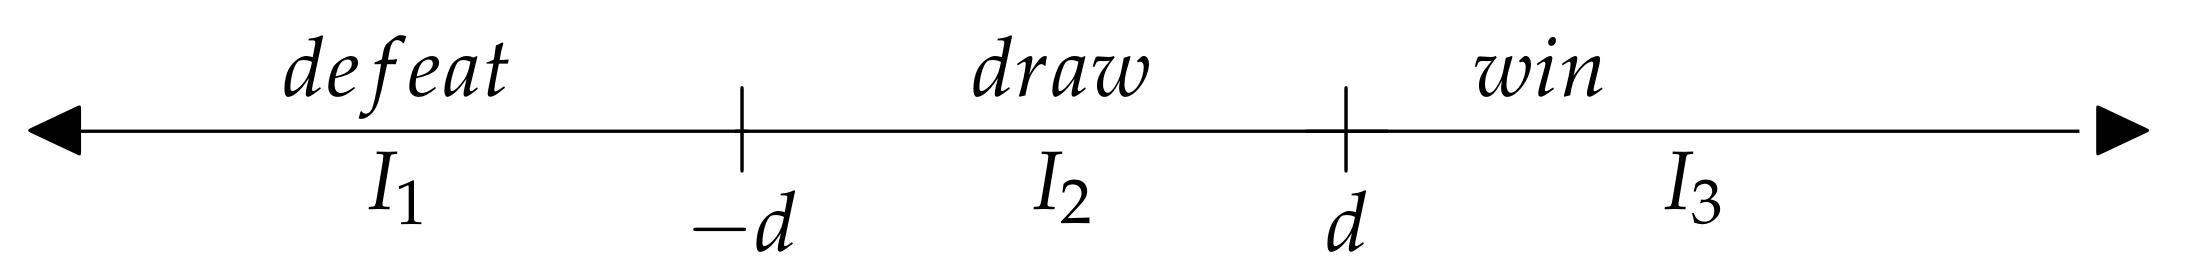
The method can be summarized as follows. Let us consider the performances of the teams as random variables denoted by , , where n is the number of teams. The strength of the team i is the expectation of the random variable it is denoted by . The result of a match between teams i and j depends on the actual difference of the random quantity . As draw (tie) is one of the possible results of the matches in the case of handball/football tournaments, we apply the general model in [19] with three categories, namely loss/tie/win. Tie means that the difference between the performances of the teams is close to zero. More accurately, if team i beats team j then if the result is draw then , and if team i is the loser of the match then (see Figure 1). The parameter is estimated on the basis of the data.
where are supposed to be independent, identically distributed random variables with the cumulative distribution functions F. The probabilities of the results of team i and j can be expressed as follows:
Let A be a three dimensional data matrix with sizes nxnx3 and with elements is the number of matches when team i has result k against team ; stands for loses, for draws, and for wins. If then let =0, . The probability of the results given by data matrix A in the function and , supposing the independence of the sample elements, is
The maximum likelihood estimation of parameters and d denoted by and is the dimensional argument, where the function L reaches its maximal value [20].
3. Results of the Evaluation and Discussion
In this section, we apply the method described in Section 2 for DELO EHF Women’ Champions League 2020/2021. This tournament is a prestigious tournament, the best European women handball teams contest for victory.
The regulations can be found in details on web-page [21]. The short description of the regulations can be summarized as following: 16 teams participate in the tournament; they are distributed into two separate groups: Group A and Group B. In each group, every team plays with the other teams twice. The winner of a match gets 2 points, while the loser does not get any points. In case of a tie, both teams get 1 point. The rankings within the groups are based on the number of points; in case of equal points, other characteristics determine the rankings. After the end of the group phase, couples are formed: rankings in the groups determine the couplings. The play-off matches are between the first team in Group A and last team in Group B, the second team in Group A and seventh team in Group B and so on. The winning teams of the play-offs qualify for the quarter-finals. The winners of the quarter-finals are the teams of the Final4, and the best team of the Final4 is the winner of the tournament.
3.1. The Results of the Evaluations in the Groups
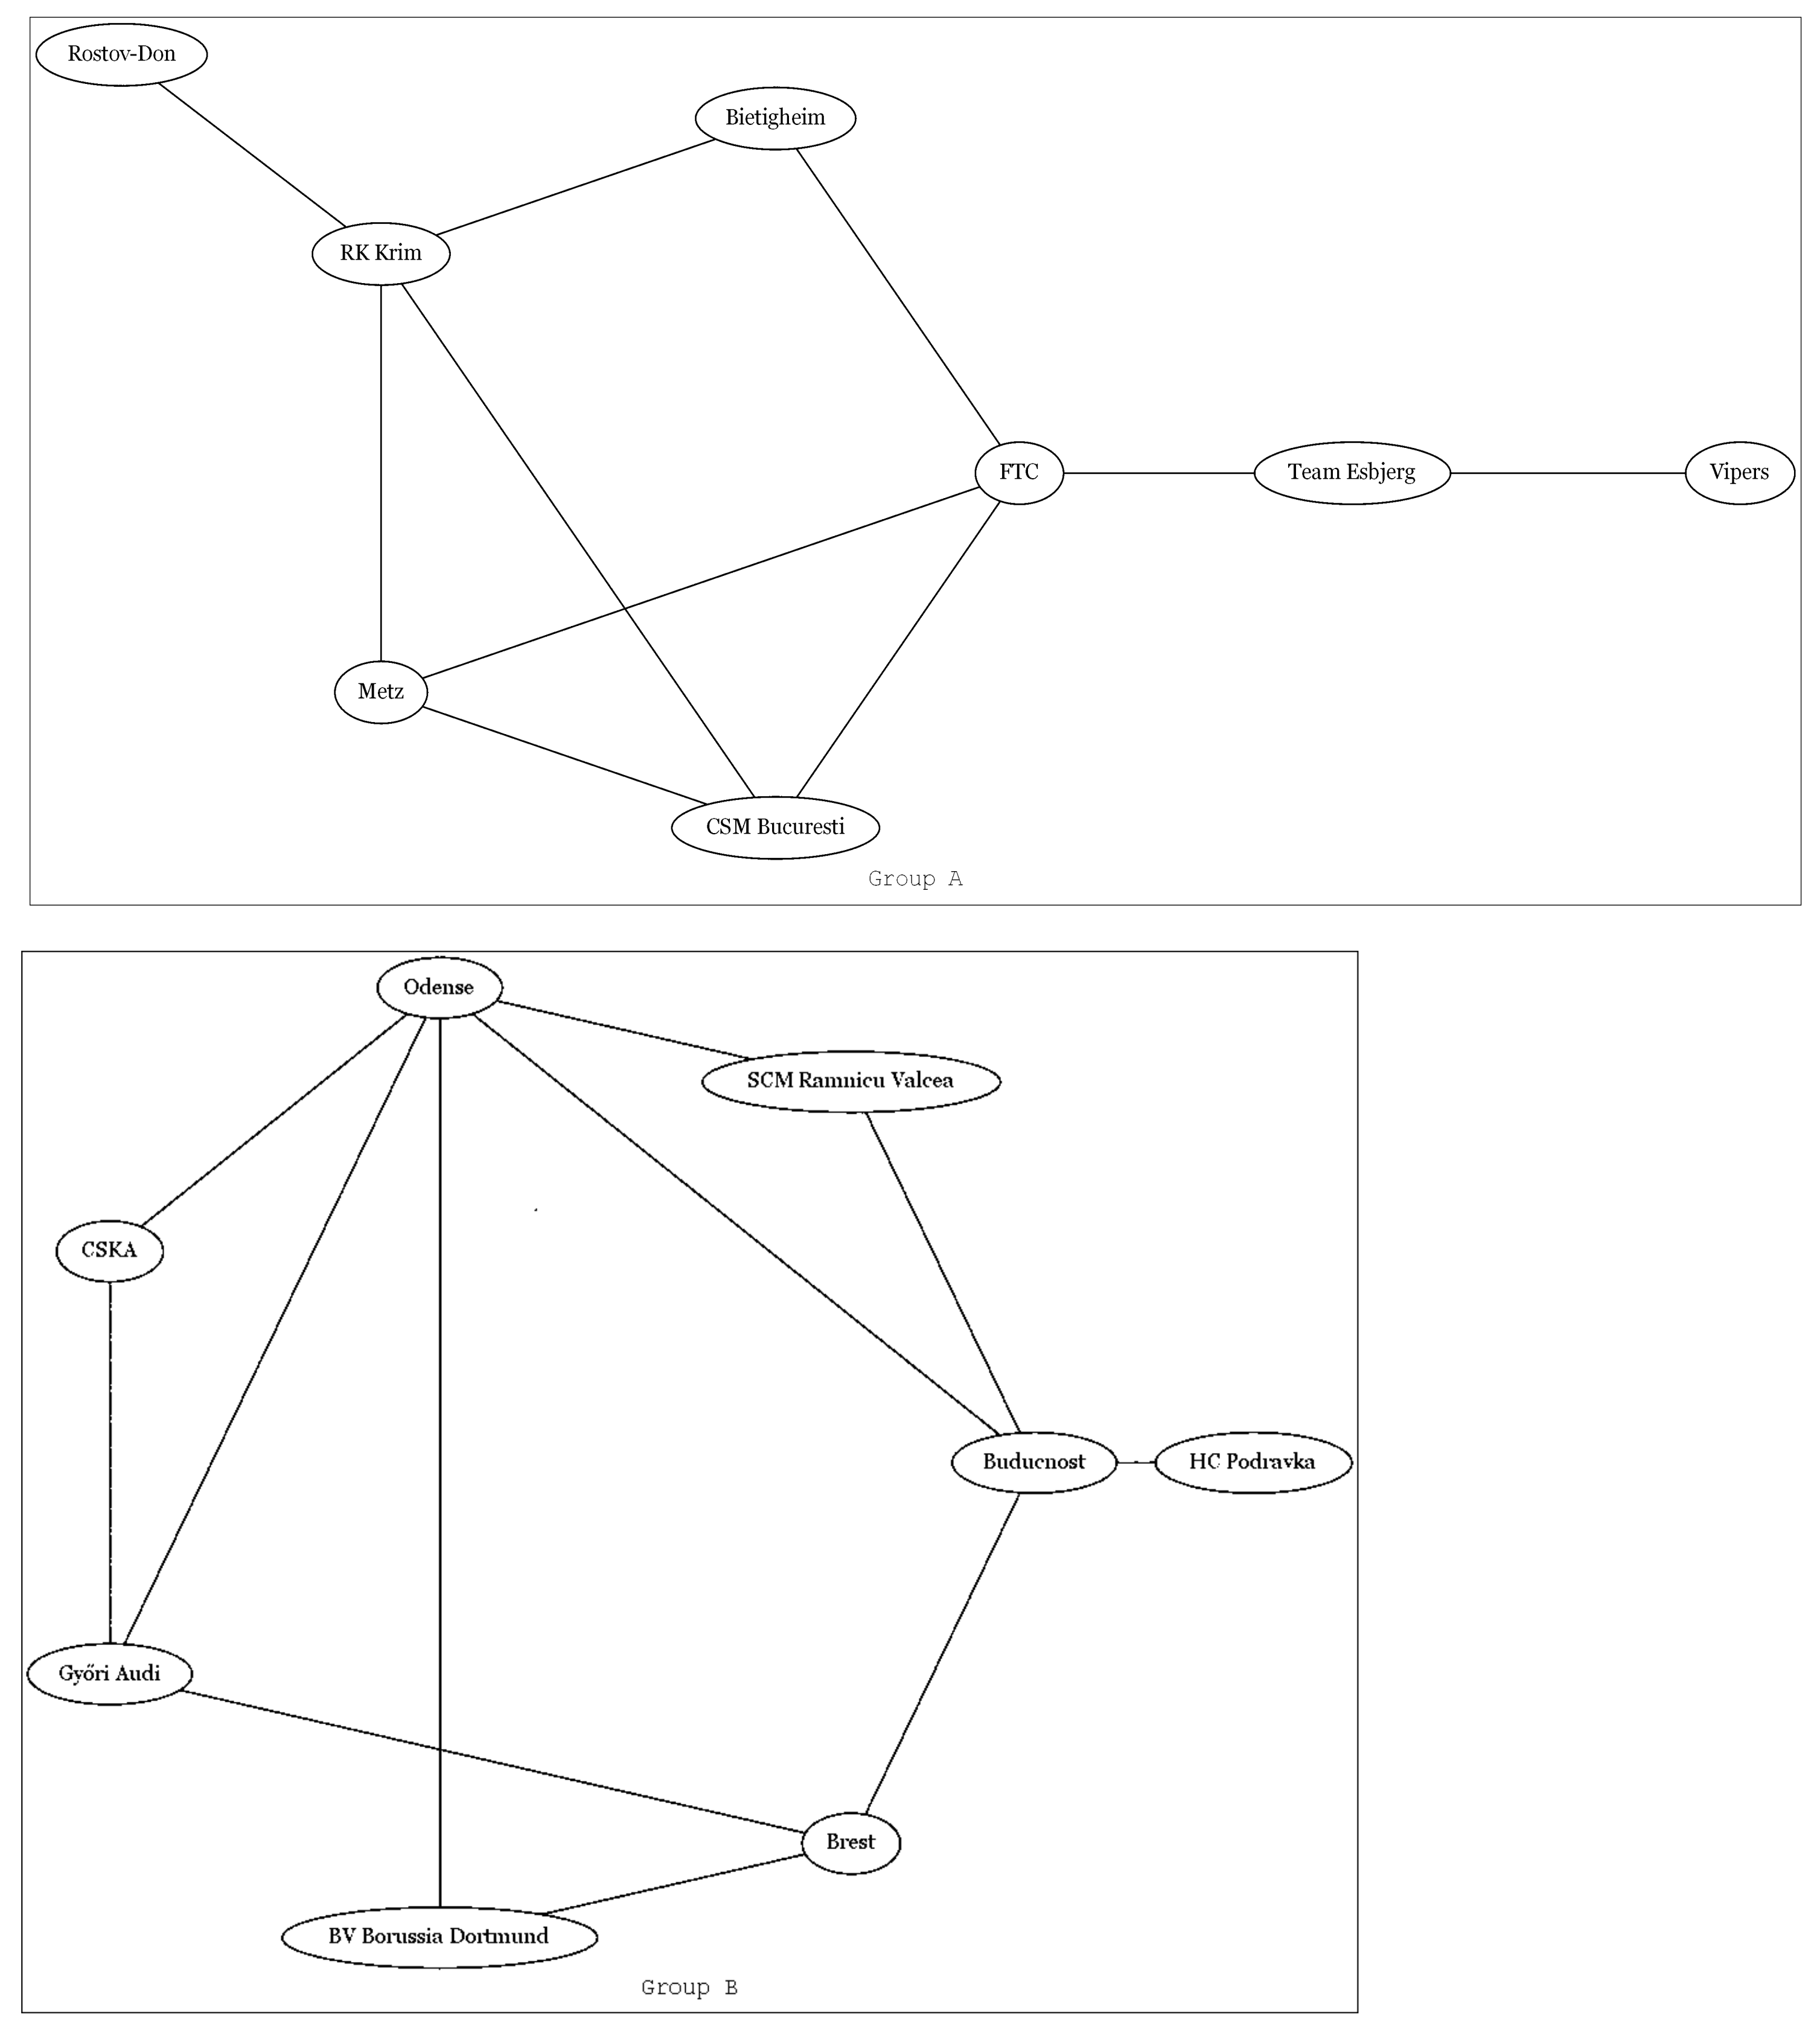
As mentioned, there are 16 teams in the tournament, they are grouped into two groups. In the 2020/2021 season Group A consists of teams CSM Bucuresti, FTC-Rail Cargo Hungaria, Metz Handball, RK Krim Mercator, Rostov-Don, SG BBM Bietigheim, Team Esbjerg, and Vipers Kristiansand. Group B consists of teams Brest Bretagne Handball, Buducnost, BV Borussia, CSKA, Gyori Audi ETO KC, HC Podravka Vegeta, Odense Handbold, and SCM Ramnicu Valcea. The results of the matches are downloaded from the official website of EHF Champions League and actually are available at the website https://en.wikipedia.org/wiki/2020%E2%80%9321_Women%27s_EHF_Champions_League (accessed on 31 January 2022) [22].
During the computations Gauss distribution with dispersion 1 is applied for the differences, i.e., .
The conditions of the existence and the uniqueness of the maximizers are fulfilled in the separate groups (see Theorem 1 in [19]): There is at least one tie (for example CSM Bucuresti-RK Krim Mercator in Group A and Brest Bretagne Handball—Buducnost in Group B), there exist two teams with win and lose against each other (for example CSM Bucuresti-FTC-Rail Cargo Hungaria in Group A and Buducnost—HC Podravka Vegeta in Group B). The third condition is that in both cases, the graphs of the teams have to be connected (there is an edge between two teams if there is at least one tie between them or there is a win and lose for both teams among themselves). The graphs defined by the results based on the played matches (without the neglected matches) can be seen in Figure 2A,B. These graphs are connected, therefore the existence and uniqueness of the evaluations in the separate groups are guaranteed, if we fix the value of a parameter .
Figure 2A,B demonstrate that both graphs are connected. Note that the graphs provided by all matches have more edges than the graphs without the non-played matches, therefore these are connected too. It means that the results containing “won by default” matches can also be evaluated by the generalized Thurstone method. These evaluations are used as comparison.
The results of the evaluations in Group A and Group B can be seen in Table 1 and Table 2, respectively. The teams, together with their points, are listed in the rankings of the official results. Column contains the rankings and the expectations estimated on the basis of all matches including the non-played ones, while column contains the ranking, the expected strengths estimated on the basis of the matches which were actually played and the expectations of the points if the matches had not been canceled. The reference points were FTC-Rail Cargo Hungaria and Odense Handbold in Group A and Group B, respectively. The reason is that these teams played all their matches, therefore, their points do not depend on the non-played matches.
It can be stated that the first two teams dominate and the last two teams founder by all evaluations. It supports that the original regulation concerning the play-off matches (those teams ranked 1st and 2nd of both Group A and Group B qualify to the quarter-finals directly and the last two teams in the groups cannot qualify for the play-off matches) could have been applied in the present situation, as well.
In the case of Group A, first, let us compare the results based on the points and based on the generalized Thurstone evaluation with “won by default” matches (see column . The only difference in the rankings is that of FTC-Rail Cargo Hungaria and Vipers Kristiansand. One can observe that there is no difference in their points (16p), and there is a very small difference in their estimated expectations (.
To compare the results based on the two cases, i.e., with and without the matches “won by default”, first, we review the cancelled matches. In Group A, there are 6 matches that were not played. Vipers Kristiansand is involved in three among them, and twice Vipers Kristiansand was in the disadvantages party. SG BBM Bietigheim suffered two losses from allocated points, as well. On the other hand, two matches were advantageous for CSM Bucuresti. Metz Handball, Team Esbjerg and Rostov-Don profited from allocated points once. Finally, Rostov-Don and RK Krim Mercator lost one match because of the non-played matches. Therefore, the Bucuresti profited most from the allocated points, and SG BBM Bietigheim suffered losses. The position of Vipers Kristiansand deteriorated, while the position of CSM Bucuresti, Metz Handball and Team Esbjerg got better due to the matches “won by default”.
These observations are reflected in the changes of the estimated expectations. Comparing the ranking based on to the official ranking, Vipers Kristiansand moves up two places, while Bucuresti goes down two in the rankings (see column . The rankings of the other teams do not change. The expected points in the last column are computed on the basis of the probabilities (1), (2), and (3), applying the estimated values of the expectations ( and parameter . The team which could play all the matches has the earned points during those games they actually played. Those teams which omitted matches have more points compared to the real earned points, reflecting the strengths of the teams. The increments compared to the points without the allocated ones are the average points the teams would have collected if they had played the omitted matches. The rankings based on the expected points are the same as the rankings based on the expectations computed by .
As a control group, let us have a look at the results of Group B. Note that both matches between BV Borussia Dortmund and SCM Ramnicu Valcea were canceled. Even though the comparison is incomplete, the method works, thanks to the connectedness of the graph. There is no difference in the rankings regardless of the methods of evaluation. There are four non-played matches, SCM Ramnicu Valcea was involved in all of them, twice it obtains the allocated points, twice it loses them. Similarly, Borussia Dortmund once obtains and once loses the allocated points. Brest is disadvantaged, while HC Podravka Vegeta profits on one occasion. Therefore, the changes in data are moderate, they do not cause changes in rankings, only in the estimated expectations (see columns and in Table 2). The expected points provide the same rankings as the expectations computed by
3.2. The Unified Ranking of the Teams
After the group phase, the tournament is continued until the Final4.
It is an interesting problem which is the unified ranking of all the teams in the groups based on the results of the matches in the group phase.
One can easily see that without any connection between groups A and B, Thurstone method can not provide a unified ranking. However, if we use some results of the couples in Table 3, the evaluation can be performed.
The play-offs contained two matches for every pair. Gyori Audi ETO KC (first team in Group B) played with SG BBM Bietigheim (last team in Group A), and Gyori Audi ETO KC was the winner of the match. Rostov-Don (first team in group A) played with HC Podravka Vegeta (last team in group B), and Rostov-Don beated HC Podravka Vegeta. These were predictable results in both cases (their probabilities are very close to 1) and they really came true. We use these results to connect the teams of Group A and Group B and to form the unified ranking. The unified ranking with the estimated strengths can be seen in Table 4. The parameter of the last team is fixed to 0.
On the basis of Table 4 one can see that the teams were grouped into two groups with equal strength (A and B), the averages of the serial numbers of the groups in the interwoven rankings are the same: 8.5. If we take these numbers among the best 8, group A is worse than Group B (average rankings are 5.6 and 2.67, respectively). This predicted that the majority of the teams in the Final4 would come from group B, and this prediction came true.
Now, we illustrate that Thurstone method is a suitable evaluation for predicting qualification for the next round.
First, we present how successful our predictions were for the best 8 teams. Table 5 contains two predictions. The first column contains the EHF expert opinion concerning the best 8 teams based on the results of the group phase. This opinion was at the official website of EHF and actually can be found on the website [23]. In the second column of Table 5 one can see the list of the participants predicted by the Thurstone method, taking into account the pairs of the rounds (see Table 3). The teams with 8 largest expected strength is predicted for qualification (see Table 4). The teams set in bold are the well-predicted cases, while the teams where the prediction failed are written in normal letters. It is important to note that, according to the experts of EHF, Vipers Kristiansand does not belong to the best 8 teams, but according to the Thurstone method does; it is the 6th in the ranking (see Table 4). The results of the play-offs have supported our evaluations: Vipers Kristiansand qualified for the best 8.
As one can see, neither the experts prediction, nor the prediction of the Thurstone method were entirely successful. However, the experts’ prediction failed twice, but the Thurstone method only once. We emphasize that we applied the same information that the experts also had, therefore Thurstone method could make better predictions than the experts. The prediction of the result of the matches of Buducnost and FTC-Rail Cargo Hungaria was wrong according to both. Note that the probability of the qualification of Buducnost was 0.35, and there was a close contest between them.
3.3. Forecast of the Participants and the Results in the Final4
Finally, we made the prediction for the results of the Final4. For that, we used the data of the matches of the best 8 teams only, because these results are more significant than the results of the matches against the weak teams. Moreover, these matches are closer in time to the matches of Final4. The ranking and the estimated expectations can be read in Table 6.
Based on the results of Table 6 and the pairs in Table 3 we can see the predicted participants of the Final4 in Table 7.
From Table 7, we can observe that all the four participants were correctly predicted by the Thurstone method. We can see that the experts’ prediction was less correct again, but they used less information.
As Final4 does not allow for ties, we computed the probabilities of “win” by comparing the difference to 0. This can be done by substituting the estimated parameters (in Table 6) into the formula
This is valuable information for the fans, for the betters and also for the betting offices. We have calculated the probabilities in Table 8.
The actual result: Vipers Kristiansand beat CSKA, but the match between Brest Bretagne Handball and Gyori Audi ETO KC was extremely close: a tie during the regular time, a tie in extra time, and the penalties resulted in the victory of Brest Bretagne Handball (We note that, during the group phase, their matches always ended in ties.).
Returning to the predictions, we emphasize that three results were well-predicted from the four matches in the Final4, and the results of the matches in the final and for the third place were the same as the predictions. Moreover, the winner of the tournament was correctly predicted.
4. Conclusions
A Thurstone motivated method is suggested in this paper to evaluate the results of sports tournaments taking into account the ties as substantive possibilities. The evaluations of handball teams’ groups and the predictions for the further results illustrate the effectiveness of the method. The predictions based on this method were right in most cases. With the help of this method, the evaluation can be done based on the played matches and omitting the results of those “won by default”. The method considers the whole group as a complex system, and, while evaluating the teams, it is capable of taking the performance of the teams against other opponent into account, similarly to Elo’s method in chess [18]. It has been demonstrated that if there are many omitted matches or/and the allocation of the points are unbalanced, the method changes the score-based ranking. The results thus achieved reflect the actual strength of the teams more accurately. If, on the other hand, fewer points were allocated, the ranking does not change. It is presented that the method can be applied in an effective way to interweave different groups, taking into account a few real or presumable games’ results. The authors think that the possibility of the unified ranking of the different countries’ football teams (clubs) is an appealing facility for the football fans, too. The probabilities of the outcomes of further matches are also estimated, and the forecasts are in good coincidences with the true results. Finally, we emphasize that the method was able to predict the winner of the tournament, although the betting offices gave very low chance for its victory.
Author Contributions
Conceptualization, C.M.; methodology, É.O.-M. and L.G.; software, L.G.; validation, C.M.; formal analysis, É.O.-M.; data curation, L.G.; writing—original draft preparation, É.O.-M.; writing—review and editing, C.M.; visualization É.O.-M.; supervision, C.M. All authors have read and agreed to the published version of the manuscript.
Funding
National Research Development and Innovation Fund of Hungary 2020-4.1.1-TKP2020 Thematic Excellence Programme 2020; Széchenyi 2020 EFOP-3.6.1-16-2016-00015; ÚNKP-21-2 New National Excellence Program of the Ministry for Innovation and Technology Hungary.
Institutional Review Board Statement
Not applicable.
Informed Consent Statement
Not applicable.
Data Availability Statement
Publicly available datasets were analyzed in this study. These data can be found on the web-pages given in References.
Acknowledgments
Project TKP2020-NKA-10 has been implemented with the support provided by the National Research, Development and Innovation Fund of Hungary, financed under the 2020-4.1.1-TKP2020 Thematic Excellence Programme 2020—National Challenges sub-program funding scheme. The authors would like to thank this support. The authors acknowledges and thanks the financial support of Széchenyi 2020 under the EFOP-3.6.1-16-2016-00015. project. The research was supported by the ÚNKP-21-2 New National Excellence Program of the Ministry for Innovation and Technology from the source of the National Research, Development and Innovation Found. László Gyarmati thanks the support.
Conflicts of Interest
The authors declare no conflict of interest.
References
- Csató, L. A simulation comparison of tournament designs for the World Men’s Handball Championships. Int. Trans. Oper. Res. 2021, 28, 2377–2401. [Google Scholar] [CrossRef] [Green Version]
- Csató, L. Tournament Design: How Operations Research Can Improve Sports Rules; Springer: Berlin/Heidelberg, Germany, 2021. [Google Scholar]
- Bozóki, S.; Csató, L.; Temesi, J. An application of incomplete pairwise comparison matrices for ranking top tennis players. Eur. J. Oper. Res. 2016, 248, 211–218. [Google Scholar] [CrossRef] [Green Version]
- Hwang, J.W.; Kim, J.Y. A study on industrial security psychology. In Proceedings of the 2020 IEEE International Conference on Big Data and Smart Computing (BigComp), Pusan, Korea, 19–22 February 2020; pp. 500–506. [Google Scholar]
- Montequín, V.R.; Balsera, J.M.V.; Piloñeta, M.D.; Pérez, C.Á. A Bradley-Terry model-based approach to prioritize the balance scorecard driving factors: The case study of a financial software factory. Mathematics 2020, 8, 276. [Google Scholar] [CrossRef] [Green Version]
- Chen, J.F.; Hsieh, H.N.; Do, Q.H. Evaluating teaching performance based on fuzzy AHP and comprehensive evaluation approach. Appl. Soft Comput. 2015, 28, 100–108. [Google Scholar] [CrossRef]
- Wang, X.Y.; Li, G.; Tu, J.F.; Nguyen, K.T.T.; Chang, C.Y. Sustainable education using new communication technology: Assessment with analytical hierarchy process (AHP). Sustainability 2021, 13, 9640. [Google Scholar] [CrossRef]
- Anastasiadou, K.; Gavanas, N.; Pyrgidis, C.; Pitsiava-Latinopoulou, M. Identifying and prioritizing sustainable urban mobility barriers through a modified delphi-AHP approach. Sustainability 2021, 13, 10386. [Google Scholar] [CrossRef]
- Bao, J.; Johansson, J.; Zhang, J. Comprehensive evaluation on employee satisfaction of mine occupational health and safety management system based on improved AHP and 2-tuple linguistic information. Sustainability 2017, 9, 133. [Google Scholar] [CrossRef] [Green Version]
- Cabrera, F.E.; Amaya, M.; Vaccaro Witt, G.F.; Peláez, J.I. Pairwise voting to rank touristic destinations based on preference valuation. Sustainability 2019, 11, 5873. [Google Scholar] [CrossRef] [Green Version]
- Saaty, T.L. Decision making—The analytic hierarchy and network processes (AHP/ANP). J. Syst. Sci. Syst. Eng. 2004, 13, 1–35. [Google Scholar] [CrossRef]
- Bozóki, S.; Fülöp, J.; Rónyai, L. On optimal completion of incomplete pairwise comparison matrices. Math. Comput. Model. 2010, 52, 318–333. [Google Scholar] [CrossRef] [Green Version]
- Thurstone, L.L. A law of comparative judgment. Psychol. Rev. 1927, 34, 273–286. [Google Scholar] [CrossRef]
- Anderson, A. Maximum likelihood ranking in racing sports. Appl. Econ. 2014, 46, 1778–1787. [Google Scholar] [CrossRef]
- Araki, K.; Hirose, Y.; Komaki, F. Paired comparison models with age effects modeled as piecewise quadratic splines. Int. J. Forecast. 2019, 35, 733–740. [Google Scholar] [CrossRef]
- Mease, D. A penalized maximum likelihood approach for the ranking of college football teams independent of victory margins. Am. Stat. 2003, 57, 241–248. [Google Scholar] [CrossRef]
- Lasek, J.; Gagolewski, M. Interpretable sports team rating models based on the gradient descent algorithm. Int. J. Forecast. 2021, 37, 1061–1071. [Google Scholar] [CrossRef]
- Elo, A. The Rating of Chess Players, Past and Present; Arco: New York, NY, USA, 1978. [Google Scholar]
- Orbán-Mihálykó, É.; Mihálykó, C.; Koltay, L. A generalization of the Thurstone method for multiple choice and incomplete paired comparisons. Cent. Eur. J. Oper. Res. 2019, 27, 133–159. [Google Scholar] [CrossRef]
- Eliason, S.R. Maximum Likelihood Estimation: Logic and Practice; Number 96; Sage: Tucson, AZ, USA, 1993. [Google Scholar]
- WEBREGUL. Available online: https://www.eurohandball.com/en/what-we-do/regulations/club-competitions/ehf-champions-league/ (accessed on 9 July 2021).
- WEBDATA. Available online: https://en.wikipedia.org/wiki/2020%E2%80%9321_Women%27s_EHF_Champions_League (accessed on 31 January 2022).
- WEBEXPERTS. Available online: https://www.eurohandball.com/en/news/en/gyor-top-power-ranking-going-into-play-offs/ (accessed on 31 January 2022).
Figure 1.
The possible results and the intervals belonging to them.

Figure 2.
The possible results and the intervals belonging to them. (A) The graph of Group A’s teams with the connections including only the played matches; (B) the graph of Group B’s teams with the connections including only the played matches.
Figure 2.
The possible results and the intervals belonging to them. (A) The graph of Group A’s teams with the connections including only the played matches; (B) the graph of Group B’s teams with the connections including only the played matches.


Table 1.
The evaluations of group A’ s results.
| Teams in Official Rankings | ||||||
|---|---|---|---|---|---|---|
| p. | r. | r. | exp.p. | |||
| 1. Rostov-Don | 21 | 1. | 0.455 | 1. | 0.535 | 21.750 |
| 2. Metz Handball | 20 | 2. | 0.447 | 2. | 0.360 | 19.178 |
| 3. CSM Bucuresti | 17 | 3. | 0.101 | 5. | −0.052 | 15.345 |
| 4. FTC-Rail Cargo Hungaria | 16 | 5. | 0 | 4. | 0 | 16 |
| 5. Vipers Kristiansand | 16 | 4. | 0.016 | 3. | 0.132 | 17.355 |
| 6. Team Esbjerg | 12 | 6. | −0.335 | 6. | −0.397 | 11.241 |
| 7. RK Krim Mercator | 7 | 7. | −0.788 | 7. | −0.712 | 7.758 |
| 8. SG BBM Bietigheim | 3 | 8. | −1.389 | 8. | −1.311 | 3.372 |
Table 2.
The evaluations of the group B’ s results.
| Teams in Official Rankings | ||||||
|---|---|---|---|---|---|---|
| p. | r. | r. | exp.p. | |||
| 1. Gyori Audi ETO KC | 24 | 1. | 1.129 | 1. | 1.210 | 24 |
| 2. CSKA | 23 | 2. | 1.112 | 2. | 1.172 | 23 |
| 3. Brest Bretagne Handball | 17 | 3. | 0.351 | 3. | 0.536 | 18.629 |
| 4. Odense Handbold | 13 | 4. | 0 | 4. | 0 | 13 |
| 5. Buducnost | 12 | 5. | −0.165 | 5. | −0.179 | 12 |
| 6. SCM Ramnicu Valcea | 10 | 6. | −0.404 | 6. | −0.400 | 10.286 |
| 7. BV Borussia Dortmund | 9 | 7. | −0.480 | 7. | −0.525 | 8.811 |
| 8. HC Podravka Vegeta | 4 | 8. | −1.155 | 8. | −1.546 | 2.273 |
Table 3.
The pairs of the rounds.
| Play-offs | |
| SG BBM Bietigheim | Gyori Audi ETO KC |
| HC Podravka Vegeta | Rostov-Don |
| RK Krim Mercator | CSKA |
| BV Borussia Dortmund | Metz Handball |
| Team Esbjerg | Brest Bretagne Handball |
| SCM Ramnicu Valcea | CSM Bucuresti |
| Vipers Kristiansand | Odense Handbold |
| Buducnost | FTC-Rail Cargo Hungaria |
| Quater-finals | |
| Buducnost | Gyori Audi ETO KC |
| Vipers Kristiansand | Rostov-Don |
| CSM Bucuresti | CSKA |
| Brest Bretagne Handball | Metz Handball |
| Semi-finals | |
| Gyori Audi ETO KC | Brest Bretagne Handball |
| Vipers Kristiansand | CSKA |
Table 4.
The unified ranking using the results of the matches of the bests against the worsts.
| Thurstone’s Rank | ||
|---|---|---|
| 1 | Gyori Audi ETO KC | 2.689 |
| 2 | CSKA | 2.654 |
| 3 | Rostov-Don | 2.301 |
| 4 | Metz Handball | 2.108 |
| 5 | Brest Bretagne Handball | 2.032 |
| 6 | Vipers Kristiansand | 1.878 |
| 7 | FTC-Rail Cargo Hungaria | 1.743 |
| 8 | CSM Bucuresti | 1.688 |
| 9 | Odense Handbold | 1.521 |
| 10 | Buducnost | 1.343 |
| 11 | Team Esbjerg | 1.331 |
| 12 | SCM Ramnicu Valcea | 1.127 |
| 13 | BV Borussia 09 Dortmund | 1.011 |
| 14 | RK Krim Mercator | 1.010 |
| 15 | SG BBM Bietigheim | 0.390 |
| 16 | HC Podravka Vegeta | 0 |
Table 5.
The best 8 teams—the predictions (bold letters: correct predictions).
| Expert Prediction | Thurstone Method’s Prediction |
|---|---|
| Gyori Audi ETO KC | Gyori Audi ETO KC |
| CSKA | CSKA |
| Rostov-Don | Rostov-Don |
| Metz Handball | Metz Handball |
| FTC-Rail Cargo Hungaria | Brest Bretagne Handball |
| Brest Bretagne Handball | Vipers Kristiansand |
| CSM Bucuresti | FTC-Rail Cargo Hungaria |
| Odense Handbold | CSM Bucuresti |
Table 6.
The ranking and the expected strengths of the best 8 teams based on the matches played among themselves.
Table 6.
The ranking and the expected strengths of the best 8 teams based on the matches played among themselves.
| Team | |
|---|---|
| Vipers Kristiansand | 2.117 |
| Rostov-Don | 1.729 |
| Gyori Audi ETO KC | 1.649 |
| CSKA | 1.462 |
| Brest Bretagne Handball | 0.764 |
| Metz Handball | 0.740 |
| CSM Bucuresti | 0.720 |
| Buducnost | 0 |
Table 7.
The predicted participants of the Final4 (bold letters: correct predictions).
| Experts’ Prediction | Thurstone Method’s Prediction |
|---|---|
| Gyori Audi ETO KC | Vipers Kristiansand |
| CSKA | Gyori Audi ETO KC |
| Rostov-Don | CSKA |
| Metz Handball | Brest Bretagne Handball |
Table 8.
The probabilities of the win of the first column’s teams (bold letters: the result coincides with the probability).
Table 8.
The probabilities of the win of the first column’s teams (bold letters: the result coincides with the probability).
| Team 1 | Team 2 | Pr. |
|---|---|---|
| Vipers Kristiansand | CSKA | 0.744 |
| Gyori Audi ETO KC | Brest Bretagne Handball | 0.812 |
| Brest Bretagne Handball | Vipers Kristiansand | 0.088 |
| Gyori Audi ETO KC | CSKA | 0.574 |
Publisher’s Note: MDPI stays neutral with regard to jurisdictional claims in published maps and institutional affiliations. |
© 2022 by the authors. Licensee MDPI, Basel, Switzerland. This article is an open access article distributed under the terms and conditions of the Creative Commons Attribution (CC BY) license (https://creativecommons.org/licenses/by/4.0/).
Share and Cite
MDPI and ACS Style
Orbán-Mihálykó, É.; Mihálykó, C.; Gyarmati, L. Application of the Generalized Thurstone Method for Evaluations of Sports Tournaments’ Results. Knowledge 2022, 2, 157-166. https://0-doi-org.brum.beds.ac.uk/10.3390/knowledge2010009
AMA Style
Orbán-Mihálykó É, Mihálykó C, Gyarmati L. Application of the Generalized Thurstone Method for Evaluations of Sports Tournaments’ Results. Knowledge. 2022; 2(1):157-166. https://0-doi-org.brum.beds.ac.uk/10.3390/knowledge2010009
Chicago/Turabian StyleOrbán-Mihálykó, Éva, Csaba Mihálykó, and László Gyarmati. 2022. "Application of the Generalized Thurstone Method for Evaluations of Sports Tournaments’ Results" Knowledge 2, no. 1: 157-166. https://0-doi-org.brum.beds.ac.uk/10.3390/knowledge2010009