
A Comparison of Approaches to Regional Land-Use Capability Analysis for Agricultural Land-Planning

 , ,
, ,  ,
,
Abstract
:1. Introduction
2. Materials and Methods
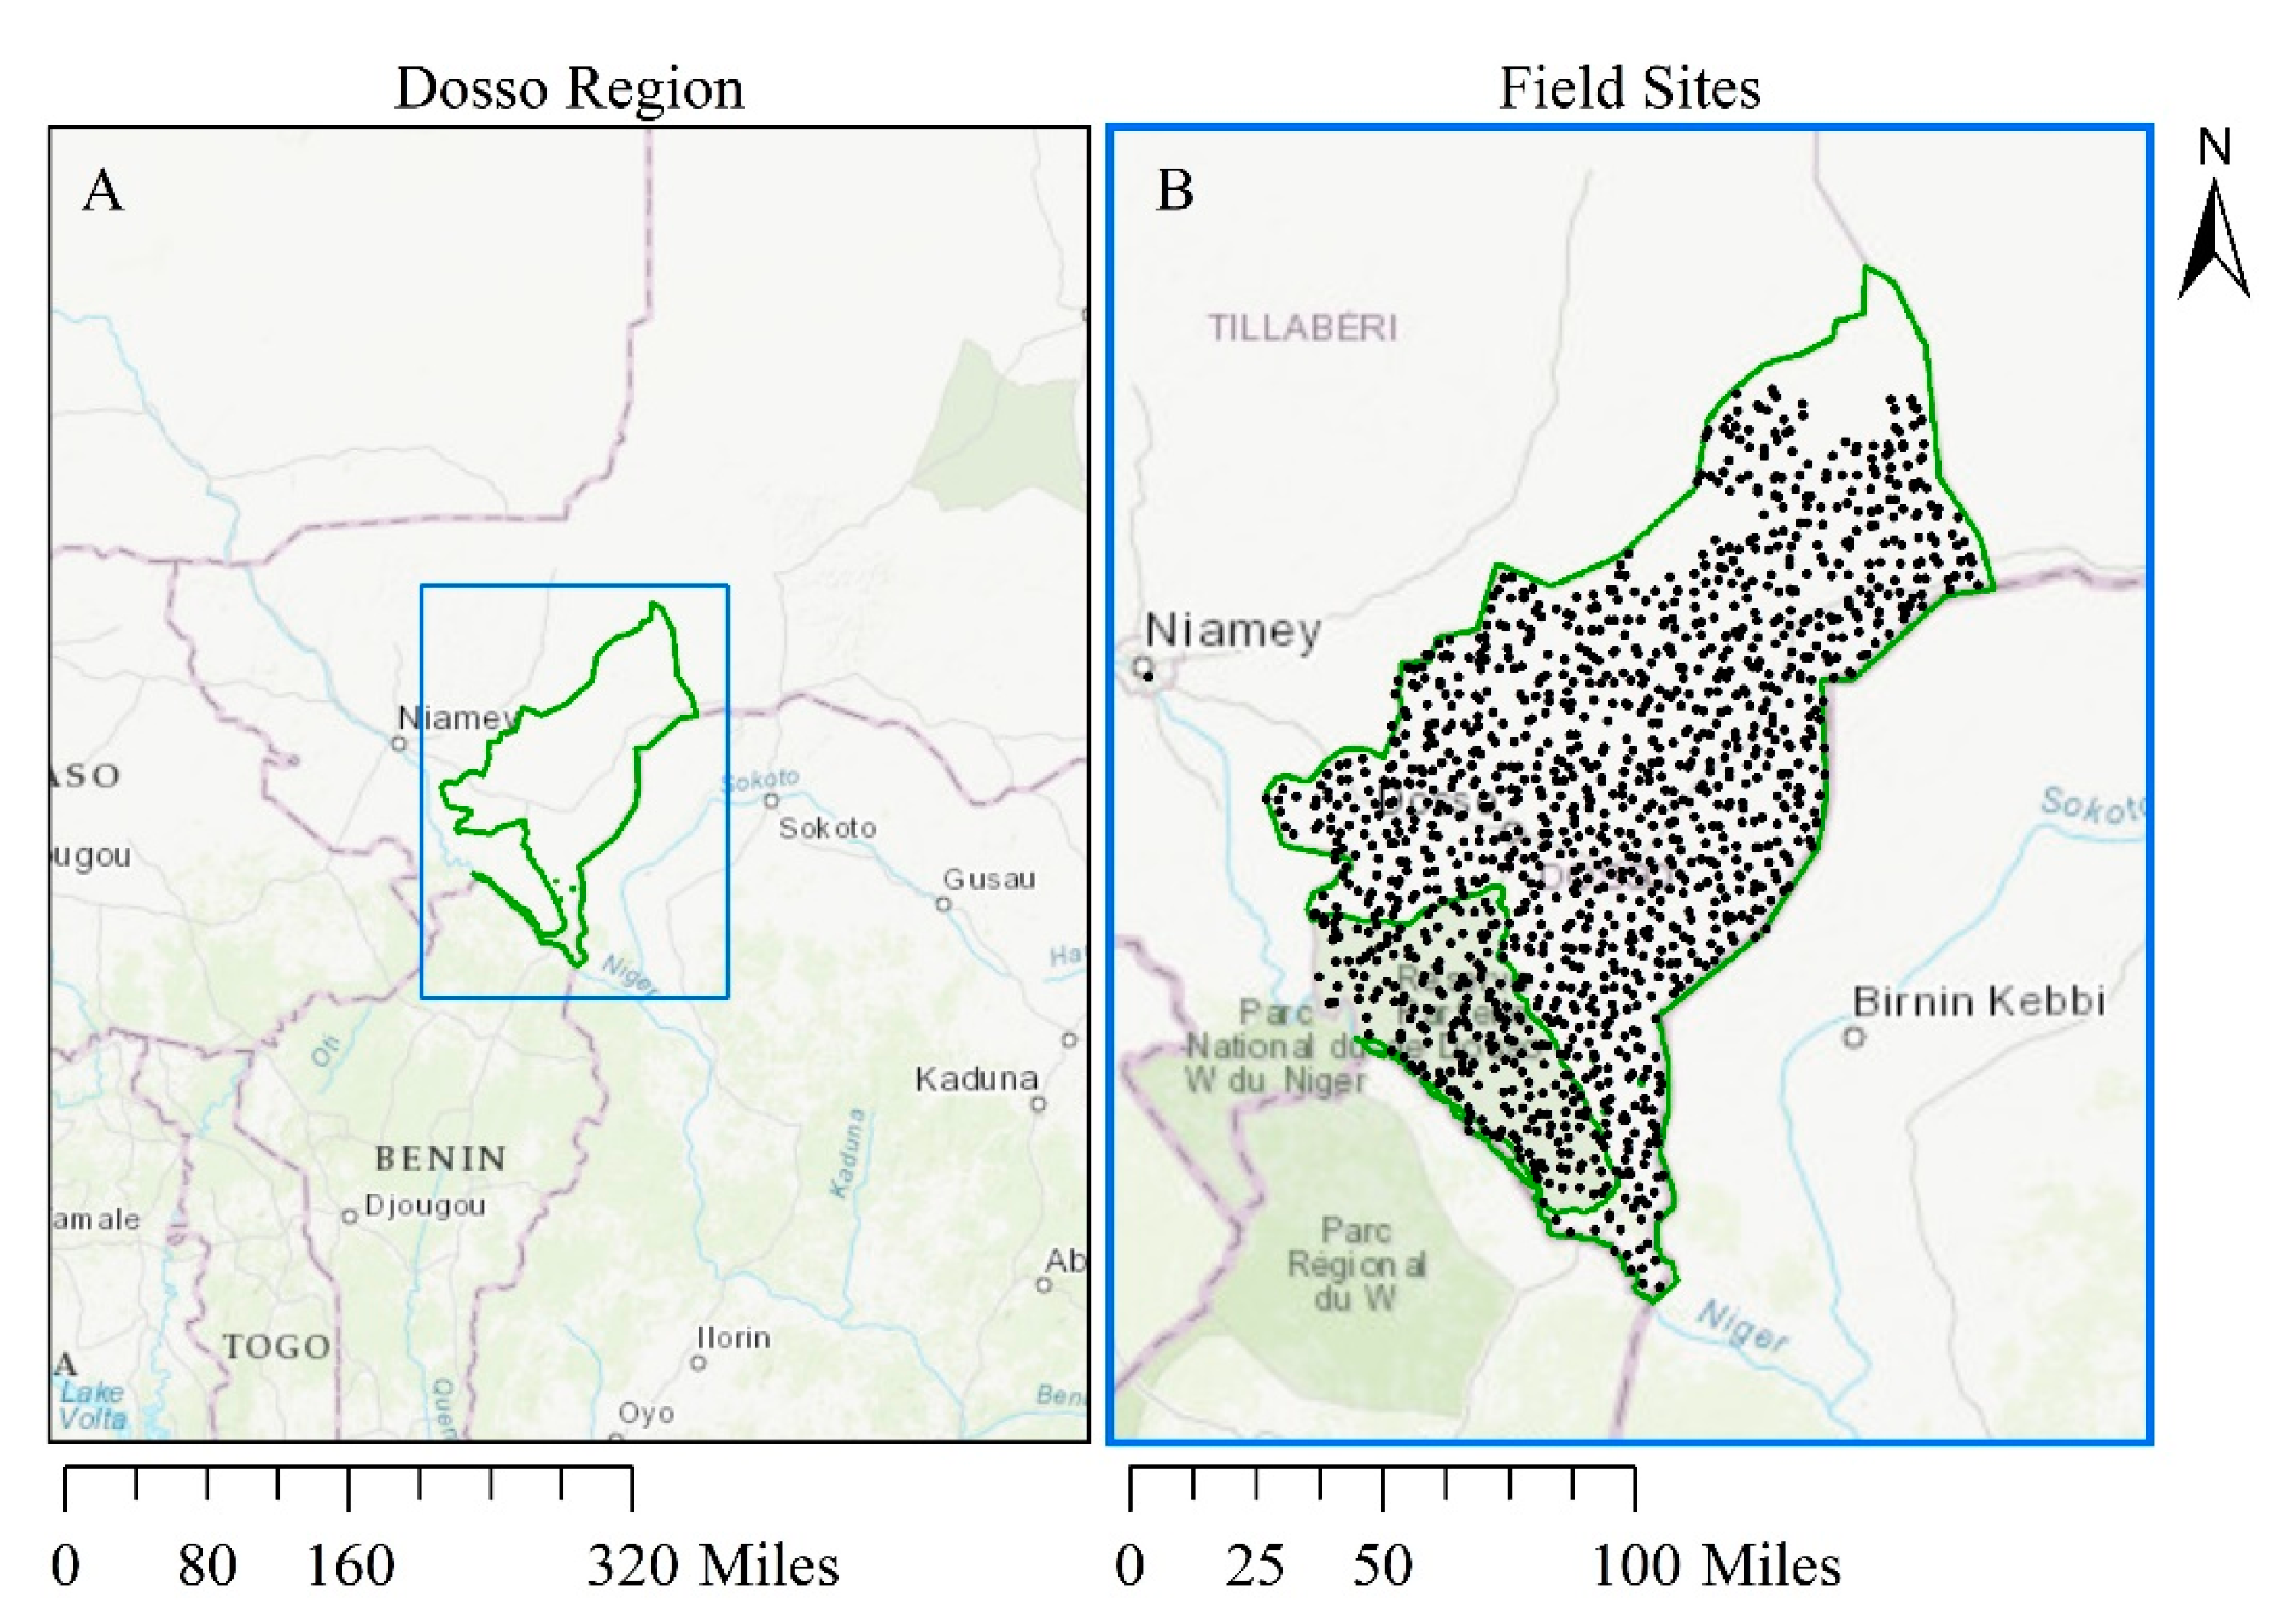
2.1. Study Site Description
2.2. Field Data
2.2.1. Study Site
2.2.2. Soil Sampling Location
2.2.3. Soil Property Determination
2.2.4. Slope Data
2.3. Land Capability Classification
2.4. Comparative Digital Soil Datasets
2.5. Spatial Analysis
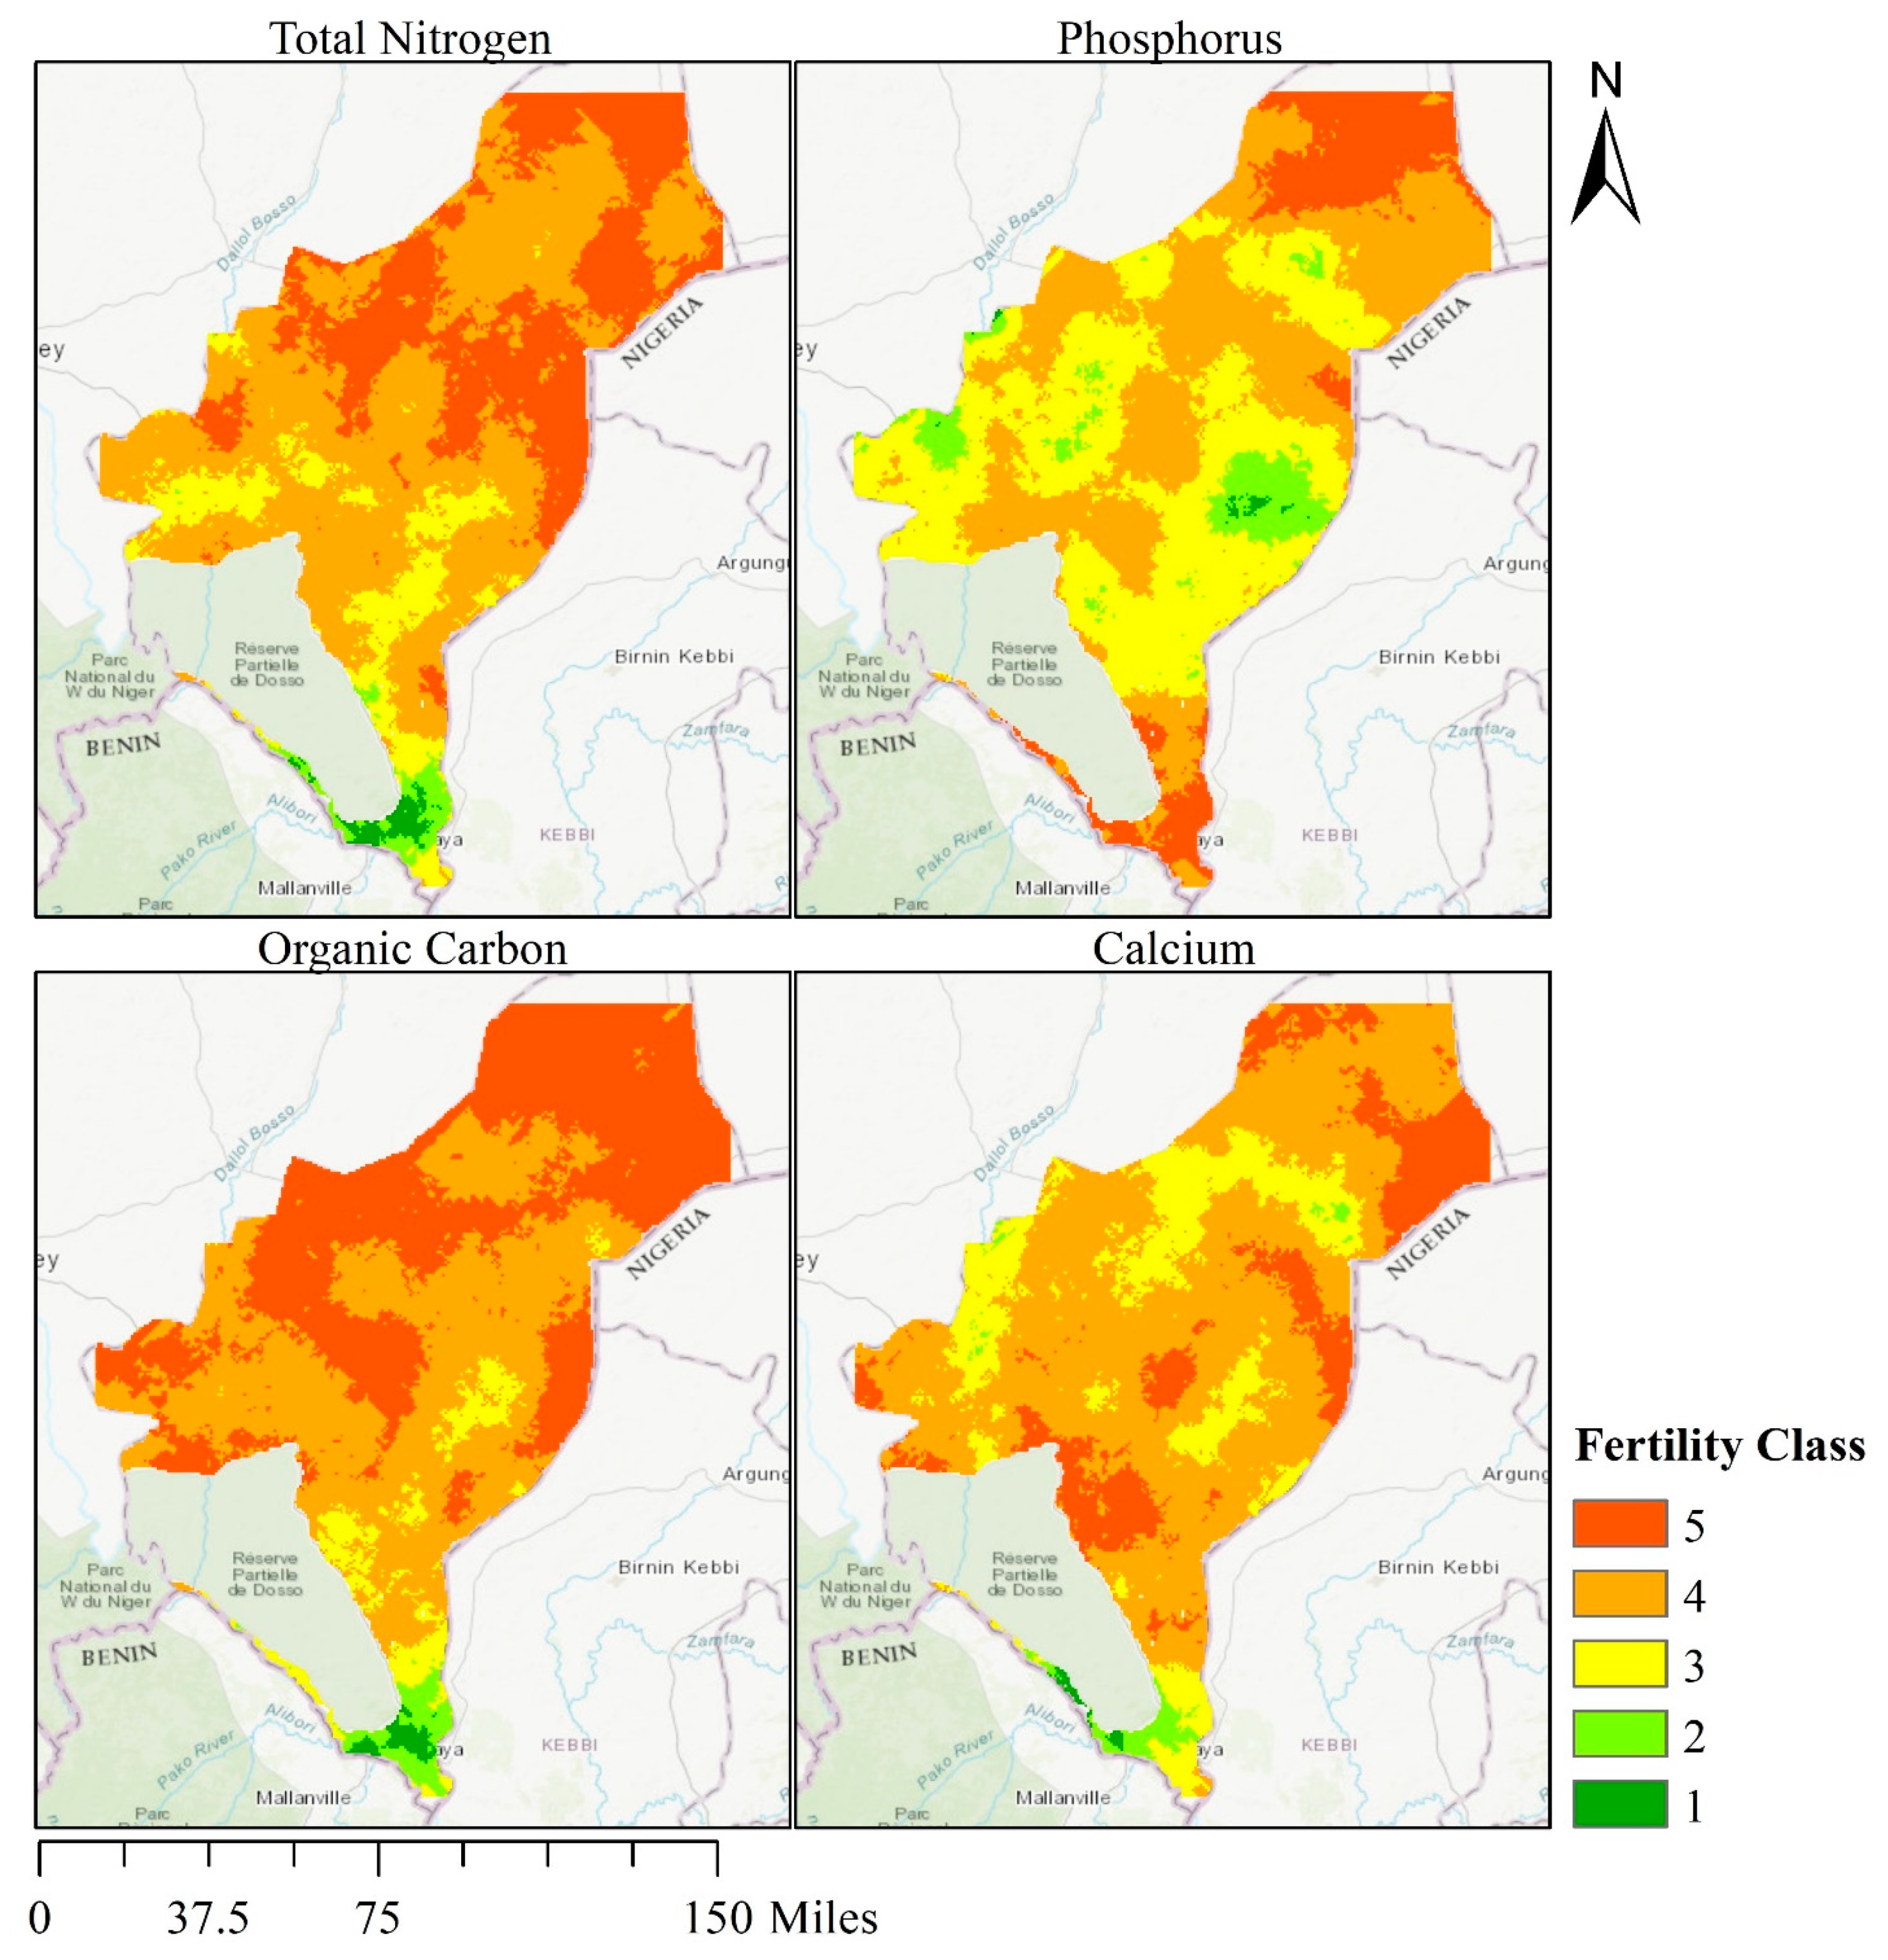
2.6. Fertility Analysis
3. Results
3.1. Summary of Data Inputs
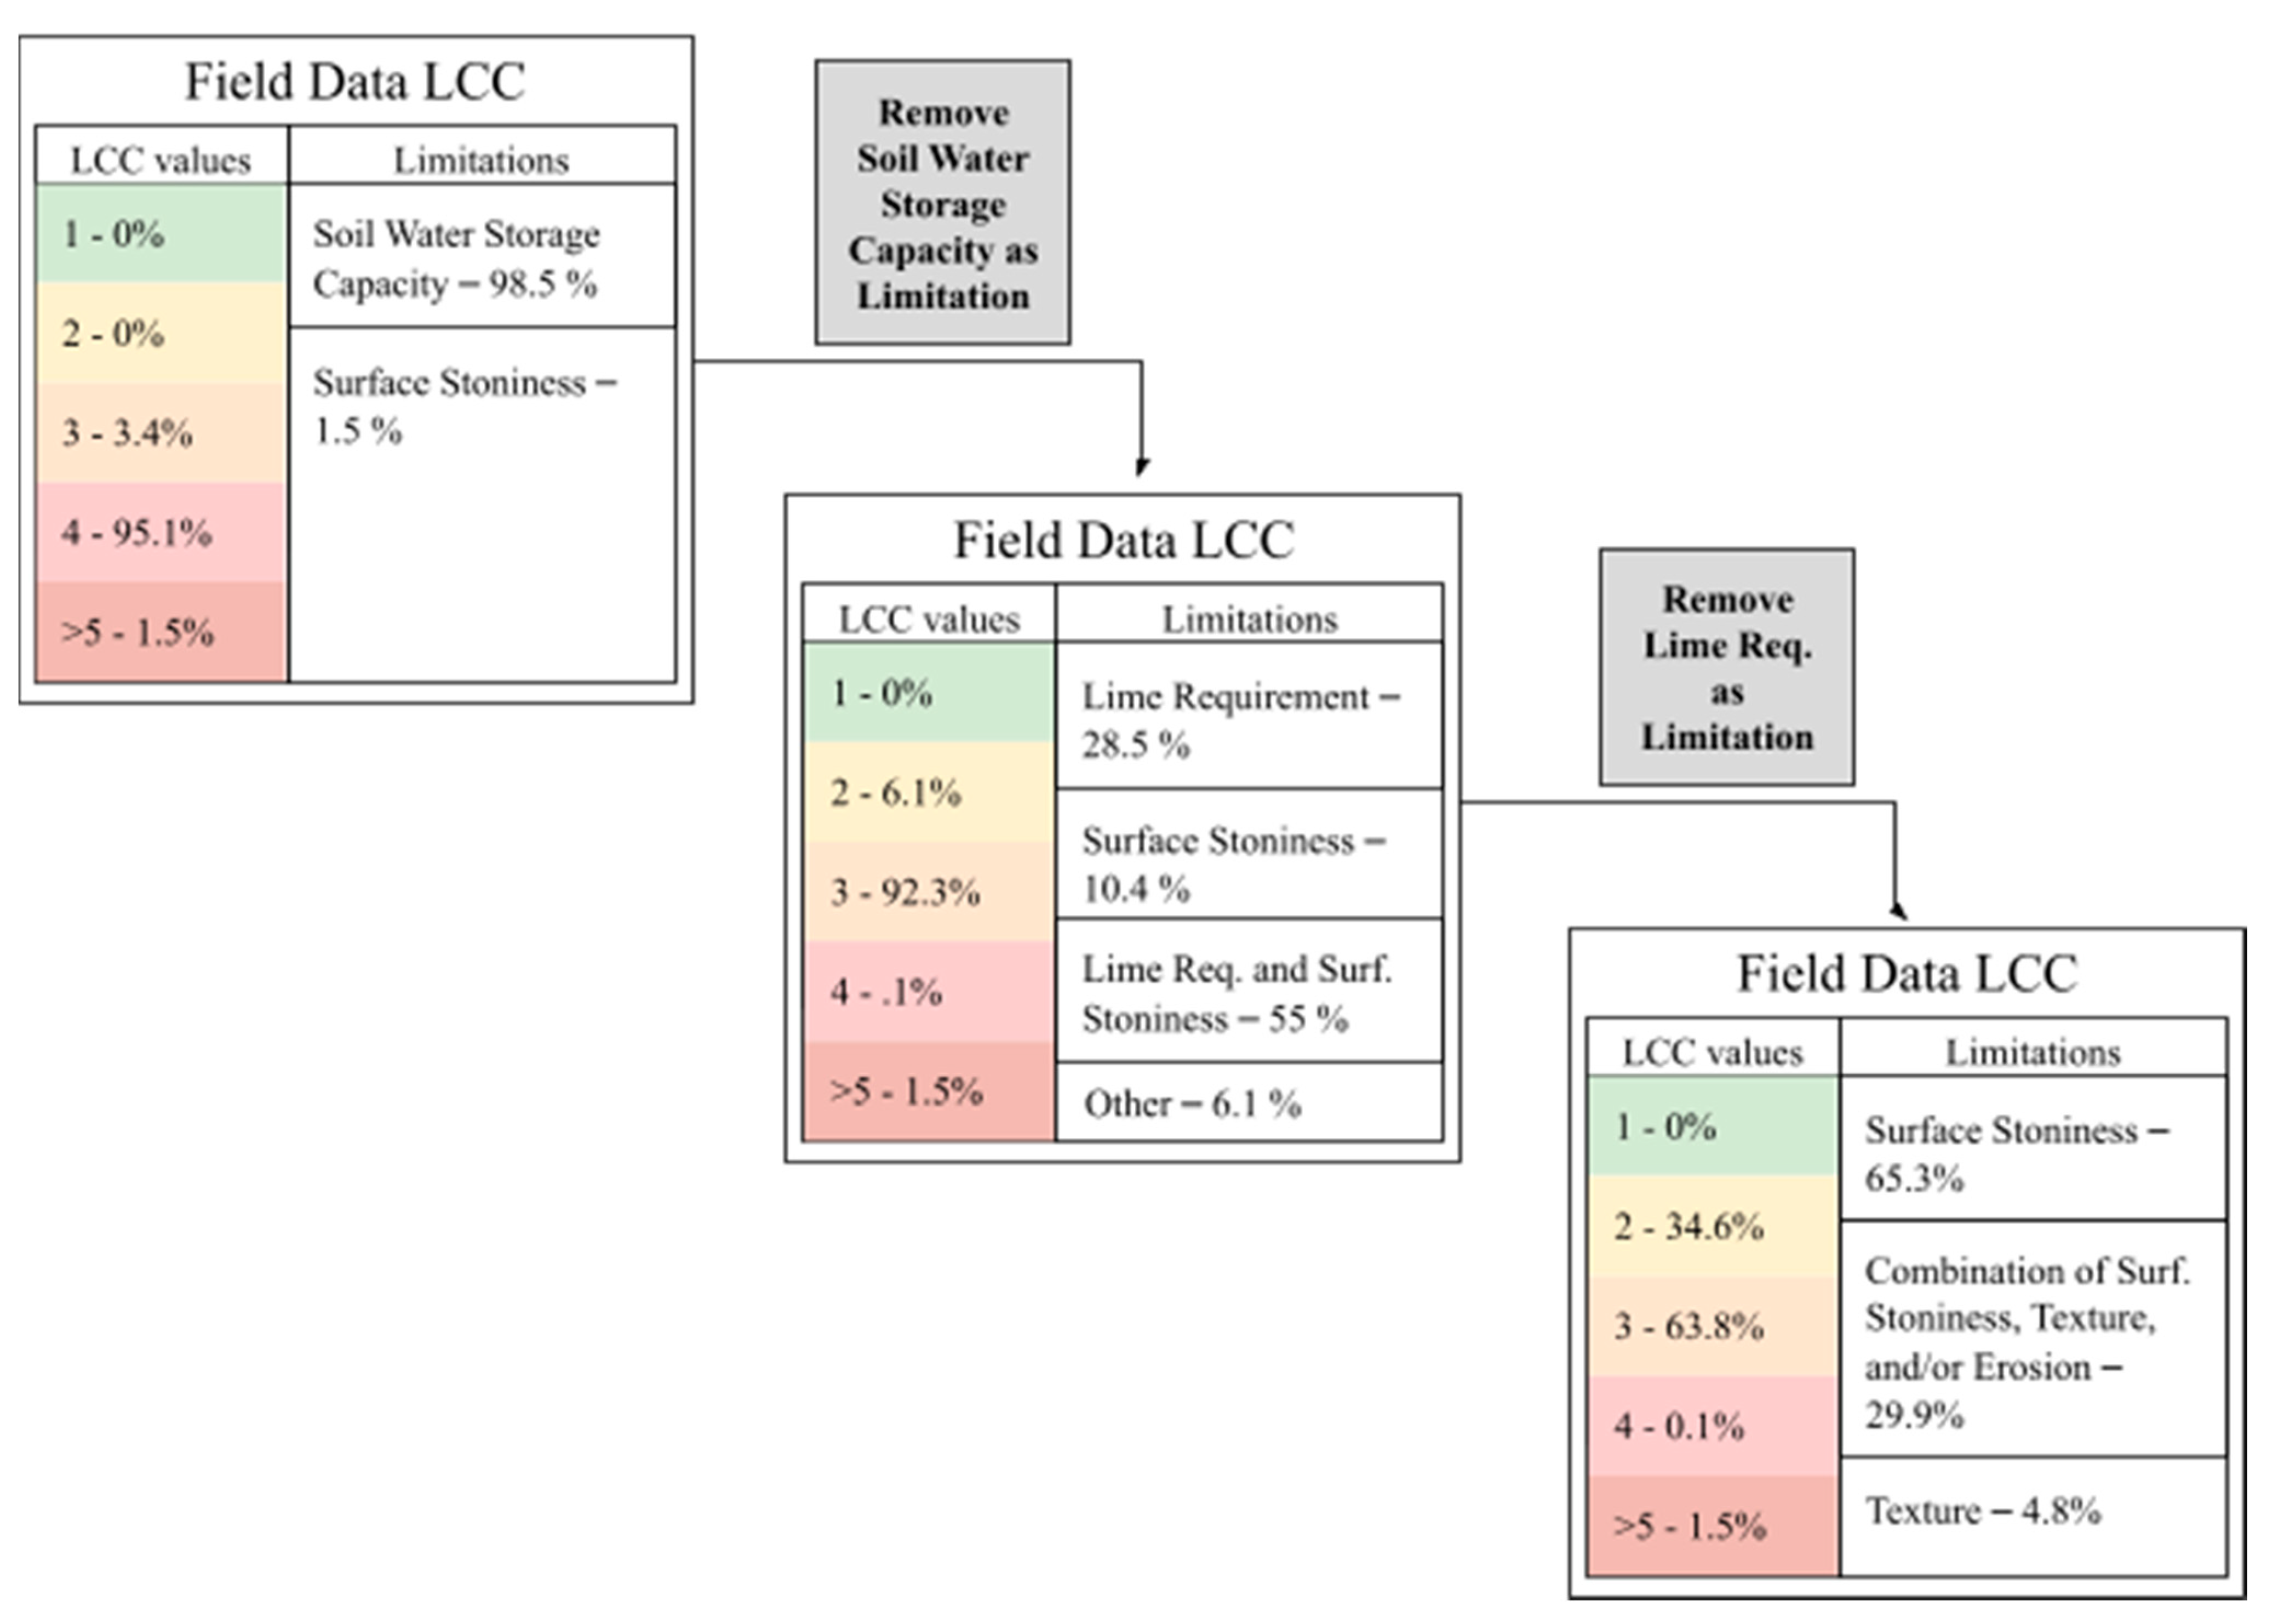
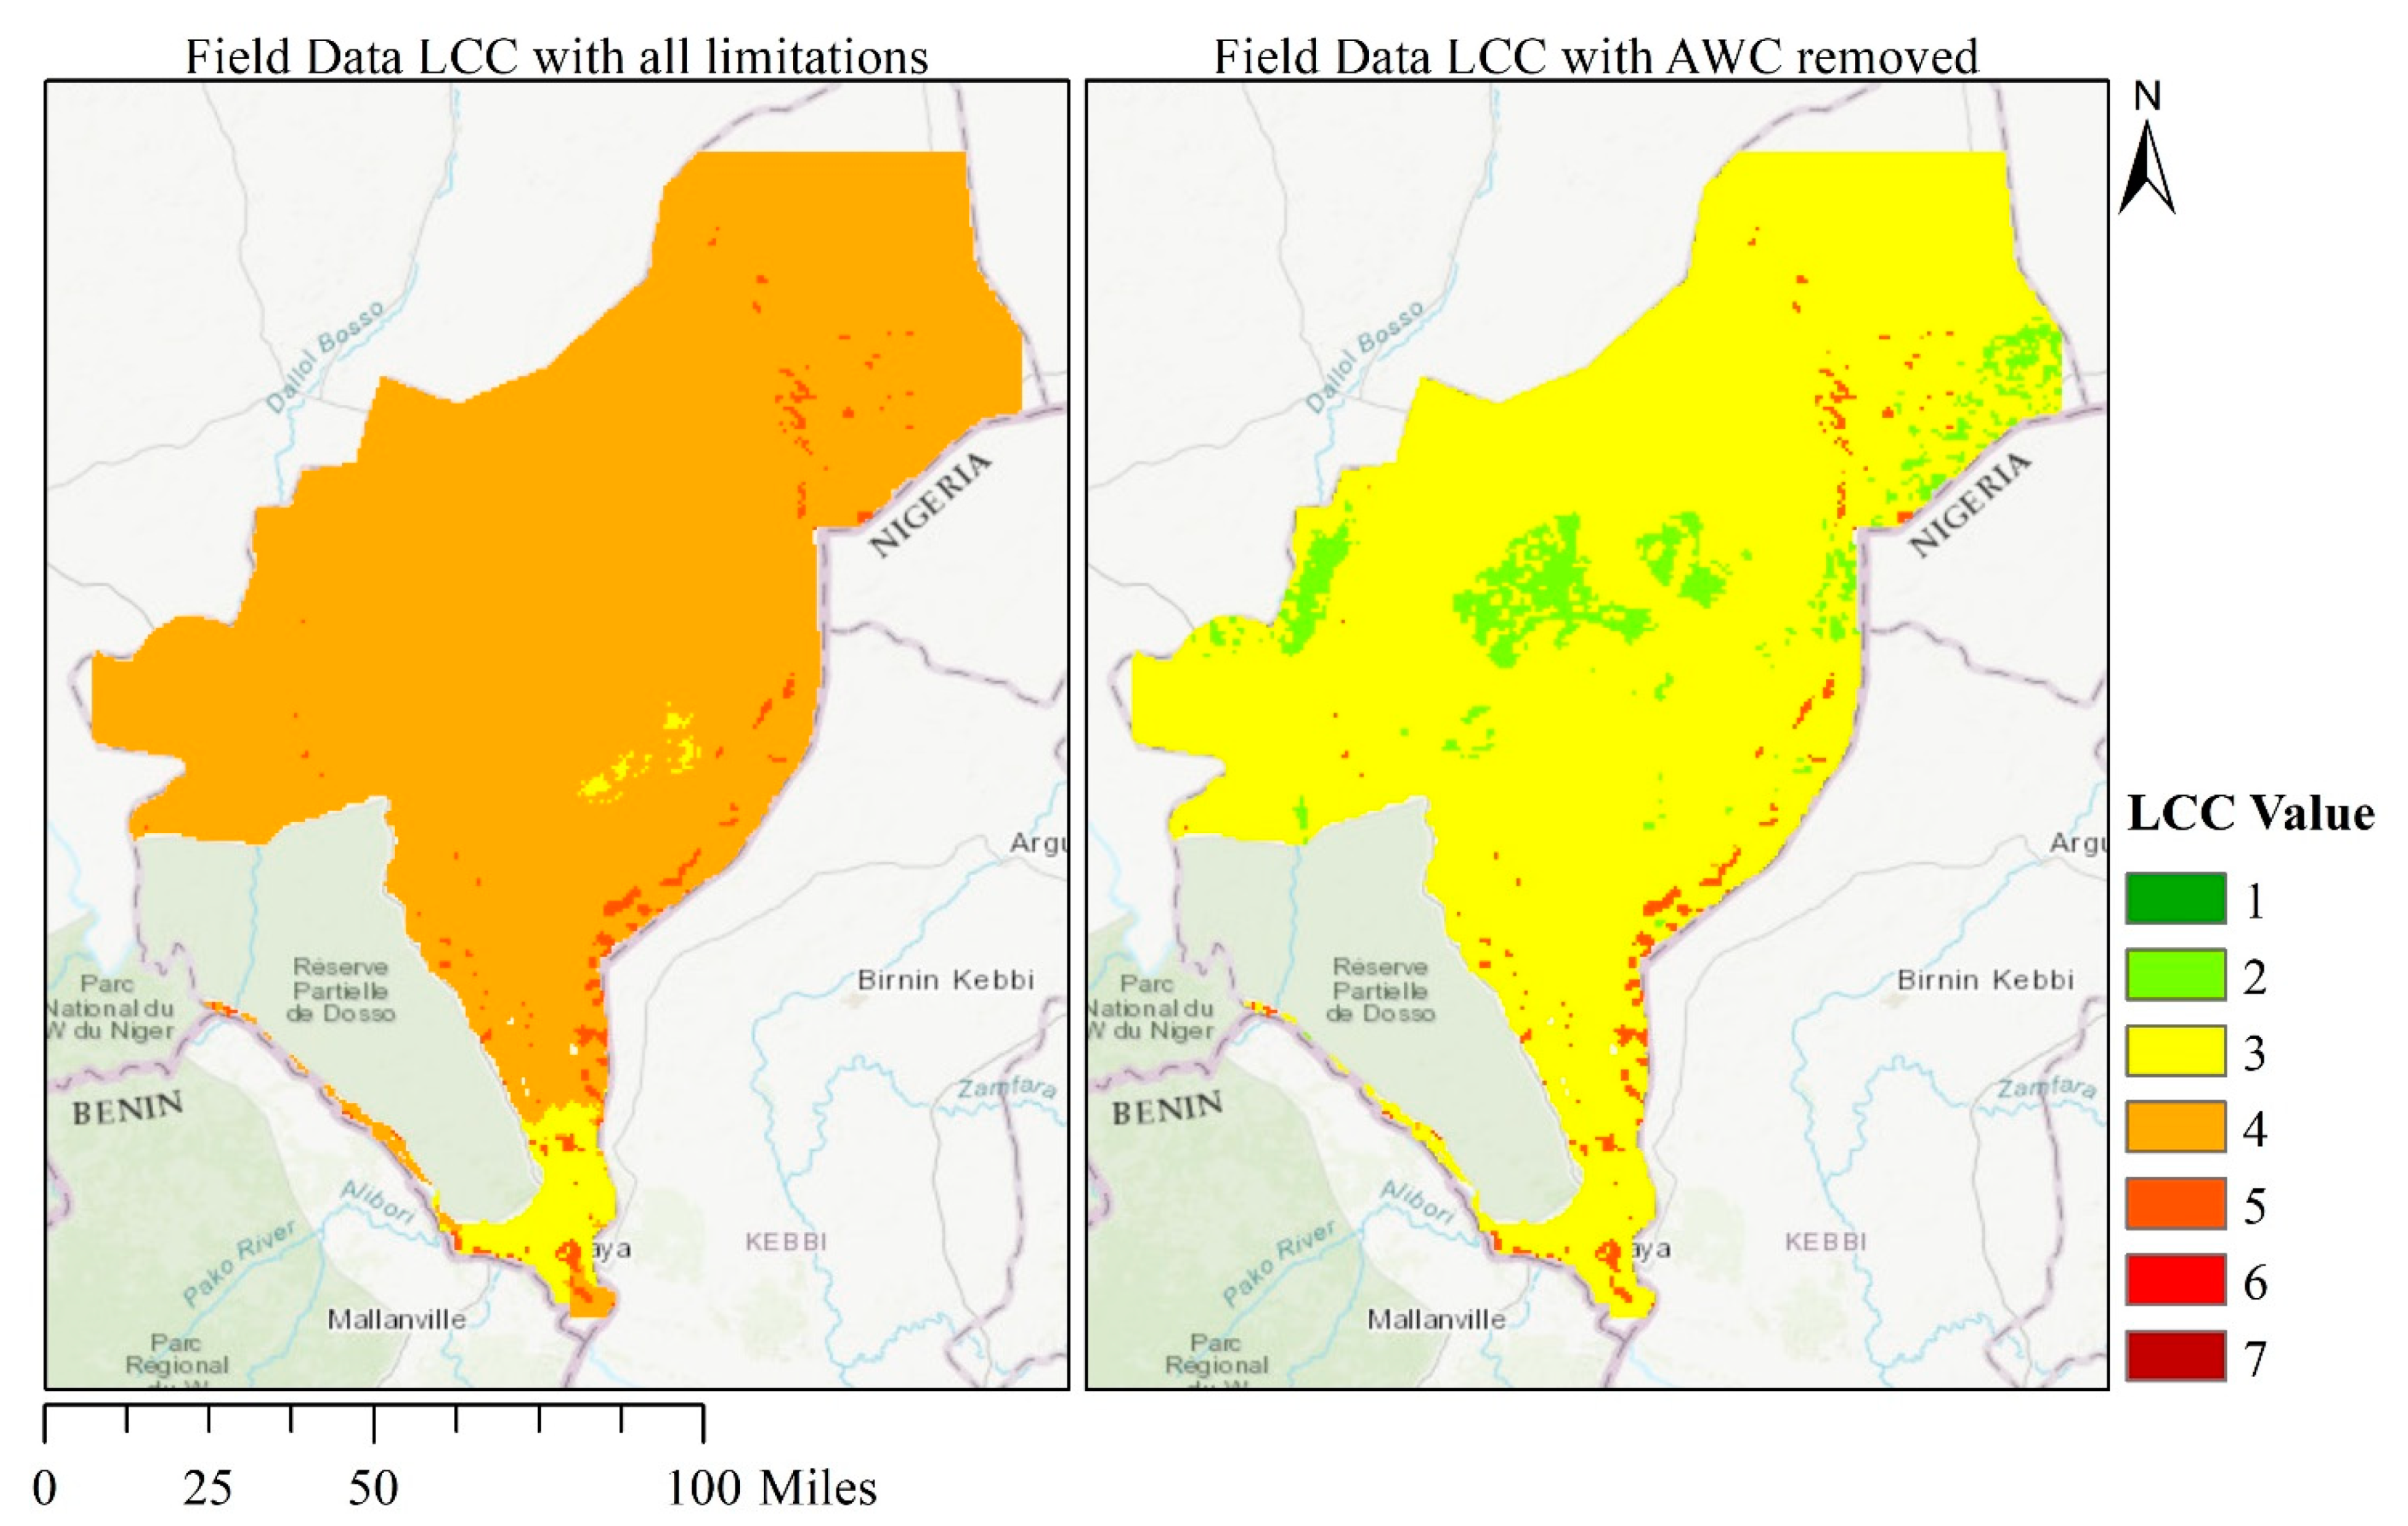
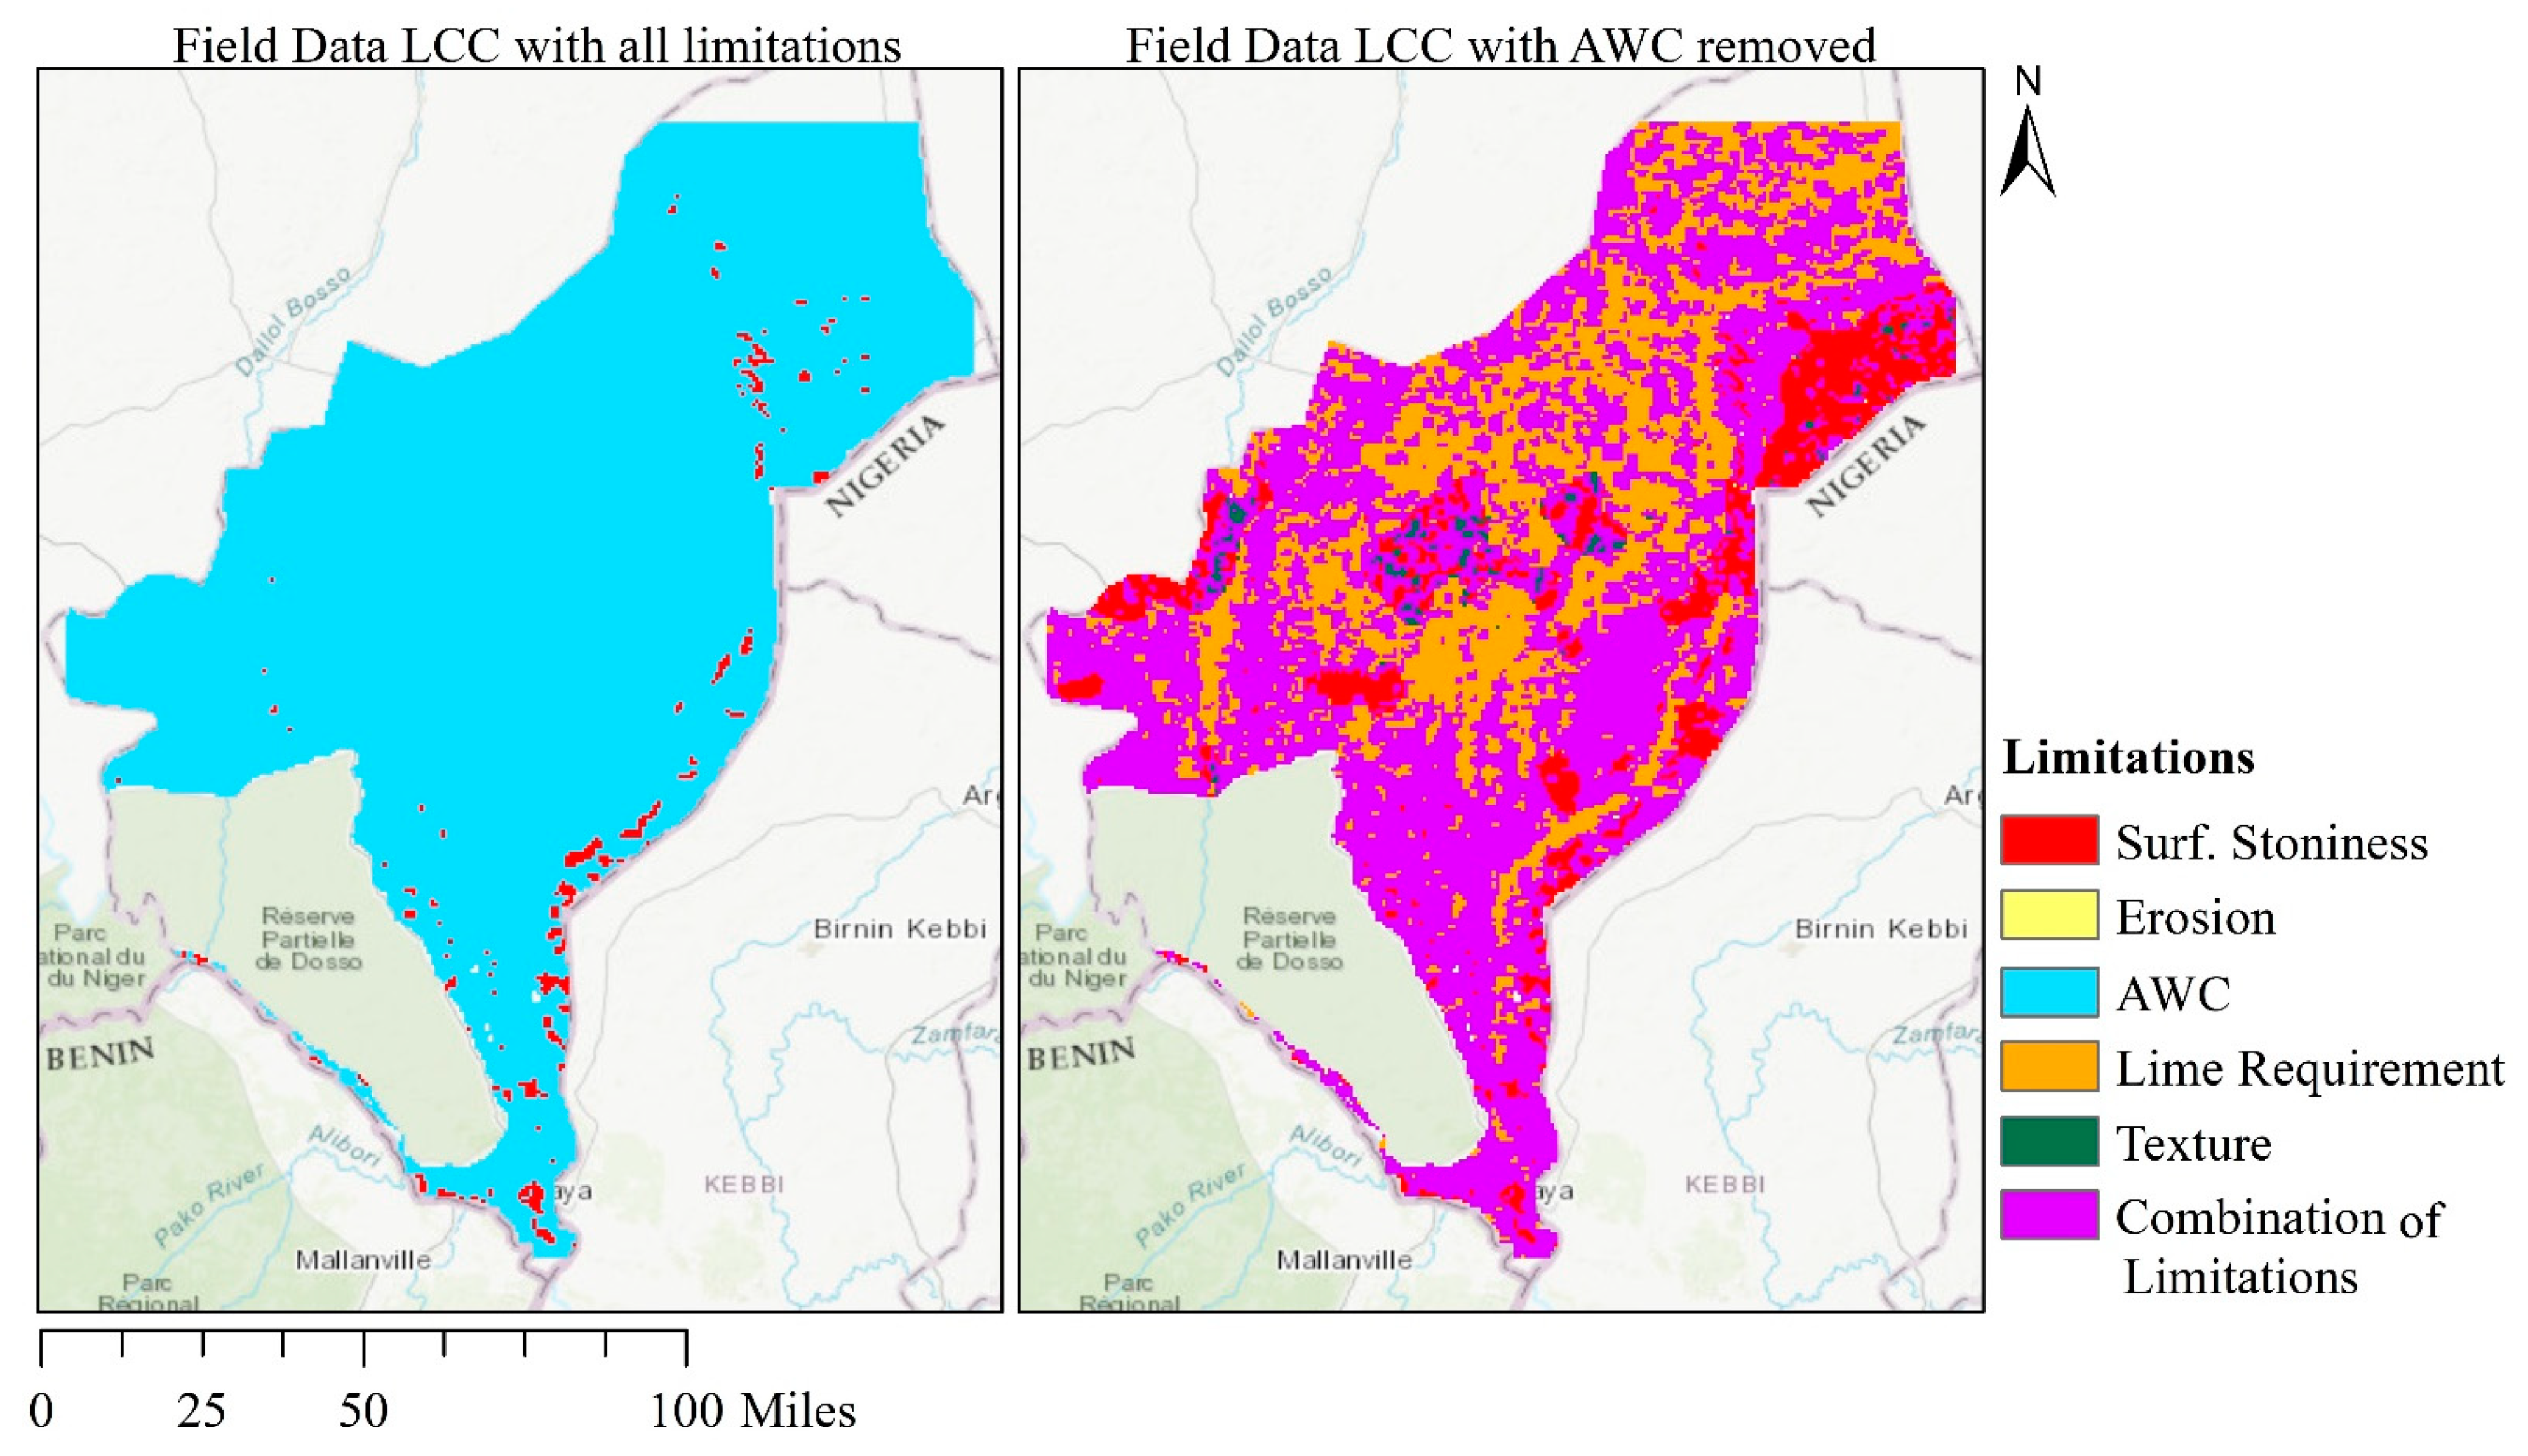
3.2. Field Data
3.3. Digital Soil Datasets
3.4. Differences between Datasets
4. Discussion
4.1. Interpretation for the Dosso Region
4.2. Comparison of the Three Map Products
5. Conclusions
Author Contributions
Funding
Data Availability Statement
Conflicts of Interest
References
- FAO; IFAD; UNICEF; WFP; WHO. The State of Food Security and Nutrition in the World 2017: Building Resilience for Peace and Food Security; FAO: Rome, Italy, 2017. [Google Scholar]
- Connolly-Boutin, L.; Smit, B. Climate change, food security, and livelihoods in sub-Saharan Africa. Reg. Environ. Chang. 2016, 16, 385–399. [Google Scholar] [CrossRef] [Green Version]
- IPCC. Climate Change 2014–Impacts, Adaptation and Vulnerability: Regional Aspects; Field, C.B., Barros, D.J., Dokken, K.J., Mach, M.D., Mastrandrea, T.E., Bilir, M., Chaterjee, K.L., Ebi, Y.O., Estrada, R.C., et al., Eds.; Cambridge University Press: Cambridge, UK, 2014. [Google Scholar]
- Yordanov, I.; Velikova, V.; Tsonev, T. Plant Responses to Drought, Acclimation, and Stress Tolerance. Photosynthetica 2000, 38, 171–186. [Google Scholar] [CrossRef]
- Barnabás, B.; Jäger, K.; Fehér, A. The effect of drought and heat stress on reproductive processes in cereals. Plant Cell Environ. 2007, 31, 11–38. [Google Scholar] [CrossRef]
- Prasad, P.V.; Bheemanahalli, R.; Jagadish, S.K. Field crops and the fear of heat stress—Opportunities, challenges and future directions. Field Crop. Res. 2017, 200, 114–121. [Google Scholar] [CrossRef] [Green Version]
- Welborn, L. Africa and Climate Change: Projecting Vulnerability and Adaptive Capacity; Institute for Security Studies: Pretoria, South Africa, 2018; pp. 1–24. [Google Scholar]
- Ogwang, B.A.; Kabengwela, M.H.; Dione, C.; Kamga, A. The State of Climate of Africa in 2017; African Centre for Meteorological Applications for Development: Niamei, Niger, 2018. [Google Scholar]
- Gautam, M. Managing Drought in Sub-Saharan Africa: Policy Perspectives. In Proceedings of the 2006 Annual Meeting of the International Association of Agricultural Economists, Queensland, Australia, 12–18 August 2006; Available online: https://ideas.repec.org/p/ags/iaae06/25608.html (accessed on 29 March 2021).
- Gisladottir, G.; Stocking, M. Land degradation control and its global environmental benefits. Land Degrad. Dev. 2005, 16, 99–112. [Google Scholar] [CrossRef]
- IPBES. The IPBES Assessment on Land Degradation and Restoration; Companion to Environmental Studies; Routledge: Oxon, UK, 2018. [Google Scholar]
- Barbier, E.B.; Hochard, J.P. Land degradation and poverty. Nat. Sustain. 2018, 1, 623–631. [Google Scholar] [CrossRef]
- Pereira, P.; Bogunovic, I. Land degradation neutrality. How to reverse land degradation with conservation agriculture practices? In Proceedings of the 12th International Scientific/Professional Conference Agriculture in Nature and Environment Protection, Osijek, Croatia, 27–29 February 2019. [Google Scholar]
- Huang, J.; Yu, H.; Guan, X.; Wang, G.; Guo, R. Accelerated dryland expansion under climate change. Nat. Clim. Chang. 2016, 6, 166–171. [Google Scholar] [CrossRef]
- Kopittke, P.M.; Menzies, N.W.; Wang, P.; McKenna, B.A.; Lombi, E. Soil and the intensification of agriculture for global food security. Environ. Int. 2019, 132, 105078. [Google Scholar] [CrossRef]
- Bindraban, P.S.; van der Velde, M.; Ye, L.; Berg, M.V.D.; Materechera, S.; Kiba, D.I.; Tamene, L.; Ragnarsdóttir, K.V.; Jongschaap, R.; Hoogmoed, M.; et al. Assessing the impact of soil degradation on food production. Curr. Opin. Environ. Sustain. 2012, 4, 478–488. [Google Scholar] [CrossRef]
- Stewart, Z.P.; Pierzynski, G.M.; Middendorf, B.J.; Prasad, P.V.V. Approaches to improve soil fertility in sub-Saharan Africa. J. Exp. Bot. 2020, 71, 632–641. [Google Scholar] [CrossRef] [Green Version]
- Herrick, J.E.; Neff, J.; Quandt, A.; Salley, S.; Maynard, J.; Ganguli, A.; Bestelmeyer, B. Prioritizing land for investments based on short- and long-term land potential and degradation risk: A strategic approach. Environ. Sci. Policy 2019, 96, 52–58. [Google Scholar] [CrossRef]
- Lin, H.; Wheeler, D.; Bell, J.; Wilding, L. Assessment of soil spatial variability at multiple scales. Ecol. Model. 2005, 182, 271–290. [Google Scholar] [CrossRef]
- Carletto, G.; Jolliffe, D.; Banerjee, R. From Tragedy to Renaissance: Improving Agricultural Data for Better Policies; Policy Research Working Paper No. 7150; World Bank Group: Washington, DC, USA, 2015. [Google Scholar]
- De La Rosa, D.; Mayol, F.; Diaz-Pereira, E.; Fernandez, M. A land evaluation decision support system (MicroLEIS DSS) for agricultural soil protection: With special reference to the Mediterranean region. Environ. Model. Softw. 2004, 19, 929–942. [Google Scholar] [CrossRef]
- Elsheikh, R.; Shariff, A.R.B.M.; Amiri, F.; Ahmad, N.B.; Balasundram, S.K.; Soom, M.A.M. Agriculture Land Suitability Evaluator (ALSE): A decision and planning support tool for tropical and subtropical crops. Comput. Electron. Agric. 2013, 93, 98–110. [Google Scholar] [CrossRef] [Green Version]
- Gad, A.-A. Land capability classification of some western desert Oases, Egypt, using remote sensing and GIS. Egypt. J. Remote Sens. Space Sci. 2015, 18, S9–S18. [Google Scholar] [CrossRef] [Green Version]
- Tiruneh, G. Land capability classification using geographical information system in shinfa watershed, highlands of Ethiopia. J. Phys. Sci. Environ. Stud. 2015, 1, 17–20. [Google Scholar]
- Quandt, A.; Herrick, J.; Peacock, G.; Salley, S.; Buni, A.; Mkalawa, C.; Neff, J. A standardized land capability classification system for land evaluation using mobile phone technology. J. Soil Water Conserv. 2020, 75, 579–589. [Google Scholar] [CrossRef]
- Potts, M.; Zulu, E.; Wehner, M.; Castillo, F.; Henderson, C. The Crisis in the Sahel Humanitarian Exchange. October 2012. Available online: http://bixby.berkeley.edu/wp-content/uploads/2015/03/potts_2013_oasis_crisis_in_the_sahel.pdf (accessed on 12 January 2021).
- Bello, G.H.M.; Maman, M.N.M. A Ricardian Analysis of the Impact of Temperature and Rainfall Variability on Agriculture in Dosso and Maradi Regions of Niger Republic. Agric. Sci. 2015, 6, 724–733. [Google Scholar] [CrossRef] [Green Version]
- Tiepolo, M.; Bacci, M.; Braccio, S. Multihazard Risk Assessment for Planning with Climate in the Dosso Region, Niger. Climate 2018, 6, 67. [Google Scholar] [CrossRef] [Green Version]
- SLAPIS. ANADIA2. Projet D’Adaptation au Changement Climatique, Prévention des Catastrophes et Développement Agricole pour la Sécurité Alimentaire. Deuxième Phase. 2018. Available online: http://sdicatalog.fi.ibimet.cnr.it:5003/fr/dataset/9dbe4f54-fc64-418b-a88f-2b023657cfec/resource/4a1c48a2-6b4e-4194-b5d9-e4767f2ca12f/download/larba-birno.pdf (accessed on 4 March 2021).
- Khouma, M. Les grands types de sols du Niger. In Proceedings of the Quatorzième Réunion du Sous-Comité Ouest et Centre Africain de Corrélation des Sols pour la Mise en Valeur des Terres, Abomey, Bénin, 9–13 October 2000. [Google Scholar]
- Mehlich, A. Mehlich 3 soil test extractant: A modification of Mehlich 2 extractant. Commun. Soil Sci. Plant Anal. 1984, 15, 1409–1416. [Google Scholar] [CrossRef]
- Saxton, K.E.; Rawls, W.J. Soil Water Characteristic Estimates by Texture and Organic Matter for Hydrologic Solutions. Soil Sci. Soc. Am. J. 2006, 70, 1569–1578. [Google Scholar] [CrossRef] [Green Version]
- FAO; IIASA; ISSCAS; ISRIC. Harmonized World Soil Database (Version 1.2); FAO: Rome, Italy; IIASA: Laxenburg, Austria, 2012. [Google Scholar]
- Hengl, T.; De Jesus, J.M.; Heuvelink, G.B.M.; Gonzalez, M.R.; Kilibarda, M.; Blagotić, A.; Shangguan, W.; Wright, M.N.; Geng, X.; Bauer-Marschallinger, B.; et al. SoilGrids250m: Global gridded soil information based on machine learning. PLoS ONE 2017, 12, e0169748. [Google Scholar] [CrossRef] [PubMed] [Green Version]
- Sanderman, J.; Hengl, T.; Fiske, G.J. Soil carbon debt of 12,000 years of human land use. Proc. Natl. Acad. Sci. USA 2017, 114, 9575–9580. [Google Scholar] [CrossRef] [Green Version]
- Zomer, R.J.; Bossio, D.A.; Sommer, R.; Verchot, L.V. Global Sequestration Potential of Increased Organic Carbon in Cropland Soils. Sci. Rep. 2017, 7, 1–8. [Google Scholar] [CrossRef] [Green Version]
- United Nations; Department of Economic and Social Affairs, Population Division. World Population Prospects; United Nations: New York, NY, USA, 2019; Volume 1. [Google Scholar]
- Shettima, A.G.; Tar, U.A. Farmer-pastoralist conflict in West Africa: Exploring the causes and consequences. Inf. Soc. Justice J. 2008, 1, 163–184. [Google Scholar] [CrossRef]
- Cornelis, W.; Waweru, G.; Araya, T. Building Resilience Against Drought and Floods: The Soil-Water Management Perspective. In Sustainable Agriculture Reviews; Springer: Berlin/Heidelberg, Germany, 2019; pp. 125–142. [Google Scholar]


| Capability Class Codes † | Soil Limitations for Agricultural Use |
|---|---|
| LCC class 1 | Most suitable for cropping systems with few limitations to crop growth |
| LCC class 2 | Suitable for agriculture with moderate limitations that may restrict crop selection or require specific management practices |
| LCC class 3 | Severe limitations that will significantly reduce cropping options and/or require extensive conservation practices |
| LCC class 4 | Very severe limitations with fewer cropping options relative to class 3 and/or more extensive conservation practices |
| LCC class 5–8 | Not suitable to crop cultivation |
| Subclass | Potential Interventions | |
|---|---|---|
| Erosion | Stone lines; half-moon; grass bands; zai; reduced tillage; agroforestry; pasture; hay; conservation | |
| Soil | Depth | Zai; half-moon; tied ridges; possibly deep tillage (only where depth to a non-bedrock root-limiting layer that can be broken and erosion risk is low); agroforestry; pasture; hay; conservation |
| Salinity | Plant salinity tolerant crops; modify irrigation schedule and amount, ensure adequate drainage. | |
| Surface stoniness | Remove stones or use planting methods that are not limited by surface stones | |
| Soil water storage capacity | Increase organic amendments such as manure and crop residues; use drought-tolerant crops including pasture and hay species; use zai, stone lines, grass bands, tied ridges, contour ridges and half-moon for rainwater capture; install irrigation; keep soil surface covered; reduce planting density | |
| Lime requirement | Add lime; some biochars in some cases; use non-acidifying fertilizers | |
| Wetness | Flooding | Communal level dams, use flood-tolerant crops |
| Water table depth | Conservation; pasture; hay | |
| Permeability | Increase organic amendments such as manure and crop residues; use zai, stone lines, tied ridges, contour ridges, grass bands, and half-moon for slowing surface runoff; some tillage |
| Input Data Set | Variables Needed for LCC | Source of Variable |
|---|---|---|
| Field Data | Soil Depth | Variable unavailable |
| Surface soil texture | Sand, silt, and clay percentages from 0–20 cm | |
| Salinity | Variable unavailable | |
| Surface Stoniness § | Volumetric gravel content of 0–5 cm horizon ‡ from SoilGrids dataset | |
| Soil water storage capacity | Calculated for 0–20 cm using texture, organic matter, and rock fragment, multiplied by 5 to have 100 cm of soil water storage capacity | |
| Lime requirement | pH value from 0–20 cm | |
| Flooding | Variable unavailable | |
| Water table depth | Variable unavailable | |
| Permeability | Calculated for each horizon using texture, organic matter, and rock fragment, minimum permeability value of all horizons ‡ used | |
| Sentinel-2 Digital Elevation Model | Calculated using ArcGIS |
| Value | Symbols | Units |
|---|---|---|
| Organic Matter | OM (=0.5% & slider) | (%v)—as percent |
| Sand | SAND | (%v)—as decimal |
| Clay | CLAY | (%v)—as decimal |
| 1st Wilting point step | WP1 | (%v)—as decimal |
| Wilting point solution | WP | (%v)—as decimal |
| 1st Field Capacity step | FC1 | (%v)—as decimal |
| Field Capacity solution | FC | (%v)—as decimal |
| Layer Available Water Capacity | LAWC | (cm/cm) |
| Volume fraction of gravel “Rock Fragment” | RF | (g cm−3)—as decimal |
| Profile Available Water Capacity | AWC | cm |
| Input Data Set | Variables Needed for LCC | Source of Variable |
| FAO Harmonized World Soil Database | Soil Depth | Phases—binary indicators based on characteristics that are significant for land management Roots—depth class of an obstacle to roots |
| Surface soil texture | Sand, silt, and clay percentages for 0–30 cm | |
| Salinity | Electrical conductivity 0–30 cm | |
| Surface Stoniness § | Volumetric gravel (particles > 2 mm) content of 0–30 cm | |
| Soil water storage capacity | Calculated for 0–30 cm and 30–100 cm horizons using texture, organic matter, and rock fragment, summed over horizons | |
| Lime requirement | pH value 0–30 cm | |
| Flooding | Phases—binary indicators based on characteristics that are significant for land management | |
| Water table depth | Variable unavailable | |
| Permeability | Calculated for 0–30 cm and 30–100 cm horizons using texture, organic matter, and rock fragment, minimum permeability value of all horizons used | |
| Sentinel-2 Digital Elevation Model | Calculated using ArcGIS | |
| Input Data Set | Variables Needed for LCC | Source of Variable |
| ISRIC SoilGrids | Soil Depth | Depth to Bedrock |
| Surface soil texture | Sand, silt, and clay percentages of 0–15 cm horizon †‡ from 0–20 cm | |
| Salinity | Variable unavailable | |
| Surface Stoniness | Volumetric gravel (particles > 2 mm) content of 0–5 cm horizon ‡ | |
| Soil water storage capacity | Calculated for each horizon using texture, organic matter, and rock fragment, summed over horizons ‡ | |
| Lime requirement | pH value 0–30 cm horizon ‡ | |
| Flooding | Variable unavailable | |
| Water table depth | Variable unavailable | |
| Permeability | Calculated using texture, organic matter, and rock fragment § | |
| Sentinel-2 Digital Elevation Model | Calculated using ArcGIS |
| Input Soil Dataset | Sand | Loamy Sand | Sandy Loam | Sandy Clay Loam | Loam |
|---|---|---|---|---|---|
| Interpolated Field Data (0–20 cm) | 66.3% | 30.7% | 3.0% | 0% | 0% |
| FAO Harmonized World Soil Database (0–30 cm) | 87.0% | 0% | 5.0% | 0.5% | 7.5% |
| ISRIC SoilGrids (0–15 cm) | 16.5% | 32.3% | 49.3% | 1.0% | 1.0% |
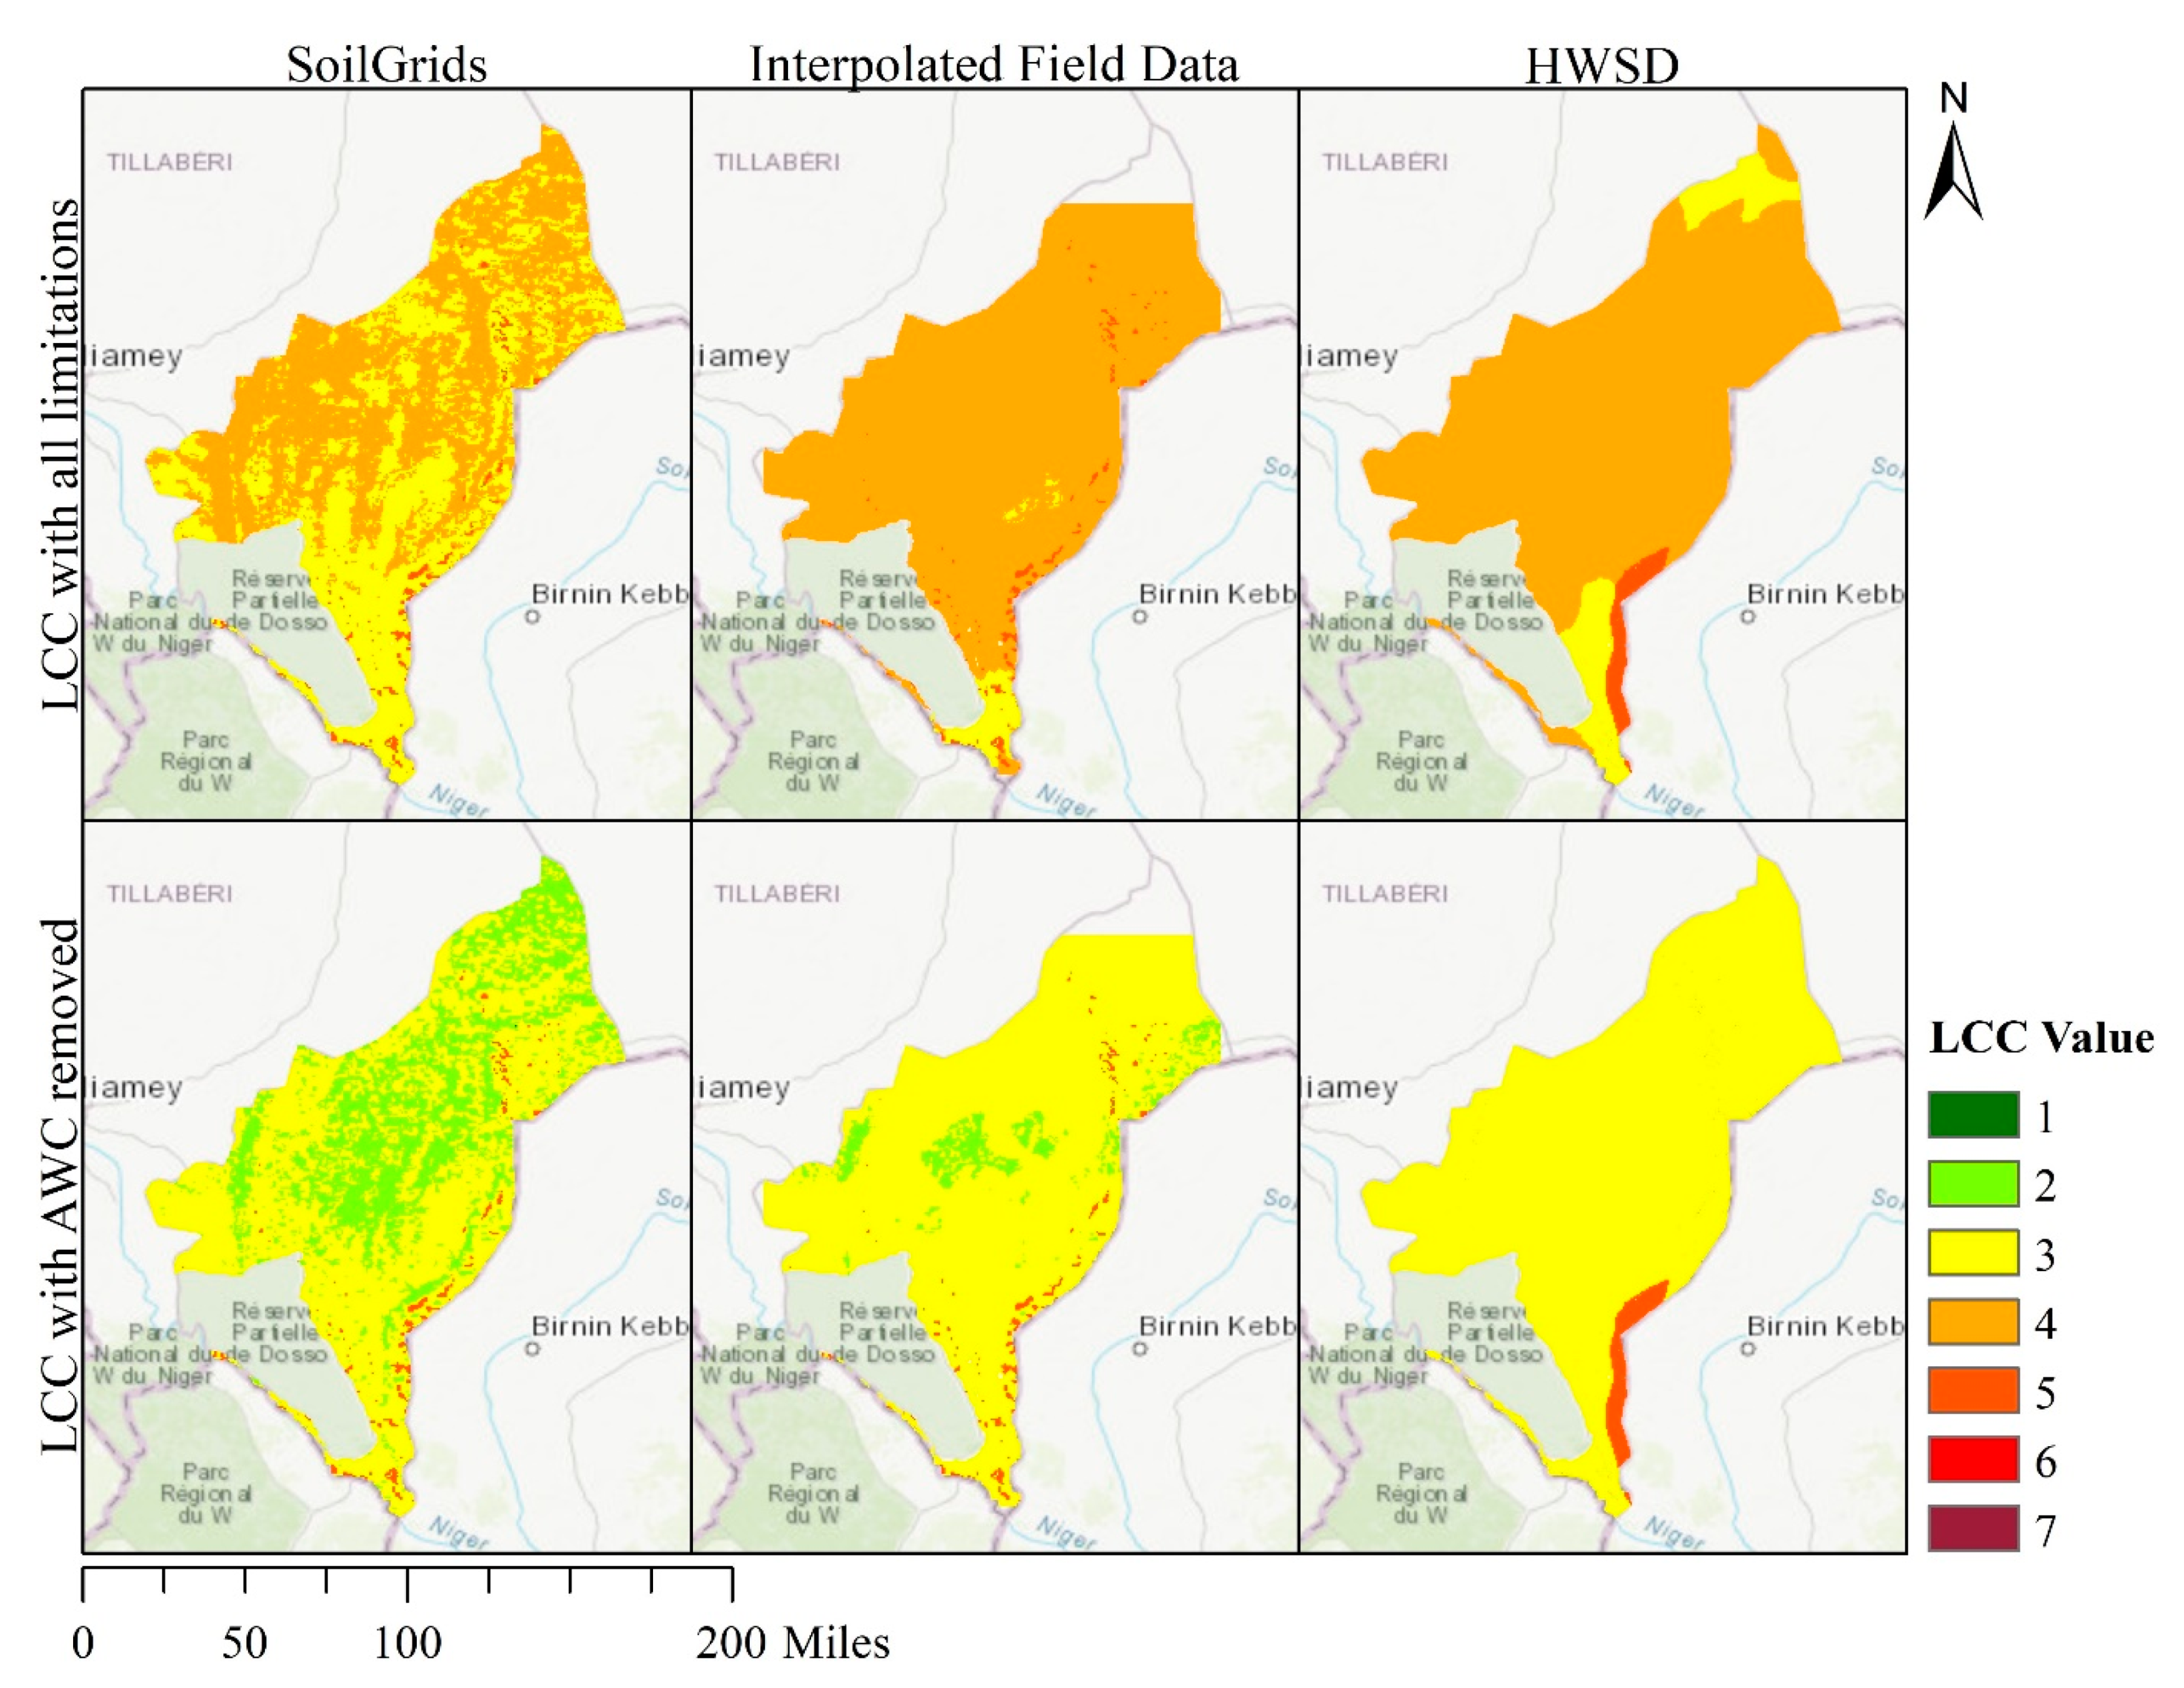
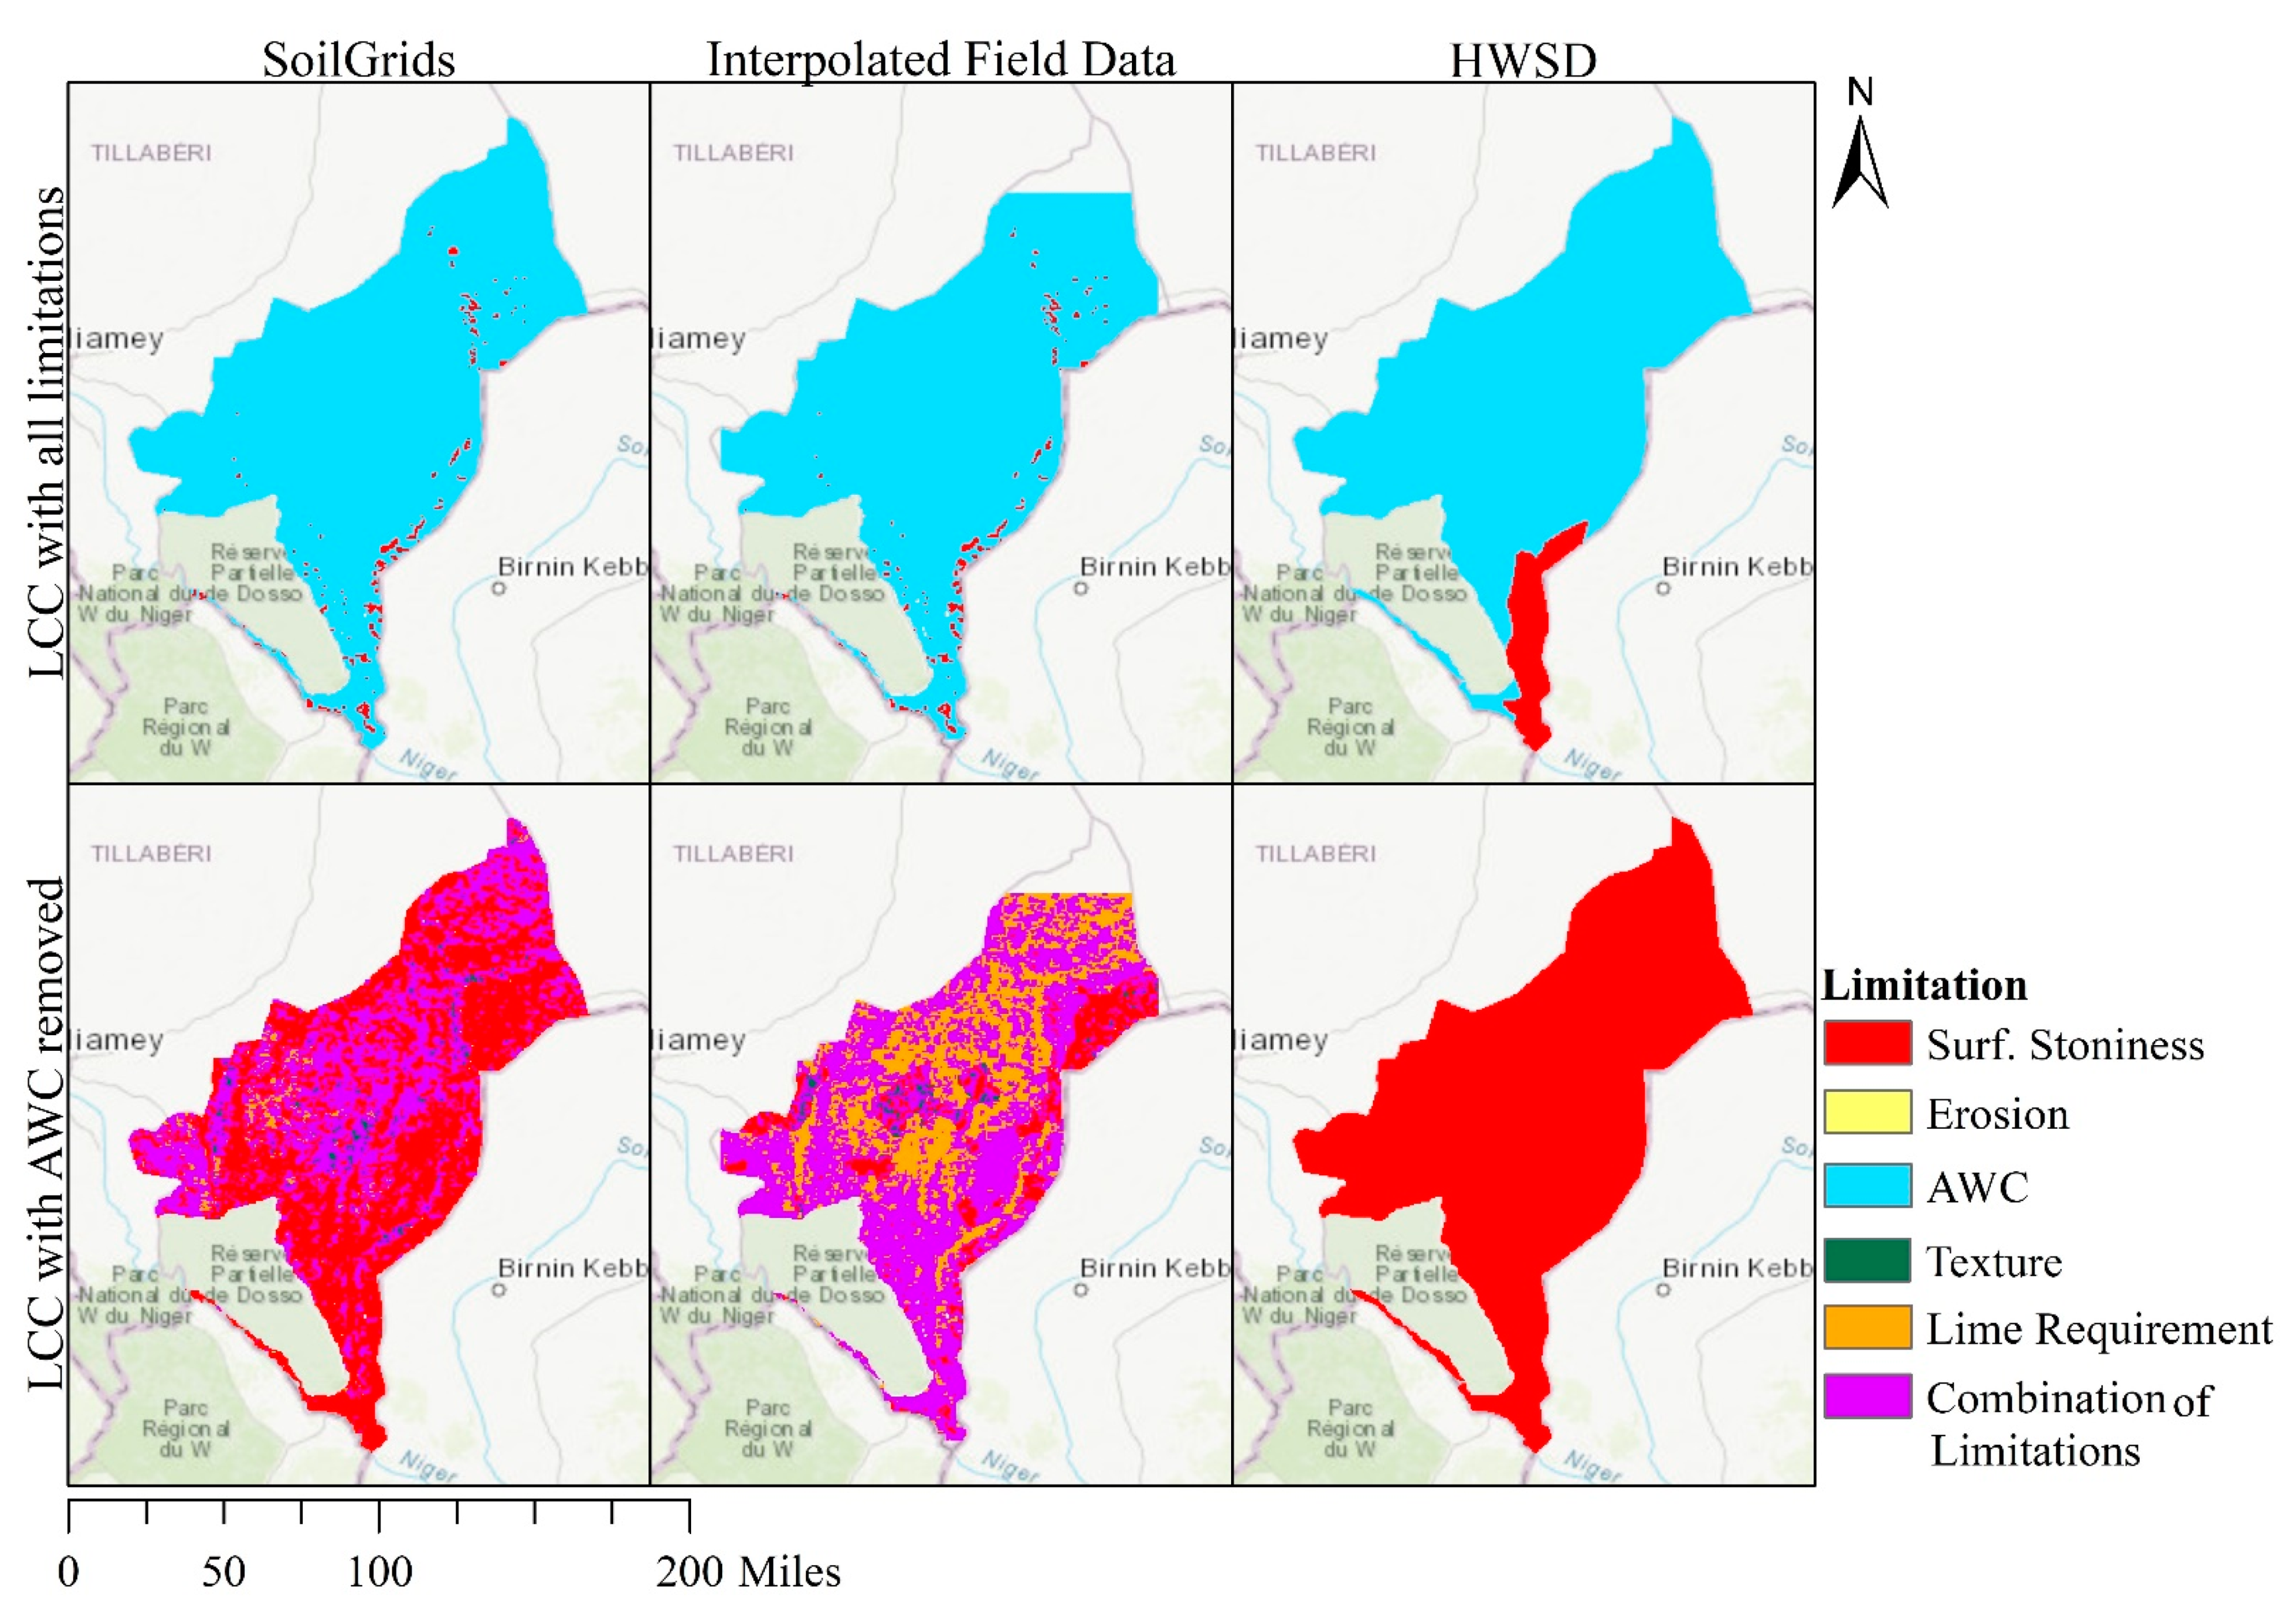
| LCC results with all limitations considered | |||||
| Input soil dataset | LCC 1 | LCC 2 | LCC 3 | LCC 4 | LCC 5–8 |
| Interpolated Field Data (0–20 cm) | 0% | 0% | 3.4% | 95.1% | 1.5% |
| LCC results with available water holding capacity removed as a limitation | |||||
| Input soil dataset | LCC 1 | LCC 2 | LCC 3 | LCC 4 | LCC 5–8 |
| Interpolated Field Data (0–20 cm) | 0% | 6.1% | 92.3% | 0.04% | 1.5% |
| LCC results with all limitations considered | |||||
| Input soil dataset | LCC 1 | LCC 2 | LCC 3 | LCC 4 | LCC 5–8 |
| FAO Harmonized World Soil Database | 0% | 0% | 9.5% | 87.5% | 3.0% |
| ISRIC SoilGrids | 0% | 0% | 44.6% | 53.9% | 1.5% |
| LCC results with available water holding capacity removed as a limitation | |||||
| Input soil dataset | LCC 1 | LCC 2 | LCC 3 | LCC 4 | LCC 5–8 |
| FAO Harmonized World Soil Database | 0% | 0% | 97.0% | 0.1% | 2.9% |
| ISRIC SoilGrids | 0.06% | 32.0% | 66.4% | 0.04% | 1.5% |
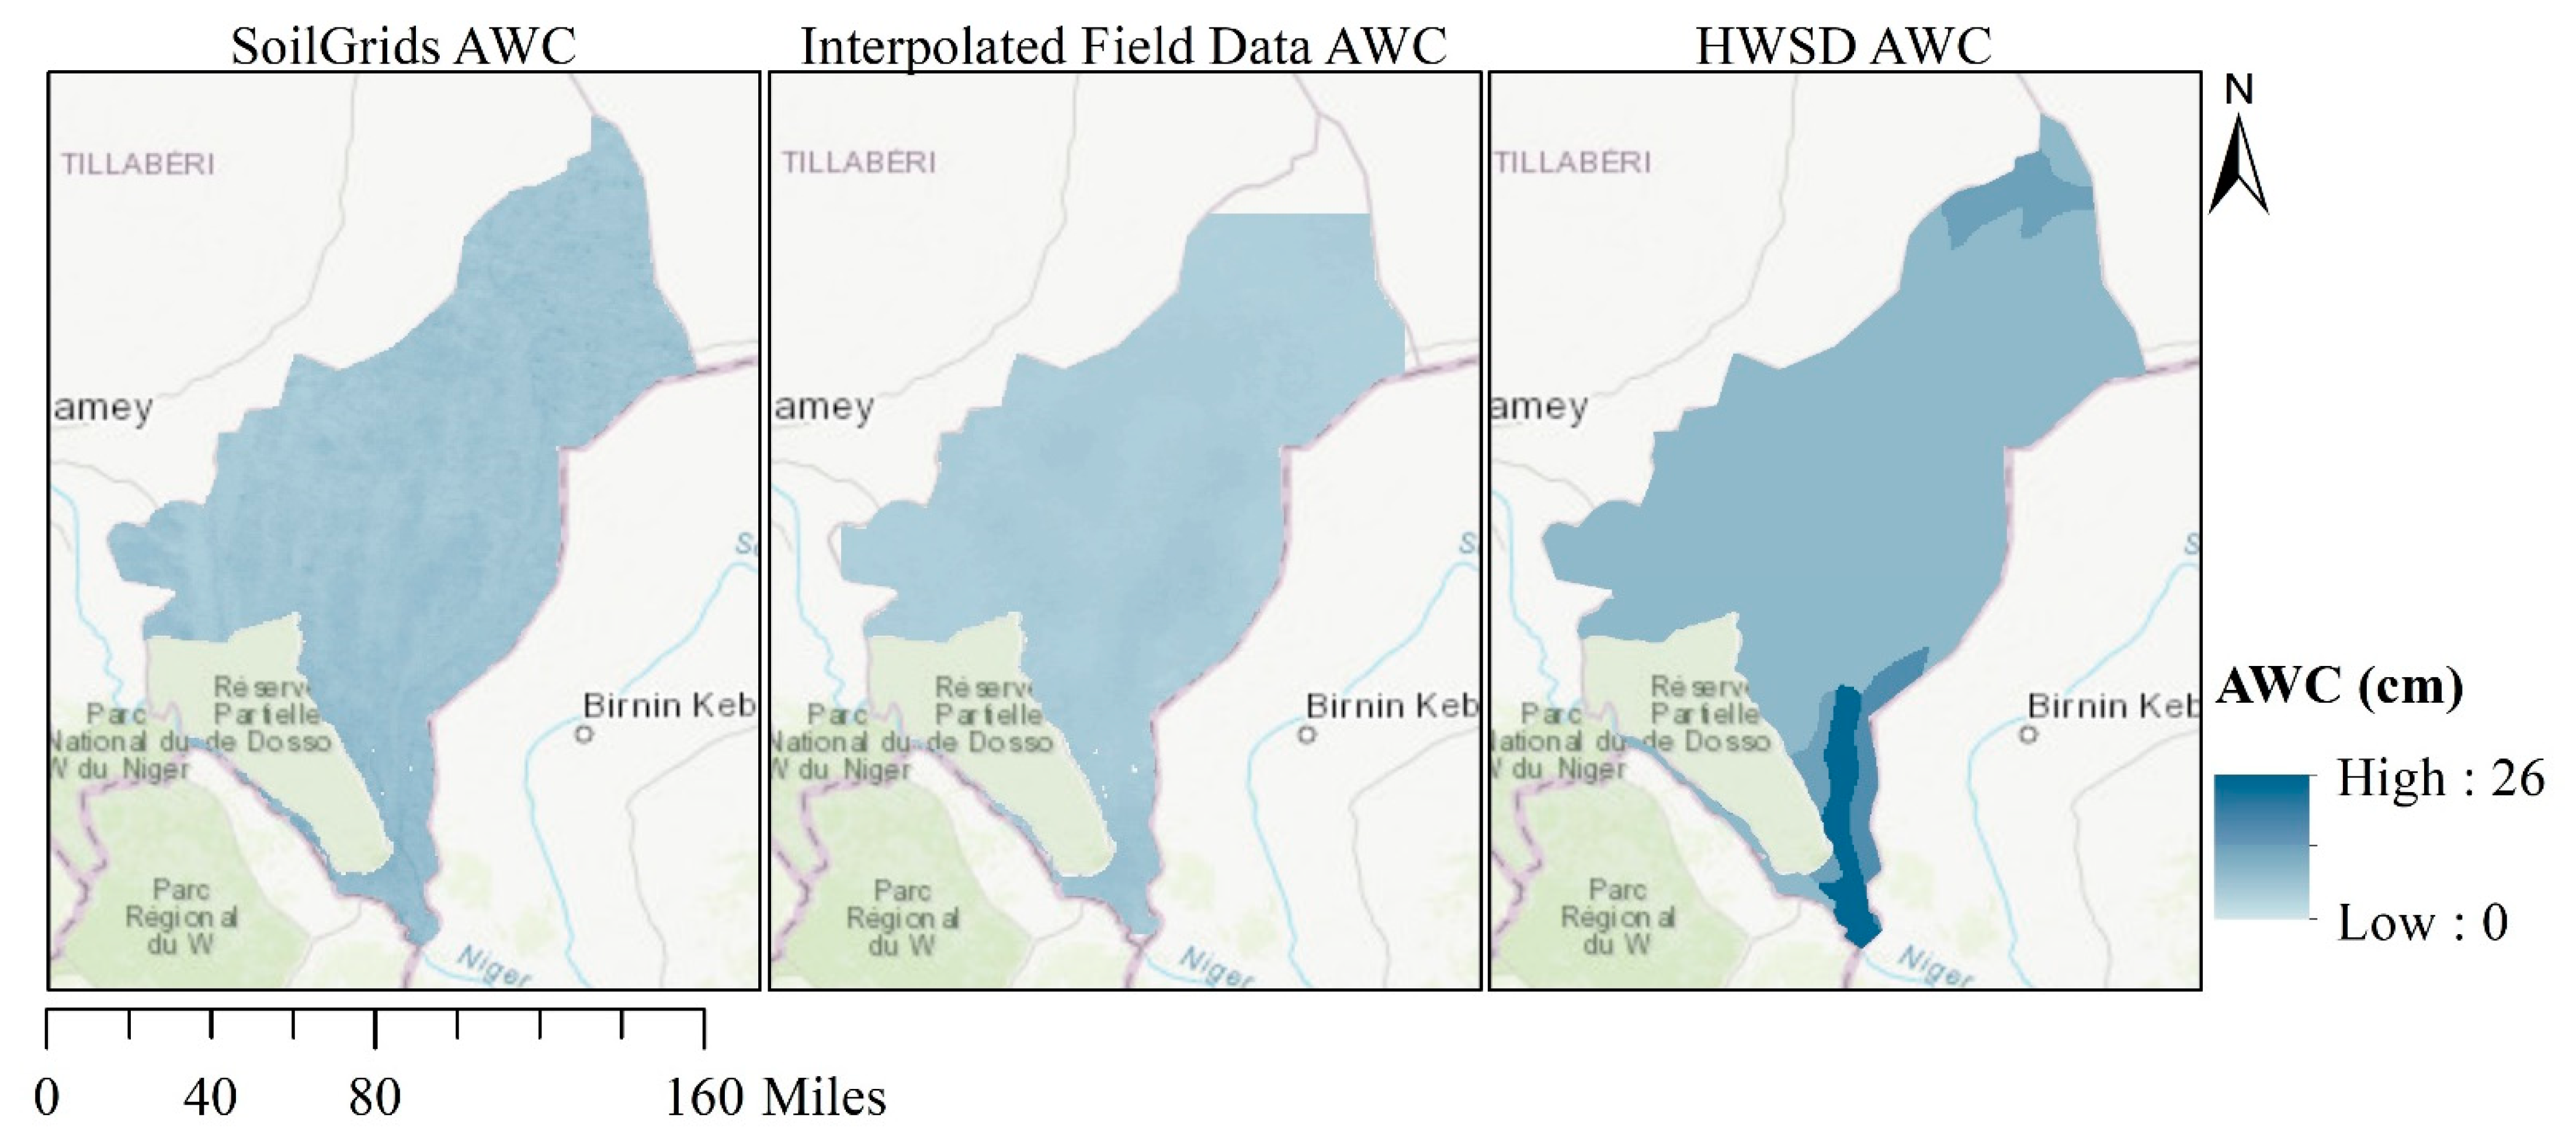
| Input Data Set | AWC Descriptive Statistics (cm/m Soil) | |
|---|---|---|
| FAO Harmonized World Soil Database | Minimum | 8.2 cm |
| Maximum | 25.4 cm | |
| Mean | 9.4 cm | |
| Standard Deviation | 3.7 cm | |
| ISRIC SoilGrids | Minimum | 3.8 cm |
| Maximum | 11.3 cm | |
| Mean | 6.0 cm | |
| Standard Deviation | 0.9 cm | |
| Interpolated Field Data | Minimum | 3.3 cm |
| Maximum | 7.2 cm | |
| Mean | 4.6 cm | |
| Standard Deviation | 5.0 cm | |
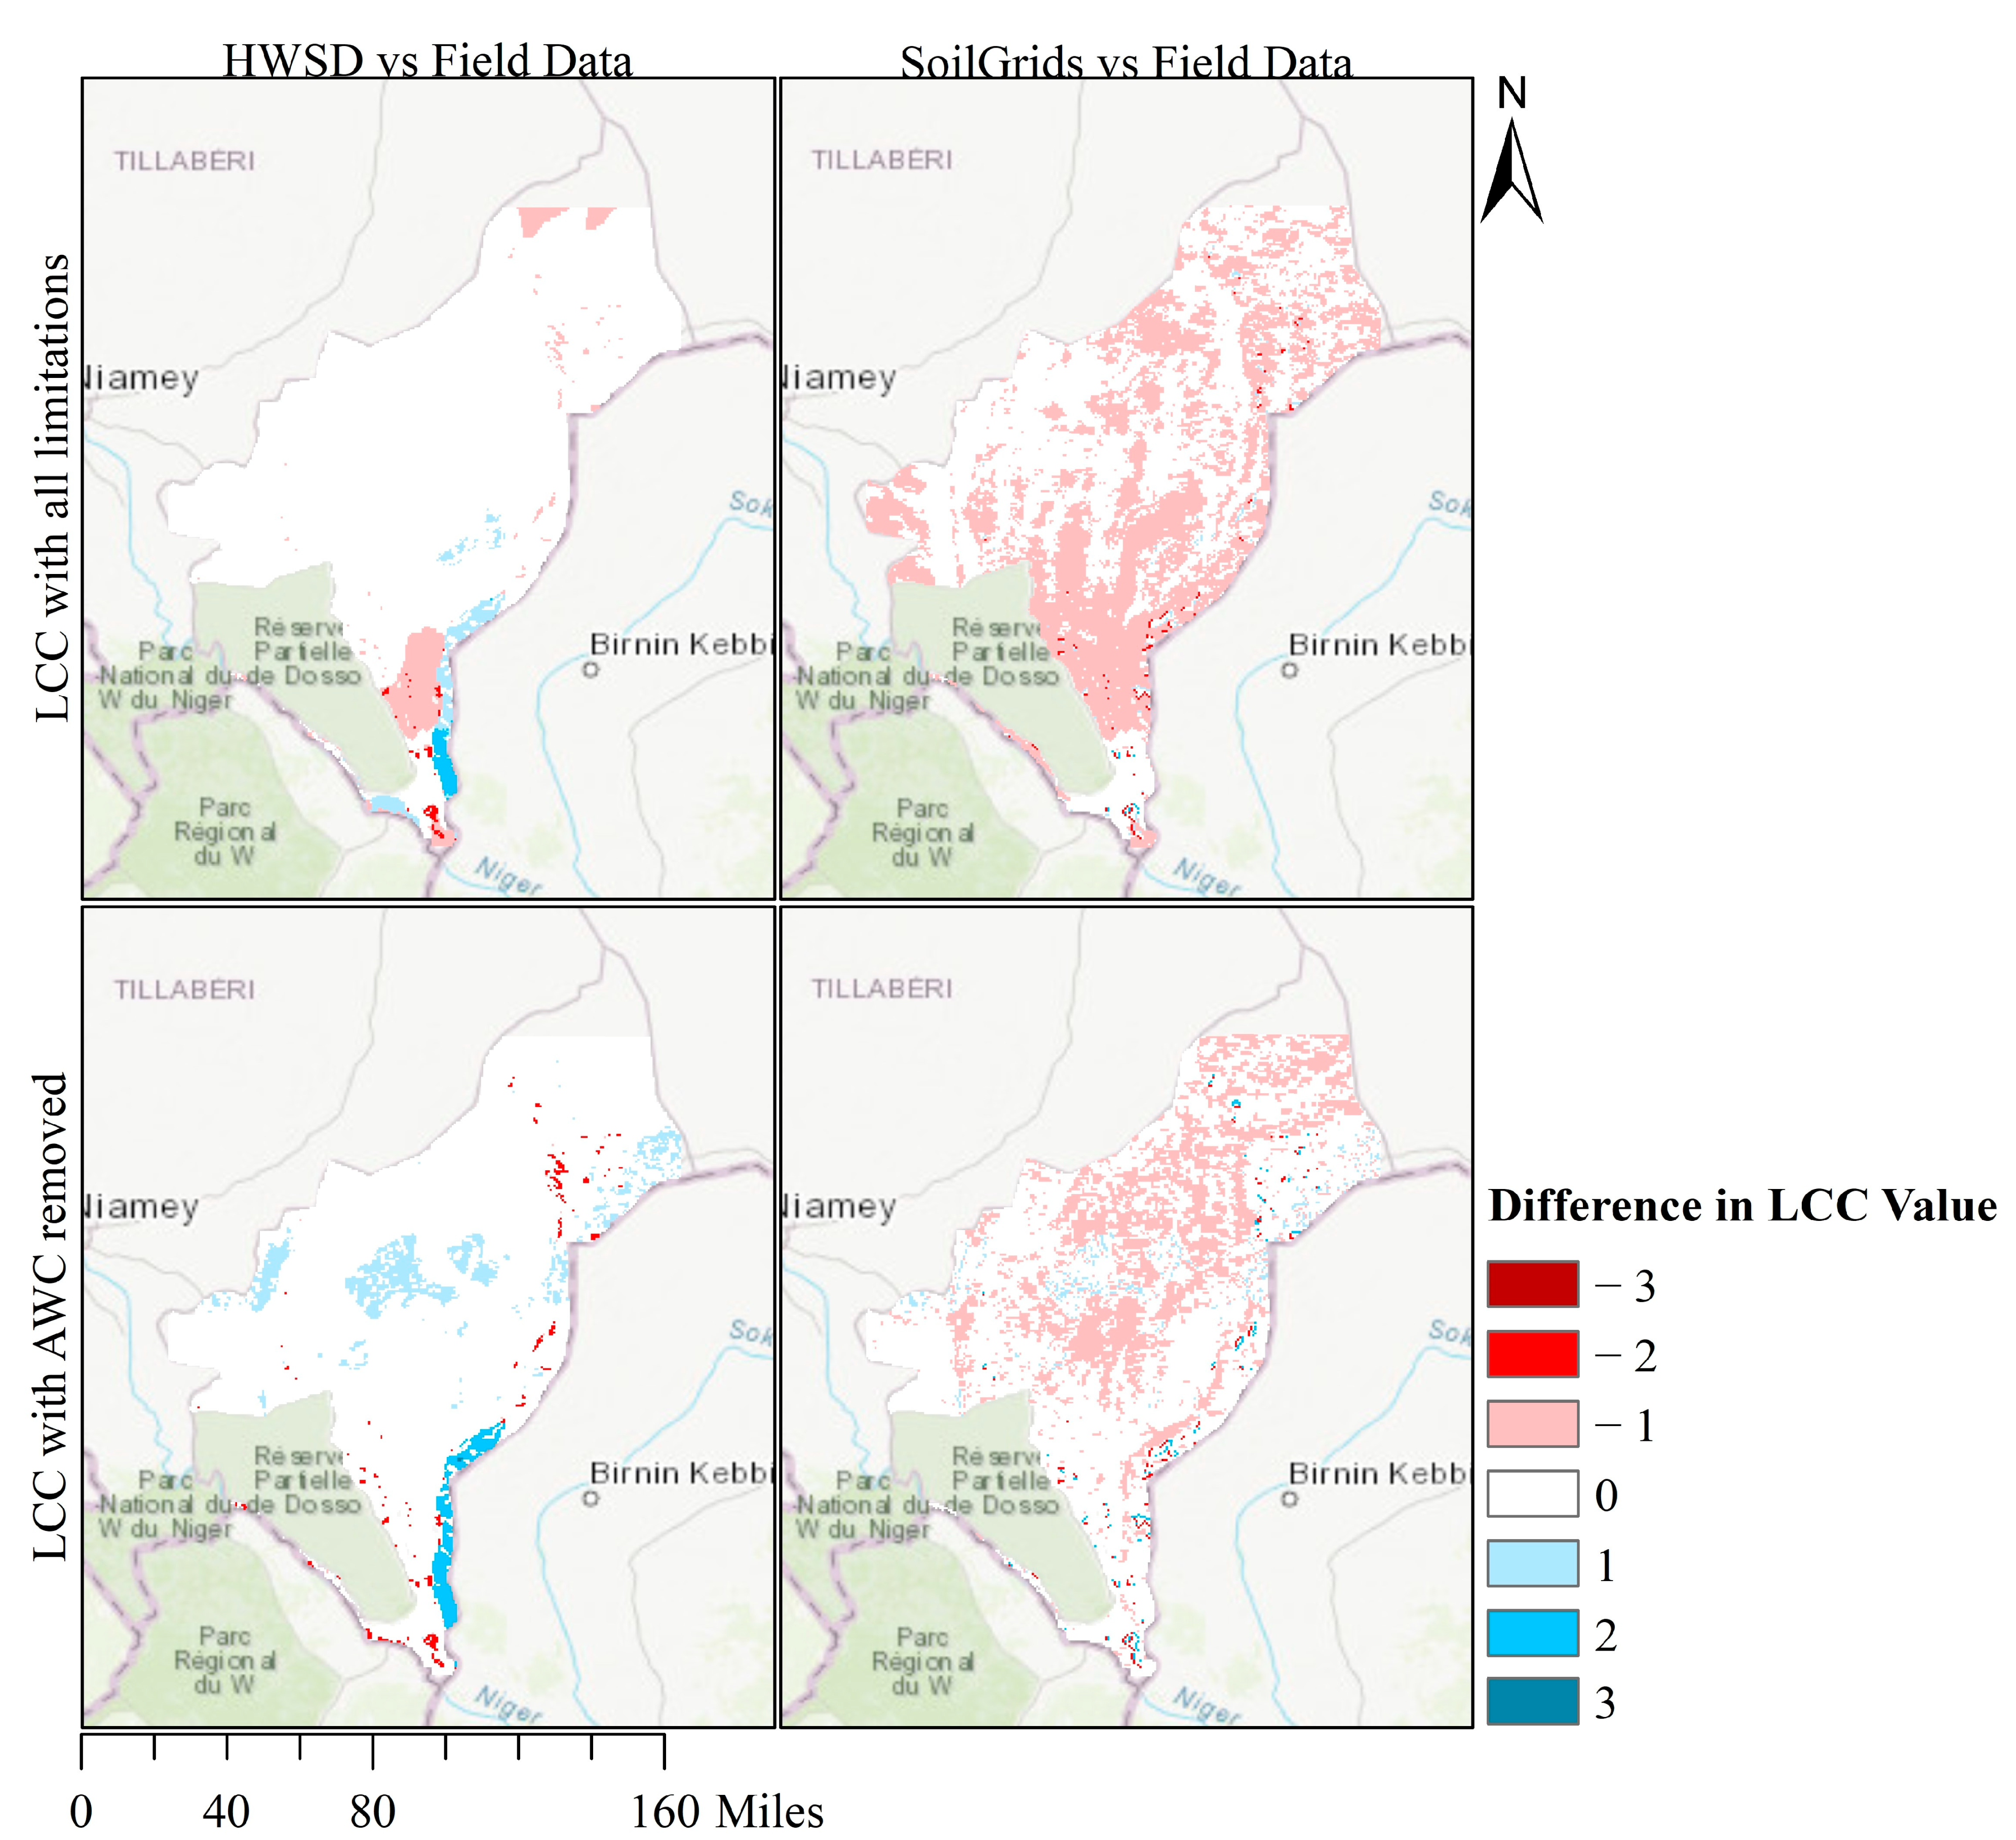
| Data Sets Compared | Correlation Coefficient |
|---|---|
| LCC with AWC as a limitation | |
| HWSD LCC and Field Data LCC with AWC | 0.16 |
| SoilGrids LCC and Field Data LCC with AWC | 0.30 |
| HWSD LCC and SoilGrids LCC with AWC | 0.090 |
| LCC without AWC as a limitation | |
| HWSD LCC and Field Data LCC | 0.30 |
| SoilGrids LCC and Field Data LCC | 0.47 |
| HWSD LCC and SoilGrids LCC | 0.25 |
| Nutrient | Unit of Measurement | Minimum | Maximum | Mean | Standard Deviation | Fertility Class Breakdowns |
|---|---|---|---|---|---|---|
| Phosphorus | mg P/kg soil | 2.93 | 7.70 | 4.75 | 0.71 | 5: [2.93–3.89] 4: [3.89–4.84] 3: [4.84–5.79] 2: [5.79–6.74] 1: [6.74–7.70] |
| Nitrogen | g N/100 g soil | 0.021 | 0.053 | 0.030 | 0.0044 | 5: [0.021–0.027] 4: [0.027–0.034] 3: [0.034–0.040] 2: [0.040–0.046] 1: [0.046–0.053] |
| Organic Carbon | g C/100 g soil | 0.23 | 0.74 | 0.35 | 0.070 | 5: [0.23–0.33] 4: [0.33–0.43] 3: [0.43–0.54] 2: [0.54–0.64] 1: [0.64–0.74] |
| Calcium | cmol/kg soil | 0.44 | 1.03 | 0.62 | 0.073 | 5: [0.44–0.56] 4: [0.56–0.67] 3: [0.67–0.79] 2: [0.79–0.91] 1: [0.91–1.03] |
Publisher’s Note: MDPI stays neutral with regard to jurisdictional claims in published maps and institutional affiliations. |
© 2021 by the authors. Licensee MDPI, Basel, Switzerland. This article is an open access article distributed under the terms and conditions of the Creative Commons Attribution (CC BY) license (https://creativecommons.org/licenses/by/4.0/).
Share and Cite
Ippolito, T.A.; Herrick, J.E.; Dossa, E.L.; Garba, M.; Ouattara, M.; Singh, U.; Stewart, Z.P.; Prasad, P.V.V.; Oumarou, I.A.; Neff, J.C. A Comparison of Approaches to Regional Land-Use Capability Analysis for Agricultural Land-Planning. Land 2021, 10, 458. https://0-doi-org.brum.beds.ac.uk/10.3390/land10050458
Ippolito TA, Herrick JE, Dossa EL, Garba M, Ouattara M, Singh U, Stewart ZP, Prasad PVV, Oumarou IA, Neff JC. A Comparison of Approaches to Regional Land-Use Capability Analysis for Agricultural Land-Planning. Land. 2021; 10(5):458. https://0-doi-org.brum.beds.ac.uk/10.3390/land10050458
Chicago/Turabian StyleIppolito, Tara A., Jeffrey E. Herrick, Ekwe L. Dossa, Maman Garba, Mamadou Ouattara, Upendra Singh, Zachary P. Stewart, P. V. Vara Prasad, Idrissa A. Oumarou, and Jason C. Neff. 2021. "A Comparison of Approaches to Regional Land-Use Capability Analysis for Agricultural Land-Planning" Land 10, no. 5: 458. https://0-doi-org.brum.beds.ac.uk/10.3390/land10050458