Article

Informed Geoheritage Conservation: Determinant Analysis Based on Bibliometric and Sustainability Indicators Using Ordination Techniques

School of Agriculture and Environment, Volcanic Risk Solutions, Turitea Campus, Massey University, Palmerston North 4442, New Zealand
*
Author to whom correspondence should be addressed.
Submission received: 19 March 2021 / Revised: 10 May 2021 / Accepted: 17 May 2021 / Published: 19 May 2021
(This article belongs to the Special Issue Geoparks as a Form of Tourism Space Management)

Abstract

:
Ordination methods are used in ecological multivariate statistics in order to reduce the number of dimensions and arrange individual variables along environmental variables. Geoheritage designation is a new challenge for conservation planning. Quantification of geoheritage to date is used explicitly for site selection, however, it also carries significant potential to be one of the indicators of sustainable development that is delivered through geosystem services. In order to achieve such a dominant position, geoheritage needs to be included in the business as usual model of conservation planning. Questions about the quantification process that have typically been addressed in geoheritage studies can be answered more directly by their relationships to world development indicators. We aim to relate the major informative geoheritage practices to underlying trends of successful geoheritage implementation through statistical analysis of countries with the highest trackable geoheritage interest. Correspondence analysis (CA) was used to obtain information on how certain indicators bundle together. Multiple correspondence analysis (MCA) was used to detect sets of factors to determine positive geoheritage conservation outcomes. The analysis resulted in ordination diagrams that visualize correlations among determinant variables translated to links between socio-economic background and geoheritage conservation outcomes. Indicators derived from geoheritage-related academic activity and world development metrics show a shift from significant Earth science output toward disciplines of strong international agreement such as tourism, sustainability and biodiversity. Identifying contributing factors to conservation-related decisions helps experts to tailor their proposals for required evidence-based quantification reports and reinforce the scientific significance of geoheritage.

1. Introduction

Determinant analysis [1] is a detailed examination of the factors affecting the course of geoheritage conservation and reviews the relationships among these factors. Bibliometric and sustainability are an interesting confluence of indicators as the basis of determinant analysis. The measurable aspects of environmental, economic and social sustainability assessed against the bibliometric productivity of researchers and the performance of their output provide informative linkages on what determines the objectives and direction of geoheritage conservation taking place around the globe [2,3,4,5,6,7,8,9,10]. Understanding these latent factors is key to optimizing subjectivity inherited in the assessments of the significance of natural features. In exploratory data analysis, the approach is to summarize the main characteristics of a data set. The statistical model we used was an unconstrained ordination method that is the most suitable operation for determining relationships. The model orders values so that similar variables are near each other and dissimilar variables are farther from each other [11].
Geological and geomorphological environments are extremely complicated. Most geoheritage practitioners aim to simplify the complexity and describe these environments through their most representative occurrences. The lithosphere is the interface between the inside and outside in the context of planetary systems. Geoheritage or any geological site is part of the Earth as a system and, placed into its global context, it provides the advantage of an educational and outreach tool [12]. However, the determinants or conditions of an environment where geoheritage features are successfully conveyed to the public are yet to be discovered. Determinant analysis is used to identify factors affecting the subject of interest and to review the linkages among the factors.
Geoheritage studies grow disconnected from other strongly related disciplines, which makes multi-dimensional decisions difficult. To date, the best practice is the compilation of a geoheritage inventory by Earth scientists [13,14,15,16,17,18,19]. This intellectual freedom breeds continual invention of novel and hybrid inventory methods [20,21,22,23,24,25,26]. Geoheritage assessment methods have a certain level of inherited subjectivity that is subject to optimization [27,28,29,30,31]. In cases where geoheritage exists in specific areas, such as a growing city, decisions on what value can be considered have to be made. Geoheritage value is not directly measurable, and, therefore, that inherently links unreliability to the evaluation. A robust analysis of the state of knowledge is a conventional tool to remove the subjectivity from evaluations and can ratify liability for management of geoheritage by authorities, organizations and landowners. Decision-making tasks involve finding optimum choices among alternatives, often under conditions of uncertainty. In effect, if the item is not certified parametrically, it cannot be considered as an alternative.
Statistical exploratory methods are established in other disciplines like ecology, biology, sociology and psychology [32,33,34,35]. Ordination is the collective term for multivariate techniques that are abundantly used in ecology that arrange sites along an axis on the basis of data on species composition [36]. Ecological systems are complex; one of the biggest challenges of the modern world is quantifying ecosystems as part of sustainability measurements. This challenge is very similar to that of geoheritage; in fact, geoheritage appears in the literature as “geosystem services” [37,38]. Ecosystems consist of many interacting biotic, abiotic and geoheritage components. Geoheritage outright encompasses an unusual range of interactions of abiotic, societal, economic and biotic factors that require a manual to be well understood.
The main need for quantitative procedures for examining vegetation as a continuum prompted the development of ordination techniques [39], years before geoheritage made its appearance in the scientific literature [40]. Ordination methods quickly made their way to other multi-disciplinary fields where stakeholder perspectives are the subject of research [41] and still the most adequate methods to find underlying structures, influencing factors and indicators [32].
When trying to get a comprehensive view on the content of scientific activity in order to inform stakeholders, the most traditional method is the analysis of scientific publications with the construction of performance indicators [42]. Bibliometric markers are a powerful tool for science policy makers. They monitor research and the assessment of the scientific contribution of authors as well as the tracking of knowledge evolution in research hotspots to inform science and public policy [43,44,45]. Bibliometric performance indicators combined with environmental indicators provide insight beyond scientific activity and imply sets of optimum conditions for the high scientific performance of a field [46,47]. Performance indicators can be defined and quantified during link analysis; link counts are used as indicators or measurements of the level of influence and performance of people, domains or nations. These “evaluative link analyses” are used to rank studies according to their influence [48].
The ability of metrics to represent complex information about research in an accessible format is overlooked not only in geoheritage, but also in other scientific fields [44]. Geoheritage studies draw attention to the shortcomings of the inherited subjectivity [49,50]. The heavily biased field is expected to reach the level of reliability required by decision makers after three decades of practice by the adaptation of proven instruments from other disciplines that tackled similar issues. A scoping study explored all approaches to geoheritage conservation as the first step in cleaning up the field and to comprehensively synthesize evidence [51]. Four concepts were identified by a meta-analysis of the literature. These approaches originate from the same maxim, however, they cover fairly different value systems [52,53,54,55,56]. The development of four different concepts suggests a stronger socio-economic influence on geoheritage conservation. While socio-economic background has its place in the frame of geoheritage, its uncontrolled influence will jeopardize core conservation intentions.
This critical study serves against considering geoheritage in abstraction from a socio-political perspective to intensify geoheritage conservation implementation in all agendas amidst rapid urbanization. Surveying the literature and collecting background data on experts created a robust database for further analysis of relationships to determine geoheritage determinants. The main goal of this research is to seek correlation among different types of world development indicators with bibliometric data on geoheritage in order to find those key factors. The research included three objectives to achieve its goals. The first objective was to recognize countries with elevated interest in geoheritage conservation through citation analysis. Next, the study involved looking for indicators of geoheritage interest and relevant socio-economic background. The final and main objective was to report the directions of geoheritage implementations and their determinants at global and local levels by tracking correlations among indicators.
The expected outcome of this study is the identification of the optimum conditions for geoheritage growth that serve the strengthening of geoheritage instruments for successful implementation.
The evolution of the field of geoheritage is best understood by its characterization and comparison at different scales. The research involved collecting data at a global scale and then narrowing them down to a case study of the Auckland Volcanic Field (New Zealand) in order to understand further challenges present at the local scale. New Zealand is a relatively new country (268,021 km2), geographically distant from the next inhabited land yet still globalized, as is reflected in the tripled amount of shares of trade, finance and migration in total among OECD countries (NZ member since 1973) in the past 20 years [57]. The country safeguards its indigenous values while participating in major international agreements. Conservation strategies are based on addressing global issues within the capacity of preserving the bicultural identity that refers to indigenous Māori and the polyethnic communities resulting from European migration [58]. The expansion of its biggest city occurs under the scope of sustainability on an actively researched monogenetic volcanic field [59,60]. The study area encompasses all the components of geoheritage and provides an unprecedented example for the world of an overarching approach to conservation.

2. Indicators at the Global Scale

Sustainable development meets the needs of the present without compromising the ability of future generations to meet their own needs [61,62]. Sustainable development has been successfully adopted worldwide and is gradually permeating all functions of national and provincial governments [63,64,65,66]. Sustainability is the new paradigm of development.
While the concept of sustainable development is derived from the Holdgate [61] report of the Brundtland Commission (World Commission on Environment and Development), it is due to come to a solution on rapidly increasing concerns of an alienated society from natural–geological environments and basic human nature [67,68,69].
Geoheritage conservationists have directed attention toward the overlooked intangible values of non-living features and their fundamental role towards achieving sustainability [55,70,71,72,73]. Therefore, sustainable development also means that any experience of the past handed over to the present is obtainable for future generations to the most accurate extent possible. In other words, landforms and geological features deemed to be significant to the geographical location must be secured for future generations to utilize them as educational tools for knowledge and understanding of basic characteristics of the site, hazards and simply the sense of cultural belonging.
The people who are the object of development must be addressed; those who have the right to preserve their cultural identity and their own community by eradicating poverty through a sustainable environment and political development. However, economic growth always brings the risk of environmental damage as it puts increased pressure on land resources. When policy makers are guided by the concept of sustainability, the development will not necessarily ensure that the ecological roots are nurtured [61]. The concept of geoheritage is to unite an inanimate environment and human societies to pursue resilience through recognition, seeding the ground for communities of coherence and holism. Outstanding landscape elements reduce the feeling of losing control and provide a powerful attraction for understanding the nature of geological processes, all whilst reframing market-based decision-making issues as possibilities for alternative ideas and agendas generated with new problem definitions, ambitions and solutions. Yet, there is no section specifically addressing these outstanding occurrences of geodiversity.
Sustainability also means resilience. Resilient communities understand their environment and potential hazards. Geoscience education through geoheritage is an explicit normative framework for achieving overarching understanding of hazard characteristics. The Sendai Framework for Disaster Risk Reduction 2015–2030 [74] is an instrument created by the United Nations that provides concrete actions for societies of Member States to build resilience of communities to disasters. The agreement outlines four priorities, the first of which is, “…the understanding of disaster risk in all its dimensions of vulnerability, capacity, exposure of persons and assets, hazard characteristics and the environment. Such knowledge can be used for risk assessment, prevention, mitigation, preparedness and response.” Urban areas are more vulnerable due to the high population density and geoheritage is more likely to have been destroyed in the development of urbanized areas. Geoheritage conservation and resilience building go hand in hand with sustainable urbanization, and should be particularly acknowledged in international agreements on hazard mitigation. This priceless knowledge is derived from important geological and geomorphological sites (geoheritage), through rigorous scientific methods. Their rapid loss through intensified landscaping undermines the capacity of accurate hazard forecasts.
New Urban Agenda was adopted as a global framework for achieving sustainable urbanization. The United Nation Human Settlement Programme (UN-Habitat) for human settlements and sustainable urban development envisioned the document as a guideline for urban development. The Agenda “supports science, research and innovation, including a focus on social, technological, digital and nature-based innovation, robust science-policy interfaces in urban and territorial planning and policy formulation and institutionalized mechanisms for sharing and exchanging information, knowledge and expertise, including the collection, analysis, standardization and dissemination of geographically based, community-collected, high-quality, timely and reliable data disaggregated by income, sex, age, race, ethnicity, migration status, disability, geographic location and other characteristics relevant in national, subnational and local contexts” [75]. Although the geoheritage principle completely fits into this description, there is no particular mention of the importance of protecting outstanding geological sites.

3. Indicators at a Local Scale: Auckland Volcanic Field

Rapid urbanization and housing problems are not the only priority areas of urban planners in Auckland, the metropolis built on the Auckland Volcanic Field. Biculturalism implies integrating indigenous streams, protect customs, values and spiritual lands. The first people to arrive in New Zealand were ancestors of the Māori and probably arrived from Polynesia between 1200 and 1300 AD and inhabited lands with perfect conditions such as the volcanic cones of Auckland. The first European settlers arrived in the nineteenth century and the modern urbanization took place during the twentieth century, quarrying away not only iconic volcanoes but also cultural belongings [76,77].
Māori people believed that they were related to the natural world—the earth, the birds, the trees. Many environmental phenomena are considered to be the ancestors of humankind, therefore, every aspect of existence shares an intimate relationship with people. At its root, this view of the world is the projection of human qualities onto the natural world (personification) [77]. Until contact with Europeans, Māori lived in rural areas. In current urbanized areas, they have lost contact with their original hapū (community) and iwi (tribe). In this way, urban youth could reconnect with the tribes of their ancestors [78]. Their value system and connectedness to ancestors and nature have to be included in all political systems and governmental functions, to be preserved for future generations.
Auckland is predicted to include up to 60 percent of New Zealand’s population growth over the next 30 years. The strategic plan for regional growth must meet the standards of international best practices in an effectively integrated spatial planning system. In order to achieve successful geoheritage conservation within the Auckland area, the policy framework must fit into this strategic direction of integrated spatial planning, and must also be drawn from both indigenous identity and international best practices. Strengthening existing linkages between spatial planning and geoheritage is essential for the integration, otherwise competing policy goals such as conservation and opportunity costs could potentially dominate geoheritage efforts [79].
In New Zealand, the term “outstanding natural features” is used to refer to geoheritage, as it appears in the Resource Management Act [80] (RMA). The Act is the blueprint that every related function of national, regional and local governments is based upon in alignment with corresponding international obligations.
In essence, the compilation of the Geopreservation Inventory was carried out under the principles of RMA and its coastal management regime, the New Zealand Coastal Policy Statement [81] (NZCPS). The purpose of the NZCPS is to state policies in order to achieve the purpose of RMA. Policy 1.1.3. (a) is a national priority to protect significant representative examples of each landform which provide variety in each region, visually or scientifically significant geological features and (b) characteristics of special spiritual, historical or cultural significance to Māori.
The Auckland Council today faces the challenge of prioritizing geopreservation action over economic growth. The Inventory highlights all the landforms and geological sites the scientific community has deemed important. However, present decision making has gone through scientific development and resulted in complex spatial planning systems to calculate precise areas of interest. The increasing demand upon land surface forced the production of evidence-based assessment on the value of geographic areas of significant landforms and outstanding features. Satisfying the principles of geoheritage conservation with relevance to indigenous values while sustaining economic growth became an advanced task in the metropolitan area of Auckland. Elaborately designed geopreservation assessment tools are hence indispensable and must start with an analysis of the key factors that dominate geoheritage conservation all around the globe.

4. Methods

This research resulted in the compilation of a report (Figure 1) on the determinants of increased geoheritage activity. Three data types were collected: citing articles and academic output; geographic data on protected areas and geoparks; and world development indicators. Information on the scientific orientation and dynamism of a country and on the impact on both the national and international community serves as a tool for describing emerging theories, methods, orientations and conservation outlooks [82].

4.1. Indicators

Our approach to measuring this performance and extract determinants in high-achieving countries started with the analysis of research metrics. A proven practice for such analysis is the use of online databases of scientific publications such as Web of Science and Scopus [82,83,84,85]. Author metrics were extracted from Scopus [86] and citing articles were extracted from Web of Science [87] through research impact metrics tools of these online databases. The authors of this study considered the major advocates within the scientific discourse on achieving global agreement on the quantification criteria of geoheritage or geodiversity [51]. The search was conducted with the authors’ names in the full databases of Scopus and Web of Science with no minimum time period until 2020. We built two databases, one on the authors’ backgrounds and H-indices extracted from Scopus and another on the origin countries and scientific backgrounds of the citing documents collected from Web of Science. During the summarizing period, the citing countries entailed two criteria of inclusion: to cite at least one of the works of the 47 selected authors and to have at least 15 documents citing one or more of the selected authors. These countries are the entities of the indicators in our determinant analysis.
To explore patterns between countries’ scientific productivity compared to their geoheritage performance, we extracted data that were based on publications from the SCImago Journal & Country Rank that develops scientific indicators for journals and countries from the Scopus database. The ranking site is useful for analyzing and comparing scientific domains [88]. Earth science output and geoheritage interest made up the academic indicators in our determinant analysis.
Biodiversity conservation is strongly associated with geodiversity conservation, therefore, World Protected Areas were chosen as one of the two geographic indicators [89]. The percentage of protected areas was calculated in ArcGIS software. The year of extraction was 2018 and the final data are expressed in percentages of the total land of the country. The data were retrieved from data.worldbank.com based on a world database on protected areas for which the compilation and the management were carried out by the United Nations (Environment World Conservation Monitoring Centre), available for download through the Protected Planet website: protectedplanet.net. The World Database on Protected Areas is the most comprehensive global dataset of areas registered under the IUCN Protected Area Categories I-IV including national parks, wilderness areas, community conserved areas, nature reserves, marine reserves, etc. The count of geoparks of each country and the year of UNESCO Geopark designation were extracted from the website: http://www.unesco.org/new/en/natural-sciences/environment/earth-sciences/unesco-global-geoparks (accessed on 1 October 2020). The number of geoparks, the major measurable manifestation of geoheritage conservation, was added as the second geographic indicator in our research of geoheritage determinants.
Databases on countries’ performance in other functions of society provide tools to discover, compare, predict and attack inequality in the world. World Bank Group, an international organization affiliated with the United Nations, offers a tool for measuring sustainable development through the measurement of the wealth of nations [90]. The country-level community well-being indicators are drawn from the publicly available World Bank Development Indicators. Eight variables are included as indicators of country development: population, urban population, urban population growth, urban land, total land, population density and international tourism receipts. The countries identified through Web of Science as having elevated interest in the scientific communication of geoheritage were compiled into an “interest group” to obtain data of our chosen world development indicators.
Worldbank.com provided an incomplete dataset on the urban landcover. To recover missing data for Austria, Czech Republic, Hungary, Serbia and Slovakia, we used the online database of the European Environment Agency (https://www.eea.europa.eu/data-and-maps, accessed on 19 May 2021) stored as “Artificial Surfaces” of which calculation was based on data of the Copernicus Land Monitoring Service–Corine Land Cover (www.land.copernicus.eu, accessed on 19 May 2021) from 2012–2018. These data are more recent than those of world.bank.com from 2010. However, for the sake of our study on finding influencing factors of geoheritage decisions, the level of inaccuracy caused is statistically insignificant for the final result. This is due to the low land cover of urban and other artificial developments in the 39 European countries, which amounted to 0.1% over the period of 2006–2012 [91]. This rate slowed down even more for the period of 2012–2018, taking up 200 km2 less land per year in all European countries [92].
At present, more than half of the world’s people are living in cities, and that proportion is predicted to expand to about two thirds of the world’s population by 2050 [93]. As the process of urbanization keeps growing, it is crucial to measure and monitor the change to move toward sustainability. The indicators allow planning to move in line with new global targets of sustainability by pinpointing present conditions relative to conditions that have prevailed in the past. These tools are very important to influence all sectors, from energy, land use and social well-being policy making to biodiversity and geoheritage conservation strategy setting.
We developed indices from the publicly available World Bank data to increase insightful indicators. We added three indices: the number of international arrivals per 1000 people, tourist density and trade openness, each explained below.
The arrival number is an index of international arrivals per 1000 people of the country’s population. The index expresses the capacity of tourists to enhance communities’ economic well-being. If the number of arrivals is small in comparison to the host population, then a smaller number of individuals or communities can benefit from tourism. It is more likely to have a significant impact on micro, small and medium enterprises when the number of annual arrivals is relatively large. For the sake of analyzing influencing factors in geoheritage designation, we use 60% of the given local population as a margin to judge the number of visitors as large or small.
The tourist density index is developed to perceive the country’s capacity to distribute tourists. A larger number of tourists concentrated in small geographic areas induces pressure on authorities to enact policies and direct their movement to designated areas. Hence, these authorities are likely to have an interest in promoting geological sites. Based on the data for the studied countries, we established the threshold at 120. Equation: Annual international arrivals/Population * 1000/Total land.
Trade openness and quality of economic growth have a long-term stable co-integration relationship, as a case study showed in China [94]. Another study showed a positive long-term relationship between trade openness and economic growth [95]. The question is whether there is an influence on developing geoheritage conservation by the level of international trade. It is said that international trade lowers barriers toward faster economic progress. Indirectly, international trade openness contributes to a natural increase in international tourism flow. Hence, the importance of analyzing trade openness and whether it is an important influencing factor in geoheritage development. Transnational tourism helps communities to restore their well-being. Studies confirm that changes to the countryside have coincided with growth in tourism and recreational needs and activities in rural areas [96]. Communities, however, exist in cities and based on the explored dynamics of ecotourism, urban geoheritage can direct tourism development in all geographical areas toward a balance between community-driven and operator-driven tourism.
Policy changes have also led to an increase in ecotourism by opening previously restricted areas and increased opportunities for funding for environmental programs [96]

4.2. Correlation Matrix

The indicators showed very different data types. It is important in statistical analysis to unify the data types. Our scaling option was interval scaling. The reliability of the set intervals was validated by the calculation of Cronbach’s alpha. In quantification theory, the general internal consistency and reliability play an important role in interpreting multiple-choice-like data [97]. Cronbach’s alpha, indicated by α, attains a maximum of 1 when all variables are perfectly correlated with the total score. In other words, the score reflects that the reliability is the degree to which the instrument is free from random error. To date, it can only measure the internal consistency through correlations among test items. Introducing such practices leads to the ability to measure reproducibility, that is, the stability over time or the consistency of scores across raters at a point in time. To calculate correlation, we used Spearman’s rank correlation (ρ), because it creates a new variable in order to rank the result and is proved to be the most robust with outliers.

4.3. Correspondence Analysis (CA)

We use exploratory data analysis techniques to identify any systematic relations between variables. Correspondence analysis (CA) is an unconstrained ordination method that orders individuals characterized by categorical values of multiple variables. CA works on categorical datasets that have been divided into categories and is a powerful tool for finding patterns in large datasets [98]. This multivariate method is used for almost any data matrix with non-negative entries and principally involves tables of frequencies of counts and analyzes data without explanatory variables [33]. A particularly powerful technique is to group our indicators in the reduced dimensional spaces to present the key insights on relationships. Ordination orders the individuals so that ones with similar profiles are near each other and dissimilar objects are farther from each other. It simplifies complex data and provides an exhaustive analysis of the data [99]. The technique is appropriate for discrete variates. It is often considered as a simple scaling method and is widely used by plant ecologists. Floristic data to which gradient analysis is applicable consist of occurrences of a number of species at a numerous sites where certain species prefer certain types of habitat and therefore can become indicators [35]. The first stage for such gradient analysis is to scale along a known gradient, for example, a country with a score of 1 may be small in area, a score of 5 may be very large and a score of 3 may be medium. In the interpretation of such data, a geometric approach has the most benefits. The rows and columns are assumed to be points in a high-dimensional Euclidean space redefined so that the principal dimensions capture the most variance possible, allowing for lower-dimensional descriptions of the data [33].

4.4. Multiple Correspondence Analysis (MCA)

While CA showed the relation between variables, multiple correspondence analysis (MCA) analyses relationships within a set of variables and the interrelationships between the statements or categories of variables. MCA is the central analytical tool to embed qualitative data. MCA was applied to detect and represent underlying structures in our dataset to investigate influencing factors for geoheritage designation. Therefore, this analysis can explore whether there is an association between a “high number of geoheritage-related citations” and a “high number of international arrivals”. CA can only tell us whether all the categories of the same variable have a statistically significant correlation with any other variable. This method tackles the more general problem of associations among a set of more than two categorical variables [34]. This unconstrained geometric approach is directly linked to data visualization.

5. Results

5.1. Individual Author Metrics

A previous study presented a robust instrument that leveraged the power of a meta-analysis of the scientific literature in the form of scope review [51]. It pinpointed the most influencing articles (no. = 70), produced by 47 individual authors, that channeled the discipline of geoheritage into four characteristic leading concepts. These concepts are: (i) Observing the changes to complex Earth systems (geosystems); (ii) dealing with geodiversity that can be considered the stage upon which biodiversity acts; (iii) focusing on social interactions of geotourism and support networks of geoparks; (iv) studying the connection of geosystems to communities, ethics and traditions and transnational policies and cultural interconnectedness. Breaking down geoheritage discourse into its elements is crucial for quality implementation. With the understanding of the state of geoheritage, it is possible to take single or dashboard indicators to guide and facilitate decision making [100].
Scopus offers author metrics to show researchers’ performance. We were interested to find out what scientific backgrounds the influence of the 47 authors were coming from and where the highest measurable impact of their research could be found. We first looked at their H-indices that indicate their citation influence and indicates the most influential conceptual orientation. For the research, we took a pool of 47 authors that were identified as the leading characters in geoheritage conceptual evolution. Figure 2 shows the scientific fields these authors are experts in. The main area is Earth and planetary sciences at ~31%, followed by environmental science with ~24% and social sciences with ~16%. Agricultural and biological sciences (10.61%) and business and economics (8.11%) appear with a fair share, revealing the multidisciplinary nature and permeability between areas of geoheritage research. The leading area is Earth science, which is evidence for the core scientific nature of geoheritage conservation. The citation overview of the authors in question (Figure 3) presents consistent growth from the late 1990s when two of the very popular concepts on geosites and geomorphosites were published by Wimbledon [101] and Panizza [102]. This period represents a milestone for development, and the works published in the early 2000s add a fundamental contribution to conceptualizing geoheritage, creating a strong pattern still present today.
Hirsch [103] proposed the H-index, defined as the number of papers with citation number ≥ h, as a useful index to characterize the scientific output of a researcher and quantify the cumulative impact. We organized the authors according to their affiliations and assigned H-indices (Table 1) to their countries. This index shows us the countries providing contributions to geoheritage conservation. The highest impacts in the field are derived from the United Kingdom, United States, Australia, Italy, Spain and Poland. We kept this data as control data to validate our results on geoheritage interest, one of the academic indicators of our study.

5.2. Citing Articles

We hypothesize is that the analysis of the background of the received citations reflects the interest in geoheritage. To collect these data, we used the online database that provides research impact metrics, Web of Science (WoS). We broke down each author’s received citations per citing country and the main scientific areas of the publications’ generated citations by our chosen authors for geoheritage.
The analysis of given cumulative citations produced a list of 54 countries that were the subjects of our further data collection processes. The countries with the largest amounts of citing articles of geoheritage conservation-related works formed the entities used to derive underlying trends. Figure 4 compares these countries’ rankings in terms of their scientific output, respectively, in all scientific fields, in earth sciences and for citing geoheritage authors. The rank in each column is based on the total number of articles published in 2018. We were interested to see if we could identify a linear relationship between Earth science and geoheritage research.
The United States and China are the most fruitful publishers of science research. Studies found that the correlation of resources producing more output moves beyond the obvious assumption but, in fact, bibliometric output increases more than is proportional with revenues [104], the trend of which is clearly identified in geoheritage research.
Figure 4 suggests that increased Earth science research within a country does not necessarily increase geoheritage publications. Earth scientists should be encouraged to translate their findings and their specific knowledge to geotourism education material and nominate outstanding outcrops of their study area for geoheritage evaluation. There is a tendency for authors to reserve a special place in their articles to cite their fellow scientists from shared cultural backgrounds. In comparison with the authors’ H-index analysis, the highest impact countries are ranked in terms of geoheritage interest. The United States and the United Kingdom did not change position compared to the rank columns for Earth sciences and all scientific disciplines. Australia, on the contrary, jumped over six countries and ranked in 3rd place in geoheritage interest without showing any increased interest in Earth sciences compared to all sciences. Spain and Italy showed a very similar trend.
In terms of Web of Science background field categories, Environmental sciences produced the largest numbers of citations, with geology in second place. By grouping the citing counts according to the authors from whom concepts were derived, we could gain insight into further trends in geoheritage conservation. Ratio normalized counts (Figure 5) uncovered special interests within concepts. Certain fields such as remote sensing and anthropology show an increased interest in concept 1, characterized by Earth science compared to the other concepts. Zoology and biodiversity conservation are rather interested in concept 2, the joint evaluation of biodiversity and geodiversity. Social sciences and health care sciences cited authors dealing with concept 3 on geotourism. Sustainability, as concept 4, was the biggest interest of the fields of fisheries, urban studies and development studies, validating our interpretation of sustainability.
The last part of the analysis of the citing articles divided countries per their leading choice of concept (Figure 6). The value was the result of the highest normalized counts of citations generated by the given country for the four different concepts. The first three countries, the United States, United Kingdom and Australia, in the geoheritage interest ranking had cited authors publishing on the relationships between geodiversity and biodiversity. Although the number one interest is geodiversity, the following interests for these leading countries are very different; while in the United Kingdom, Earth sciences is next, in the United States and Australia it is sustainability. China’s biggest interest is in geotourism with geodiversity in last place and, on the contrary, Canada has sustainability in first place and geotourism comes last. Italy, Spain and Portugal appear with the exact same interest pattern: geotourism in first place, with Earth sciences right after and sustainability coming last. This pattern suggests a special acknowledgement of educating geotourists.
The most obvious assumption would be that the type of interest in geoheritage is driven by the size and the societal demand of the country. To understand how certain countries’ preferences are formed in geoheritage or geodiversity conservation, we introduced further indicators to the study to be able to derive evidence-based conclusions on the major drivers in geoheritage interests.
Single indicators provide simple methods for interpretation, encompassing less subjectivity and bias and other synthesis errors inherent in composite indices [100,105]. However, single indicators are only suitable for the measurement of unidimensional issues.

5.3. Indicators

International agreements are based on a convention that countries commit to and they create a framework aligned with their socio-economic background. International committees are established to monitor and ensure these changes are taking place. Thus far, geoheritage conservation does not have a standard measurement tool.
Despite the complexity of geoheritage conservation, the starting point in evaluating features is always the scientific knowledge derived from it. Unfortunately, geographic areas that are distant from scientific hotspots (scientific hotspots are understood here as regions where persistent Earth science research is performed over prolonged periods of time and is of global interest) or different from current scientific interest (areas which were the focal point of Earth science studies in the past, but today are considered as areas where there is “nothing left” to research) will be less likely to be listed in any geoheritage inventory. The intensity of scientific research depends on the governing regime and the level of support science institutions receive. Scientific output can be a great indicator in the geoheritage measurement tool once the number of sites is listed and released in a global database. It could be interesting to see whether a rise in a certain field in a given country increases the number of listed geoheritage sites. In this study, we analyze the country performance in citing geoheritage works against Earth science publications. The indicator in our case could be the outperforming production of geoheritage documents in relation to the output of Earth science documents.
In 2004, Europe and China launched a geopark program to kickstart the publicization of geoheritage conservation [106]. Geoparks (Figure 7) have proved to be successful in contributing to sustainable development goals by revolutionizing tourism, promoting local tourism businesses and ensuring the protection of important geological sites and landscapes [107,108]. Hence, UNESCO put it on its agenda opening new opportunities for propagation. The number and reputation of geoparks increased rapidly and today can be used as an indicator for geoheritage conservation measurement.
In addressing subjectivity in geoheritage evaluation, we have absolutely no tool to measure and compare the effectiveness of geoheritage conservation. The lack of geoheritage conservation policies means successful geoheritage conservation at the site level would most likely take place within already protected areas. However, there is no database on the number of geoheritage sites preserved and promoted over the years within protected areas.
The two maps show an interesting contrast. Countries with the largest number of geoparks appear to have a lower percentage of protected areas.
Visitation, when not as a form of business, will contribute to the tourism sector. Whether geopark, geoheritage site or geomorphologic landscape, the economic aspect is always part of the equation. The teaching Earth science through experience and recreation cannot take place without the visitation of the site. Visitations affect the economy and, if regulated, they increase local development. Basic world development indicators (Table 2) can therefore unearth the optimal socio-economic conditions that motivate decision makers to pursue geoheritage conservation. Such economic effects can be ensured in rural areas, as in urban areas, conservation often leads to opportunity loss.
To validate the data, we used Cronbach’s coefficient α (Figure 8) to calculate the internal consistency of the scaling. The overall scaling reliability of the gradient values was robust at α = 0.83 [109]. Correlation coefficients did not highlight one outstanding relationship that would connect academic, geographic and world development indicators, therefore, we continued the analysis, looking for bundles that indicate determinants in geoheritage conservation.

5.4. Correspondence Analysis (CA)

Several functions are available in R software for computing CA; we used the packages “FactoMineR” and “Factoshiny”. The inertia of the first dimensions suggests that there are strong relationships between variables and suggests the first 3 dimensions to be studied. The first three dimensions of the analysis express 68.46% of the total dataset. By the plane of the first two dimensions, 56% of the total variability is explained. Due to the relatively large number of variables, the variability of the discarded dimensions cannot reveal reliable relationships representing the noise due to the heterogenous construct of the data.
Figure 9 presents the indicator profiles representing the proportions belonging to each country category (Table 3). In the first dimension, we have a bundle of population variables: Total land, Population and Urban population growth, and one bundle for tourism industry-related variables: Trade openness, Tourist arrivals, Urban land and Tourist density. In this dimension, Geoheritage citations and Number of geoparks remained closely linked and presented an association with the bundle of population variables rather than the tourism industry variables.
In the second dimension, we can observe the bundle of geoheritage variables (Table 4): Geoheritage citations, Documents of Earth science, Number of geoparks and, interestingly, joined variables of Urban land. This dimension also joined the variable of International tourism receipts to the tourism industry bundle.
In the third dimension, Geoheritage citations was significantly associated with Urban population and Tourist arrivals. Additionally, Population density and Urban land gained ground in the population bundle.

5.5. Multiple Correspondence Analysis (MCA)

Categories were not made for Urban land and GDP as they did not show statistical significance with any of the indicator bundles. The categories were assigned to the indicators based on the known gradient scaled values from CA computation and, to express the lower and higher range of the spectrum, the scores were split at the medium scale and assigned to categories (Table 5) accordingly unless the value range of the indicator required three categories, in which the medium scale was kept.
The individual factor map (Figure 10) shows the repartition of the countries in the multifactorial analysis plane. Countries are colored according to bibliometric data of concepts. The Wilks’ test p-value indicates that the “concept” factors are the best separated on the plane, best explaining the distance between individuals. A confidence ellipsis is shown around the categories for all the qualitative variables used. Apart from concepts, none of the development descriptors used in this study could distinguish the countries.
The first three dimensions of analysis express 51.9 % of the total variance. The inertia by the 0.95 quantile of random distributions is less, which suggests that only these three dimensions carry real information (Table 6). Accordingly, the description stands for these axes. The Cronbach’s alpha of 0.45 is low but acceptable in exploratory data analysis. It suggests a poor interrelatedness between items. The variation arises from the sampling of indicators [94]. During the construction of the dataset, the aim was to compare measurements taken from different disciplines to explore any potential relationship, and to investigate major drivers behind enhanced geoheritage activities. Geoheritage is a relatively new discipline that has not gained ground among scientific and economic disciplines. It has only recently started appearing on the policy-making agenda.
Based on the graphical depiction of the indicator categories (Figure 11), we were able to identify three opposing trends, six in total.
In dimension 1, the first result shows that an open market, large number of arrivals, concentrated tourism and small total land area have a strong relationship and are associated with “Yes” for geopark, higher population density, >15% protected area and large tourism share. The concept of Earth science (Table 7) was ordered according to these categories.
The opposing result in this dimension, “No” for geopark, sparsely populated countries, scattered tourism, smaller number of arrivals, closed market and large land area show a significant relationship and are associated with small tourism share, prominent urban population growth and <15% protected areas. The concept of geodiversity was ordered according to these categories.
In dimension 2, there is a strong link between the categories of rural population, large tourism share, less significant Earth science output and few geoheritage citations, associated with negative urban population growth and small land area.
On the opposite side, we found stronger relationships among many geoheritage citations and significant Earth science output, associated with small tourism share, urban population, medium land and negligible urban population growth. The concept of sustainability was ordered according to these categories.
In dimension 3, relationships between the rural population, negative urban growth, “Yes” for geopark, >15 protected areas, smaller number of arrivals and medium land area showed a trend, but less than that revealed by the first two axes. The concept of geotourism was ordered according to these categories. On the opposite side, a relationship was found among high population density, “No” for geopark, urban population, a large number of arrivals, <15 protected areas and small land area.

6. Discussion

6.1. Determinant Analysis at the Global Scale

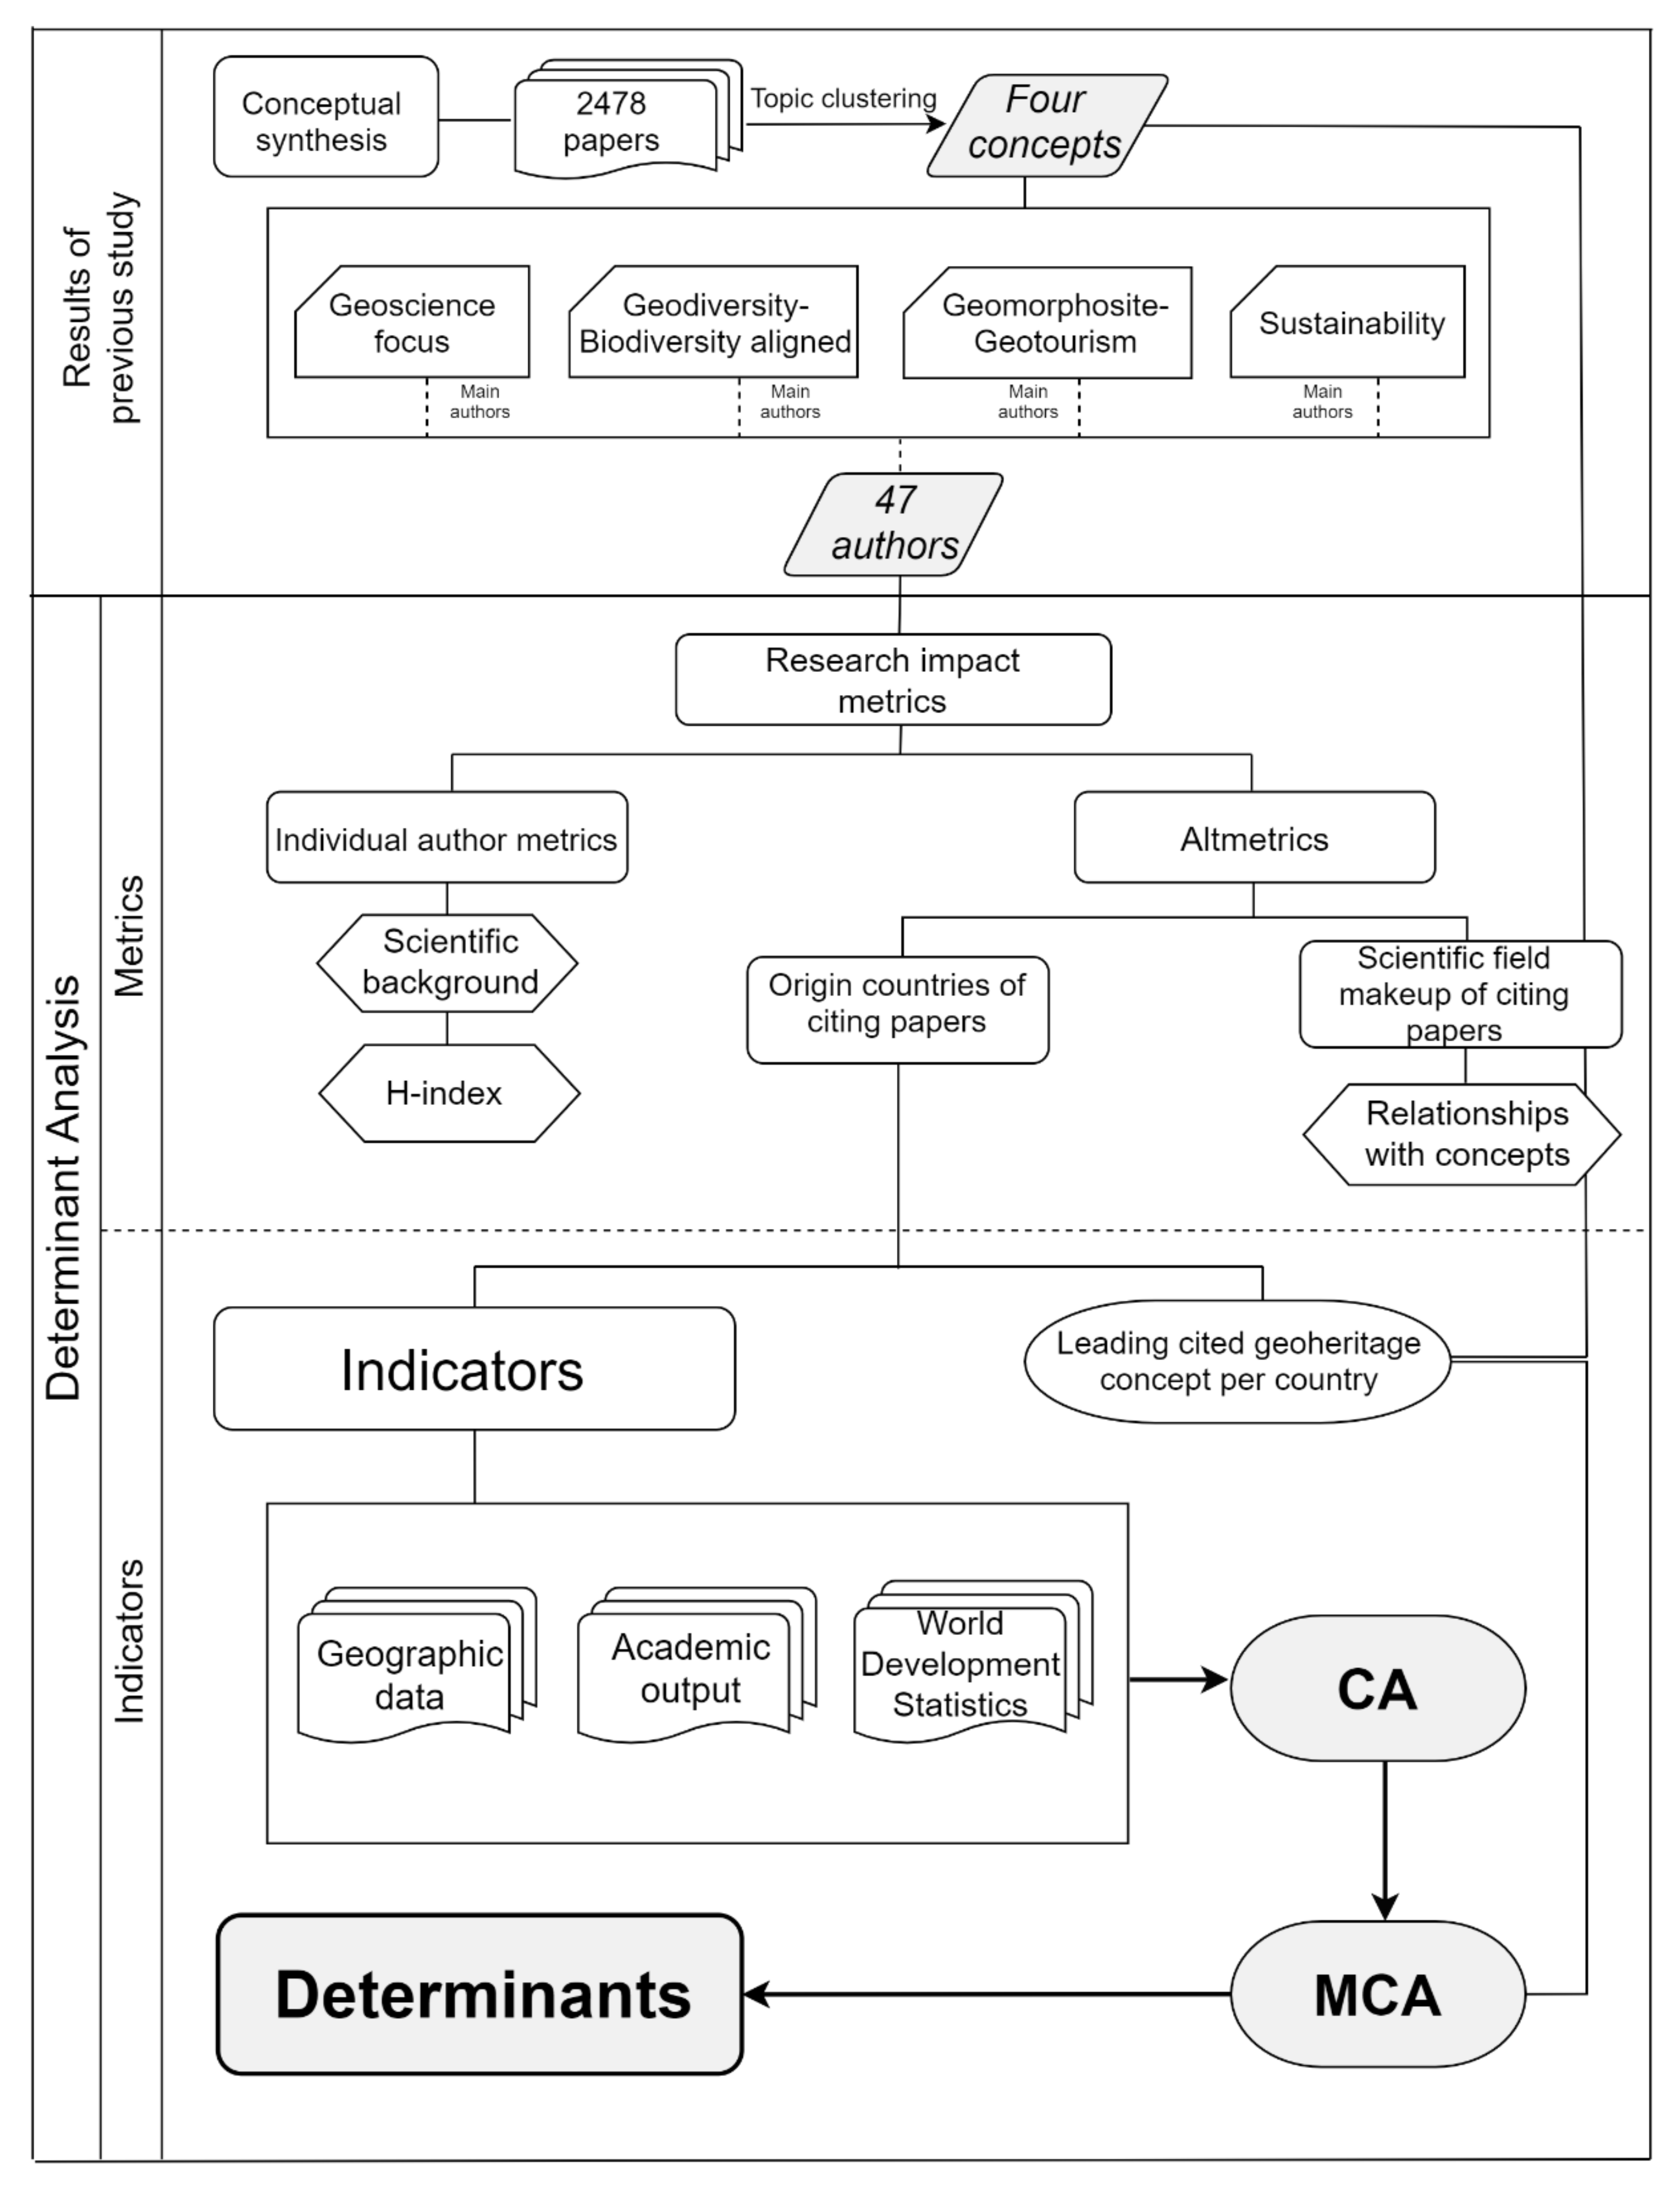
Quality implementation requires reliability and credibility. Longstanding activities, or a pressing issue, will determine decision outcomes until these two factors are not present. Geoheritage as a scientific discipline embraces a bottom-up approach and lack of need for developing regulatory policies. Consequently, the conceptual background can be shaped to make implementation happen in receptive areas rather than in rapid geoheritage loss areas to avoid the difficulties that specific adaptation imply. The geoheritage concept continues to gain popularity, with communities recognizing the value of their natural features. Year by year, new geoparks appear in the network, involving an increasing number of a wide variety of scientists in the program. Global activities achieved a level that allows us to investigate what determines this evolution. The question is what indicators can uncover such determinants. The primary purpose of the United Nations is to solve international problems, creating numerous bodies to work towards goals solving these problems. The Sustainable Development Goals were launched in 2015 and became a core framework of national strategies. The Commission on Sustainable Development defined 14 indicator themes: poverty; governance; health; education; demographics; natural hazards; atmosphere; land; oceans, seas and coasts; freshwater, biodiversity; economic development; global partnership; consumption and production patterns. We chose the closest themes to geoheritage as indicators for our research. These are land, biodiversity, economic development and global partnership. Each country that adopted the Agenda 21 plan and Rio Declaration on Environment and Development committed themselves to working towards sustainable development and should work towards adopting the highest standards for geoheritage conservation.
The limitation of a procedure based on scientific literature and research metrics is that it cannot use unpublished material, technical reports or gray literature (e.g., literature appearing in magazines not listed on Web of Science or Scopus or any major global science database). The survey has also not included scientific outputs published in non-English languages. We acknowledge that geoheritage conservation initiatives often take place in non-academic environments. The countries in our study are not the target subjects, they were the chosen as test subjects through a replicable procedure. With the help of these countries’ publicly available statistical data, trends in global practices can be extracted and used to understand how New Zealand measures up to international practices.
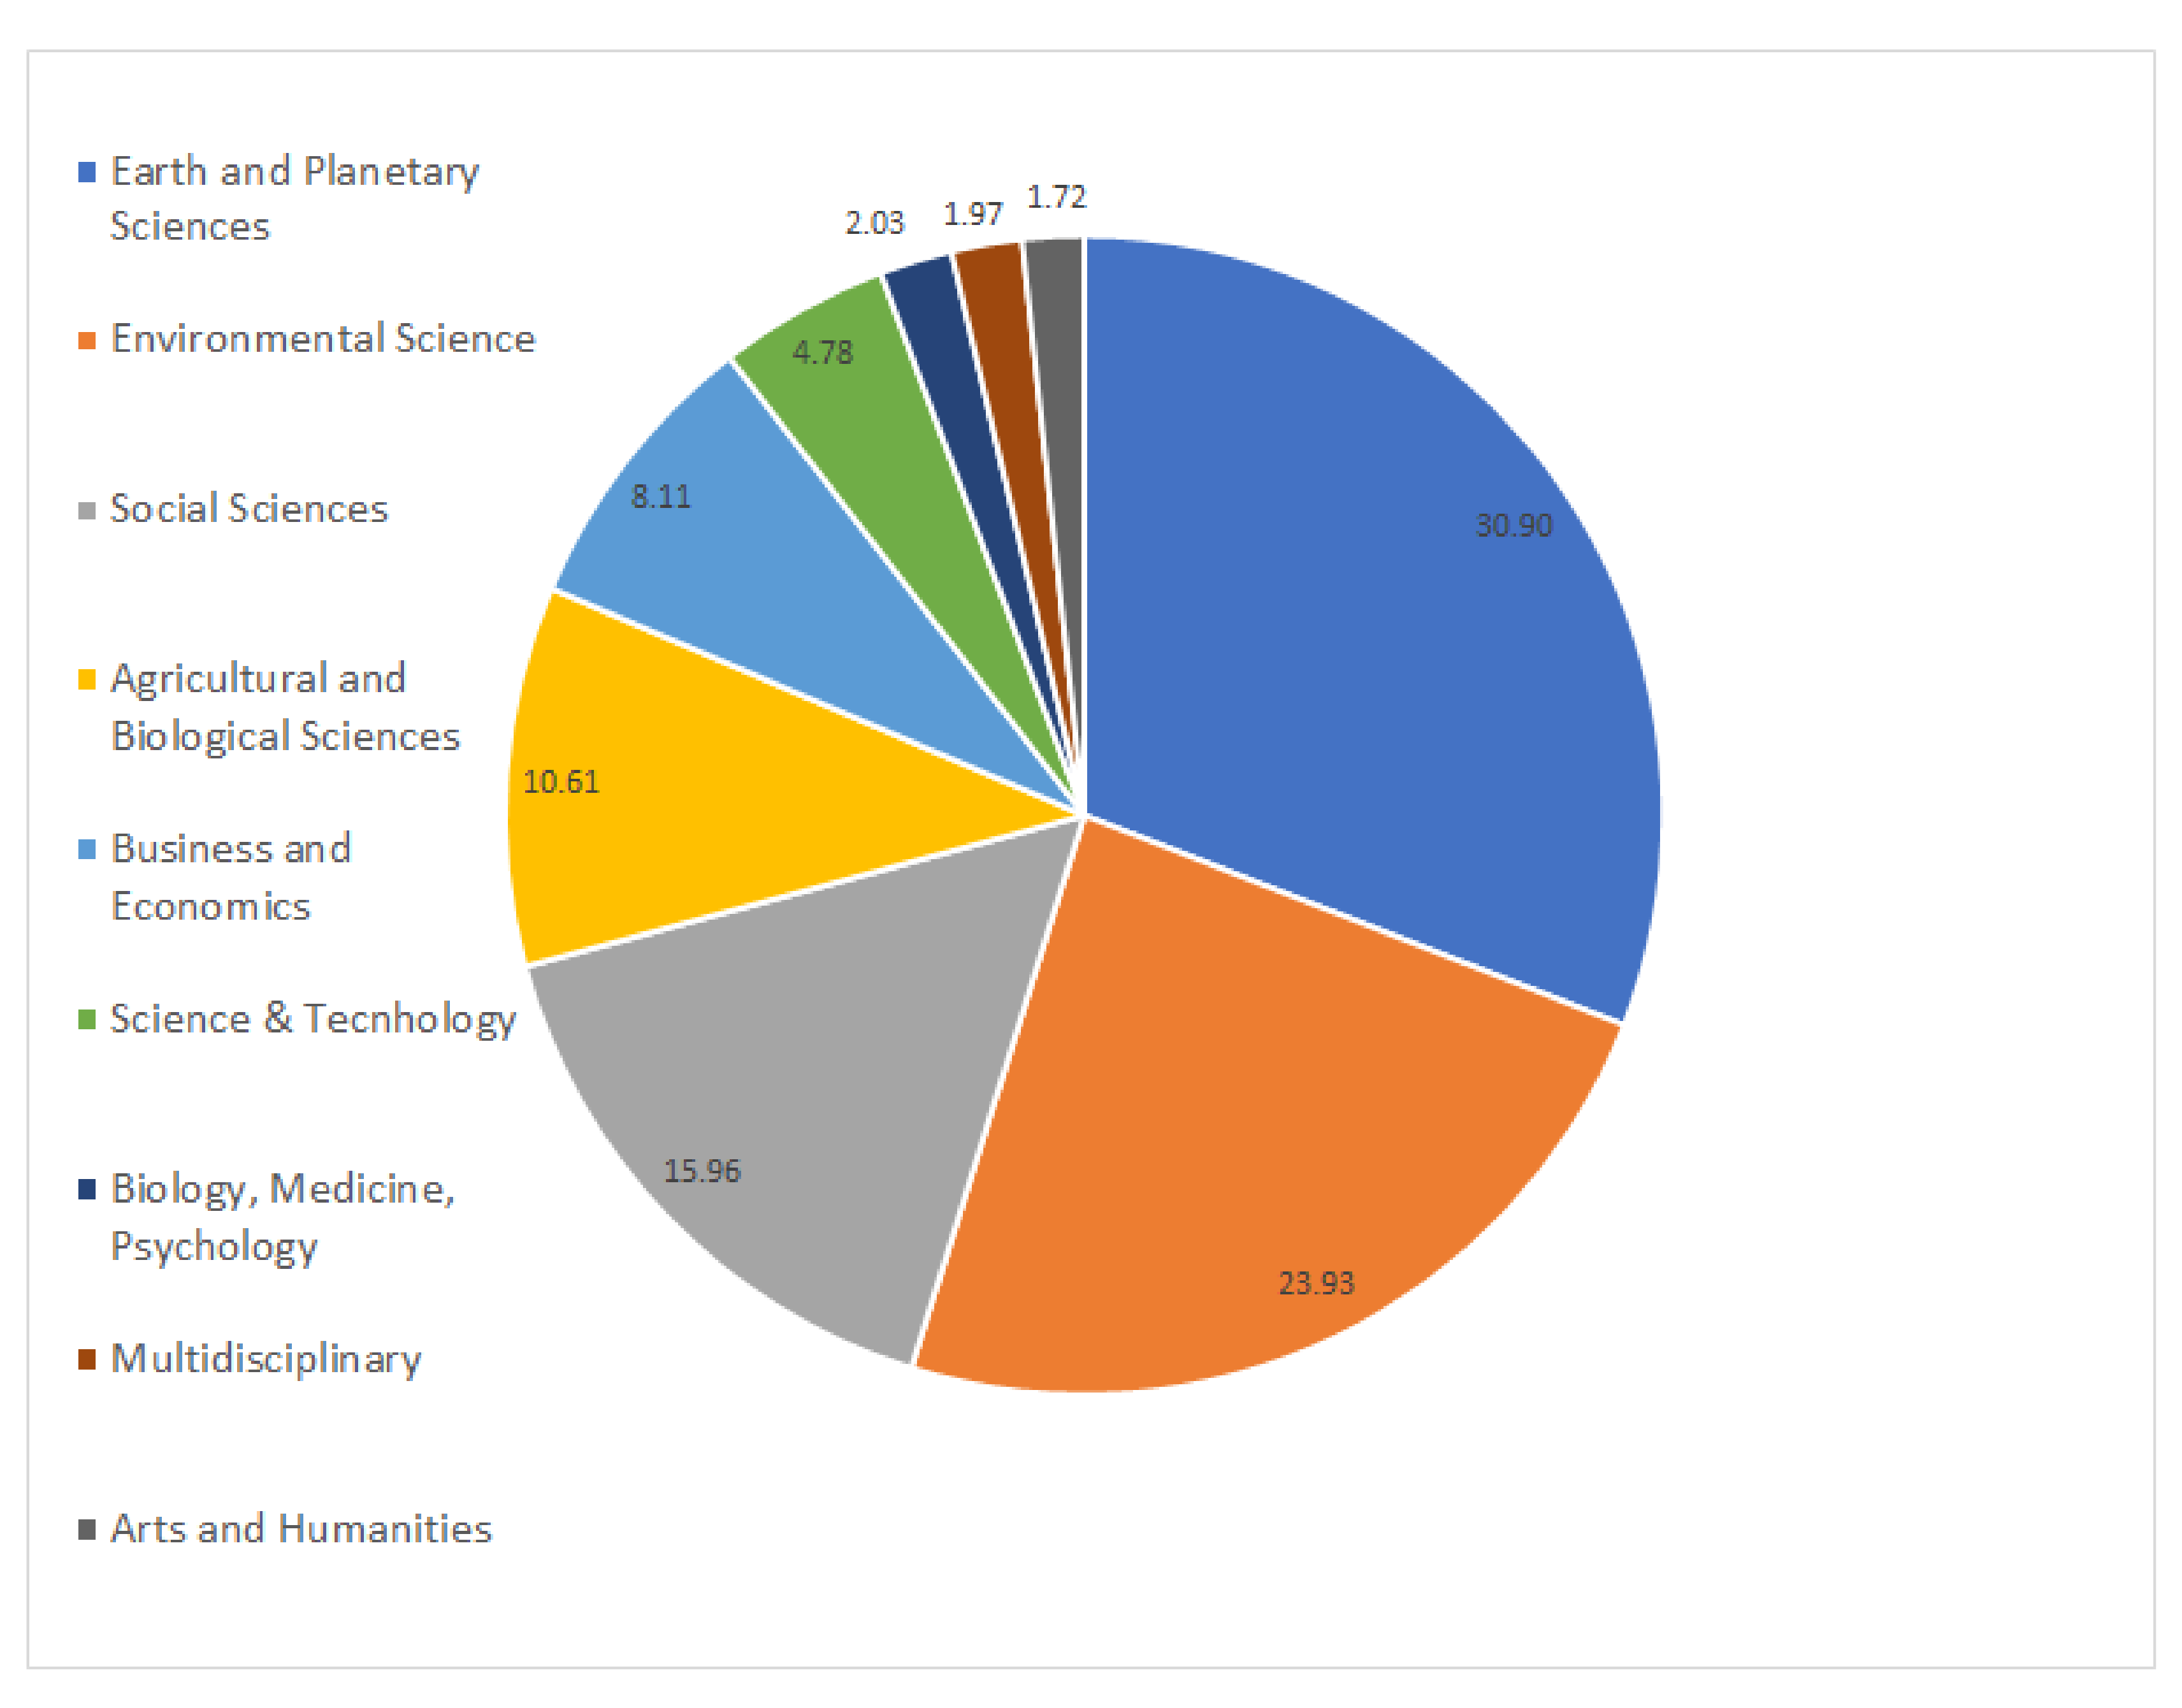
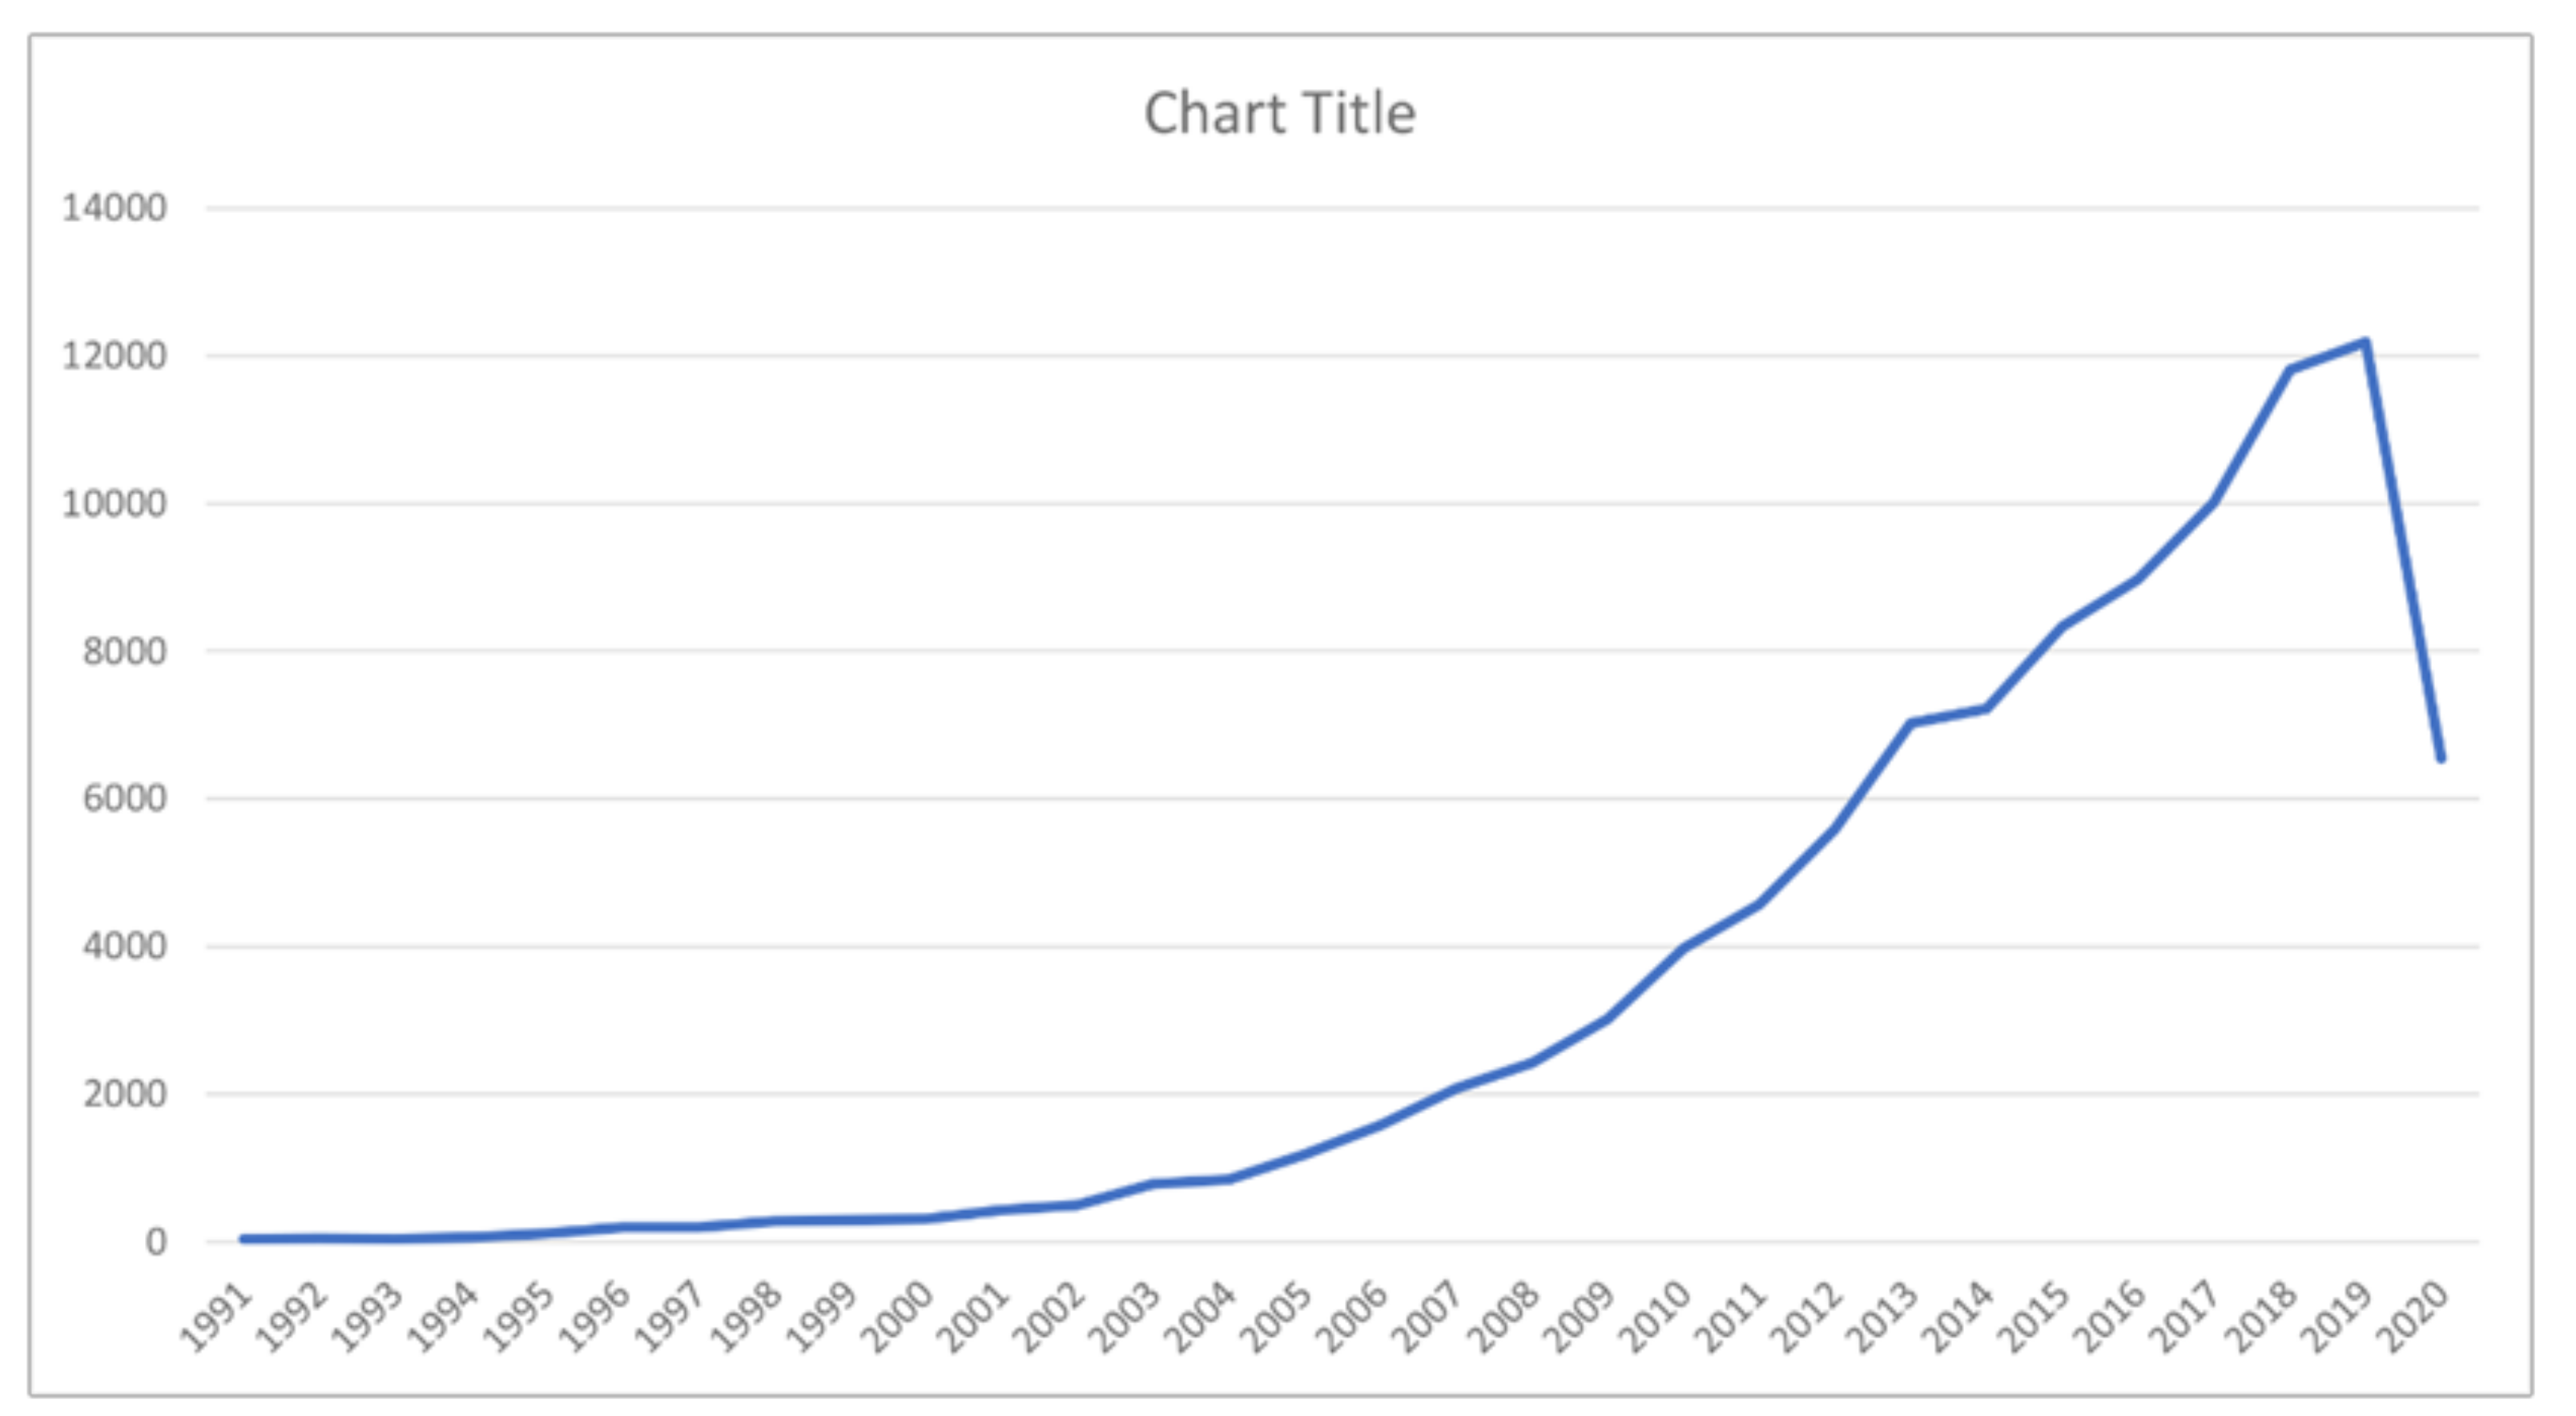
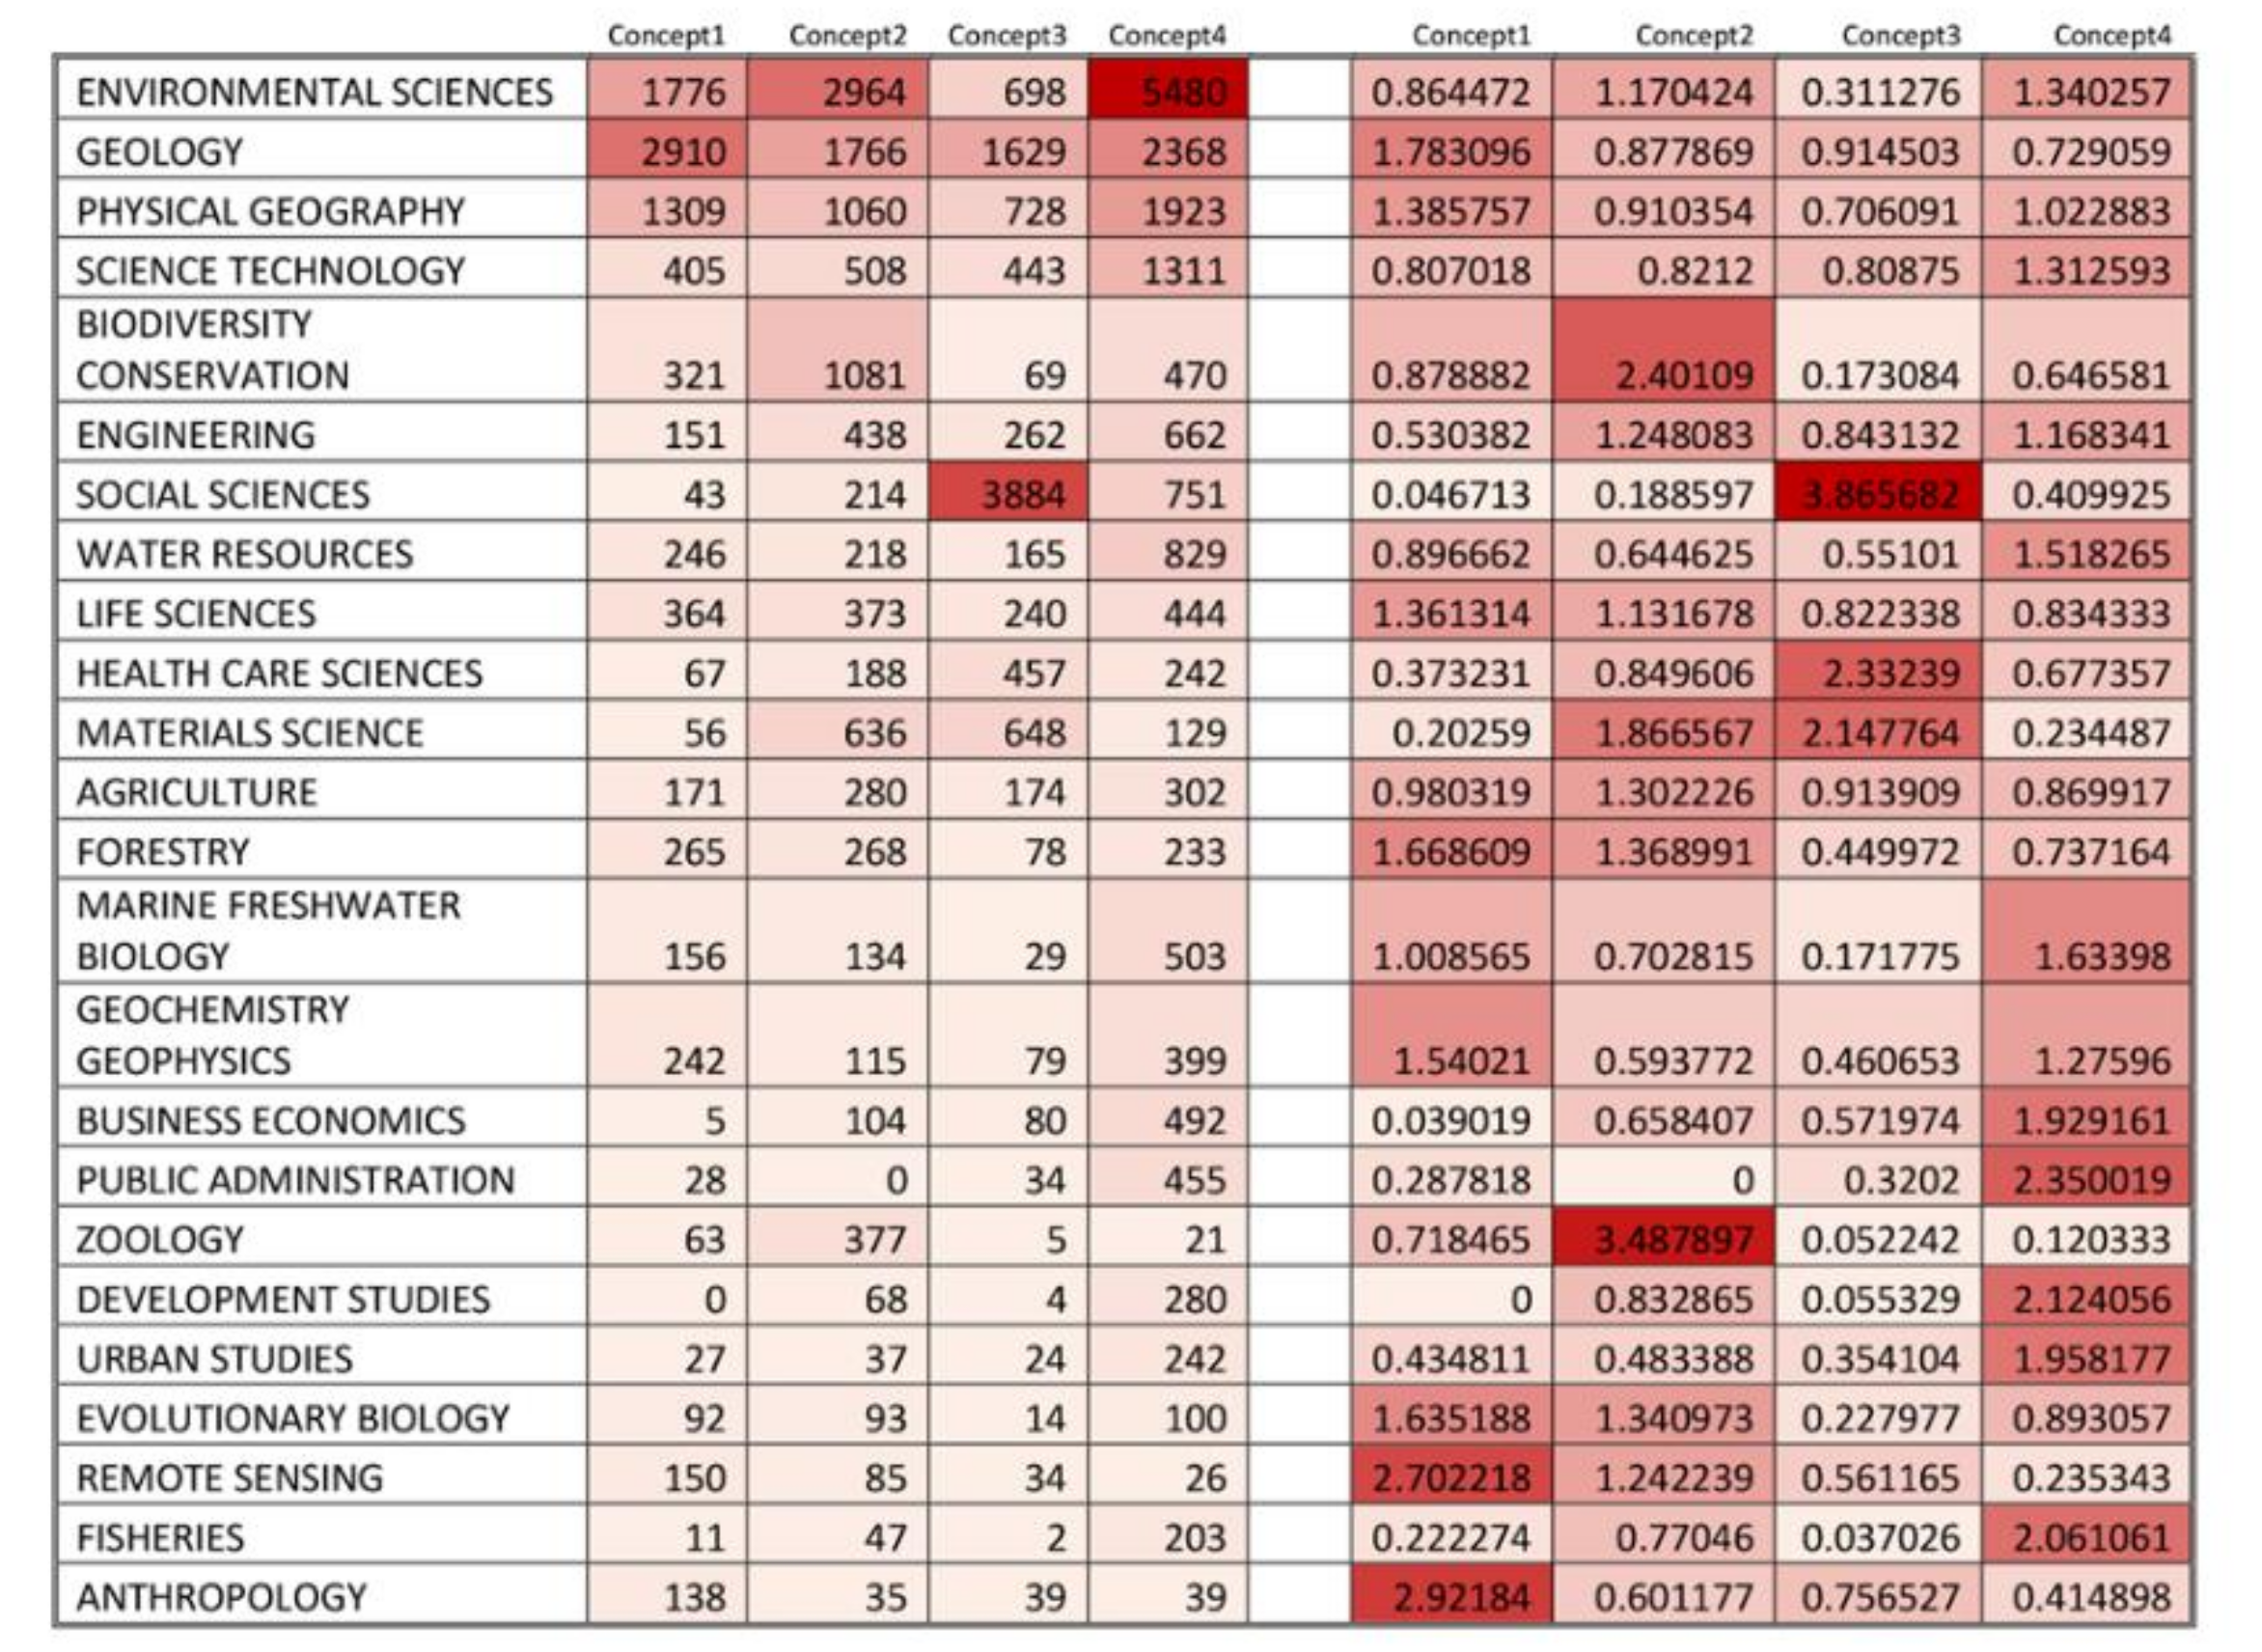
The authors’ backgrounds are Earth sciences, environmental sciences, social sciences and agricultural Sciences. There is a fair share of business and economics background that explains the geotourism aspect of geoheritage. The citation of these authors, steadily rising from the early 1990s, proves the scientific field achieved an amount of data that can unveil underlying trends and patterns in geoheritage practices. Knowing what drives policy makers to put geoheritage on all agendas helps to adjust evaluation methods to provide adequate information for successful policy impact. Geoheritage conservation is still not compensating for the losses of important Earth science sites and landscapes worldwide.
UNESCO took over the global network of geoparks that added a new dynamic in the phenomena. In the age of sustainability and conservation, there is an unprecedented number of bottom-up proposals for UNESCO.
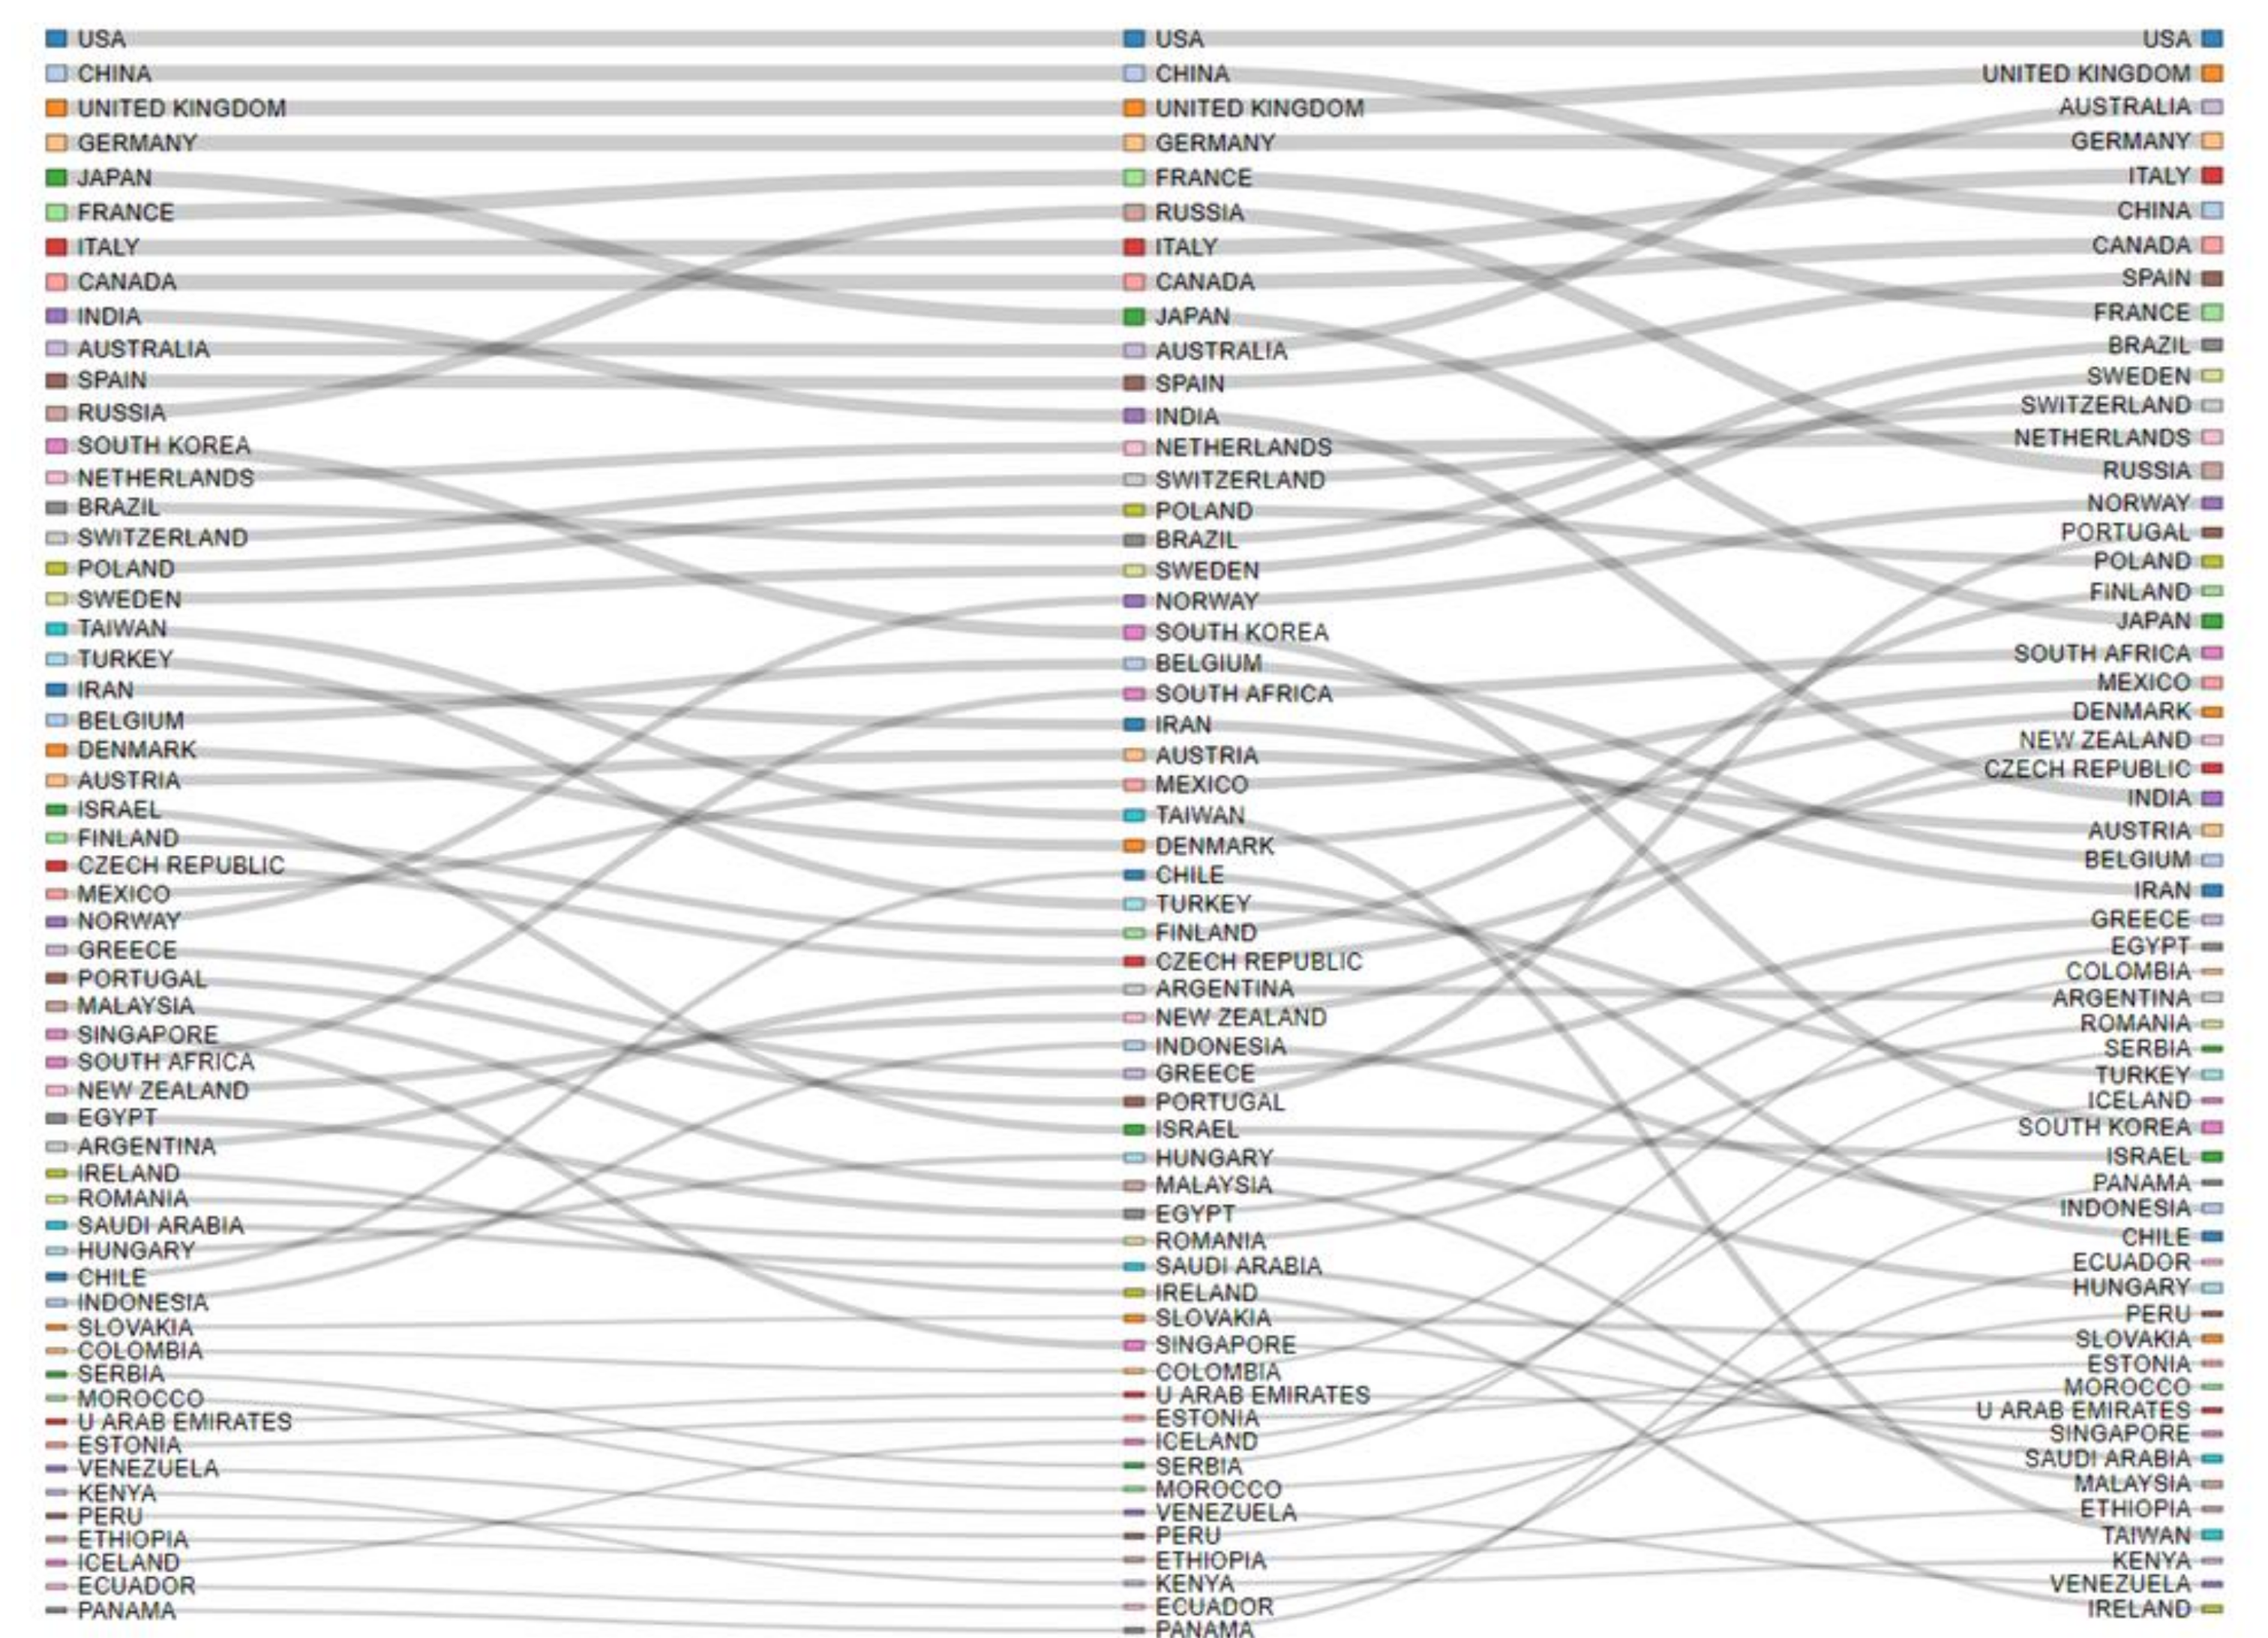
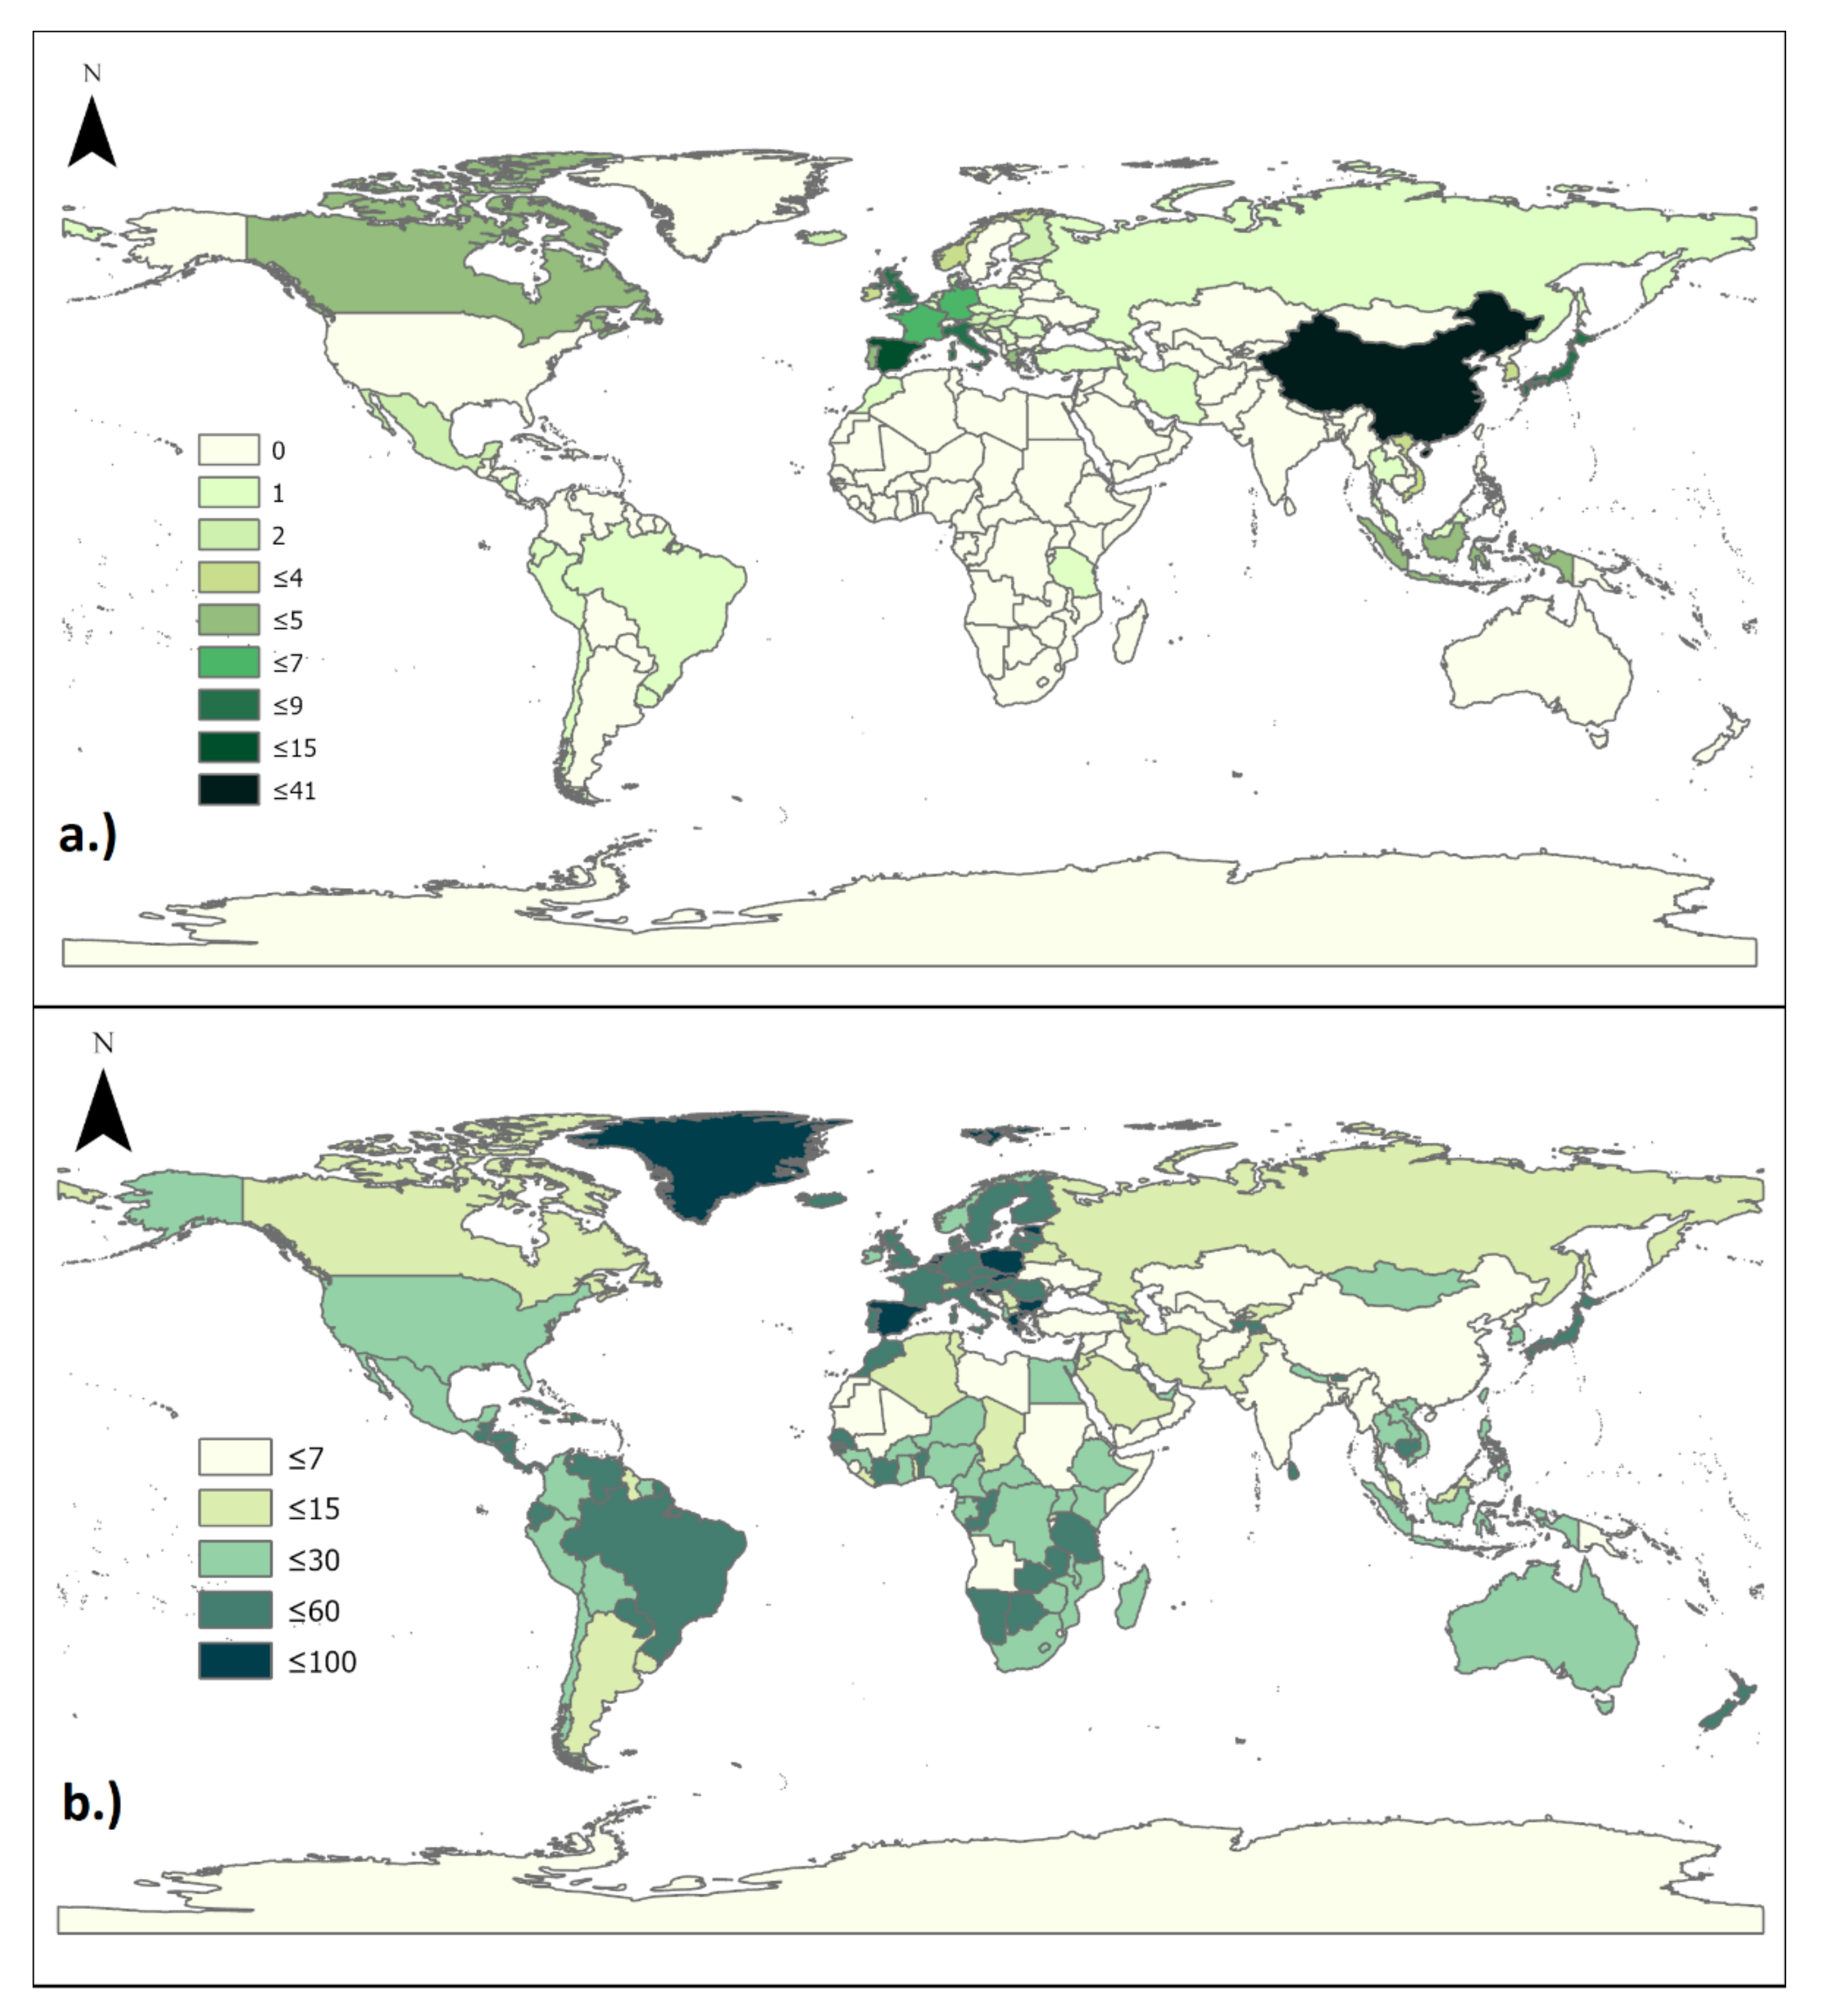
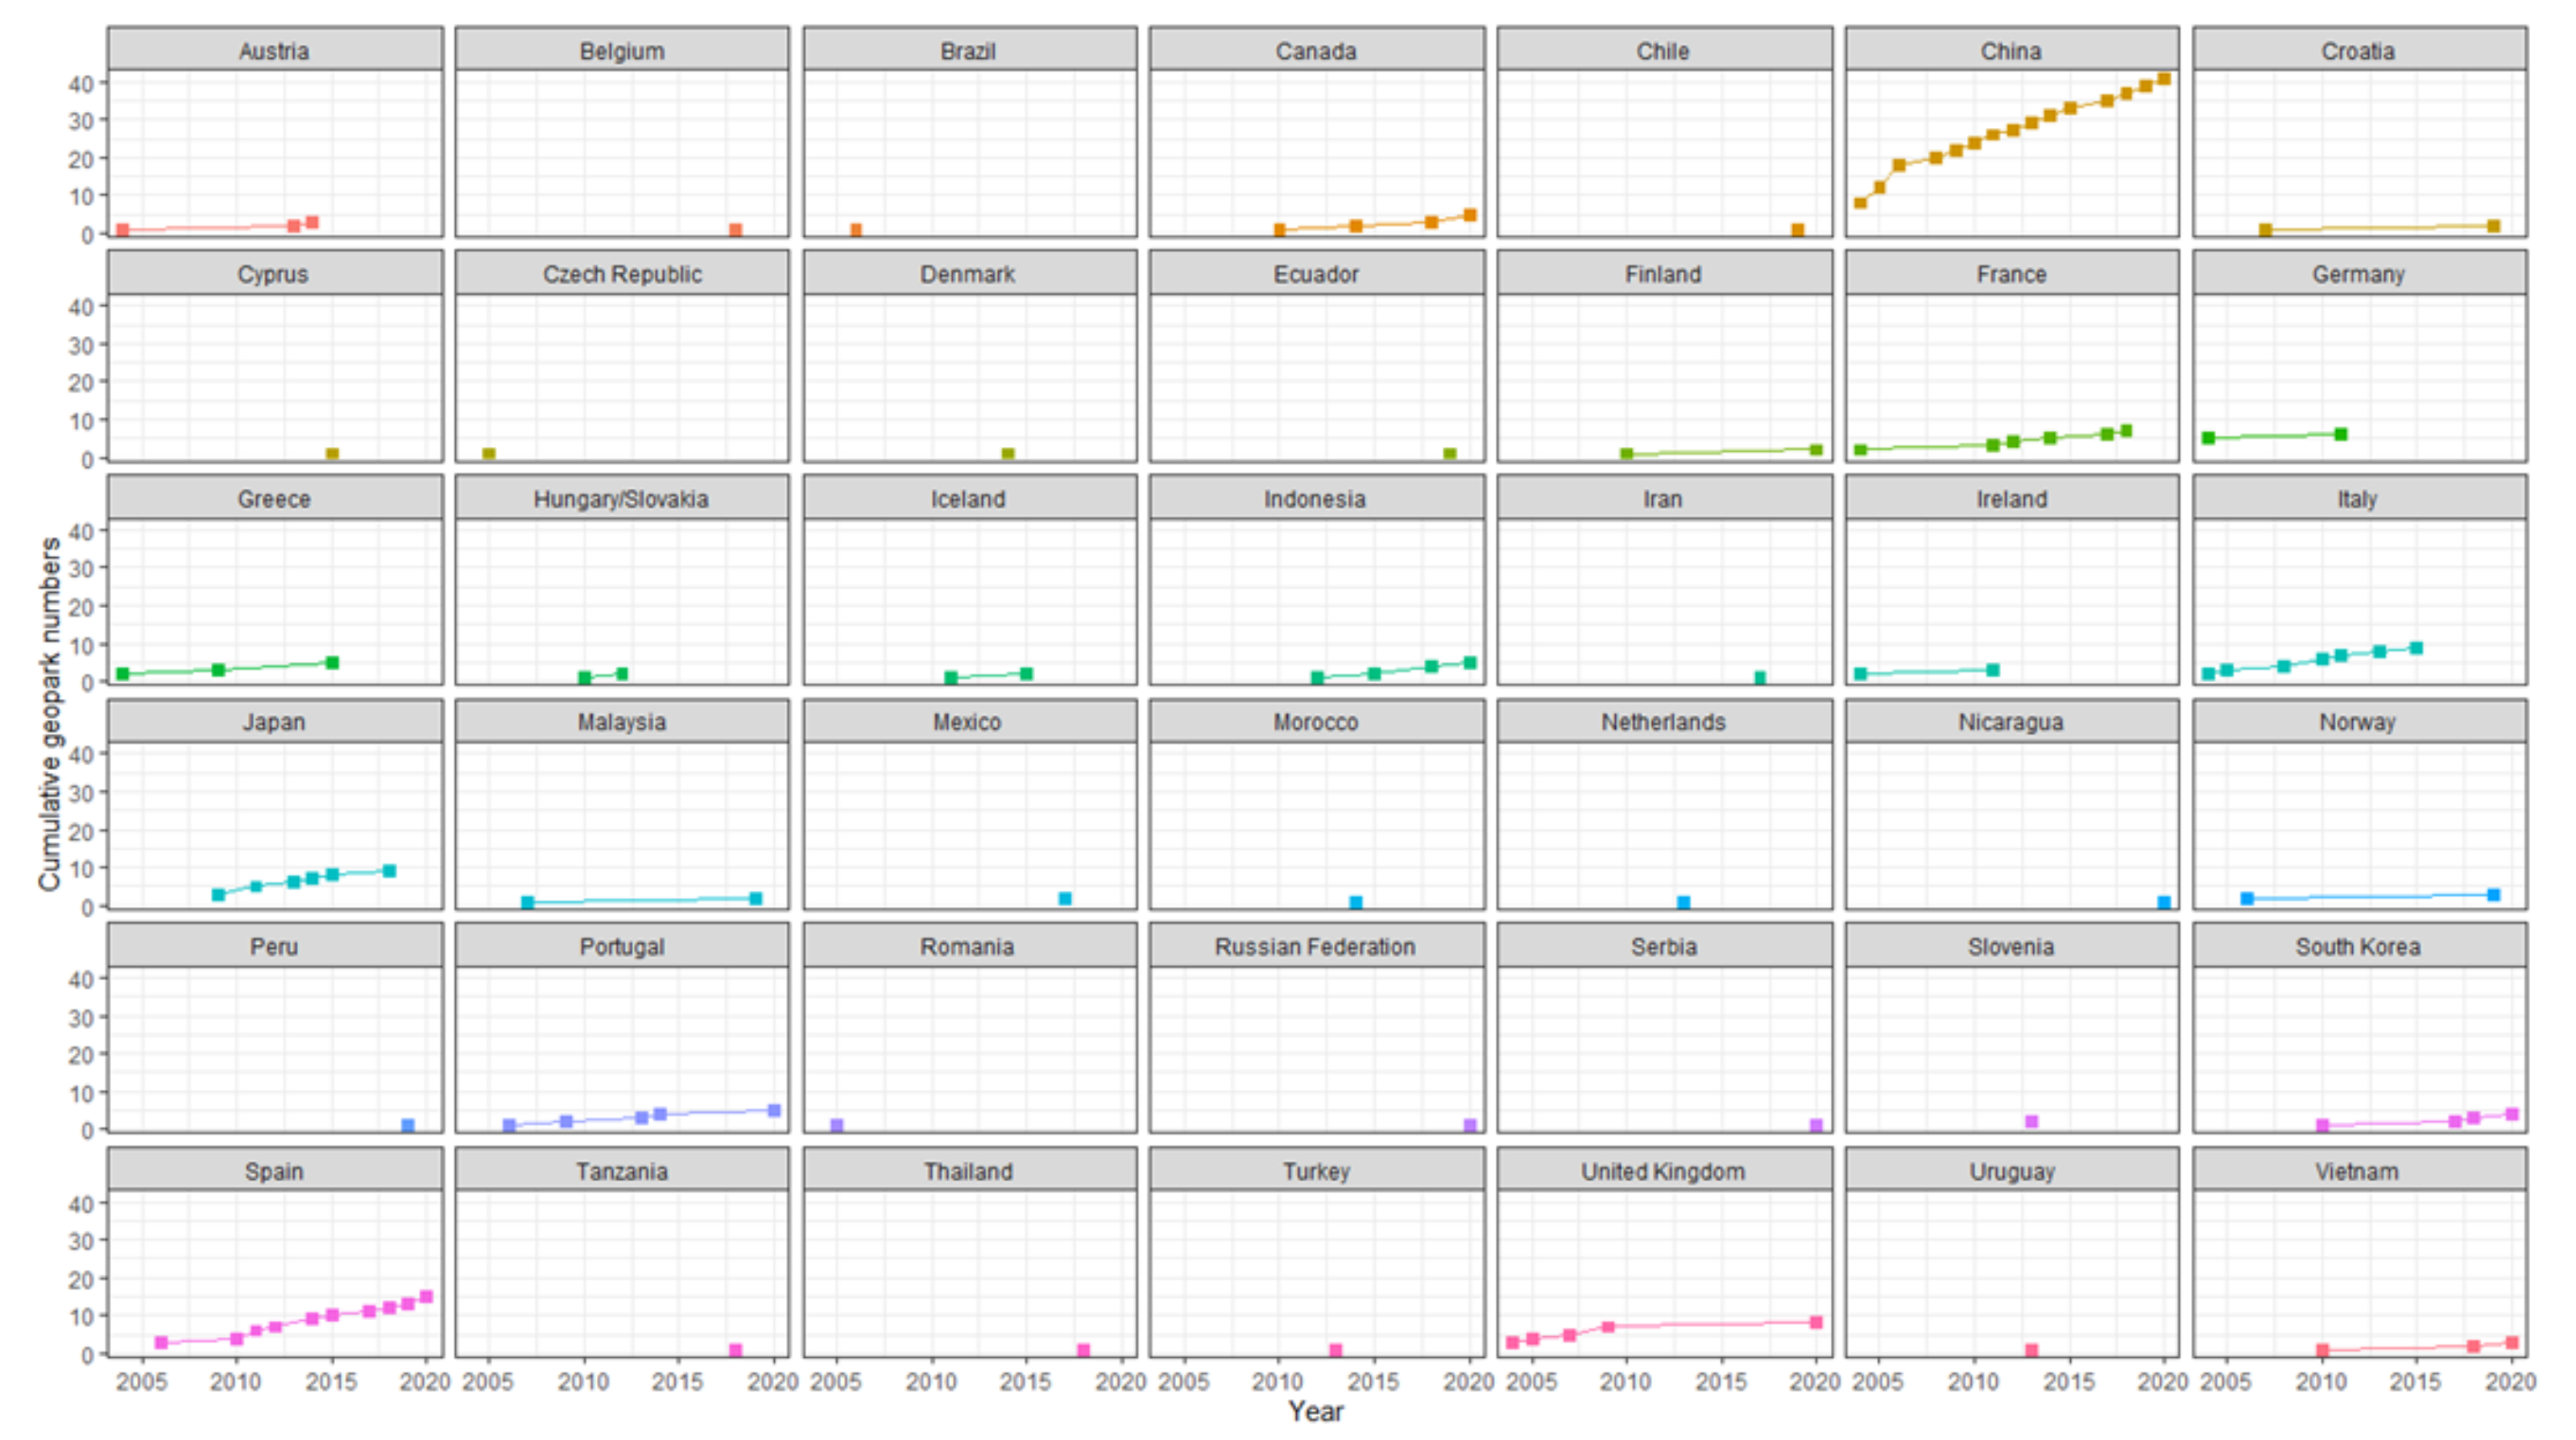
The figure (Figure 12) shows that most countries struggled to increase the number of geoparks, while China, Spain, the United Kingdom, Italy, France and Japan had more success with a continuous expansion of this form of geoheritage conservation. Today, most countries have recognized the benefits of a geopark and wish to make an appearance on the UNESCO Global Geopark Network’s map. However, the evaluation process of the applications is very strict and follows a different approach to IUCN Protected Area management. Communities hold their geological landscape in such high esteem and potentially avoid the high standard assessment practice required by UNESCO. Synthesis of the global state of geoparks sheds light on the approach they need to take to prepare successful applications.
Multivariance analysis enabled us to observe more complex relationships appearing between geoheritage conservation practices. Due to the nature of our study, this is not a robust instrument to measure and monitor geoheritage popularity but, on the one hand, to identify rising trends over time and prompt action for an international framework to avoid adverse interpretations and applications on the subject. On the other hand, the study aimed to understand the complexity of decision making when the natural environment is at high risk of devastation. All conservation planning requires trade-offs. Geoheritage assessments cannot occur without including the demands of the local society and the limited resources of the land. However, when talking about conservation trade-offs, the principles of sustainability cannot be stressed hard enough. Approaches must consider the support of small and medium enterprises and the restoration of cohesive communities with a sense of belonging.
Basic indicators were chosen to first uncover basic trends. To consider further indicators, in-depth data are needed that are not necessarily publicly available from creditable sources. Such work can only be carried out by an international working group under the umbrella of a non-governmental, non-profit organization requiring contributions from practitioners from all around the world.
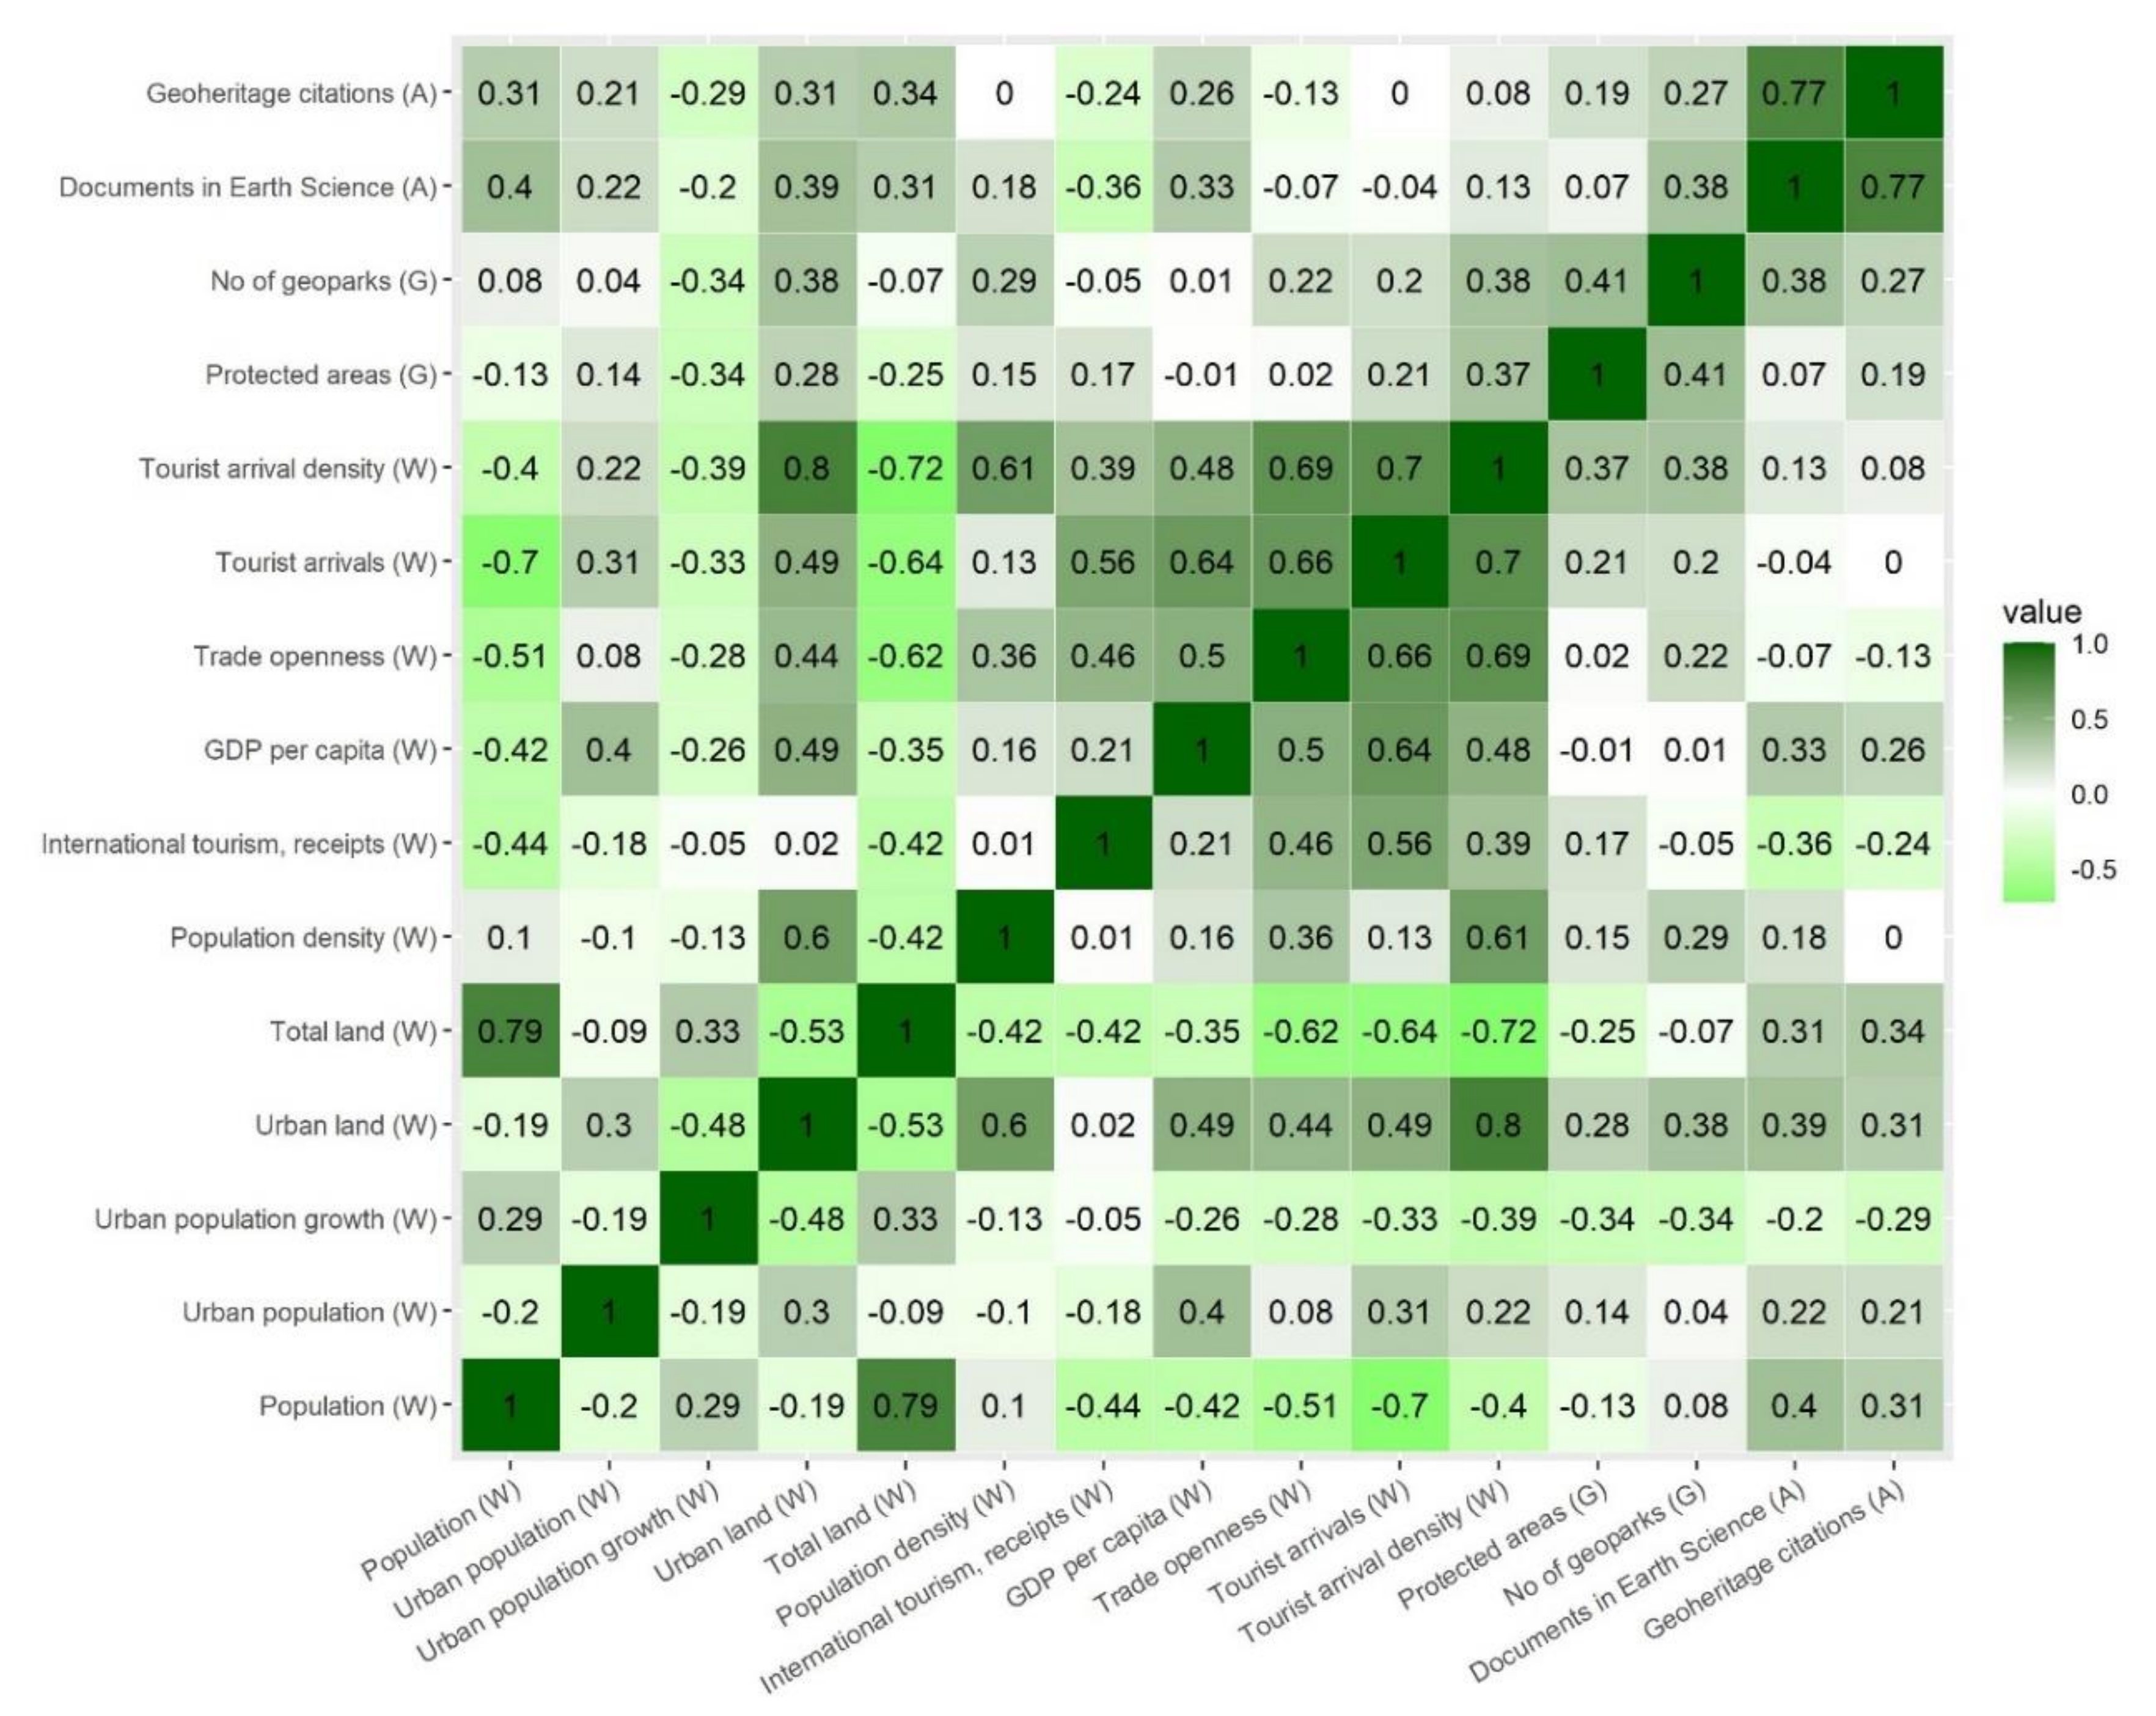
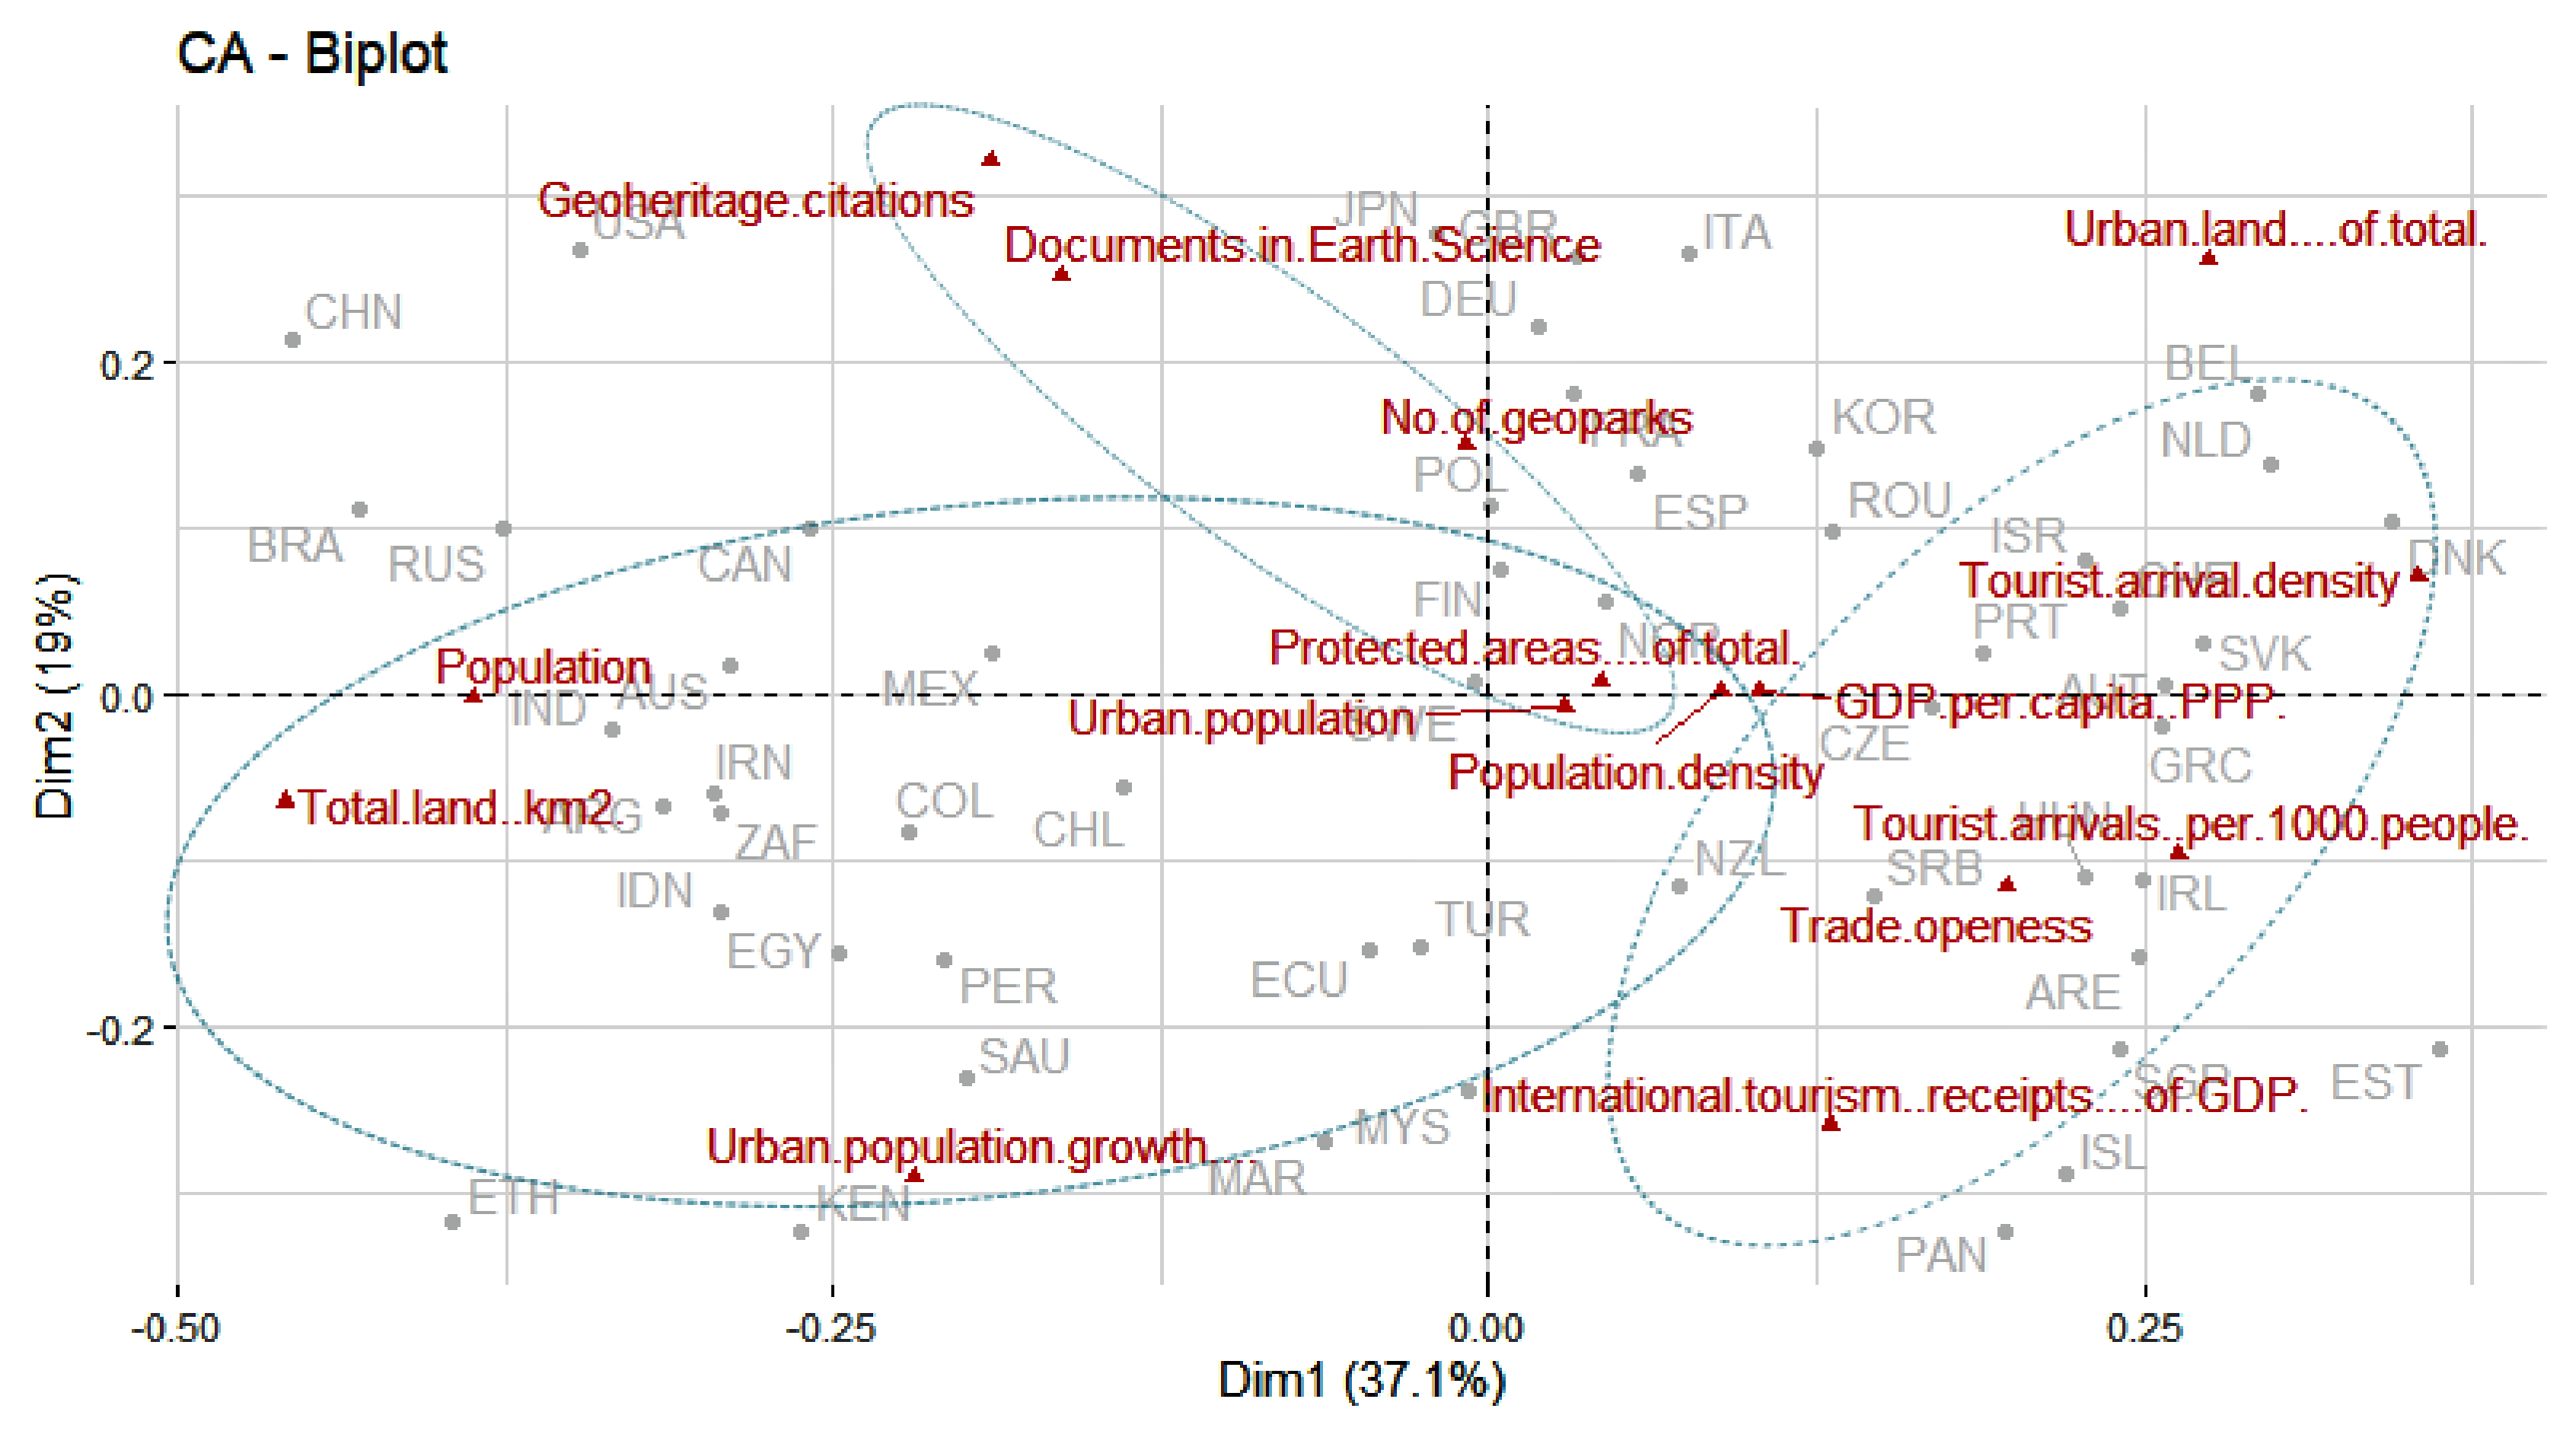
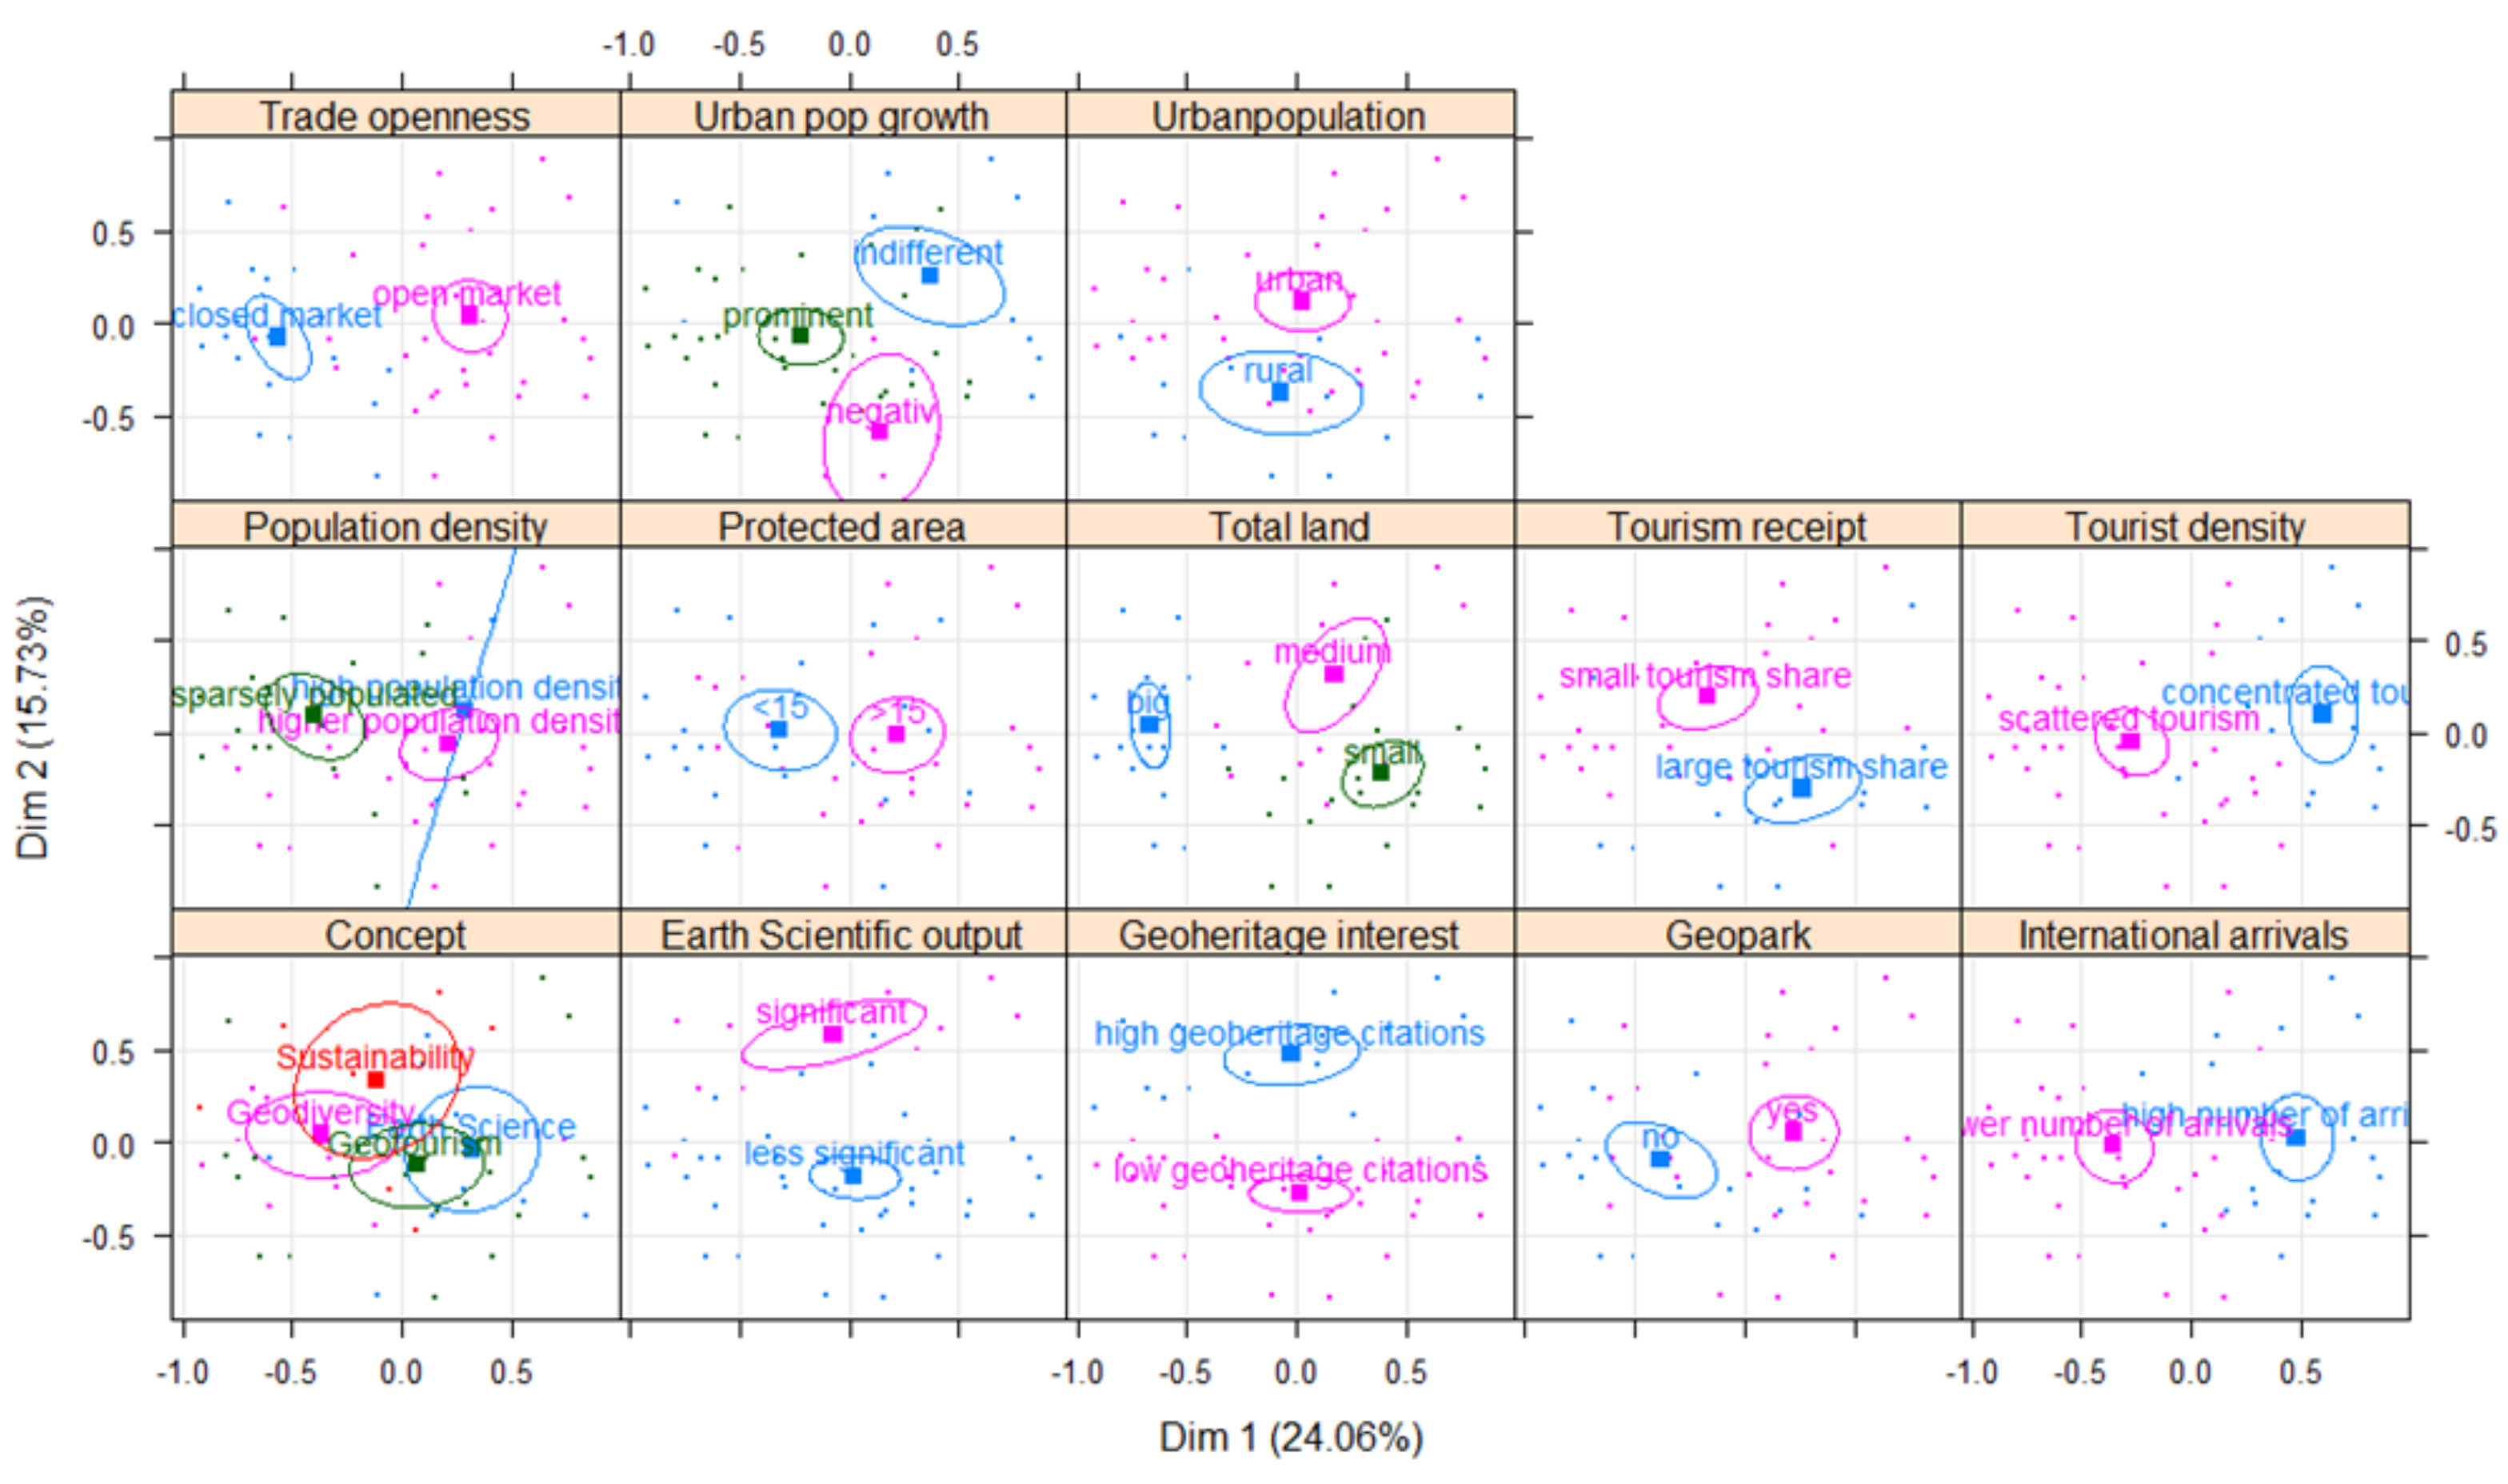
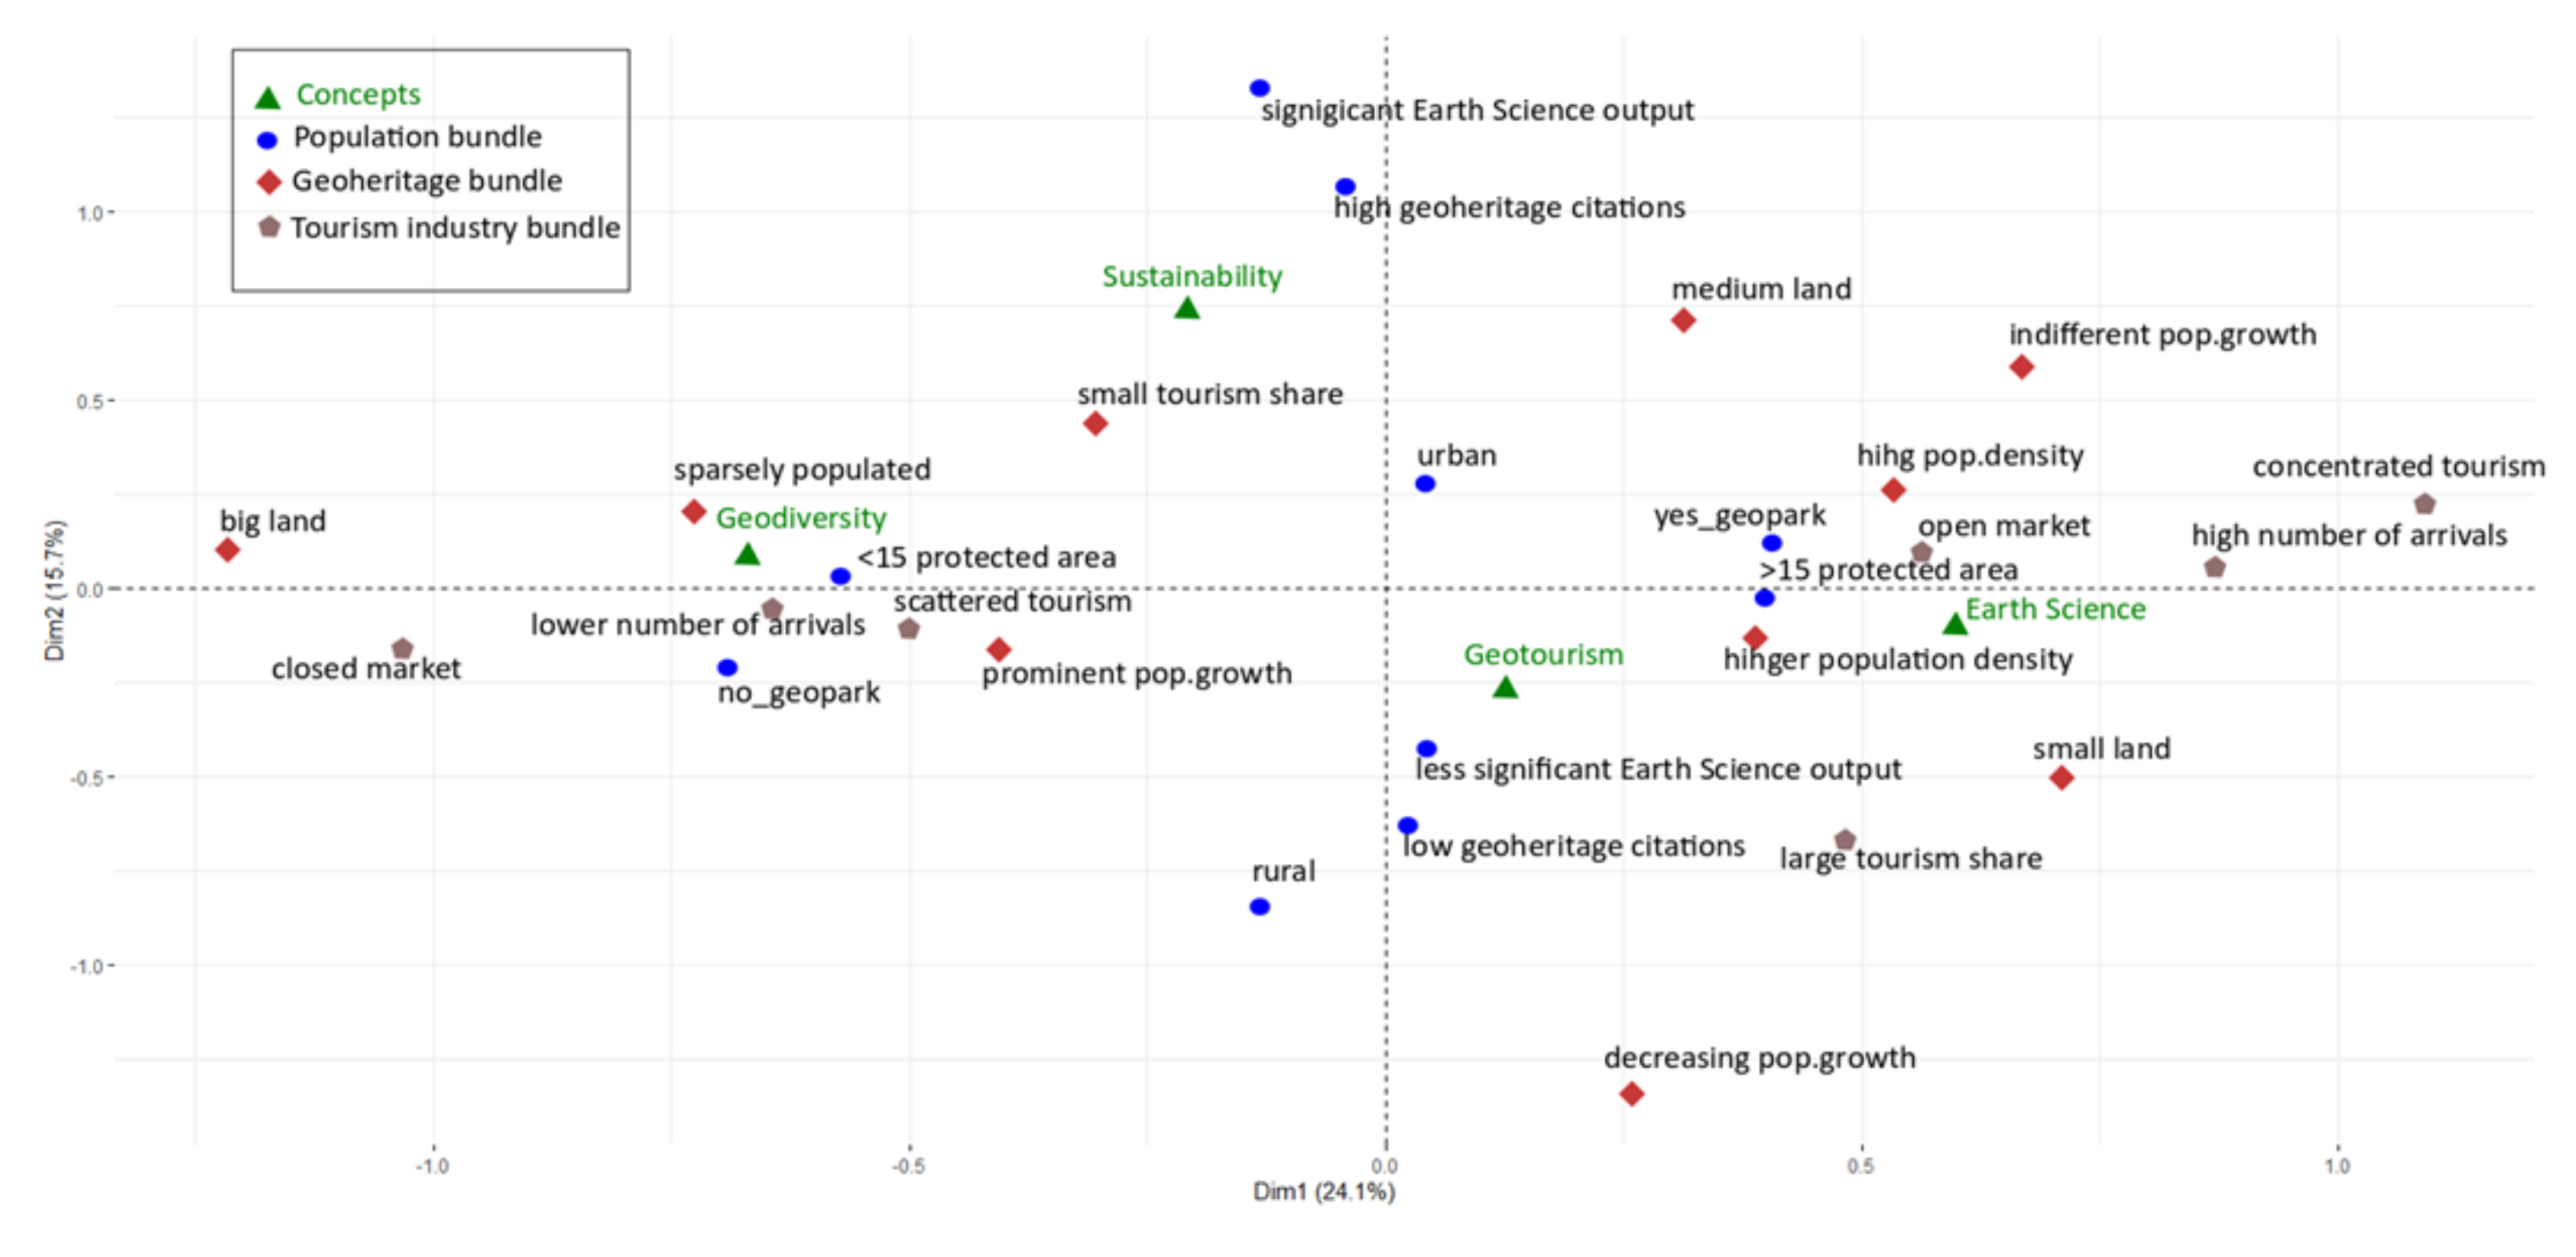
The derived sets of associated indicators formed three well-distinguished bundles. They formed clusters with population-, tourism industry- and geoheritage-related items. We could also observe that with the formation of the population bundle in the bibliometric indicator, geoheritage citations appeared to be associated. This result suggests a particular proportion of the size of the population, land, urban land and the pace of urban growth triggers enhanced interest in geoheritage research, as opposed to the number of international tourist arrivals and their economic effect. Conservation efforts are triggered by the witnessing of loss. It is a very interesting observation that the GDP of the country does not link to any trend, rather the size of the rural population. Globally, the present issues in today’s world provide opportunities for communities in the countryside. Addressing geoheritage in these areas seems to attract positive geoheritage outcomes.
Analyzing the formation of relationships within the categories offered further insight into the dynamics of geoheritage conservation. In effect, our analysis also supports the theory that high trade openness attracts more visitors and positively affects the economic aspect of the tourism sector. The first axis, dimension 1, ordered the existence of geoparks according to this phenomenon, as well as the maintenance of a larger protected area network, small land area and higher population density. In some countries, an overall intensified conservation strategy was made necessary due to the higher proportion of population to land. These countries encountered the problem of land limitation and noted that society must learn to coexist with the environment in the best way possible. The globalized market and large number of international arrivals lead to a more open approach to imply the idea of extending conservation to geoheritage. At the same time, these circumstances seem to drive decision makers to acknowledge and utilize the power of Earth science education to generate sustainable tourism that can take place in geoparks. Our model ordered the concept “Earth science” according to these conditions.
The category of “no geopark” bonded with categories of sparse population, scattered tourism opportunity, fewer international visitors and lower value of trade openness. Here, the protected area network tends to be smaller and the growth of the urban population is taking place. This suggests there is no land pressure nor social pressure to force conservation policies to be more inclusive in terms of geology. The arrivals use the existing facilities without risking adverse effects and the urbanization has not yet exerted the level of pressure on policies that leads to changes. The concept of “geodiversity” aligns the most with this state. The reason is that the primary focus is yet to shift from merely biodiversity and geodiversity is looked at as a factor for more accurate biodiversity conservation measures.
With dimension 2, we arrived at the main interest of ours, which is the is the categories associated with a high interest in geoheritage. It was no surprise that significant Earth science research activity falls into this group. Other members of this group are small tourism share, urban population, medium land area and a very slow rate of urban population growth. The concept of sustainability falls in line with the categories. The lower contribution from the tourism sector to GDP and the lack of pressure to create opportunities for rural populations makes it less important to guide tourists, or to create geoparks. At the same time, urbanization is becoming stronger, causing scientists to research geoheritage.
The opposite end of the axis showed us that a population living in rural areas, receiving a large tourism share and experiencing a decrease in urban population has low interest in geoheritage. Such a trend is possible in a small or medium country that has a culturally strong and cohesive society with an authentic landscape that attracts tourists. As there is no pressure to expand urban land, society does not experience the loss of geoheritage features. Efforts primarily address an overall economic growth without the weight of losing cultural identity or significant harm to the environment. These circumstances should not stop decision makers to prevent conservational issues from becoming prominent with rapid urbanization.
Dimension 3 had the least common relationships. Here, we can observe the type of rural population with existing geoparks that have a smaller number of arrivals. This is the case where attracting more visitors to the area to enhance local economy opens ways for geoheritage practitioners to create geoparks. In these areas, however, there is no real pressure on geoheritage loss, rather using aesthetically pleasing geomorphological features with the secondary goal of promoting Earth science and geotourism. This approach has its place in an overarching geoheritage conservation framework but cannot grow at the expense of scientific importance. Our model ordered the concept “geotourism” according to this bundle.
On the opposite end, we attained our last category, that is, small land area without geoparks, high population density, large number of arrivals and an urban population. In such areas, urbanization reached an extent where there is no organic landscape to preserve. Visitors here are interested in the built landscape with impressive technology and recreational landscaping aided by urban geoheritage aspects and ex situ geoeducational aspects such as specialist museums or exhibition centers explaining the landscape and geology buried under the urban landscape [110,111].

6.2. Determinant Analysis at a Local Scale

This study sheds light on the underlying trends of geoheritage conservation. The rise in geoheritage publications suggests that the discipline has gained ground at a global scale. However, it is possible that important geological sites and landscapes may keep disappearing due to developments at a local scale. To understand how trends change with the change in scale, we zoomed into our results and had a closer look at geoheritage determinants in an urban area. We selected Auckland, the city where all pressing issues are present with governance is aiming to create a sustainable city for both Western and indigenous communities by 2050. The unique volcanic land paired with a unique socio-economic landscape provided a perfect textbook example for the understanding determinants of geoheritage conservation.
New Zealand is a relatively sparsely populated country (population density: 18 per km2) by OECD standards. Its population density is relatively low but highly concentrated in the Auckland area. Conserving land is a challenging task and is determined by a conflict of interests. Cultural land and geoheritage sites keep disappearing and the reserves and green spaces left for recreation and cultural purposes do not provide compensation for the rapid sprawl. Therefore, there is no better place to conduct a case study and contribute to the world information on what gaps need to be closed to achieve the status needed for geoheritage conservation.
From a geopark perspective, New Zealand has no UNESCO Global Geopark yet, despite that, recognized scientists are involved in the construction of geopark proposals. Interestingly, out of the “expected” locations considered as conservation and tourism hotspots, there is the Central Volcanic Plateau on the North Island or the Rotorua geothermal areas [112,113]. New Zealand has a pending application for the Waitaki Whitestone Aspiring UNESCO Global Geopark on the South Island [114]. Cultural values of the country are invaluable for the world and should be an important node of the network by all means. However, the slower rate of historic events and lower population density limits the cultural aspect of an otherwise geologically unique area shaping a social landscape such as Auckland.
OECD tourism policies highlight the need for coherent and comprehensive approaches. One of the main focuses is the rethinking of tourism through a sustainability lens [115], following up on the growing argument that tourism success is measured by visitor numbers instead of by its contribution to local economies and benefits to destinations. However, there is no standard response to these problems and the OECD Tourism Committee still reports a failure to adequately address the value of tourism for destinations [115]. New Zealand took additional steps to integrate sustainability into tourism through a program managed by New Zealand’s tourism industry association “Tourism Industry Aotearoa” developed by industry for industry. The aim is to achieve sustainability for every New Zealand tourism business by 2025 (https://www.sustainabletourism.nz/).
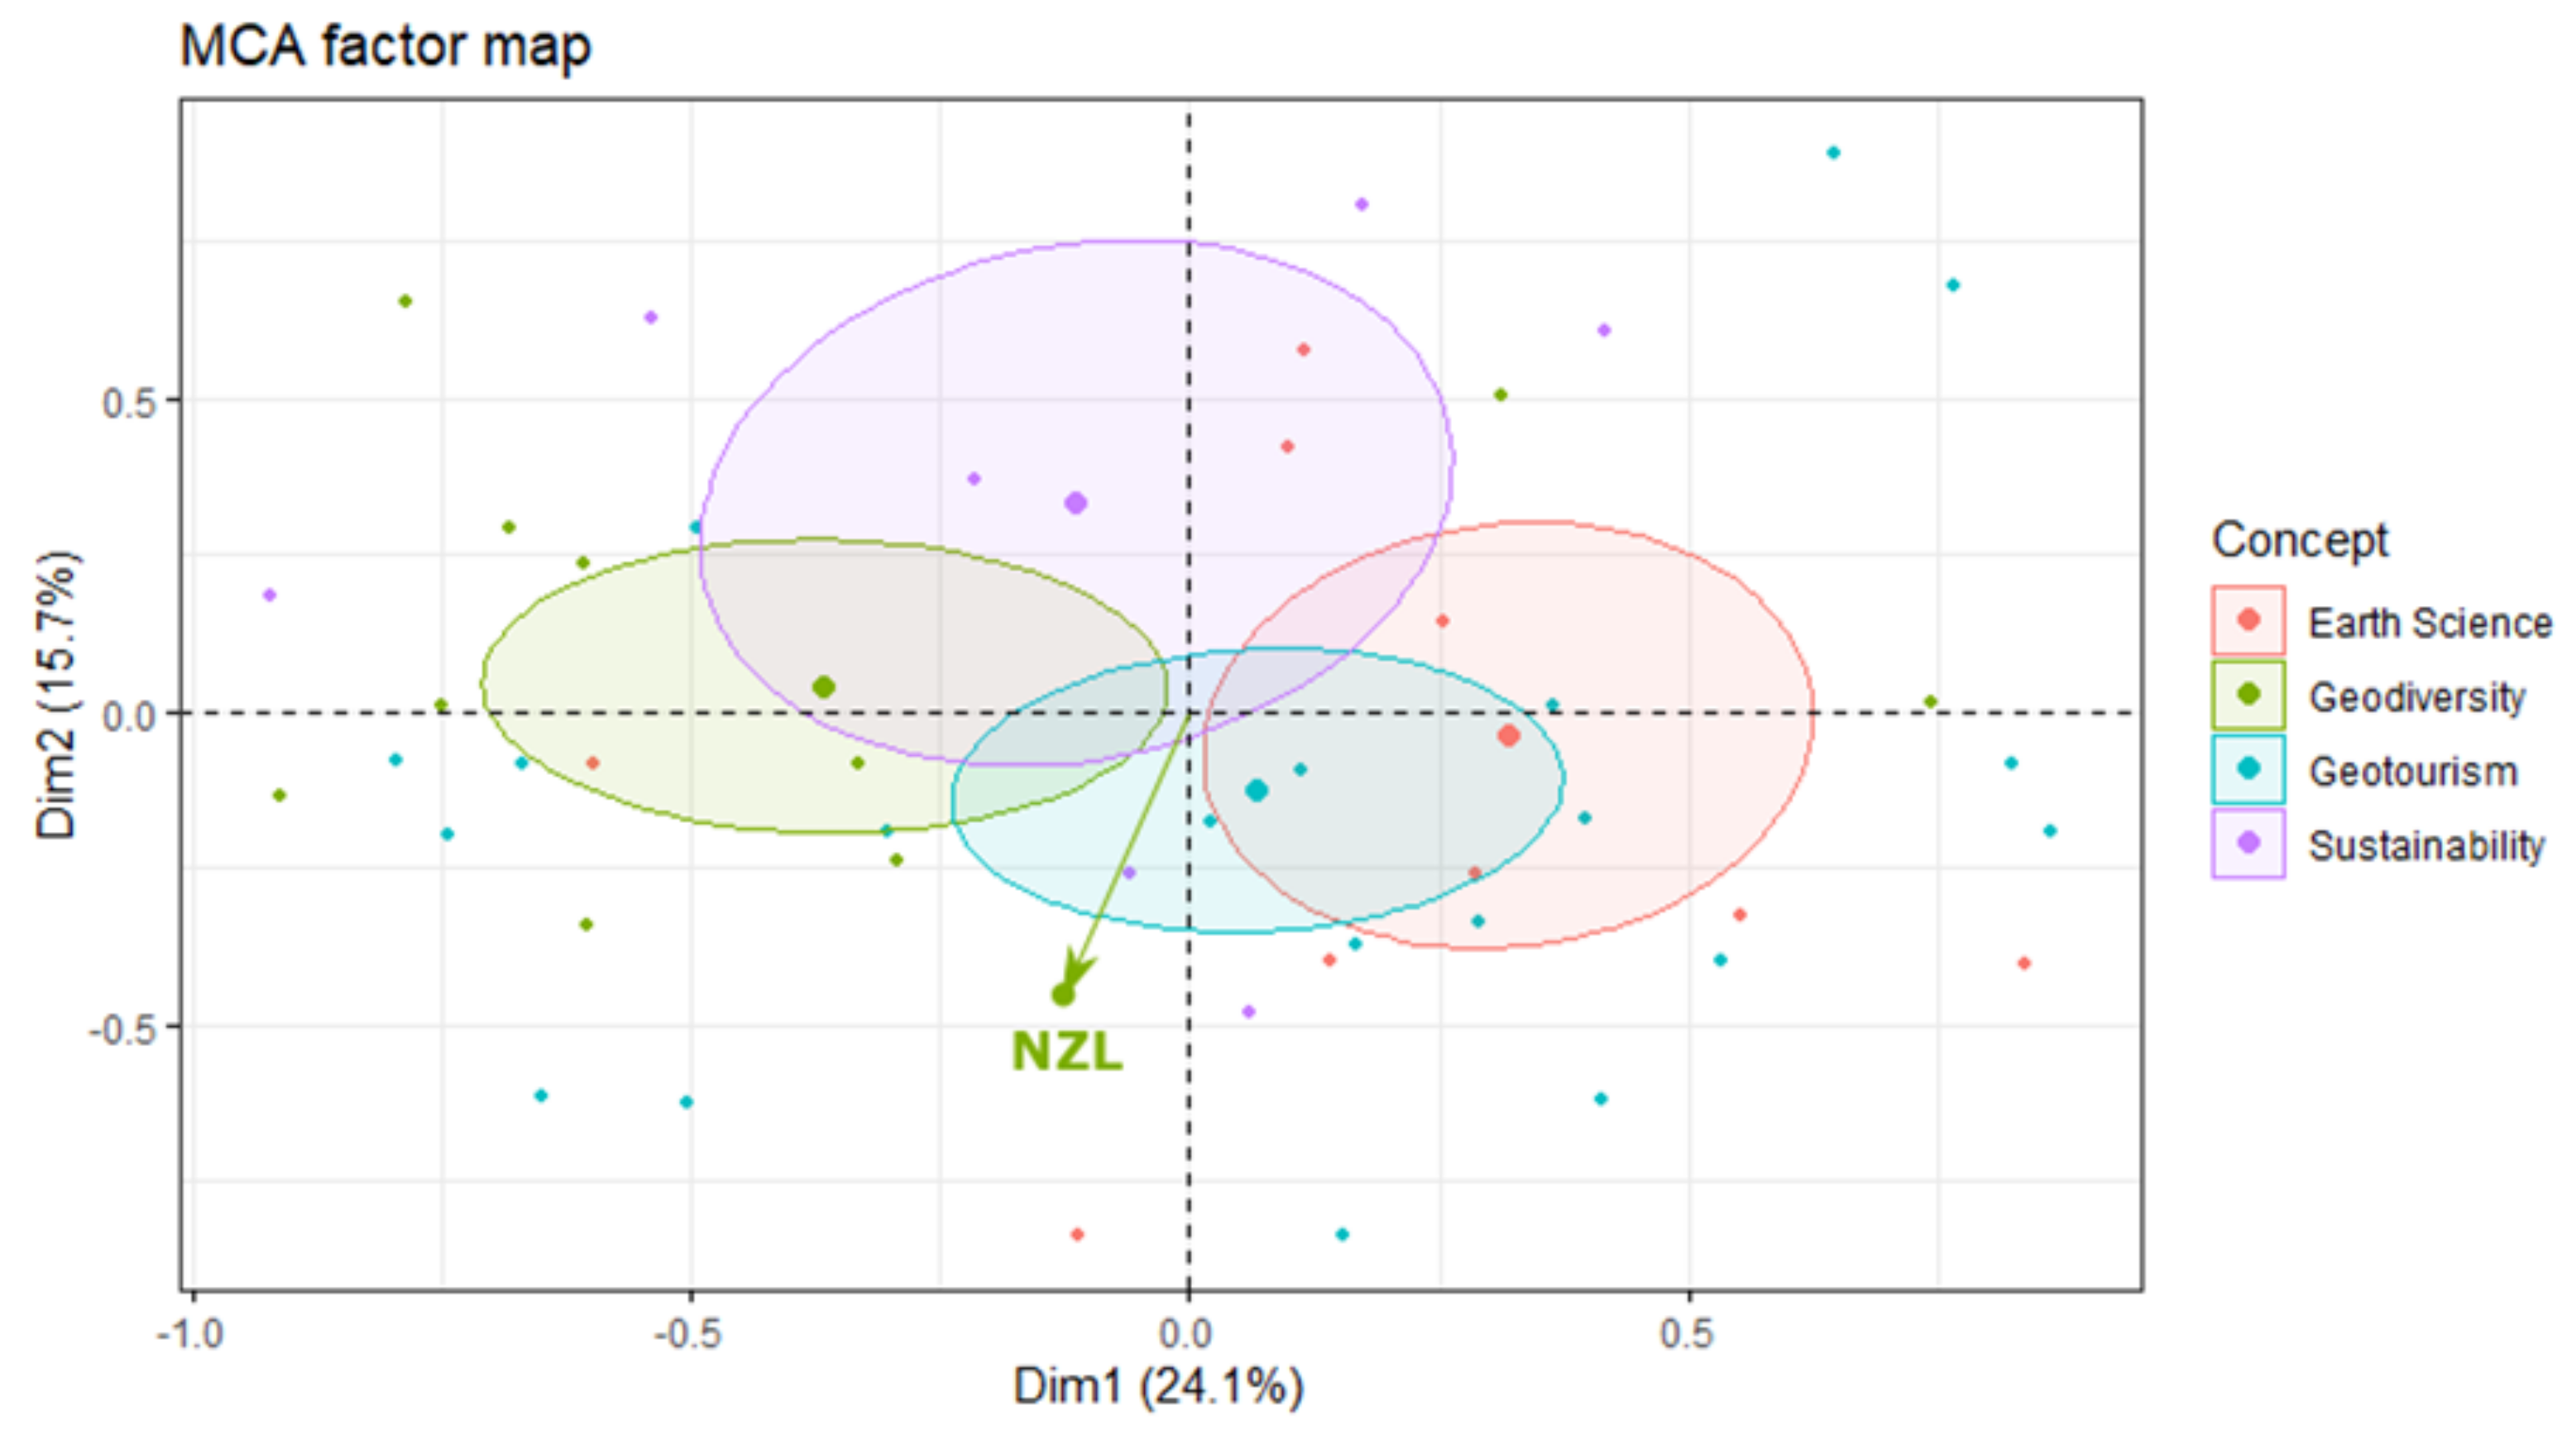
New Zealand has a set of categories between sustainability and geodiversity. It is sparsely populated, but the country strives to create opportunities for rural communities without undermining community well-being. Additionally, the country regionally experiences immense pressure from rapid urbanization, especially in the Auckland region. According to our analysis, New Zealand not only measures up to international practices but stands out. It shows special interest towards saving geoheritage features of scientific and indigenous value, however, it is a difficult and complex process to carry out, with numerous obstacles to overcome [116,117]. In the Auckland Volcanic Fields, scientists work together with indigenous representatives to create a peaceful future for all communities [118]. Value systems can evolve and merge, and one does not need to suppress the other. Along with the strong measures to preserve cultural identities, Auckland aspires to pursue internationally agreed goals on geodiversity, biodiversity and sustainability [119].
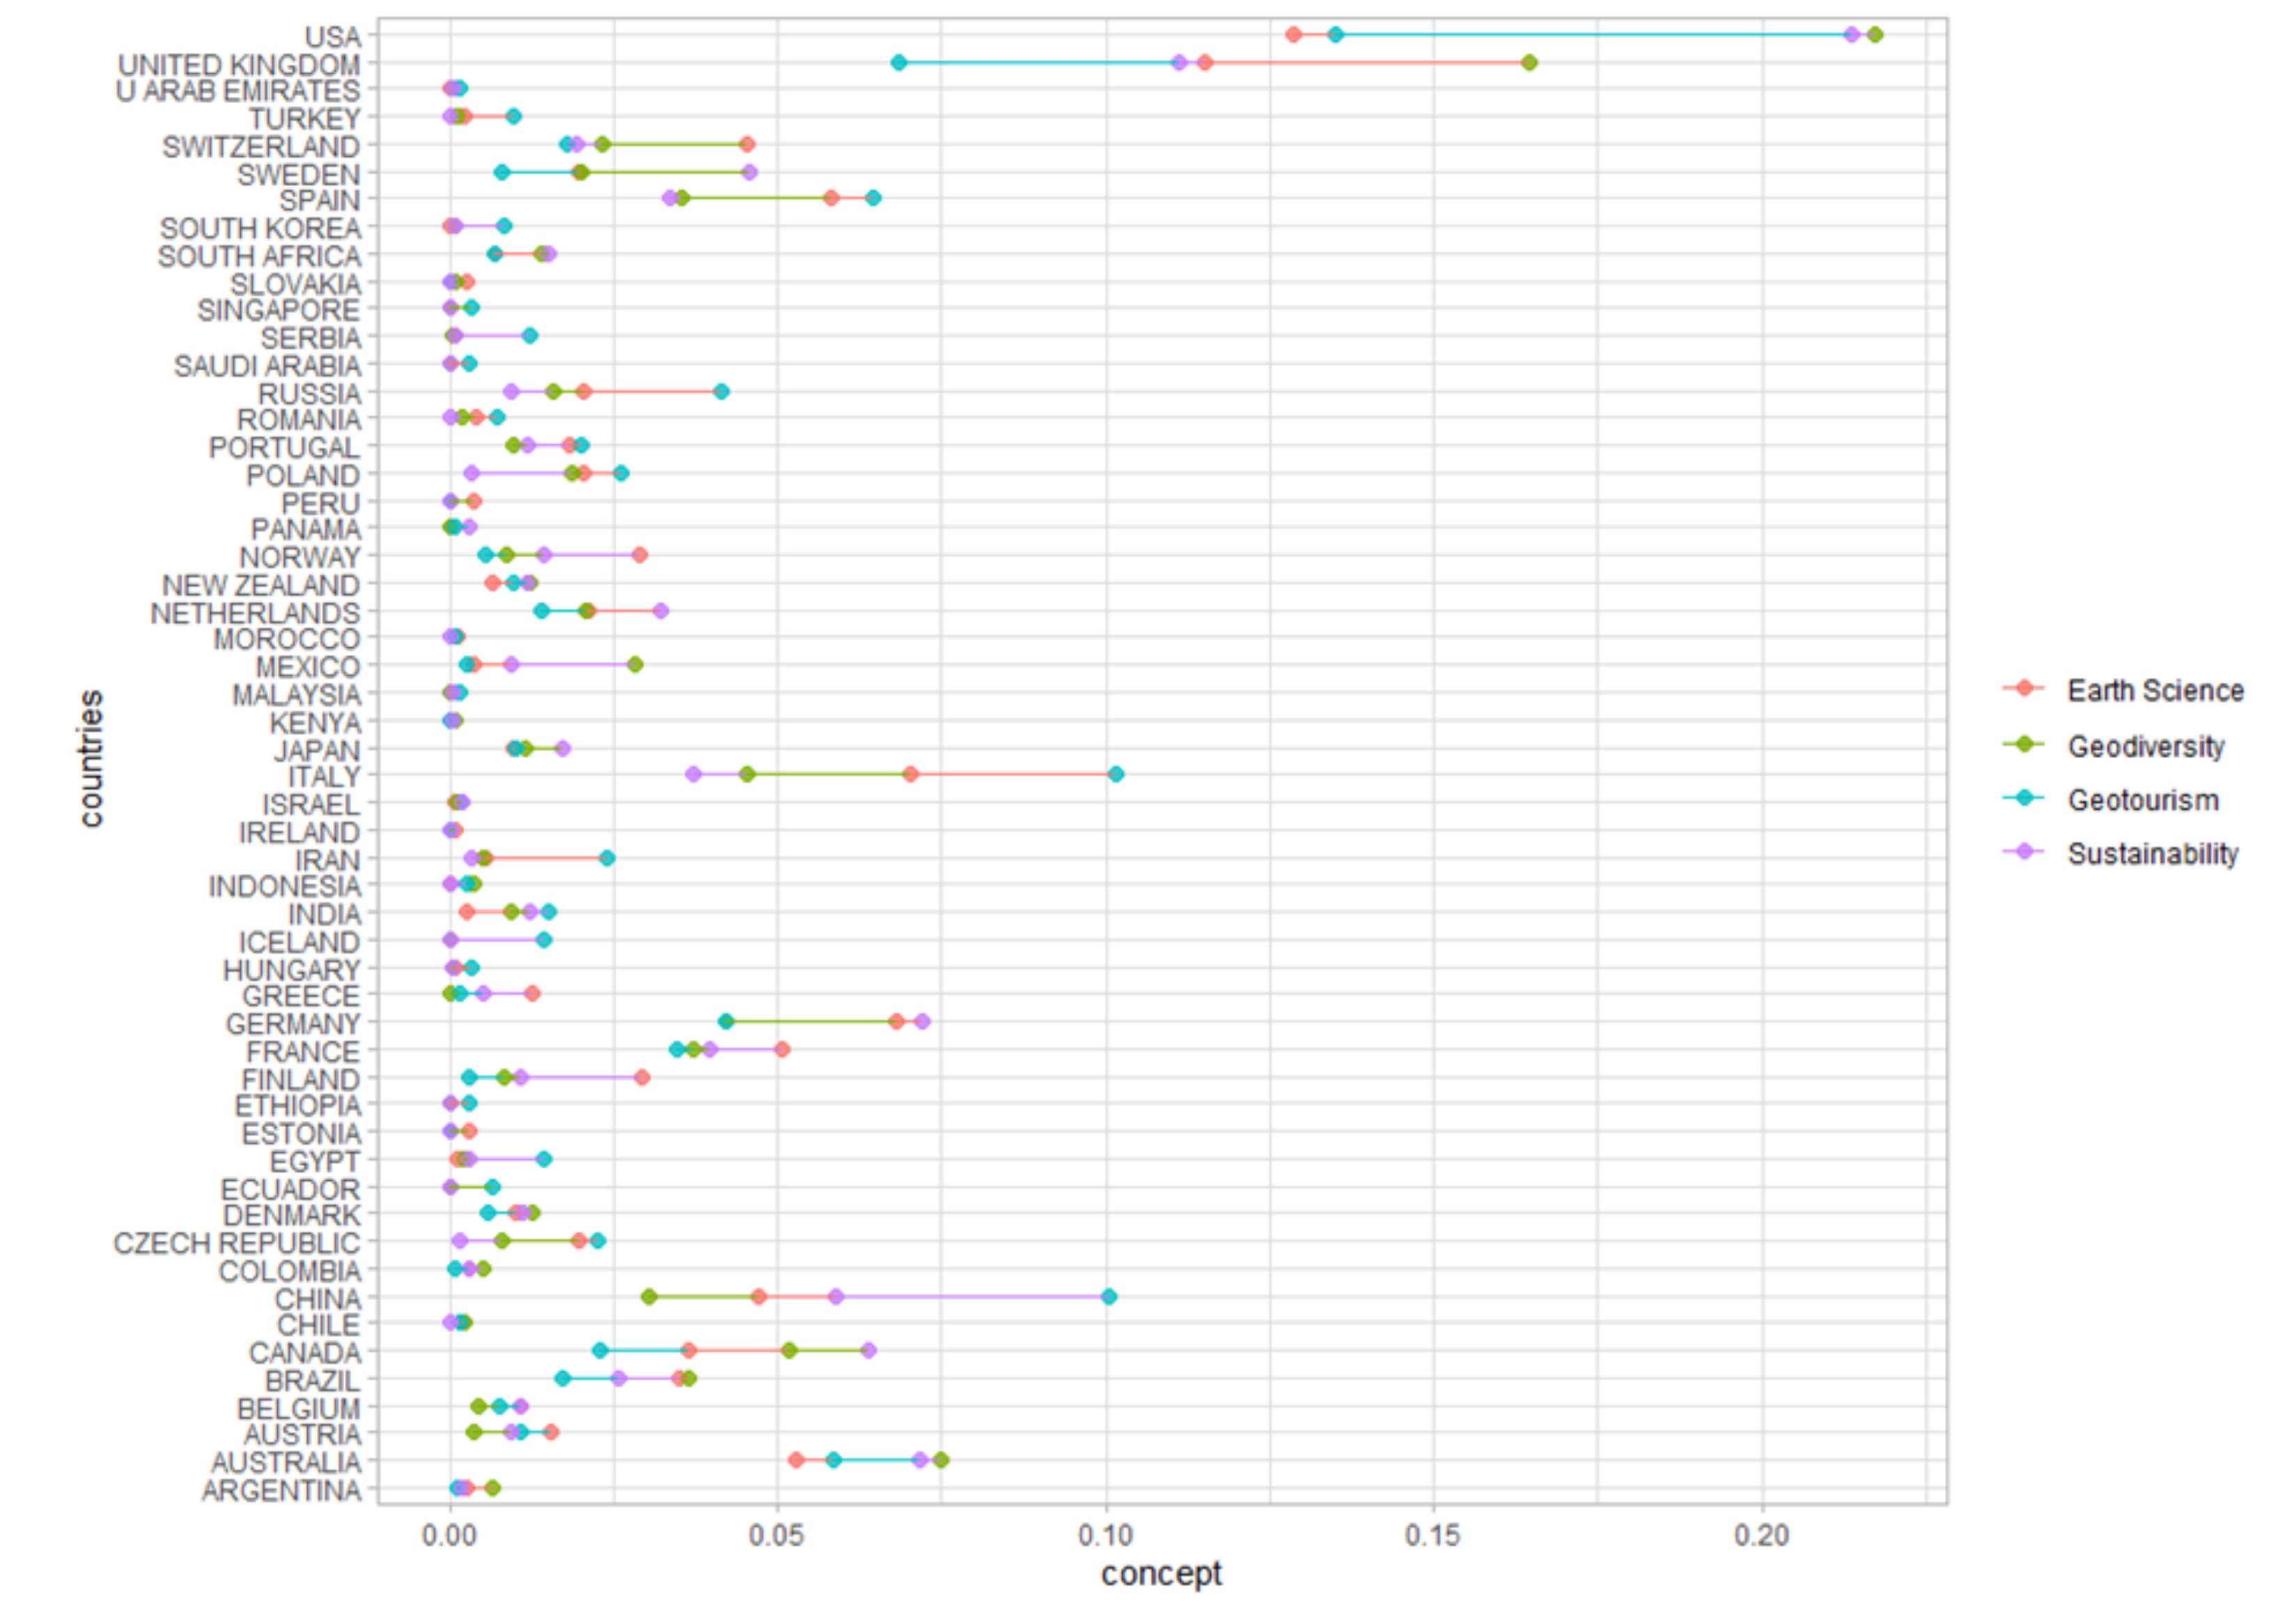
In the scheme of concepts, New Zealand citied geodiversity/biodiversity authors the most. However, Figure 13 suggests the same angle to concepts of sustainability and geotourism. This means environments with complexity, such as Auckland, cannot simply include geoscientific significance in the urban planning agenda, and concepts of existing regulatory frameworks (tourism, biodiversity, sustainability) will have to take over.
The humanitarian governance of Auckland not only allows room for complying to a potential international convention on geoheritage conservation but it is also to shape the outlook of global patterns toward holding diversity of nature and culture in their highest regard.

7. Conclusions

Monitoring and reporting geoheritage conservation changes is essential for effective and long-lasting management. Management of geoheritage conservation is constrained by the absence of an internationally accepted framework. We aimed to relieve constraints by providing connecting links between socio-economic backgrounds and geoheritage conservation. Citation analysis of the most influential academic discourse is a powerful tool for the recognition of countries with elevated interest in geoheritage conservation. The main objective of this study was the comparison of the academic activity and development metrics within these countries to unearth the factors allowing for extensive geoheritage conservation.
The results of the determinant analysis and the metrics research clearly show some key factors determining successful implementation of geoheritage conservation. Indicators derived from geoheritage-related academic activity and world development metrics show patterns towards a shift to other conservation disciplines of strong international agreement on objectives and goals. Socio-economic needs and geographic conditions play strong roles in how and where geoheritage conservation can progress forward. It is also shown that international conventions create the credibility needed for positive decision outcomes that are potentially made at the expense of economic growth.
There is currently no tool to measure and monitor the change in geoheritage conservation. The absence of a framework to quantify the improvement or decay in conservation makes it impossible to carry out credible reporting and applications for conservation. Not all areas face the pressure of rapid geoheritage loss. An area specifically dedicated to protection of biodiversity has associated natural values awaiting recognition, however, geoconservation cannot take place in isolation. Society exploits resources all over the world, and the fate of geoheritage features should not be left to chance. Within and outside of protected, urban, industrial and agricultural areas, geoheritage can be protected without inducing restrictive laws, polices and all type of activities can advance. Additionally, we observed that without the pressure of creating new opportunities or saving rapidly disappearing natural environments, geoheritage interest decreases as well as the enthusiasm to build geoparks. The results show that countries with higher geoheritage interest tend to have a larger protected area network. This is evidence that geoheritage conservation is predominantly taking place in already protected areas. That serves the goal of promoting Earth science in general, but also generates a misconception about opportunity loss when the geoheritage feature is situated in close proximity to development areas.
For a rich understanding of the world, it is important to zoom in and understand how global trends manifest themselves locally in the Auckland Volcanic Field and how local problems relate to global patterns. It is impossible to establish overarching agreement without the acknowledgment of the interdependence of places and the variety of different scales. The identification of relationships between microscale and macroscale phenomena is imperative to solve conservation concerns. New Zealand conservation strategies not only resonate with three out of the four concepts but they also call for further studies to accelerate the pace and scale of sustainable development. Small changes at the local level can result in large differences at the global scale, therefore, locals need to understand not only their place in the big picture but also their crucial role.
This research project has demonstrated the importance of a common goal for implementation strategies in geoheritage conservation. How the identification of geoheritage conservation determinants has the ability to positively influence conservation outlooks at the local scale needs to be analyzed in detail. Further research should take a closer look at the conservation status of geological sites of high geoscientific significance and the geological sites of high cultural and recreational value at the Auckland Volcanic Field. This could influence further success in quality implementation and generate further interest from geoscientists to mediate geoheritage promotion and valorization.

Author Contributions

Conceptualization, B.N. and K.N.; methodology, B.N. and K.N.; validation and formal analysis, B.N.; investigation, B.N., K.N. and J.N.P.; resources, J.N.P.; writing—original draft preparation, B.N.; writing—review and editing, B.N., K.N. and J.N.P.; supervision, K.N. and J.N.P.; project administration, K.N.; funding acquisition, K.N. All authors have read and agreed to the published version of the manuscript.

Funding

This research was funded by GNS-EQC00028—DEVORA Sub-Contract: “GeoHeritage Values in Auckland—Planning and Public Education”. The APC was funded by K. Nemeth and Massey University.

Institutional Review Board Statement

Not applicable.

Informed Consent Statement

Not applicable.

Data Availability Statement

Data available directly from Authors upon request.

Acknowledgments

We gratefully acknowledge funding support from the Determining Volcanic Risk in Auckland (DEVORA) collaborative research program and GNS Science contract GNS-EQC00028—DEVORA Sub-Contract: “GeoHeritage Values in Auckland—Planning and Public Education”. We acknowledge the support by Volcanic Risk Solutions, a multidisciplinary center for applied volcanic hazard and risk management research at Massey University. Our research is aligned with the goals of the UNESCO IGCP 692 “Geoheritage for Geohazard Resilience” project. We thank Ilmars Gravis of The Geoconservation Trust Aotearoa for suggestions that highly improved this manuscript.

Conflicts of Interest

The funders had no role in the design of the study; in the collection, analyses, or interpretation of data; in the writing of the manuscript, or in the decision to publish the results.

References

  1. Hughes, K.; Black, H.R.; Kenyon, N.H. Public Health Nutrition Intervention Management: Determinant Analysis; JobNut Project; Trinity College Dublin: Dublin, Ireland, 2008. [Google Scholar]
  2. Štrba, Ľ. Analysis of Criteria Affecting Geosite Visits by General Public: A Case of Slovak (Geo)Tourists. Geoheritage 2018, 11, 291–300. [Google Scholar] [CrossRef]
  3. Maghsoudi, M.; Moradi, A.; Moradipour, F.; Nezammahalleh, M.A. Geotourism Development in World Heritage of the Lut Desert. Geoheritage 2018, 11, 501–516. [Google Scholar] [CrossRef]
  4. Németh, K.; Moufti, M.R. Geoheritage Values of a Mature Monogenetic Volcanic Field in Intra-continental Settings: Harrat Khaybar, Kingdom of Saudi Arabia. Geoheritage 2017, 9, 311–328. [Google Scholar] [CrossRef]
  5. Poiraud, A.; Chevalier, M.; Claeyssen, B.; Biron, P.-E.; Joly, B. From geoheritage inventory to territorial planning tool in the Vercors massif (French Alps): Contribution of statistical and expert cross approaches. Appl. Geogr. 2016, 71, 69–82. [Google Scholar] [CrossRef]
  6. Sallam, E.S.; Fathy, E.E.; Ruban, D.A.; Ponedelnik, A.A.; Yashalova, N.N. Geological heritage diversity in the Faiyum Oasis (Egypt): A comprehensive assessment. J. Afr. Earth Sci. 2018, 140, 212–224. [Google Scholar] [CrossRef]
  7. Santos, D.S.; Mansur, K.L.; Gonçalves, J.B.; Arruda, E.R.; Manosso, F.C. Quantitative assessment of geodiversity and urban growth impacts in Armação dos Búzios, Rio de Janeiro, Brazil. Appl. Geogr. 2017, 85, 184–195. [Google Scholar] [CrossRef]
  8. Nazaruddin, D.A. Systematic Studies of Geoheritage in Jeli District, Kelantan, Malaysia. Geoheritage 2017, 9, 19–33. [Google Scholar] [CrossRef]
  9. Őrsi, A. Quantifying the geodiversity of a study area in the Great Hungarian Plain. J. Environ. Geogr. 2011, 4, 19–22. [Google Scholar]
  10. Szepesi, J.; Harangi, S.; Ésik, Z.; Tibor, N.; Lukács, R.; Ildikó, S. Volcanic Geoheritage and Geotourism Perspectives in Hungary: A Case of an UNESCO World Heritage Site, Tokaj Wine Region Historic Cultural Landscape, Hungary. Geoheritage 2016, 9, 329–349. [Google Scholar] [CrossRef] [Green Version]
  11. Borcard, D.; Gillet, F.; Legendre, P. Unconstrained Ordination. In Numerical Ecology with R; Springer: New York, NY, USA, 2011; pp. 115–151. [Google Scholar]
  12. Van Wyk de Vries, B.; Byrne, P.; Delcamp, A.; Einarson, P.; Göğüş, O.; Guilbaud, M.-N.; Hagos, M.; Harangi, S.; Jerram, D.; Matenco, L.; et al. A global framework for the Earth: Putting geological sciences in context. Glob. Planet. Chang. 2018, 171, 293–321. [Google Scholar] [CrossRef]
  13. Pereira, D.I.; Pereira, P.; Brilha, J.; Cunha, P.P. The Iberian Massif Landscape and Fluvial Network in Portugal: A geoheritage inventory based on the scientific value. Proc. Geol. Assoc. 2015, 126, 252–265. [Google Scholar] [CrossRef] [Green Version]
  14. De Wever, P.; Alterio, I.; Egoroff, G.; Cornée, A.; Bobrowsky, P.; Collin, G.; Duranthon, F.; Hill, W.; Lalanne, A.; Page, K. Geoheritage, a National Inventory in France. Geoheritage 2015, 7, 205–247. [Google Scholar] [CrossRef] [Green Version]
  15. Djurović, P.; Mirela, Đ. Inventory of Geoheritage Sites—The Base of Geotourism Development in Montenegro. Geogr. Pannonica 2010, 14, 126–132. [Google Scholar] [CrossRef] [Green Version]
  16. Dos Santos, W.F.S.; de Souza Carvalho, I.; Brilha, J.B.; Leonardi, G. Inventory and Assessment of Palaeontological Sites in the Sousa Basin (Paraíba, Brazil): Preliminary Study to Evaluate the Potential of the Area to Become a Geopark. Geoheritage 2016, 8, 315–332. [Google Scholar] [CrossRef] [Green Version]
  17. Fuertes-Gutiérrez, I.; Fernández-Martínez, E. Geosites Inventory in the Leon Province (Northwestern Spain): A Tool to Introduce Geoheritage into Regional Environmental Management. Geoheritage 2010, 2, 57–75. [Google Scholar] [CrossRef]
  18. Hicham, B.; Ahmed, B.; Fatima, T.; Atika, M.; Mohammed, E.Y. Inventory and assessment of geomorphosites for geotourism development: A case study of Aït Bou Oulli valley (Central High-Atlas, Morocco). Area 2018, 50, 331–343. [Google Scholar] [CrossRef]
  19. Díaz-Martínez, E.; Brilha, J.; Brocx, M.; Erikstad, L.; García-Cortés, Á.; Wimbledon, W. Global Geosites: An active and partially achieved geoheritage inventory initiative, waiting to regain official recognition. In Actes du Congres International ‘Les Inventaires du Geopatrimoine‘; Cornee, A., Egoroff, G., de Wever, P., Lalanne, A., Duranthon, F., Eds.; Mémoire hors-série de la Société géologique de France: Paris, France, 2016; pp. 103–108. Available online: https://www.researchgate.net/publication/322628518_Global_Geosites_an_active_and_partially_achieved_geoheritage_inventory_initiative_waiting_to_regain_official_recognition (accessed on 19 May 2021).
  20. Warowna, J.; Zgłobicki, W.; Kołodyńska-Gawrysiak, R.; Gajek, G.; Gawrysiak, L.; Telecka, M. Geotourist values of loess geoheritage within the planned Geopark Małopolska Vistula River Gap, E Poland. Quat. Int. 2016, 399, 46–57. [Google Scholar] [CrossRef]
  21. Pereira, P.; Pereira, D. Methodological guidelines for geomorphosite assessment. Openedition J. 2010, 16, 215–222. [Google Scholar] [CrossRef] [Green Version]
  22. Reynard, E.; Fontana, G.; Kozlik, L.; Scapozza, C. A method for assessing “scientific” and ”additional values" of geomorphosites. Geogr. Helv. 2007, 62, 148–158. [Google Scholar] [CrossRef]
  23. Pralong, J.-P. A method for assessing tourist potential and use of geomorphological sites. Géomorphosites DéfinitionÉvaluation Et Cartogr. 2005, 11, 189–196. [Google Scholar] [CrossRef]
  24. Rybar, P. Assessment of attractiveness (value) of geotouristic objects. Acta Geotouristica 2010, 1, 13–21. [Google Scholar]
  25. Zouros, N.C. Geomorphosite assessment and management in protected areas of Greece Case study of the Lesvos island – coastal geomorphosites. Geogr. Helv. 2007, 62, 169–180. [Google Scholar] [CrossRef]
  26. Serrano, E.; Gonzalez-Trueba, J.J. Assessment of geomorphosites in natural protected areas: The Picos de Europa National Park (Spain). Géomorphologie Relief Process. Environ. 2005, 3, 197–208. [Google Scholar] [CrossRef] [Green Version]
  27. Ibáñez, J.-J.; Brevik, E.C.; Cerdà, A. Geodiversity and geoheritage: Detecting scientific and geographic biases and gaps through a bibliometric study. Sci. Total Environ. 2019, 659, 1032–1044. [Google Scholar] [CrossRef] [PubMed] [Green Version]
  28. Valdez, F. Geoheritage: Obtaining, Explaining and Transmitting Archaeological Knowledge. Int. J. Geoheritage Parks 2018, 6, 86–102. [Google Scholar] [CrossRef]
  29. Bollati, I.; Coratza, P.; Giardino, M.; Laureti, L.; Leonelli, G.; Panizza, M.; Panizza, V.; Pelfini, M.; Piacente, S.; Pica, A.; et al. Directions in Geoheritage Studies: Suggestions from the Italian Geomorphological Community. In Engineering Geology for Society and Territory-Volume 8; Springer: Cham, Switzerland, 2015; Volume 8, pp. 213–217. [Google Scholar]
  30. Ollier, C. Problems of geotourism and geodiversity. Quaest. Geogr. 2012, 31, 57–61. [Google Scholar] [CrossRef] [Green Version]
  31. Mucivuna, V.C.; Reynard, E.; Garcia, M.D.G.M. Geomorphosites Assessment Methods: Comparative Analysis and Typology. Geoheritage 2019, 11, 1799–1815. [Google Scholar] [CrossRef]
  32. Zoderer, B.M.; Tasser, E.; Carver, S.; Tappeiner, U. Stakeholder perspectives on ecosystem service supply and ecosystem service demand bundles. Ecosyst. Serv. 2019, 37, 100938. [Google Scholar] [CrossRef]
  33. Blasius, J.; Greenacre, M. Correspondence Analysis and Related Methdos in Practice. In Multiple Correspondence Analysis and Related Methods; CRC Press: Chapman & Hall/CRC: New York, NY, USA, 2006. [Google Scholar]
  34. Greenacre, M. From simple to Multiple Correspondence Analysis. In Multiple Correspondence Analysis and Related Methods; Chapman & Hall/CRC: Boca Raton, FL, USA, 2006. [Google Scholar]
  35. Hill, M.O. Correspondence Analysis: A Neglected Multivariate Method. J. R. Stat. Soc. Ser. C (Appl. Stat. ) 1974, 23, 340–354. [Google Scholar] [CrossRef]
  36. Ter Braak, C.J.F. Ordination. In Data Analysis in Community and Landscape Ecology; Cambridge University Press: Cambridge, UK, 1995; pp. 91–274. [Google Scholar]
  37. Gray, M. Other nature: Geodiversity and geosystem services. Environ. Conserv. 2011, 38, 271–274. [Google Scholar] [CrossRef] [Green Version]
  38. Gordon, J.E.; Barron, H.F. Geodiversity and ecosystem services in Scotland. Scott. J. Geol. 2013, 49, 41–58. [Google Scholar] [CrossRef] [Green Version]
  39. Austin, M.P. Continuum Concept, Ordination Methods, and Niche Theory. Annu. Rev. Ecol. Syst. 1985, 16, 39–61. [Google Scholar] [CrossRef]
  40. Brocx, M.; Semeniuk, V. Geoheritage and geoconservation - history, definition, scope and scale. J. R. Soc. West. Aust. 2007, 90, 53–87. [Google Scholar]
  41. Burke, M.J.; Borucki, C.C.; Hurley, A.E. Reconceptualizing psychological climate in a retail service environment: A multiple-stakeholder perspective. J. Appl. Psychol. 1992, 77, 717–729. [Google Scholar] [CrossRef]
  42. Bauin, S.; Michelet, B.; Schweighoffer, M.G.; Vermeulin, P. Using bibliometrics in strategic analysis: “understanding chemical reactions” at the CNRS. Scientometrics 1991, 22, 113–137. [Google Scholar] [CrossRef]
  43. Larivière, V.; Ni, C.; Gingras, Y.; Cronin, B.; Sugimoto, C.R. Bibliometrics: Global gender disparities in science. Nat. News 2013, 504, 211. [Google Scholar] [CrossRef]
  44. Derrick, G.E.; Pavone, V. Democratising research evaluation: Achieving greater public engagement with bibliometrics-informed peer review. Sci. Public Policy 2013, 40, 563–575. [Google Scholar] [CrossRef]
  45. Narin, F.; Olivastro, D.; Stevens, K.A. Bibliometrics/Theory, Practice and Problems. Eval. Rev. 1994, 18, 65–76. [Google Scholar] [CrossRef]
  46. Van Leeuwen, T.; Visser, M.; Moed, H.; Nederhof, T.; Van Raan, A. The Holy Grail of science policy: Exploring and combining bibliometric tools in search of scientific excellence. Scientometrics 2003, 57, 257–280. [Google Scholar] [CrossRef]
  47. Chinchilla-Rodríguez, Z.; Zacca-González, G.; Vargas-Quesada, B.; Moya-Anegón, F. Latin American scientific output in Public Health: Combined analysis using bibliometric, socioeconomic and health indicators. Scientometrics 2015, 102, 609–628. [Google Scholar] [CrossRef] [Green Version]
  48. Borgman, C.L.; Furner, J. Scholarly communication and bibliometrics. Annu. Rev. Inf. Sci. Technol. 2002, 36, 1–53. [Google Scholar] [CrossRef] [Green Version]
  49. Kubalíková, L. Geomorphosite assessment for geotourism purposes. Czech J. Tour. 2013, 2, 80. [Google Scholar] [CrossRef]
  50. Štrba, L.u.; Rybár, P.; Baláž, B.; Molokáč, M.; Hvizdák, L.; Kršák, B.; Lukáč, M.; Muchová, L.; Tometzová, D.; Ferenčíková, J. Geosite assessments: Comparison of methods and results. Curr. Issues Tour. 2015, 18, 496–510. [Google Scholar] [CrossRef]
  51. Németh, B.; Németh, K.; Procter, J.N.; Farrelly, T. Geoheritage Conservation: Systematic Mapping Study for Conceptual Synthesis. Geoheritage 2021, 13, 45. [Google Scholar] [CrossRef]
  52. Gray, M.; Gordon, J.E.; Brown, E.J. Geodiversity and the ecosystem approach: The contribution of geoscience in delivering integrated environmental management. Proc. Geol. Assoc. 2013, 124, 659–673. [Google Scholar] [CrossRef]
  53. Anderson, M.G.; Ferree, C.E. Conserving the Stage: Climate Change and the Geophysical Underpinnings of Species Diversity. PLoS ONE 2010, 5, e11554. [Google Scholar] [CrossRef]
  54. Brilha, J. Inventory and Quantitative Assessment of Geosites and Geodiversity Sites: A Review. Geoheritage 2016, 8, 119–134. [Google Scholar] [CrossRef] [Green Version]
  55. Crofts, R. Putting Geoheritage Conservation on All Agendas. Geoheritage 2018, 10, 231–238. [Google Scholar] [CrossRef]
  56. Patrick, J.; McKeever, N.; Zouros, N.; Patzak, M. The UNESCO Global Network of Geoparks. In Geoparks: Think Outside the Park; Bailey, H., Hill, W., Eds.; George Wright Society: West Yellowstone, MT, USA, 2010. [Google Scholar]
  57. OECD—The Organisation for Economic Co-operation and Development; Gurría, A. Managing Globalisation and the Role of the OECD by Gurría, Secretary-General of the OECD. Available online: https://www.oecd.org/corruption/managingglobalisationandtheroleoftheoecd.htm (accessed on 10 September 2020).
  58. Mead, H. Tikanga Māori: Living by Māori Values; Huia Publishers and Te Whare Wananga o Awanuiarangi: Wellington, New Zealand, 2003; p. 398. [Google Scholar]
  59. Hayward, B.W.; Murdoch, G.; Maitland, G. Volcanoes of Auckland, The Essential Guide; Auckland University Press: Auckland, New Zealand, 2011. [Google Scholar]
  60. Hopkins, J.L.; Smid, E.R.; Eccles, J.D.; Hayes, J.L.; Hayward, B.W.; McGee, L.E.; van Wijk, K.; Wilson, T.M.; Cronin, S.J.; Leonard, G.S.; et al. Auckland Volcanic Field magmatism, volcanism, and hazard: A review. N. Z. J. Geol. Geophys. 2020, 1–22. [Google Scholar] [CrossRef]
  61. Holdgate, M.W. Our Common Future: The Report of the World Commission on Environment and Development; Oxford University Press: Oxford, UK; New York, NY, USA, 1987; Volume 14, p. 282. [Google Scholar]
  62. Lélé, S.M. Sustainable development: A critical review. World Dev. 1991, 19, 607–621. [Google Scholar] [CrossRef]
  63. Griggs, D.; Stafford-Smith, M.; Gaffney, O.; Rockström, J.; Öhman, M.C.; Shyamsundar, P.; Steffen, W.; Glaser, G.; Kanie, N.; Noble, I. Sustainable development goals for people and planet. Nature 2013, 495, 305–307. [Google Scholar] [CrossRef] [PubMed]
  64. Sachs, J.D. The Age of Sustainable Development; Columbia University Press: New York, NY, USA, 2015. [Google Scholar]
  65. Pearce, D.; Barbier, E.; Markandya, A. Sustainable Development: Economics and Environment in the Third World; Routledge: London, UK, 2013. [Google Scholar]
  66. Nilsson, M.; Griggs, D.; Visbeck, M. Policy: Map the interactions between Sustainable Development Goals. Nature 2016, 534, 320–322. [Google Scholar] [CrossRef] [PubMed]
  67. Ghai, D.; Vivian, J.M. Grassroots Environmental Action: People’s Participation in Sustainable Development; Routledge: London, UK, 2014. [Google Scholar]
  68. Vejre, H.; Jensen, F.S.; Thorsen, B.J. Demonstrating the importance of intangible ecosystem services from peri-urban landscapes. Ecol. Complex. 2010, 7, 338–348. [Google Scholar] [CrossRef]
  69. Loorbach, D. Transition Management for Sustainable Development: A Prescriptive, Complexity-Based Governance Framework. Governance 2010, 23, 161–183. [Google Scholar] [CrossRef]
  70. Lazzari, M.; Aloia, A. Geoparks, geoheritage and geotourism: Opportunities and tools in sustainable development of the territory. Geoj. Tour. Geosites 2014, 13, 8–9. [Google Scholar]
  71. López-Gamero, M.D.; Zaragoza-Sáez, P.; Claver-Cortés, E.; Molina-Azorín, J.F. Sustainable development and intangibles: Building sustainable intellectual capital. Bus. Strategy Env.. 2011, 20, 18–37. [Google Scholar] [CrossRef]
  72. Roders, A.P.; van Oers, R. Bridging cultural heritage and sustainable development. J. Cult. Herit. Manag. Sustain. Dev. 2011, 1, 5–14. [Google Scholar] [CrossRef]
  73. Wimbledon, W.A.; Smith-Meyer, S. Geoheritage in Europe and Its Conservation; ProGEO Noruega: Oslo, Norway, 2012; Volume 405. [Google Scholar]
  74. UNITED NATIONS OFFICE FOR DISASTER RISK REDUCTION (UNDRR). Sendai Framework for Disaster Risk Reduction 2015–2030. Available online: https://www.preventionweb.net/publications/view/43291 (accessed on 31 August 2020).
  75. New Urban Agenda. Habitat III Secretariat, A/RES/71/256. Available online: http://habitat3.org/the-new-urban-agenda/ (accessed on 31 August 2020).
  76. New Zealand Geopreservation Inventory. Available online: http://www.geomarine.org.nz/NZGI/https://services.main.net.nz/geopreservation/ (accessed on 1 June 2020).
  77. Te Ahukaramū Charles Royal. ‘First Peoples in Māori Tradition’, Te Ara—The Encyclopedia of New Zealand. Available online: http://www.TeAra.govt.nz/en/first-peoples-in-maori-tradition (accessed on 31 August 2020).
  78. Taonui, R. Tribal Organization—The History of Māori Social Organisation. Te Ara—the Encyclopedia of New Zealand. Available online: http://www.TeAra.govt.nz/en/tribal-organisation/page-6 (accessed on 31 August 2020).
  79. Auckland Governance Reforms. Spatial Planning Options for the Auckland Council. In Cabinet Comittee on Implementation of Auckland Governance Reforms; Ministry for the Environment: Wellington, New Zealand, 2009. Available online: https://environment.govt.nz/more/cabinet-papers-and-related-material-search/cabinet-papers/auckland-governance-reform/spatial/ (accessed on 6 November 2020).
  80. Resource Management Act. Resource Management Act No 69 (as at 29 October 2019); Public Act—New Zealand Legislation: Wellington, New Zealand, 1991. Available online: https://www.legislation.govt.nz/act/public/1991/0069/latest/DLM230265.html (accessed on 1 June 2020).
  81. New Zealand Coastal Policy Statement. Replaces New Zealand Coastal Policy Statement 1994; New Zealand Department of Conservation: Wellington, New Zealand, 2010.
  82. Okubo, Y. Bibliometric Indicators and Analysis of Research Systems: Methods and Examples; OECD Science, Technology and Industry Working Papers, No. 1997/01; OECD Publishing: Paris, France, 1997. [Google Scholar] [CrossRef]
  83. Merigó, J.M.; Gil-Lafuente, A.M.; Yager, R.R. An overview of fuzzy research with bibliometric indicators. Appl. Soft Comput. 2015, 27, 420–433. [Google Scholar] [CrossRef]
  84. Durieux, V.; Gevenois, P.A. Bibliometric indicators: Quality measurements of scientific publication. Radiology 2010, 255, 342–351. [Google Scholar] [CrossRef]
  85. Van Raan, A.F. Comparison of the Hirsch-index with standard bibliometric indicators and with peer judgment for 147 chemistry research groups. Scientometrics 2006, 67, 491–502. [Google Scholar] [CrossRef]
  86. Scopus. Available online: https://0-www-scopus-com.brum.beds.ac.uk/ (accessed on 1 February 2021).
  87. Web of Science. Available online: https://0-apps-webofknowledge-com.brum.beds.ac.uk/. (accessed on 15 July 2020).
  88. SCImago, n.d.S. SCImago Journal & Country Rank [Portal]. Available online: http://www.scimagojr.com (accessed on 15 July 2020).
  89. Yale Center for Environmental Law + Policy—YCELP—Yale University; Center for International Earth Science Information Network—CIESIN—Columbia University; World Economic Forum—WEF; Joint Research Centre—JRC—European Commission. 2012 Environmental Performance Index and Pilot Trend Environmental Performance Index. 2012. Available online: https://sedac.ciesin.columbia.edu/data/set/epi-environmental-performance-index-pilot-trend-2012/docs (accessed on 15 August 2020).
  90. World Bank. World development indicators Washington, DC: Development Data Group, The World Bank. Available online: http://datatopics.worldbank.org/world-development-indicators/ (accessed on 31 August 2020).
  91. European Environment Agency. Indicator Assessment. Land Take. Available online: https://www.eea.europa.eu/data-and-maps/indicators/land-take-2/assessment-12017 (accessed on 31 July 2020).
  92. European Environment Agency. Indicator Assessment. Land take in Europe. Available online: https://www.eea.europa.eu/data-and-maps/indicators/land-take-3/assessment (accessed on 31 July 2020).
  93. Razmjoo, A. Investigating energy sustainability indicators for developing countries. Int. J. Sustain. Energy Plann. Manag. 2019, 21, 59–76. [Google Scholar]
  94. Kong, Q.; Peng, D.; Ni, Y.; Jiang, X.; Wang, Z. Trade openness and economic growth quality of China: Empirical analysis using ARDL model. Finance Res. Lett. 2020, 38, 101488. [Google Scholar] [CrossRef]
  95. Obeid, R.; Awad, D.B. The Effect of Trade Openness on Economic Growth in Jordan: An Analytical Investigation (1992-2015). Int. J. Econ. Financ. Issues 2018, 8, 219. [Google Scholar]
  96. Beeton, S. Chapter 6—Rural tourism communities. In Community Development through Tourism; Landlinks Press: Collingwood, Australia, 2006; p. 258. [Google Scholar]
  97. Cronbach, L. Coefficient alpha and the internal structure of tests. Psychometrika 1951, 16, 297–334. [Google Scholar] [CrossRef] [Green Version]
  98. Deschamps, R.; Programming Historian. Correspondence Analysis for Historical Research with R. Available online: https://0-doi-org.brum.beds.ac.uk/10.46430/phen0062 (accessed on 31 August 2020).
  99. Costa, P.S.; Santos, N.C.; Cunha, P.; Cotter, J.; Sousa, N. The Use of Multiple Correspondence Analysis to Explore Associations between Categories of Qualitative Variables in Healthy Ageing. J. Aging. Res. 2013, 2013, 302163. [Google Scholar] [CrossRef] [PubMed]
  100. Iddrisu, I.; Bhattacharyya, S.C. Sustainable Energy Development Index: A multi-dimensional indicator for measuring sustainable energy development. Renew. Sustain. Energy Rev. 2015, 50, 513–530. [Google Scholar] [CrossRef] [Green Version]
  101. Wimbledon, W.A.P. GEOSITES—A new conservation initiative. Epis. Newsmag. Int. Union Geol. Sci. 1996, 19, 87–88. [Google Scholar] [CrossRef] [Green Version]
  102. Panizza, M. Geomorphosites: Concepts, methods and examples of geomorphological survey. Chin. Sci. Bull. 2001, 46, 4–5. [Google Scholar] [CrossRef]
  103. Hirsch, J.E. An index to quantify an individual’s scientific research output. Proc. Natl. Acad. Sci. USA 2005, 102, 16569–16572. [Google Scholar] [CrossRef] [Green Version]
  104. Lepori, B.; Geuna, A.; Mira, A. Scientific output scales with resources. A comparison of US and European universities. PLoS ONE 2019, 14, e0223415. [Google Scholar] [CrossRef] [Green Version]
  105. Böhringer, C.; Jochem, P.E.P. Measuring the immeasurable—A survey of sustainability indices. Ecol. Econ. 2007, 63, 1–8. [Google Scholar] [CrossRef] [Green Version]
  106. Jones, C. History of Geoparks. Geol. Soc. Lond. Specaial Publ. 2008, 300, 273–277. [Google Scholar] [CrossRef]
  107. Williams, M.; McHenry, M.; Boothroyd, A. Geoconservation and Geotourism: Challenges and Unifying Themes. Geoheritage 2020, 12, 63. [Google Scholar] [CrossRef]
  108. Catana, M.M.; Brilha, J.B. The Role of UNESCO Global Geoparks in Promoting Geosciences Education for Sustainability. Geoheritage 2020, 12, 1. [Google Scholar] [CrossRef]
  109. Taber, K.S. The Use of Cronbach’s Alpha When Developing and Reporting Research Instruments in Science Education. Research in Science Education 2018, 48, 1273–1296. [Google Scholar] [CrossRef]
  110. Kong, W.; Li, Y.; Li, K.; Chen, M.; Peng, Y.; Wang, D.; Chen, L. Urban Geoheritage Sites Under Strong Anthropogenic Pressure: Example from the Chaohu Lake Region, Hefei, China. Geoheritage 2020, 12, 77. [Google Scholar] [CrossRef]
  111. Fio Firi, K.; Maričić, A. Usage of the Natural Stones in the City of Zagreb (Croatia) and Its Geotouristical Aspect. Geoheritage 2020, 12, 62. [Google Scholar] [CrossRef]
  112. Dowling, R. New Zealand: A diverse array of geotourism resources. In Handbook of Geotourism; Dowling, R.K., Newsome, D., Eds.; Edward Elgar Publishing: Cheltenham, UK, 2018. [Google Scholar]
  113. Migoń, P.; Pijet-Migoń, E. Geoconservation and tourism at geothermal sites–lessons learnt from the Taupo Volcanic Zone, New Zealand. Proc. Geol. Assoc. 2016, 127, 413–421. [Google Scholar] [CrossRef]
  114. Waitaki District Council. Waitaki Whitestone Geopark—UNESCO Global Geopark Expression of Interest Application 2018. Available online: https://www.waitaki.govt.nz/Documents/UNESCO%20GGP%20EoI%20WWGP.pdf20018 (accessed on 1 December 2020).
  115. OECD—The Organisation for Economic Co-operation and Development. Tourism Trends and Policies, 2020; OECD: Paris, France, 2014. [Google Scholar]
  116. Gravis, I.; Németh, K.; Procter, J.N. The Role of Cultural and Indigenous Values in Geosite Evaluations on a Quaternary Monogenetic Volcanic Landscape at Ihumātao, Auckland Volcanic Field, New Zealand. Geoheritage 2017, 9, 373–393. [Google Scholar] [CrossRef]
  117. Gravis, I.; Németh, K.; Twemlow, C.; Németh, B. The Case for Community-Led Geoheritage and Geoconservation Ventures in Māngere, South Auckland, and Central Otago, New Zealand. Geoheritage 2020, 12, 19. [Google Scholar] [CrossRef]
  118. The Auckland Plan. In The Aucklan Plan 2050; Strategy and Research Department: Auckland Council, New Zealand, 2018. Available online: https://www.aucklandcouncil.govt.nz/plans-projects-policies-reports-bylaws/our-plans-strategies/auckland-plan/Pages/default.aspx (accessed on 31 August 2020).
  119. Auckland Conservation Management Strategy. Auckland Conservation Management Strategy (CMS) 2014–2020; 2014; Volume I. Available online: https://www.doc.govt.nz/about-us/our-policies-and-plans/statutory-plans/statutory-plan-publications/conservation-management-strategies/auckland/ (accessed on 1 September 2020).
Figure 1. Flowchart of research process.
Land 10 00539 g001
Figure 2. Background fields of the 47 authors most influencing the conceptual evolution of geoheritage conservation.
Land 10 00539 g002
Figure 3. Cumulative citations (Y-axis) of the 47 authors since 1991. The citation number includes citations for all their published and co-published material available in the Scopus online database.
Land 10 00539 g003
Figure 4. The three columns display the countries extracted through the bibliometric analysis. All columns are rankings according to their scientific output (1) in all scientific subject areas from SCImago, (2) in Earth science and (3) in geoheritage (third column). The width of the arrows is proportional to the flow rate. For detailed explanation, please refer to the main text.
Land 10 00539 g004
Figure 5. The chart depicts relationships between the main background subjects of citing articles and the four main concepts of geoheritage conservation. Concept 1 = Earth science focus, Concept 2 = Geodiversity–biodiversity-aligned conservation, Concept 3 = Geotourism, Concept 4 = Sustainability.
Land 10 00539 g005
Figure 6. This figure provides information on the relation of the origin countries of citing articles and the four different concepts. The dots indicate the normalized value of citations generated by the country for the different concepts. For detailed explanation, please refer to the main text.
Land 10 00539 g006
Figure 7. (a) Number of geoparks per country in the year 2020. (b) Percentage of protected areas per total area of each country in the year 2020.
Land 10 00539 g007
Figure 8. The matrix is built up by the correlation coefficient values of each indicator to detect the level to which they affect one another. The coefficient is based on their variance for all the studied countries. Indicators of academic output are marked with (A), geographic data are marked with (G), world development statistics are marked with (W).
Land 10 00539 g008
Figure 9. Correspondence analysis ordination diagram of the first two axes with countries (gray) and indicators (red); ellipsoids illustrate the three identified indicator bundles.
Land 10 00539 g009
Figure 10. Individual factor map. The chart breaks down the relationship of values with the origin countries of citing articles separately for each indicator. None of the indicators create well-distinguished clusters of the countries (represented by dots), meaning none of the indicators alone influenced the course of geoheritage conservation.
Land 10 00539 g010
Figure 11. Biplot of the first two axes of the multiple correspondence analysis (MCA) illustrating the categories of the three identified indicator bundles with their associations with the four geoheritage concepts. The categories show the highest variation within the first concept.
Land 10 00539 g011
Figure 12. Cumulative number of geoparks in the world. The X-axis represents the year the geopark was established.
Land 10 00539 g012
Figure 13. MCA factor map of the concepts and their positions in New Zealand. The angle between row points and the central point of confidence ellipsoids gives a measure of their correlation. The farther the angle is from 90°, the closer the relations are.
Land 10 00539 g013
Table 1. H-index of the authors listed according to their country of affiliation in 2020.
Σ AuthorsH-Index of Each Author
United Kingdom12 17 17 1 21 12 6 10 15 3 3 522
United States812171281081415
Australia676120166
Italy42214132113
Poland36412
Spain312418
Iran265
Netherlands2186
Brazil12
Canada18
China12
Czech Republic16
Finland124
France13
Germany11
Greece113
Iceland113
Norway112
Portugal114
Russian Federation118
Slovakia18
Sweden198
Switzerland118
Table 2. Indicators to measure geoheritage effectiveness. Values were scaled from 1 to 5 to standardize the different data types for further statistical analysis.
Indicators1 (Very Low)2 (Low)3 (Medium)4 (High)5 (Very High)
Population (million)<77–2020–100 100–3301300–1500
Urban population (% of total population)<3535–5555–7575–9090–100
Urban population growth (annual %)<00–11–22–3>3
Urban land (% of total)<55–1010–2020–30>30
Population density<1515–5050–100100–500>500
International tourism, receipts (% of GDP)<11–2.52.5–5.55.5–9.0>9
GDP per capita (thousand USD)<1010–2525–5050–70>70
Trade openness<3535–6060–100100–200>200
Tourist arrivals (per 1000 people)<7575–400400–10001000–2500>2500
Tourist density<1010–8080–200200–300>300
Total land (thousand km2)<5050–300300–10001000–5000>5000
Protected areas (%)<77–1515–2525–3535–40
No of geoparksnone1–23–78–20>20
Geoheritage citing papers<5050–400400–15001500–500>5000
Documents in Earth science<5 5 -2020–100100–200>200
Table 3. CA dimension discrimination measures.
IndicatorsDim 1Dim 2Dim 3
Population−0.387−0.0030.172
Urban population0.029−0.007−0.158
Urban population growth (%)−0.219−0.2910.094
Urban land (% of total)0.2750.2620.155
Total land (km2)−0.459−0.065−0.069
Protected areas (% of total)0.0430.008−0.008
Population density0.0890.0020.29
International tourism receipts0.13−0.259−0.063
No. of geoparks−0.0090.1490.094
GDP per capita0.1030.001−0.132
Trade openness 0.198−0.1170.008
Geoheritage citations−0.190.322−0.167
Documents in Earth science−0.1630.252−0.05
Tourist arrivals0.263−0.097−0.148
Tourist density0.3540.0720.105
Table 4. Identified indicator bundles.
Population BundleTourism Industry Bundle Geoheritage Bundle
Total land (km2)Trade openness Geoheritage citations
PopulationTourist arrivalsDocuments in Earth science
Urban population growth (%)Tourist densityNo. of geoparks
Population densityInternational tourism receiptsProtected areas
Urban land (% of total)Urban land (% of total)Urban population
Geoheritage citations Urban land (% of total)
Tourist arrivals
Table 5. Categories of indicators for multiple correspondence analysis.
IndicatorsCategories of Indicators
Concept (supplementary var.)Earth scienceGeodiversityGeotourismSustainability
Urban population ruralurban
Urban population growth negativenegligibleprominent
Protected areas <15>15
Population densityscattered tourismconcentrated tourism
International tourism, receiptssmall tourism sharelarge tourism share
No. of geoparksnoyes
Trade opennessclosed marketopen market
Geoheritage citationsfew geoheritage citationsmany geoheritage citations
Tourist arrivalssmaller number of arrivalslarge number of arrivals
Tourist densityscattered tourismconcentrated tourism
Total land smallmediumbig
Earth science outputless significantsignificant
Table 6. MCA dimension discrimination measures.
CategoriesDim 1Dim 2Dim 3
no−0.6914−0.21107−0.61507
yes0.406690.1241560.361807
<15−0.57620.036882−0.36361
>150.39613−0.025360.249981
big−1.21910.095424−0.06502
medium0.314530.7108950.710553
small0.70959−0.50325−0.38445
many geoheritage citations−0.04451.0695250.241772
few geoheritage citations0.02619−0.62913−0.14222
less significant0.0419−0.4205−0.09211
significant−0.13211.3261970.290501
rural−0.1355−0.846141.133691
urban0.042960.26829−0.35946
negligible0.668070.588311−0.02177
negative0.25884−1.343252.138608
prominent−0.4081−0.16302−0.25508
high population density0.531480.264942−2.26671
higher population density0.38636−0.132510.295789
sparsely populated−0.7270.202258−0.27514
closed market−1.0347−0.17118−0.01041
open market0.561720.0929290.005654
large tourism share0.48245−0.68441−0.1501
small tourism share−0.3070.4355350.09552
large number of arrivals0.870860.061819−0.40836
smaller number of arrivals−0.6461−0.045870.302975
concentrated tourism1.0915780.227105−0.36497
scattered tourism−0.50154−0.104350.16769
Table 7. Determinants of concepts derived from MCA.
GeodiversitySustainabilityEarth ScienceGeotourism
“No” for geoparkmany geoheritage citationsopen marketrural population
sparsely populated countriessignificant Earth science outputlarge number of arrivalssmaller number of arrivals
small tourism sharesmall tourism shareconcentrated tourismnegative urban growth
lower number of arrivalsurban populationsmall total landmedium land
big landmedium land“Yes” for geopark“Yes” for geopark
prominent urban population growthnegligible urban population growth>15% protected area>15 protected areas
scattered tourism higher population density
closed market large tourism share
<15% protected areas
Publisher’s Note: MDPI stays neutral with regard to jurisdictional claims in published maps and institutional affiliations.

