Comparison of the Spatial Wind Erosion Patterns of Erosion Risk Mapping and Quantitative Modeling in Eastern Austria

 , , and
Abstract
:
1. Introduction
- (i)
- assess the spatial and temporal pattern of wind erosion risk for a selected study area in eastern Austria;
- (ii)
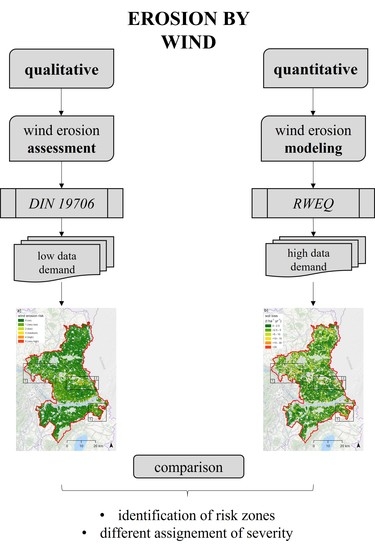
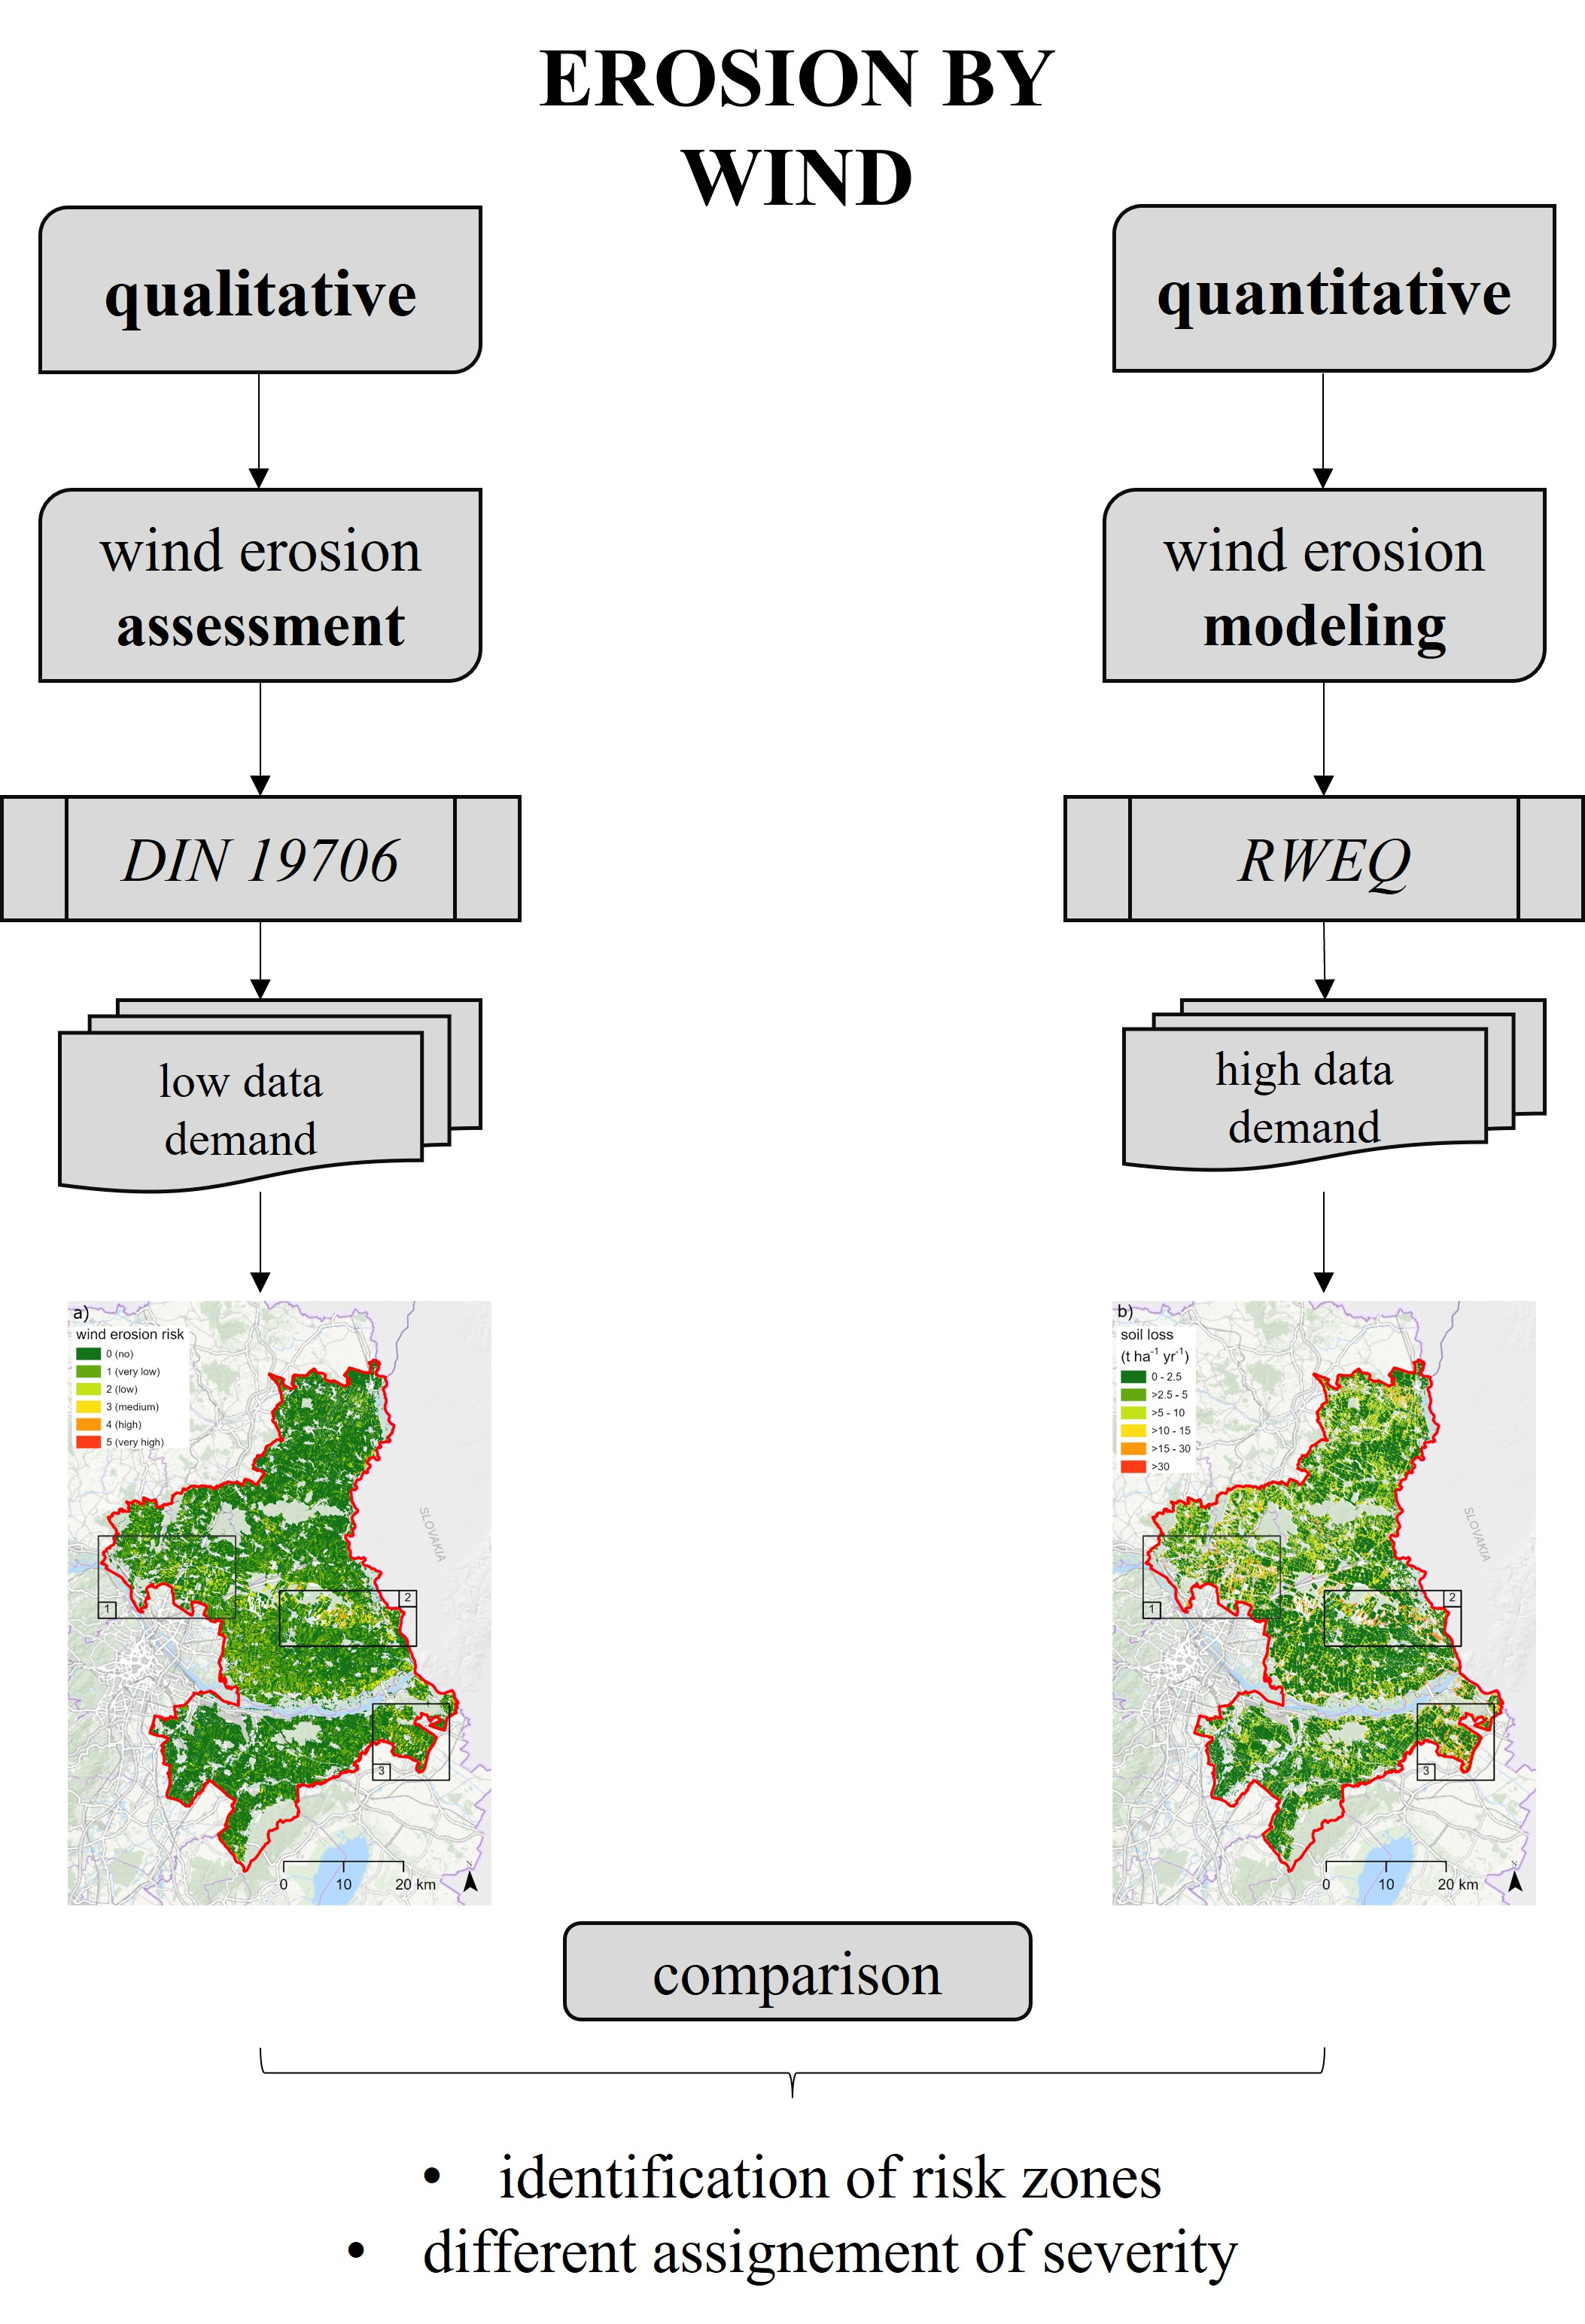
- discuss the validity of wind erosion assessment based on DIN 19706 and compare to the modeling results of RWEQ;
- (iii)
- discuss different classification schemes for soil erosion.
2. Materials and Methods
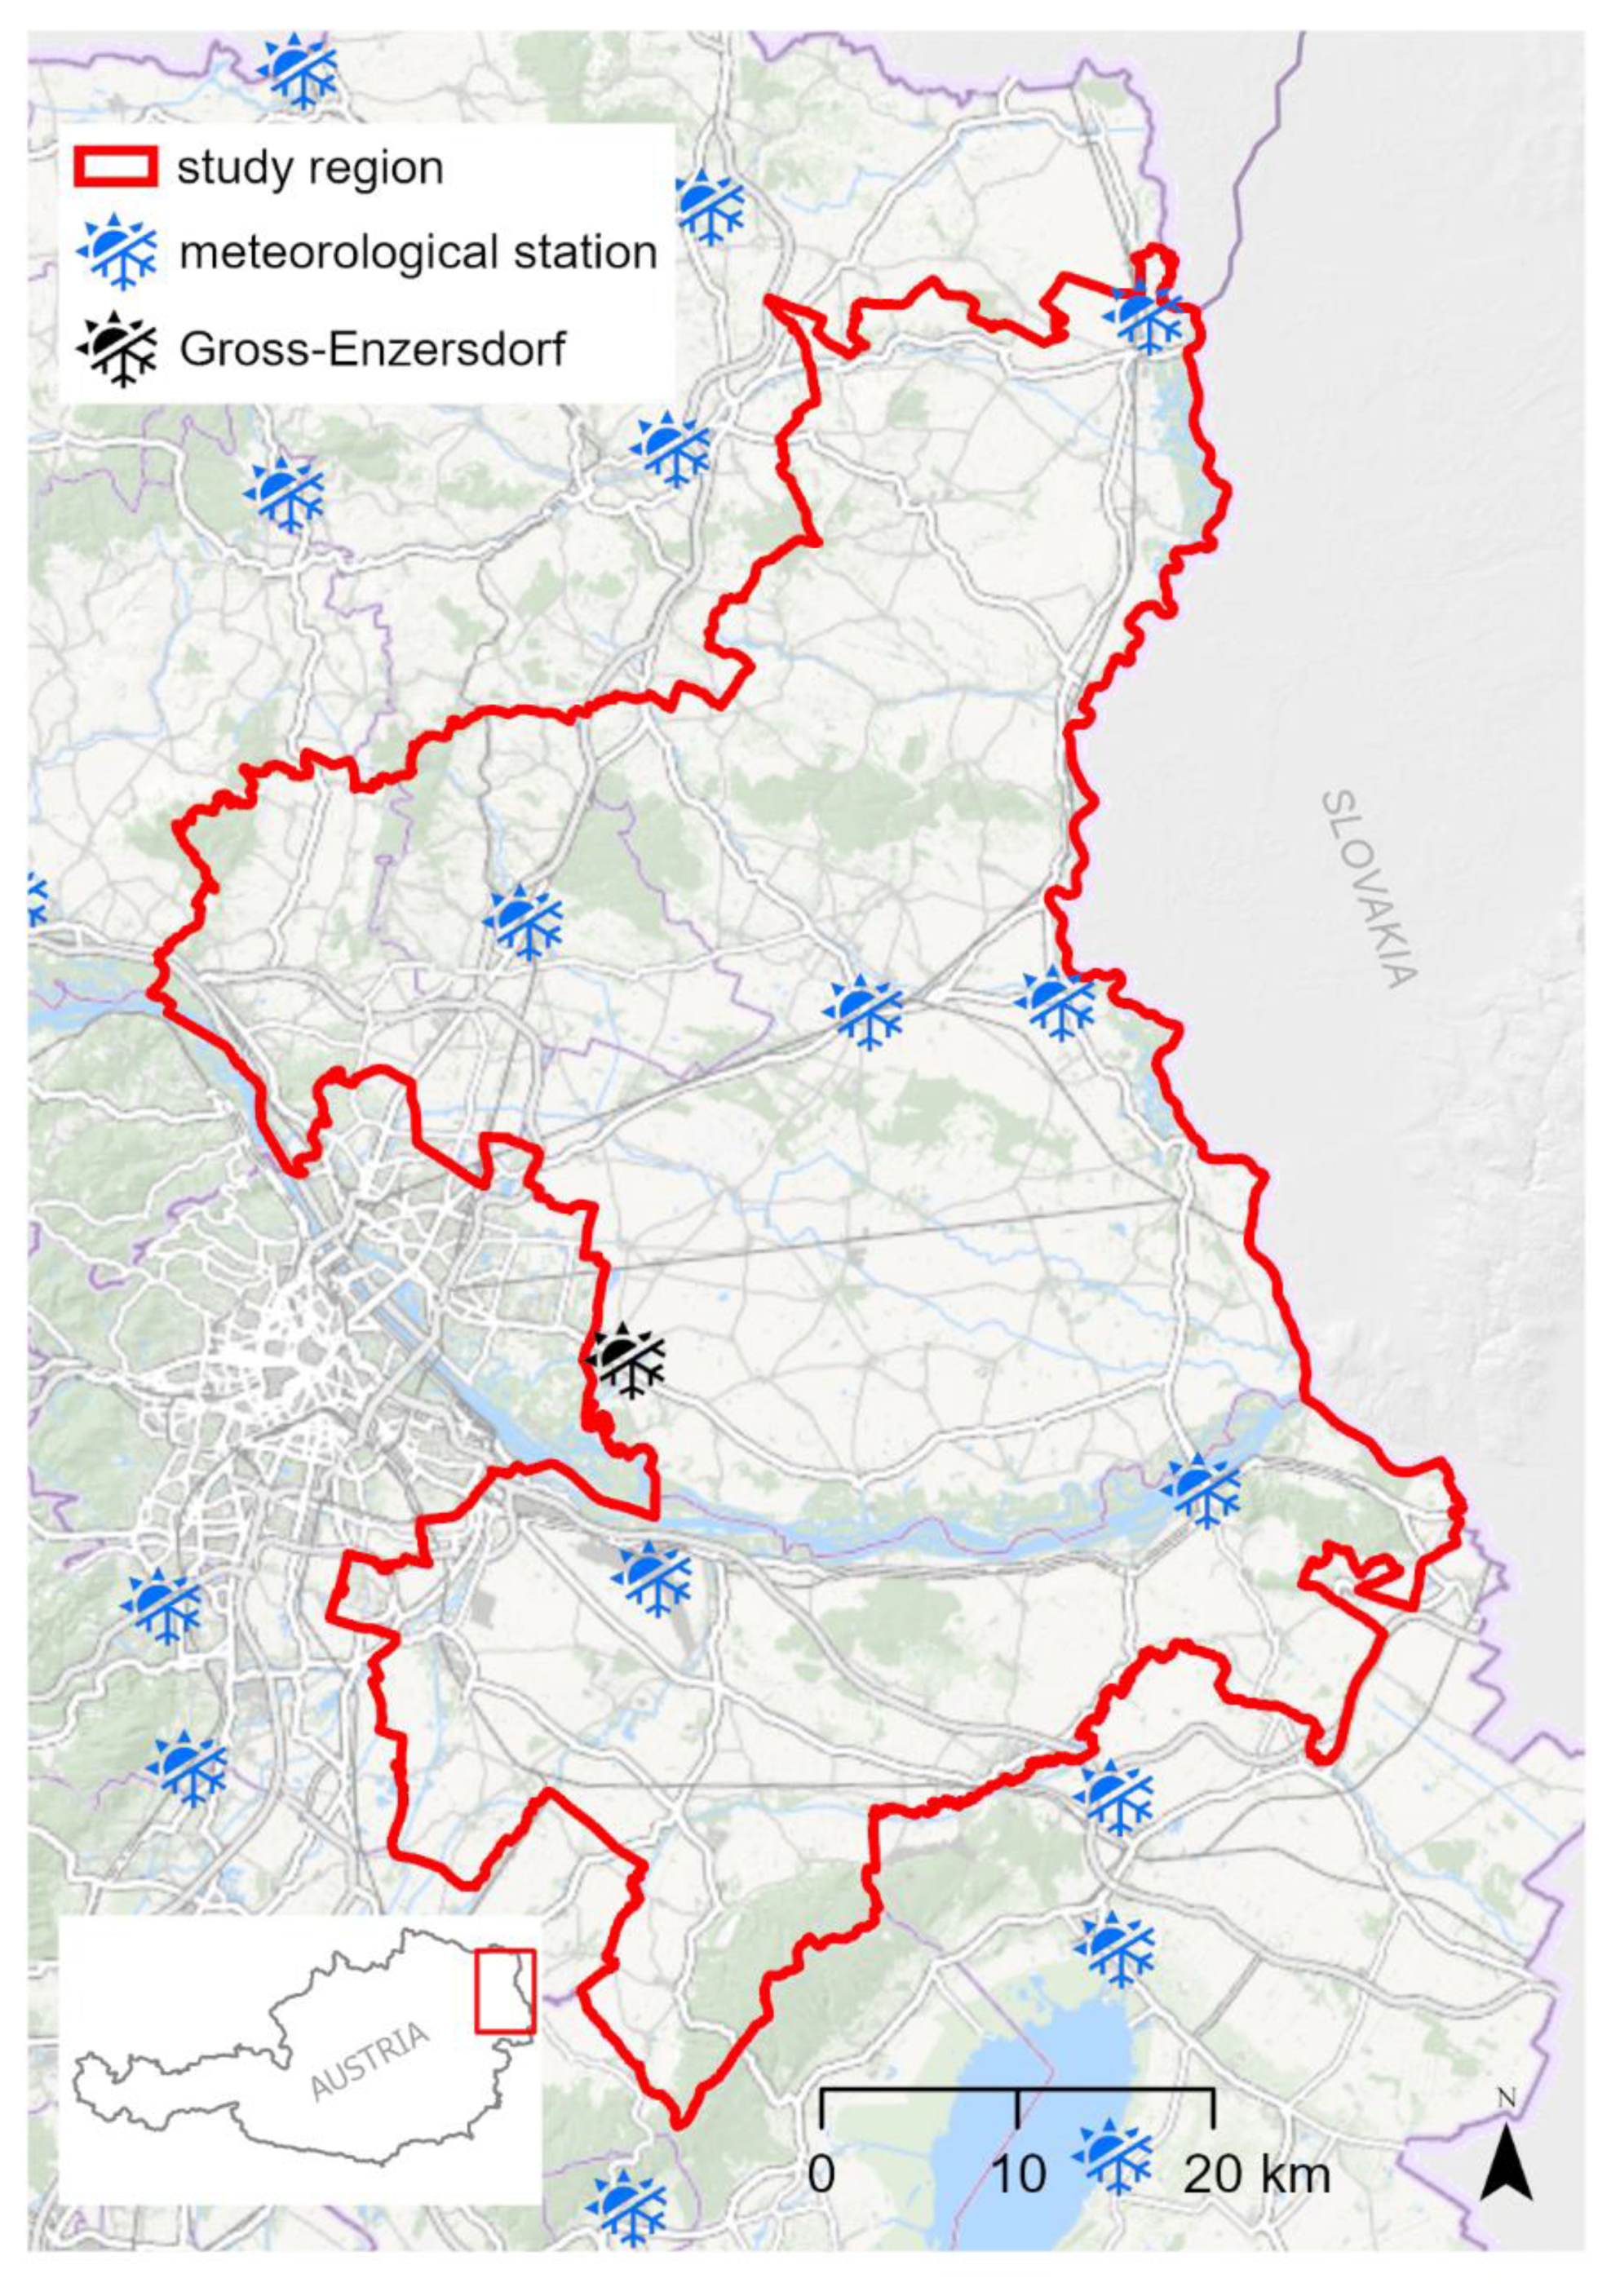
2.1. Study Area
2.2. Datasets
2.3. Qualitative and Quantitative Erosion Modeling
2.3.1. DIN 19706
2.3.2. RWEQ
Erodibility Factor (EF) and Soil Crust Factor (SCF)
Soil Roughness Factor (K′)
Combined Crop Factor (COG)
3. Results and Discussion
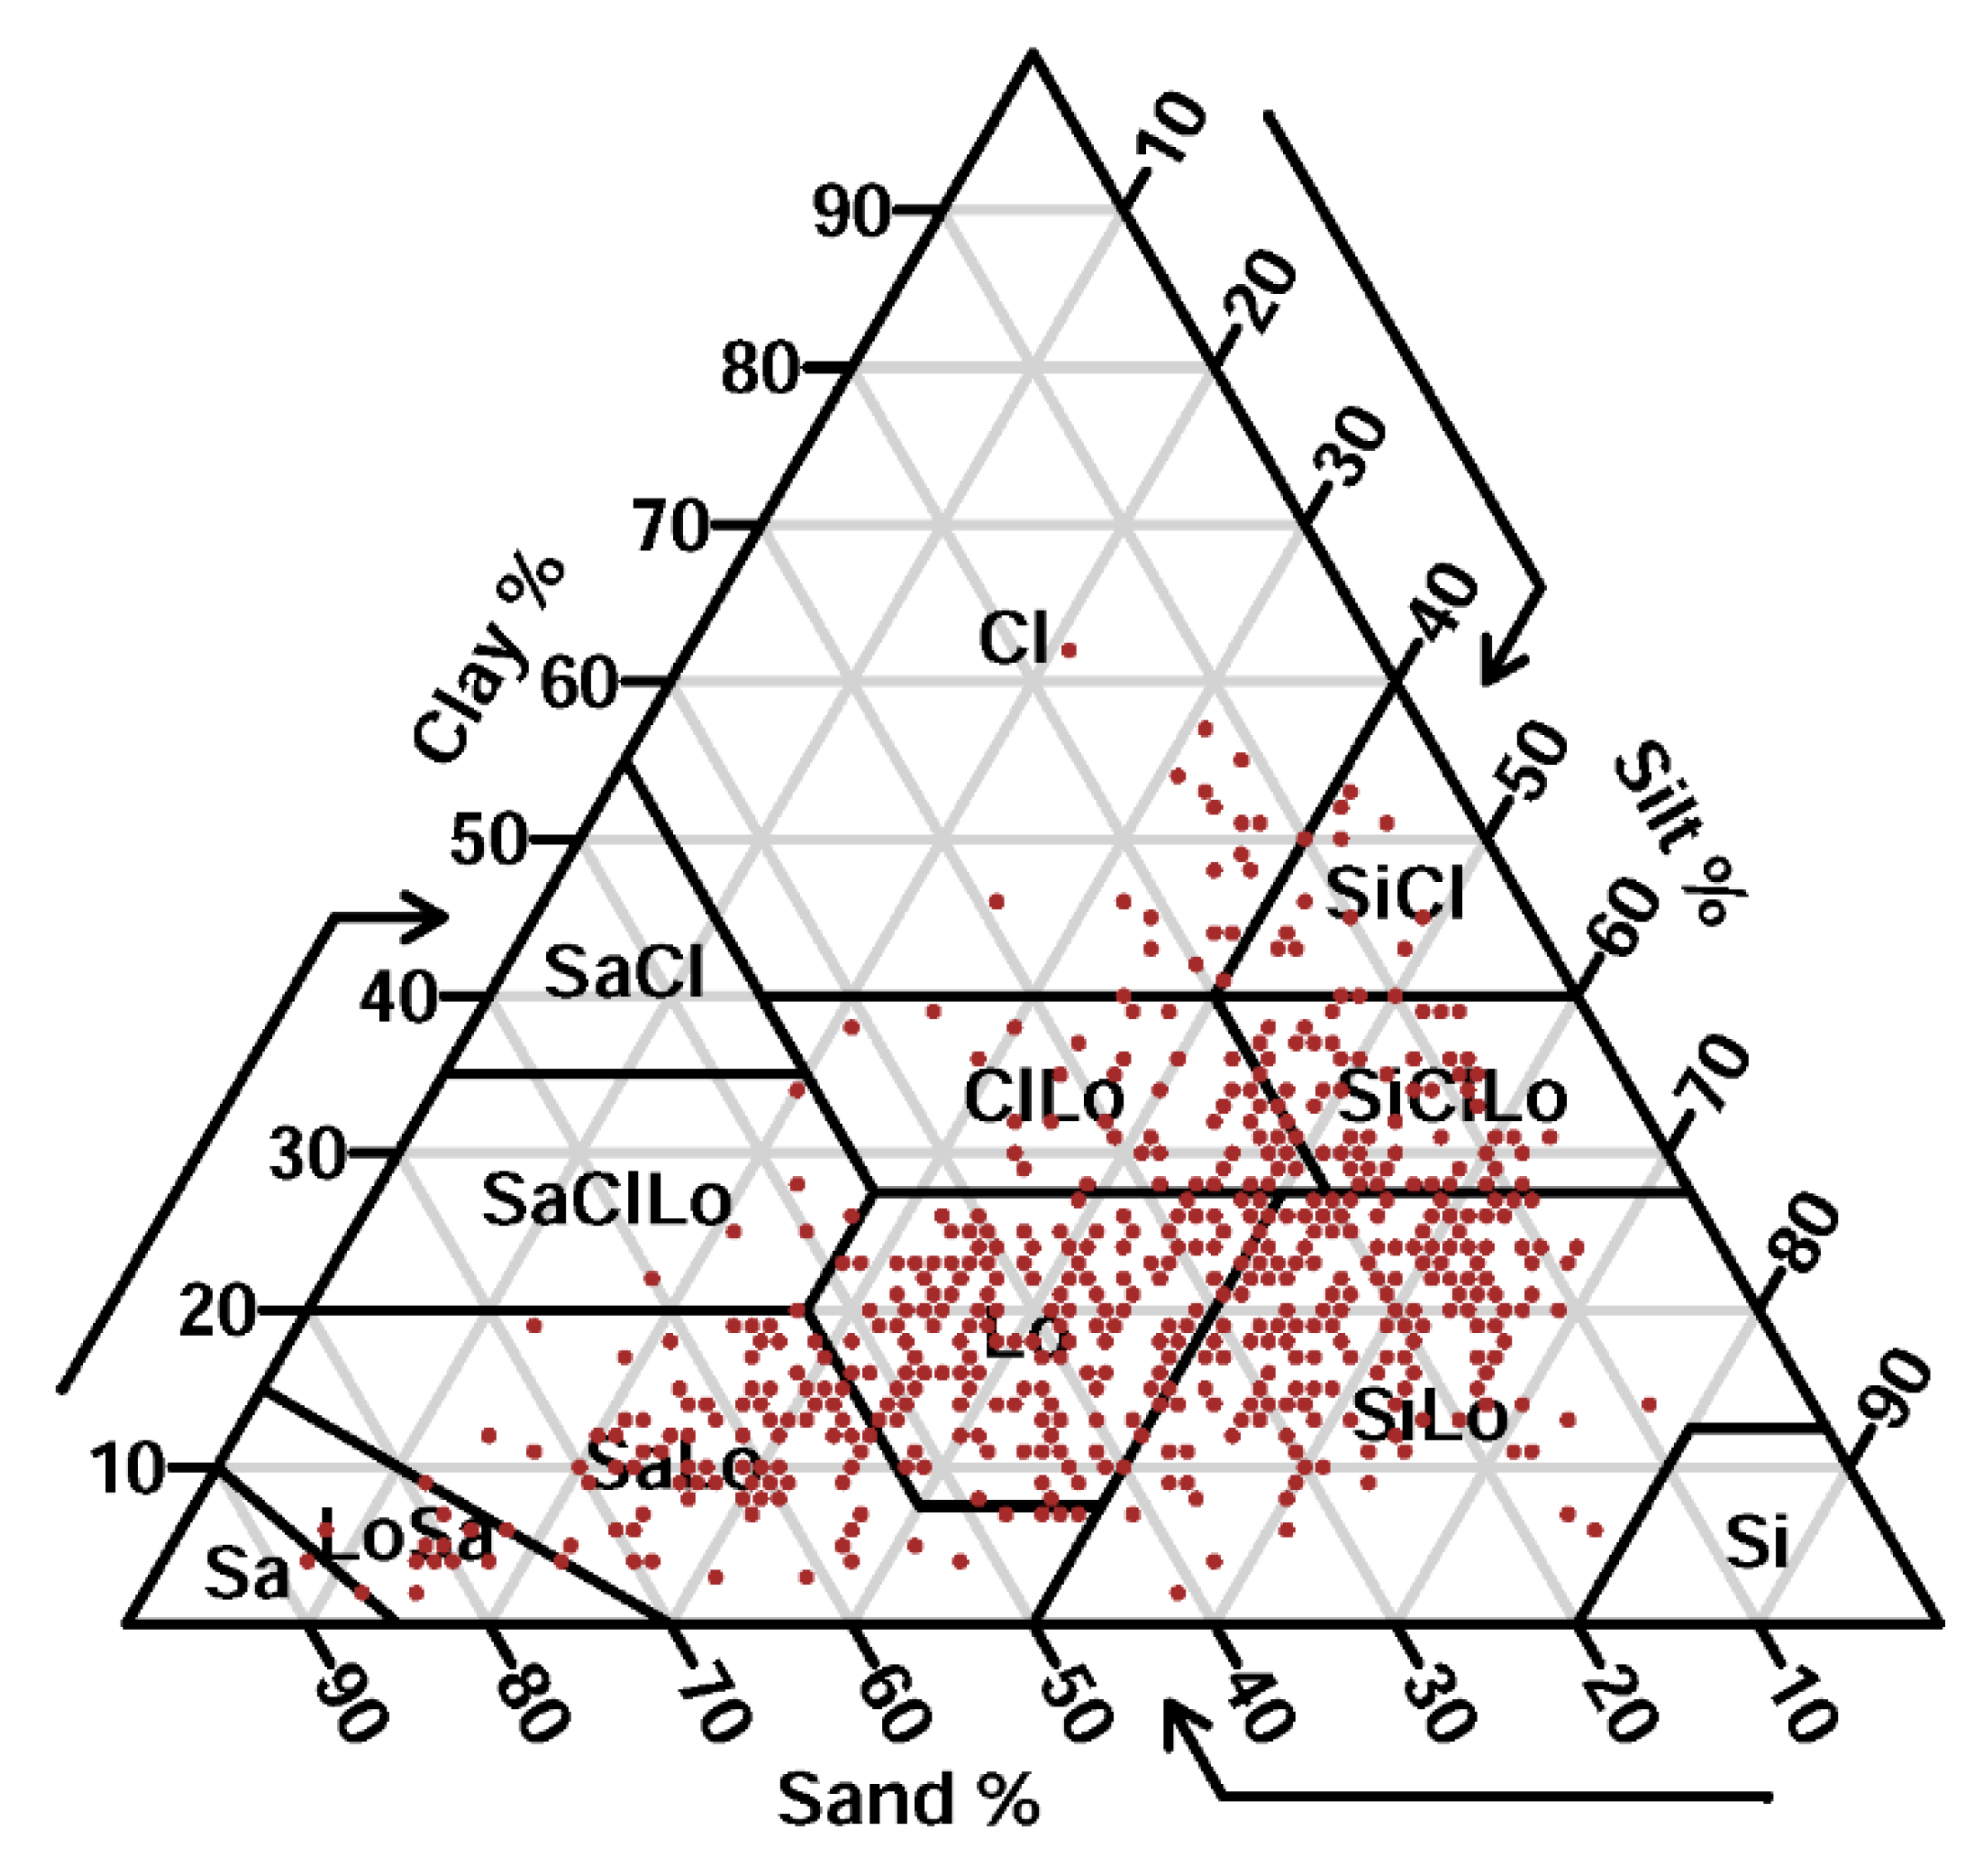
3.1. Erodibility and Surface Crust Factor within the Study Region
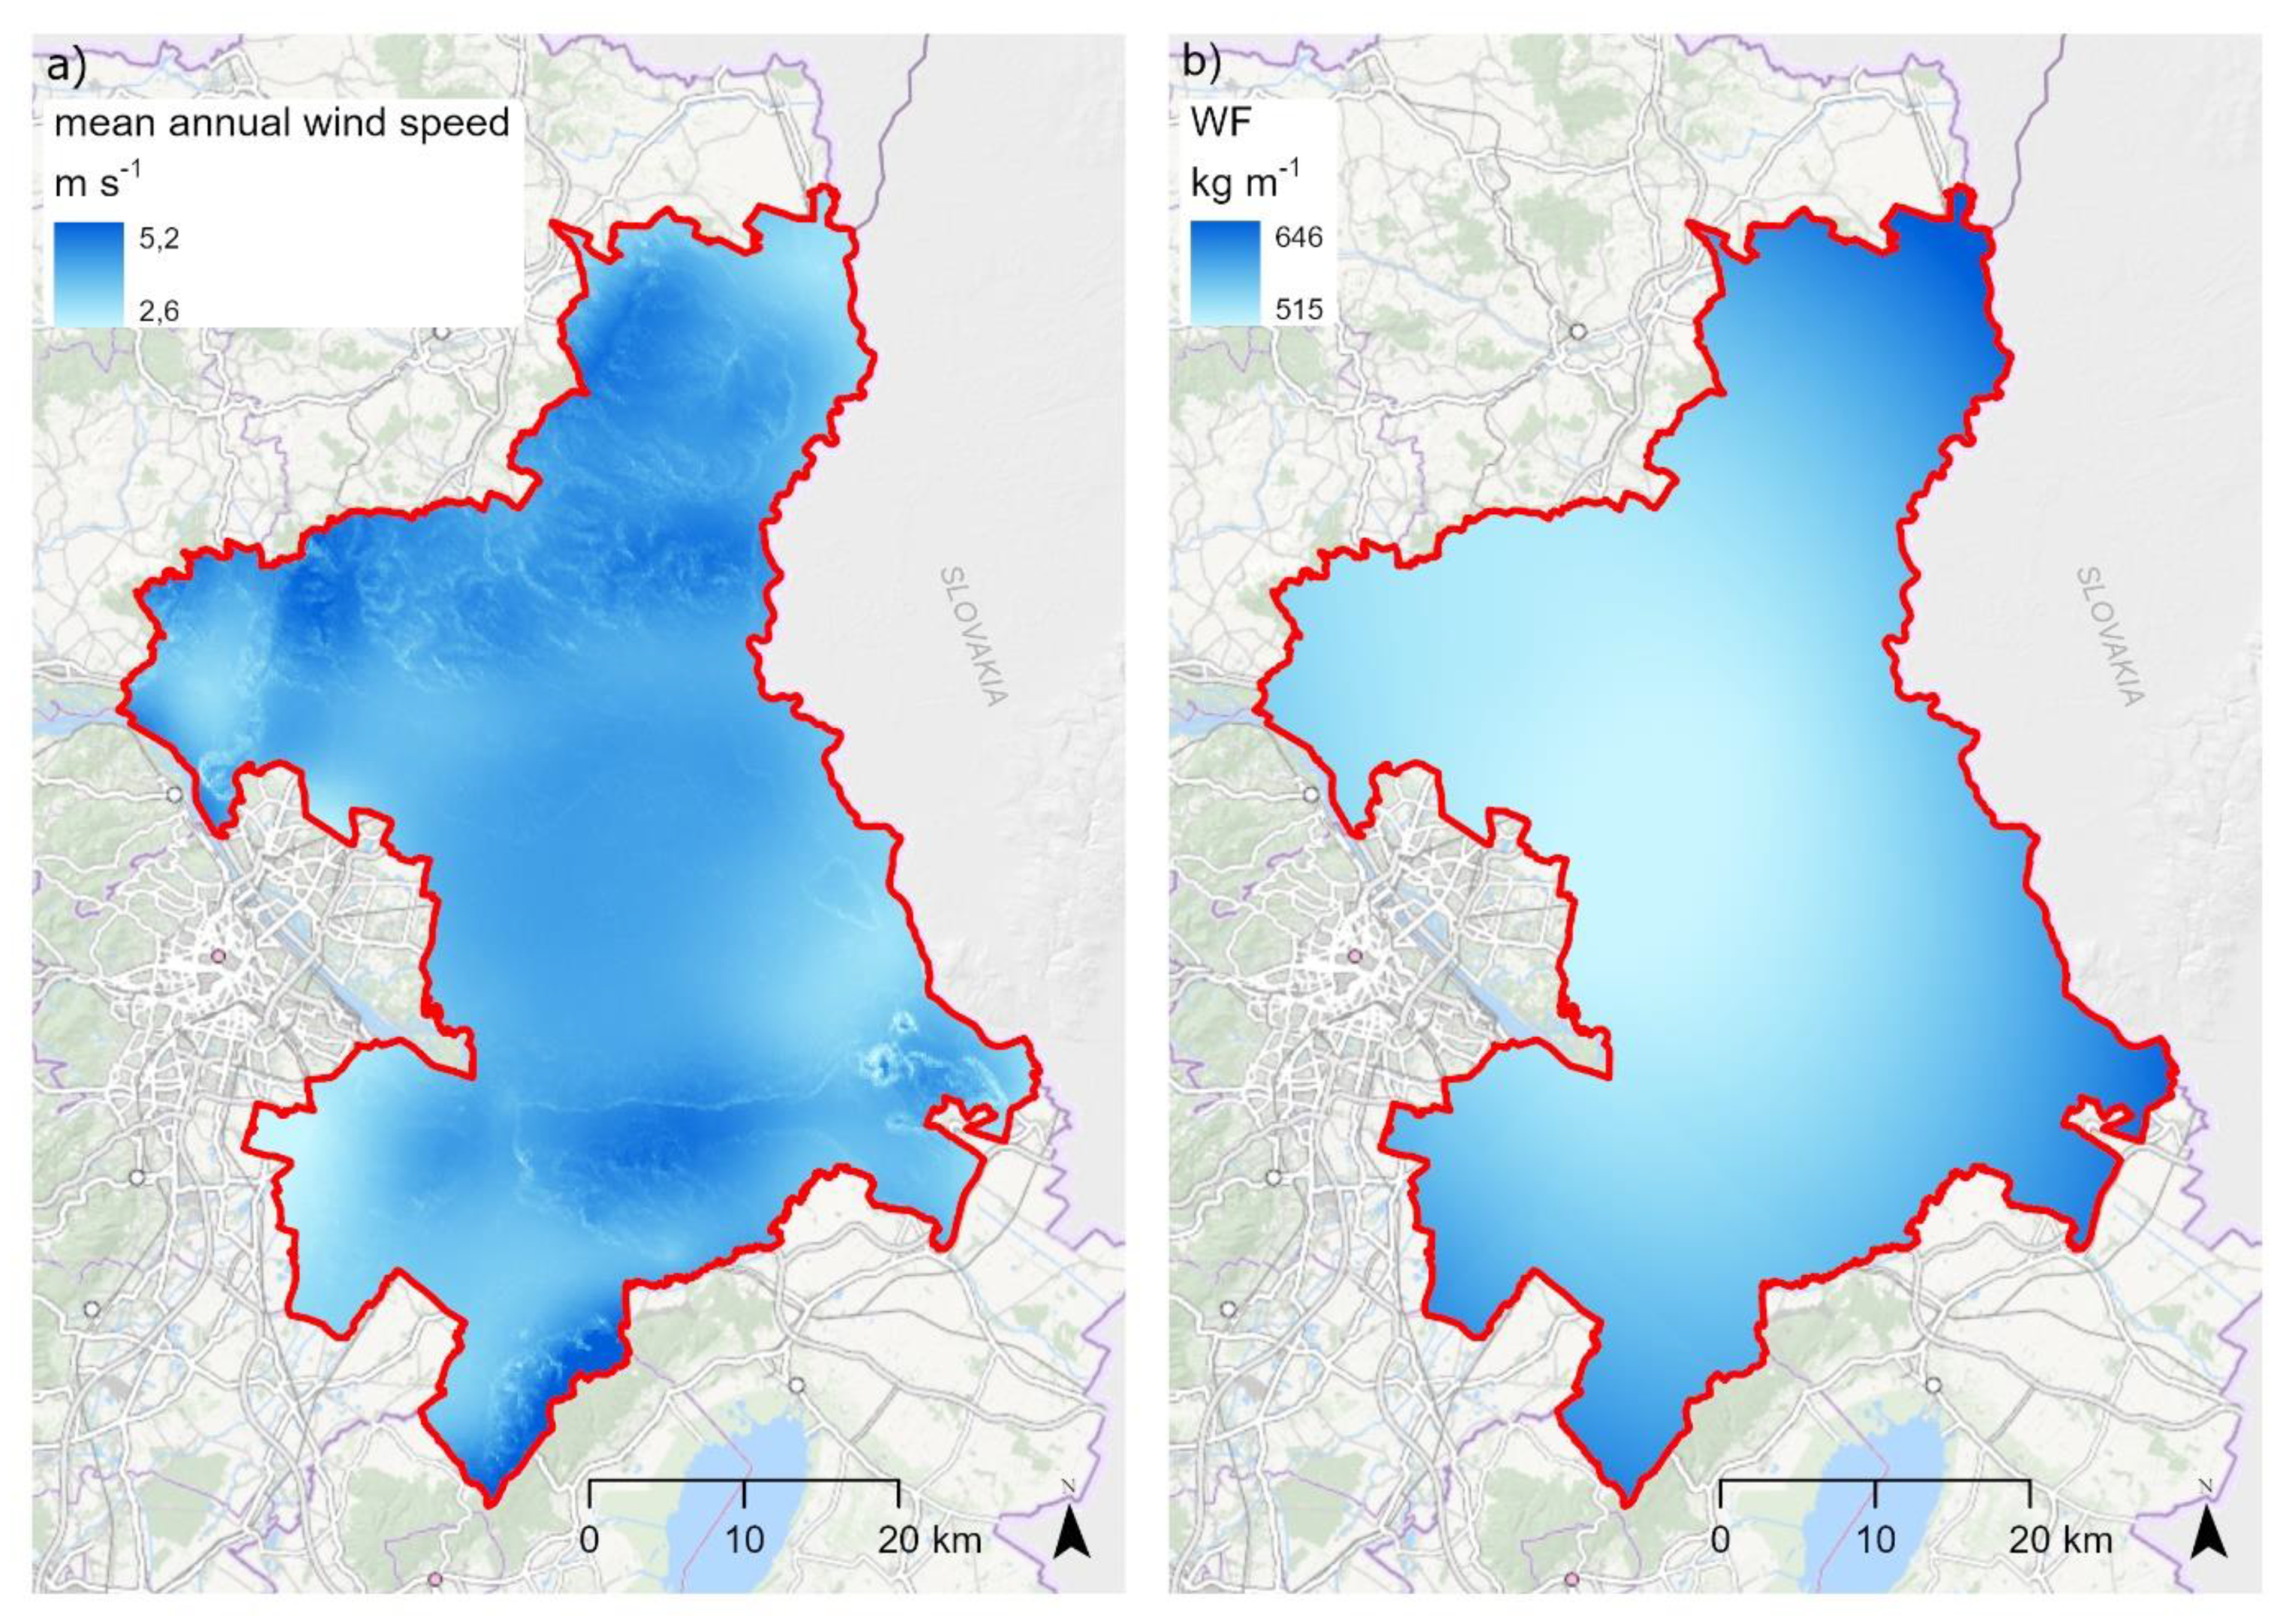
3.2. Climate Factors within the Study Region
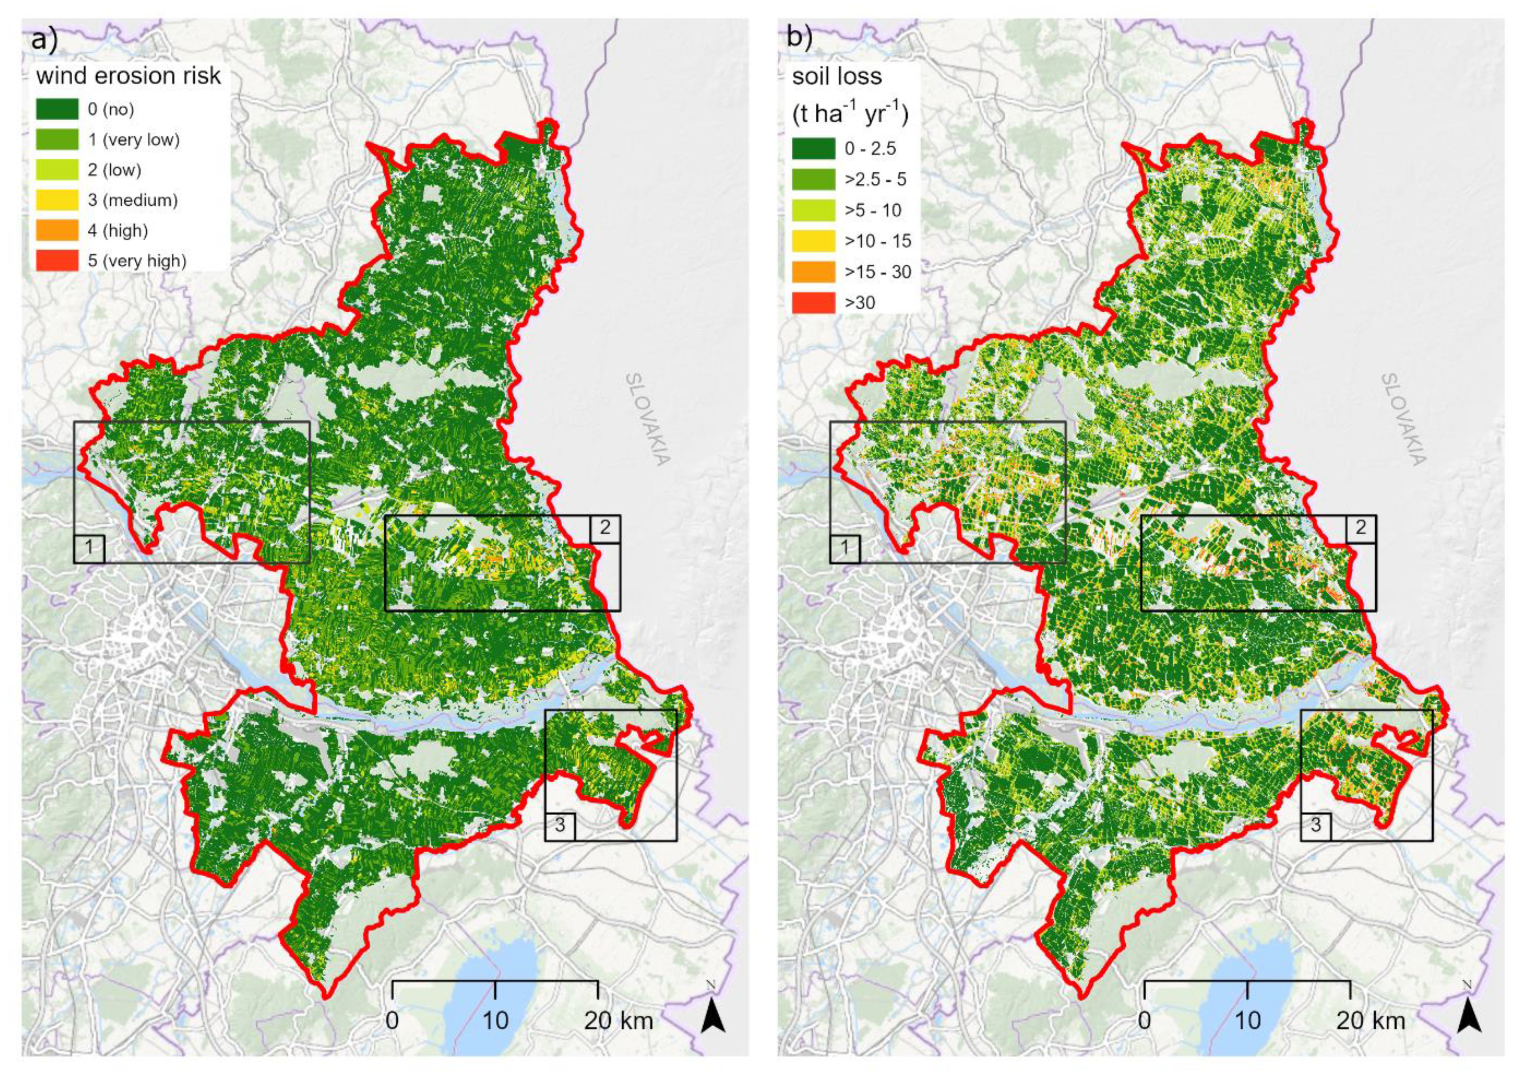
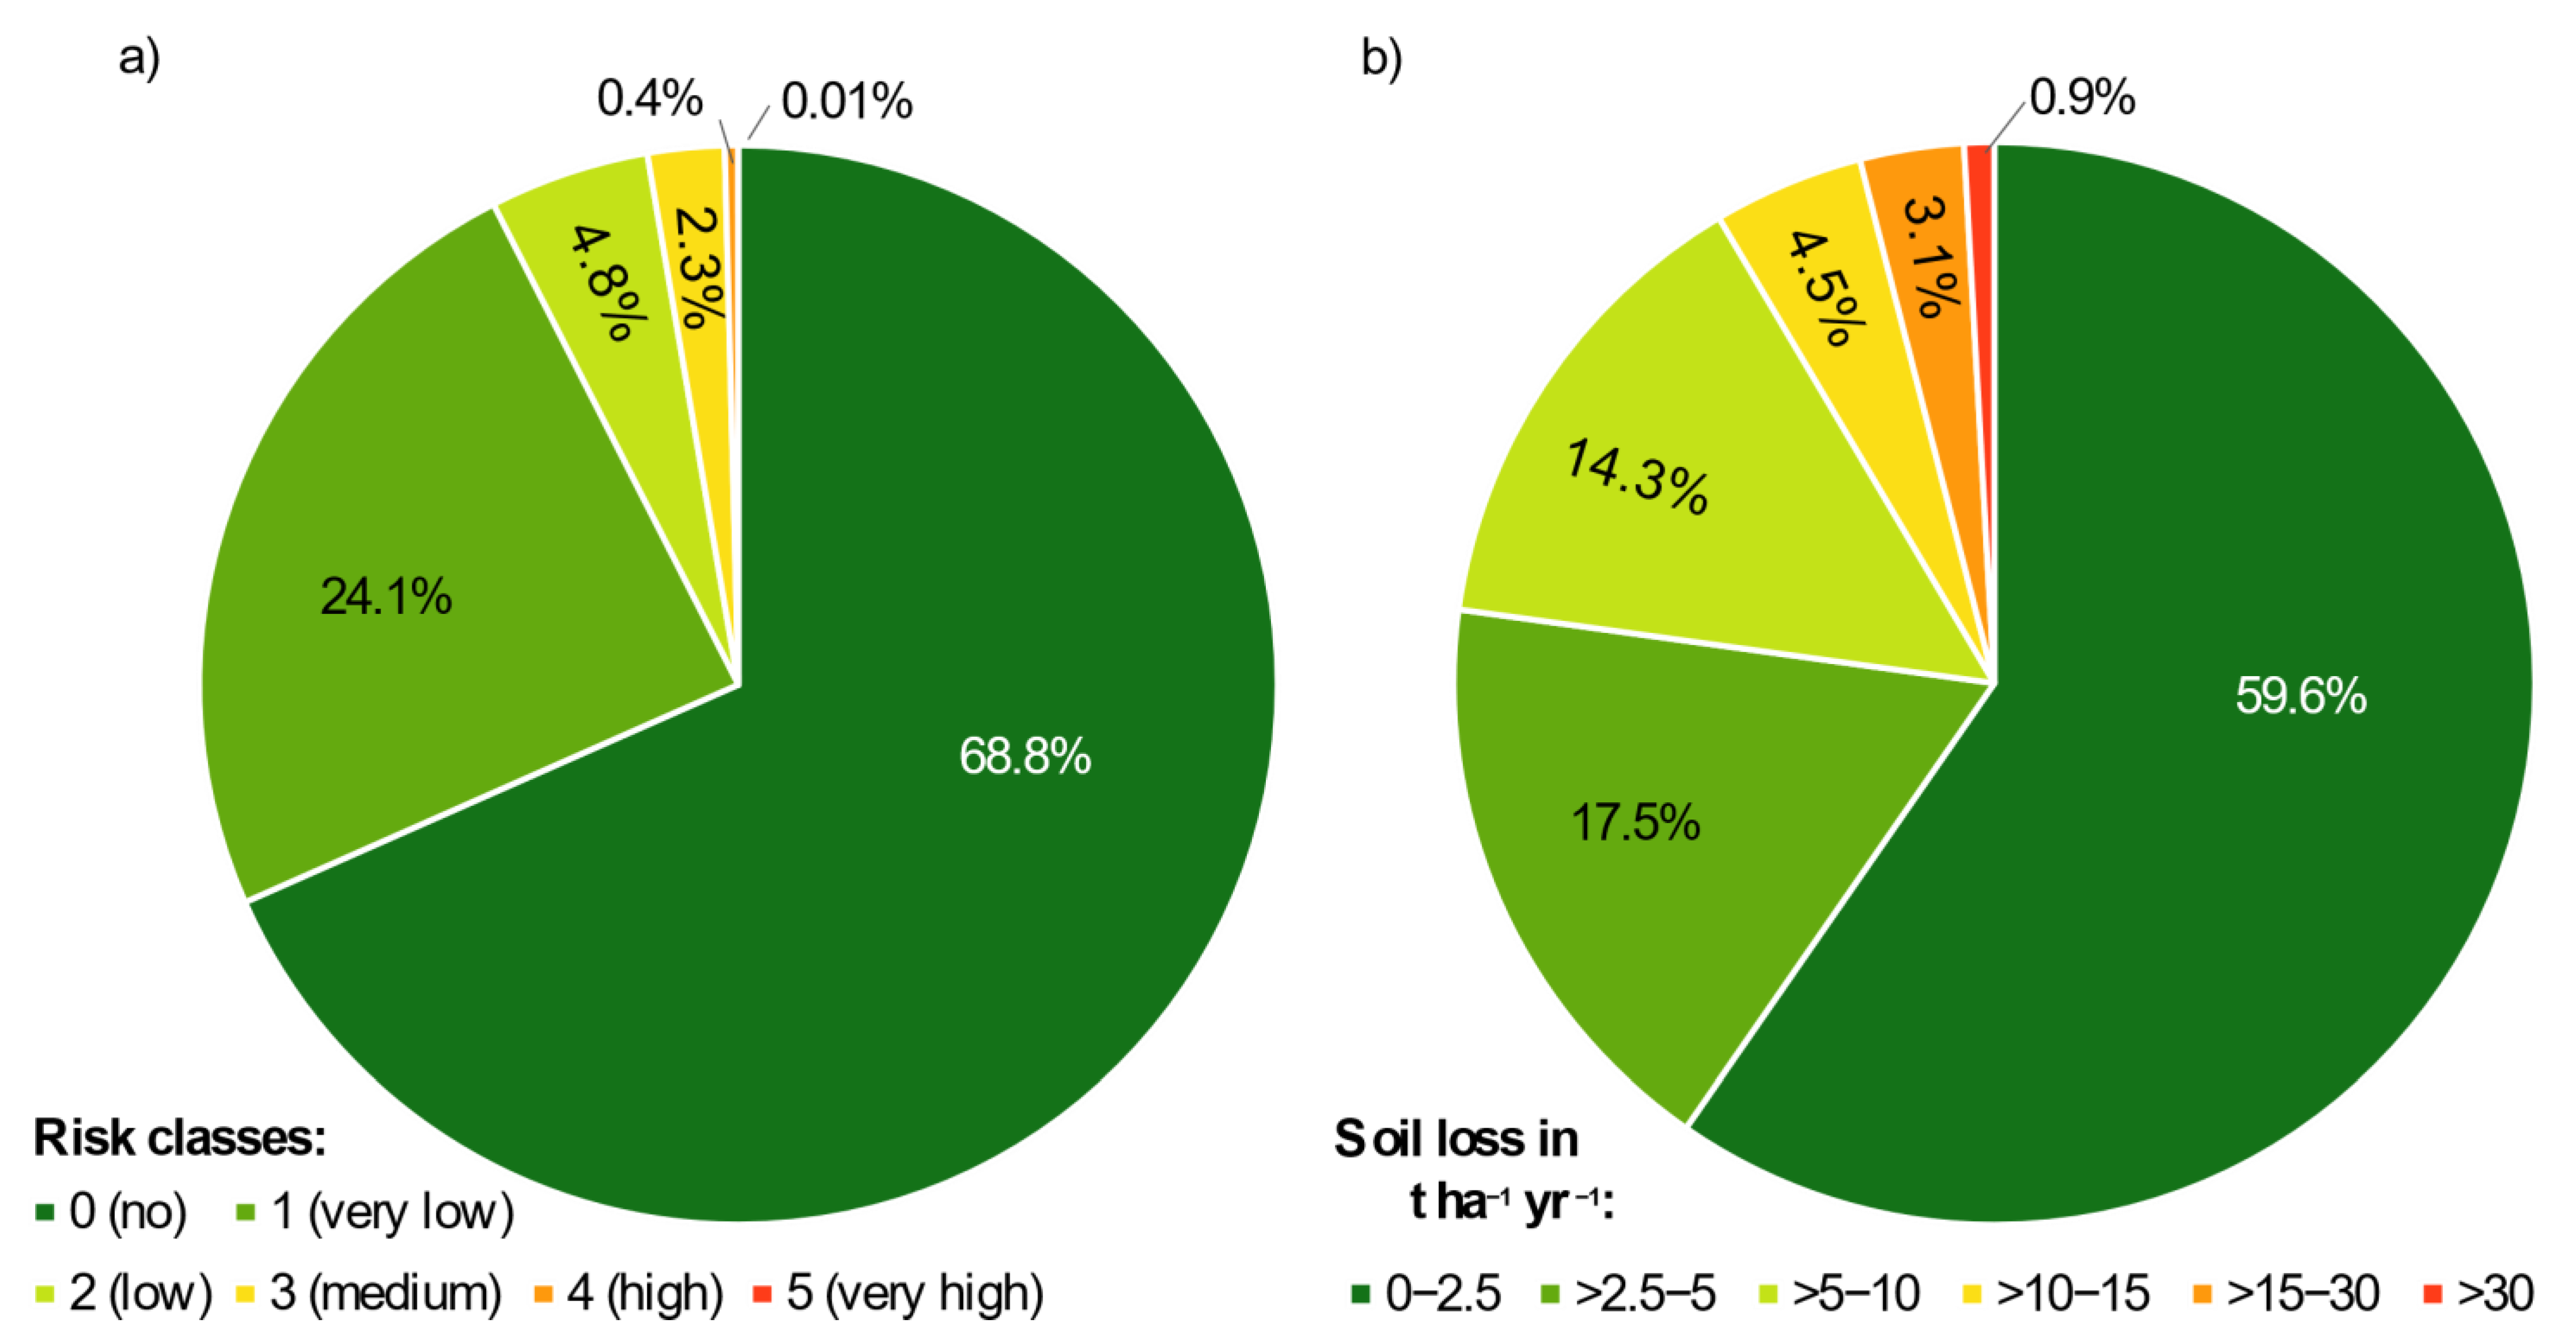
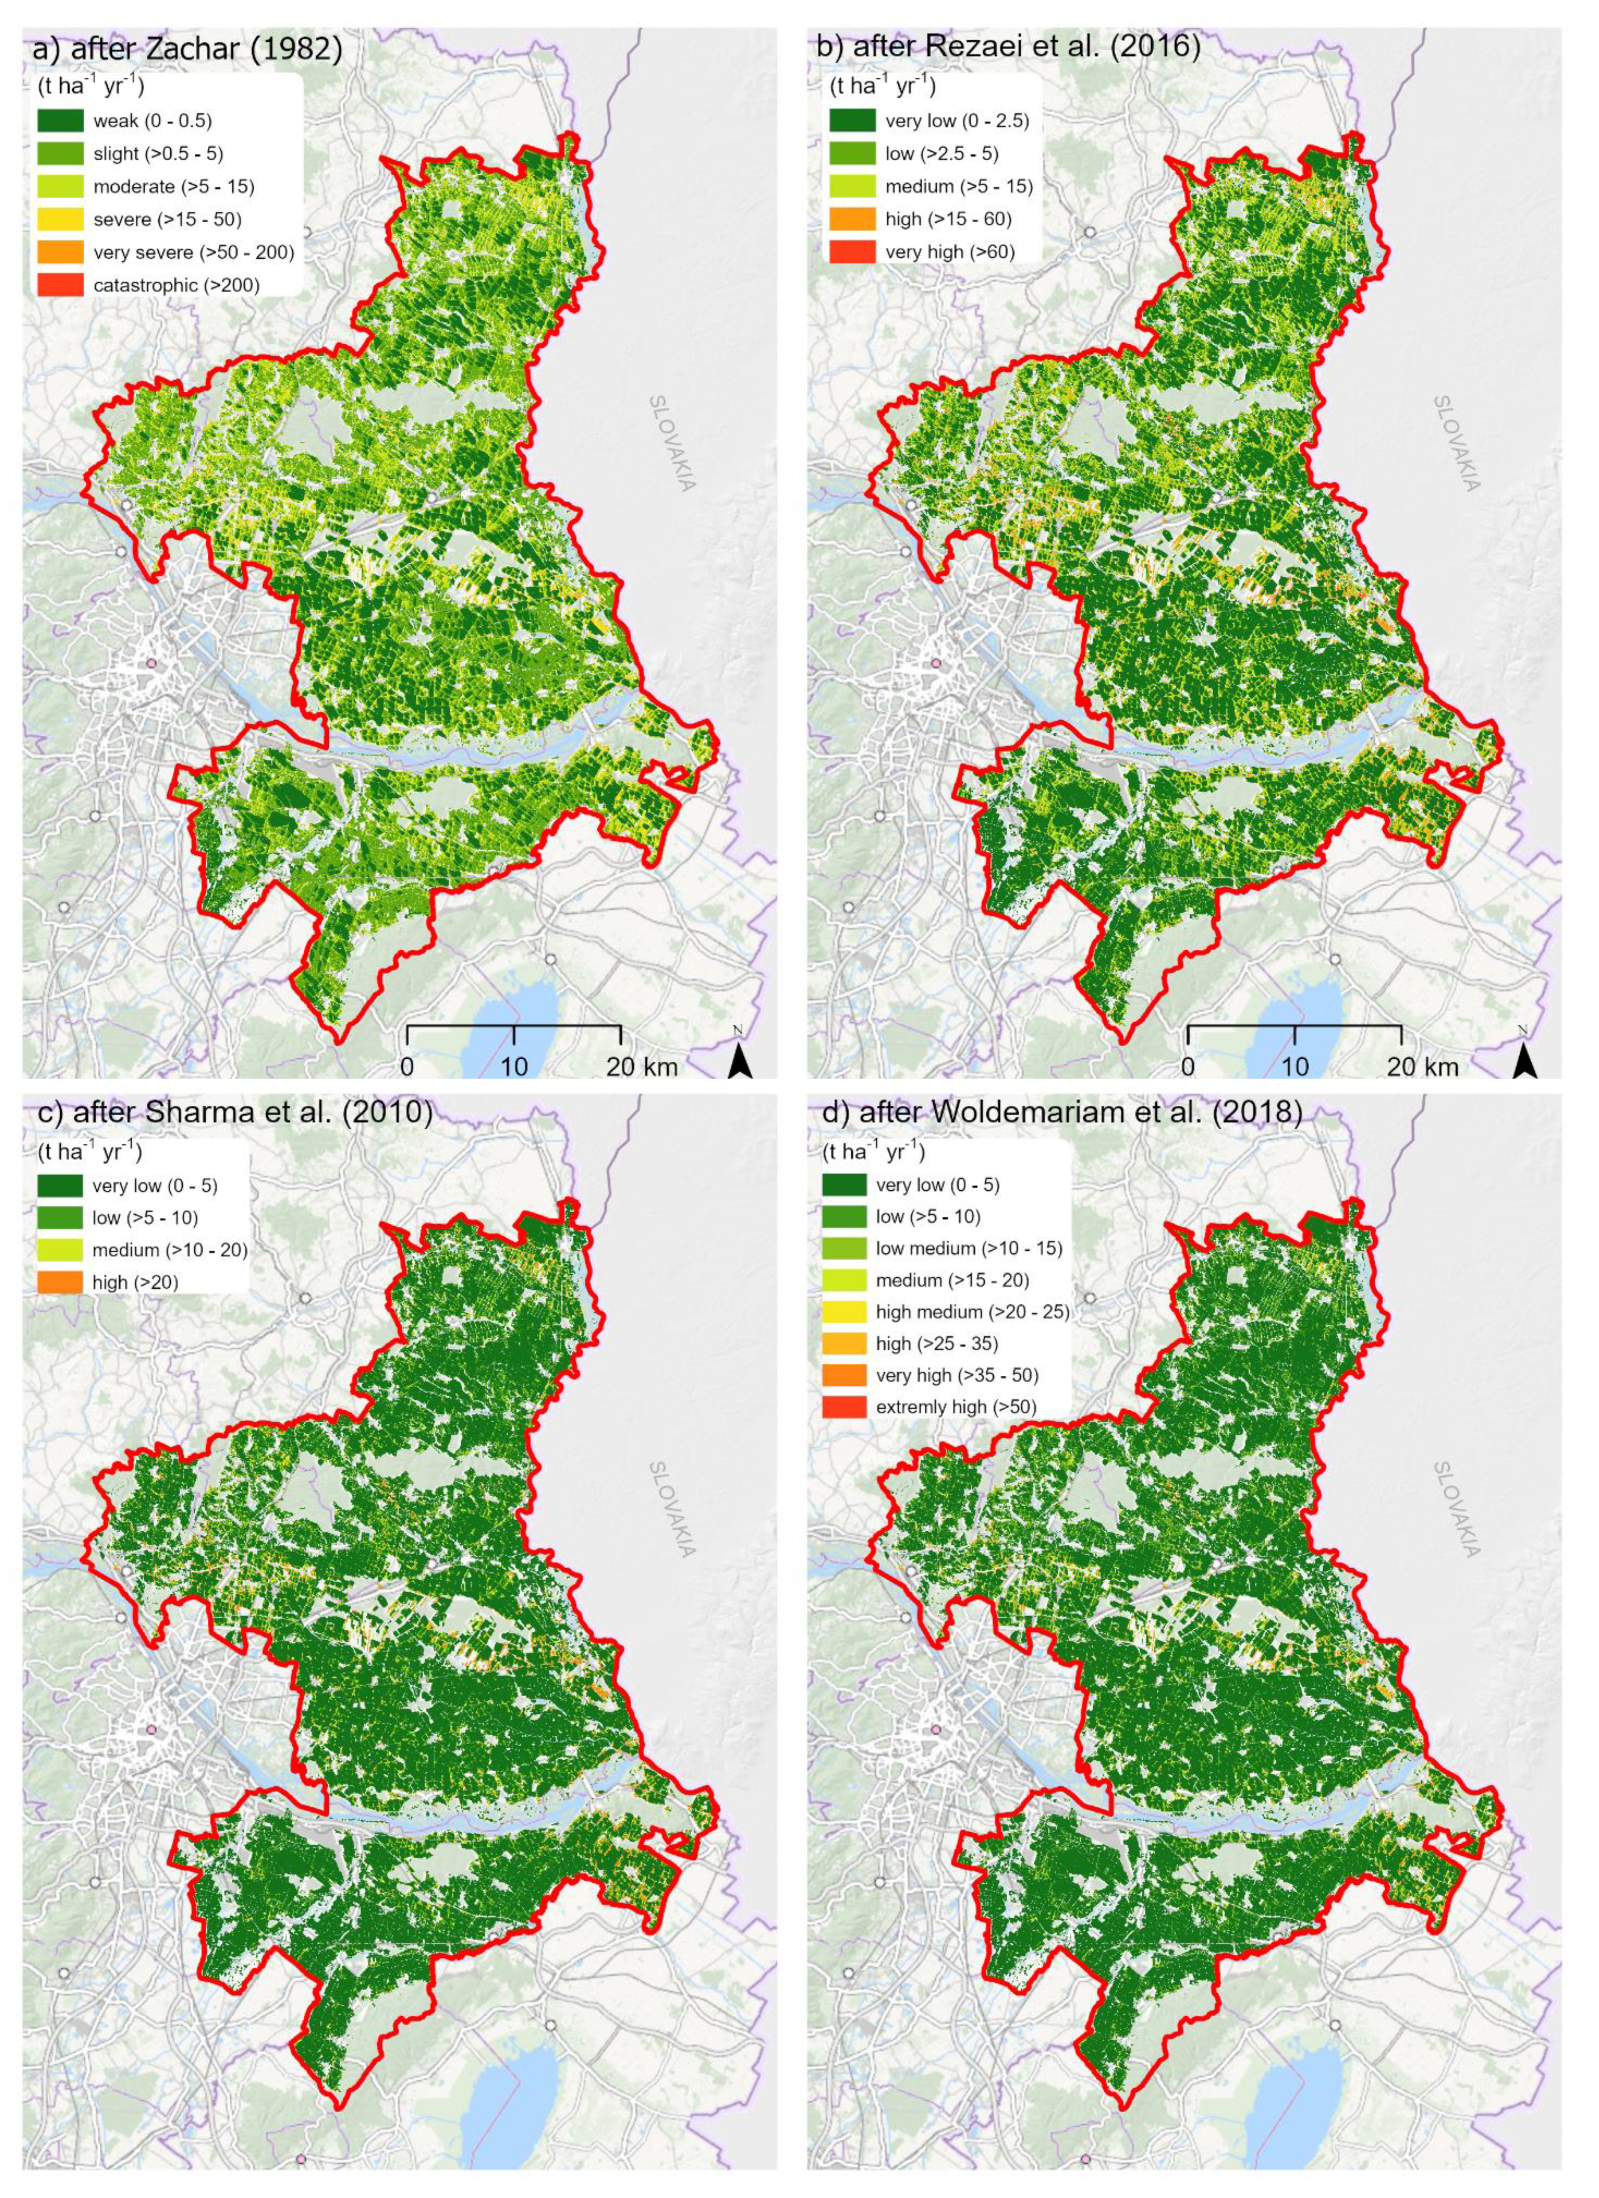
3.3. Comparison of the Wind Erosion Risk Maps
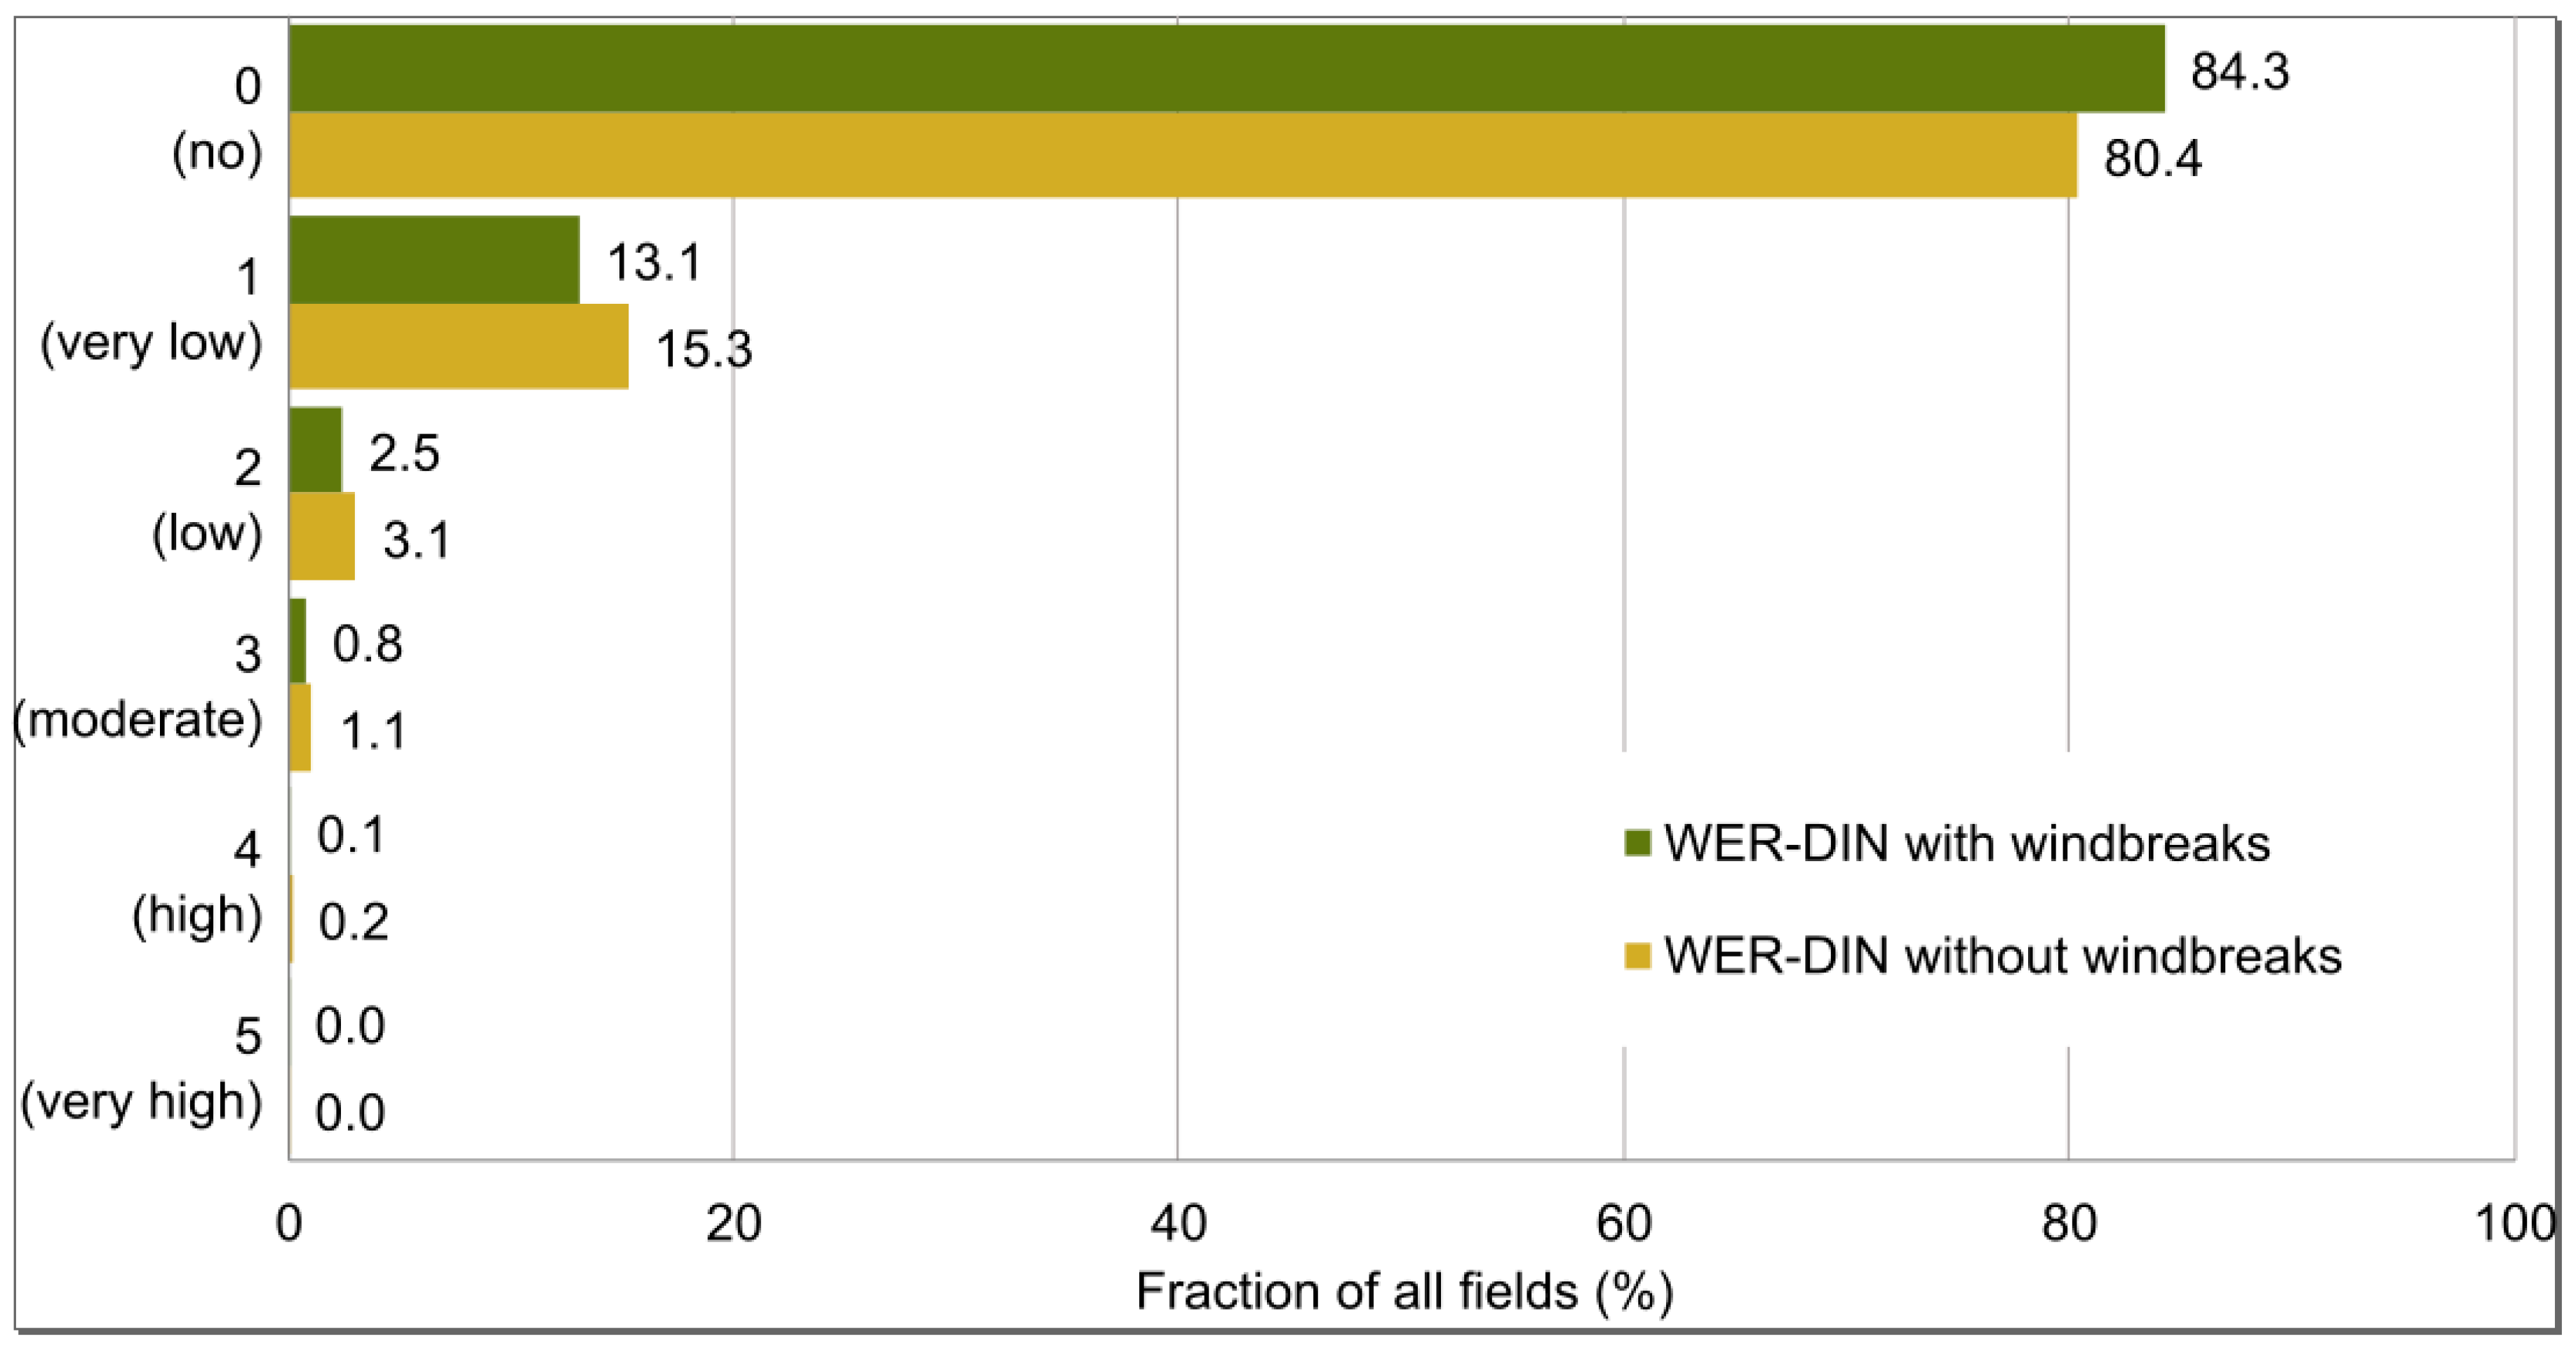
3.4. Individual Consideration of Wind Erosion Parameters
3.5. Classification and Severity Classes of Erosion Rates in Quantitative Modeling
3.6. Limitations of DIN19706 and RWEQ
4. Conclusions
Supplementary Materials
Author Contributions
Funding
Data Availability Statement
Acknowledgments
Conflicts of Interest
References
- Arshad, M.A.; Martin, S. Identifying critical limits for soil quality indicators in agro-ecosystems. Agric. Ecosyst. Environ. 2002, 88, 153–160. [Google Scholar] [CrossRef]
- Pimentel, D.; Burgess, M. Soil Erosion Threatens Food Production. Agriculture 2013, 3, 443–463. [Google Scholar] [CrossRef] [Green Version]
- Jie, C.; Jing-zhang, C.; Man-zhi, T.; Zi-tong, G. Soil degradation: A global problem endangering sustainable development. J. Geogr. Sci. 2002, 12, 243–252. [Google Scholar] [CrossRef]
- Commission of the European Communities. Proposal for a Directive of the European Parliament and of the Council Establishing a Framework for the Protection of Soil and Amending Directive 2004/35/EC: /* COM/2006/0232 Final—COD 2006/0086 */; Commission of the European Communities: Brussels, Belgium, 2006. [Google Scholar]
- Prăvălie, R.; Patriche, C.; Borrelli, P.; Panagos, P.; Roșca, B.; Dumitraşcu, M.; Nita, I.-A.; Săvulescu, I.; Birsan, M.-V.; Bandoc, G. Arable lands under the pressure of multiple land degradation processes. A global perspective. Environ. Res. 2021, 194, 110697. [Google Scholar] [CrossRef]
- Ravi, S.; D’Odorico, P.; Breshears, D.D.; Field, J.P.; Goudie, A.S.; Huxman, T.E.; Li, J.; Okin, G.S.; Swap, R.J.; Thomas, A.D.; et al. Aeolian Processes and the Biosphere. Rev. Geophys. 2011, 49. [Google Scholar] [CrossRef] [Green Version]
- Funk, R.; Reuter, H.I. Wind Erosion. In Soil Erosion in Europe; Boardman, J., Poesen, J., Eds.; Wiley: Chichester, UK; Hoboken, NJ, USA, 2006; pp. 563–582. ISBN 0470859105. [Google Scholar]
- Borrelli, P.; Alewell, C.; Alvarez, P.; Anache, J.A.A.; Baartman, J.; Ballabio, C.; Bezak, N.; Biddoccu, M.; Cerdà, A.; Chalise, D.; et al. Soil erosion modelling: A global review and statistical analysis. Sci. Total Environ. 2021, 780, 146494. [Google Scholar] [CrossRef]
- Chepil, W.S.; Woodruff, N.P. The Physics of Wind Erosion and its Control. Adv. Agron. 1963, 15, 211–302. [Google Scholar] [CrossRef]
- Fryrear, D.W.; Bilbro, J.D.; Saleh, A.; Schomberg, H.; Stout, J.E.; Zobeck, T.M. RWEQ: Improved wind erosion technology. J. Soil Water Conserv. 2000, 55, 183–189. [Google Scholar]
- Shao, Y. Physics and Modelling of Wind Erosion; Springer: Dordrecht, The Netherlands, 2009; ISBN 9781402088940. [Google Scholar]
- Borrelli, P.; Ballabio, C.; Panagos, P.; Montanarella, L. Wind erosion susceptibility of European soils. Geoderma 2014, 232-234, 471–478. [Google Scholar] [CrossRef]
- Borrelli, P.; Panagos, P.; Ballabio, C.; Lugato, E.; Weynants, M.; Montanarella, L. Towards a Pan-European Assessment of Land Susceptibility to Wind Erosion. Land Degrad. Develop. 2016, 27, 1093–1105. [Google Scholar] [CrossRef]
- Borrelli, P.; Lugato, E.; Montanarella, L.; Panagos, P. A New Assessment of Soil Loss Due to Wind Erosion in European Agricultural Soils Using a Quantitative Spatially Distributed Modelling Approach. Land Degrad. Develop. 2017, 28, 335–344. [Google Scholar] [CrossRef] [Green Version]
- Wendelberger, G. Die Restwälder der Parndorfer Platte im Nordburgenland: Die Natürlichen Voraussetzungen Standortgemässer Wiederaufforstungen; Amt d. Burgenländ. Landesregierung, Landesarchiv—Landesbibliothek: Eisenstadt, Austria, 1955. [Google Scholar]
- Strauss, P.; Klaghofer, E. Austria. In Soil Erosion in Europe; Boardman, J., Poesen, J., Eds.; Wiley: Chichester, UK; Hoboken, NJ, USA, 2006; pp. 205–212. ISBN 0470859105. [Google Scholar]
- Klik, A. Wind Erosion Assessment in Austria Using Wind Erosion Equation and GIS. Unpublished. 2003. [Google Scholar]
- Woodruff, N.P.; Siddoway, F.H. A Wind Erosion Equation1. Soil Sci. Soc. Am. J. 1965, 29, 602. [Google Scholar] [CrossRef]
- Fryrear, D.; Saleh, A.; Bilbro, J.D.; Schomberg, H.; Stout, J.E.; Zobeck, T.M. Revised wind erosion equation (RWEQ). Wind Erosion and Water Conservation Research Unit, USDA-ARS, Southern Plains Area Cropping Systems Research Laboratory. Tech. Bull. 1998, 1, 36–51. [Google Scholar]
- Tatarko, J.; Wagner, L.; Fox, F. The Wind Erosion Prediction System and its Use in Conservation Planning. In Bridging among Disciplines by Synthesizing Soil and Plant Processes; Wendroth, O., Lascano, R.J., Ma, L., Eds.; American Society of Agronomy and Soil Science Society of America: Madison, WI, USA, 2019; pp. 71–101. ISBN 9780891183655. [Google Scholar]
- Hagen, L.J. A ind erosion prediction system to meet user needs. J. Soil Water Conserv. 1991, 46, 106–111. [Google Scholar]
- Jarrah, M.; Mayel, S.; Tatarko, J.; Funk, R.; Kuka, K. A review of wind erosion models: Data requirements, processes, and validity. Catena 2020, 187, 104388. [Google Scholar] [CrossRef]
- Schmidt, S.; Meusburger, K.; Figueiredo, T.; Alewell, C. Modelling Hot Spots of Soil Loss by Wind Erosion (SoLoWind) in Western Saxony, Germany. Land Degrad. Develop. 2017, 28, 1100–1112. [Google Scholar] [CrossRef] [Green Version]
- Le Bissonnais, Y.; Montier, C.; Jamagne, M.; Daroussin, J.; King, D. Mapping erosion risk for cultivated soil in France. Catena 2002, 46, 207–220. [Google Scholar] [CrossRef]
- van Gool, D.; Tille, P.J.; Moore, G.A. Land Evaluation Standar Aluation Standards for Land r ds for Land Resource Mapping: Assessing ce Mapping: Assessing Land Qualities and Determining Land Capability in South-Western Australia; Department of Primary Industries and Regional Development: Perth, Australia, 2005. [Google Scholar]
- Department of Agriculture and food. Report Card on Sustainable Natural Resource Use in Agriculture: Status and Trend in the Agricultural Areas of the South-West of Western Australia; Department of Primary Industries and Regional Development: Perth, Australia, 2013. [Google Scholar]
- Středová, H.; Podhrázská, J.; Chuchma, F.; Středa, T.; Kučera, J.; Fukalová, P.; Blecha, M. The Road Map to Classify the Potential Risk of Wind Erosion. ISPRS Int. J. Geo-Inf. 2021, 10, 269. [Google Scholar] [CrossRef]
- Négyesi, G.; Lóki, J.; Buró, B.; Bertalan-Balázs, B.; Pásztor, L. Wind erosion researches in Hungary—past, present and future possibilities. HunGeoBull 2019, 223–240. [Google Scholar] [CrossRef] [Green Version]
- DIN German Institute for Standardisation. DIN 19706:2013-02, Bodenbeschaffenheit_—Ermittlung der Erosionsgefährdung von Böden Durch Wind; Beuth Verlag GmbH: Berlin, Germany, 2013. [Google Scholar]
- Deumlich, D.; Funk, R.; Kiesel, J.; Reuter, H.I.; Thiere, J.; Völker, L. Anwendung der “vergleichsmethode standort (vermost)” zur bewertung der erosionsgefährdungspotenziale als datenbasis für förderinstrumente am beispiel des landes Brandenburg: Application of the site comparison method (vermost) to assess the potential erosion risk as a basis to examine instruments of environmental policy—The example of Brandenburg. Arch. Agron. Soil Sci. 2004, 50, 259–271. [Google Scholar] [CrossRef]
- Funk, R.; Deumlich, D.; Steidl, J. GIS Application to Estimate the Wind Erosion Risk in the Federal State of Brandenburg. In Soil Erosion Research for the 21st Century; American Society of Agricultural and Biological Engineers: Honolulu, HI, USA, 2001. [Google Scholar] [CrossRef]
- Funk, R.; Deumlich, D.; Völker, L.; Steidl, J. GIS application to estimate the wind erosion risk in the Federal State of Brandenburg. In Wind Erosion and Dust Dynamics: Observations, Simulations, Modelling; Goossens, D., Riksen, M., Eds.; Wageningen University and Research Centre, Department of Environmental Sciences, Erosion and Soil and Water Conservation Group: Wageningen, The Netherlands, 2004; pp. 139–149. ISBN 90-6754-813-8. [Google Scholar]
- Steininger, M.; Wurbs, D. Bundesweite Gefährdung der Böden durch Winderosion und Bewertung der Veränderung infolge des Wandels klimatischer Steuergrößen als Grundlage zur Weiterentwicklung der Vorsorge und Gefahrenabwehr im Bodenschutzrecht; Umweltbundesamt: Dessau-Roßlau, Germany, 2017. [Google Scholar]
- Funk, R. Assessment and Measurement of Wind Erosion. In Novel Methods for Monitoring and Managing Land and Water Resources in Siberia; Mueller, L., Sheudshen, A.K., Eulenstein, F., Eds.; Springer International Publishing: Cham, Switzerland, 2016; pp. 425–449. ISBN 978-3-319-24407-5. [Google Scholar]
- Geoland. Digitales Geländemodell (DGM) Österreich 10 m × 10 m. Available online: https://www.data.gv.at/katalog/dataset/land-ktn_digitales-gelandemodell-dgm-osterreich (accessed on 17 May 2021).
- Hiebl, J.; Reisenhofer, S.; Auer, I.; Böhm, R.; Schöner, W. Multi-methodical realisation of Austrian climate maps for 1971–2000. Adv. Sci. Res. 2011, 6, 19–26. [Google Scholar] [CrossRef]
- ZAMG. Klimamittel 1981–2010. Available online: https://www.zamg.ac.at/cms/de/klima/informationsportal-klimawandel/daten-download/klimamittel (accessed on 14 May 2021).
- BFW. eBod—Digitale Bodenkarte von Österreich, 1 km-Raster. Available online: https://bodenkarte.at/ (accessed on 17 May 2021).
- Agrarmarkt Austria. INVEKOS Schläge Österreich 2020. Available online: https://geometadatensuche.inspire.gv.at/metadatensuche/srv/eng/catalog.search#/metadata/e499eacb-df06-4a6a-8175-b9745eeeadc4 (accessed on 17 May 2021).
- Statistik Austria. Agrarstrukturerhebung 2016: Schnellbericht 1.17; Statistics Austria: Vienna, Austria, 2016; Available online: https://www.statistik.at/wcm/idc/idcplg?IdcService=GET_NATIVE_FILE&RevisionSelectionMethod=LatestReleased&dDocName=116146 (accessed on 17 May 2021).
- ZAMG. Messdaten. Available online: https://www.zamg.ac.at/cms/de/produkte/klima/daten-und-statistiken/messdaten (accessed on 17 May 2021).
- Krenn, A.; Winkelmeier, C.; Cattin, R.; Müller, S.; Truhetz, H.; Biberacher, M.; Eder, T. Austrian wind atlas and wind potential analysis. DEWEK 2010. Available online: https://www.windatlas.at/downloads/20101117_Paper_Dewek.pdf (accessed on 15 September 2021).
- Holmes, J.D.; Bekele, S. Wind Loading of Structures, 4th ed.; CRC Press: Boca Raton, FL, USA, 2021; ISBN 9780367273262. [Google Scholar]
- ESA: Sentinel-2 User Handbook; European Space Agency: Paris, France, 2015. Available online: https://sentinel.esa.int/documents/247904/685211/Sentinel-2_User_Handbook (accessed on 15 September 2021).
- R Core Team. R: A Language and Environment for Statistical; R Foundation for Statistical Computing: Vienna, Austria, 2020. [Google Scholar]
- Ranghetti, L.; Boschetti, M.; Nutini, F.; Busetto, L. “sen2r”: An R toolbox for automatically downloading and preprocessing Sentinel-2 satellite data. Comput. Geosci. 2020, 139, 104473. [Google Scholar] [CrossRef]
- Geoland. Orthofoto Offline Österreich. Available online: https://www.data.gv.at/katalog/dataset/7cb3fb29-6b14-477b-a88b-a6a526b59b40 (accessed on 17 May 2021).
- BEV. Digitales Oberflächenmodell. Available online: https://www.bev.gv.at/portal/page?_pageid=713,2875583&_dad=portal&_schema=PORTAL (accessed on 17 May 2021).
- Geoland. Basemap.at Verwaltungskarte Raster Offline Österreich. Available online: https://www.data.gv.at/katalog/dataset/703fce40-6116-4836-aca4-7dddc33912ab (accessed on 17 May 2021).
- BEV. Verwaltungsgrenzen (VGD). Available online: https://www.bev.gv.at/portal/page?_pageid=713,2601287&_dad=portal&_schema=PORTAL (accessed on 17 May 2021).
- Minasny, B.; McBratney, A.B.; Wadoux, A.M.-C.; Akoeb, E.N.; Sabrina, T. Precocious 19th century soil carbon science. Geoderma Reg. 2020, 22, e00306. [Google Scholar] [CrossRef]
- BMLFUW. Digitales Geländemodell 1 m: Niederösterreich. Available online: https://www.noe.gv.at/noe/Karten-Geoinformationen/NOE_Geodaten_Angebot.html (accessed on 17 May 2021).
- Zhu, C.; Fan, X.; Bai, Z. Spatiotemporal Pattern of Wind Erosion on Unprotected Topsoil Replacement Sites in Mainland China. Sustainability 2020, 12, 3237. [Google Scholar] [CrossRef] [Green Version]
- Urban, T. Wind Erosion in the Agricultural Landscape: The Wind Erosion Equation Used in GIS: Monograph; Wydawnictwo Uniwersytetu Rolniczego: Kraków, Poland, 2013; ISBN 978-83-60633-97-7. [Google Scholar]
- Skidmore, E.L.; Woodruff, N.P. Wind erosion forces in the United States and their use in predicting soil loss. In Agriculture Handbook 346; Agricultural Research Service, U.S. Dept. of Agriculture in cooperation with Kansas Agricultural Experiment Station: Beltsville, MD, USA, 1968; p. 44. [Google Scholar]
- Moeys, J. Package “Soiltexture”. 2018. Available online: https://cran.r-project.org/web/packages/soiltexture/soiltexture.pdf (accessed on 15 September 2021).
- Saleh, A.; Fryrear, D.W. Soil roughness for the revised wind erosion equation (RWEQ). J. Soil Water Conserv. 1999, 54, 473–476. [Google Scholar]
- Zingg, A.W.; Woodruff, N.P. Calibration of a Portable Wind Tunnel for the Simple Determination of Roughness and Drag on Field Surfaces 1. Agron. J. 1951, 43, 191–193. [Google Scholar] [CrossRef]
- Zikeli, S.; Gruber, S. Reduced Tillage and No-Till in Organic Farming Systems, Germany—Status Quo, Potentials and Challenges. Agriculture 2017, 7, 35. [Google Scholar] [CrossRef] [Green Version]
- Mezősi, G.; Blanka, V.; Bata, T.; Kovács, F.; Meyer, B. Estimation of regional differences in wind erosion sensitivity in Hungary. Nat. Hazards Earth Syst. Sci. 2015, 15, 97–107. [Google Scholar] [CrossRef] [Green Version]
- ESRI Environmental Systems Research Institute. ArcGIS Pro; ESRI: Redlands, CA, USA, 2020. [Google Scholar]
- López, M.V.; de Dios Herrero, J.M.; Hevia, G.G.; Gracia, R.; Buschiazzo, D.E. Determination of the wind-erodible fraction of soils using different methodologies. Geoderma 2007, 139, 407–411. [Google Scholar] [CrossRef] [Green Version]
- Shiyatyi, E.I. Wind Structure and Velocity over a Rugged Soil Surface; Vestnik Sel.-khoz. Nauki 10: Alma-Ata, Kazakhstan, 1965. (In Russian) [Google Scholar]
- Jugder, D.; Gantsetseg, B.; Davaanyam, E.; Shinoda, M. Developing a soil erodibility map across Mongolia. Nat Hazards 2018, 92, 71–94. [Google Scholar] [CrossRef]
- Tatarko, J. Soil Aggregation and Wind Erosion: Processes and Measurements. Ann. Arid. Zone 2001, 40, 251–263. [Google Scholar]
- Morgan, R.P.C. Soil Erosion and Conservation, 3rd ed.; Blackwell: Malden, MA, USA, 2005; ISBN 978-1-405-11781-4. [Google Scholar]
- Panagos, P.; Ballabio, C.; Poesen, J.; Lugato, E.; Scarpa, S.; Montanarella, L.; Borrelli, P. A Soil Erosion Indicator for Supporting Agricultural, Environmental and Climate Policies in the European Union. Remote Sens. 2020, 12, 1365. [Google Scholar] [CrossRef]
- Zachar, D. Soil Erosion; Elsevier Scientific Pub. Co.: Amsterdam, The Netherlands, 1982; ISBN 9780080869773. [Google Scholar]
- Strauss, P.; Schmaltz, E.; Krammer, K.; Zeiser, A.; Weinberger, C.; Dersch, G. Bodenerosion in Österreich—Eine Nationale Berechnung mit Regionalen Daten und Lokaler Aussagekraft für ÖPUL: Endbericht; The Federal Agency for Water Management: Petzenkirchen, Austria, 2020; Available online: https://info.bmlrt.gv.at/dam/jcr:579b01e2-745e-4f38-83ce-1f3c87244380/Evaluierung%20%C3%96PUL%20und%20Bodenerosion.pdf (accessed on 31 August 2021).
- Panagos, P.; Borrelli, P.; Poesen, J.; Ballabio, C.; Lugato, E.; Meusburger, K.; Montanarella, L.; Alewell, C. The new assessment of soil loss by water erosion in Europe. Environ. Sci. Policy 2015, 54, 438–447. [Google Scholar] [CrossRef]
- Frielinghaus, M.; Winnige, B.; Deumlich, D.; Funk, R.; Schmidt, W.; Thiere, J.; Völker, L. Infomationsheft zum Landwirtschaftlichen Bodenschutz im Land Brandenburg: Teil Bodenerosion; Landesamt für Vebraucherschutz und Landwirtschaft: Potsdam, Germany, 1999. [Google Scholar]
- Jiang, L.; Xiao, Y.; Ouyang, Z.; Xu, W.; Zheng, H. Estimate of the wind erosion modules in Qinghai Province based on RWEQ model. Res. Soil Water Conserv. 2015, 22, 21–25. [Google Scholar] [CrossRef]
- Cornelis, W.M.; Gabriels, D. Optimal windbreak design for wind-erosion control. J. Arid Environ. 2005, 61, 315–332. [Google Scholar] [CrossRef]
- Weninger, T.; Scheper, S.; Lackóová, L.; Kitzler, B.; Gartner, K.; King, N.W.; Cornelis, W.M.; Strauss, P.; Michel, K. Ecosystem services of tree windbreaks in rural landscapes—A systematic review. Environ. Res. Lett. 2021. [Google Scholar] [CrossRef]
- Rezaei, M.; Sameni, A.; Fallah Shamsi, S.R.; Bartholomeus, H. Remote sensing of land use/cover changes and its effect on wind erosion potential in southern Iran. PeerJ 2016, 4, e1948. [Google Scholar] [CrossRef] [PubMed]
- Sharma, A. Integrating terrain and vegetation indices for identifying potential soil erosion risk area. Geo-Spat. Inf. Sci. 2010, 13, 201–209. [Google Scholar] [CrossRef]
- Woldemariam, G.; Iguala, A.; Tekalign, S.; Reddy, R. Spatial Modeling of Soil Erosion Risk and Its Implication for Conservation Planning: The Case of the Gobele Watershed, East Hararghe Zone, Ethiopia. Land 2018, 7, 25. [Google Scholar] [CrossRef] [Green Version]
- Verheijen, F.; Jones, R.; Rickson, R.J.; Smith, C.J. Tolerable versus actual soil erosion rates in Europe. Earth-Sci. Rev. 2009, 94, 23–38. [Google Scholar] [CrossRef] [Green Version]
- Ellenberg, H.; Weber, H.E.; Düll, R.; Wirth, V.; Werner, W. Zeigerwerte von Pflanzen in Mitteleuropa, 3., Durchgesehene Auflage; Verlag Erich Goltze GmbH & Co. KG: Göttingen, Germany, 2001; ISBN 9783884525180. [Google Scholar]
- Böhner, J.; Schäfer, W.; Conrad, O.; Gross, J.; Ringeler, A. The WEELS model: Methods, results and limitations. Catena 2003, 52, 289–308. [Google Scholar] [CrossRef]


| Data | Description | Data Type | Resolution (Spatial/Temporal) | Source |
|---|---|---|---|---|
| Meteorological measurements | Stational measurements at 22 stations, parameters: wind speeds, wind direction, temperature, precipitation, relative humidity, pressure, snow height | Point data | -/daily, 2010–2017 | [41] |
| Mean annual wind speeds | Wind raster of Austria, 50 m height above ground level | Rasterized | 100 m × 100 m/- | [42] |
| eBod—digital soil map | Digital soil map of Austria with parameters such as soil type, soil texture, organic content, carbonates | Vectorized | 1:25,000, based on soil profile/once | [38] |
| Field block | Field blocks 2015–2020, with cultivation data | Vectorized | 1:2500/2015–2020 | [39] |
| Sentinel-2 Level 2A | Multispectral satellite imagery | Rasterized | 10 m × 10 m/2018–2020 | [44] |
| Windbreaks | Mapped windbreaks in Lower Austria | Vectorized | continuous mapping/various years | Lower Austrian Authority for Land Reform |
| Orthophoto | Orthophoto of Austria | Rasterized | >0.15 m × 0.15 m/2020 | [47] |
| Digital surface model | Digital surface model based on laser scanning | Rasterized | 1 m × 1 m/- | [35] |
| Background information | Basemap, administrative borders | Rasterized, vectorized | various/various | [49,50] |
| WER-DIN | % of Fields | SL-RWEQ t ha−1 yr−1 | % of Fields | SL-RWEQ in t ha−1 yr−1 Classified after Zachar [68] | % of Fields |
|---|---|---|---|---|---|
| 0 (no) | 80.4 | 0–2.5 | 53.7 | 0–0.5 (weak) | 17.1 |
| 1 (very low) | 15.3 | >2.5–5 | 22.9 | >0.5–5 (slight) | 59.5 |
| 2 (low) | 3.1 | >5–10 | 16.1 | >5–15 (moderate) | 20.3 |
| 3 (moderate) | 1.1 | >10–15 | 4.2 | >15–50 (severe) | 2.9 |
| 4 (high) | 0.2 | >15–30 | 2.5 | >50–200 (very severe) | 0.1 |
| 5 (very high) | 0.0 | >30 | 0.6 | >200 (catastrophic) | 0 |
| Month | Min WF | Max WF | Mean WF |
|---|---|---|---|
| kg m−1 | |||
| January | 28.1 | 52.6 | 39.5 |
| February | 36.2 | 41.9 | 38.2 |
| March | 45.4 | 52.2 | 48.1 |
| April | 47.2 | 53.5 | 49.7 |
| May | 49.7 | 55.9 | 51.7 |
| June | 47.2 | 55.1 | 49.8 |
| July | 45.5 | 61.0 | 49.3 |
| August | 45.5 | 58.1 | 48.9 |
| September | 42.3 | 54.4 | 45.9 |
| October | 44.6 | 54.7 | 48.5 |
| November | 41.7 | 55.2 | 44.7 |
| December | 41.6 | 48.9 | 43.7 |
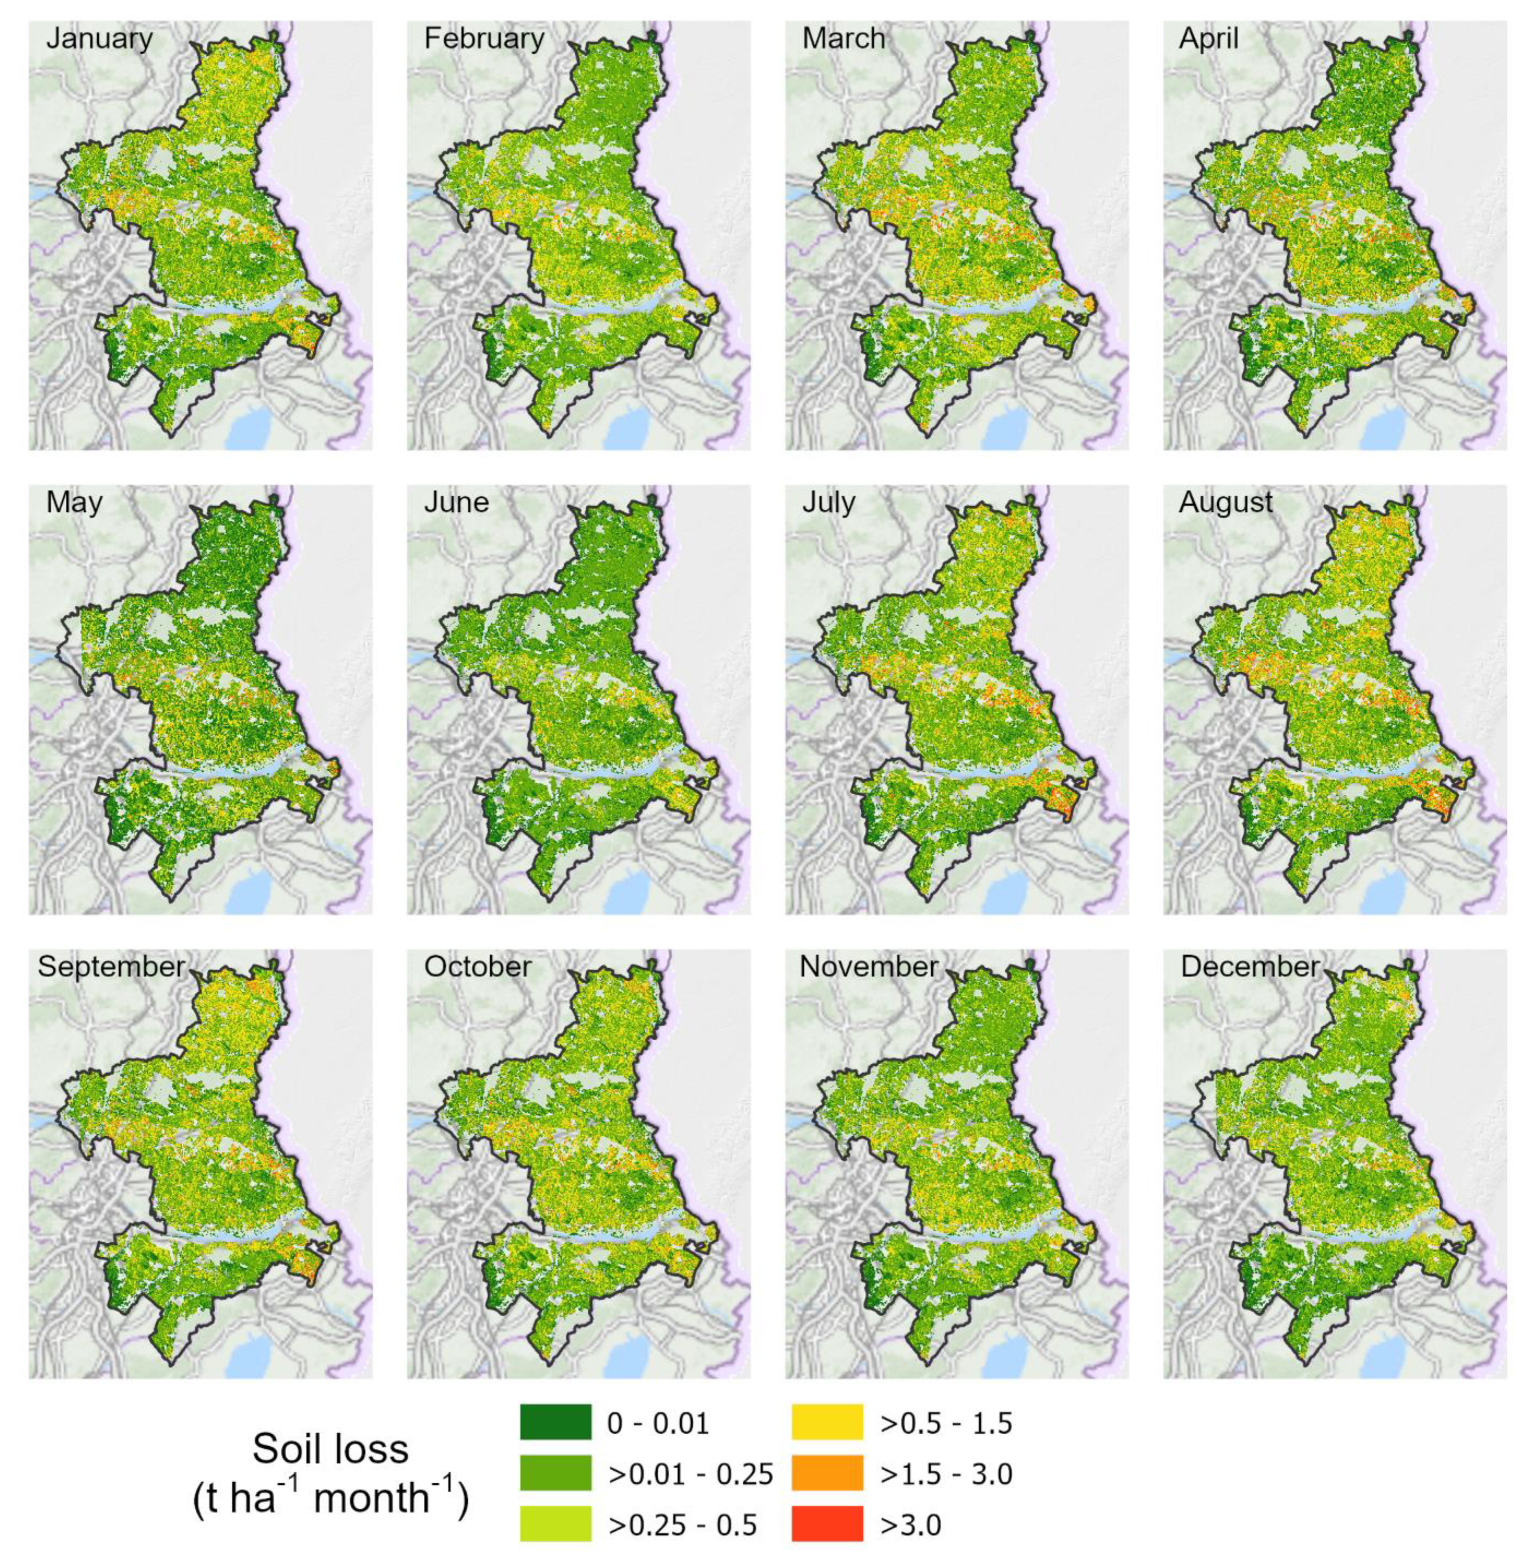
| Month | Modeled Soil Loss in t ha−1 month−1 | ||||
|---|---|---|---|---|---|
| Mean | Standard Deviation | Median | 90th Percentile | 99th Percentile | |
| January | 0.35 | 0.64 | 0.14 | 0.88 | 2.88 |
| February | 0.27 | 0.4 | 0.14 | 0.62 | 1.89 |
| March | 0.40 | 0.66 | 0.17 | 1.00 | 3.10 |
| April | 0.35 | 0.67 | 0.09 | 0.95 | 3.15 |
| May | 0.26 | 0.56 | 0.04 | 0.74 | 2.57 |
| June | 0.18 | 0.4 | 0.05 | 0.46 | 1.88 |
| July | 0.39 | 0.82 | 0.12 | 0.97 | 3.88 |
| August | 0.49 | 0.93 | 0.17 | 1.26 | 4.39 |
| September | 0.42 | 0.74 | 0.17 | 1.04 | 3.36 |
| October | 0.39 | 0.65 | 0.18 | 0.97 | 2.99 |
| November | 0.27 | 0.44 | 0.12 | 0.67 | 2.1 |
| December | 0.24 | 0.4 | 0.11 | 0.58 | 1.85 |
Publisher’s Note: MDPI stays neutral with regard to jurisdictional claims in published maps and institutional affiliations. |
© 2021 by the authors. Licensee MDPI, Basel, Switzerland. This article is an open access article distributed under the terms and conditions of the Creative Commons Attribution (CC BY) license (https://creativecommons.org/licenses/by/4.0/).
Share and Cite
Scheper, S.; Weninger, T.; Kitzler, B.; Lackóová, L.; Cornelis, W.; Strauss, P.; Michel, K. Comparison of the Spatial Wind Erosion Patterns of Erosion Risk Mapping and Quantitative Modeling in Eastern Austria. Land 2021, 10, 974. https://0-doi-org.brum.beds.ac.uk/10.3390/land10090974
Scheper S, Weninger T, Kitzler B, Lackóová L, Cornelis W, Strauss P, Michel K. Comparison of the Spatial Wind Erosion Patterns of Erosion Risk Mapping and Quantitative Modeling in Eastern Austria. Land. 2021; 10(9):974. https://0-doi-org.brum.beds.ac.uk/10.3390/land10090974
Chicago/Turabian StyleScheper, Simon, Thomas Weninger, Barbara Kitzler, Lenka Lackóová, Wim Cornelis, Peter Strauss, and Kerstin Michel. 2021. "Comparison of the Spatial Wind Erosion Patterns of Erosion Risk Mapping and Quantitative Modeling in Eastern Austria" Land 10, no. 9: 974. https://0-doi-org.brum.beds.ac.uk/10.3390/land10090974