
Spatio-Temporal Variation and Driving Forces of Land-Use Change from 1980 to 2020 in Loess Plateau of Northern Shaanxi, China


1
Institute of Geographic Sciences & Natural Resources Research, Chinese Academy of Sciences, Beijing 100101, China
2
College of Resource and Environment, University of Chinese Academy of Sciences, Beijing 100049, China
3
Department of Agricultural Economics and Rural Development, Renmin University of China, Beijing 100872, China
*
Author to whom correspondence should be addressed.
Land 2021, 10(9), 982; https://0-doi-org.brum.beds.ac.uk/10.3390/land10090982
Submission received: 27 July 2021
/
Revised: 7 September 2021
/
Accepted: 8 September 2021
/
Published: 17 September 2021
(This article belongs to the Special Issue Land Use Change and Anthropogenic Disturbances: Relationships, Interactions, and Management)
Abstract
:Land-use cover is undergoing intense change under global climate change and rapid urbanization, especially in the Loess Plateau, where ecological restoration policies like Green for Grain Project (GFGP) have been vigorously implemented since the 1980s. The main objective of this study was to distinguish the difference of spatio-temporal variation of land-use change in the two study periods of 1980–2000 and 2000–2020 at the county scales. Geographically and temporally weighted regression (GTWR) was employed to handle both the spatial and temporal heterogeneity of the driving forces for land use change. The results showed that the quantity of construction land, woodland and grassland experienced continuous growth, but arable land declined substantially. The results of GTWR model showed that the dominant influencing factors of land-use change had temporal and spatial differences in the Loess Plateau. Specifically, the implementation of GFGP and precipitation accelerated the changes in arable land, grassland and woodland. For construction land, its growth was mainly promoted by gross domestic product (GDP) and population, both of which had more obvious positive effects in the last 20 years. The findings provide a scientific basis to put forward countermeasures emphasizing sustainable land use in the Loess Plateau.
1. Introduction
Land-use/land-cover change is the most direct manifestation characterizing the interplay between anthropogenic activity and the natural environment [1]. A series of interdisciplinary joint projects targeted at land system change have been launched to coordinate the relationship between man-land relationship, including the Land-Use and Land-Cover Change project, Global Land Project (GLP) and Future Earth [2,3,4]. At the same time, there are wide scientific discussions about land-use change, including issues about land dynamic evaluation [5,6], land use transition [7,8], driving mechanism and eco-environmental effects of land-use change [9,10], and simulation modeling [11,12]. The spatial scale of the previous studies are multiple, ranging from global, national, provincial, prefecture to county level [13,14,15,16,17,18,19,20].
The Loess Plateau, where human activity has had an increasing impact on the natural environment, has been undergoing a huge transformation in land use. Before the year 2000, agriculture was the principal economic activity in this region [21]. The increase in population and the continuous requirement of grain production led to the increased expansion of farmland [22]. However, unreasonable land use brought much eco-environmental problems like land degradation, deforestation and overgrazing, which has been highly concerned by the Chinese government [23,24]. The “Grain for Green program” (GFGP) initiated in the year of 1999, aiming at alleviating overuse of farmland and restoring the damaged ecological environment, has been carried out on a large scale throughout the country [25,26]. It has promoted the conversion of arable land with slopes greater than 25° into grassland and woodland, changing both the structure and spatial distribution of regional land use [27].
In addition to the influence of ecological policy, socio-economic development and climate change also contribute to land-use change [28]. Rural-out migration under the rapid urbanization exerts profound impact on land-use change, such as extensive expansion of construction land, massive loss of arable land in highly urbanized areas and hollowing out of the countryside and abandonment of farmland in rural area in the Loess Plateau [29,30,31]. Climate change, like the gradual increase in annual precipitation, usually influences the vegetation coverage and accelerates the conversion of arable land into grassland and woodland [32,33]. Hence, exploring land-use change in the Loess Plateau in different stages of socio-economic development is an important issue to obtain sustainable land use.
Meanwhile, there exists non-stationarity spatial and temporal variations of the driving forces for land-use change, responding to specific human-environment conditions. For instance, the expansion rate of construction land in the early and late stage of urbanization is different. Urbanization refers to the gradual increase in the proportion of people living in urban areas. Thus, in the stage of rapid urbanization in large cities, construction land is expanding faster than that at the beginning of urbanization. The climate variability, shifting from drought to warming and humidification, drives the increase in the amount of woodland area and vegetation growth in the Loess Plateau [34,35]. The previous studies are mostly based on the assumption that the relationship between explanatory factors and dependent variables is homogenous over space and time [36,37,38]. Much of them ignored the spatial and temporal heterogeneity of the key factors over time.
Although a lot of studies have been conducted on land-use change and its driving forces in the Loess Plateau, there has been little comparative analysis of the spatio-temporal variations for diverse land use types in different phases. Because the “Green for Grain Project” was launched by the Chinese government in 1999, we divided the 1980–2020 period into the two periods of 1980–2000 and 2000–2020 to differentiate the influence of the GFGP, socio-economic variables and climate change to land use change. In addition, how the key factors influence the land-use change over space and time remains unclear. Hence, to fill the knowledge gaps, this paper aims to:
(1) Examine spatio-temporal evolution of land-use change and mutual conversions among diverse land-use types in Loess Plateau during the period 1980–2020;
(2) Compare the land-use change in 1980–2000 and 2000–2020 to distinguish the spatio-temporal characteristics before and after the implementation of GFGP;
(3) Assess how major factors for various land-use types changed in 1980–2000 and 2000–2020.
2. Materials and Methods
2.1. Study Area
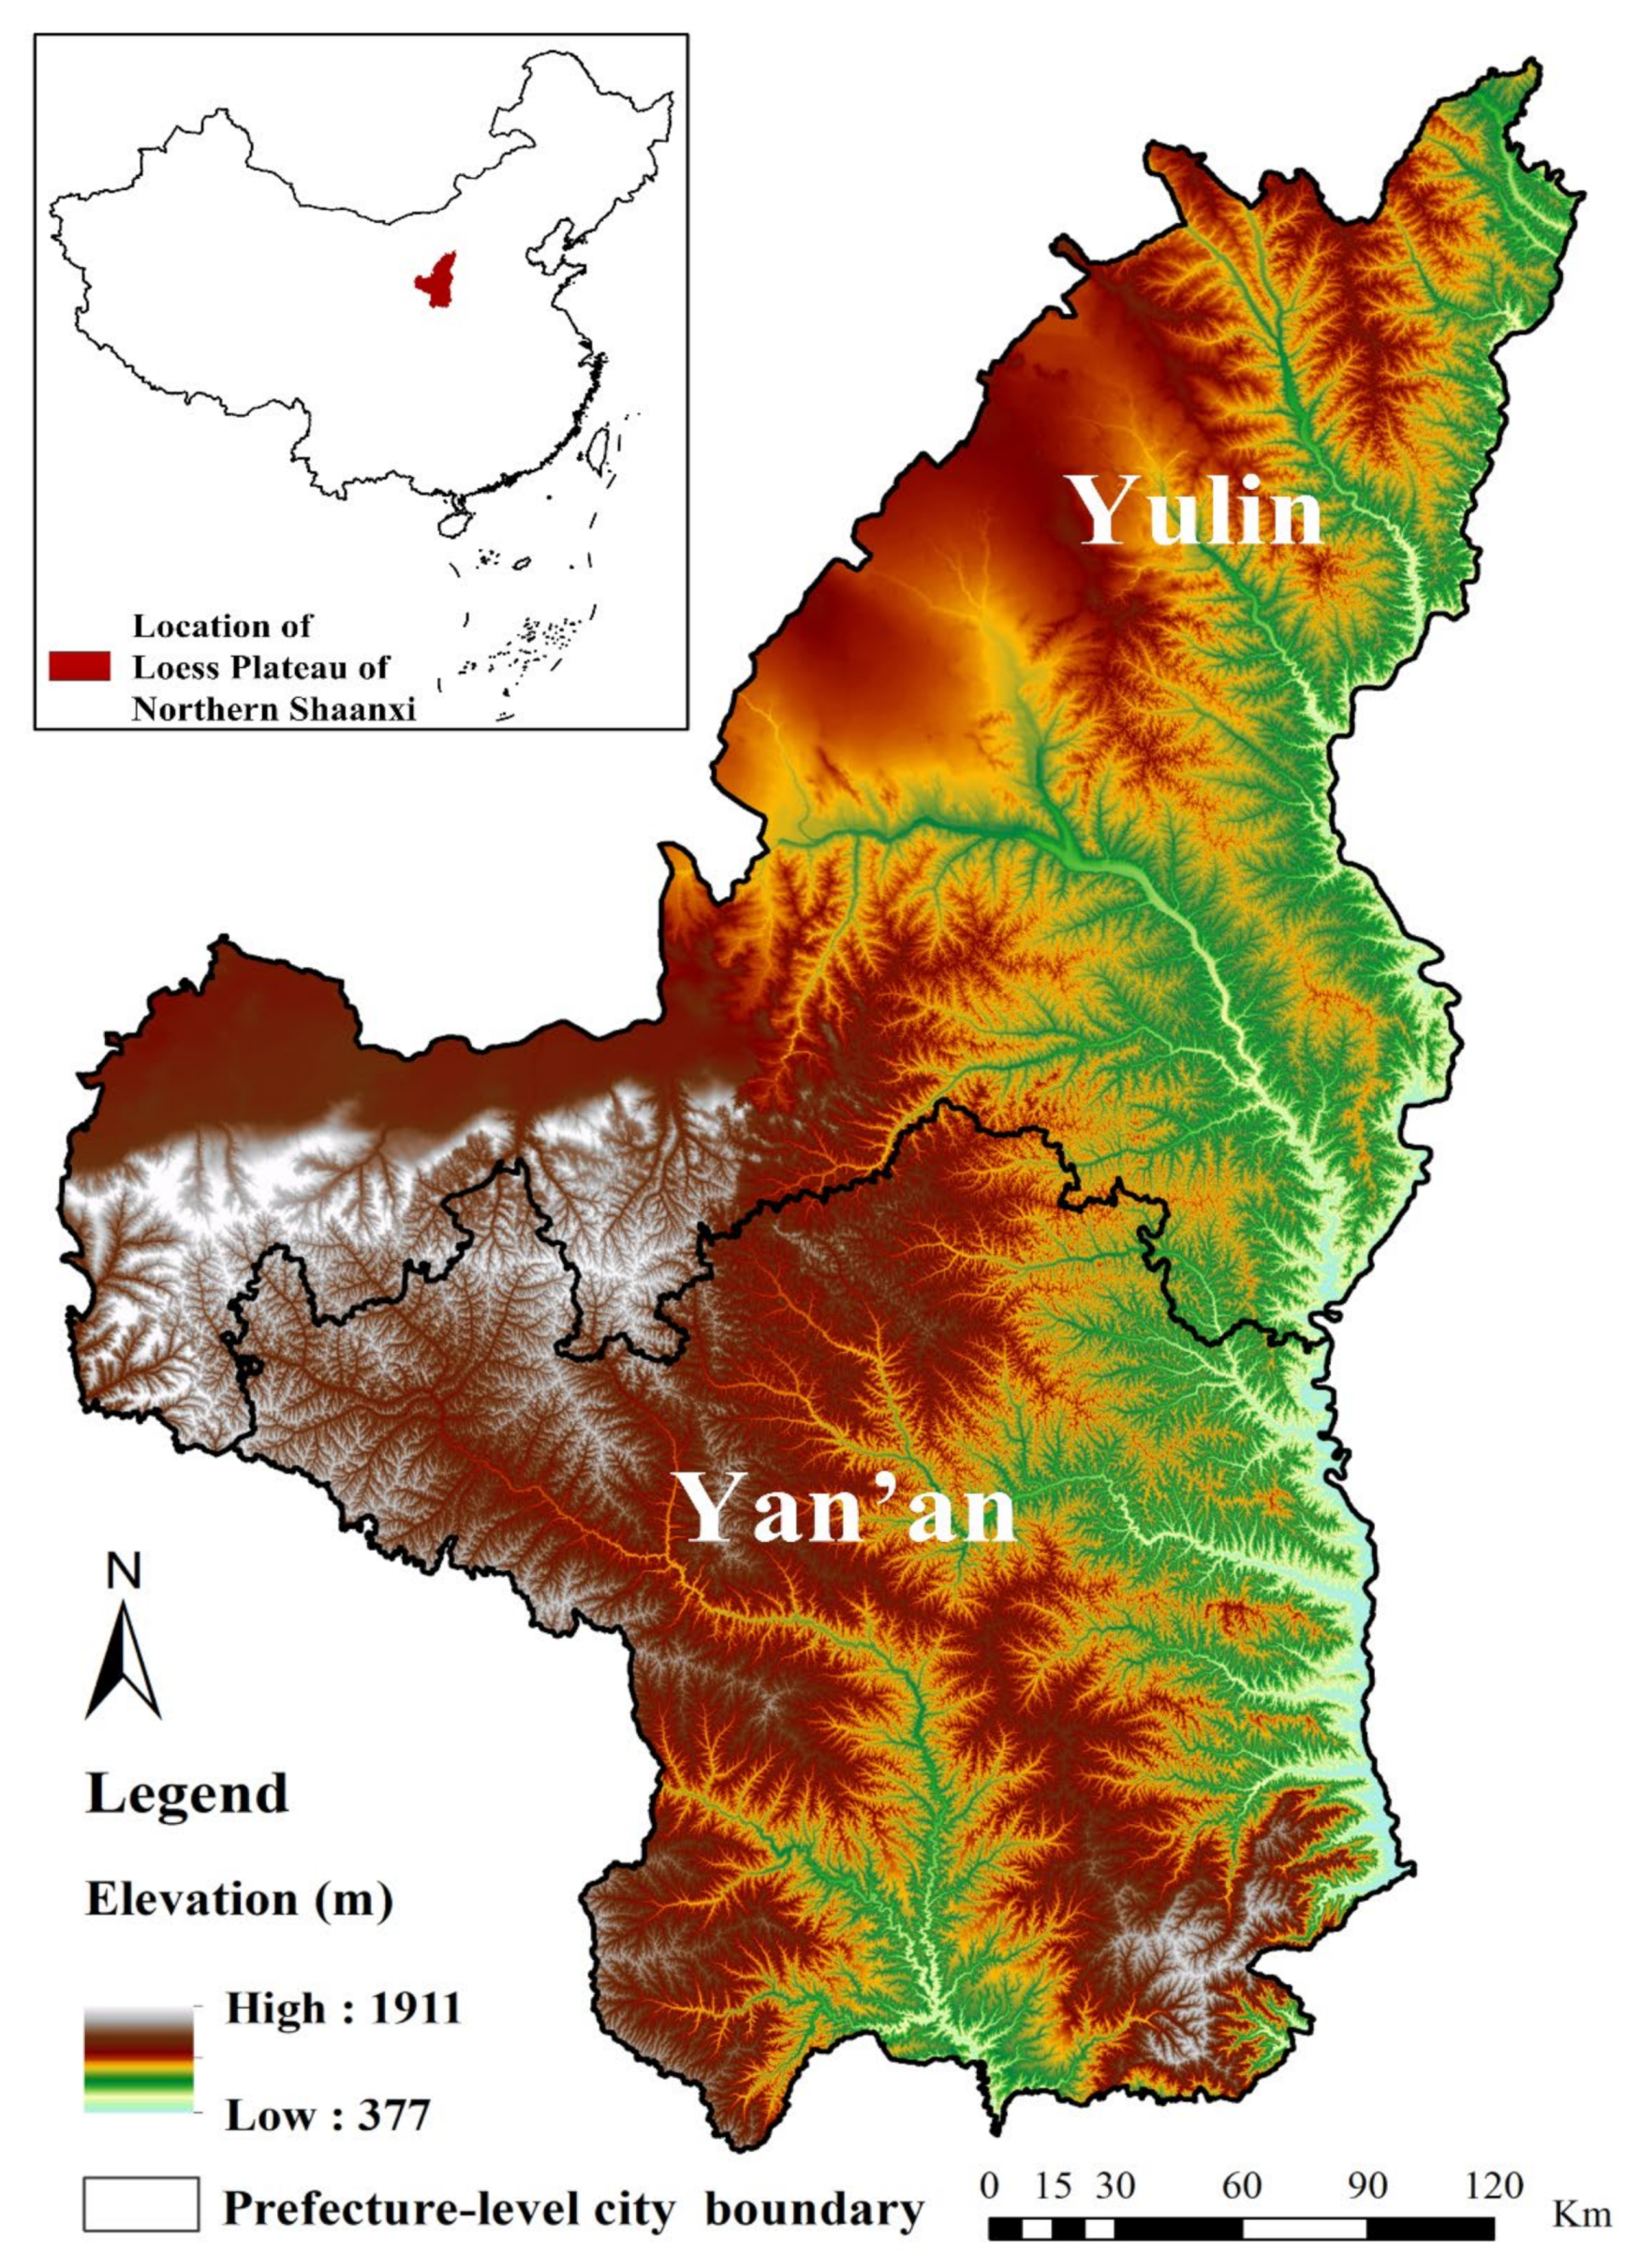
Loess Plateau of Northern Shaanxi (LPNS) is located in the north-central part of China (107°15′ E–111°15′ E, 35°21′ N–39°35′ N), which is an ecologically vulnerable region with severe soil erosion (Figure 1). It covers an area of 80,000 km2 and includes 25 counties, affiliated to Yulin city and Yan’an city in Shaanxi province. The elevation in this region gradually declines from northwest to southeast and ranges from 370 m to 2000 m (Figure 1). Landforms along the northwest part are the aeolian landforms, which gradually transition to a loess hilly-gully region in the central-east region and loess tableland to the southern part of Yan’an city. The Loess Plateau in Northern Shaanxi is characterized by an arid and semi-arid climate, and the mean annual temperature and precipitation are about 9 °C and 450 mm respectively [39]. Since the implementation of the GFGP in 1999, substantial changes in land-use structure and spatial configuration have taken place in the Loess Plateau. In addition, global climate change and socio-economic development have promoted the transformation of regional land use. Furthermore, modern agricultural geographical engineering carried out in the Loess Plateau have also profoundly affected the regional land-use patterns. Hence, studying the characteristics of spatial-temporal changes and driving forces of diverse land-use types are a significant issue.
2.2. Data Source and Processing
Land-use data, topographic data, meteorological data and socio-economic data for the Loess Plateau of northern Shaanxi were used in this study. Among them, land-use data, digital elevation model data and meteorological data were initially gathered from the Resource and Environment Data Cloud Platform of Chinese Academy of Sciences (http://www.resdc.cn). The land use data with a spatial resolution of 100 m adopted in this study spanned the period of 1980, 1990 to 2015 with a 5-year time interval. There were six land-use types involved in this study, containing arable land, woodland, grassland, waterbody, construction land and unused land. Among them, construction land includes urban-rural residential land and industrial mining land. Unused land contains land that is undeveloped or difficult to use such as sandy land, saline land, bare land, etc. Based on a digital elevation model, slope data were generated by the surface toolset provided in ArcGIS 10.2. With smooth spline interpolation employed, meteorological data were calculated by using the daily observation data over 2400 meteorological stations in China, consisting of temperature and precipitation from 1995 to 2020. Economic data were acquired from China County Statistical Yearbook from 1995 to 2020. To match the spatial reference of land-use data, all the data were geo-registered to the same coordinate system and resampled to a spatial resolution of 100 m. A panel data was constructed by incorporating the land use data and influencing factors for 25 counties from 1995 to 2020 in order to explore driving forces of land-use change. To explore the driving force mechanism, logarithmic transformations were applied to both dependent variables and independent variables.
2.3. Methods
2.3.1. Theoretical Framework
Land is one of the basic elements of agricultural production. Land-use change is the result of interaction between natural environment and anthropogenic activity which is an vital part of regional sustainable development [40,41,42]. The natural environment is the most basic factor of regional land use change, which affects the regional land resource endowment and the spatial distribution of land-use change [43]. With the adoption of advanced agricultural technology and the implementation of engineering measures such as land consolidation, human activities have broken through the limitations of the natural geographical environment and changed the spatial distribution and form of regional land use [44,45]. Human activity involving urbanization process, population growth, land use/management policies are the main driving forces of land-use change, affecting the land use in an indirect way [46].
Natural factors include the physiographic environment and climate change (Table 1). Physiographic was characterized by elevation and slope in this study, becoming the basis for the spatial distribution patterns of land-use change [47]. The steeper the terrain, the less conducive to land use. At the same time, we chose annual precipitation and annual average temperature to reflect the climate changes in the Loess Plateau of northern Shaanxi. A lot of scholars found that the increase in precipitation and temperature led to the changes of arable land and unused land [48,49]. Temperature vegetation dryness index (TVDI) was an indicator representing the degree of soil drought. The higher the TVDI, the lower the soil moisture; conversely, the lower the TVDI, the higher the soil moisture [50].
Five variables, shown in Table 1, were adopted to describe the socioeconomic changes before and after the implementation of the GFGP in the Loess Plateau. Socio-economic factors have become the key driving factors for land use change [51,52]. Population growth has usually been accompanied by an increase in food demand and dwellings which has led to an increase in demand for arable land and construction land [53]. At the same time, more unused land or waterbodies would have been occupied and reclaimed for specific land use to meet the basic needs of human beings [47]. In addition, the rapid urbanization process drives the expansion of construction land, which is predominantly converted from arable land [54]. Furthermore, the GFGP has been implemented in Loess Plateau since 1999, exerting a profound impact on the quantity and spatial patterns of land-use change [55]. A comparison of driving forces between 1995–2000 and 2000–2020 can distinguish the effect of the GFGP on land-use change.
2.3.2. Land-Use Dynamic Degree
The quantitative change of diverse land use types in various periods was measured by land-use dynamic degree (LUDD). LUDD is generally employed to reflect the range, speed and dynamic trend of land-use change [1,56]. In addition, it can compare the temporal features of various land-use types in different periods and forecast future trends of land use change [57]. The formula can be expressed as follows.
where Ki denotes the dynamic degree of the land-use type i; Ua and Ub represent the area of land use type i in the beginning and the end of the study period, respectively. T presents the length of the study period.
2.3.3. Land-Use Transfer Matrix
Based on the area of six land use types, the land-use transfer matrixes in the two periods of 1980–2000 and 2000–2020 in the LPNS were calculated in this study. The Markov transfer matrix was initially applied to describe of the state and state transition over a certain period and gradually extended to the field of land management, known as the land-use transfer matrix (LUTM) [56]. It has been widely employed in mass literatures to gain in-depth insight of the evolution process of land-use change [58,59]. It is helpful to comprehensively explain the mutual conversions among different land-use types [60,61]. The calculation process was carried out in ArcGIS 10.2.2. The calculation formula for the LUTM is shown in follows.
where Sij is the area converted from land-use type i to land use type j; i and j represent the specific land-use type at the beginning and the end of the study period; n is the number of land-use types.
2.3.4. Landscape Pattern Metrics
Landscape pattern metrics have been widely used to reveal the landscape structure and spatial processes, including indices at three spatial levels: patches, categories and landscape [62,63,64,65]. To explore the spatial patterns of diverse land-use types within the county, this study selected the mean patch fragmentation dimension (MPED) and aggregation index (AI) to measure the morphology and spatial agglomeration degree of diverse land-use types at the class level [66,67]. Shannon’s diversity index (SHDI) and Shannon’ evenness index (SHEI) were chosen to measure the landscape ecological security at the landscape level [68]. In this study, the land-use types were organized according to the administrative scopes of the 25 counties. The county-scale rasterized land use files were imported into the FRAGSTATS 4.2 software with the eight-cell neighborhood rule chosen. Arable land, woodland, grassland, waterbody, construction land and unused land were reclassified as 1 to 6, respectively.
2.3.5. Geographically and Temporally Weighted Regression
The driving factors of land-use change in the Loess Plateau of northern Shaanxi from 1995 to 2020 were detected by the geographically and temporally weighted regression (GTWR) in this study. Compared with the traditional regression model, GTWR model can simultaneously deal with both spatial and temporal heteroscedasticity [69,70,71,72]. The GTWR model was developed through the introduction of spatiotemporal weight matrix based on the initial geographically weighted regression model, which can be expressed as follows [69].
where Yi denotes the dependent variable; βi0(xi, yi, ti) presents the intercept value; independent variables are denoted by xik in the regression model; βik(xi, yi, ti) is the estimated local regression parameter; εi represents the random error term.
3. Results
3.1. Spatio-Temporal Pattern of Land-Use Change
3.1.1. Analysis of Land-Use Dynamic Degree
Land-use dynamic degrees for arable land, woodland, grassland, waterbody, construction land and unused land were calculated for the two periods of 1980–2000 and 2000–2020. Except for unused land, the absolute value of LUDD for the other five land-use types in 2000–2020 were higher than that in 1980–2000, showing more obvious change in 2000–2020. The findings showed that dramatic changes especially occurred in arable land, woodland and construction land. Compared with 1990–2000, the absolute value of LUDD for arable land, woodland and construction land in 2000–2020 rose about 13 times, 7 times and 20 times, respectively. The LUDD of unused land was relatively small, with LUDD of 1.06 in 1980–2000 and 0.30 in 2000–2020. The absolute value of LUDD for grassland and waterbody increased by two times in the second phase (Table 2).
3.1.2. Analysis of the Land-Use Transfer Matrix
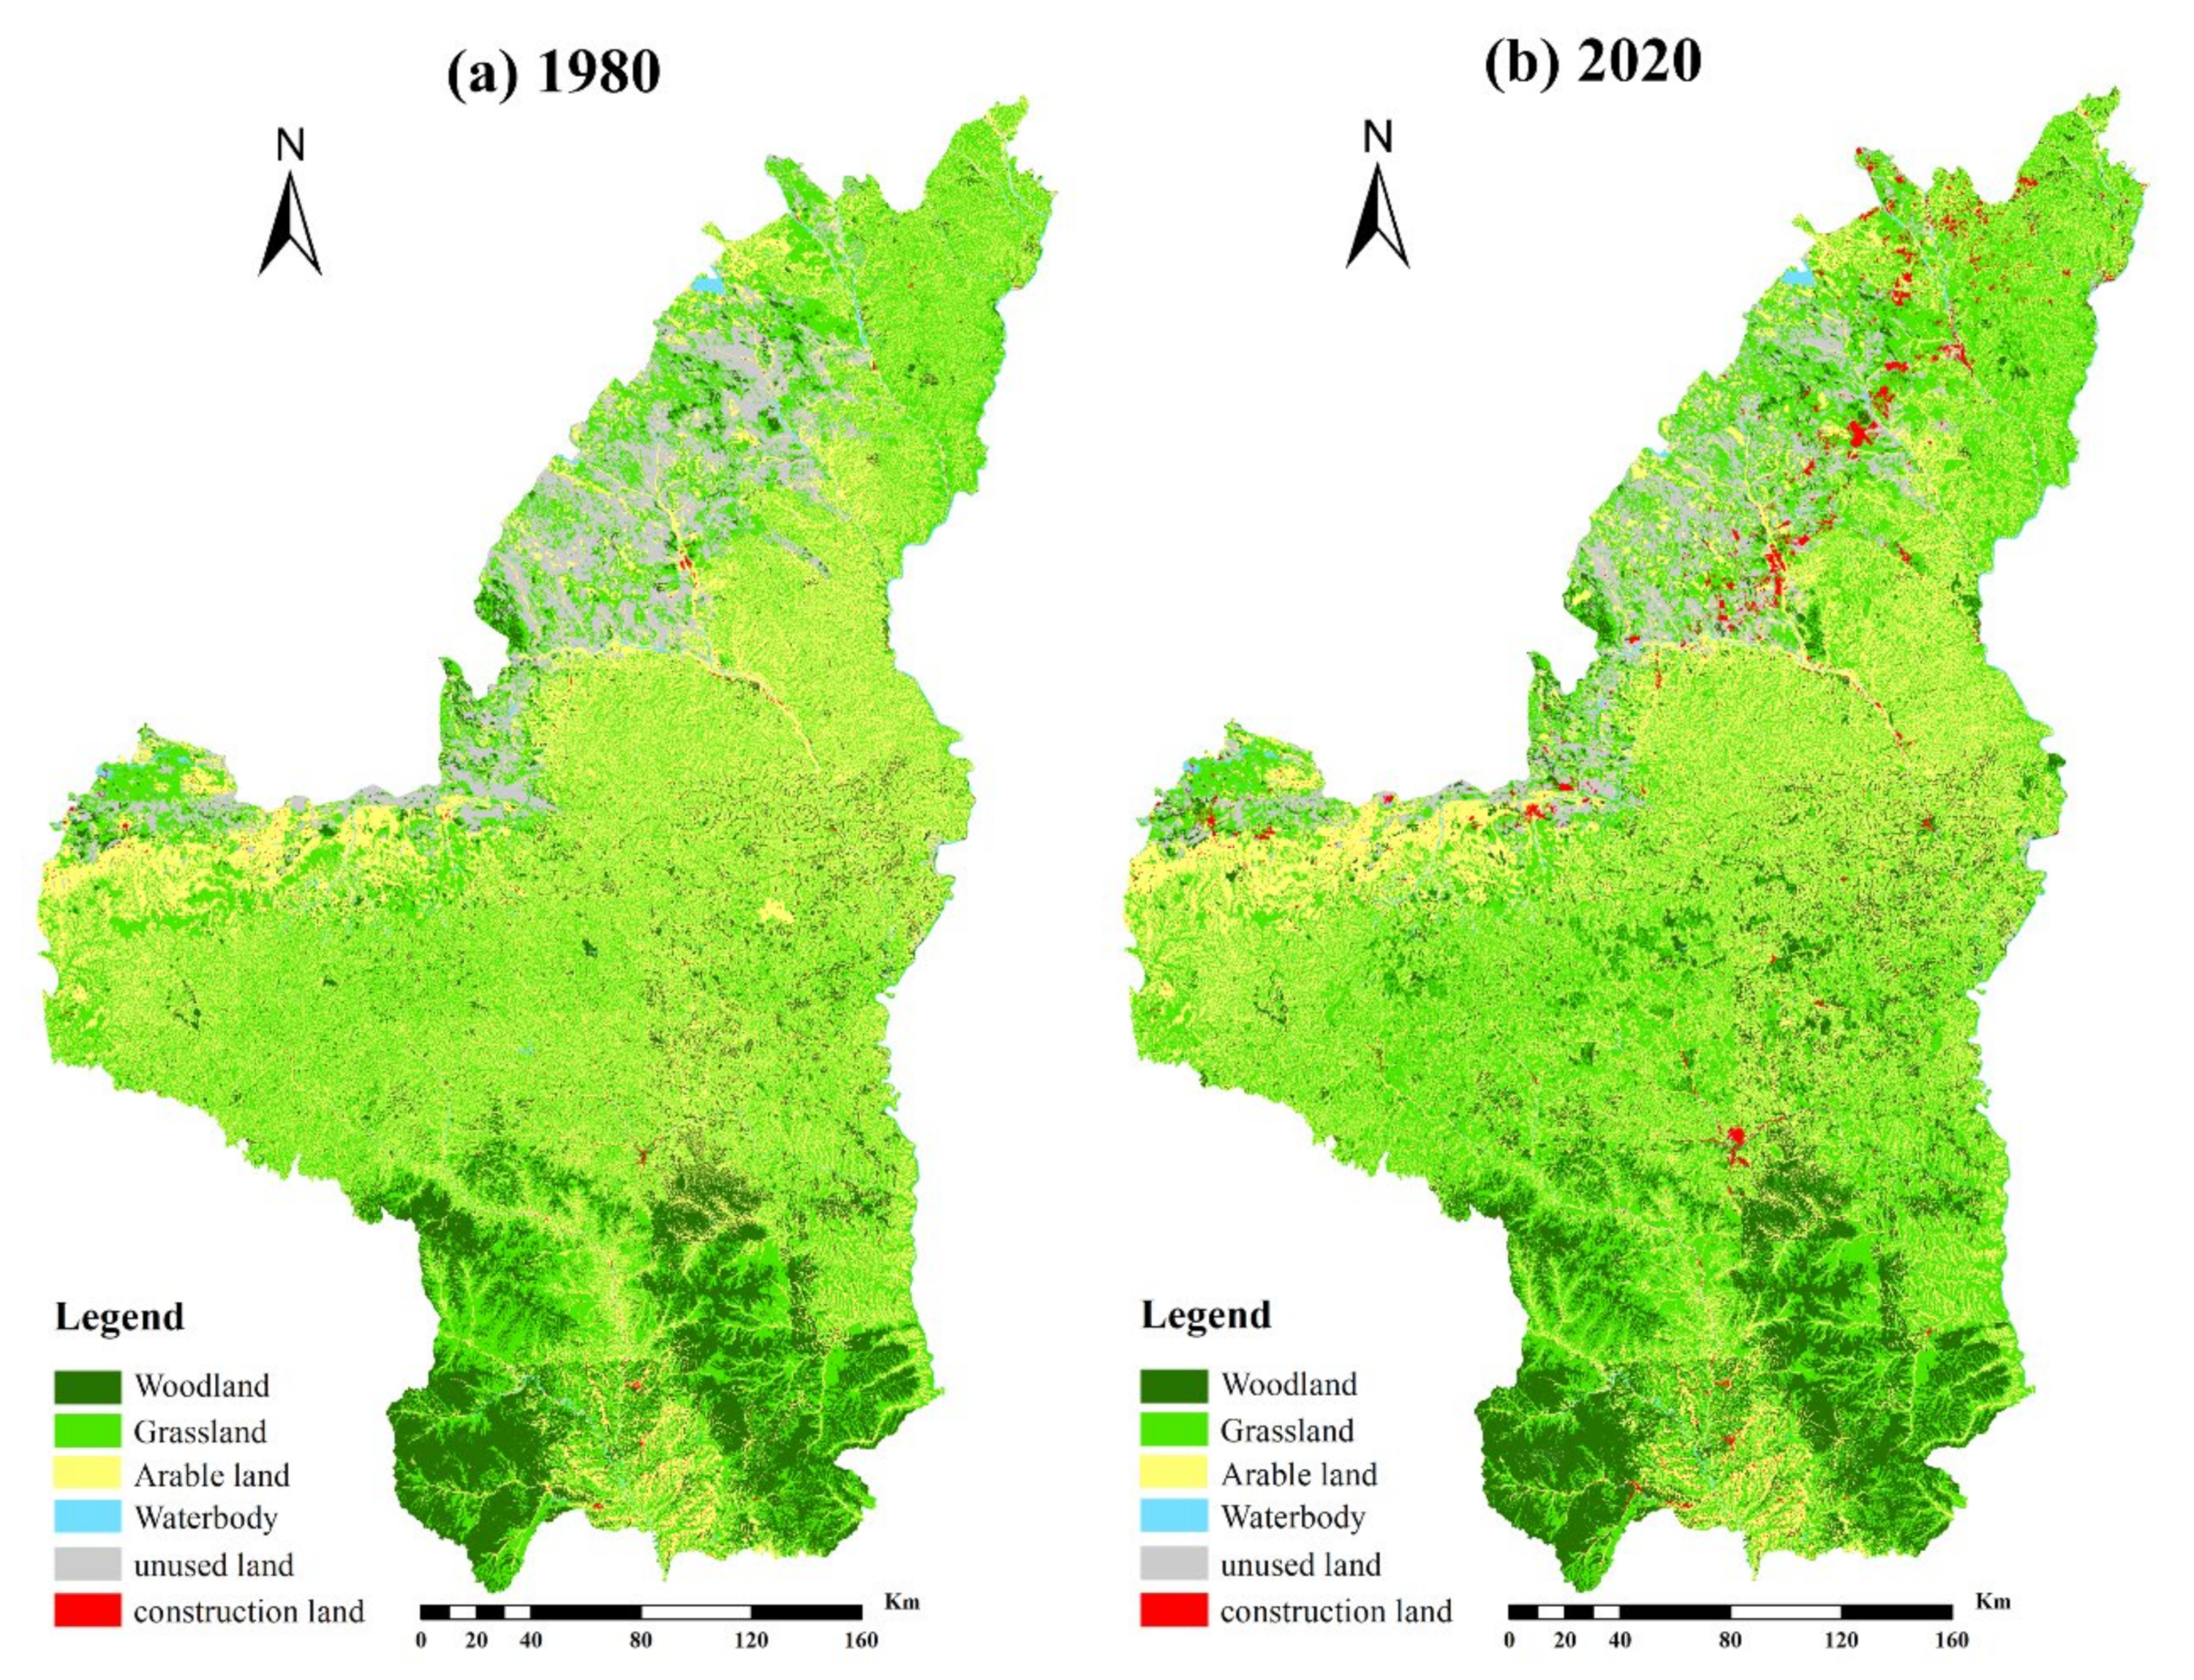
In this part, the land-use change and the mutual conversions among six land-use types in two phases were analyzed (Figure 2, Table 2 and Supplementary Table S3). On the whole, for the past 40 years, the area of woodland, grassland and construction land in the Loess Plateau of northern Shaanxi rose greatly, while arable land and unused land reduced substantially. The waterbody showed a slight upward trend. According to the comparative analysis of the two periods, there were differences in the changes of various land-use types. The arable land and waterbody changed in completely opposite directions in the two study phases in the Loess Plateau of northern Shaanxi. Conversely, other land-use types showed a similar trend in 1980–2000 and 2000–2020 (Table 2).
From 1980 to 2000, the area of arable land increased by 2.69 × 10⁴ ha, mainly derived from the conversion of grassland. In the next 20 years, the growth of arable land area stopped and decreased by 34.80 × 10⁴ ha, predominantly returning to grassland and woodland. Furthermore, the reduced area of arable land in 2000–2020 was about 13 times of the increased area in 1980–2000 (Table 2). Similarly, the amount of waterbody also showed opposite changes in 1980–2000 and 2000–2020. The decrease in waterbody during 1980–2000 was mainly replaced by grassland and arable land. In 2000–2020, the increase in waterbody area was mainly a conversion from grassland and arable land (Figure 3b).
Mutual conversions between arable land, grassland and woodland were the main land-use transfer types both in 1980–2000 and 2000–2020 (Supplementary Figure S1). In the past 40 years, the woodland showed a continuous upward trend. The newly-planted woodland was predominantly transferred from arable land and grassland both in 1980–2000 and 2000–2020. In the first 20 years, more grassland was converted into woodland when compared with the conversion from arable land to woodland. Owing to the implementation of the GFGP, most of the increase in woodland came from arable land in 2000–2020. In summary, the substantial increase in woodland and grassland were significantly due to the implementation of GFGP in the Loess Plateau.
The increase of construction land was an important reason for the loss of arable land, grassland and unused land. Also, construction land became the land-use type with the most significant changes after the implementation of GFGP. The increased amount of construction land in 2000–2020 was 22 times of the increased area in 1980–2000 (Table 2). As shown in Supplementary Figure S1a, the increase of construction land in 1980–2000 was mainly from the occupancy of arable land, contributing 74.89% of its growth. In the next two decades, much grassland, arable land and unused land were converted to construction land, making up 48.64%, 30.45% and 21.76%, respectively. Newly developed construction land was obviously found in Shenmu county, Fugu County in the north of the region in 2000–2020 (Figure 2b).
In the past 40 years, the unused land concentrated in the northwest of the Loess Plateau of northern Shaanxi was declining constantly (Figure 2a,b). The amount of unused land that was reduced in the 1980–2000 and 2000–2020 was 12.49 × 10⁴ ha and 2.82 × 10⁴ ha, respectively (Table 2). The reclamation modes of unused land in this region were gradually diversified after 2000. In 1980–2000, more than 90% of unused land was converted into grassland land as shown in Figure 3a. It was mainly reclaimed for grazing and husbandry production. In the next 20 years, unused land was converted into multiple land-use types, of which grassland accounted for the highest proportion (41.03%), followed by arable land (25.55%) and construction land (29.40%), as shown in Supplementary Figure S1b.
3.1.3. Analysis of Landscape Pattern Change
Landscape patterns in LPNS were analyzed by landscape indices, including SHEI and SHDI at the whole landscape, AI and MPED at the level of land-use classes from 1980 to 2020. From the perspective of changes at the whole landscape, Shannon’ evenness index (SHEI) in the Loess Plateau of northern Shaanxi gradually increased (from 0.67 to 0.70), but Shannon’s diversity index (SHDI) fluctuated unevenly as shown in Supplementary Figure S2. As for the landscape characteristics of six land-use types, different land-use types had diverse degrees of shape regularity and spatial agglomeration.
The shape of construction land was the most regular with the smallest MPED, followed by water and unused land. The grassland and arable land were the most irregular with the largest MPED. Much temporal changes in MPED occurred in construction land and arable land. The shape of arable land became increasingly regular, but construction land showed the opposite tendency (Figure 3a). In terms of spatial agglomeration, unused land and woodland had the largest of aggregation index (AI) value, showing well spatial agglomeration. However, waterbodies and construction land had the relatively smallest value of AI with the least spatial agglomeration. Except for construction land and grassland, the other four land-use types including woodland, waterbody, unused land and arable land showed a downward trend in the past 40 years with decreasing spatial aggregation (Figure 3b).
3.2. Driving Forces of Typical Land-Use Types
3.2.1. Model Comparison
Based on the above analysis, the area of arable land, woodland, grassland and construction land changed significantly with various characteristics in space and time. Thus, this study analyzed the driving mechanisms of these four land-use types by using the method of GTWR and ordinary least squares (OLS). According to the results of multicollinearity test and previous literatures [9,39,73], this study focused on the effects of two natural indexes and three economic indexes on land use change, including slope, precipitation, GDP, population and urbanization. The results showed that the variance inflation factors (VIFs) were less than 5 for five factors, indicating no collinearity among the selected factors. The same data were applied for OLS and GTWR models analysis with bandwidth determined by the AICc method [74]. By comparing the Akaike information criterion and R2 of two models (Table 3), it was further shown that the GTWR model had the largest R2 and the smallest AIC, better fitting than the OLS models. The results showed that land-use change was driven by the six critical variables, consisting of slope, precipitation, GDP, urbanization and population.
3.2.2. The Core Driving Forces of Diverse Land-Use Types
The Driving Forces of Arable Land
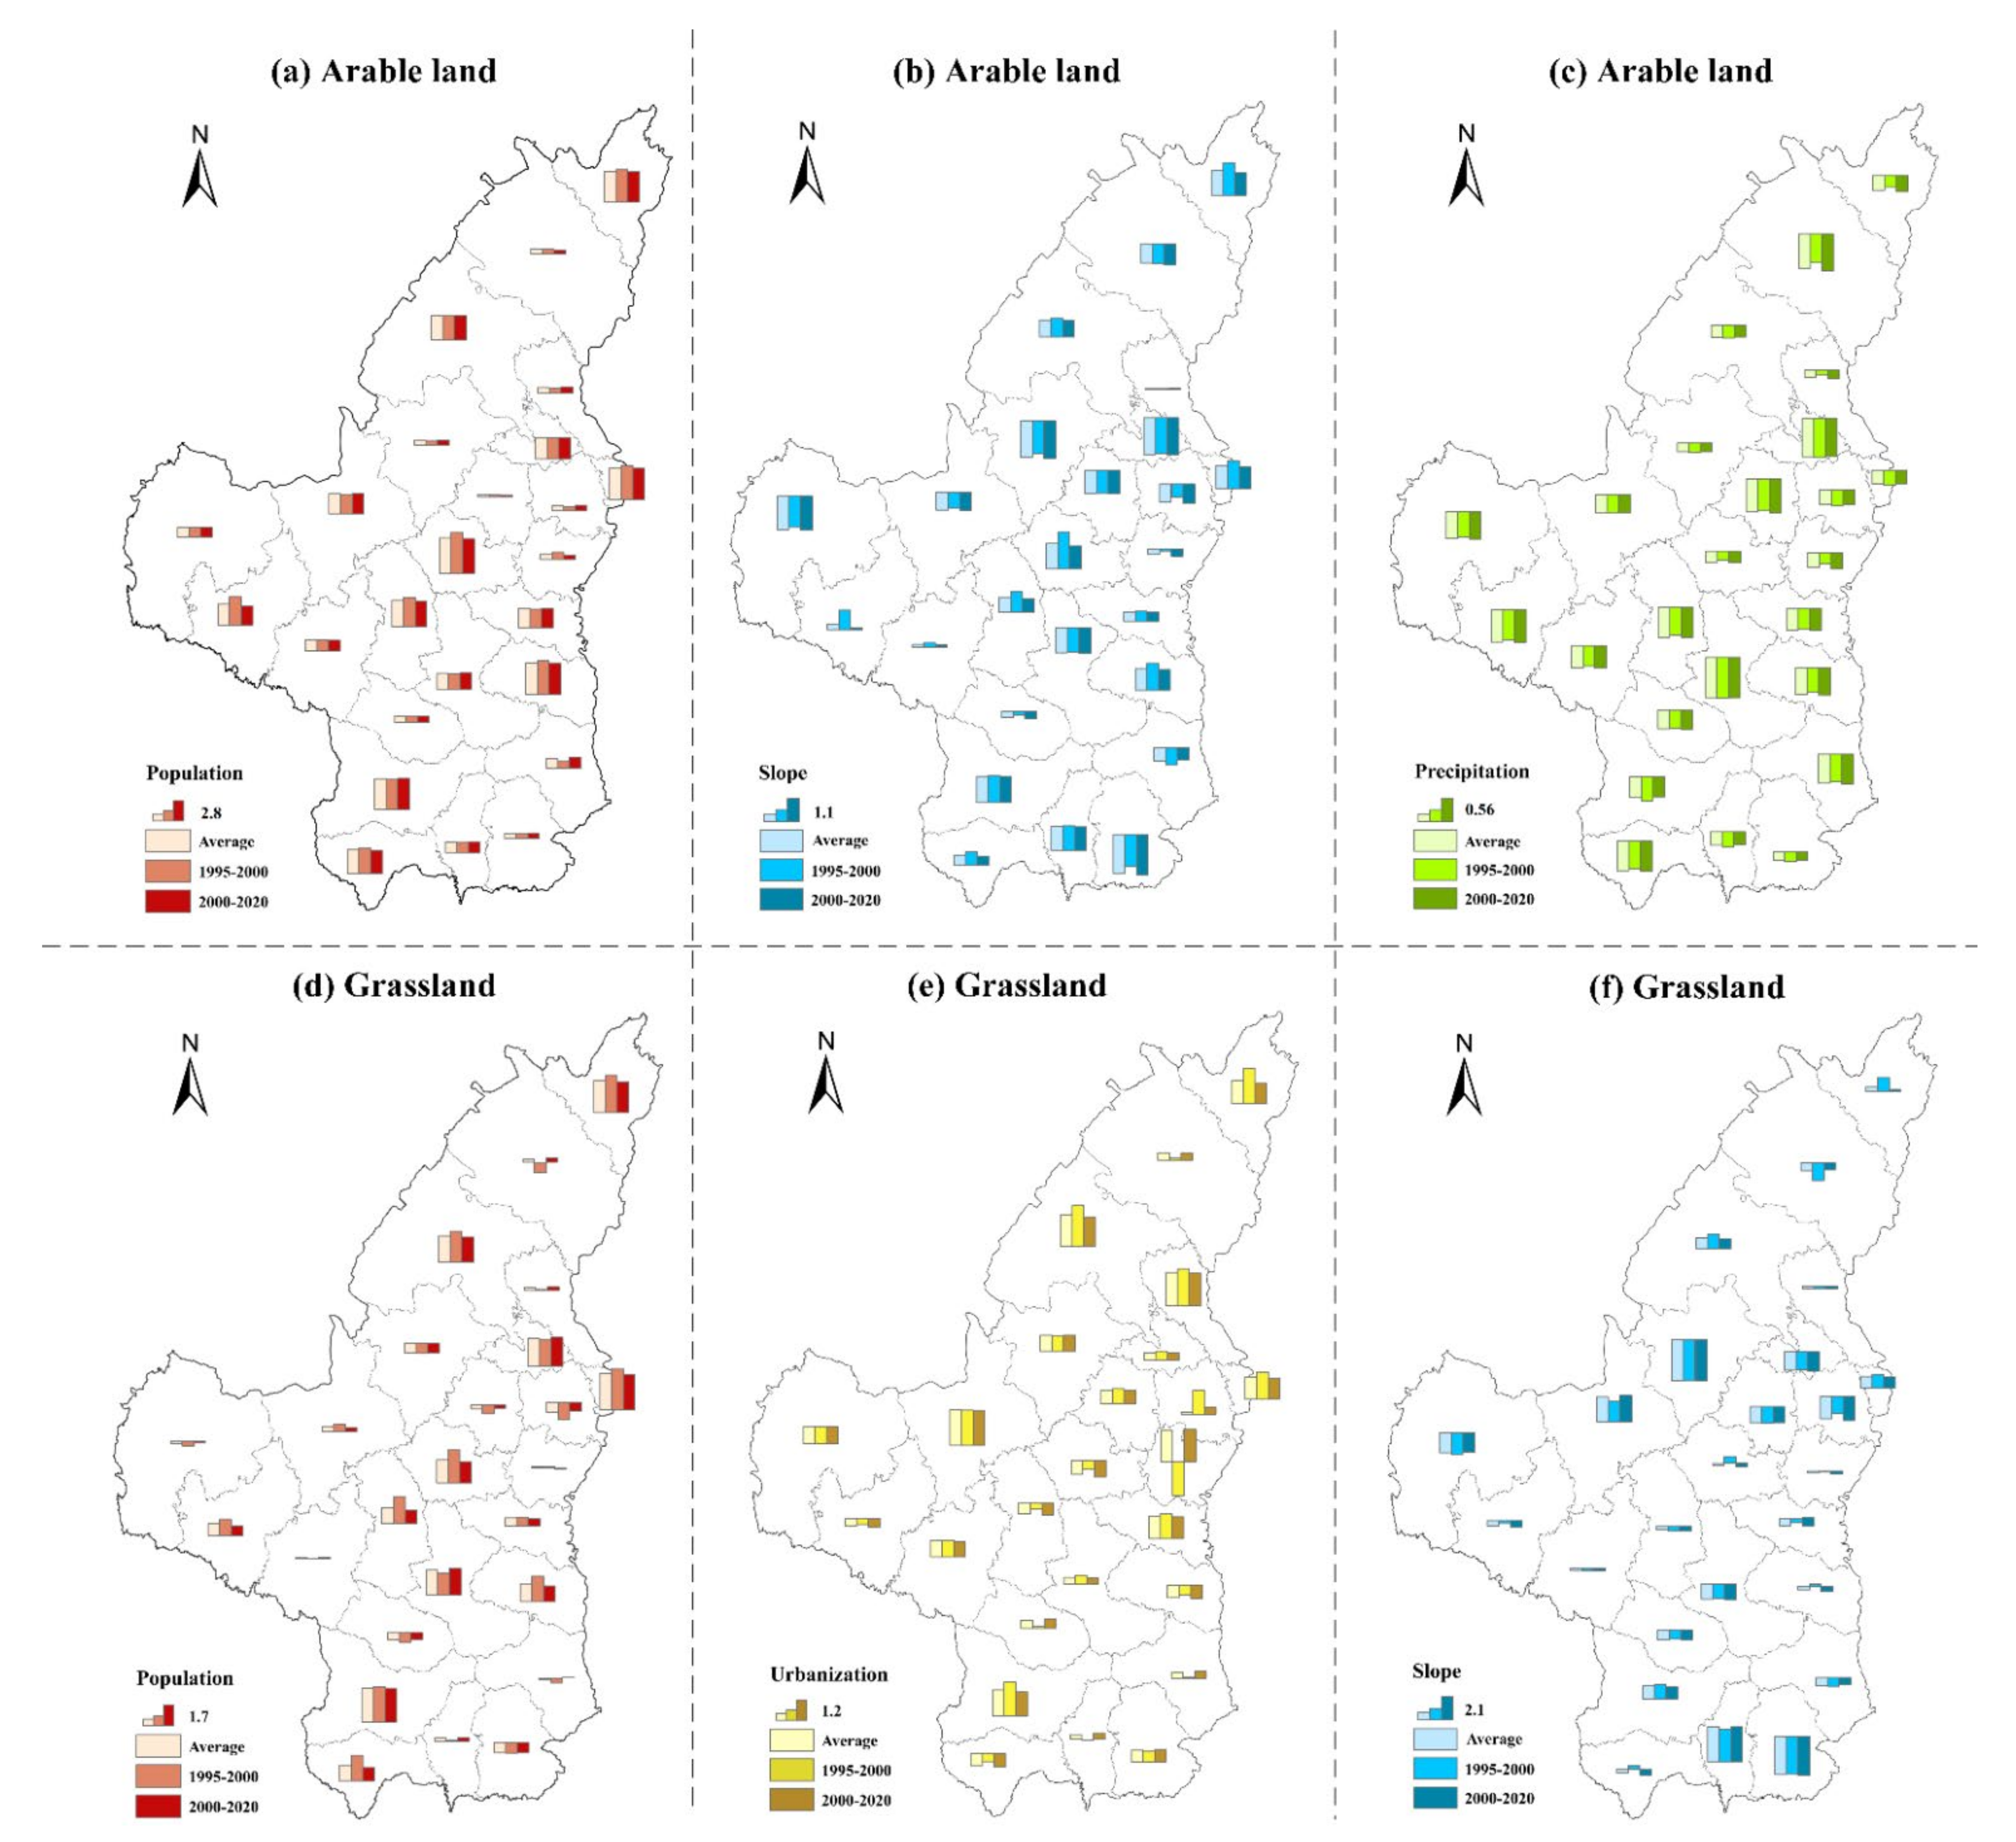
As shown in Supplementary Table S3, population, precipitation and slope were the dominant driving forces of arable land-use change with more than 80% of counties significantly associated with arable land. The mean regression coefficient of the population was the largest (2.28), followed by precipitation (−0.60) and slope (−0.15). The influence of slope on arable land-use change varied in diverse regions. Counties like Huanglong, Mizhi, Hengshan and Dingbian had a larger absolute value of regression coefficients for slope. Precipitation suggested a negative effect on arable land-use change. The counties with larger absolute regression coefficients were clustered in northeastern region such as Baota, Mizhi and Shenmu. The impact of population on arable land was positive, and the regression coefficients in central and eastern regions such as Fugu, Fuxian, Wubao, Yanchang and Zichang were relatively large (Figure 4a–c).
Comparing the average coefficient of three variables in 1995–2000 and 2000–2020, the increase in the area of arable land brought about by the increase in population declined in 2000–2020. However, the decrease of arable land area caused by the increase of precipitation rose slightly after 2000. The coefficient of slope changed from positive in 1995–2000 to negative in 2000–2020. The phenomenon of deforestation and land reclamation was prominent before 2000. In the second period, the steeper the slope, the smaller the area of arable land, showing the effect of the implementation of GFGP on arable land (Supplementary Table S3).
The Driving Forces of Grassland
As shown in Supplementary Table S3, slope, population, and urbanization were significantly correlated with grassland use change with mean regression coefficients −1.09, 1.53 and 0.96, respectively. Counties with significant coefficients for the three factors accounted for more than 80%, showing obvious spatial variations. The influence of slope on grassland had regional variations with larger absolute regression coefficients concentrated along the Great Wall in northern Shaanxi and in the southern Yan’an city. The impact of population on grassland varied at the county level. More than half of counties located in the central-eastern regions and southern Yan’an had a positive impact. The high regression coefficients were concentrated in the northeast. The increase in population in 2000–2020 had a reduced effect on the increase in grassland when compared with that in 1995–2000. The relationship between urbanization and grassland was spatially different. More than half of the counties in the central region had a positive impact. The absolute value of regression coefficients in the north-central region like Jiaxian, Jingbian, Qingjian, and Yuyang were relatively large. When the urbanization rate increased, less grassland area increased from 2000–2020 compared with 1995–2000 (Figure 4d–f).
The Driving Forces of Woodland
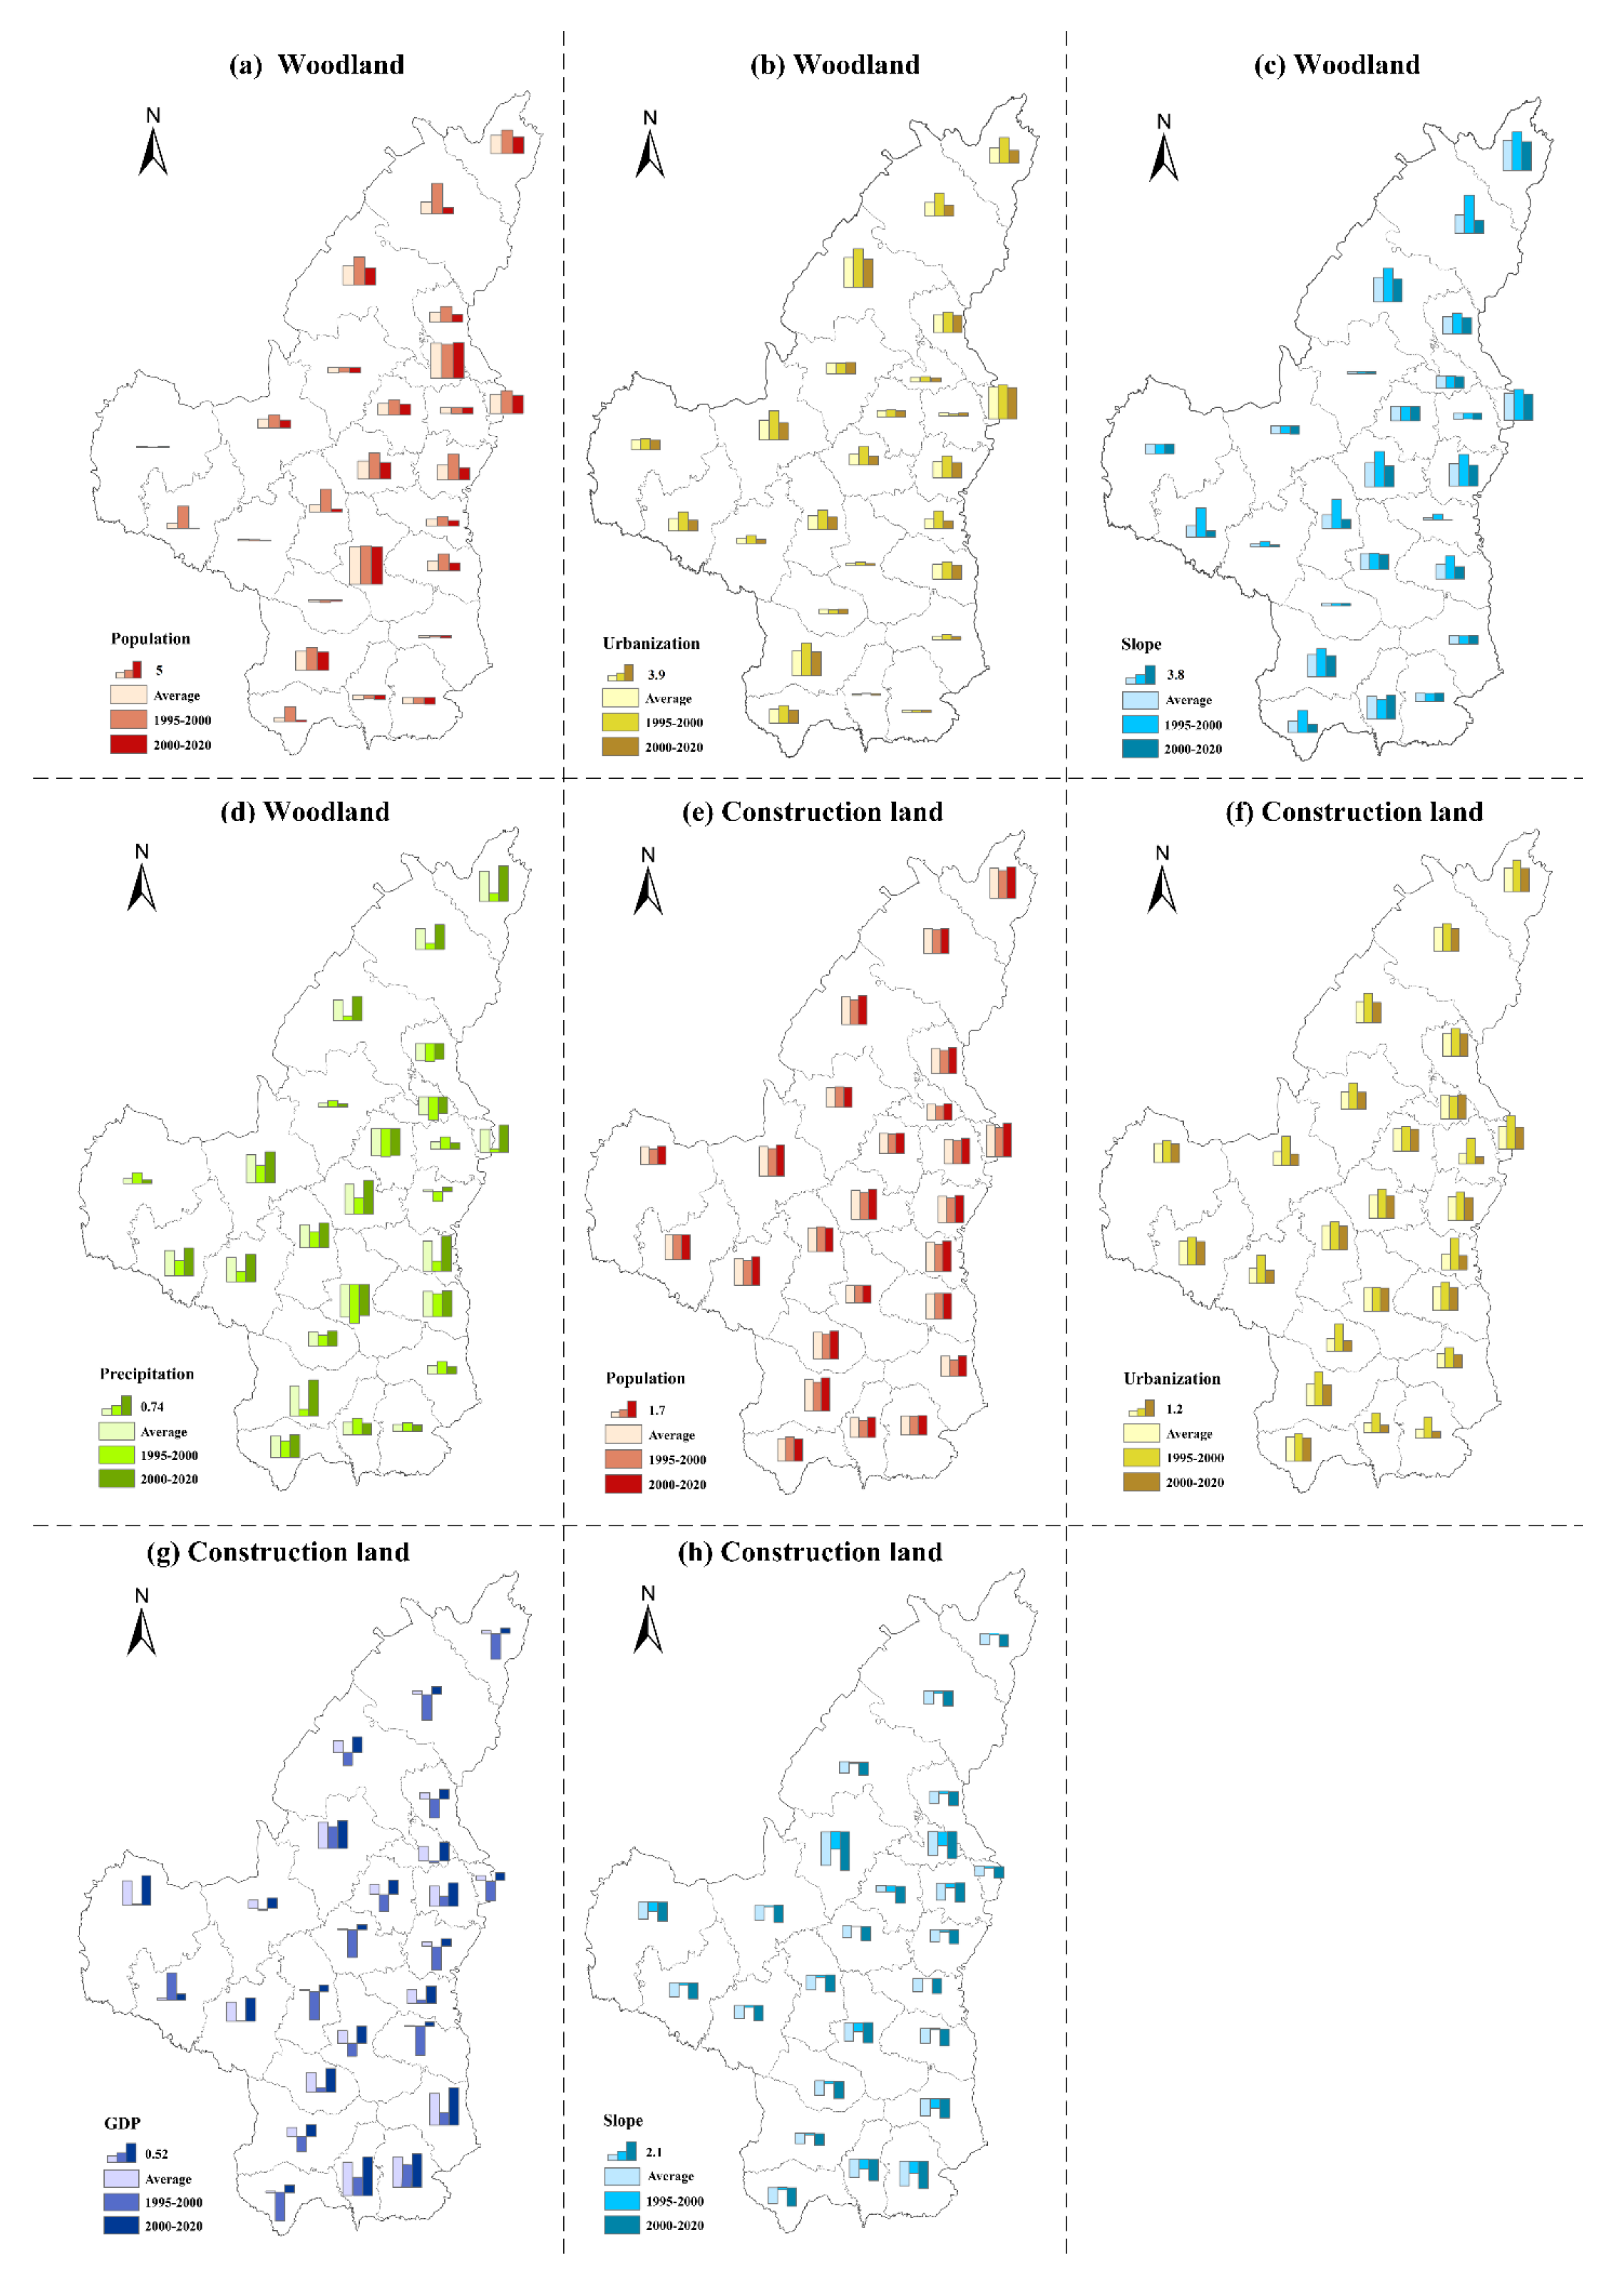
As displayed in Supplementary Table S3, slope, precipitation, population and urbanization were significantly associated with the woodland with more than 75% of counties significantly correlated with woodland. The mean regression coefficients of slope, population and urbanization exceeded 2, and precipitation had the smallest influence on woodland (0.46). The slope and precipitation had an overall positive effect on woodland. The high absolute value of regression coefficients for slope were mainly distributed in the eastern regions like Fugu, Wubao, Luochuan. Counties in south-central area had larger absolute value of regression coefficients for precipitation. The impact of population on the woodland were significant but had large spatial variations among counties. More than half of the counties’ woodland were positively correlated with population over the past 40 years. Counties in northeastern part had relatively larger absolute value of regression coefficients for population. The impact of urbanization on woodland was generally positive except for Luochuan. The counties with larger regression coefficients were distributed in Fugu, Jiaxian, Qingjian and other places in the northeast. There were generally less influences of population, urbanization and slope on woodland in 2000–2020 than in 1995–2000. Conversely, an increase in precipitation was associated with an increase in woodland in most counties in 2000–2020 (Figure 5a–d).
The Driving Forces of Construction Land
Based on Supplementary Table S3, the five variables had a strong impact on the change of construction land. The proportion of counties that had a significant impact on construction land for these five factors all reached 100%. Among them, the regression coefficient for population was the largest (2.44), followed by slope and urbanization, both exceeding 1. The impact of slope on construction land was negative. The regression coefficients in southeastern regions like Hengshan, Huangling, and Luochuan were relatively large. Compared the two periods, the less steep the slope, the grater the increase in construction area in 2000–2020 over that in 1995–2000. Population had a positive effect on construction land. The larger regression coefficients were concentrated in in the northeastern region such as Fugu, Wubao, Yuyang. Except in Ansai, Pagoda, Huangling, and Wuqi, population contributed more to the increase of construction land in the second period. Urbanization was positively correlated with construction land. The larger mean regression coefficients were distributed in the central-eastern regions. The impact of urbanization on the expansion of construction land was lower in 2000–2020 than that before 2000. The impact of GDP on construction land was overall positive with the larger regression coefficients concentrated in the southern Yan’an City and counties along the Great Wall in Northern Shaanxi. Except for eight counties concentrated in the southwest, GDP showed the opposite influence in construction land in the two phases, transitioning from negative in 1995–2000 to positive in 2000–2020 (Figure 5e–h).
4. Discussion
Large-scale reclamation in the Loess Plateau resulted in severe ecological and environmental problems such as soil erosion and soil degradation for many years [23]. Since 1999, an ecological restoration project known as the ‘Green for Grain project’ has been strictly implemented on a large scale in China including Loess Plateau. The policy restricts promoted the conversion of cultivated land with slopes greater than 25° into forest land and explicitly encourages the afforestation in barren mountains and wastelands [56]. By comparing the changes of land use before and after 2000, this study found that a large amount of arable land was converted into woodland and grassland from 2000 to 2020. The reduced area of arable land in 2000–2020 was about 13 times of the increased area in 1980–2000, confirming the effect of GFGP. A previous study found the increase in vegetation cover during 2000–2013 was more than three times that during 1990–2000 [23]. Besides the impact on agricultural land and the ecological environment, there was a greater increase in construction land in 2000–2020 accelerated by the rapid socio-economic development. We found mass unused land concentrated along the Great Wall in northern Shaanxi was converted into construction land in the period of 2000–2020. Furthermore, the proportion of construction land increased substantially, from less than 0.5% in 1980–2000 to 1.4% in 2020. The changes of diverse land-use types are consistent with previous research [38,75,76].
The land-use change has been driven by multiple factors, like geographical environment, climate change, socioeconomic conditions and regional land use policy [77,78]. However, for various land-use types, the driving factors are totally different. By comparing the land-use change in the two periods, this study found that the implementation of the GFGP was the leading driving force for the dramatic decline of arable land and the increase of woodland and grassland in Loess Plateau. In particular, slope was one of the critical factors for agricultural land change, showing a significantly negative relationship with the reduction of arable land and grassland after the year of 2000. Natural factors, including slope and precipitation, showed an increasing role in the change of woodland. The results showed that the increase in the area of woodland associated with increased precipitation was more obvious in 2000–2020 than that in 1995–2000. In short, agricultural land use was more promoted by the GFGP and natural variables.
Economic development and population growth were the vital factors in the expansion of construction land. The Loess Plateau has been experiencing a huge change in its social, economic and ecological development [27]. Based on the Shaanxi province Statistical Yearbook, it is found that Loess Plateau of Northern Shaanxi had a stable increase in the total population during this 40-year study period, and it showed a continuous upward trend. At the same time, the GDP was below 2 billion before the year 2000, climbing to more than 50 billion in 2000–2020. The results support previous findings that construction land was mainly driven by the population, GAP and urbanization [77,79]. Furthermore, the driving forces of natural and socio-economic factors on land-use change had temporal variations in the periods of 1995–2000 and 2000–2020. The growth of population and GDP had a greater positive effect on the expansion of construction land in 2000–2020 than that in 1995–2000. More newly developed construction land in this region in 2000–2020 was found in areas with gentle slopes.
Systematic analysis of land-use change provides decision-making references for the implementation of regional ecological policies, sustainable land use and the layout of regional agricultural industry. First, the implementation of the GFGP not only increases the area of woodland and improves the regional ecological environment, but also bring about the shortage of regional water resources and the water cycle at the basin scale [80,81,82]. In the future, the implementation of ecological projects should systematically consider the sustainable allocation of regional water and soil resources, especially in water-limited areas like the Loess Plateau. Second, as one of the most basic agricultural production factors, regional crop planting structure and the layout of agricultural industry need to be carried out considering the regional land resource endowment. Third, on the basis of ensuring the safety of the regional ecological environment, land-use policies and land-use/-management measures should be developed to establish suitable patterns of diverse land use and realize rational layout of agricultural production so as to ensure the grain security, improve farmers’ livelihoods, and promote sustainable development in the Loess Plateau.
5. Conclusions
Using LUDD, LUTM and GTWR, this study examined the spatial-temporal patterns and dynamic processes of land-use change in the Loess Plateau for the periods of 1980–2000 and 2000–2020. With LUDD, LUTM and the landscape indices used, the quantitative changes in diverse land-use types were analyzed.
In terms of quantitative changes of diverse land use types, the area of woodland, grassland, and construction land rose greatly, while arable land and unused land decreased substantially in the past 40 years. Specifically, the area of arable land improved slightly through conversion of grassland in the 1980–2000 period and declined dramatically in 2000–2020, mainly due to the conversion to grassland and woodland. Woodland showed a continuous upward trend and then remained stable, mainly due to the conversion from grassland in 1980–2000 and arable land in 2000–2020. The increased amount of construction land in 2000–2020 was 22 times the increased area in 1980–2000, mainly from the conversion of arable land (contributing about 74.89%). The landscape became more balanced and the degree of fragmentation of construction land decreased at the landscape level over the past 40 years. Analysis of landscape configuration at the class level showed that different land-use types have diverse degrees of shape regularity and spatial agglomeration. Based on the GTWR model results, population, urbanization and slope were the main contributors to the land-use changes. There were differences in the main driving force of various land-use types. The implementation of GFGP, precipitation and slope played a critical role in arable land, grassland and woodland. The expansion of construction land was mainly influenced by GDP and population, both of which had more obvious positive effects in the latest 20 years.
It is helpful to extend our understanding of the impact of ecological policy on land-use change and spatio-temporal differences of the impact of natural and social factors on land-use change, providing insight into the sustainable land-use in Loess Plateau in China. However, how to quantity contributions of human activities is an important hot topic, such as ecological projects and specific land-use policy. Quantifying the contribution of ecological engineering to land-use change and the eco-environmental effects of land-use change need to be intensified in future research in order to achieve sustainable land use.
Supplementary Materials
The following are available online at https://0-www-mdpi-com.brum.beds.ac.uk/article/10.3390/land10090982/s1, Figure S1: Internal conversions among diverse land use types in 1980–2000 and 2000–2020, Figure S2: The changes of landscape indices at the whole landscape, Table S1: Descriptive statistics of regression coefficients of independent variables for arable land, Table S2: Descriptive statistics of regression coefficients of independent variables for woodland, Table S3: Descriptive statistics of regression coefficients of independent variables for grassland, Table S4: Descriptive statistics of regression coefficients of independent variables for construction land.
Author Contributions
Conceptualization, X.Z. and Y.Z.; methodology, X.Z.; software, X.Z.; writing—original draft preparation, X.Z.; writing—review and editing, Y.Z.; supervision, Y.Z.; project administration, Y.Z.; funding acquisition, Y.Z. All authors have read and agreed to the published version of the manuscript.
Funding
This research was supported by the Strategic Priority Research Program of Chinese Academy of Sciences (Grant no. XDA23070301) and the National Natural Science Foundation of China (Grant no. 41871183).
Data Availability Statement
The new data were created in this study are available on request.
Acknowledgments
The authors would like to thank the anonymous reviewers for their comments and suggestions which contributed to the further improvement of this paper.
Conflicts of Interest
The authors declare no conflict of interest.
References
- Liu, J.; Liu, M.; Zhuang, D.; Zhang, Z.; Deng, X. Study on spatial pattern of land-use change in China during 1995–2000. Sci. China Ser. D Earth Sci. 2003, 46, 373–384. [Google Scholar] [CrossRef]
- Lindesay, J.A.; Andreae, M.O.; Goldammer, J.G.; Harris, G.; Annegarn, H.J.; Garstang, M.; Scholes, R.J.; Van Wilgen, B.W. International geosphere-biosphere programme/international global atmospheric chemistry SAFARI-92 field experiment: Background and overview. J. Geophys. Res. Atmos. 1996, 101, 23521–23530. [Google Scholar] [CrossRef]
- Uhrqvist, O.; Linnér, B.-O. Narratives of the past for Future Earth: The historiography of global environmental change research. Anthr. Rev. 2015, 2, 159–173. [Google Scholar] [CrossRef]
- Moran, E.; Ojima, D.S.; Buchmann, B.; Canadell, J.G.; Coomes, O.; Graumlich, L.; Jackson, R.; Jaramillo, V.; Lavorel, S.; Leadley, P. Global Land Project: Science Plan and Implementation Strategy, 1st ed.; IGBP Secretariat: Stockholm, Sweden, 2005. [Google Scholar]
- Surya, B.; Ahmad, D.N.A.; Sakti, H.H.; Sahban, H. Land use change, spatial interaction, and sustainable development in the Metropolitan Urban Areas, South Sulawesi Province, Indonesia. Land 2020, 9, 95. [Google Scholar] [CrossRef] [Green Version]
- Teklay, A.; Dile, Y.T.; Setegn, S.G.; Demissie, S.S.; Asfaw, D.H. Evaluation of static and dynamic land use data for watershed hydrologic process simulation: A case study in Gummara watershed, Ethiopia. Catena 2019, 172, 65–75. [Google Scholar] [CrossRef]
- Lambin, E.F.; Meyfroidt, P. Land use transitions: Socio-ecological feedback versus socio-economic change. Land Use Policy 2010, 27, 108–118. [Google Scholar] [CrossRef]
- Rimal, B.; Baral, H.; Stork, N.E.; Paudyal, K.; Rijal, S. Growing City and rapid land use transition: Assessing multiple hazards and risks in the Pokhara Valley, Nepal. Land 2015, 4, 957–978. [Google Scholar] [CrossRef] [Green Version]
- Bičík, I.; Jeleček, L.; Štěpánek, V. Land-use changes and their social driving forces in Czechia in the 19th and 20th centuries. Land Use Policy 2001, 18, 65–73. [Google Scholar] [CrossRef]
- Fu, B.; Wang, S.; Liu, Y.; Liu, J.; Liang, W.; Miao, C. Hydrogeomorphic ecosystem responses to natural and anthropogenic changes in the Loess Plateau of China. Annu. Rev. Earth Planet. Sci. 2017, 45, 223–243. [Google Scholar] [CrossRef]
- Verburg, P.H.; Overmars, K.P. Dynamic simulation of land-use change trajectories with the CLUE-s model. In Modelling Land-Use Change; Springer: Dordrecht, The Netherlands, 2007; Volume 90, pp. 321–337. [Google Scholar] [CrossRef]
- Atonya, S.; OLANG, L.; Morara, L. Future Land-use Changes in the transboundary Sio-Malaba-Malakisi Basin of East Africa: Simulations using the CLUE-S model and Classified Satellite Land Cover Datasets. Authorea Prepr. 2021. [Google Scholar] [CrossRef]
- Lambin, E.F.; Geist, H.J.; Lepers, E. Dynamics of land-use and land-cover change in tropical regions. Annu. Rev. Environ. Resour. 2003, 28, 205–241. [Google Scholar] [CrossRef] [Green Version]
- Cao, M.; Zhu, Y.; Quan, J.; Zhou, S.; Lü, G.; Chen, M.; Huang, M. Spatial sequential modeling and predication of global land use and land cover changes by integrating a global change assessment model and cellular automata. Earth’s Futur. 2019, 7, 1102–1116. [Google Scholar] [CrossRef] [Green Version]
- Shi, G.; Ye, P.; Ding, L.; Quinones, A.; Li, Y.; Jiang, N. Spatio-temporal patterns of land use and cover change from 1990 to 2010: A case study of Jiangsu province, China. Int. J. Environ. Res. Public Health 2019, 16, 907. [Google Scholar] [CrossRef] [Green Version]
- Huang, H.; Zhou, Y.; Qian, M.; Zeng, Z. Land Use Transition and Driving Forces in Chinese Loess Plateau: A Case Study from Pu County, Shanxi Province. Land 2021, 10, 67. [Google Scholar] [CrossRef]
- Xystrakis, F.; Psarras, T.; Koutsias, N. A process-based land use/land cover change assessment on a mountainous area of Greece during 1945–2009: Signs of socio-economic drivers. Sci. Total Environ. 2017, 587, 360–370. [Google Scholar] [CrossRef] [PubMed]
- López, E.; Bocco, G.; Mendoza, M.; Duhau, E. Predicting land-cover and land-use change in the urban fringe. Landsc. Urban Plan. 2001, 55, 271–285. [Google Scholar] [CrossRef]
- Lapola, D.M.; Martinelli, L.A.; Peres, C.A.; Ometto, J.P.H.B.; Ferreira, M.E.; Nobre, C.A.; Aguiar, A.P.D.; Bustamante, M.M.C.; Cardoso, M.F.; Costa, M.H.; et al. Pervasive transition of the Brazilian land-use system. Nat. Clim. Chang. 2014, 4, 27–35. [Google Scholar] [CrossRef] [Green Version]
- Piorr, H.P. Environmental policy, agri-environmental indicators and landscape indicators. Agric. Ecosyst. Environ. 2003, 98, 17–33. [Google Scholar] [CrossRef]
- Fu, B.J.; Zhang, Q.J.; Chen, L.D.; Zhao, W.W.; Gulinck, H.; Liu, G.B.; Yang, Q.K.; Zhu, Y.G. Temporal change in land use and its relationship to slope degree and soil type in a small catchment on the Loess Plateau of China. Catena 2006, 65, 41–48. [Google Scholar] [CrossRef]
- Zhang, Q.J.; Fu, B.J.; Chen, L.D.; Zhao, W.W.; Yang, Q.K.; Liu, B.G.; Gulinck, H. Dynamics and driving factors of agricultural landscape in the semiarid hilly area of the Loess Plateau, China. Agric. Ecosyst. Environ. 2004, 103, 535–543. [Google Scholar] [CrossRef]
- Liu, Y.; Yang, Y.; Li, Y.; Li, J. Conversion from rural settlements and arable land under rapid urbanization in Beijing during 1985–2010. J. Rural Stud. 2017, 51, 141–150. [Google Scholar] [CrossRef]
- Nendel, C.B.; Hu, Y.; Lakes, T. Land-use change and land degradation on the Mongolian Plateau from 1975 to 2015—A case study from Xilingol, China. Land Degrad. Dev. 2018, 29, 1595–1606. [Google Scholar] [CrossRef]
- Chen, L.; Wang, J.; Fu, B.; Qiu, Y. Land-use change in a small catchment of northern Loess Plateau, China. Agric. Ecosyst. Environ. 2001, 86, 163–172. [Google Scholar] [CrossRef]
- Xu, X.; Zhang, D. Evaluating the effect of ecological policies from the pattern change of persistent green patches—A case study of Yan’an in China’s loess plateau. Ecol. Inform. 2021, 63, 101305. [Google Scholar] [CrossRef]
- Liu, Y. Introduction to land use and rural sustainability in China. Land Use Policy 2018, 74, 1–4. [Google Scholar] [CrossRef]
- Fu, B.; Chen, L.; Ma, K.; Zhou, H.; Wang, J. The relationships between land use and soil conditions in the hilly area of the loess plateau in northern Shaanxi, China. Catena 2000, 39, 69–78. [Google Scholar] [CrossRef]
- Liu, Y.; Fang, F.; Li, Y. Key issues of land use in China and implications for policy making. Land Use Policy 2014, 40, 6–12. [Google Scholar] [CrossRef]
- Long, H.; Qu, Y. Land use transitions and land management: A mutual feedback perspective. Land Use Policy 2018, 74, 111–120. [Google Scholar] [CrossRef]
- Tan, M.; Li, X.; Xie, H.; Lu, C. Urban land expansion and arable land loss in China—A case study of Beijing-Tianjin-Hebei region. Land Use Policy 2005, 22, 187–196. [Google Scholar] [CrossRef]
- Fan, X.; Ma, Z.; Yang, Q.; Han, Y.; Mahmood, R.; Zheng, Z. Land use/land cover changes and regional climate over the Loess Plateau during 2001–2009. Part I: Observational evidence. Clim. Change 2015, 129, 427–440. [Google Scholar] [CrossRef] [Green Version]
- Jing, W.; Lin, Y.; Glendinning, A.; Xu, Y. Land-use changes and land policies evolution in China’s urbanization processes. Land Use Policy 2018, 75, 375–387. [Google Scholar]
- Ostwald, M.; Chen, D. Land-use change: Impacts of climate variations and policies among small-scale farmers in the Loess Plateau, China. Land Use Policy 2006, 23, 361–371. [Google Scholar] [CrossRef]
- Liu, X.; Liu, Y.; Liu, Z.; Chen, Z. Impacts of climatic warming on cropping system borders of China and potential adaptation strategies for regional agriculture development. Sci. Total Environ. 2021, 755, 142415. [Google Scholar] [CrossRef] [PubMed]
- Li, B.; Shi, X.; Chen, Y.; Jiang, Y. Quantitative assessment of the ecological effects of land use/cover change in the arid region of Northwest China. Environ. Monit. Assess. 2019, 191, 1–13. [Google Scholar] [CrossRef]
- Qin, Y.; Yan, H.; Liu, J.; Dong, J.; Chen, J.; Xiao, X. Impacts of ecological restoration projects on agricultural productivity in China. J. Geogr. Sci. 2013, 23, 404–416. [Google Scholar] [CrossRef]
- Du, X.; Zhao, X.; Liang, S.; Zhao, J.; Xu, P.; Wu, D. Quantitatively assessing and attributing land use and land cover changes on China’s loess plateau. Remote Sens. 2020, 12, 353. [Google Scholar] [CrossRef] [Green Version]
- Yao, Z.; Wang, B.; Huang, J.; Zhang, Y.; Yang, J.; Deng, R.; Yang, Q. Analysis of Land Use Changes and Driving Forces in the Yanhe River Basin from 1980 to 2015. J. Sensors 2021, 1, 1–11. [Google Scholar] [CrossRef]
- Wang, S.Q.; Zheng, X.Q.; Zang, X.B. Accuracy assessments of land use change simulation based on Markov-cellular automata model. Procedia Environ. Sci. 2012, 13, 1238–1245. [Google Scholar] [CrossRef] [Green Version]
- Ge, Y.; Zhang, K.; Yang, X. A 110-year pollen record of land use and land cover changes in an anthropogenic watershed landscape, eastern China: Understanding past human-environment interactions. Sci. Total Environ. 2019, 650, 2906–2918. [Google Scholar] [CrossRef]
- Van Asselen, S.; Verburg, P.H. Land cover change or land-use intensification: Simulating land system change with a global-scale land change model. Glob. Chang. Biol. 2013, 19, 3648–3667. [Google Scholar] [CrossRef]
- Zhou, X.; Chen, W.; Wang, Y.; Zhang, D.; Wang, Q.; Zhao, M.; Xia, X. Suitability evaluation of large-scale farmland transfer on the Loess Plateau of Northern Shaanxi, China. Land Degrad. Dev. 2019, 30, 1258–1269. [Google Scholar] [CrossRef]
- Li, Y.; Li, Y.; Fan, P.; Sun, J.; Liu, Y. Land use and landscape change driven by gully land consolidation project: A case study of a typical watershed in the Loess Plateau. J. Geogr. Sci. 2019, 29, 719–729. [Google Scholar] [CrossRef] [Green Version]
- Zhou, Y.; Li, Y.; Xu, C. Land consolidation and rural revitalization in China: Mechanisms and paths. Land Use Policy 2020, 91, 104379. [Google Scholar] [CrossRef]
- Zhou, Y.; Li, X.; Liu, Y. Rural land system reforms in China: History, issues, measures and prospects. Land Use Policy 2020, 91, 104330. [Google Scholar] [CrossRef]
- Taillefumier, F.; Piégay, H. Contemporary land use changes in prealpine Mediterranean mountains: A multivariate gis-based approach applied to two municipalities in the Southern French Prealps. Catena 2003, 51, 267–296. [Google Scholar] [CrossRef]
- Dale, V.H. The relationship between land-use change and climate change. Ecol. Appl. 1997, 7, 753–769. [Google Scholar] [CrossRef]
- Liu, H.; Deng, Y.; Liu, X. The contribution of forest and grassland change was greater than that of cropland in human-induced vegetation greening in China, especially in regions with high climate variability. Sci. Total Environ. 2021, 792, 148408. [Google Scholar] [CrossRef] [PubMed]
- Patel, N.R.; Anapashsha, R.; Kumar, S.; Saha, S.K.; Dadhwal, V.K. Assessing potential of MODIS derived temperature/vegetation condition index (TVDI) to infer soil moisture status. Int. J. Remote Sens. 2009, 30, 23–39. [Google Scholar] [CrossRef]
- Lambin, E.F.; Turner, B.L.; Geist, H.J.; Agbola, S.B.; Angelsen, A.; Bruce, J.W.; Coomes, O.T.; Dirzo, R.; Fischer, G.; Folke, C. The causes of land-use and land-cover change: Moving beyond the myths. Glob. Environ. Chang. 2001, 11, 261–269. [Google Scholar] [CrossRef]
- Ningal, T.; Hartemink, A.E.; Bregt, A.K. Land use change and population growth in the Morobe Province of Papua New Guinea between 1975 and 2000. J. Environ. Manag. 2008, 87, 117–124. [Google Scholar] [CrossRef] [PubMed]
- Liu, Y.; Zhou, Y. Reflections on China’s food security and land use policy under rapid urbanization. Land Use Policy 2021, 109, 105699. [Google Scholar] [CrossRef]
- Wang, L.; Anna, H.; Zhang, L.; Xiao, Y.; Wang, Y.; Xiao, Y.; Liu, J.; Ouyang, Z. Spatial and temporal changes of arable land driven by urbanization and ecological restoration in China. Chin. Geogr. Sci. 2019, 29, 809–819. [Google Scholar] [CrossRef] [Green Version]
- Liu, C.; Xu, Y.; Sun, P.; Huang, A.; Zheng, W. Land use change and its driving forces toward mutual conversion in Zhangjiakou City, a farming-pastoral ecotone in Northern China. Environ. Monit. Assess. 2017, 189, 1–20. [Google Scholar] [CrossRef] [PubMed]
- Zhou, Y.; Li, X.; Liu, Y. Land use change and driving factors in rural China during the period 1995–2015. Land Use Policy 2020, 99, 105048. [Google Scholar] [CrossRef]
- Pontius, R.G.; Huang, J.; Jiang, W.; Khallaghi, S.; Lin, Y.; Liu, J.; Quan, B.; Ye, S. Rules to write mathematics to clarify metrics such as the land use dynamic degrees. Landsc. Ecol. 2017, 32, 2249–2260. [Google Scholar] [CrossRef]
- Guan, D.; Gao, W.; Watari, K.; Fukahori, H. Land use change of Kitakyushu based on landscape ecology and Markov model. J. Geogr. Sci. 2008, 18, 455–468. [Google Scholar] [CrossRef]
- Zhang, R.; Lu, J. Simulation of Land Use Pattern Evolution from a Multi-Scenario Perspective: A Case Study of Suzhou City in Anhui Province, China. Int. J. Environ. Res. Public Health 2021, 18, 921. [Google Scholar] [CrossRef] [PubMed]
- Li, J.; Zheng, X.; Zhang, C.; Chen, Y. Impact of land-use and land-cover change on meteorology in the Beijing–Tianjin–Hebei Region from 1990 to 2010. Sustainability 2018, 10, 176. [Google Scholar] [CrossRef] [Green Version]
- Bachmair, S.; Weiler, M.; Nützmann, G. Controls of land use and soil structure on water movement: Lessons for pollutant transfer through the unsaturated zone. J. Hydrol. 2009, 369, 241–252. [Google Scholar] [CrossRef]
- Jenerette, G.D.; Wu, J. Analysis and simulation of land-use change in the central Arizona–Phoenix region, USA. Landsc. Ecol. 2001, 16, 611–626. [Google Scholar] [CrossRef]
- Dadashpoor, H.; Azizi, P.; Moghadasi, M. Land use change, urbanization, and change in landscape pattern in a metropolitan area. Sci. Total Environ. 2019, 655, 707–719. [Google Scholar] [CrossRef] [PubMed]
- Arora, A.; Pandey, M.; Mishra, V.N.; Kumar, R.; Rai, P.K.; Costache, R.; Punia, M.; Di, L. Comparative evaluation of geospatial scenario-based land change simulation models using landscape metrics. Ecol. Indic. 2021, 128, 107810. [Google Scholar] [CrossRef]
- Ghafouri, B.; Amiri, B.J.; Shabani, A.A.; Songer, M. Examining Relationships Between Socioeconomic Factors and Landscape Metrics in the Southern Basin of the Caspian Sea. Environ. Model. Assess. 2016, 21, 669–680. [Google Scholar] [CrossRef]
- O’Neill, R.V.; Krummel, J.R.; Gardner, R.H.; Sugihara, G.; Jackson, B.; DeAngelis, D.L.; Milne, B.T.; Turner, M.G.; Zygmunt, B.; Christensen, S.W.; et al. Indices of landscape pattern. Landsc. Ecol. 1988, 1, 153–162. [Google Scholar] [CrossRef]
- Long, H.; Heilig, G.K.; Li, X.; Zhang, M. Socio-economic development and land-use change: Analysis of rural housing land transition in the Transect of the Yangtse River, China. Land Use Policy 2007, 24, 141–153. [Google Scholar] [CrossRef]
- Na, L.; Genxu, W.; Guangsheng, L.; Yun, L.; Xiangyang, S. The ecological implications of land use change in the Source Regions of the Yangtze and Yellow Rivers, China. Reg. Environ. Chang. 2013, 13, 1099–1108. [Google Scholar] [CrossRef]
- Huang, B.; Wu, B.; Barry, M. Geographically and temporally weighted regression for modeling spatio-temporal variation in house prices. Int. J. Geogr. Inf. Sci. 2010, 24, 383–401. [Google Scholar] [CrossRef]
- Wu, R.; Li, Z.; Wang, S. The varying driving forces of urban land expansion in China: Insights from a spatial-temporal analysis. Sci. Total Environ. 2021, 766, 142591. [Google Scholar] [CrossRef]
- Mohammadnazar, A.; Mahdinia, I.; Ahmad, N.; Khattak, A.J.; Liu, J. Understanding how relationships between crash frequency and correlates vary for multilane rural highways: Estimating geographically and temporally weighted regression models. Accid. Anal. Prev. 2021, 157, 106–146. [Google Scholar] [CrossRef]
- Soltani, A.; Pettit, C.J.; Heydari, M.; Aghaei, F. Housing price variations using spatio-temporal data mining techniques. J. Hous. Built Environ. 2021, 36, 1199–1227. [Google Scholar] [CrossRef]
- Msofe, N.K.; Sheng, L.; Lyimo, J. Land use change trends and their driving forces in the Kilombero Valley Floodplain, Southeastern Tanzania. Sustainability 2019, 11, 505. [Google Scholar] [CrossRef] [Green Version]
- Shao, Q.; Zhou, Y.; Zhu, P. Spatiotemporal Analysis of Environmental Factors on the Birdstrike Risk in High Plateau Airport with Multi-Scale Research. Sustainability 2020, 12, 9357. [Google Scholar] [CrossRef]
- Cao, Z.; Li, Y.; Liu, Y.; Chen, Y.; Wang, Y. When and where did the Loess Plateau turn “green”? Analysis of the tendency and breakpoints of the normalized difference vegetation index. Land Degrad. Dev. 2018, 29, 162–175. [Google Scholar] [CrossRef]
- Liu, Y.; Li, J.; Yang, Y. Strategic adjustment of land use policy under the economic transformation. Land Use Policy 2018, 74, 5–14. [Google Scholar] [CrossRef]
- Seto, K.C.; Fragkias, M.; Güneralp, B.; Reilly, M.K. A meta-analysis of global urban land expansion. PLoS ONE 2011, 6, e23777. [Google Scholar] [CrossRef]
- He, J.; Shi, X.; Fu, Y.; Yuan, Y. Evaluation and simulation of the impact of land use change on ecosystem services trade-offs in ecological restoration areas, China. Land Use Policy 2020, 99, 105020. [Google Scholar] [CrossRef]
- Kroll, F.; Haase, D. Does demographic change affect land use patterns?: A case study from Germany. Land Use Policy 2010, 27, 726–737. [Google Scholar] [CrossRef]
- Shao, R.; Zhang, B.; He, X.; Su, T.; Li, Y.; Long, B.; Wang, X.; Yang, W.; He, C. Historical Water Storage Changes Over China’s Loess Plateau. Water Resour. Res. 2021, 57, e2020WR028661. [Google Scholar] [CrossRef]
- Jiang, C.; Wang, X.; Zhang, H.; Labzovskii, L.; Wang, J.; Liu, T. Re-orienting ecological restoration in degraded drylands for a more sustainable soil–water relationship: Non-linear boundary of limited water resources in combating soil loss. J. Arid. Environ. 2019, 167, 87–100. [Google Scholar] [CrossRef]
- Shangguan, Z.P.; Zheng, S.X. Ecological properties of soil water and effects on forest vegetation in the Loess Plateau. Int. J. Sustain. Dev. World Ecol. 2006, 13, 307–314. [Google Scholar] [CrossRef]
Figure 1.
Location and elevation map of the study area.

Figure 2.
Spatial variations of land-use change from 1980 to 2020.

Figure 3.
The landscape pattern changes for diverse land-use types.

Figure 4.
The mean regression coefficients of core factors for arable land and grassland.

Figure 5.
The mean regression coefficients of core factors for woodland and construction land.


Table 1.
Descriptive statistics of independent variables of land-use change.
| Type | Factors | Description |
|---|---|---|
| Natural factors | Elevation | The average elevation in a county |
| Slope | The average slope in a county | |
| Precipitation | The average annual precipitation in a county | |
| Temperature | The average annual temperature in a county | |
| TVDI | Mean value of TVDI from May to October in a county | |
| Economic factors | GDP | The value added of GDP each year |
| Population | The total registered population each year | |
| Urbanization | the non-agricultural registered population divided by the total registered population each year |
Table 2.
Changes in the area and land-use dynamic degree (LUDD) for the Loess Plateau of northern Shaanxi in 1980–2000 and 2000–2020.
Table 2.
Changes in the area and land-use dynamic degree (LUDD) for the Loess Plateau of northern Shaanxi in 1980–2000 and 2000–2020.
| Land Use Types | Area (Unit: 104 ha) | LUDD | ||||
|---|---|---|---|---|---|---|
| 1980–2000 | 2000–2020 | 1980–2020 | 1980–2000 | 2000–2020 | 1980–2020 | |
| Arable land | 2.69 | −34.80 | −32.11 | 0.05 | −0.61 | −0.28 |
| Woodland | 1.75 | 12.18 | 13.93 | 0.08 | 0.56 | 0.32 |
| Grassland | 7.82 | 16.99 | 24.82 | 0.11 | 0.24 | 0.18 |
| Waterbody | −0.13 | 0.21 | 0.07 | −0.10 | 0.15 | 0.03 |
| Construction land | 0.37 | 8.24 | 8.61 | 0.70 | 13.83 | 8.24 |
| Unused land | −12.49 | −2.82 | −15.31 | −1.06 | −0.30 | −0.65 |
Table 3.
Parameters from ordinary least squares (OLS) and geographically and temporally weighted regression (GTWR) models.
Table 3.
Parameters from ordinary least squares (OLS) and geographically and temporally weighted regression (GTWR) models.
| Land Use Types | Model Types | AICc | R2 |
|---|---|---|---|
| Arable land | OLS | 237.81 | 0.51 |
| GTWR | 196.49 | 0.77 | |
| Woodland | OLS | 386.98 | 0.47 |
| GTWR | 316.49 | 0.84 | |
| Grassland | OLS | 322.22 | 0.23 |
| GTWR | 230.72 | 0.79 | |
| Construction land | OLS | 381.49 | 0.52 |
| GTWR | 393.24 | 0.65 |
Publisher’s Note: MDPI stays neutral with regard to jurisdictional claims in published maps and institutional affiliations. |
© 2021 by the authors. Licensee MDPI, Basel, Switzerland. This article is an open access article distributed under the terms and conditions of the Creative Commons Attribution (CC BY) license (https://creativecommons.org/licenses/by/4.0/).
Share and Cite
MDPI and ACS Style
Zhou, X.; Zhou, Y. Spatio-Temporal Variation and Driving Forces of Land-Use Change from 1980 to 2020 in Loess Plateau of Northern Shaanxi, China. Land 2021, 10, 982. https://0-doi-org.brum.beds.ac.uk/10.3390/land10090982
AMA Style
Zhou X, Zhou Y. Spatio-Temporal Variation and Driving Forces of Land-Use Change from 1980 to 2020 in Loess Plateau of Northern Shaanxi, China. Land. 2021; 10(9):982. https://0-doi-org.brum.beds.ac.uk/10.3390/land10090982
Chicago/Turabian StyleZhou, Xue, and Yang Zhou. 2021. "Spatio-Temporal Variation and Driving Forces of Land-Use Change from 1980 to 2020 in Loess Plateau of Northern Shaanxi, China" Land 10, no. 9: 982. https://0-doi-org.brum.beds.ac.uk/10.3390/land10090982
Note that from the first issue of 2016, this journal uses article numbers instead of page numbers. See further details here.