
Territorial Analysis of the Survival of European Aid to Rural Tourism (Leader Method in SW Spain)


Department of Art and Territorial Sciences, University of Extremadura, 10003 Cáceres, Spain
*
Author to whom correspondence should be addressed.
Land 2021, 10(10), 1030; https://0-doi-org.brum.beds.ac.uk/10.3390/land10101030
Submission received: 28 July 2021
/
Revised: 22 September 2021
/
Accepted: 27 September 2021
/
Published: 30 September 2021
(This article belongs to the Special Issue Sustainable Rural Development: Strategies, Good Practices, and Opportunities Ⅱ)
Abstract
:Due to the problems of the European rural environment, the European Union introduced territorial development strategies called the Leader Method (LEADER Initiatives and the now extinct PRODER Operational Programs implemented only in Spanish territory). The objective was to activate the economic development of these areas, to maintain the population and to slow down the migration and aging processes. During the last 25 years, these initiatives have been implemented in European rural areas, and more particularly in Extremadura, establishing new activities such as rural tourism, which has become the economic backbone of many families, complementing agricultural incomes. The development of rural tourism has led to the implementation of accommodation and catering services throughout Extremadura, adapting to the new tourist demands. However, after 25 years, its sustainability has been very different, with contextual variables that have conditioned its success. Therefore, it is necessary to analyze the economic sustainability of the tourism offer financed by Leader and the extinct Proder in order to identify the factors that have determined its success in a territory with very diverse characteristics. For this purpose, a methodology based on two statistical analysis techniques (principal component analysis and cluster analysis) has been designed to establish behavioral patterns through the different context variables used. The results obtained have shown that factors such as investment, location, the presence of protected resources and accessibility are determining factors for the survival of the tourism offer.
1. Introduction
Currently, the European Union (EU) considers 44% of its territory to be rural in character [1], understanding rural areas (1 km² population grid cells) to be those whose population density is (usually) less than 300 inhabitants per km² and/or fewer than 5000 inhabitants. In these rural areas, since the mid-20th century, a significant reduction in population has been taking place, from 47.7% of the European population in 1960 to 25.3% in 2019 [1,2], with Spain being one of the European countries with the highest percentage of rural depopulation, especially in the second half of the 20th century [3]. This loss of population has led to significant changes in the economic functions of rural areas, with a considerable decline in employment in the agricultural sector, the traditional economic base of families, and the emergence of new activities focused mainly on the service sector, such as tourism [4].
Since 1950, the EU has been advocating the development of the agricultural sector in these areas through the Community Agricultural Policy (CAP), with the aim of making the agricultural sector competitive, generating optimal incomes for farmers, and allowing the population to remain in these areas. However, although agriculture continues to be a strategically important policy sector and is the main sign of identity that determines the rural environment, most rural areas have become increasingly less dependent on agriculture [5], due to its low profitability and the incursion of other economic sectors that have complemented agricultural income. The introduction of new activities arose in the EU with a change of strategy at the end of the 20th century, when the development of rural areas was included as a policy with its own character supported by sustainable development [6,7]. Within these new rural development strategies, in 1990 the EU created the Leader Initiative, aimed at co-financing new economic activities in rural areas (tourism, creation of SMEs, rehabilitation, etc.). European governments were based on the idea of local development, combining a bottom-up local development model with a top-down development model at the European, national and local levels. That is to say, an endogenous [8] and bottom-up local development model that starts from the autochthonous population, the administrations (town hall) and the business and social fabric (associations, cooperatives etc.) at the local level that, together with the LAG, are in charge of deciding the development strategies and the projects to be co-financed. This is a top-down development model in which the national administrations (regional and national governments) and the EU (EAFRD Funds) fund and review (through evaluation systems) the development strategies and the projects implemented. This methodology was developed as a pilot initiative in 217 European territories through Local Action Groups (LAGs). These groups, or non-profit associations, are responsible for the implementation of Leader in the territories and are formed by local economic, political and social agents.
The Leader initiative ended in 1994 with such good results that in mid-1995 the European Commission (Official Journal of the European Communities (94/C 180/12) [9]) approved a new programming period, Leader II (1994–2000). This new period was created with the aim of continuing to promote the diversification of economic activities in rural areas, through innovative and cooperative actions, extending its funding to new territories. In Spain, the number of applications to participate in the new period was much higher than the funding received (of the 152 applications, 79 LAGs were selected [10]), so in 1996 the Operational Program Proder (Operational Program for the Development and Economic Diversification of Rural Areas 1996–2000) was approved at the national level for those Leader II applications that had not been eligible for funding in Spain. Proder was integrated into the Community Support Framework for structural interventions in Spanish Objective 1 regions (those European regions whose gross domestic product per capita is less than 75% of the European average) [10,11]. It involved complementary aid to the Leader Community Initiative [12], with similar objectives, except for the obligation to finance cooperation projects and to be as innovative. After the end of these two programs, Leader + and Proder II (2000–2006) (Council Regulation (EC) No. 1260/1999 of 21 June 1999, and Royal Decree No. 2/2002 of 11 January 2002 [12,13]) were initiated with the objective of continuing to make progress in increasing the potential of the territories with new, more long-term strategies. Leader + and Proder II were in force until 2006. After the end of these periods, there was a reform of the European Structural Funds, which established that LAG investments were determined by the European Agricultural Fund for Rural Development (EAFRD) regulation, which included Leader as one of its funding axes. This new period, called EAFRD, was in force from 2007 to 2013 and included the LAGs managing both the Leader initiative and the Proder Program.
The Leader Initiative and the Proder Program were based on the creation of different strategic actions to achieve their objectives. In general, these strategic measures or actions were aimed at enhancing the value of local and rural heritage, promoting training, rural tourism, the creation and maintenance of SMEs, crafts and services, as well as the revaluation of agricultural and forestry production and environmental conservation [8]. Within these measures, rural tourism became one of the activities with the greatest potential to complement the income of areas deeply affected by depopulation and the crisis of the traditional agricultural production model [14], being one of the activities with the greatest funding at the European level [15]. This initiative favored the creation and improvement of accommodation and catering services throughout the rural geography [16,17].
In Spain, tourism was one of the most heavily financed measures during the early periods of the Leader and the Proder Program. This fact was caused by the excessive overcrowding of sun and beach tourism, which motivated the search for new destinations, and by a change in the paradigms of tourists at the national level, who began to look for new forms of weekend leisure away from large urban agglomerations, but close in distance (it is estimated that 70% of tourists live less than 200 km away [18]). As a result, Spanish rural areas saw tourism as a way to activate their economies and mitigate regressive demographic processes.
Extremadura, the case study, is characterized as one of the most rural Autonomous Communities in Spain; 76.8% of its municipalities have less than 2000 inhabitants and account for only 20.8% of the regional population. In addition, its population density is 25.5 inhabitants/km2, the second lowest in Spain, with a national average of 93 inhabitants/km2. Between the 1960s and 1970s, Extremadura lost around 800,000 active farmers who emigrated out of the region [19,20], mainly to urban and industrial areas, in search of better jobs. This population loss began to stabilize in the early 1980s, when the 1973 economic oil crisis forced some industrial workers to return to rural areas due to a lack of job offers, since urban areas could no longer absorb the agricultural surplus. Since then, the rural areas of Extremadura have continued to lose population, although much more slowly than in the 1960s, due to high mortality rates and low birth rates. The aging and weak natural growth of the population, together with the lack of job opportunities, is conditioning the rural environment, becoming a factor of repulsion of the active and young population of the municipalities with a smaller population [21]. Due to all this, Extremadura is one of the least developed regions in the EU; its GDP is still below 75% of the European average, with an excessive dependence on an uncompetitive agricultural sector.
For all these reasons, Leader and Proder have been operating in the region from Leader I, with four LAGs, to the present, with 24 LAGs. These 24 LAGs include all the municipalities except the four urban centers: Badajoz, Cáceres, Mérida and Plasencia. One of the most developed sectors under the Leader Initiative and the Proder Program in the region has been tourism. This has allowed the creation and improvement of accommodation and catering services in areas that would not have been possible without this aid, as well as the development of projects and initiatives that have allowed the incorporation of this region into national and international tourist flows, attracting thousands of tourists every year [22].
The importance of the Leader Method, the Proder Program and tourism in rural areas is also evident in the scientific field, since there are a large number of studies that reflect this. Of note are the studies by Candela Hidalgo et al. [23], on the potential of tourism in mountain areas with reference to the number of accommodations and catering services financed under Leader, or the studies by Tirado-Ballesteros and Hernández-Hernández [24], analyzing the social and economic repercussions of investments in rural tourism in Castilla-La Mancha during Leader and Proder. It is also necessary to mention the analysis of Yubero Bernabé and García Hernández [25], on the evolution of the tourism offer financed by Leader in Aragón or the study of Morán Rodríguez and Sotelo Navalpotro [26] on the benefits of Leader + on tourism in the northern mountains of Madrid Also, in the Valencian Community, the studies by Pitarch and Arnandís [27], analyze the impact of Leader and Proder policies on the tourism sector, including an analysis of the increase in tourism offer promoted by these aids, or in Extremadura by Nieto and Cárdenas that analyze the distribution of Leader and Proder aids to tourism in Extremadura [28,29]. With reference to Proder, the studies by Castellano-Álvarez et al. [30,31], on the limitations of rural tourism as a way of diversifying the economy in mountain areas are worth mentioning.
The importance that tourism has had on Spanish rural areas is undeniable, and this has promoted the creation of a tourist offer with the intention of complementing family economies. The articles cited above are just a smaller sample of the direction taken by scientific studies based on tourism financed by Leader and Proder. However, despite the importance of investment in tourism enterprises, the studies on their long-term sustainability are limited. In this case, the study by Santos et al. [32], analyzing the survival of all businesses created in Alentejo (Portugal) during Leader+ through binary choice models. The analyses carried out by Navarro et al. [33], about the evolution of the enterprises created during Leader, differentiating by measures: Tourism, SMEs and empowerment of agricultural and endogenous production, in three local action groups in Andalucía. Finally, the study carried out by Castellano-Álvarez et al. [30], on the limitation of tourism to diversify rural economies through interviews with owners of rural lodgings, among other business. This study was carried out in a territory financed under the Proder Program.
To this end, the objective of this project was to study the evolution of tourism businesses created under Leader and the Proder Program, in one of the regions that has benefited the most from these aids: Extremadura. We use a methodology that allows determining which variables are affecting the sustainability of these businesses, and thus create a pattern of behavior that will help the implementation of future businesses.
This article is an innovation in its field of study and also allows corroborating the effectiveness of a less-developed methodology in the field of tourism and especially in studies on the degree of success of accommodations and catering businesses: cluster analysis together with principal component analysis. Cluster analysis, unlike PCA, will allow the grouping of data on the basis of the characteristics of the municipalities analyzed, taking into account 100% of the variance, so that the groups are the most homogeneous among themselves. The use of PCA together with cluster analysis provides more information than the use of either method alone [34].
2. Materials and Methods
2.1. Study Area
Extremadura is a region in Southwestern Spain bordering Portugal, with a population of just over 1 million inhabitants and an area of more than 40,000 km2, which means that the population density is 25 inhabitants/km2, well below the national average of 94 inhabitants/km2. It is a predominantly rural region with a GDP below 75% of the European average, with significant demographic and economic problems. Extremadura is characterized by a series of physical, demographic and economic features that have enabled the region to benefit from rural development aid since the early 1990s. In general, the region lags slightly behind other Spanish regions, due to its peripheral location and its border with Portugal, as well as the complicated orography of part of its territory. These characteristics have conditioned the demographic and economic development of its population. This, together with its scarce industrial development caused by a late incorporation to the industrialization process, a scarce accessibility and a fast development of the service sector, have conditioned the economy of Extremadura’s families. All this has caused the emigration of a population in continuous decline, except for the main centers of the region: Badajoz, Cáceres, Mérida and Plasencia.
All this has made it possible for aid programs such as Leader and Proder to have been implemented in the region for 30 years, since 1991 in four GAL: Sierra de Gata, Valle del Jerte, Alcántara and La Serena. The good results obtained meant that during Leader II the number of LAGs increased to 10, and in the first period of the Proder Program, Proder I (1995–2000), 12 more LAGs joined the program. During the following stages, the number increased to 24, 10 in the case of Leader +, so that the number of LAGs in Leader was maintained, and 14 in the Proder Program, adding two LAGs to the previous 12. For the following period, the Proder Program was extinguished and the 14 LAGs were included in EAFRD, the third financing period 2007–2013 (Figure 1). Therefore, the entire Extremadura territory, except for the four urban areas, Badajoz, Cáceres, Mérida and Plasencia, was included in this aid. In these LAGs, tourism has been implemented as an activity capable of complementing agricultural income and slowing down or mitigating regressive demographic processes.
2.2. Database
The first methodological step of this project was to collect all data related to the Leader Initiative, from Leader II (1995–2000) to EAFRD (2007–2013), and the Proder Program, Proder I (1995–2000) and Proder II (2000–2006). Neither the last funding period, Leader 2014/2020, has been included, as it has not been finalized, nor Leader I, as it is considered a pilot experience. These data, obtained from the Junta de Extremadura, were added to an Excel file and then georeferenced with ArcGis software. For this purpose, the postal address of each of the projects was used together with the Iberpix viewer, which allows obtaining coordinates and adding this information to the original data. Once the different layers were created in point format in ArcGis, one for each period, a homogenization of the projects was carried out based on the financed measure. For this purpose, the homogenization developed by authors Nieto and Gurría [35], was used, which classifies projects into seven different actions: Action 1, encompasses projects that finance LAG management costs; Action 2, financing in training and employment; Action 3, projects related to tourism; Action 4, intended to finance projects in SMEs, crafts and services; Action 5 and Action 6, valorization of agricultural and forestry production as well as the conservation and improvement of heritage and the environment; and finally Action 7, cooperation. In addition to the type of measure, the volume of investment was added, and within this, the volume of private investment.
Then, projects intended to finance the management costs of the LAGs themselves were eliminated, as well as the projects that made up the cooperation and professional training measures because they were not related to tourism businesses. The rest of the projects were analyzed one by one to check if they financed any type of accommodation or catering business. Therefore, projects that had financed SMEs that were tourism infrastructure or projects within the agricultural valorization measure that created new accommodation or catering services and that had been related to a farm were also reviewed. In total, more than 1000 projects, of the more than 8000 initial projects, financed some type of accommodation and catering services business. These 1000 projects were also classified into the different types of tourism infrastructure in accordance with regional tourism laws in order to obtain greater homogenization in their treatment. The classification was as follows:
- –
- Hotel Accommodations: include accommodations classified as hotels, hostels, hotel-apartments, guesthouses and inns.
- –
- Rural Accommodations: rural houses, rural hotels and rural apartments.
- –
- Non-hotel Accommodations: hostels, camping sites and tourist apartments.
- –
- Catering Service: cafeterias, pubs and restaurants.
The next step was to check whether they were in operation. To do this, we first checked if they were still active in the tourism infrastructure database, provided by the Junta de Extremadura, which shows the companies that are currently active in the region. In cases where the business did not appear in the database, it was complemented with another database called SABI (the SABI database was developed by the company Bureau van Dijk as a web tool with information on Spanish and Portuguese companies. It was designed as a tool for financial analysis and strategic marketing with information on company balance sheets, global positioning in the markets) and, finally, through field work with Internet searches and consultations with Local Action Groups.
In order to be able to compare the data with other context variables and at a detailed scale of analysis, it was decided to use the municipal scale for this work. Therefore, these projects were grouped by municipalities and both the investments, the number of projects and the survival rate (total active projects or investments) per inhabitant were standardized in order to be able to make comparisons between different municipalities without skewing the results by population size.
In summary, the variables related to public aid were as follows: investment per inhabitant, percentage of active projects, percentage of active investment, percentage of active private investment, percentage of active non-hotel accommodations, percentage of active hotel accommodations, percentage of active catering services, percentage of active rural accommodations and percentage of active places.
Once this first database was completed, a second database was created with the context variables that may be favoring or conditioning the maintenance over time of Leader and Proder investments. Physical, demographic and economic variables defining the characteristics of Extremadura’s territorial structures were added, based on the variables applied in previous studies on the region [35]. The aim is to check whether the survival rate of investments is related to population growth, aging, wealth or unemployment data by sector of activity. In addition to these variables, other variables included were the minimum access time to the nearest highway per municipality, the minimum access time to Madrid and the percentage of cultural and natural resources, museums and interpretation centers in each municipality compared to the regional total. Including access time and the region’s natural and heritage resources will help determine whether a favorable location, as well as the existence of resources, is positively affecting business. Access to Madrid [22] has been added as it is the main issuer of rural tourism travelers. In this way, the database was configured in 21 variables, 11 of which refer to context variables (Table 1).
2.3. Minimun Access Time
The minimum access time will make it possible to calculate the accessibility from the municipalities to the nearest highway, as well as their access from Madrid (the main source of tourists). The study of accessibility is based on graph theory [36,37]. The graphs are a collection of nodes (the municipalities), which are connected by edges (the roads of the region), allowing us to know to which node each of the edges is connected, and to calculate the access time of each node to each edge, independent of the shape of the edges and the position of the nodes. The first step was to calculate the centroid of the municipalities, since the wide extension of the municipalities of the nuclei of the region could affect the calculation of the minimum time. Once the centroid was located, a hierarchical analysis of the edges was performed. This analysis, based on impedance, will make it possible to simulate the resistance effect associated with travel on the network [38]. For this work, the impedance has been calculated taking into account the length (in m) and the speed of the tracks (the maximum allowed: 120 km in the case of Spain), in the following expression (1):
[length/(velocity × 1000/60)]
The calculation of the minimum access time from each locality to its nearest resource will show an ideal model, calculating the minimum access time from Madrid and the minimum access time to the nearest highway. The expression is as follows (2):
where the minimum time from each node i (centroid of the municipality or Madrid) to the nearest freeway or nucleus (node j) is ascertained. For this purpose, we have used as a basis the cartography of the Spanish road network, data obtained from the National Download Center of the National Geographic Institute (IGN).
2.4. Principal Component Analysis
PCA is one of the most widely used multivariate analysis techniques, since it allows synthesizing or reducing the information of interrelated variables [16,39]. It is an explanatory method of variables involving external factors [40], which makes it possible to identify the latent dimensions of a set of variables and reduce them to a smaller number of independent factors, which are ordered by their explanatory power [41]. It is a technique with which new sets of variables, the principal components, are obtained as a result of the combination of interrelated variables [7]. These components represent homogeneous behaviors in different entities or elements that allow the identification of territorial substructures, since the PCA also represents the pattern of similarity of the observed inter-correlated variables [42]. Thus, the objective is to extract a reduced set of variables of m components, or underlying factors that explain most of the variance from a set of p variables [41]. It is a technique introduced by Pearson in 1901 [43], although it was later adapted to factor analysis by Hotelling in 1933 [44].
In this project, it was decided to use principal component analysis to obtain a territorial model of Extremadura that represents how the demographic and economic substructures of the region have influenced the tourist offer. By selecting this multivariate analysis, it will be possible to explain the relationships between the variables selected as representative of the regional reality.
The underlying factors are obtained through the correlation between the variables and are calculated as a weighted sum of those variables. Factor i would be (3):
Fi = Wi1X1 + Wi2X2 + … + WipXp.
As mentioned above, this type of analysis is very widespread and its application in social and human sciences [45,46,47] is suitable for studying complex structures, due to the reduction of a large amount of information. Moreover, it is an analysis that has already been used to study the behavior of these public aids [6], so its suitability is assured.
It should be taken into account that in order to perform the PCA it is necessary that the variables are presented in unbiased form, as rates or percentages. In addition, prospective analyses must be carried out until a matrix called the initial matrix, which is considered optimal for the study, is reached. In this way, those variables considered to be explanatory in the set or that implied collinearities for the model were eliminated. To verify the selected model, two control tests were performed: Bartlett’s test of sphericity and the Kaiser–Meyer–Olkin test (KMO). The first ensures that the correlation matrix is not an identity matrix, while the second is a measure of the adequacy of the correlation matrix to perform factor analysis, so that the closer the KMO score is 1, the higher the adequacy of the matrix. The KMO is expressed as (4):
KMO = ∑i + j r 2 ij ∑i + j r 2 ij + ∑i + j r 2 ij.m
The KMO statistic varies between 0 and 1, so it is considered that if the result is ≥0.75 the chosen variables are good, if it is ≥0.5 the idea is acceptable and if the result obtained is <0.5 it is unacceptable [48,49]. In the case of this project, the result for KMO is 0.68 so it is considered that performing the PCA with the selected variables is acceptable.
2.5. Clustering Analysis
Cluster analysis is the generic name for a multivariate procedure that groups similar objects into categories to identify (1) outliers and (2) the basic structure of the data set [50]. Cluster analysis allows grouping the data according to the characteristics of the municipalities analyzed, taking into account 100% of the variance, so that the groups are the most homogeneous among themselves. Cluster analysis presents two main types of cluster: non-hierarchical, which are called K-means, and hierarchical. In the case of this study, it was decided to use the K-means model since this model performs a classification into multiple groups, so that the total variation of the cluster is minimal. On the other hand, the hierarchical model performs a classification with a dependency structure starting from as many groups as individuals are studied [51].
As indicated, clustering was performed following the K-means algorithm. In K-means clustering, a method without spatial assignment, i.e., without spatial restrictions, was used for the participation entities. This ensures that the data are grouped according to the variables and without the influence of neighboring data, as would be the case if other grouping methods with spatio-temporal restrictions were selected. Each group will be defined through entities called “seeds”. A weighting that favors selection (K++ mean values) is applied to these randomly selected seeds. The variables used were the factor scores obtained in the PCA, complying with the condition of non-correlation between variables required by cluster analysis.
The main problem of this type of analysis is to decide the number of groups, since the grouping methods are sensitive to small changes. To test the reliability of the clusters, authors such as Smith et al. [34], set up the repetition of the analyses in different clusters and choose the best solution. In this work, different cluster values were selected until it was determined that obtaining five groups was optimal. These five groups allowed minimizing the number of clusters with negligible volumes of municipalities, while, at the same time, offering a reasonable number of clusters composed of a significant number of administrative units (municipalities). The advantage of cluster analysis is that its groupings consider all the variance in the data set, as compared to the variance typically represented by the first components of a PCA [52]. Once the territorial structures were determined, it was decided to locate homogeneous spatial behaviors with cluster analysis. The use of PCA together with cluster analysis provides more information than using either method alone [34].
3. Results
3.1. General Data
In total, more than 8000 projects were studied, of which 1049 were earmarked for the financing of accommodations and catering services. Leader financed 480 projects, in which a total of 41 million euros was invested, 65% of which came from private investment. In contrast, the Proder Program finances 18% more projects, reaching 569 with an investment of more than 57 million euros, with private investment being similar to that of Leader, 64.5%. In both cases, it can be determined how private investment has been fundamental for their operation and how the local population has been involved both with these aids and with their territory.
Comparing the data between LAGs, it is possible to establish the existence of a pattern already detected for the groups belonging to the Leader Method in a previous study [15]. This study classified the LAGs into three different groups according to their financing and territorial location. On the one hand, it established a group composed of three LAGs that invested more than 5 million euros in aid. These three groups were located in the north of the region and in the border area with Portugal, located mainly in mountainous areas, although with some areas of peneplain and irrigated land. They had a great wealth of natural resources (Sierra de Gata) and a scarce business fabric with very small municipalities, where Leader investments had been oriented towards tourism in order to enhance the value of this landscape wealth. In the same category, the other two LAGs benefited from tourism due to their proximity to the provincial capital, Cáceres. Another group, with an investment of between 4 and 5 million euros, comprised three LAGs, two of them in the south of the province of Badajoz and another in mountainous areas in the north of the province of Cáceres (Valle del Jerte with nature-related tourism, and the other two, Olivenza and Tentudía, with heritage and gastronomic tourism, also benefiting from their proximity to the main city of Extremadura or to Andalusia). The last category is constituted by four LAGs, with an investment of between 2 and 3 million euros. They are located in peneplain areas with low natural mountain resources (Campo Arañuelo, Miajadas-Trujillo and La Serena), with less influence of tourism in their economic income due to a greater relevance of the agricultural sector and a small agro-industry.
This trend is similar in the case of the municipalities that participate in the Proder Program (Table 2). The first group is integrated by four mountain LAGs with an investment of more than 5 million euros. Three of them are located in the province of Cáceres and the fourth in a mixed LAG, since it integrates municipalities from both provinces. These are mountain areas, with great natural wealth related to these landscapes and the exploitation of water as a leisure resource (rivers, gorges for bathing and routes of great value for tourists). They are also areas with small populations and business fabric that have opted for investment in tourism as a way of reversing regressive demographic trends in an attempt to fix the population. As can be seen, the municipalities in the north of the region have invested in tourism as a form of economic development. The next group, with an investment of 4 million euros, is formed by three very different LAGs. On the one hand, the Valle del Ambroz, one of the LAGs with the smallest population and with an economic base linked to tourism and forestry exploitation, presents tourism resources related to nature tourism. On the other hand, the LAG Zafra-Río Bodión, composed of several municipalities that act as regional head, its economic base is linked to trade, the existence of a small industry and tourism with heritage resources, demographically it is one of the most dynamic areas of the region. Finally, the GAL Sierra Grande-Tierra de Barros has an economy linked to the agricultural sector and a small industry that favors population growth. It is the group that has received the largest volume of all the LAGs in Extremadura and, therefore, its overall figures are also relatively high in tourism when compared to other LAGs with fewer resources, although in percentage terms most of its investments have been in the revaluation of agricultural production and agro-industry. The last group is organized into seven LAGs, which, as in Leader, stand out for being located in peneplain areas with an economic base linked to agriculture and small agro-industry, especially in the Vegas Altas del Guadiana LAG, which have invested in actions aimed at agroforestry improvements. The only exception is the Monfragüe LAG, which has important figures of natural protection and lower investments in tourism. It should be noted that this LAG was created in the last Proder period, in the year 2000, and because it only manages one period, its total investment volume in tourism with respect to the total is lower, but it is very significant with respect to its total investment.
3.2. Principal Component Analysis
Once this first descriptive analysis of the general data has been established, the results obtained from the analyses performed will be presented. First, the results of the statistical analyses of the variables used in the study are shown. The number of elements is 265, which means that of the 384 municipalities that make up the LAGs in the region, 69.1% are municipalities that have invested in tourism businesses. By variables, demographic variables such as old age index and population growth, social variables such as unemployment data, as well as the percentage of tourism resources are the most stable variables, with a standard deviation close to their mean (Table 3). The demographic variables reflect the current situation of the region, characterized by a slight but constant loss of population over the last three decades and related to negative vegetative growth (higher mortality rates compared to lower birth rates) rather than migratory movements. In these last decades of the 20th century and the beginning of the 21st century, the massive migratory movements of previous decades in Extremadura (the so-called rural exodus) no longer took place. Thus, the population is maintained with slight deviations in relation to the economic trends of the time. This is reflected in the high rate of old age, 28.6 inhabitants over 65 years of age, with a low standard deviation that shows that the trend is inherent to the entire region. The socioeconomic variables, income and unemployment, show that the weight of agriculture is still evident in the region’s economy, due to the high unemployment in the agricultural sector and that the economic income is not very high (an average of 10,273 euros per inhabitant and a deviation of 1285). The region’s economy went from an agricultural subsistence economy to one based on the service sector, with a strong presence of the public sector, without going through an industrial revolution. The tertiary sector in Extremadura is also characterized by a high specialization in tourism with high unemployment rates due to the seasonality of the sector. As for the percentage of tourist resources, the region has almost 30% of its territory protected by natural resources (Nature network, United Nations Educational, Scientific and Cultural Organization-UNESCO) and more than 200 heritage resources that have been linked to tourism (with a high percentage also of protected Cultural Interest Assets of the Junta de Extremadura or at the international level by UNESCO). Road access is essential in the region, since rail lines are scarce and slow and there is only one airport with flights only to Madrid and Barcelona (in summer it extends its flights to the Canary Islands and the Balearic Islands) [53,54]. The region is structured by two state highways that run from north to south and from northeast to west, connecting the region with Madrid and Lisbon. However, a significant part of the region’s municipalities present accessibility problems [55]; the average access time to the highways is 20 min, with a deviation of 15.8 min with respect to the average. If we look at the data relating to the country’s capital, we can see that the average is 3 h.
Regarding the specific variables of Leader and Proder management, it should be noted that the average investment per inhabitant is 459 euros, with a wide standard deviation of 780 euros. Thus, it is possible to determine the existence of concentrations in some municipalities with respect to others. The percentages of active projects, active investment and active private investment show an average of 60%, with a deviation (approximately 40%) that indicates a high dispersion of the data. Finally, the descriptive statistics show that the variables referring to accommodations and catering services also show differences. The average for active rural accommodation is close to 50%, this is followed by catering services (27.9%), extra-hotel accommodation (18%), and hotel accommodation (16.6%). In all cases, they present very wide deviations so that we are going to find very different realities depending on the territories and, with the later analyses, we will be able to locate them spatially, since not all the municipalities have had investment in all the typologies.
The next step was to check the explanation of the variables through the communalities (Table 4). The principal component analysis will allow us to obtain an explanation of each of the variables through the communalities, this value expresses the part of each variable (i.e., its variability) that can be explained by the factors common to all of them. To obtain this factor, the squares of the correlations or factor loadings retained with the variable are added [6], thus expressing the proportion of variance of the variables extracted with m factors, where m is the number of factors retained. If m is equal to the total number of variables, the communality is 1. In the case of this study, almost all the variables present values higher than 0.6 (only the variables referring to population growth between 1995 and 2000, altitude and investment per inhabitant, with an extraction of 0.46, 0.55 and 50 respectively), which shows the high explanation of the set. The variables that explain the most are those that refer to the aid itself (investment, projects, active supply and active investment) as well as the variables referring to job seekers and the percentage of tourist resources. The variable with the least explanation is the population growth variable. This variable is less explained, since it is more complex, as most of the rural municipalities in Extremadura have lost population in recent decades.
The results obtained (Figure 2 and Table 5) show that of the 20 components extracted in the analysis, only seven have eigenvalues above 1, so the rest of the components had to be eliminated. This is based on the assumption of Chatfield and Collin [48], who stated that components with an eigenvalue less than 1 should be eliminated, since they explain a very small part of the variability [56]. In this way, the first seven extracted components were rotated according to varimax rotation in order to facilitate the interpretation of the extracted components [49]. As a result, the percentages of the total variances of the seven extracted components represent more than 70% of the total variance of the observed variables, i.e., the seven extracted components explain the variables analyzed. However, although these seven components have an initial eigenvalue of more than 1, only the first five will be used in the cluster analysis. This choice was determined after analyzing the scree plot, since it is considered that those components in which the trend line breaks should not be taken into account, since their explanation in the set is low [50]. In the case of this study, the line begins to break in component 5, so as already indicated, they were considered optimal for the cluster analysis.
Table 5 shows the coefficients of the rotation matrix of the five components. From these coefficients, their higher or lower values and their sign, positive or negative, it will be possible to determine which are the variables that define each of the components. Component 1 (C1) is characterized by interrelating investment and active supply with the rest of the variables. This allows the differentiation between those areas with a higher percentage of success and those whose success has been moderate, low or non-existent (some municipalities with investment in tourism supply have presented percentages of active). Its positive substructure is formed with the highest significances. These are: supply and active investment, rural accommodations, active vacancies, private investment and the number of vacancies created (variables with the highest degree of explanation, all above 0.7). Also, to a lesser extent, of investment per inhabitant, the old age index, the percentage of active catering services and income per inhabitant (with a factorial weight of between 0.33 and 0.20). In a third group, below 0.20, we find the variables of unemployment in the service sector, the percentage of tourist resources, altitude, the percentages of hotel and non-hotel accommodations, and finally access to highways. On the contrary, in the negative substructure, the variables of access time to Madrid, agricultural unemployment and growth 2015–2019 appear correlated, although with not very high factorial weights. This cluster explains the degree of success of the tourist offer, which is why it has been defined with this denomination.
Component 2 is determined by the negative substructure. The old age index, income, investment per capita and unemployment in the service sector determine this component, which has been named as aging areas that have received significant investments and have average incomes. In the positive substructure, population growth from 2015 to 2019, supply, active investment and also with the active private participation and the percentage of active hotels, catering services stand out with a weight of less than 0.46.
As opposed to the two previous components, Component 3 is very clearly defined by the dichotomy between agricultural unemployment and unemployment in the service sector. In the positive substructure, the variable reflecting unemployment in the service sector stands out with a factorial weight of more than 0.6, and in the opposite case, with a factorial weight of −0.59, the variable reflecting agricultural unemployment in the region. For this reason, this component has been referred to simply as job seekers by sector. Component 4 is determined by the variable reflecting the percentage of tourist resources, with a factorial weight of more than 0.67, followed by access to highways, the percentage of active hotels and altitude with a factorial weight of 0.55, 0.38 and 0.37 respectively. They will be located in mountain areas with high protected resources and proximity to highways. In the case of the negative substructure, population growth from 1995 to 2000 and agricultural unemployment stand out with a factorial weight of less than 0.3. In the case of this component, it was called tourism resources. Finally, Component 5, known as the influence of Madrid, is characterized in the negative substructure by access to Madrid with a weight of −0.62 and in second place the variables that explain unemployment in the service sector, access to highways, in the case of the positive substructure, with a weight of less than −0.4, is defined by the active projects in hotels, by the percentage of tourist resources and by the income per inhabitant. However, this last factor needs very little explanation because of its complexity in the relationships between variables.
3.3. Cluster Analysis
Once this overview has been established, the results obtained in the cluster analysis will be explained. One of the advantages of the cluster analysis, in relation to the PCA, is that it allows spatial groupings of the results to be located, thus complementing the information obtained by the PCA. For this analysis, the factorial weight of the Extremadura municipalities in the five extracted components were taken into account. After different control tests, the selection of five clusters was considered to be the optimal option. This option made it possible to minimize the information by offering a reasonable or a representative number of administrative units (municipalities) in each of the clusters. In summary, the objective was not to obtain clusters with very small volumes of municipalities, and at the same time, very few clusters with heterogeneous values. In each of these five groups, there is a concentration of municipalities (clusters) with similar characteristics in terms of the sustainability parameters of the investments and of the context variables analyzed that will allow a pattern to be established (see Table 6 and Figure 3).
Group 1: group composed of 75 municipalities with an average population of 1399 inhabitants located mainly in the mountainous areas in the north of the region (Table 7). It presents a positive average in the values of Components 1 and 4, which represent the rate of success of the tourist offer and the tourist resources of the region, respectively (Table 6). While in those corresponding to Components 2, 3 and 5 they are negative, representing aging, the agricultural-services sector dichotomy and the influence of Madrid, respectively, which can be explained by the internal characteristics of the group (Table 6). This is a group that has been experiencing a sustained loss of population, around 4%, both at the beginning of this aid and at present, and therefore the negative values of Component 2. The old age index is high, 29.3, and the average income is very similar to that of the rest of the groups (there is no great variability in the average income in the different groups. In Extremadura, the average income does not show large differences between municipal values, unlike what happens in other Spanish regions, varying from the municipalities with the lowest wealth at 9000 euros to those with the highest income at 15,000 euros). It is a group with an economy dependent on the monoculture agricultural sector and with a high seasonality in the north, as is the case of the cherry in the Valle del Jerte or the cultivation of tobacco in La Vera and in irrigated areas also located in the north. Its negative values in Component 3 are due to the seasonality of the agricultural sector, especially in the Valle del Jerte area, where the concentration of the harvesting season in a few months of the year increases unemployment in the agricultural sector. These are the territories where tourism activity has been most developed with Leader (they have high values in Component 1 where the highest investments in tourism per inhabitant appear). This is mainly due to the existence of highly valued natural resources of high environmental conservation related to the mountains and water resources (rivers, gorges and streams adapted for bathing). These resources have allowed the development of leisure and entertainment offers, benefiting the creation of tourist accommodations in the surrounding area, which is reflected in the positive values of Component 4. Many of them have also benefited from their proximity to Madrid (the main source of tourists to Extremadura), as well as to the main highways in the region. As mentioned, it is a group where the investment per inhabitant is the second highest, only surpassed by group 5, with 555 euros per inhabitant (Table 7). It is also one of the most successful because it has an average active investment of more than 85%, as well as the percentage of projects above 80%. It is a group that has made its investment mainly in rural type accommodation and 90% of the accommodation places created are still active.
Group 2: this group is composed of 44 municipalities, with an average population of 2385 inhabitants (Table 7). In the case of this group, it presents a positive average only in Component 2, which reflects the fact that they are municipalities with a lower population loss, and negative values in Components 1, 3, 4 and 5 (Table 6). This group is characterized by being the only one that gained population at the beginning of the Leader initiative and the Proder Program, although for the period 2015–2019 it lost 3% of its population. It presents the second lowest old age index (26.6) only below group 4. Economically, there are two tendencies: on the one hand, those municipalities with a larger population with an economy related to the productive irrigated and rainfed agricultural sector, with special relevance to the use of grapes and olives, which is also joined by a small agro-industry. On the other hand, municipalities that stand out for an economy are based on the use of natural resources for electricity production, such as hydroelectric or nuclear power plants. The first subcategory is also characterized by municipalities that act as county seats, with a greater development of the service sector with strong links to the public sector. On the other hand, municipalities stand out for an economy based on the use of natural resources for electricity production, such as hydroelectric or nuclear power plants. The first subcategory is also characterized by municipalities that act as county seats, with a greater development of the service sector with strong links to the public sector. It is the group with the lowest percentage of natural and cultural resources, one of the groups that, on average, is farthest from Madrid, more than 3 h and 30 min away, and located in areas of peneplain or irrigated plains. Territories that do not have the natural wealth of the mountain areas, nor the wealth of heritage or services to the cities of Extremadura. It is the group that presented lower investments in Leader and Proder tourism together with group 4, with 243 euros per inhabitant, because its investments have been related to the development of agricultural activities, SMEs and services to its population. As reflected by the value of Component 1, it is the group with the lowest supply and investment (20% and 12% respectively, Table 7). Only non-hotel accommodation exceeds 10% of the assets, linked to the pilgrimage of the Camino de Santiago. These results explain the values of the components, especially in the case of component 1, which shows how the degree of success in this group is low.
Group 3: this is composed of 38 municipalities with an average population of 864 inhabitants (Table 7), with positive values on Components 3 and 4, and negative values in Components 1, 2 and 5 (Table 6). Most of them are small municipalities, the municipality with the largest population has less than 4000 inhabitants. In general, they are municipalities that have lost a significant percentage of their population, reaching 7% in the period 2015–2019, which explains the values of Component 2. It is the most aged, with an economy mainly linked to the agricultural sector, the irrigated area of the northwest of the region. There are few municipalities, which due to their small population and aging do not have enough business fabric to invest in the tourism sector, nor in Leader and Proder in general. Although they are close to areas with natural or cultural wealth, they have positive values in Component 4, but being far from Madrid and from the main highways and being surrounded by more dynamic municipalities, with a larger population and a better tourist offer, their tourist offer has not survived, reflected in the negative values of Component 1. They present an average investment of 485 euros per inhabitant, a low survival rate of both projects and investment (15.1 and 13.2, Table 7) and also of active private participation (13%). Among the offer they designed they also present very low indicators, with all of them with less than 15% active (hotel, for example, only 5% are maintained and rural, which are the most successful within this territory, only 12.4% remain active).
Group 4: this group is composed of 50 municipalities with an average population of more than 5000 inhabitants (Table 7). It presents positive average values 1,2,4 and 5, and negative in Component 3, due to higher average unemployment in the service sector (Table 6). Most of these municipalities are located in the Extremadura peneplain. With respect to population, this group is currently losing 5% of its population, but it is the least aged group of the 5. This group is characterized for being the one with the highest percentage of tourist resources, related to historical-artistic resources, also taking advantage of its proximity to cities such as Cáceres or Mérida (these two cities are those that receive the highest number of tourists in the region). Economically, they are municipalities related to the service sector, hence the negative values in Component 3, since some of them act as county seats, as well as municipalities with an economy related to the productive agricultural sector. The positive values in Component 1 determine the high success of the investments, with almost 80% being active, with a similar percentage in active projects and in private investment (it is the third with the best results) (Table 7).
Group 5: is made up of 58 municipalities with an average of 1728 inhabitants per municipality (Table 7). This group presents a positive average in the values of Components 1, 2 and 3, and negative in Components 4 and 5, and these results are explained by the conditions and characteristics of the municipalities that make up the group (Table 6). In this case, the municipalities are located in mountain areas, mainly in the Villuercas (SE of the province of Cáceres) and some mountain municipalities on the border with Portugal (Figure 3). Demographically, it is characterized by being one of the groups that loses more population together with Group 3, reflected in the old age index and in the income, the lowest of the five groups. However, Component 2 shows positive average values, despite the fact that this group presents important population losses. These positive values are determined by its low agricultural unemployment, due to the lack of population, its high success rate despite regressive demographics, and low incomes. Component 3 shows that the economies of these municipalities are linked to the low profitability agricultural sector, with little business fabric. Some municipalities in this group, such as those located in Villuercas, have a rich natural landscape of great value which, due to their remoteness from both Madrid and the highways, have not been able to develop a tourist offer like that of other mountain areas. In the area of public aid, it is the group with the highest investment per inhabitant, with a high active investment. In terms of accommodation, and rural accommodation has been financed the most, with more than 70% of the financed accommodation being active (Table 7). However, although these investments have been high in relation to the number of inhabitants, they have not been sufficient to create a sufficiently dynamic offer to increase the population, increase the young population or increase income.
4. Discussion
In this article, two methodologies have been used with a wide background in the scientific literature that studies Leader and Proder [57,58,59], although none of them are linked to the study of tourism supply in the long term. For this purpose, variables that have conditioned the sustainability of Leader and Proder (the percentage of investments and projects that are maintained, the type of infrastructure financed and the ratio of investments in relation to the population) have been used, together with other context variables that may have conditioned the survival of tourism businesses. For this purpose, factors such as population growth, both at present and at the beginning of the aid, income, unemployment in the agricultural sector, which is still relevant in the rural areas of Extremadura, and the service sector, have been taken into account as well as other variables, such as access to the main source of tourists in the region, Madrid [22], and to the highways in the regions. We have also taken into account the percentage of protected natural and heritage resources, in order to check whether their existence conditions the success of tourist establishments. The use of these two methodologies will facilitate the establishment of a pattern of the rate of success of investments in tourism in territories with different casuistry. In such a way that the results obtained can be extrapolated to other territories and serve as a reference for the future development of tourism. Based on the results obtained and presented above, it has been possible to verify different trends:
- -
- The municipalities that make up Group 1 and Group 4 are municipalities located in mountainous areas with great natural resources and that have opted for tourism as a way of complementing their agricultural income, with a high rate of active supply and active investment. Within them, Group 1 is made up of municipalities of smaller population size than those in Group 4, which are characterized by being small county seats. In general, they are losing population, but not as much as Group 5, and they are aging, but with lower numbers than other groups. They are located mainly in the northern territories of the region, coinciding with the rural areas with the most tourism [22], which have opted for tourism as the main economic activity along with agricultural and forestry production. These are municipalities that have created tourist activity around a product, in the case of Valle del Jerte, cherries, Valle del Ambroz, autumn landscapes and timber exploitation, or La Vera, agricultural products such as paprika or tobacco. Their active investments are related to the size of the population, being the small municipalities those that have financed mainly rural accommodations. This is due to the fact that they are a type of accommodation with a number of places that rarely exceeds 10 and are easily managed by the family environment. The larger municipalities have managed catering services, which are linked more to the internal consumption of the inhabitants of the municipalities themselves than to the tourism sub-sector.
- -
- The other group with a high success rate is Group 5. This group is located in areas far from the highways and Madrid, with a high aging, scarce business fabric and lower incomes that, although they have invested considerable amounts per inhabitant, are not enough to stop the demographic loss processes. These are territories that in many cases have a high landscape value, such as Las Villuercas or the areas of the reservoirs of La Serena, but that need greater investment to reverse these processes. This is as well as advocating the development of a central tourism product that encompasses the rest of the resources, as has happened in the Valle del Jerte or in the Valle del Ambroz, or in the GAL Tajo-Salor-Almonte with the Torta del Casar, although the latter to a lesser extent. In other words, betting on a single product around which tourism promotion revolves, such as the Villuercas Geopark (Villuercas-Ibores-Jara Geopark), which, despite its scientific relevance, has not achieved tourism development.
- -
- The other two groups have low success rates, both with less than 20% in supply and less than 15% in private investment. On the one hand, they are municipalities that have not invested significant amounts in tourism or that have not destined these investments in the development of tourism, but rather to enhance the value of agricultural and forestry production. Most of them are municipalities located in irrigated and rainfed areas productive with vines and olives, as is the case of the municipalities in Group 2, which, in addition, are growing in population. There are also municipalities with an economy based on the exploitation of natural resources, such as the granite quarries in the La Serena area. On the other hand, there are municipalities that, although they have invested in tourism, are small municipalities that do not have a sufficient previous business fabric to invest in the tourism sector or in general to invest in Leader and Proder. These municipalities are those located in Group 3, which present small aging populations where the reversion of the regressive demographic processes has not taken place.
Thus, the results obtained with PCA and cluster analysis have made it possible to differentiate three patterns according to the five groups established. It can be determined that factors such as the investment made, a greater number of projects, the type of accommodation, the size of the population, the existence of tourist resources and the influence of Madrid are variables that have conditioned the sustainability of the enterprises financed under initiatives such as Leader and disappeared Proder. Despite the lack of studies focused on the viability of tourism businesses, there are other studies that should be mentioned because of the results obtained, since they certify that the results presented are valid. Studies by Nieto Masot and Cárdenas Alonso [28,29], indicate the existence of a concentration of tourism investments in Extremadura. These two studies applied spatial location methods, such as Local Moran’s and Getis-Ord, and a statistical method to test the degree of effectiveness and the degree of efficiency in determining an Ideal Point, in this case related to the concentration of tourism investments. The results showed the existence of a concentration of tourism investments and projects in the northern mountain areas of the region, especially in the Proder groups due to the greater flexibility of the regulations. Although this study did not categorize by LAG, it is possible to establish a similarity with the results obtained in the two aforementioned studies, since it was determined that businesses located in mountain municipalities, mostly in the north of the region, have a higher rate of success.
Other studies outside the region, such as that by Candela Hidalgo et al. [23], deal with the potential of tourism promoted by the Leader initiative in mountain areas. This is a case study in mountain areas, close to the Mediterranean coast, which have seen the optimal economic benefits of sun and beach tourism. Although this study does not include an analysis of the sustainability of tourism businesses, nor an analysis with context variables, it does take into account all those projects aimed at improving the tourism offer: accommodations, route signage, museums, interpretation centers, tourism promotions, etc. Despite these differences, several common points have been established: excessive funding for tourism, without taking into account other measures that also allow for economic diversification; and the tendency to concentrate investments in municipalities close to the Rural Development Centers. Also, the study by Frutos Mejías et al. [60], on the evolution of rural tourism during Leader and Proder in Aragón (a region located in northeastern Spain) is noteworthy. This study establishes that thanks to these initiatives there has been an increase in the creation of lodging enterprises, which are located excessively in mountain areas, especially near the Pyrenees and in regions with greater tourist attraction due to their natural resources and where there was already a tourist base with lodging and activities.
These are some examples of analyses carried out at a general level on tourism businesses financed with the Leader Method. Regarding the studies that analyze the long-term sustainability of these businesses, those carried out by Navarro Valverde et al. [33], Castellano-Álvarez et al. [30], or Santos et al. [32], stand out. The first shows that tourism companies have had the greatest continuity (71 out of 100) in comparison with other types of company financed with Leader. This study, unlike the one presented, does not differentiate between types of tourism enterprises, so a comparison cannot be made at the infrastructure level. However, it is possible to make a comparison based on the territory, since the selected LAGs, three LAGs in Andalucía (Southern Spain), have certain similarities with those present in this study, which allows a comparison to be made and once again demonstrates the effectiveness of the model presented. At the territorial level, the study by Navarro Valverde et al. [33], presents three groups: one of them in a mountainous area where agriculture and tourism predominate; another LAG far from the main cities, with less economic development and low population density; the last, close to a large population, with an economic sector linked to this larger municipality. Through surveys, they have determined that those areas where the companies were located in areas with a high natural and landscape value and with a location close to the cities, which allows the urban population to move to the rural areas on weekends or short vacations, have a higher percentage of success. The second article, which was carried out in a LAG in Extremadura through interviews, cannot be extrapolated to the regional level, since it deals with an area with very specific characteristics. These authors state that the areas that already had a previous tourist fabric before these aids were more successful, so it is considered that the existence of a greater number of lodgings favors the survival of the investments. It should be taken into account that the existence of only one accommodation or catering service in a municipality does not produce a positive effect, but because it is isolated and with little or no supply does not generate tourist flows that sustain business over time. It should also be added that in Extremadura the carrying capacity of the tourist offer has not yet been exceeded.
Finally, the article by Santos et al. [32], which, although it does not differentiate between types of company, has been considered for inclusion when dealing with the viability of Leader+ financed businesses in a specific area of Portugal. The study location corresponds to an area bordering Extremadura, which presents socioeconomic characteristics similar to those of the region: ageing population, low population density and an economy based on tourism and the agricultural sector. These authors establish not only that the location and the investment made are important for the viability of the companies, but also that some types of company, such as those providing business support services, have a higher success rate.
In short, the results obtained not only agree with the conclusions of the previous authors, but enable us to determine that the tourism offer has been successful in areas with natural mountain resources, with greater investment and number of financed lodgings, with an intermediate population size and close to urban areas that send out tourists. In addition, it has been shown the existence of rural areas with certain characteristics (which in this study would be the municipalities belonging to Group 1), which, although they have not managed to modify the regressive demographic trends, have managed to soften the loss of population and create solid tourism businesses over time, complementing the income of family farms and including these areas in both national and international tourism markets. Thus, these articles, although with a different methodology and area of study than that presented here, allow us to verify the effectiveness of the method. It is possible to apply this method not only in European rural areas with Leader funding, but it is also possible to apply this methodology in general in tourism and, specifically, in studies on the creation of new businesses of accommodation and catering services in rural areas that are not strictly part of the EU.
5. Conclusions
The changes that took place in European countries during the second half of the 20th century have affected the development of rural areas, which are currently suffering from significant problems of population loss, aging, abandonment and reduced economic development. As a way to mitigate the existing problems, European governments developed a series of initiatives with the aim of slowing down the regressive demographic processes in these areas and activating local economies. Thus, in 1991, the Leader Method was launched, aimed at co-financing new activities in rural areas, encouraging the participation of the local population and promoting endogenous development. During the second call for Leader, Leader II, the number of applications exceeded the budgeted funding, so the Proder Program, complementary to Leader with similar objectives, was approved in Spain. Within Leader and Proder, tourism was positioned as the main activity capable of diversifying rural economies and complementing agricultural income, encouraging the development of a tourism offer that would satisfy the growing demand in rural areas.
Throughout these more than 25 years of Leader and Proder applications, accommodation and catering businesses have been financed; however, their sustainability over time has been scarcely studied. Due to the limitations of previous studies, the project presented here represents not only an innovation in the proposed topic, but also in the methodology used. The methodology applied has made it possible to establish several patterns depending on the degree of success of the aid and different contextual variables that can be replicated in other territories. Thus, investment is fundamental, but it is not a determining factor in the success of these businesses. An ideal location, at a distance of less than 3 h by car from municipalities that send out tourists, the existence of natural and heritage resources, investment in rural accommodation and greater economic dynamism, especially focused on the agricultural sector and the service sector, benefit the success of the businesses. Demographically, it has been detected that businesses located in areas with high rates of aging and a small population size can survive if the above characteristics are present. Leader and Proder actions have been necessary in all rural areas of Extremadura because they have favored the creation of accommodation infrastructures. The most successful areas (with a percentage above 70%) are located in areas with the most optimal conditions (proximity to Madrid, existence of natural resources, water resources, etc.). In the less successful areas, despite the fact that they present the optimal external and internal conditions for the development of tourism, it is necessary to continue implementing these initiatives with a focus on quality tourism.
In conclusion, there is a need for studies such as this one, allowing us to see the weakest points of aid and thus optimize resources by modifying and addressing new measures with greater effectiveness and efficiency. In the case of Extremadura, tourism with Portugal should be promoted, especially in border areas, so that those areas with lower investment and profitability increase their success rates. In addition, it is necessary to increase the volume of aid in areas with a lower degree of success, to enable them to offer a greater number of accommodation and catering services. Another important point is the development of integrated and complementary offers that do not compete with each other. Finally, it is necessary, in the case of the region under study, to improve accessibility (better trains and access to international airports such as Sevilla, Madrid or Lisbon), as well as the dissemination of the territories at regional, national and international levels through the development of new technologies. In future research, it would be interesting to analyze how the current pandemic situation has affected this region, since due to the restrictions and limitations, these businesses will have lost part of their activity, and therefore part of their profits.
Author Contributions
A.N.M. and Á.E.M. conceived and designed the experiments; Á.E.M. and A.N.M. performed the experiments, analyzed the data and contributed analysis tools; Á.E.M. A.N.M., and J.M.A. supervised the article. All authors have read and agreed to the published version of the manuscript.
Funding
This publication has been made possible thanks to funding granted by the Consejería de Economía, Ciencia y Agenda Digital from Junta de Extremadura and by the European Regional Development Fund of the European Union through the reference grant GR18052 and with PhD scholarship of the regional government, Junta de Extremadura (PD16009).
Institutional Review Board Statement
Not applicable.
Informed Consent Statement
Not applicable.
Data Availability Statement
Not applicable.
Conflicts of Interest
The authors declare no conflict of interest.
References
- European Commission. Rural Areas and the Primary Sector in the EU; General Direction Agriculture and Rural Development: Brussels, Belgium, 2018. [Google Scholar]
- Banco Mundial. Crecimiento de la Población Rural-European Union. Available online: https://datos.bancomundial.org/indicator/SP.RUR.TOTL.ZG?locations=EU (accessed on 15 May 2021).
- Collantes, F.; Pinilla, V.; Sáez, L.A.; Silvestre, J. Reducing Depopulation in Rural Spain: The Impact of Immigration. Popul. Space Place 2014, 20, 606–621. [Google Scholar] [CrossRef]
- Midgley, J. A New Rural Agenda; IPPR: Newcastle, UK, 2006. [Google Scholar]
- Lowe, P. European agricultural and rural development policies for the 21st century. In A New Rural Agenda; IPPR Report; IPPR: Wales, UK, 2006; pp. 29–45. [Google Scholar]
- Cárdenas Alonso, G.; Nieto Masot, A. Towards Rural Sustainable Development? Contributions of the EAFRD 2007–2013 in Low Demographic Density Territories: The Case of Extremadura (SW Spain). Sustainability 2017, 9, 1173. [Google Scholar] [CrossRef] [Green Version]
- Plaza Gutiérrez, J.I. Territorio, geografía rural y políticas públicas. Desarrollo y sustentabilidad en las áreas rurales. Boletín Asoc. Geógrafos Españoles 2006, 41. Available online: https://bage.age-geografia.es/ojs/index.php/bage/article/view/1992 (accessed on 30 September 2021).
- Nieto Masot, A.; Cárdenas Alonso, G. El método Leader como política de desarrollo rural en Extremadura en los últimos 20 años (1991–2013). Boletín Asoc. Geógrafos Españoles 2015, 69. [Google Scholar] [CrossRef]
- European Communities. Official Journal of the European Communities (94/C 180/12); European Communities: Brussels, Belgium, 1994. [Google Scholar]
- Esparcia Pérez, J. LEADER II y PRODER en el Desarrollo Rural en España; Institución Fernando el Católico: Zaragoza, Spain, 2006; pp. 65–90. [Google Scholar]
- Nieto Masot, A. El Desarrollo Rural en Extremadura: Las Políticas Europeas y el Impacto de los Progrlamas Leader y Proder; Universidad de Extremadura Cáceres: Cáceres, España, 2007. [Google Scholar]
- Council of the European Union. Council Regulation (EC) No. 1260/1999 of June 21, 1999; European Communities: Brussels, Belgium, 1999. [Google Scholar]
- Ministerio de Agricultura, Pesca y Alimentación. Real Decreto 2/2002, de 11 de Enero; Boletín Oficial del Estadot: Madrid, Spain, 2002. [Google Scholar]
- García Hernández, M.; de la Calle Vaquero, M. Turismo en el medio rural: Conformación y evaluación de un sector productivo en plena transformación. El caso del Valle del Tiétar (Ávila). Cuad. De Tur. 2006, 17, 75–101. [Google Scholar]
- Engelmo Moriche, Á.; Nieto Masot, A.; Mora Aliseda, J. Economic Sustainability of Touristic Offer Funded by Public Initiatives in Spanish Rural Areas. Sustainability 2021, 13, 4922. [Google Scholar] [CrossRef]
- Albaladejo Pina, I.P.; Díaz Delfa, M.T. Rural tourism demand by type of accommodation. Tour. Manag. 2005, 26, 951–959. [Google Scholar] [CrossRef]
- PICTE. Plan de Integral de Calidad del Turismo Español; Secretería de Espado de Comercio y Turismo, Ed.; Ministerio de Economía: Madrid, Spain, 2000. [Google Scholar]
- Torres Riesco, J.C. Un freno a la estacionalidad. Rev. De Desarro. Rural 2002, 18, 20–23. [Google Scholar]
- Nieto Masot, A.; Gurría Gascón, J.L. Las políticas rurales europeas y su impacto en Extremadura. Boletín Asoc. Geógrafos Españoles 2008, 48, 225–246. Available online: https://bage.age-geografia.es/ojs/index.php/bage/article/view/720 (accessed on 30 September 2021).
- Pérez Díaz, A.; Leco Berrocal, F. La despoblación: Una amenaza para el medio rural Extremeño. In La Agricultura y la Ganadería Extremeñas; Badajoz, F.C., Ed.; Facultad de Ciencias Económicas y Empresariales, Escuela de Ingenierías Agrarias and Universidad de Extremadura: Badajoz, Spain, 2014. [Google Scholar]
- Nieto Masot, A.; Gurría Gascón, J.L. Análisis de la población de los programas de desarrollo rural en Extremadura mediante sistemas de información geográfica. Cuad. Geográficos 2005, 36, 479–495. [Google Scholar] [CrossRef]
- Observatorio de Turismo. Boletines Trimestrales de Oferta y Demanda. Available online: https://www.turismoextremadura.com/es/pie/observatorio.html (accessed on 5 April 2021).
- Candela Hidalgo, A.R.; García Carretero, M.D.M.; Such Climent, M.P. La Potenciación del Turismo Rural a Través del Programa LEADER. Investigaciones Geográficas 1995, 14. [Google Scholar] [CrossRef]
- Tirado-Ballesteros, J.-G.; Hernández-Hernández, M. Análisis de las inversiones en turismo rural desde los programas con enfoque territorial en Castilla-La Mancha (1991–2013). Doc. D’anàlisi Geogràfica 2018, 64, 149–174. [Google Scholar] [CrossRef] [Green Version]
- Yubero Bernabé, C.; García Hernández, M. Turismo en Albarracín y Comarca. Acción pública local y dinámica reciente en clave de desarrollo turístico sostenible/Tourism in Albarracín and Region. Local Public Action and dynamics in recent key sustainable tourism development. An. Geogr. Univ. Complut. 2016, 36, 173. [Google Scholar] [CrossRef] [Green Version]
- Morán Rodríguez, M.A.M.; Sotelo Navalpotro, J.A. El turismo rural y Leader+ en la sierra norte madrileña. Anales de Geografía de la Universidad Complutense 2002, 2002, 471–482. [Google Scholar]
- Pitarch, M.D.; Arnandís, R. Impacto en el sector turístico de las políticas de desarrollo rural en la Comunidad Valenciana (1991–2013). Análisis de las estrategias de fomento y revitalización del turismo rural. Doc. D’anàlisi Geogràfica 2014, 60, 315–348. [Google Scholar]
- Nieto Masot, A.; Cárdenas Alonso, G. 25 Años de políticas europeas en Extremadura: Turismo rural y método LEADER. Cuad. Tur. 2017, 39, 389–416. [Google Scholar] [CrossRef] [Green Version]
- Nieto Masot, A.; Cárdenas Alonso, G. The Rural Development Policy in Extremadura (SW Spain): Spatial Location Analysis of Leader Projects. Isprs Int. J. Geo-Inf. 2018, 7, 76. [Google Scholar] [CrossRef] [Green Version]
- Castellano-Álvarez, F.J.; del Río-Rama, M.d.l.C.; Álvarez-García, J.; Durán-Sánchez, A. Limitations of Rural Tourism as an Economic Diversification and Regional Development Instrument. The Case Study of the Region of La Vera. Sustainability 2019, 11, 3309. [Google Scholar] [CrossRef] [Green Version]
- Castellano-Álvarez, F.J.; Nieto Masot, A.; Castro-Serrano, J. Intangibles of Rural Development. The Case Study of La Vera (Extremadura, Spain). Land 2020, 9, 203. [Google Scholar] [CrossRef]
- Santos, A.; Neto, P.; Serrano, M.M. A long-term mortality analysis of subsidized firms in rural areas: An empirical study in the Portuguese Alentejo region. Eurasian Econ. Rev. 2016, 6, 125–151. [Google Scholar] [CrossRef]
- Navarro Valverde, F.A.; Cejudo García, E.; Cañete Pérez, J.A. Análisis a largo plazo de las actuaciones en desarrollo rural neoendógeno. Continuidad de las empresas creadas con la ayuda de LEADER y PRODER en tres comarcas andaluzas en la década de 1990. Ager. Rev. Estud. Sobre Despoblación Desarro. Rural 2018, 25, 189–219. [Google Scholar] [CrossRef]
- Smith, A.D.A.C.; Emmett, P.M.; Newby, P.K.; Northstone, K. A comparison of dietary patterns derived by cluster and principal components analysis in a UK cohort of children. Eur. J. Clin. Nutr. 2011, 65, 1102–1109. [Google Scholar] [CrossRef] [Green Version]
- Nieto Masot, A.; Gurría Gascón, J.L. El modelo rural y el impacto de los programas LEADER y PRODER en Extremadura (Propuesta metodológica). Scr. Nova. Rev. Electrónica De Geogr. Cienc. Soc. 2010, 14. Available online: https://raco.cat/index.php/ScriptaNova/article/view/210459 (accessed on 30 September 2021).
- Cardozo, O.D.; Gómez, E.L.; Parras, M.A. Teoría de grafos y sistemas de información geográfica aplicados al transporte público de pasajeros en Resistencia (Argentina). Rev. Transp. Territ. 2009, 1, 89–111. [Google Scholar] [CrossRef]
- Menédez, A. Una breve introducción a la teoría de grafos. Suma 1998, 28, 11–26. [Google Scholar]
- Nieto Masot, A.; Engelmo-Moriche, Á.; Cárdena-Alonso, G. La distribución territorial de recursos sanitarios y socio-sanitarios públicos para población mayor en Extremadura. Rev. De Estud. Andal. 2019, 37, 141–160. [Google Scholar]
- Terrádez Gurrea, M. Análisis de Componentes Principales Análisis de Componentes Principales Esquema de Contenidos; UOC: Madrid, Spain, 2000. [Google Scholar]
- Cloke, P. Conceptualizing rurality. In Handbook of Rural Studies; Cloke, P.M., Mooney, P., Eds.; SAGE Publications: London, UK; Thousand Oaks, CA, USA; New Delhi, India, 2006; pp. 18–28. [Google Scholar]
- Cuadras, C.M. Nuevos Métodos de Análisis Multivariante; CMC Edicions: Barcelona, Spain, 2007. [Google Scholar]
- López-Roldán, P.; Lozares Colina, C. Anàlisi Multivariable de Dades Estadístiques; Univ. Autònoma de Barcelona: Barcelona, Spain, 2000; Volume 93. [Google Scholar]
- Pearson, K. LIII. On lines and planes of closest fit to systems of points in space. Lond. Edinb. Dublin Philos. Mag. J. Sci. 1901, 2, 559–572. [Google Scholar] [CrossRef] [Green Version]
- Hotelling, H. Analysis of a complex of statistical variables into principal components. J. Educ. Psychol. 1933, 24, 417. [Google Scholar] [CrossRef]
- Dai, P.-F.; Xiong, X.; Zhou, W.-X. A global economic policy uncertainty index from principal component analysis. Financ. Res. Lett. 2021, 40, 101686. [Google Scholar] [CrossRef]
- Giuliani, M.M.; Nardella, E.; Gagliardi, A.; Gatta, G. Deficit Irrigation and Partial Root-Zone Drying Techniques in Processing Tomato Cultivated under Mediterranean Climate Conditions. Sustainability 2017, 9, 2197. [Google Scholar] [CrossRef] [Green Version]
- Rajesh, S.; Jain, S.; Sharma, P. Inherent vulnerability assessment of rural households based on socio-economic indicators using categorical principal component analysis: A case study of Kimsar region, Uttarakhand. Ecol. Indic. 2018, 85, 93–104. [Google Scholar] [CrossRef]
- Frías-Navarro, D.; Soler, M.P. Prácticas del Análisis Factorial Exploratorio (AFE) en la Investigación Sobre Conducta del Consumidor y Marketing. Artículos en PDF Disponibles Desde 1994 Hasta 2013. A Partir de 2014 Visítenos en. 2013, Volume 19. Available online: www.elsevier.es/sumapsicol (accessed on 20 June 2021).
- Suárez, O.M. Aplicación del análisis factorial a la investigación de mercados. Caso de estudio. Sci. Et Tech. 2007, 1, 281–286. [Google Scholar]
- Wilkinson, L.; Blank, G.; Gruber, C. Desktop Data Analysis with SYSTAT.; Prentice Hall: Hoboken, NJ, USA, 1996. [Google Scholar]
- Moreno Velásquez, M. Aplicación de Análisis de Componentes Principales y Conglomerados a Datos de Fluorescencia de Rayos X (FRX) en Suelos; Fundación Universitaria Los Libertadores: Bogotá, Colombia, 2019. [Google Scholar]
- Xue, J.; Lee, C.; Wakeham, S.G.; Armstrong, R.A. Using principal components analysis (PCA) with cluster analysis to study the organic geochemistry of sinking particles in the ocean. Org. Geochem. 2011, 42, 356–367. [Google Scholar] [CrossRef]
- Mora Aliseda, J.; Nogales Galán, J.; Gutierréz Gallego, J.; Cortés Ruíz, T. Aplicación de técnicas de SIG en la planificación del transporte en Extremadura (España). Finisterra 2003, 38, 67–83. [Google Scholar] [CrossRef]
- Nieto Masot, A.; Venegas Labrador, S.; Campos Moreno, R. Base infraestructural. In Treinta años de Economía y Sociedad Extremeña, 1983–2013; Badajoz, D.D., Ed.; Diputación Provincial de Badajoz: Badajoz, Spain, 2014; pp. 71–86. [Google Scholar]
- Nieto Masot, A.; Engelmo Moriche, Á.; Cárdenas Alonso, G. Análisis espacial de la ordenación territorial en áreas rurales de baja densidad demográfica: El caso de Extremadura. Pap. Geogr. 2017, 63, 113–132. [Google Scholar] [CrossRef] [Green Version]
- Hamed, M.A.R. Application of Surface Water Quality Classification Models Using Principal Components Analysis and Cluster Analysis. SSRN 2019. [Google Scholar] [CrossRef]
- Nieto Masot, A.; Cárdenas Alonso, G.; Costa Moreno, L.M. Principal component analysis of the leader approach (2007–2013) in south western europe (extremadura and alentejo). Sustainability 2019, 11, 4034. [Google Scholar] [CrossRef] [Green Version]
- Moyano Pesquera, P.B. La implicación de los agentes sociales y económicos en el desarrollo rural: Una necesidad insatisfecha. Econ. Agrar. Recur. Nat. 2018, 17, 55–79. [Google Scholar] [CrossRef]
- Alfaro Navarro, J.L.; Mondéjar Jiménez, J.; Vargas Vargas, M. Análisis de impacto de los programas Proder y Leader en Castilla-La Mancha: Medidas de apoyo a pequeñas empresas, artesanía y servicios. Rev. Desarro. Rural Coop. Agrar. 2004, 8, 63–75. [Google Scholar]
- Frutos Mejías, L.M.; Hernández Navarro, M.; Castelló Puig, A. Desarrollo y Turismo Rural: Una Perspectiva Sobre Aragón; Serie Geográfica: Alcalá de Henare, Spain, 2009. [Google Scholar]
Figure 1.
Local Action Groups.

Figure 2.
Scree plot.

Figure 3.
Cluster analysis.


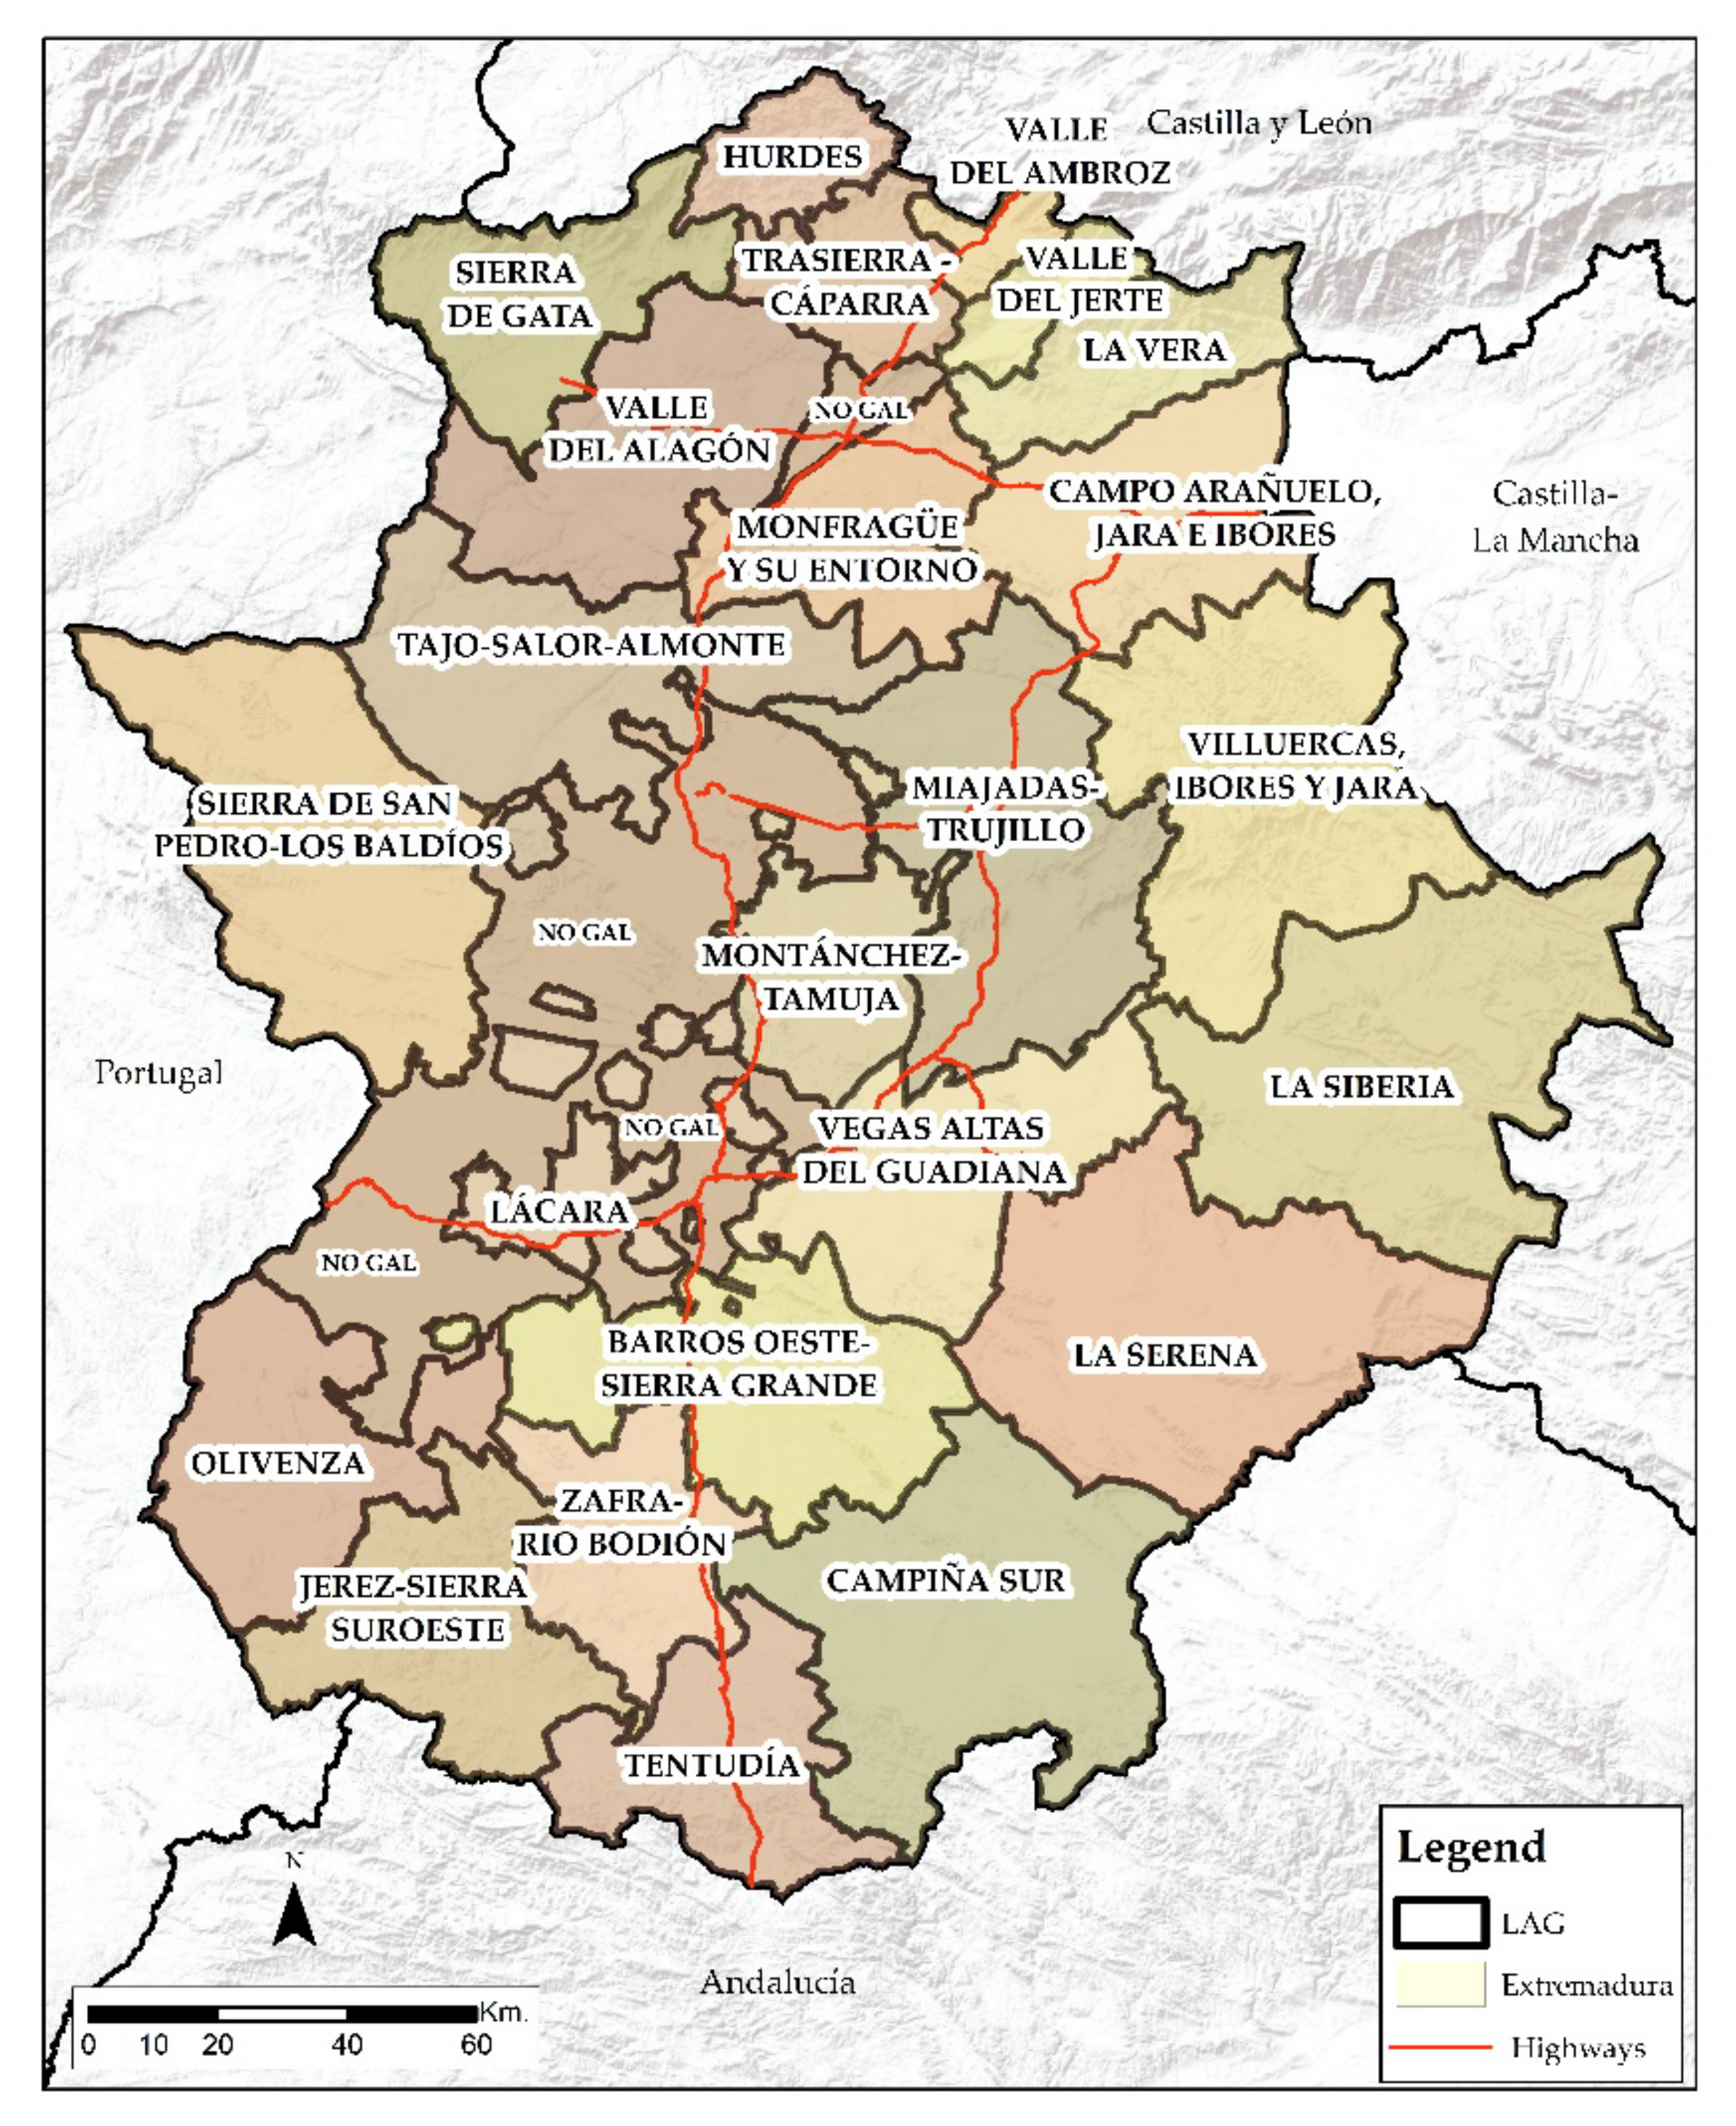
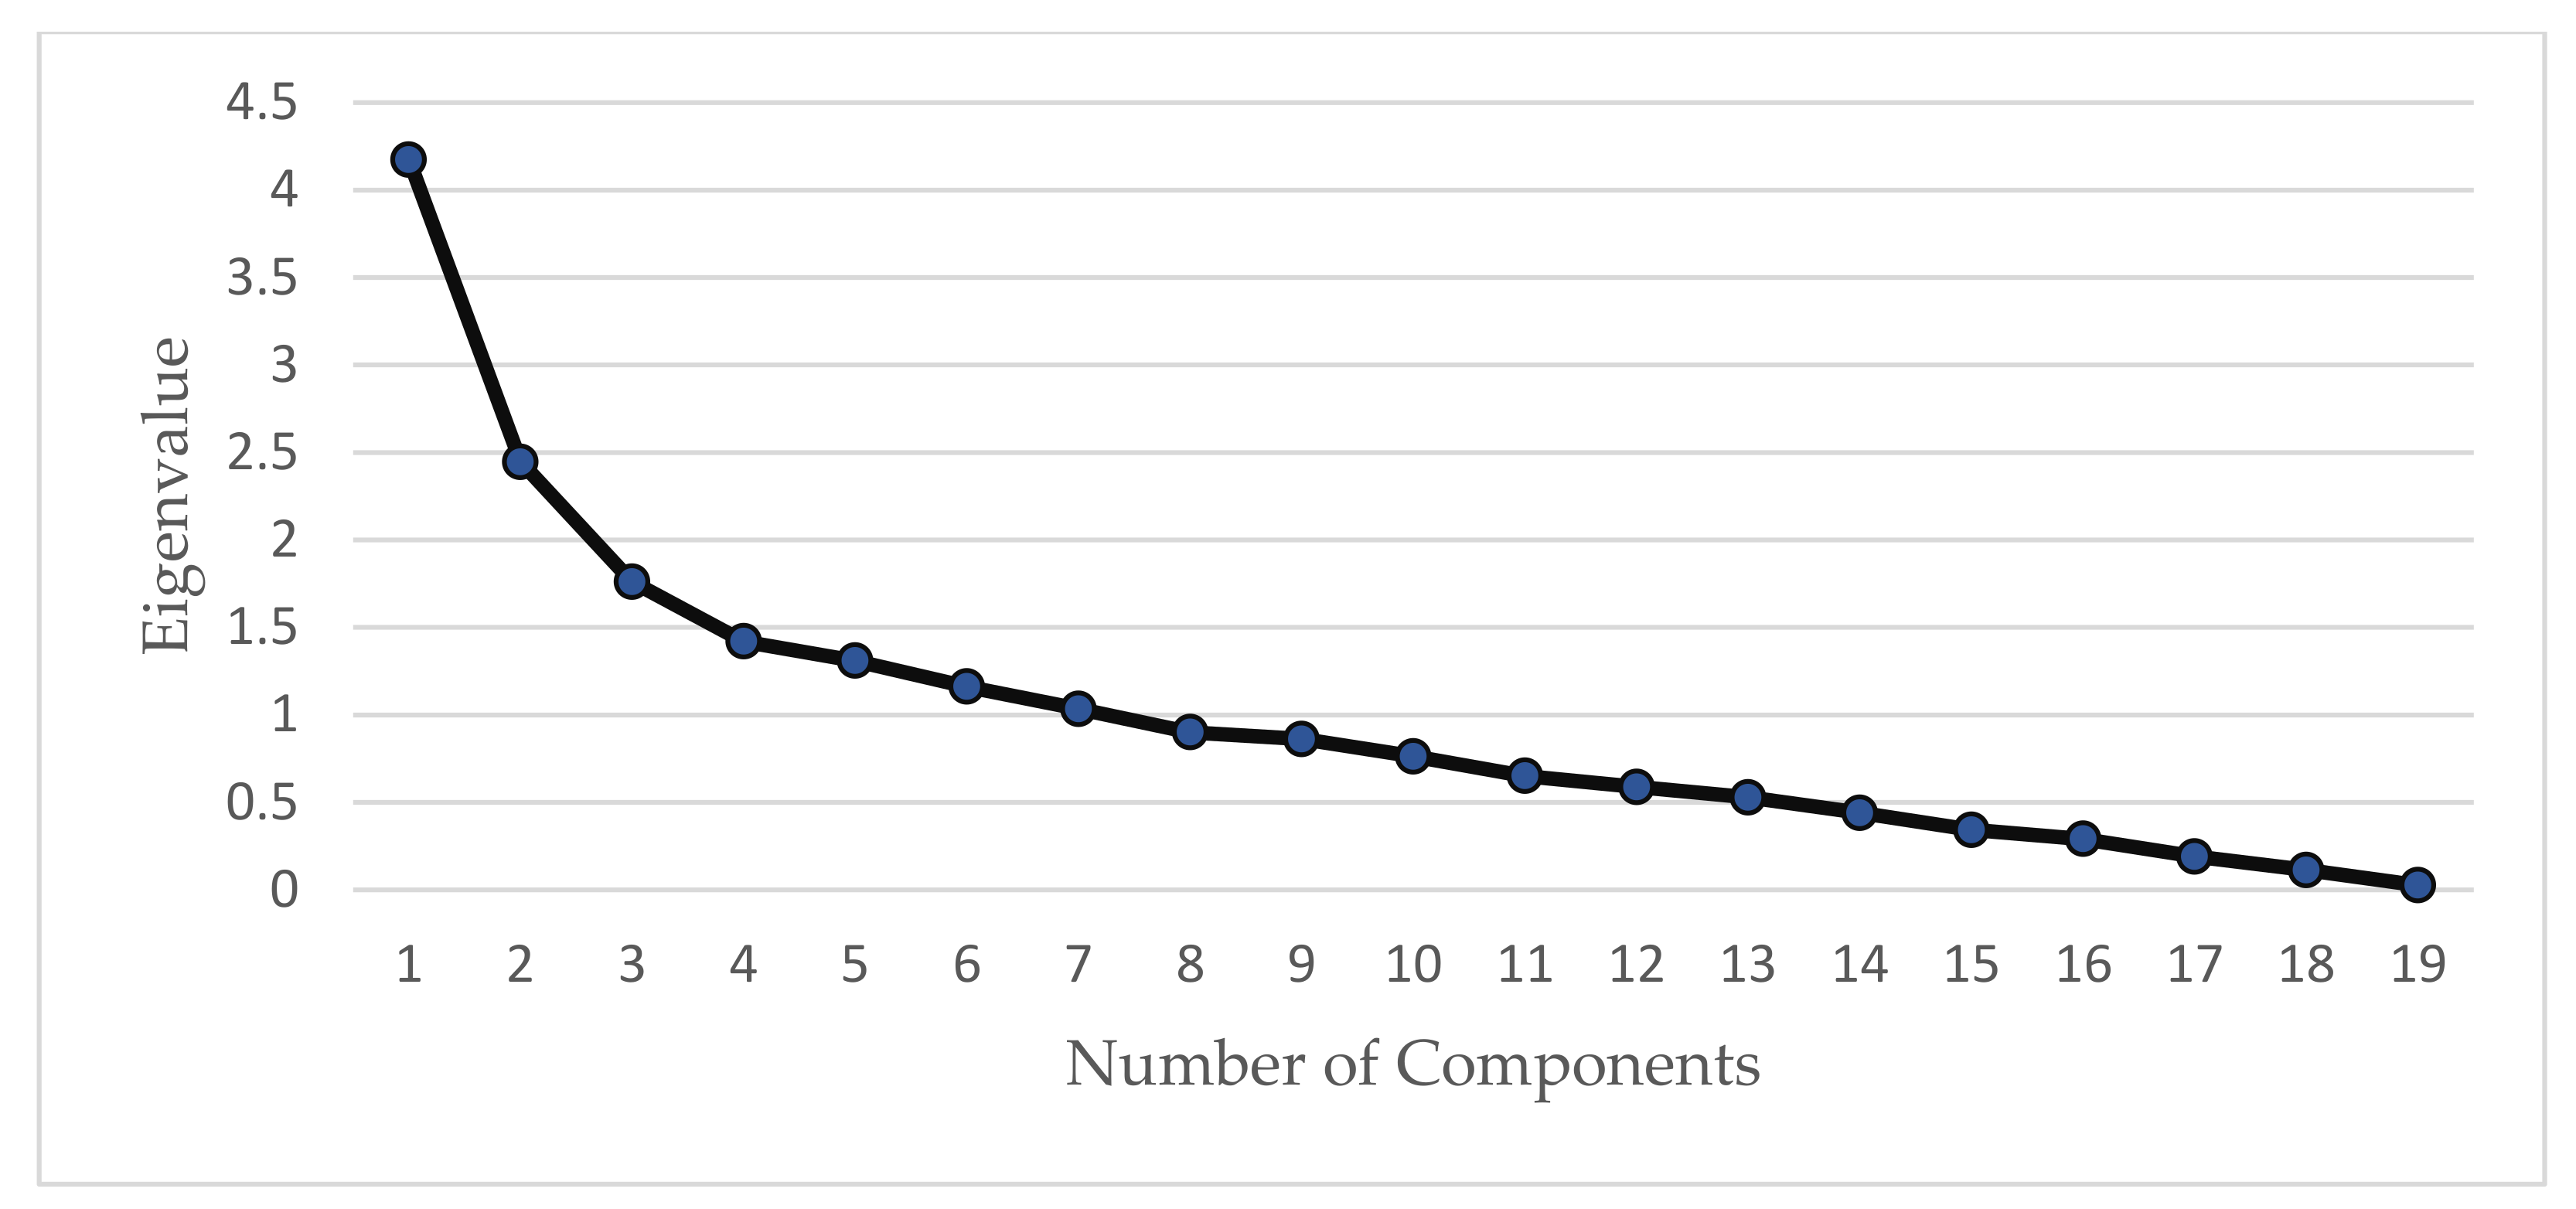
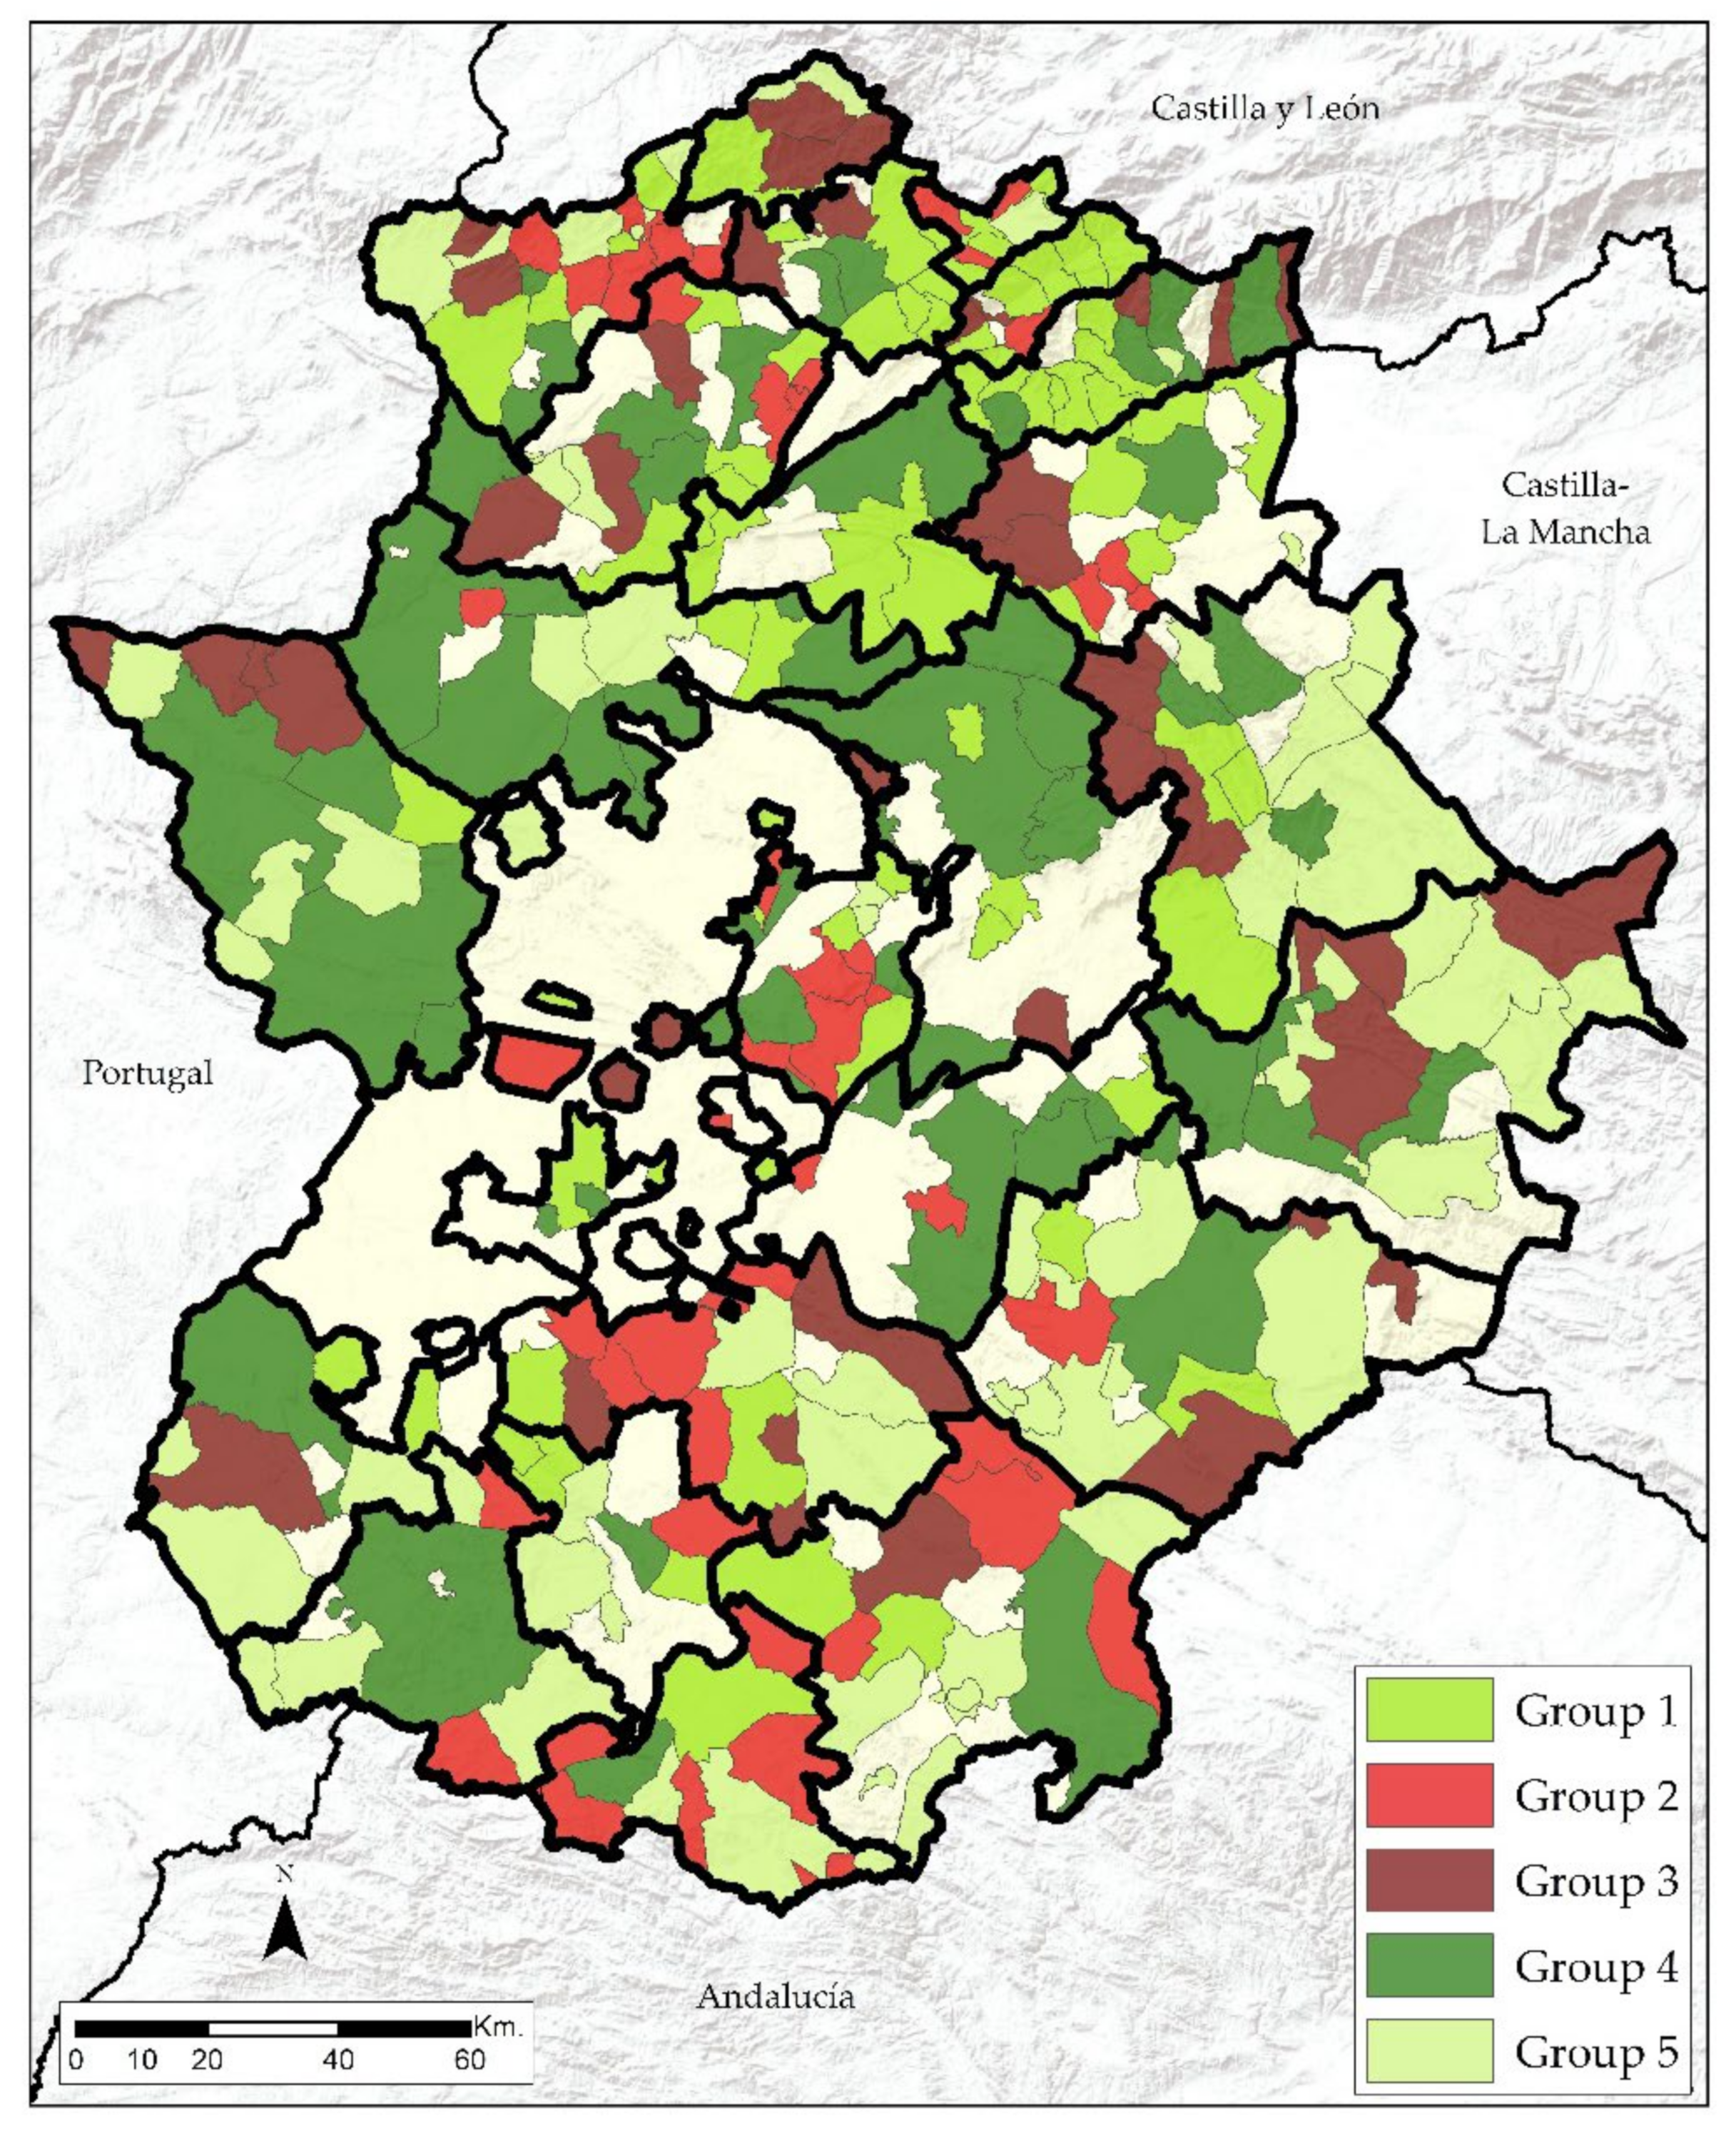
Table 1.
Context variables.
| Typologies | Variables | Data Source |
|---|---|---|
| Physical | Altitude | National Institute of Statistics |
| Demographics | Population growth 1995–2000 | National Institute of Statistics |
| Population growth 2015–2019 | National Institute of Statistics | |
| Old Age Index 2019 | National Institute of Statistics | |
| Economic | Income per capita 2019 | Socioeconomic Atlas Junta de Extremadura |
| Unemployment in the Agricultural Sector as a % of total job seekers | State Public Employment Service (SEPE) | |
| Unemployment in the Service Sector as a % of total job seekers | State Public Employment Service (SEPE) | |
| Accessibility | Minimum Access Time to highways | National Geographic Institute |
| Minimum Access Time from Madrid | National Geographic Institute | |
| Tourism Resources | Historical and Artistic Heritage | Junta de Extremadura |
| Natural Heritage | Junta de Extremadura | |
| Museums and Interpretation Centers | Junta de Extremadura |
Table 2.
Projects and investment in tourism.
| LAGs Leader | Investment in Tourism | % Private Investment | Projects | LAGs Proder | Investment in Tourism | % Private Investment | Projects |
|---|---|---|---|---|---|---|---|
| Campiña Sur | 3,118,315 | 61.8 | 34 | Cáparra | 2,905,954 | 68.1 | 31 |
| Campo Arañuelo | 2,464,825 | 65.5 | 22 | Hurdes | 5,178,228 | 58.2 | 51 |
| Miajadas-Trujillo | 3,484,672 | 68.7 | 44 | Jerez-Sierra Suroeste | 2,879,511 | 62.4 | 23 |
| Olivenza | 4,393,019 | 64.2 | 30 | Lácara | 2,161,322 | 69.2 | 27 |
| Serena, La | 2,825,715 | 57.7 | 38 | Monfragüe | 2,750,532 | 67.7 | 19 |
| Sierra de Gata | 5,220,789 | 65.2 | 99 | Móntanchez-Tamuja | 3,732,989 | 65.3 | 38 |
| Tajo-Salor-Almonte | 5,199,020 | 72.2 | 53 | Siberia, La | 3,443,762 | 64.6 | 32 |
| Tentudía | 4,924,447 | 66.6 | 39 | Sierra de San Pedro-Los Baldíos | 6,231,382 | 64.9 | 76 |
| Valle del Alagón | 5,017,349 | 60.0 | 45 | Sierra Grande-Tierra de Barros | 4,336,448 | 67.0 | 39 |
| Valle del Jerte | 4,563,585 | 64.8 | 76 | Valle del Ambroz | 4,976,198 | 63.7 | 53 |
| Vegas Altas del Guadiana | 769,676 | 63.9 | 8 | ||||
| Vera, La | 7,722,711 | 61.2 | 74 | ||||
| Villuercas-Ibores-Jara | 5,898,528 | 62.5 | 67 | ||||
| Zafra-Río Bodion | 4,868,517 | 71.5 | 31 | ||||
| Total | 41,211,740 | 65.0 | 480 | Total | 57,855,758 | 64.5 | 569 |
Table 3.
Statistical analyses.
| Variables | Average | Standard Deviation | Number |
|---|---|---|---|
| Altitude | 474.26 | 162.55 | 265 |
| Population growth 1995–2000 | −3.28 | 10.65 | 265 |
| Population growth 2015–2019 | −5.35 | 4.52 | 265 |
| Old Age Index 2019 | 28.70 | 7.70 | 265 |
| Income per capita 2019 | 10,273.67 | 1285.80 | 265 |
| Unemployment Agricultural Sector | 11.57 | 8.84 | 265 |
| Unemployment Service Sector | 69.23 | 12.17 | 265 |
| % Tourism Resources | 0.28 | 0.24 | 265 |
| Access Madrid | 200.08 | 55.06 | 265 |
| Highway Access | 19.41 | 15.85 | 265 |
| Active projects | 60.8 | 37.35 | 265 |
| Active Investment | 62.60 | 39.76 | 265 |
| % Active Private Investment | 61.44 | 40.60 | 265 |
| Investment per inhabitant | 459.28 | 780.12 | 265 |
| Percentage of Active Hotel Accommodations | 16.67 | 36.65 | 265 |
| Percentage of Active Non-hotel Accommodation | 18.81 | 38.16 | 265 |
| Percentage of Active Catering Services | 27.93 | 41.20 | 265 |
| Percentage of Active Rural Accommodation | 47.65 | 44.31 | 265 |
| Percentage of active places | 58.00 | 47.88 | 265 |
Table 4.
Communalities.
| Variables | Initial | Extraction |
|---|---|---|
| Altitude | 1 | 0.55 |
| Population growth 1995–2000 | 1 | 0.46 |
| Population growth 2015–2019 | 1 | 0.66 |
| Old Age Index 2019 | 1 | 0.68 |
| Income per capita 2019 | 1 | 0.66 |
| Unemployment Agricultural Sector | 1 | 0.75 |
| Unemployment Service Sector | 1 | 0.80 |
| % Tourism Resources | 1 | 0.72 |
| Access Madrid | 1 | 0.69 |
| Highway Access | 1 | 0.67 |
| Active projects | 1 | 0.89 |
| Active Investment | 1 | 0.93 |
| % Active Private Investment | 1 | 0.91 |
| Investment per inhabitant | 1 | 0.50 |
| Percentage of Active Hotel Accommodation | 1 | 0.56 |
| Percentage of Active Non-hotel Accommodation | 1 | 0.70 |
| Percentage of Active Catering Services | 1 | 0.70 |
| Percentage of Active Rural Accommodation | 1 | 0.75 |
| Percentage of active places | 1 | 0.73 |
Table 5.
Factor weights of the variables.
| Variables | Component 1 | Component 2 | Component 3 | Component 4 | Component 5 |
|---|---|---|---|---|---|
| Altitude | 0.17 | −0.27 | −0.32 | 0.37 | 0.04 |
| Population growth 1995–2000 | −0.14 | 0.21 | 0.39 | −0.25 | 0.08 |
| Population growth 2015–2019 | −0.18 | 0.46 | 0.35 | −0.01 | 0.11 |
| Old Age Index 2019 | 0.28 | −0.73 | −0.20 | −0.14 | 0.11 |
| Income per capita 2019 | 0.21 | −0.55 | 0.36 | −0.04 | 0.39 |
| Unemployment Agricultural Sector | −0.26 | 0.43 | −0.59 | −0.26 | 0.26 |
| Unemployment Service Sector | 0.19 | −0.32 | 0.62 | 0.19 | −0.38 |
| % Tourism Resources | 0.16 | 0.02 | 0.19 | 0.67 | 0.41 |
| Access Madrid | −0.27 | 0.38 | −0.12 | 0.20 | −0.62 |
| Highway Access | 0.09 | −0.15 | −0.41 | 0.55 | −0.32 |
| Active projects | 0.86 | 0.33 | 0.07 | −0.13 | −0.07 |
| Active Investment | 0.90 | 0.29 | 0.05 | −0.13 | −0.09 |
| % Active Private Investment | 0.89 | 0.28 | −0.03 | −0.13 | −0.09 |
| Investment per inhabitant | 0.33 | −0.54 | 0.04 | −0.10 | −0.01 |
| Percentage of Active Hotel Accommodation | 0.18 | 0.31 | −0.10 | 0.38 | 0.40 |
| Percentage of Active Non-hotel Accommodation | 0.16 | 0.24 | 0.15 | 0.15 | 0.18 |
| Percentage of Active Catering Services | 0.23 | 0.34 | 0.32 | −0.09 | −0.19 |
| Percentage of Active Rural Accommodation | 0.80 | −0.05 | −0.22 | −0.13 | 0.01 |
| Percentage of active places | 0.75 | 0.02 | −0.28 | 0.06 | 0.11 |
Table 6.
Average component values by group.
| Variables | Group 1 | Group 2 | Group 3 | Group 4 | Group 5 |
|---|---|---|---|---|---|
| Component 1 | 0.74 | −1.23 | −1.24 | 0.17 | 0.65 |
| Component 2 | −0.51 | 0.42 | −0.52 | 0.09 | 0.59 |
| Component 3 | −0.23 | −0.55 | 0.74 | −0.31 | 0.60 |
| Component 4 | 0.60 | −0.20 | 0.10 | 0.29 | −0.62 |
| Component 5 | −0.60 | −0.46 | −0.20 | 1.54 | −0.09 |
| N° of Municipalities | 75 | 44 | 38 | 50 | 58 |
| Success rate | High | Low | Low | High | High |
| Active projects | 82.6 | 19.8 | 15.1 | 76.1 | 79.7 |
| Active Investment | 86.1 | 12.5 | 13.2 | 79.1 | 87.6 |
Table 7.
Average data by group.
| Variables | Group 1 | Group 2 | Group 3 | Group 4 | Group 5 |
|---|---|---|---|---|---|
| N° of Municipalities | 75 | 44 | 38 | 50 | 58 |
| Average population | 1399 | 2385 | 864 | 5129 | 1728 |
| Altitude | 486 | 483 | 475 | 430 | 500 |
| Population growth 1995–2000 | −3.98 | 2.15 | −5.7 | −3.53 | −4.66 |
| Population growth 2015–2019 | −4.18 | −3.10 | −7.7 | −4.95 | −6.55 |
| Old Age Index 2019 | 29.3 | 26.6 | 30.9 | 25.5 | 30.6 |
| Income per capita 2019 | 10348 | 10111 | 10475 | 10492 | 9978 |
| Unemployment Agricultural Sector | 14.6 | 8.8 | 16.3 | 10.0 | 7.7 |
| Unemployment Service Sector | 64.4 | 72.0 | 62.5 | 70.6 | 76.3 |
| % Tourism Resources | 0.2 | 0.1 | 0.2 | 0.4 | 0.2 |
| Access Madrid | 176.1 | 215.5 | 207.1 | 188 | 224 |
| Highway Access | 13.0 | 13.5 | 27.4 | 15.0 | 30.5 |
| Active projects | 82.6 | 19.8 | 15.1 | 76.9 | 79.7 |
| Active Investment | 86.1 | 12.5 | 13.2 | 79.1 | 87.6 |
| % Active Private Investment | 85.1 | 9.2 | 13.0 | 81.1 | 85.0 |
| Investment per inhabitant | 555 | 243 | 485 | 202 | 702 |
| Percentage of Active Hotel Accommodation | 25.3 | 7.3 | 5.2 | 22.5 | 14.9 |
| Percentage of Active Non-hotel Accommodation | 19.3 | 14.7 | 12.2 | 16.3 | 27.5 |
| Percentage of Active Catering Services | 6.2 | 7.5 | 6.5 | 86.4 | 34.9 |
| Percentage of Active Rural Accommodation | 78.3 | 6.7 | 12.4 | 33.9 | 73.7 |
| Percentage of active places | 90.8 | 15.7 | 18.9 | 38.8 | 89.6 |
| Success rate | High | Low | Low | High | High |
Publisher’s Note: MDPI stays neutral with regard to jurisdictional claims in published maps and institutional affiliations. |
© 2021 by the authors. Licensee MDPI, Basel, Switzerland. This article is an open access article distributed under the terms and conditions of the Creative Commons Attribution (CC BY) license (https://creativecommons.org/licenses/by/4.0/).
Share and Cite
MDPI and ACS Style
Engelmo Moriche, Á.; Nieto Masot, A.; Mora Aliseda, J. Territorial Analysis of the Survival of European Aid to Rural Tourism (Leader Method in SW Spain). Land 2021, 10, 1030. https://0-doi-org.brum.beds.ac.uk/10.3390/land10101030
AMA Style
Engelmo Moriche Á, Nieto Masot A, Mora Aliseda J. Territorial Analysis of the Survival of European Aid to Rural Tourism (Leader Method in SW Spain). Land. 2021; 10(10):1030. https://0-doi-org.brum.beds.ac.uk/10.3390/land10101030
Chicago/Turabian StyleEngelmo Moriche, Ángela, Ana Nieto Masot, and Julián Mora Aliseda. 2021. "Territorial Analysis of the Survival of European Aid to Rural Tourism (Leader Method in SW Spain)" Land 10, no. 10: 1030. https://0-doi-org.brum.beds.ac.uk/10.3390/land10101030
Note that from the first issue of 2016, this journal uses article numbers instead of page numbers. See further details here.