
Research on the Evaluation Index System of the Soil Remediation Effect Based on Blockchain


Business School, Sichuan University, Chengdu 610064, China
*
Author to whom correspondence should be addressed.
Land 2021, 10(11), 1274; https://0-doi-org.brum.beds.ac.uk/10.3390/land10111274
Submission received: 18 October 2021
/
Revised: 14 November 2021
/
Accepted: 17 November 2021
/
Published: 20 November 2021
Abstract
:Soil remediation technology has achieved good results at present, but evaluation research on the soil remediation effect is relatively lacking. In the field of soil remediation effect evaluation, there are problems such as unscientific and imperfect indices and the inability to guarantee the authenticity of data. Based on the research results of domestic and foreign scholars and the soil remediation standards of some developed countries, a set of recommended indices for soil remediation evaluation has been formed through the analysis and screening of a large number of documents and the results of expert consultation. However, there are phenomena such as lack of data authenticity, information asymmetry, and low supervision efficiency. Based on the technical characteristics of the blockchain and the current soil remediation effect evaluation requirements, combined with the research results of domestic and foreign scholars and the soil remediation standards of some developed countries, the core technology and corresponding application scenarios were analysed for functional requirements in this paper. The introduction of blockchain technology will improve the authenticity of data and form a decentralized, trustworthy, and traceable supervision model. Finally, an evaluation index system of the soil remediation effect based on blockchain was constructed from the following five aspects: collection of soil remediation indices, the addition of a new blockchain-based soil remediation effect evaluation and supervision model, the determination of index weights, a list of soil remediation effect evaluation indices, and providing feedback and suggestions. Through the application of blockchain technology and the innovative addition of the “regional policy” evaluation index, changes and innovations were made in all aspects of the soil remediation effect evaluation process.
1. Introduction
Research on soil remediation technology appeared in the 1970s and has developed rapidly in recent years. Some developed countries have made huge investments in soil remediation technology and equipment research and have accumulated rich field remediation technology and experience in engineering applications. Therefore, soil remediation technology has been rapidly developed, and a soil remediation technology system has been formed and achieved good governance results. However, the evaluation indexes of soil remediation are mainly divided into physical (soil texture, bulk density, etc.), biological (microbes and enzymes), and chemical (pH, salinity, organic carbon, etc.) indexes [1]. The evaluation indices are incomplete, and the evaluation process is not clear. It is difficult to guarantee the timeliness of the restoration data in all aspects, and it is difficult to determine whether the soil restoration has achieved the expected purpose and whether the plan needs improvement. However, due to the lack of scientific and advanced supervision models in the evaluation of soil remediation effects in practice, the authenticity of data sources cannot be guaranteed, and accountability cannot be traced to the source [2]. Therefore, in the current evaluation of soil remediation effects, there are problems of information asymmetry, inadequate supervision, and imperfect indicators that need to be resolved. Researchers in this field of study have been extensively concerned about these issues in recent years.
With the application and development of blockchain technology in intelligent manufacturing, supply chains and other fields, it is leading multidimensional reform in technology, organizations, and even society [3,4]. Additionally, blockchain technology provides new ideas for solving current ecological problems. The characteristics of decentralization, tamper-proofing, traceability, and high security of blockchain technology are conducive to solving the problems of information asymmetry, supervision difficulties, and government behaviour variation that have long been faced in the soil remediation effect evaluation system. The government is no longer the only central position in the governance system. The subjects in the system can overcome the obstacles of traditional information intermediaries and realize direct interaction. A mutual trust environment for the mutual assistance and cooperation order between governance entities can be created by constructing a soil remediation effect evaluation and supervision model. It provides technical conditions for effectively promoting research on evaluation index systems of the soil remediation effect [5]. Therefore, how to apply blockchain technology for data supervision and complete the evaluation indices of soil remediation effects are the research focus in this paper.
Based on the above analysis, blockchain technology was used to supervise the whole process, and the weight was determined by the combination of the analytic hierarchy process (AHP) and entropy method. Additionally, on the basis of the research results of domestic and foreign researchers and the soil remediation standards of some developed countries, “regional policy” indices were added. Then, an evaluation index system of the soil remediation effect based on blockchain technology was constructed. It included the following three modules: a new blockchain-based soil remediation effect evaluation and supervision mode, and soil remediation effect evaluation indices (3 first-level indices, 10 second-level indices, 47 third-level indices and index weights). Through the sensitivity analysis of the system, the results showed that the overall evaluation results were relatively stable, and the weights initially determined in this study were also reasonable, which can objectively reflect the true effects of soil remediation in this area. Finally, according to the evaluation value of the soil remediation effect, feedback suggestions for the soil remediation effect were provided.
2. Materials and Methods
2.1. Soil Remediation Effect Evaluation Indices
The selection of the soil remediation effect evaluation index is the core link in the soil remediation effect evaluation. Generally, it is necessary to formulate evaluation objectives, clarify the evaluation objects and soil functions first, and then select them based on conditions such as regional characteristics, climate differences, soil utilization methods and field management measures [6]. In some developed countries, the evaluation of the soil remediation effect generally determines the remediation effect by comparing the detection of target pollutants in the soil with the allowable concentration of pollutants in the soil obtained from the purpose of land reuse and risk assessment. However, this does not truly reflect the ecological safety of the soil after remediation. Larson and colleagues evaluated soil quality through production, soil erosion, groundwater, surface water, atmosphere and food quality but lacked a detailed analysis of chemical indices [7]. Conte and colleagues evaluated the highly contaminated site around the former chemical plant of ACNA (near Savona) in Northern Italy by changing the concentration of sodium dodecylsulphate, Triton X-100, a humic acid at its critical micelle concentration [8] Xu proposed that the evaluation of the remediation effect of contaminated soil can be carried out from two aspects: after-effect observation and risk evaluation of contaminated soil remediation [9]. However, the analysis and measurement methods of these indices have not yet formed a unified standard and specification. Due to the variety of soil types, it is greatly restricted in practical applications; Cui comprehensively considered clean technology factors, soil background value factors, controllable factors of standards and regulations, and pollution ecotoxicological evaluation to establish contaminated soil remediation standards [10]. The phytotoxicity evaluation method, terrestrial invertebrate evaluation method, soil microbial evaluation method, and biomarker evaluation method are commonly used to evaluate the remediation effect of contaminated soil. However, no specific secondary indices or operable evaluation system were given. Li and others judged the effect of cleaning technology on the contaminated soil from a steel smelting site through soil cadmium, lead, zinc, and arsenic concentration [11]. The main indices selected in the evaluation studies of Lin. K. and Bünemann are conventional physical and chemical indices, such as SOM, AP, TN, pH, and bulk density. However, there are fewer selections of soil biological indices [12,13]; Zhou et al. evaluated the remediation effect of contaminated rice fields through pH, bulk density, and cation exchange capacity in soil [14]; Wang et al. used the bacterial characteristic experiment and the pot experiment, and the results showed that FDA hydrolysis, acid phosphatase, urease, invertase, dehydrogenase, bacterial diversity indexes and community structure can be used to judge the repair effect of heavy metals contaminated soil [15]; Lehmann proposed that pathogens, parasites, biodiversity, bioavailability and mobile pollutants (such as dioxins, polycyclic aromatic hydrocarbons and microplastics), as well as the diversity of compounds and pore diameters, should be included in the evaluation system [16]. An et al. studied the influence of Shannon–Weiner diversity indices, evenness indices, trophic diversity (TD) indices, and maturity indices on the stability of the soil environment, and found that soil nematodes can be used as a biological indicator because they reflect the restoration process of the plant–soil ecosystem [17].
In summary, at present, there is no unified standard or specification for the evaluation of soil remediation effects. Additionally, there is a lack of scientific and technological support for the data sources and supervision in the evaluation process.
2.2. Method for Determining Index Weight
The index weight is a reflection of the relative importance of the indices and is an important parameter for calculating the evaluation index. Currently, there are many methods for determining index weights. According to different sources of original data when calculating weights, they can be divided into three categories: subjective weighting method, objective weighting method, and combined weighting method.
Li issued 600 questionnaires based on the characteristics of environmental risk assessment and used the analytic hierarchy process to construct a hierarchical structure model of the environmental risk assessment indices in industrial parks [18]. Li and others determined the weight of evaluation indices for agricultural nonpoint source pollution prevention and control technology through the “Expert Consultation-Analytic Hierarchy Process” [19]. The results showed that the constructed evaluation technology method is suitable for the comparison and selection of different individual technologies in the same type of agricultural nonpoint source pollution prevention and control technologies. The evaluation result is highly accurate. This proved that its weight determination method is scientific and feasible. Xing and others established an evaluation index system for the environmental carrying capacity of their country’s marine resources [20]. The entropy method was used to calculate the entropy value of the evaluation index to judge the degree of dispersion of the evaluation index value. A very objective evaluation index weight can be obtained through mathematical methods. Ma established a 17-index resource-recycling city economic transformation capability evaluation index system [21]. The entropy weight TOPSIS method is used to set the index weights, and the economic transformation capacity of 11 resource-recycling cities in China from 2013 to 2016 is measured. On the basis of the Drastic model, Wang introduced the entropy weight coefficient method to determine the index weight and established the DRASTIC entropy weight model [22]. In the end, a more scientific index weight that is closer to the actual situation of the study area is obtained, which provides an important reference and basis for the protection of regional groundwater resources. Zhao started from the status quo of the marine economy and summarized the status quo of marine economic development and ecological environment development in Guangdong Province [23]. The two dimensions of economic development and ecological environmental protection were selected to construct the evaluation system of the Guangdong Marine Economic Green Development Index, and the entropy method was used to calculate the index weight. Zou [24] proposed a shopping mall fire risk assessment method based on a quantitative safety checklist and the structural entropy weight method. The Delphi expert point survey method of collecting expert opinions is combined with the fuzzy analysis method to form a “typical ranking”. According to the given entropy decision formula, “typical sorting” is calculated by the entropy value, “blindness analysis”, and statistical processing of potential deviation data is performed. The combination of the subjective assignment method and objective assignment method avoids the drawbacks of their respective calculation methods. Ao [25] used the entropy weight method to obtain the weight of each index to obtain the weight of the land ecological quality evaluation index of the Yellow River Basin and then used the weight obtained by the analytic hierarchy process to modify the entropy weight. This makes the weight value closer to the actual situation.
The above research shows that to avoid the limitations of a single method in practical applications, a combination of multiple methods is often used to determine the index weight. Based on this, to avoid the limitations of a single method, a combination of the entropy weight method and AHP was used to determine the index weight in this study.
3. Method
3.1. Selection of Index System
3.1.1. Principles of Index Selection
- Principle of universality. There are many indices of soil remediation effects, but the premise is that they must be based on a comprehensive and systematic point of view. By analysing the primary and secondary effects of various soil characteristics on soil functions, the indices that have important effects are selected. Additionally, they do not unrestrictedly expand the choice of indices and complicate the entire index system.
- The principle of objectivity. The indices used for soil remediation evaluation should be objective and can reflect the remediation effect to the greatest extent. Quantitative indices should be the mainstay, and qualitative indices can be selected as auxiliary evaluation indices when necessary.
- Sensitivity principle. The selected soil remediation evaluation index must be sufficiently sensitive. If the selected index is not sensitive to soil changes, it is of no use value for monitoring soil performance changes. However, the sensitivity of the index depends on the time scale for monitoring changes in soil properties.
- Principle of evaluability. After the evaluation index of the soil remediation effect is measured, there must be corresponding standard values or reference values that can be used as the basis for evaluation. Based on this, it is determined whether the expected repair target has been achieved [26].
3.1.2. Method of Indices Selection
Constructing an effective evaluation index system is the core link and important step of the evaluation of the remediation effect, and it guarantees the success of the remediation evaluation. The preliminary determination of the evaluation index system is determined by consulting relevant literature, extracting the indices used, and statistically analysing the relevant data of each index. Finally, it was determined after discussion by experts.
Step 1: The literature analysis was based on the Web of Science database and CNKI database. The number of studies searched through “topic = (soil remediation evaluation) OR topic = (soil remediation assessment) OR topic = (soil remediation)” was slightly less.
Step 2: The literature of “topic = (soil quality evaluation) OR topic = (soil quality assessment) OR topic = (soil quality)” was searched to assist in the compilation of indices. The search time span was from 1 January 1990 to 1 October 2021, and a total of 445 references were found.
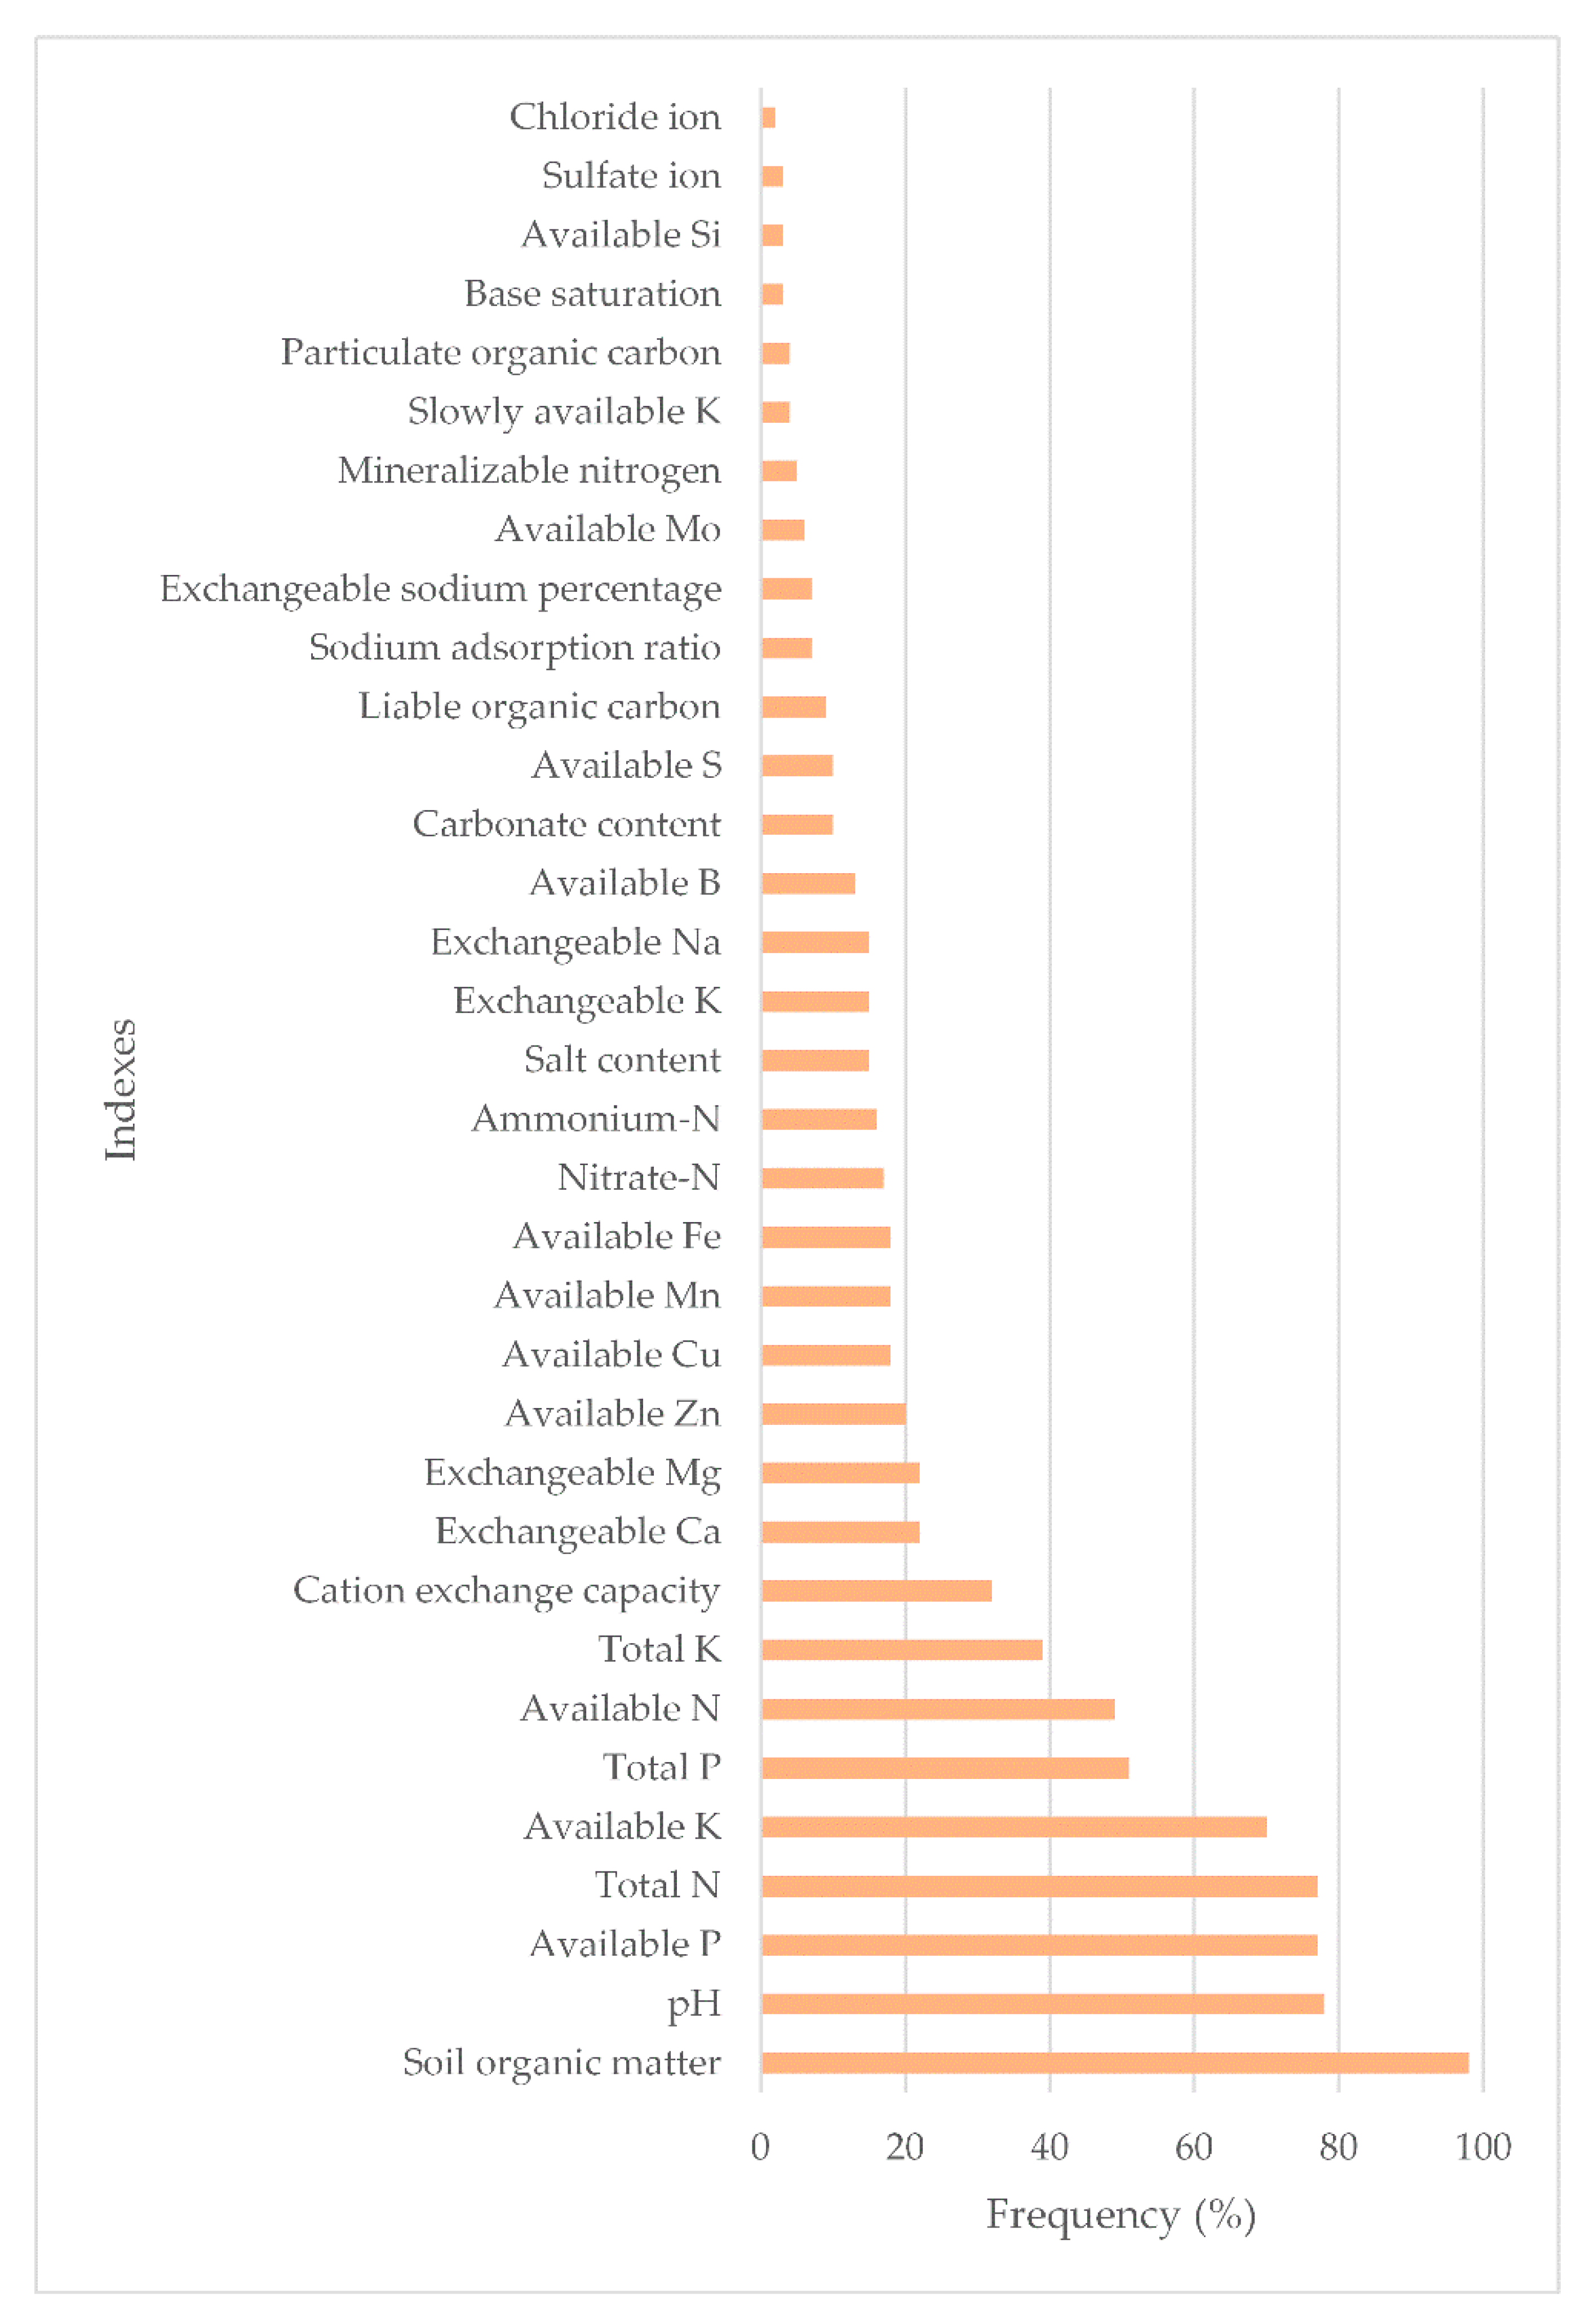
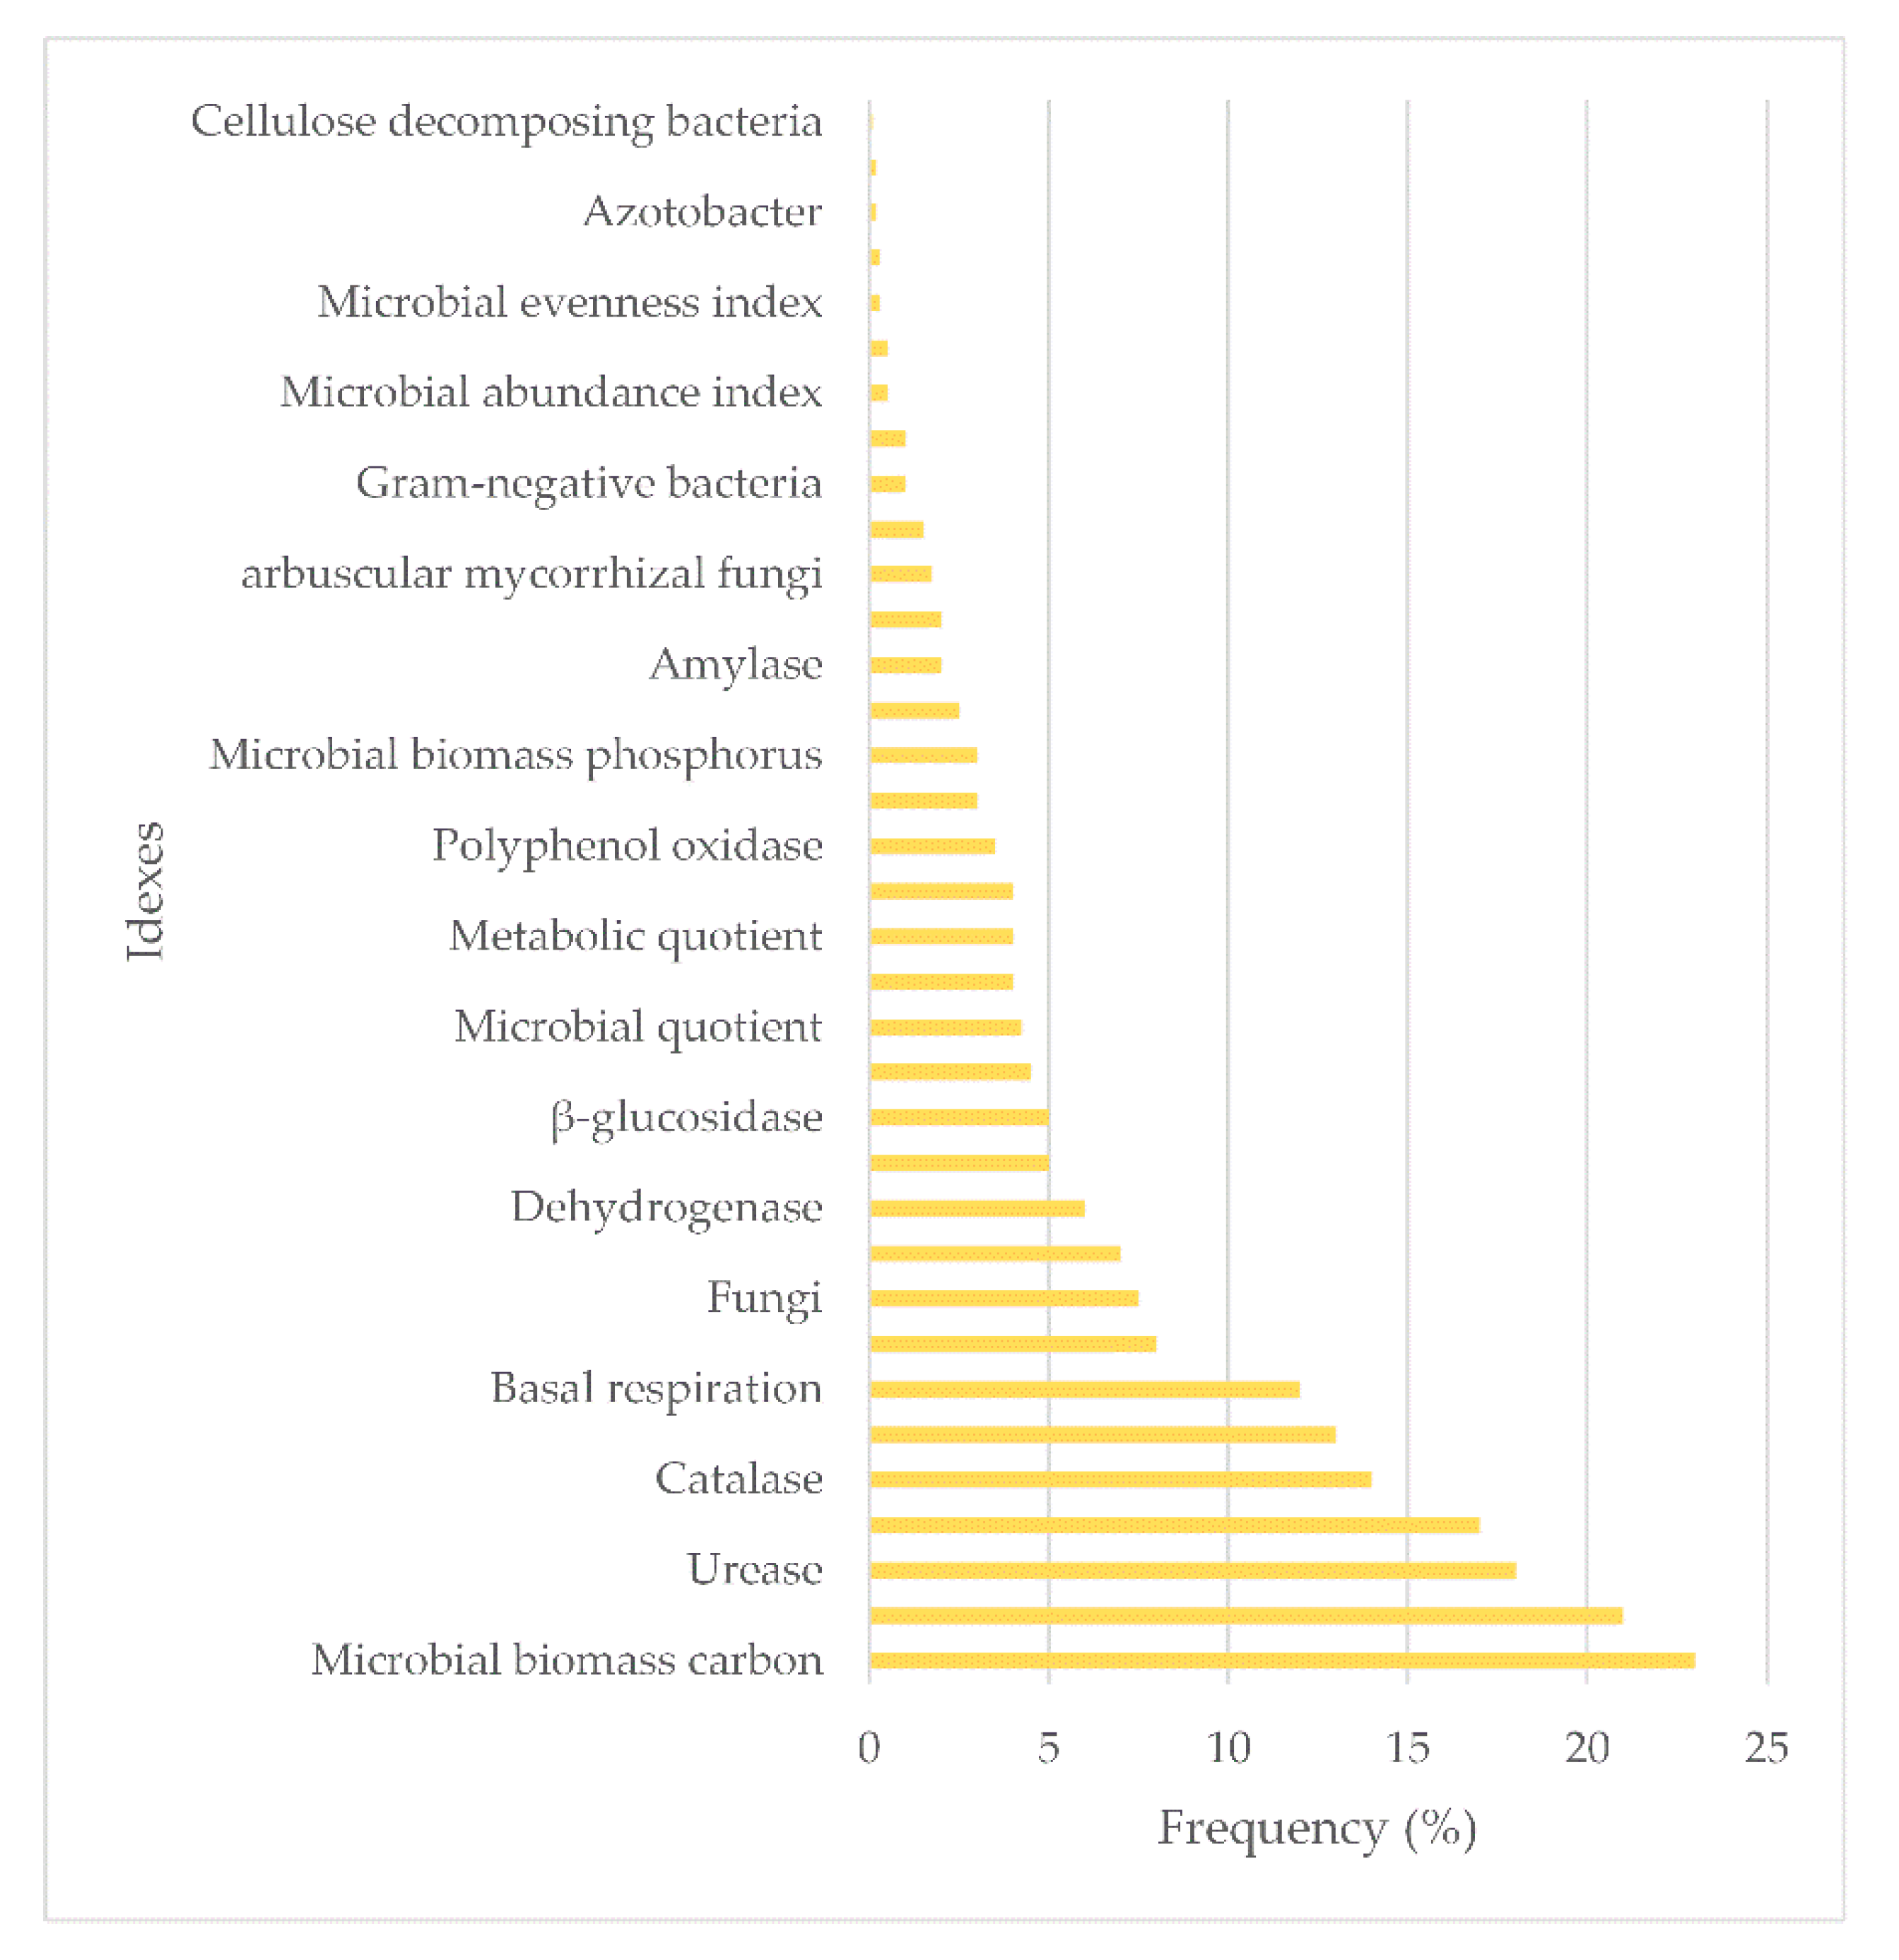
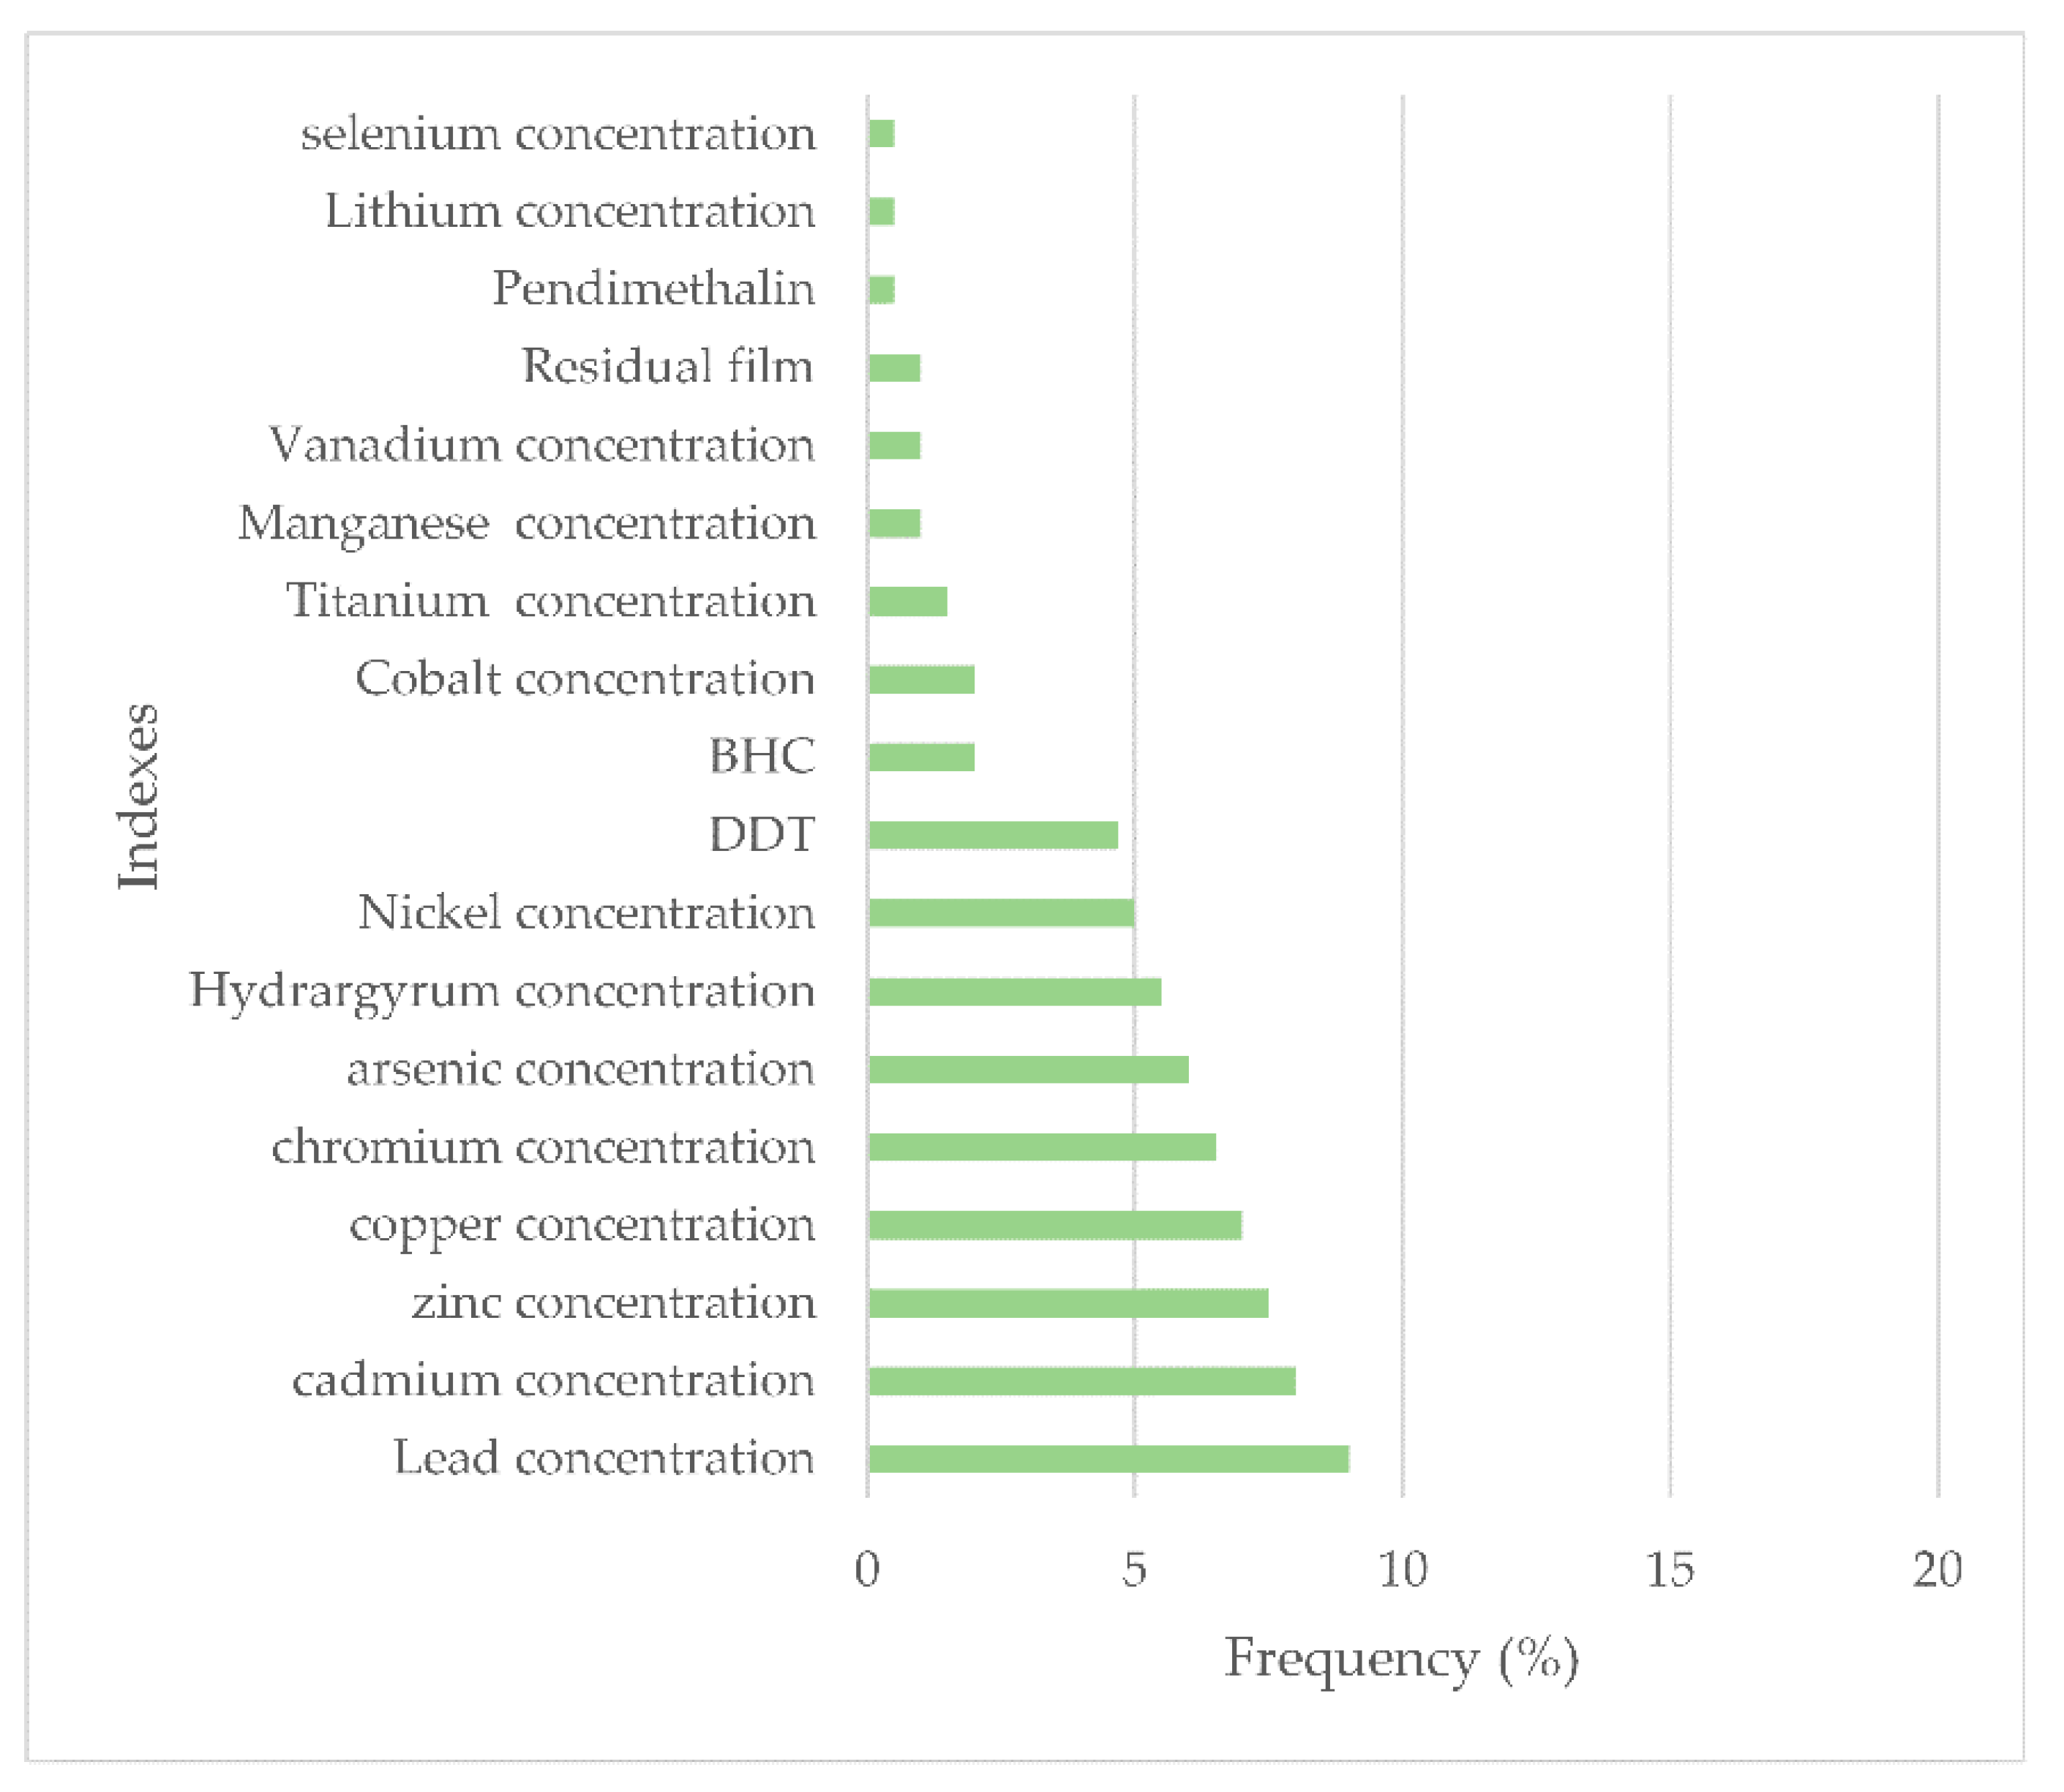
Step 3: The retrieved literature was counted, and the evaluation indices used in the selected literature were divided into four categories: physics [27,28], chemistry [29,30], biological [31,32] and environment [33,34]. Finally, the frequency of index selection was analysed. Through the indices and data obtained, Excel (Microsoft, Washington, DC, USA) was used to sort, filter, statistics and graph. The results are shown in Figure 1, Figure 2, Figure 3 and Figure 4.
3.1.3. Selection of Indices
The soil conditions and data in Zigong City are used as an example to complete the following research.
Due to the shallow soil layer of sloping farmland in Zigong City, the phenomenon of soil erosion is serious and soil fertility is reduced. In particular, the loss of topsoil on sloping farmland has made the soil of the cultivated land area layer thinner, reduced water holding capacity, deteriorated soil physical properties, and weakened water and fertilizer retention performance. The massive loss of soil not only leads to a decline in the productivity of cultivated land area, but also leads to the siltation of rivers, ponds, reservoirs, and weirs, which pollutes water resources and reduces the ability to withstand floods and droughts.
Based on the above analysis, the evaluation of soil remediation effect in Zigong City should focus on soil properties, soil fertility and water resources indices. Corresponding evaluation standards should be formulated according to the climate characteristics of Zigong City and the purpose of the remediation project.
- (1)
- Design and distribution of questionnaires
A questionnaire survey was conducted among 30 experts in different professional fields, such as soil science, pollution remediation, environmental impact assessment, and environmental planning. Experts included from teachers from Sichuan University and partner universities.
The content of the first questionnaire survey is a list of 91 indices compiled from references. The purpose is to obtain feedback from experts on indices and other indices suggested to be added. The survey results show that the additional indices recommended by experts are temperature variation of topsoil and level of networking forest.
In the second questionnaire, a set of 96 indicators that have been integrated are listed (including the 93 evaluation indices in Questionnaire 1 and the innovative “regional emergency response capability”, “equipment performance” and “management system” added in this paper.”) and evaluated one by one. As the “regional policy” is the policy support of the soil remediation project, the flexibility of the response to emergency incidents and the advancement of local remediation equipment guarantee the soil remediation project. Therefore, “regional policy” was innovatively added to the index system. The questionnaire was mainly conducted on a five-level scale; that is, according to the degree of influence of each index on the evaluation of the soil remediation effect, each index was divided from high to low degrees of influence into five options of very important, relatively important, important, less important, and very unimportant. Additionally, the scores were set to 5, 4, 3, 2, and 1 so that the respondents could score each index.
- (2)
- Descriptive statistical analysis
In this study, the returned questionnaires were counted, and then descriptive statistical analysis was performed on the statistical results using SPSS software (IBM, New York, NY, USA). Indices with a mean value greater than 3 were included, and indices with a mean value less than 3 were eliminated. Finally, 47 evaluation indices remained, which will be elaborated in Section 4. The screening results are shown in Table 1, where 1 means to keep and 2 means to delete.
- (3)
- Reliability analysis
Reliability refers to the consistency, stability, and reliability of the test results. Generally, internal consistency is used to express the reliability of the test. The higher the reliability coefficient is, the more consistent and reliable the test results. The most commonly used method for internal reliability testing is Cronbach’s alpha coefficient method. In this paper, Cronbach’s alpha α coefficient method is used to obtain α = 0.901. Generally, the value of Cronbach’s α coefficient is between 0 and 1.
If the α coefficient is less than or equal to 0.6, it indicates that the internal consensus reliability is insufficient. The α coefficient is between 0.7 and 0.8, which indicates that the scale has considerable reliability. When the α coefficient reaches 0.8–0.9, it indicates that the reliability of the scale is very good. α = 0.901 indicates that this questionnaire has high reliability and high reliability. The data obtained from the results of this questionnaire can effectively meet the requirements of the research.
- (4)
- Factor analysis
- Test whether it is suitable for factor analysis. Generally, the analysis is carried out by reflecting the image correlation matrix, the correlation coefficient matrix with the help of variables, Bartlett’s sphericity test and KMO test methods. After calculation, the KMO of the component supplier evaluation index is 0.823, and the significance probability Sig is 0.000, indicating that the data are relevant and suitable for factor analysis.
- Extract factors. The method of extracting factors mainly used in this paper is the principal component analysis method. The results of the variance contribution rate of the obtained factors are shown in Table 2. As shown in Table 2, there are eight common factors. They explained 78.060% of the total variance, indicating that these eight main factors can explain 78.060% of the original 47 variable indicators. Starting from the ninth factor, its characteristic root was less than 1, so the first eight factors are extracted as common factors.
In this study, the maximum variance method was used to orthogonally rotate the factor loading matrix. A load greater than 0.5 was selected as the naming basis, and a total of 8 common factors were extracted. Additionally, a coefficient analysis was performed on each common factor. Take the eighth common Factor C8 as an example, as shown in Table 3.
From the above analysis, it can be seen that C8 had a greater impact on regional emergency capability, equipment characteristics, and management systems. They explain 5.635% of the total variance. These three indices were all related to policies and reflect shared factors. The common Factor C8 was collectively referred to as the common factor of regional policy. Similarly, C1–C7 can be named soil chemical indices, soil physical property indices, soil biological indices, soil pollutant indices, water resource indices, biological indices, and other indices.
Finally, based on the above calculation results, through face-to-face interviews, emails and other forms of investigations with five scholars in the field of environmental governance and comprehensive evaluation from Sichuan University, C1–C3 were combined as soil fertility indices, and C4–C7 were combined as the soil environmental indices.
Considering the above consultation and calculation results, according to the general ideas and basic principles of the evaluation index system construction combined with foreign soil remediation effect index research and my country’s current standard system and norms, a soil remediation effect recommendation evaluation index system was constructed. The specific content is shown in Table 4. The index system closely focuses on the ecological functions of the soil and was proposed from three aspects: soil fertility indicators, environmental indicators, and regional policies.
3.2. Application of Blockchain
3.2.1. Demand Analysis
Generally, the application scenarios of blockchain technology have the following three basic characteristics. First, the scenario needs to be decentralized, and multiple subjects can participate in and write data at the same time. Second, the technology requires the use of data with high authenticity. Third, in the initial situation, multiple entities that do not trust each other can establish distributed trust. The soil remediation project requires multiple participants from the government, companies that implement the remediation, and the general public. However, it is necessary to continuously store various repair data in the database. The authenticity of the repair data directly affects the authenticity of the repair effect evaluation and the timeliness of the repair effect feedback. Therefore, from the perspective of system characteristics, soil remediation effect evaluation research is a scenario suitable for blockchain applications.
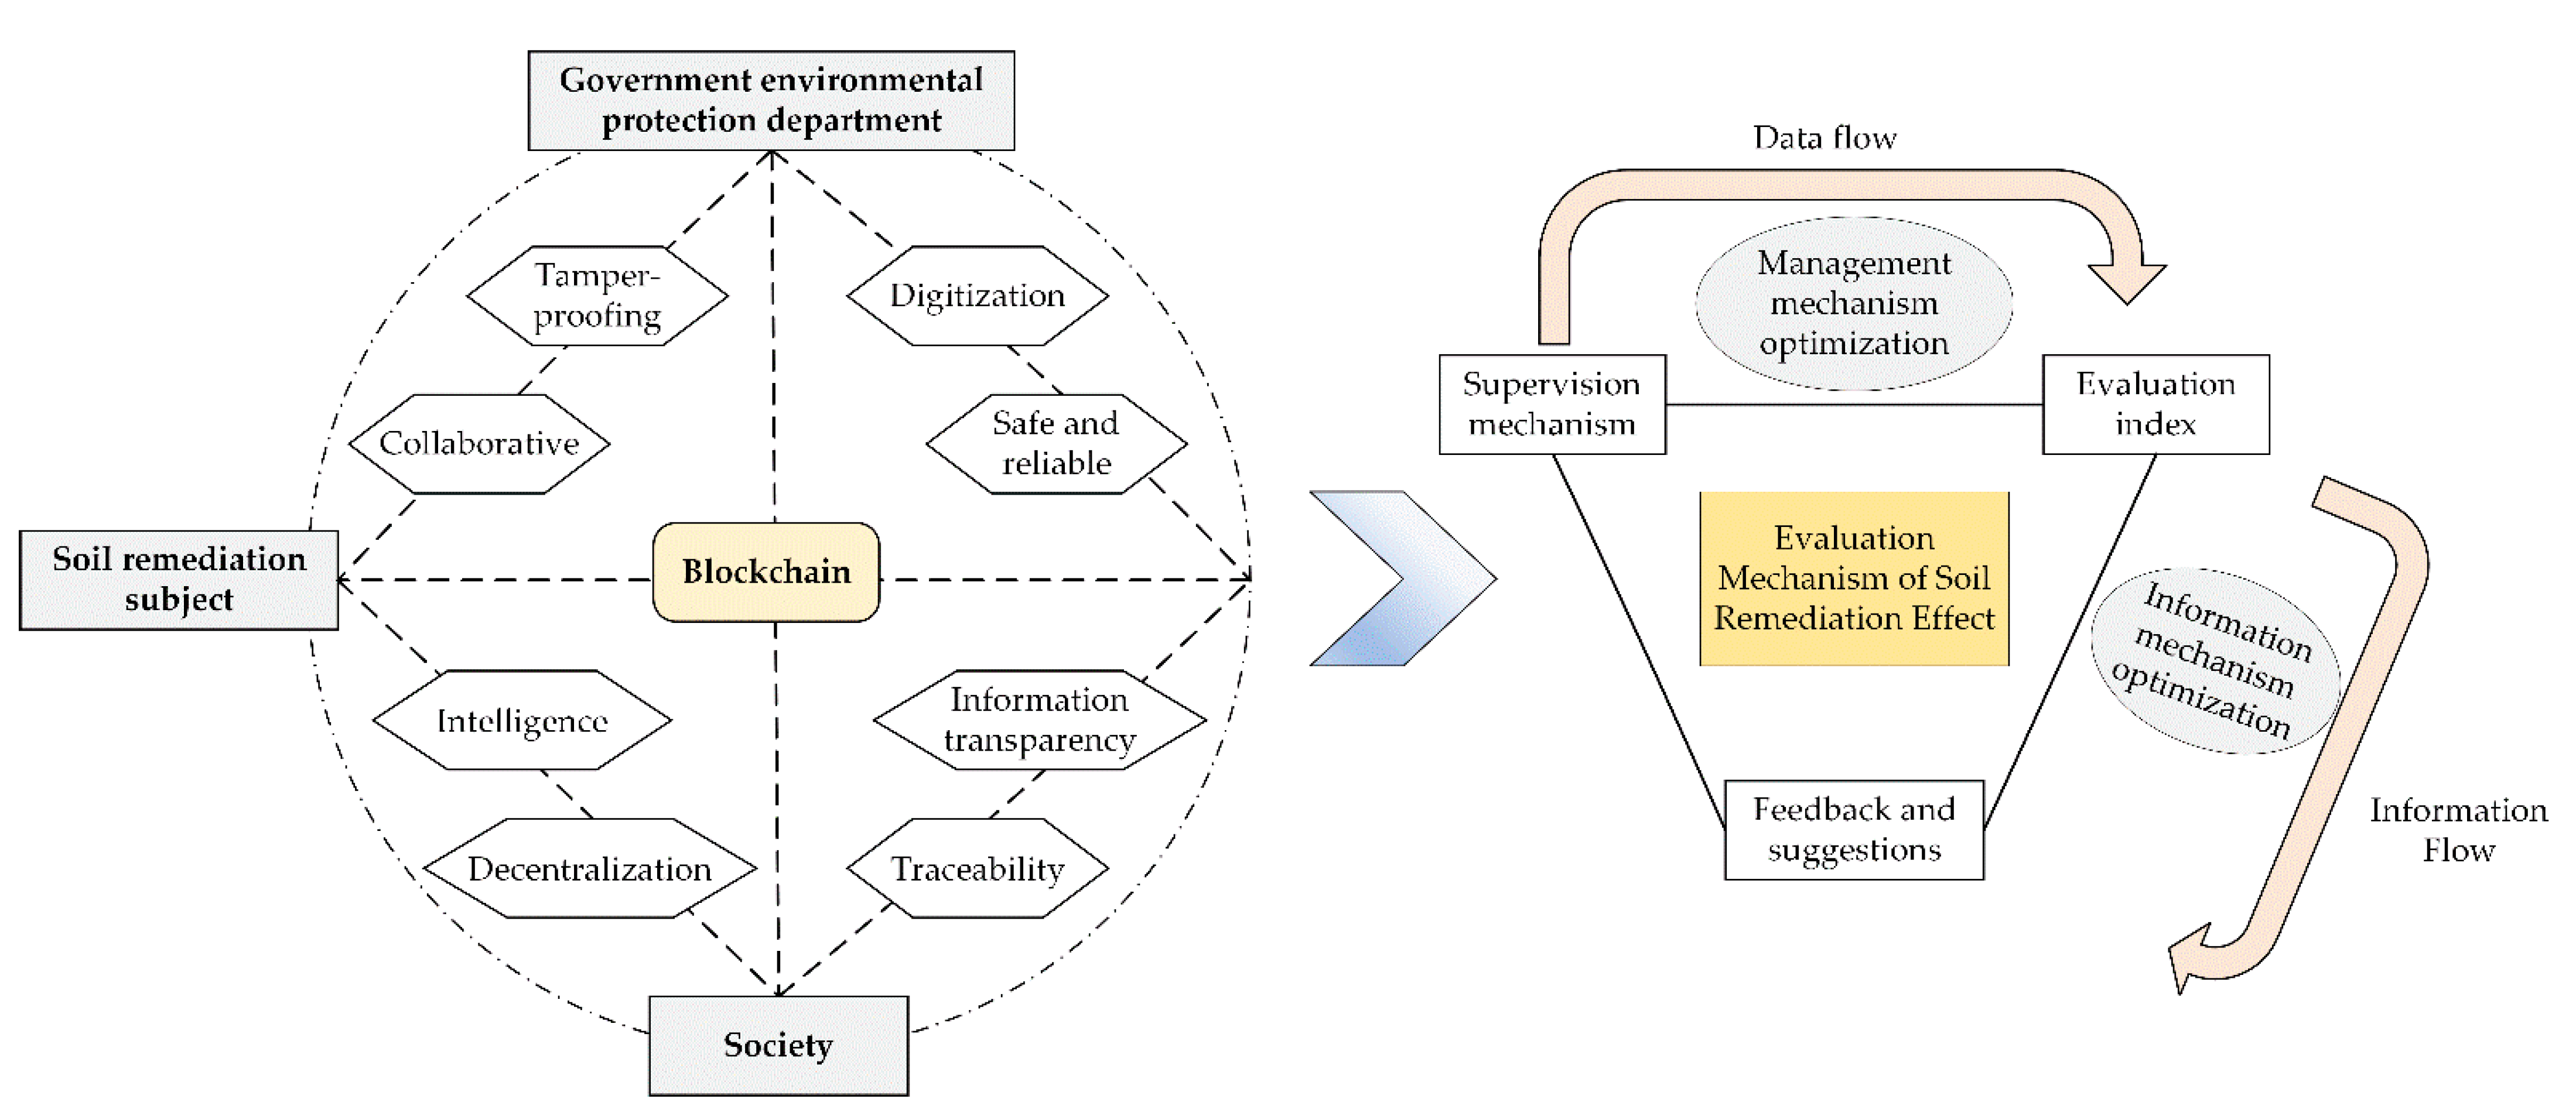
As shown in Figure 5, the data problems in the soil remediation effect evaluation index system mainly stem from loopholes in the supervision process. It can be optimized and solved through the collaborative, digitization, intelligence, decentralization, information transparency, anti-tampering, traceability and other functions of the blockchain network. At the level of management mechanisms involving supervision and accountability, traditional problems such as data that are difficult to trace and the subject of the problem are difficult to trace, and identity authentication and digital signatures in the core technology of the blockchain will provide a traceable evidence chain [35]. At the same time, the unique chain storage structure and consensus mechanism greatly increase the difficulty of illegally tampering and repairing data. Through identity authorization and access authentication, the data on the blockchain have the transparency characteristics of the entire network and all nodes [36]. Both the pollution data and the repair data need to be approved by the consensus node and then uploaded to the chain. Then, the data on the chain can be quickly queried to the block height through the Merkel tree. Asymmetric encryption technology provides completeness and security guarantees for data sharing [37] to realize reliable information transmission and sharing among multiple subjects.
3.2.2. Soil Remediation Effect Evaluation Supervision Alliance Chain
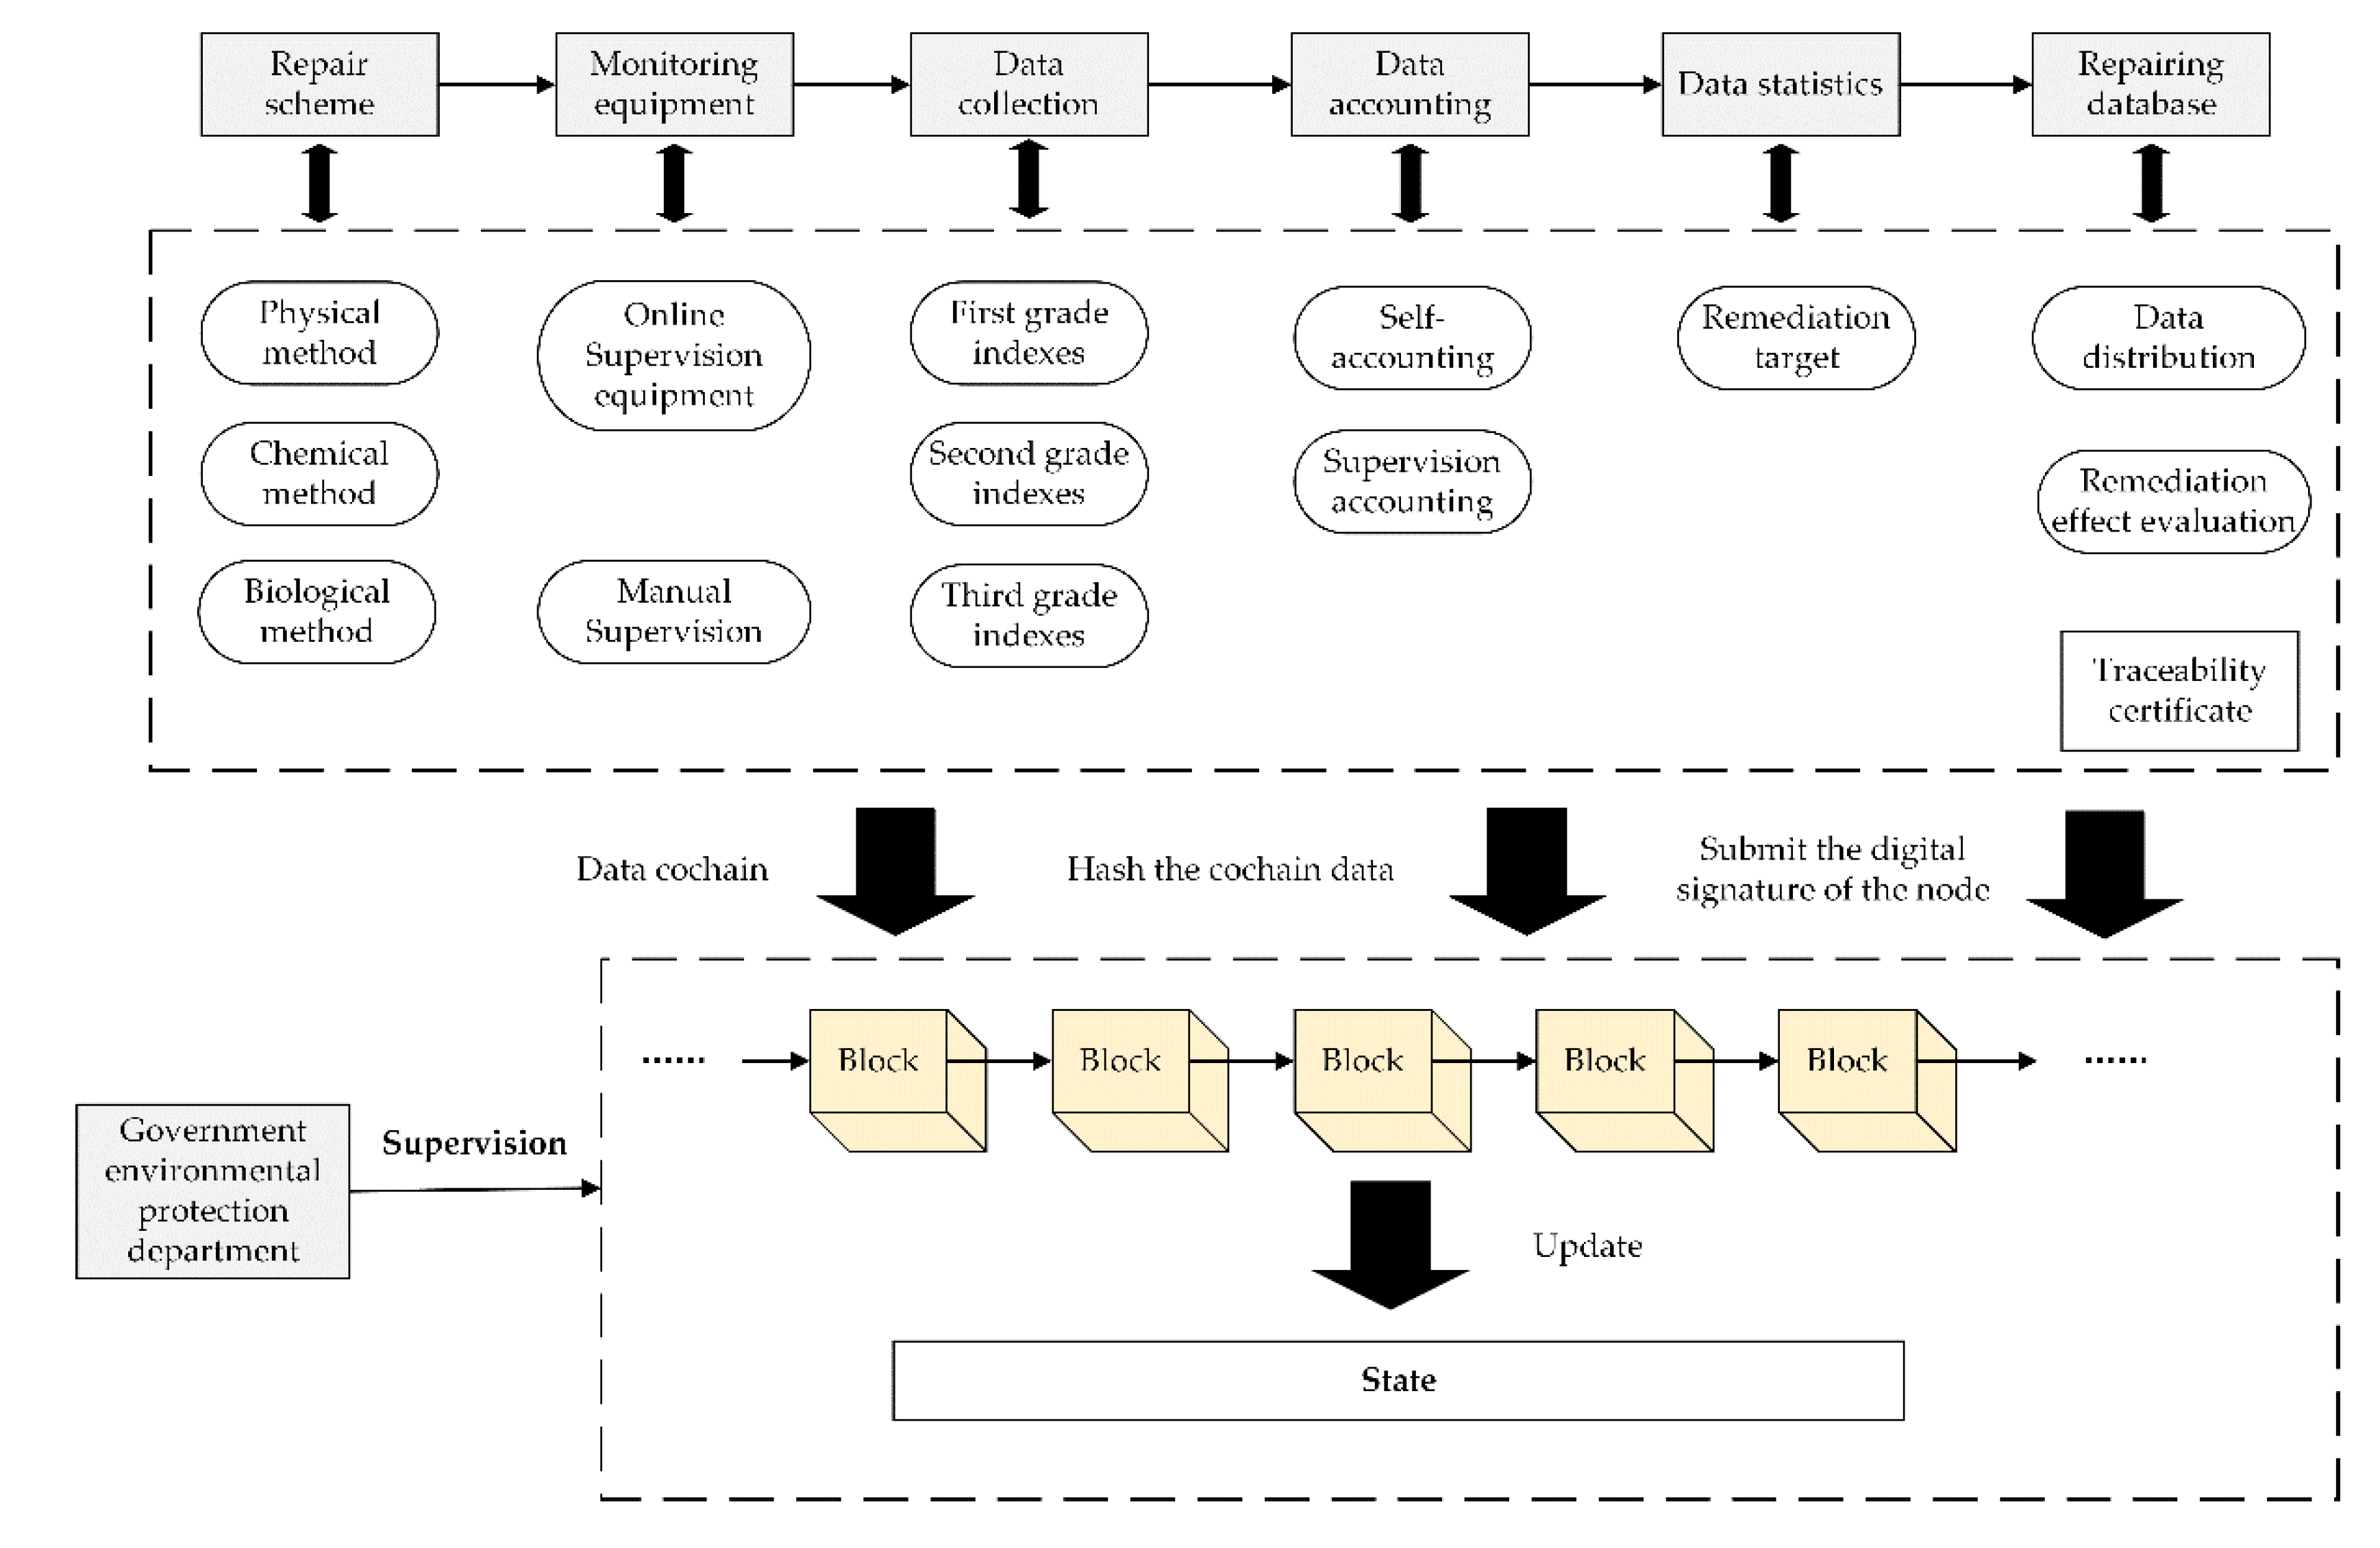
Currently, there is a widespread problem of “information loss” in data supervision. There is “information loss” in the process of reporting detection data level by level through the existing system. Remediation companies and governments and other subjects may make false reports to reduce the pressure of soil remediation. It invalidates the supervision of the entire process. However, it is difficult to determine the responsible subject through the existing supervision mechanism when it is found that there is a problem with the repaired data. The characteristics of anti-tampering, traceability, and transparency in blockchain technology provide new solutions to this problem. The supervision system based on the alliance chain can maintain the authenticity of data in an all-round way through source supervision, process supervision and end supervision and clarify the responsible party through data traceability. The workflow of the supervision alliance chain is shown in Figure 6.
Soil remediation effect evaluation includes two parts: remediation data supervision and data accounting. Online supervision equipment is installed in each link of soil remediation, or manual supervision is adopted to obtain real-time remediation data, including basic information of the remediation enterprise, remediation progress, and remediation effects. Based on the above data, the remediation company conducts data accounting. Through the statistics of remediation data, the completion degree of each remediation unit and the indices of remediation effect were calculated. Finally, the data will be entered into the soil remediation information database, and the relevant data will be disclosed to the public. During the whole process, the core data of all links are automatically uploaded to the alliance chain system and hashed. Additionally, the upload node attaches a digital signature to it, and the environmental protection department verifies the proposal by endorsement. The data information of all links and the behaviour information of participants are stored in the blockchain. The latest value of all data will be saved in the world state for quick query. The whole process of the operation of the alliance chain is supervised by the environmental protection department.
Incorporating blockchain technology into the bottom layer of the existing soil remediation effect evaluation and supervision model has the following effects. All the link cochain data cannot be tampered with once they are stored in the block. Therefore, when the source data are accurate, it is difficult for remediation units and government departments to tamper with the soil remediation data privately. Additionally, all the key uploaded data will become traceability certificates. In the later stage, once it is found that there is an abnormality in the different statistical routes of the repair data, the Merkle tree in the blockchain block can be used to compare the hash calculation to quickly query the problematic data source. At the same time, the source of the data can be traced to the responsible party through the digital signature. It provides a factual basis for clear and effective accountability.
3.3. Determination of Index Weight
In related research, commonly used subjective weighting methods include the AHP, expert survey method, binomial coefficient method, and so forth. The objective weighting method mainly includes the entropy method, standard deviation method, critic method and so on. The subjective weighting method has a greater advantage than the objective weighting method in determining the weight according to the decision-maker’s intention. However, its objectivity is relatively poor, and its subjectivity is relatively strong. The objective empowerment method has objective advantages, but it cannot reflect the importance of different indices by the participating decision-makers. The soil remediation evaluation effect is to select the index of large changes in soil quality before and after remediation. By referring to certain standard values or reference values, qualitatively or quantitatively, the improvement degree of soil quality after restoration is evaluated. Therefore, the entropy weight method is first used to calculate the weight of each index, and then the weight obtained by the analytic hierarchy process is used to modify the entropy weight in this paper. In this way, the problem that each index can only reflect the relative intensity of competition and cannot reflect the defects of the important coefficients of the indices can be resolved. The weight value can be made to closer resemble the actual situation.
a. Calculation of objective weights. The first step is to standardize the indices through the extremum method to make the data value of each index between 0 and 1 (taking soil remediation data in Zigong City, Sichuan Province as an example) [38].
In the formula, represents the j-th index at criterion level i, , and represent the minimum and maximum values at the j-th index at criterion level i. Equation (1) is used to process the positive indices, and Equation (2) is used to process the negative indices.
The second step is to calculate the information entropy.
In the formula, is the entropy value corresponding to the j-th index, . represents the total number of evaluation indices. To avoid meaninglessness of ,.
The third step is to calculate the index weight .
b. Calculation of subjective weight. Through a literature search and field research, a questionnaire was generated. Then, the questionnaire was completed on the basis of making full use of the profound professional knowledge and rich practical experience of 12 experts in ecology and soil chemistry. Based on the questionnaire information completed by the experts, the weight of each evaluation index was calculated. The final consistency check value , which means that the weight obtained was more reasonable [39].
c. Calculation of the combination weight. The index weight is optimized by the Lagrangian formula, and the combination weight value was obtained [39]. The result is shown in Table 1.
d. Calculation of comprehensive evaluation [40].
In the formula, represents the comprehensive evaluation value of the evaluation object. n is the number of evaluation factors. the weight value of the evaluation factor represents the score value of the -th evaluation factor.
4. Construction of the Evaluation Index System of the Soil Remediation Effect
4.1. Soil Remediation Effect Evaluation Index
Zigong City has a longitude of 104.78° and a latitude of 9.35°. It is located in the southern part of the Sichuan Basin and belongs to a subtropical temperate monsoon climate zone. The sunshine time is short, and cloudy weather is more common. The climate is warm, the annual average temperature is 17.0–18.0 degrees, and the annual sunshine is 1150–1200 h. The annual average temperature of Zigong City is 18.8 °C, and the average total precipitation is 780.7 mm. Temperatures are abnormally high in winter and summer, and slightly higher in spring and autumn. There is less precipitation in winter and spring, and slightly less precipitation in summer and autumn. The city’s annual average precipitation is 780.7 mm.
The city’s soil formed 5 soil types, 9 subtypes, 25 soil genera, and 70 soil species under the combined effects of specific climate, topography, parent material, biology and man-made. The city’s slope farmland accounts for 84.56% of the cultivated land area. Among them, there are 270,000 mu (mu, Chinese unit of land measurement that is commonly 666.7 square meters) of slope farmland of 15–25 degrees. Based on the data provided by the Ministry of Natural Resources, the Geological Survey Bureau, and the Meteorological Bureau of Zigong City, the following research was carried out.
According to Section 3 and a large number of database documents, the following recommended index system was summarized. This index system closely revolved around the ecological function of the soil. It was proposed from three aspects: soil fertility, soil environment and regional policy, as shown in Table 4.
Soil fertility indices include the soil chemical index, soil physical properties index, and soil biological index.
Soil chemical indices include the existence and concentration of various nutrients in the soil, including soil total nitrogen content, soil total phosphorus content, soil total potassium content, soil basic nitrogen, C/N ratio, and so on. The C/N ratio refers to the ratio of the total carbon content to the total nitrogen content in the organic matter. The size of the C/N ratio affects the conversion rate of humus in organic matter and the speed of the mineralization process in the soil. It is generally considered that the most favourable C/N ratio is 25:1. If the C/N ratio is too large, microbial decomposition and mineralization will be slow, and the available nitrogen in the soil will be consumed. Therefore, it is necessary to increase the soil organic matter as much as possible to promote the growth of soil microorganisms. It can decompose the nitrogen and phosphorus elements adsorbed in the soil during the process of soil mineralization and be absorbed by crop roots. The soil physical properties index has direct or indirect effects on plant growth and environmental quality.
The soil physical properties index includes soil texture, environmental capacity, water stable aggregates, and additional parameters. The combination of the percentage of each grain size grade in the soil to the weight of the soil is called soil texture. Soil texture is closely related to plant growth and water movement and is an important physical index. Porosity is the percentage of soil pore volume to soil volume. The coarse and fine soil particles of various shapes in the soil are assembled and arranged into a solid phase framework. Inside the framework, there are pores of different widths and shapes, forming a complex pore system. The percentage of total pore volume to soil volume is called soil porosity. Porosity that is too large or small will affect water retention and aeration performance and cause retarded root growth.
Soil organisms are the main part of soil with vitality and are the general term for various organisms, including soil microorganisms, soil animals and plants. It is one of the important indices for evaluating soil quality and health. The most commonly used index is the soil microbial index. Among them, humic acid includes fulvic acid and humic acid, and soil enzymes include urease, protease, catalase, invertase, phosphatase, and so forth.
Soil environmental indices include the soil pollutant index, water resource index, biological index and other indices.
The mineralization degree of groundwater refers to the quality of soluble salts per unit volume of groundwater and is an important index commonly used in water quality evaluation. The high degree of groundwater mineralization will cause the growth of salinization in the soil, weaken the planting vigour of the trees intolerant to saline and alkali, and reduce the production of crops.
Biological indices include population richness, diversity index, advantage index, and uniform index. Species and gene conservation is one of the important functions of soil in the Earth’s surface ecosystem. A healthy soil can nourish and maintain a considerable number of biological populations and individuals. Species diversity should be directly related to the effect of soil remediation. Population richness includes population number, individual density, large animals, arthropods, bacteria, actinomycetes, fungi, and so forth.
The diversity index refers to the abundance and mutual differences in the types, structures and functions of biological or ecological complexes; the diversity index refers to the abundance and mutual differences in the types, structures and functions of biological or ecological complexes; the advantage index refers to the existence and characteristics of dominant populations; and the uniform index refers to the spatial characteristics of the distribution of individual organisms or groups in the soil.
Other indices include soil pH, slope and level of networking forest. Soil pH is the general term for soil acidity and alkalinity and is usually used to measure the strength of the soil acid-base reaction. Under slightly acidic conditions of pH 6~7, the availability of soil nutrients is the best, which is most conducive to the growth of plants; if the slope is great, the moisture, soluble salt and soil particles on the slope will easily move down the slope. It will inevitably affect the biological and chemical processes of the soil, leading to changes in the corresponding soil properties.
Generally, low moisture content on the slope will lead to rapid mineralization of organic matter. This causes the soil texture on the slope to be lighter than that on the bottom. Therefore, the greater the slope, the more serious the soil erosion. The slope is best controlled below 15 degrees.
Regional policy indices include regional emergency capabilities, equipment quality and management systems, which are scored by experts after field investigations. Regional emergency capability refers to the ability to respond to emergencies encountered in the process of soil environmental monitoring or restoration, including the modification of remediation targets and remediation schemes. Equipment characteristics refer to whether the hardware conditions involved in the remediation process meet the requirements of the remediation schemes. The management system refers to the rationality of the remediation schemes established by the government and the openness and transparency of the remediation data. The soil remediation effect not only refers to the changes in various indices of the soil but also includes the guaranteed work done by other subjects for the soil remediation project.
The importance of blockchain technology in the process of obtaining the index data and guaranteeing the authenticity of the data is called relevance to blockchain.
4.2. Sensitivity Analysis
In this study, the one-at-a-time (OAT) method was selected to reflect the degree of influence and regularity of the single-factor weight change on the result change. The specific steps for OAT operation are [67]:
- (1)
- Define RPC (range of percent change). RPC is a finite set of discrete percentage changes with original basic data.
- (2)
- Define IPC (increment of percent change). IPC represents the percentage change of the factor weight each time within the RPC range.
- (3)
- Calculate the weight value. The sum of all factor weights W is 1:
When changing the weight of a main change factor , its weight value can be expressed by the following formula under a certain value of :
In the formula, is the weight of the index when the weight of the main change factor is changed; is the initial weight value of the main change factor . To ensure that the sum of all factor weights is 1, other factors need to be proportionally adjusted according to generated in Equation (8), which is calculated as follows:
where is the initial weight value of the i-th factor . When the weight of the main change factor changes within the RPC range through IPC, a series of evaluation results will be produced.
- (4)
- Calculate the comprehensive evaluation result of each weight change.
In Equation (10), is the evaluation result of the soil remediation effect obtained with the change in weight. is the standard grading score value corresponding to the index whose weight is changed, is the weight of other indices, and is the grading score value of other indices. The uncertainty of the calculation result can be expressed by the rate of change. As the weight changes, the uncertainty of the pixel can also be expressed visually. The formula for calculating the rate of change is:
In Equation (11), is the rate of change of the evaluation result when the weight changes; is the initial evaluation result of the soil remediation effect.
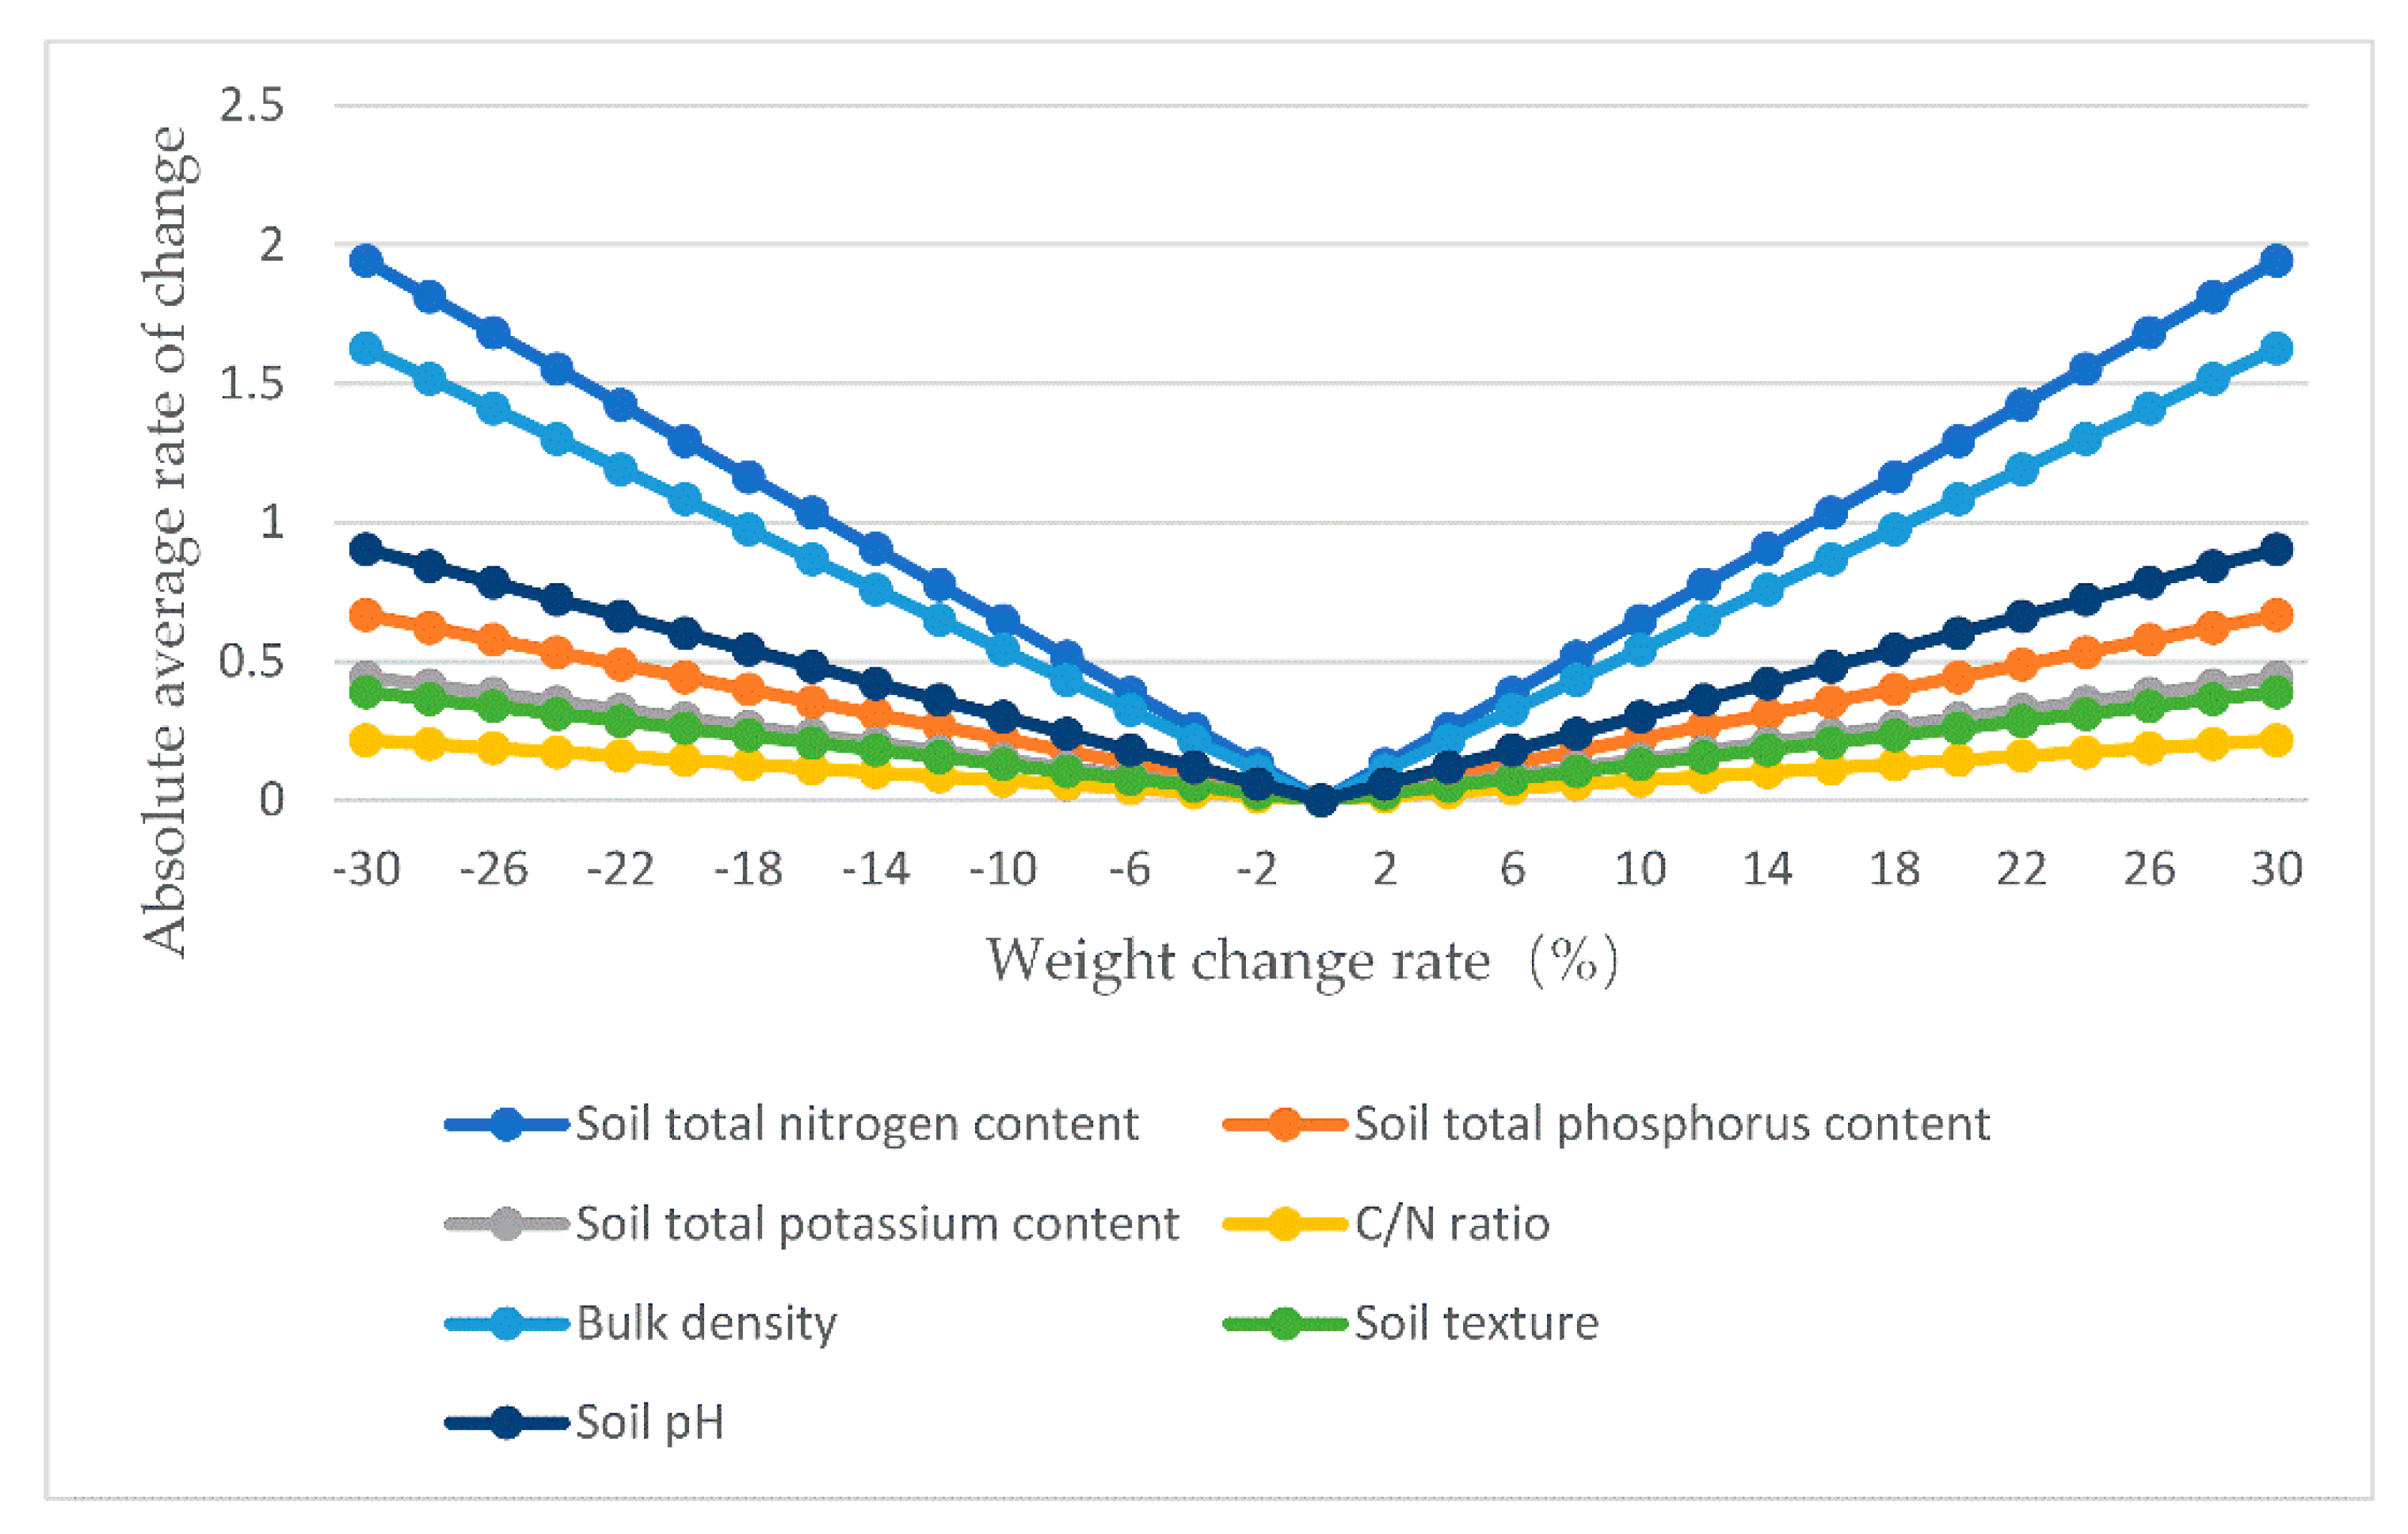
Through the comprehensive sensitivity formula, the values of RPC and IPC are ±30% and ±2%, respectively, which change from 30% of the initial weight to +30%. Each factor was selected in turn as the main change factor and applied to all evaluation indices. The 47 indices produce a total of 1410 sets of weight values. Each group of weights was calculated once, and a new evaluation result of the soil remediation effect is generated at the same time. Due to space limitations, representative indices such as soil total nitrogen content, soil total phosphorus content, soil total potassium content, C/N ratio, bulk density, soil pH, and regional emergency capability were selected as the main change factors for different weight change analyses in this study. The absolute average rate of change of the evaluation results of the soil remediation effect is shown in Figure 7.
As shown in Figure 7, the absolute average rate of change value of each index was basically symmetrically distributed with 0 as the centre and shows an approximately linear growth with the increase of the absolute value of the weight change rate, and each index has a different rate of change value. When the absolute value of the change rate of the same index weight was the same, its sensitivity to the evaluation result is the same; that is, the change rate value is positive and negative but had similar sensitivity.
An index with a larger slope is more sensitive to the evaluation of the soil remediation effect. Figure 7 shows that the absolute average change rate has a certain linear relationship with the index weight. The weight of the soil fertility level was the largest, and its sensitivity was also the largest. Soil total nitrogen content has the highest sensitivity to weight changes, and the sensitivity of other indicators to weight changes basically corresponds to their own weights. For example, when the weight change rate was 30%, the absolute average change rate of the soil total nitrogen content was 1.941%, while the absolute average change rate of the C/N ratio was only 0.2181%. The maximum absolute average change rate value is much lower than the weight change rate, indicating that the soil remediation effect evaluation result was relatively stable.
On the whole, the weights initially determined in this study were reasonable and effective and can objectively reflect the effect of soil restoration in this area. Through the sensitivity analysis of the initial weights, it is possible to verify the reasonable reliability of the weights determined in this study in the evaluation of soil remediation and reduce the influence of uncertainty in decision-making.
4.3. Suggestions on the Application of Index System
The evaluation of the soil remediation effect is a very complicated task, and the evaluation index system cannot be generalized. Table 4 is a recommended indices system. When evaluating the remediation effect of a specific engineering project, specific analysis should be combined with the expected targets, project characteristics, and stakeholder requirements. Then, an index system suitable for the project was determined through appropriate additions and reductions. The following points should be noted.
a. The selection of evaluation indices should be combined with specific remediation projects. It is necessary to reflect the use function of the soil after remediation to the greatest extent and to effectively prevent the influence of secondary pollution during the remediation process. If an index is not required in a specific remediation project target, the index can be scored 0.
b. The recommended index system proposed above was divided into positive indices, negative indices and indices with reference range values. A positive index means that the larger the detection value is, the better the remediation effect; a negative index means that the smaller the detection value is, the better the remediation effect. An index with a reference range value means that the test value can only achieve the expected target within a certain specific range. Part of the range value is based on the unified standard, and the other part is based on the remediation target. In actual applications, the evaluation index can be determined according to the specific engineering project, and then the index attribute can be determined.
c. When the soil remediation effect evaluation system of this study was applied in practice, the weight of each index can be adjusted by the weight determination method in this paper and the accurate soil remediation data of the application region.
d. The analysis method of each index should be the national or industry standard method. When no standard method is available, the recommended method of ISO or EPA can be considered. If there is still no method, the method recognized by the academic world can be used for analysis, but the applicability of the method should be analysed and explained.
e. Measures for long-term follow-up monitoring and remediation effect evaluation should be analysed based on the characteristics of the remediation project. Then, a specific long-term follow-up monitoring and evaluation scheme is proposed.
5. Feedback and Suggestions
After obtaining the test data according to the soil remediation effect evaluation index recommended in this study, they were compared with the expected target value of the soil remediation project.
a. If all the indices meet the expected targets, the soil remediation project has been successfully completed, and subsequent soil quality maintenance work will be conducted.
b. On the basis of Suggestion A., the effect of the remediation project is graded through the comprehensive scores of various indices. Relevant incentive measures can be implemented according to the level, and the specific measures are formulated according to the local government policy.
c. If some indices do not meet the expected targets, the focus and targets of the subsequent soil remediation work can be adjusted through the gap with the expected target value. Then, the soil remediation scheme and technology are adjusted.
d. If the comprehensive score of each index was lower than the minimum acceptable level, relevant punishment measures will be implemented based on the level of the remediation project result.
6. Conclusions
6.1. Conclusions
The construction of a soil remediation effect evaluation index system is a complex and systematic project. In addition to considering factors such as the composition of the soil itself, different external conditions and compound pollution, various factors, such as the development level of soil remediation technology, the level of instrument detection, and the background content level of the local soil must also be comprehensively considered. Additionally, it is necessary to combine the existing levels of various environmental protection laws and regulations and refer to the mature soil remediation legal system at home and abroad.
In this study, a large number of studies were counted, analysed, and classified. The indices were sorted, selected, and classified according to the results of expert consultation. Blockchain technology was used to construct a supervision alliance chain for evaluating data sources of soil remediation effects to ensure the authenticity of the data, clarify the responsible party, and avoid the failure of the supervisory process. Finally, a recommended index system for soil remediation effect evaluation was constructed, including 3 first-level indices, 10 s-level indices, and 47 third-level indices.
Weight sensitivity analysis was introduced to evaluate the soil remediation effect. The analysis of different weight changes was carried out by selecting different indicators as the main change factors. The results showed that the overall evaluation results were relatively stable, and the weights initially determined in this study were also reasonable, which can objectively reflect the true effects of soil remediation in this area. This research can provide a reference methodology for the evaluation of soil remediation effects. Based on the evaluation results, feedback and suggestions were provided to guide the progress of subsequent remediation projects.
6.2. Futures
In this study, the evaluation index of the soil remediation effect was constructed from physical, chemical, biological, and other aspects, but the role of humans in the food chain was ignored. Heavy metals in the soil are transferred to the human body through the food chain, but there are very few studies on the migration and transformation of heavy metals in the plant–human system. Therefore, it is not yet possible to scientifically determine the degree of human health risks caused by heavy-metal-contaminated soils. A further direction of this research is to strengthen the research on the migration and transformation of heavy metals in the soil–crop–human system, especially the migration and transformation of heavy metals in plant foods into the human system. The human health evaluation system should be formulated scientifically to provide a scientific basis for formulating soil remediation standards and soil environmental management systems based on human health.
Author Contributions
Conceptualization: X.L.; software, investigation, writing—review and editing, formal analysis, data curation: M.W.; validation, investigation, supervision: Z.L. All authors have read and agreed to the published version of the manuscript.
Funding
This work was supported by the Sichuan Provincial Science and Technology Department Program (Grant number. 2021JDRC0002) and the Fundamental Research Funds for the Central Universities (Grant number 20827041E4062).
Institutional Review Board Statement
Not applicable.
Informed Consent Statement
Not applicable.
Data Availability Statement
Not applicable.
Acknowledgments
The authors wish to acknowledge the support of the Western Research Institute of Blockchain (Chongqing) and Zigong City, Sichuan Province for providing soil remediation data.
Conflicts of Interest
The authors declare no conflict of interest.
References
- Maurya, S.; Abraham, J.S.; Somasundaram, S.; Toteja, R.; Gupta, R.; Makhija, S. Indicators for assessment of soil quality: A mini-review. Environ. Monit. Assess. 2020, 192, 1–22. [Google Scholar] [CrossRef]
- Bone, J.; Barraclough, D.; Eggleton, P.; Head, M.; Jones, D.T.; Voulvoulis, N. Prioritising Soil Quality Assessment Through the Screening of Sites: The Use of Publicly Collected Data. Land Degrad. Dev. 2014, 25, 251–266. [Google Scholar] [CrossRef]
- Spyros, V.; Nikos, F.; Siris, V.A.; Yannis, O. Blockchain Technology for Intelligent Environments. Future Internet 2019, 11, 213. [Google Scholar] [CrossRef] [Green Version]
- Zeadally, S.; Bou Abdo, J. Blockchain: Trends and future opportunities. Internet Technol. Lett. 2019, 2, e130. [Google Scholar] [CrossRef] [Green Version]
- Vladimirova, A.V. Blockchain Revolution in Global Environmental Governance: Too Good to Be True? In International Conference on Internet Science; Springer: Berlin/Heidelberg, Germany, 2019; Volume 11551, pp. 212–223. [Google Scholar]
- Yang, Q.j.; Wu, K.N.; Feng, Z.; Zhao, R.; Zhang, X.D.; Li, X.L. Soil Quality Assessment on Large Spatial Scales: Advancement and Revelation. Acta Pedol. Sin. 2020, 57, 565–578. [Google Scholar] [CrossRef]
- Larson, W.E.; Pierce, F.J. The dynamics of soil quality as a measure of sustainable management. Soil Sci. 1994, 551, 37–51. [Google Scholar]
- Conte, P.; Agretto, A.; Spaccini, R.; Piccolo, A. Soil Remediation: Humic Acids as Natural Surfactants in the Washings of Highly Contaminated Soils. Environ. Pollut. 2005, 135, 515–522. [Google Scholar] [CrossRef]
- Xu, L.; Zhou, J.; Cui, H.B.; Tao, M.J.; Liang, J.N. Research Progress in Remediation and Its Effect Evaluation of Heavy Metal Contaminated Soil. Chin. Agric. Sci. Bull. 2014, 20, 161–167. [Google Scholar]
- Fang, C.; Bo, Y. The Remediation Standards and Evaluation Methods for Remediation Effectiveness of Contaminated Soil. Adv. Mater. Res. 2012, 1570, 68–75. [Google Scholar] [CrossRef]
- Li, Y.M.; Lei, M.; Chen, T.B. Remediating lead, zinc, cadmium and arsenic contaminated steel smelting site with hydrochloric acid and sodium hydroxide. Appl. Mech. Mater. 2012, 137, 322–327. [Google Scholar] [CrossRef]
- Bünemann, E.K.; Bongiorno, G.; Bai, Z. Soil Quality—a Critical Review. Soil Biol. Biochem. 2018, 120, 105–125. [Google Scholar] [CrossRef]
- Lin, K.; Li, D.C.; Zhang, G.L. Literature analysis on soil quality assessment in China based on CNKI database. Chin. J. Soil Sci. 2017, 48, 736–744. [Google Scholar] [CrossRef]
- Zhou, L.J.; Wu, L.; Lin, X.B.; Wang, H.M.; Liu, H.; Zhang, H.Y.; Hu, M.; Shi, L.P.; Zhang, Y.; Huang, Q.R. Remediation of Cadmium Contaminated Paddy Fields Using Soil Conditioners. Environ. Sci. 2019, 40, 5098–5106. [Google Scholar] [CrossRef]
- Wang, Y.; Luo, Y.; Zeng, G.Q.; Wu, X.D.; Wu, B.; Li, X.; Xu, H. Characteristics and in situ remediation effects of heavy metal immobilizing bacteria on cadmium and nickel co-contaminated soil. Ecotoxicol. Environ. Saf. 2020, 192, 110294. [Google Scholar] [CrossRef]
- Lehmann, J.; Bossio, D.A.; Kögel-Knabner, I.; Rillig, M.C. The concept and future prospects of soil health. Nat. Rev. Earth Environ. 2020, 1, 544–553. [Google Scholar] [CrossRef] [PubMed]
- An, F.J.; Su, Y.Z.; Niu, Z.R.; Liu, T.N.; Wang, X.F. Soil nematode community composition, diversity, and soil properties in an age sequence of Haloxylon ammodendron plantations in an oasis-desert ecotone of northwestern China. Arid Land Res. Manag. 2021, 35, 463–482. [Google Scholar] [CrossRef]
- Li, Y.P.; Qiao, Q.; Chai, F.H.; Yao, Y.; Bai, L.; Hu, X.W. Study on Environmental Risk Assessment Index Weight of Industrial Park Based on the Analytic Hierarchy Process. Res. Environ. Sci. 2014, 27, 334–340. [Google Scholar] [CrossRef]
- Li, Y.L.; Zhu, C.X.; Li, H.N.; Geng, B. Evaluation of Agricultural Non-point Source Pollution Control Technologies Based on Analytic Hierarchy Process. J. Environ. Eng. Technol. 2019, 9, 355–361. [Google Scholar] [CrossRef]
- Xing, C.C.; Zhao, B.; Liu, N.N.; Liu, X.Q.; Sun, L.L.; Yang, K. The Evaluation Index System and Evaluation Method of Marine Resource Environmental Carrying Capacity in China. Ocean Dev. Manag. 2019, 36, 33–35. [Google Scholar]
- Ma, G.C. Analysis of Economic Transformation Capacity and Convergence of Resource-Regenerative Cities—Based on Entropy Weight TOPSIS Method. Am. J. Ind. Bus. Manag. 2019, 9, 1682–1698. [Google Scholar] [CrossRef] [Green Version]
- Wang, W.; Wang, W.X.; Lin, Z.; Cheng, R.; Meng, L.S.; Chen, S.M.; Liu, F.T. Application of DRASTIC Entropy Weight Model Method in Groundwater Vulnerability Evaluation in Ordos Area. IOP Conf. Ser. Earth Environ. Sci. 2021, 702, 012058. [Google Scholar] [CrossRef]
- Zhao, M.; Xiao, J.H. Evaluation of green development level of Marine economy in Guangdong province based on entropy method. JPCS 2021, 1774, 012012. [Google Scholar] [CrossRef]
- Zou, Q.L.; Zhang, T.C.; Liu, W. A fire risk assessment method based on the combination of quantified safety checklist and structure entropy weight for shopping malls. Proc. Inst. Mech. Eng. Part O J. Risk Reliab. 2021, 235, 610–626. [Google Scholar] [CrossRef]
- Ao, Y.; Jiang, L.F.; Bai, Z.D.; Yang, X.; Zhang, L.Y. Comprehensive Evaluation of Land Ecological Quality in the Yellow River Basin Based on Grid-GIS. Arid. Land Geogr. 2021, p. 16. Available online: http://kns.cnki.net/kcms/detail/65.1103.X.20210812.1543.006.html (accessed on 12 October 2021).
- Wang, T.; Li, H.M.; Shi, X.Y. Analysis on Evaluation Index System of Remediation Effectiveness in Farmland Contaminated by Heavy Metal. Chin. J. Soil Sci. 2016, 47, 725–729. [Google Scholar] [CrossRef]
- Ghaemi, M.; Astaraei, A.R.; Mahalati, M.N.; Emami, H.; Sanaeinejad, H.H. Spatio-temporal soil quality assessment under crop rotation irrigated with treated urban wastewater using fuzzy modelling. Int. Agrophys. 2014, 28, 291–302. [Google Scholar] [CrossRef] [Green Version]
- Valani, G.P.; Vezzani, F.M.; Cavalieri-Polizeli, K.M.V. Soil quality: Evaluation of on-farm assessments in relation to analytical index. Soil Till Res. 2020, 196, 104565. [Google Scholar] [CrossRef]
- Li, P.; Wu, T.; Jiang, G.; Pu, L.; Li, Y.; Zhang, J.; Xu, F.; Xie, X. An Integrated Approach for Source Apportionment and Health Risk Assessment of Heavy Metals in Subtropical Agricultural Soils, Eastern China. Land 2021, 10, 1016. [Google Scholar] [CrossRef]
- Tan, L.; Yang, B.; Xue, Z.; Wang, Z. Assessing Heavy Metal Contamination Risk in Soil and Water in the Core Water Source Area of the Middle Route of the South-to-North Water Diversion Project, China. Land 2021, 10, 934. [Google Scholar] [CrossRef]
- Paz-Ferreiro, J.; Fu, S.L. Biological Indices for Soil Quality Evaluation: Perspectives and Limitations. Land Degrad. Dev. 2016, 27, 14–25. [Google Scholar] [CrossRef]
- Adetunji, A.T.; Lewu, F.B.; Mulidzi, R.; Ncube, B. The biological activities of beta-glucosidase, phosphatase and urease as soil quality indicators: A review. J. Soil Sci. Plant. Nutr. 2017, 17, 794–807. [Google Scholar] [CrossRef] [Green Version]
- Nabiollahi, K.; Taghizadeh-Mehrjardi, R.; Kerry, R.; Moradian, S. Assessment of soil quality indices for salt-affected agricultural land in Kurdistan Province. Iran. Ecol. Indic. 2017, 83, 482–494. [Google Scholar] [CrossRef]
- Askari, M.S.; Holden, N.M. Quantitative soil quality indexing of temperate arable management systems. Soil Till Res. 2015, 150, 57–67. [Google Scholar] [CrossRef]
- Behnke, K.; Janssen, M. Boundary conditions for traceability in food supply chains using blockchain technology. Int. J. Inform. Manag. 2020, 52, 101969. [Google Scholar] [CrossRef]
- Venkatesh, V.G.; Kang, K.; Wang, B.; Zhong, R.Y.; Zhang, A. System architecture for blockchain based transparency of supply chain social sustainability. Robot. Comput.-Integr. Manuf. 2020, 63, 101896. [Google Scholar] [CrossRef]
- Shabani, M. Blockchain-based Platforms for Genomic Data Sharing: A De-centralized Approach in Response to the Governance Problems. J. Am. Med. Inform. Assoc. 2019, 26, 76–80. [Google Scholar] [CrossRef] [PubMed]
- Zhang, L.Y.; Xu, S.J. An Entropy Weight Approach on the Comprehensive Evaluation of the Pearl RiverDelta Nature Reserve. Acta Ecol. Sin. 2011, 18, 5341–5350. [Google Scholar]
- Yu, J.; Chen, Y.H.; Peng, J.; Li, L.Y.; Nie, Y. Comprehensive Evaluation on Land Ecological Quality Based on GIS and Fragstats: A Case Study in Xiantao City, Hubei Province. ACTA Ecol. Sin. 2020, 06, 2932–2943. [Google Scholar] [CrossRef]
- Sun, C.Z.; Yang, L.; Hu, D.L. Groundwater ecological sensitivity assessment in the lower Liaohe River Plain Based on GIS Technique. Acta Ecol. Sin. 2011, 24, 7428–7440. [Google Scholar]
- Wang, J.; Yi, W.; Zhao, X.L.; Yang, M.; Duan, C.; Zhu, T.; Shi, Z.H. The Potential Risk Evaluation of Farmland Soil New Submerged Area in Danjiangkou Reservoir. China Environ. Sci. 2015, 35, 157–164. [Google Scholar]
- Gao, H.; Huang, Y.M. Impacts of the Three-North shelter forest program on the main soil nutrients in Northern Shaanxi China: A meta-analysis. For. Ecol. Manag. 2020, 458, 117808. [Google Scholar] [CrossRef]
- Yang, S.; He, X.Y.; Su, Y.R.; Zhang, W.; Wang, K.L. Effects of parent rock and land use on soil fertility in karst region of Northwest Guangxi. Chin. J. Appl. Ecol. 2010, 06, 1596–1602. [Google Scholar] [CrossRef]
- Fulín, M.; Podrázsk, V.; Balá, M. Impact of grand fir on the conditions of forest soils: A case study. Rep. For. Res. 2018, 63, 129–135. [Google Scholar]
- Baran, S.; Wojcikowska-Kapusta, A.; Zukowska, G.; Bik-Malodzinska, M.; Wesolowska-Dobruk, S. Influence of Sludge-ash Composts on Some Properties of Reclaimed Land. Arch. Environ. Prot. 2015, 41, 82–88. [Google Scholar] [CrossRef] [Green Version]
- Ostrowska, A.; Porebska, G. Assessment of the C/N ratio as an indicator of the decomposability of organic matter in forest soils. Ecol. Indic. 2015, 49, 104–109. [Google Scholar] [CrossRef]
- Dong, Q.G.; Han, J.C.; Zhang, Y.; Li, N.; Lei, N.; Sun, Z.H.; Du, Y.C.; He, J. Water Infiltration of Covering Soils With Different Textures and Bulk Densities in Gravel Mulched Areas. Appl. Ecol. Environ. Res. 2019, 17, 14039–14052. [Google Scholar] [CrossRef]
- Zhang, Y.X.; Liu, Z.L.; Liu, W. Soil Environmental Capacity Calculation of Dinitrotoluene and Diaminotoluene. Chin. J. Soil Sci. 2013, 44, 980–986. [Google Scholar] [CrossRef]
- Ziegler, A.D.; Sutherland, R.A. Effect of an Anionic Soil Conditioner on Water Stable Aggregation of Three Hawaiian Soils. Commun. Soil Sci. Plan 1998, 29, 1253–1264. [Google Scholar] [CrossRef]
- Mccarthy, K.P.; Brown, K.W. Soil Gas-Permeabillty as Influenced by Soil Gas-filled Porosity. Soil Sci. Soc. Am. J. 1992, 56, 997–1003. [Google Scholar] [CrossRef]
- Zhou, L.Y. Effects of Straw Mulch on Soil Physical Conditions in Field. Res. Agric. Mod. 1997, 05, 311–313. [Google Scholar]
- Xu, Z.G.; Wu, Z.Y.; He, H.; Guo, X.; Zhang, Y.L. Comparison of soil moisture at different depths for drought monitoring based on improved soil moisture anomaly percentage index. Water Sci. Eng. 2021, 14, 171–183. [Google Scholar] [CrossRef]
- Pardo, J.; Mondaca, P.; Celis-Diez, J.L.; Ginocchio, R.; Navarro-Villarroel, C.; Neaman, A. Assessment of revegetation of an acidic metal(loid)-polluted soils six years after the incorporation of lime with and without compost. Geoderma 2018, 331, 81–86. [Google Scholar] [CrossRef]
- Falciglia, P.P.; Vagliasindi, F.G.A. Remediation of hydrocarbon-contaminated soils by ex situ microwave treatment: Technical, energy and economic considerations. Environ. Technol. 2014, 35, 2280–2288. [Google Scholar] [CrossRef]
- Liu, X.B.; Wu, L.; Wang, H.M.; Liu, H.; Huang, Q.R.; Zhou, L.J. Screening of Indicators in Brown Rice Cadmium after Remediation of Cadmium Pollution in Farmland Soil. Chin. J. Soil Sci. 2021, 52, 203–210. [Google Scholar] [CrossRef]
- Wang, W.Q.; Zhou, F.W.; Chang, Y.J.; Cui, J. Effects of Soil Amendments on Microbial Activities in a Typical Cd-Contaminated Purple Field Soil, Southwestern China. Bull. Environ. Contam. Toxicol. 2020, 104, 380–385. [Google Scholar] [CrossRef] [PubMed]
- Kaurin, A.; Cernilogar, Z.; Lestan, D. Revitalisation of Metal-contaminated, EDTA-washed Soil by Addition of Unpolluted Soil, Compost and Biochar: Effects on Soil Enzyme Activity, Microbial Community Composition and Abundance. Chemosphere 2018, 193, 726–736. [Google Scholar] [CrossRef]
- Nguyen, K.T.; Ahmed, M.B.; Mojiri, A.; Huang, Y.H.; Zhou, J.L.; Li, D.H. Advances in As contamination and adsorption in soil for effective management. J. Environ. Manag. 2021, 296, 113274. [Google Scholar] [CrossRef]
- Xu, Y.; Li, J.; Hua, D.; Guo, Z. Remediation effect of Biochar-plant on heavy metal contaminated soil in mining area. In IOP Conference Series: Earth and Environmental Science, Proceedings of the 3rd International Symposium on Resource Exploration and Environmental Science (REES 2019), Ordos, China, 27–28 April 2019; IOP Publishing: Bristol, UK, 2019; Volume 300, p. 052039. [Google Scholar] [CrossRef]
- Lee, S.J.; Ha, H.J.; Park, K.S.; Kang, G.Y. Briefing: A study on biological remediation and ecotoxicity evaluation of BaP-contaminated soil. J. Environ. Eng. Sci. 2017, 12, 51–55. [Google Scholar] [CrossRef]
- Liang, Y.; Cao, X.D.; Zhao, L.; Arellano, E. Biochar- and phosphate-induced immobilization of heavy metals in contaminated soil and water: Implication on simultaneous remediation of contaminated soil and groundwater. Environ. Sci. Pollut. Res. 2014, 21, 4665–4674. [Google Scholar] [CrossRef] [PubMed]
- Kim, D.; Song, W.; Lu, J.C. Interdisciplinary investigation of contaminants fate and transport at a former UST site (10-year case study). Environ. Earth Sci. 2011, 64, 277–291. [Google Scholar] [CrossRef]
- Li, Y.; Deng, M.J.; Wang, X.J.; Wang, Y.; Li, J.; Xia, S.Q.; Zhao, J.F. In-situ remediation of oxytetracycline and Cr(VI) co-contaminated soil and groundwater by using blast furnace slag-supported nanosized Fe-0/FeSx. Chem. Eng. J. 2021, 412, 128706. [Google Scholar] [CrossRef]
- Liu, Y.Y.; Zhang, R.B.; Sun, Z.; Shen, Q.; Li, Y.; Wang, Y.; Xia, S.Q.; Zhao, J.F.; Wang, X.J. Remediation of artificially contaminated soil and groundwater with copper using hydroxyapatite/calcium silicate hydrate recovered from phosphorus-rich wastewater. Environ. Pollut. 2021, 272, 115978. [Google Scholar] [CrossRef] [PubMed]
- Liu, M.L.; Li, X.R.; Zhu, R.Q.; Chen, N.; Ding, L.; Chen, C.Y. Vegetation richness, species identity and soil nutrients drive the shifts in soil bacterial communities during restoration process. Environ. Microbiol. Rep. 2020, 13, 411–424. [Google Scholar] [CrossRef]
- Li, Y.H.; Xu, Y.Q.; Guo, H.F. Research on Limiting Factors and Promotion Strategies of Agricultural Land Quality in Western Ecological Fragile Areas. Chin. J. Agric. Resour. Reg. Plan. 2014, 01, 69–76. [Google Scholar] [CrossRef]
- Chen, Y.; Yu, J.; Khan, S. Spatial sensitivity analysis of multi-criteria weights in GIS-based land suitability evaluation. Environ. Model. Softw. 2010, 25, 1582–1591. [Google Scholar] [CrossRef]
Figure 1.
Soil physical evaluation indices.

Figure 2.
Soil chemistry evaluation indices.

Figure 3.
Soil biological evaluation indices.

Figure 4.
Soil environment evaluation indices.

Figure 5.
Demand analysis of blockchain technology.

Figure 6.
Supervision alliance chain.

Figure 7.
Results of absolute average change rate of soil remediation effect evaluation.


Table 1.
Ranking of the importance of evaluation indices.
| Index | Mean | Variance | Screening Results |
|---|---|---|---|
| Soil total nitrogen content | 4.2 | 0.779 | 1 |
| Soil total phosphorus content | 4.1 | 0.81 | 1 |
| Soil total potassium content | 4.07 | 0.84 | 1 |
| …… | …… | …… | …… |
| DDT | 1.2 | 0.974 | 2 |
Table 2.
Total variance.
| Initial Eigenvalue | Rotation Sums of Squared Loadings | Rotate the Sum of Squares Loading | |||||||
|---|---|---|---|---|---|---|---|---|---|
| Total | Variance % | Accumulation % | Total | Variance % | Accumulation % | Total | Variance % | Accumulation % | |
| 1 | 7.153 | 23.115 | 23.105 | 7.153 | 23.105 | 23.105 | 3.343 | 11.816 | 11.816 |
| 2 | 2.741 | 8.865 | 31.980 | 2.741 | 8.865 | 31.980 | 2.811 | 9.068 | 19.885 |
| … | … | … | … | … | … | … | … | … | … |
| 8 | 1.116 | 3.653 | 78.060 | 1.136 | 3.664 | 78.060 | 1.747 | 5.635 | 78.060 |
| 9 | 0.963 | 3.107 | 81.167 | ||||||
| 10 | 0.868 | 2.703 | 83.871 | ||||||
| … | … | … | … | ||||||
| 47 | 0.006 | 0.016 | 100.00 | ||||||
Table 3.
Load matrix after rotation.
| Common Factor | α | Index | Factor Loading after Rotation | |||
|---|---|---|---|---|---|---|
| C5 | C6 | C7 | C8 | |||
| C8 | 0.704 | Regional emergency capability | 0.023 | 0.457 | 0.076 | 0.565 |
| Equipment characteristic | 0.316 | −0.523 | 0.091 | 0.693 | ||
| Management system | 0.157 | −0.028 | 0.036 | 0.849 | ||
Table 4.
Recommended index system for soil remediation effect evaluation.
| Total Target | First Level Index | Second Level Index | Third Level Index | Unit | Index Type | Relevance to Blockchain Technology | Reference |
|---|---|---|---|---|---|---|---|
| Soil remediation effect evaluation | Soil fertility (0.4) | Soil chemistry index (0.33) | Soil total nitrogen content (0.125) | % | Positive | + + | [41,42] |
| Soil total phosphorus content (0.125) | % | Positive | + + | [42,43] | |||
| Soil total potassium content (0.125) | % | Positive | + + | [42,43] | |||
| Soil basic nitrogen content (0.125) | mg/kg | Positive | + + | [44] | |||
| Soil available phosphorus content (0.125) | mg/kg | Positive | + + | [43] | |||
| Soil available potassium content (0.125) | mg/kg | Positive | + + | [42] | |||
| Cation exchange capacity (0.125) | cmol (+)/kg | Positive | + + | [43,45] | |||
| C/N ratio (0.125) | \ | Range value | + + | [46] | |||
| Soil physical properties index (0.33) | Bulk density (0.15) | kg/m3 | Negative | + − | [14,47] | ||
| Soil texture (0.1) | % | Positive | + − | [14] | |||
| Environmental capacity (0.1) | g/cm3 | Range value | + − | [48] | |||
| Water stable aggregates (0.09) | % | Range value | + − | [49] | |||
| Porosity (0.2) | % | Range value | + − | [50] | |||
| Temperature variation of topsoil (0.09) | °C | Range value | + − | [51] | |||
| Soil depth (0.09) | cm | Range value | + − | [52] | |||
| Soil moisture content (0.09) | % | Range value | + − | [53,54] | |||
| Clay content (0.09) | % | Positive | + − | [55] | |||
| Soil biology index (0.33) | Soil organic matter (0.25) | % | Positive | + + | [14] | ||
| Humic acid (0.15) | % | Range value | + + | [8] | |||
| Microbial biomass carbon (0.175) | mg/kg | Positive | + + | [56] | |||
| Microbial biomass nitrogen (0.175) | mg/kg | Positive | + + | [56] | |||
| Soil enzyme activity (0.25) | μmol/min | Positive | + + | [57] | |||
| Soil environment 0.4 | Soil pollutant index (0.4) | Soil Lead concentration (0.142) | mg/kg | Negative | + + | [11] | |
| Soil arsenic concentration (0.142) | mg/kg | Negative | + + | [58] | |||
| Soil cadmium concentration (0.142) | mg/kg | Negative | + + | [11] | |||
| Soil mercury concentration (0.142) | mg/kg | Negative | + + | [59] | |||
| Soil nickel concentration (0.142) | mg/kg | Negative | + + | [15] | |||
| Soil copper concentration (0.142) | mg/kg | Negative | + + | [59] | |||
| Soil benzo (a) pyrene concentration (0.148) | mg/kg | Negative | + + | [60] | |||
| Lead concentration of groundwater (0.1) | mg/L | Negative | + + | [61] | |||
| Water resources index (0.3) | Ground water depth (0.14) | cm | Range value | + + | [62] | ||
| Mineralization of groundwater (0.26) | mg/L | Negative | + + | [62] | |||
| Arsenic concentration of groundwater (0.1) | mg/L | Negative | + + | [62] | |||
| Cadmium concentration in groundwater (0.1) | mg/L | Negative | + + | [61] | |||
| Mercury concentration in groundwater (0.1) | mg/L | Negative | + + | [62] | |||
| Chromium concentration in Groundwater (0.1) | mg/L | Negative | + + | [63] | |||
| Copper concentration in groundwater (0.1) | mg/L | Negative | + + | [64] | |||
| Biological index (0.2) | Population richness (0.35) | \ | Positive | + − | [65] | ||
| Diversity index (0.27) | \ | Positive | + − | [17] | |||
| Advantage index (0.19) | \ | Positive | + − | [17] | |||
| Uniform index (0.19) | \ | Positive | + − | [17] | |||
| Other index (0.1) | Soil pH(0.5) | \ | Range value | + + | [53] | ||
| Slope (0.38) | % | Range value | + − | [66] | |||
| Level of networking forest (0.12) | % | Positive | + − | [66] | |||
| Regional policy 0.2 | Regional emergency capability (0.265) | Manual scoring | Positive | + + | Original | ||
| Equipment characteristic (0.135) | Manual scoring | Positive | + + | Original | |||
| Management system (0.6) | Manual scoring | Positive | + + | Original | |||
Publisher’s Note: MDPI stays neutral with regard to jurisdictional claims in published maps and institutional affiliations. |
© 2021 by the authors. Licensee MDPI, Basel, Switzerland. This article is an open access article distributed under the terms and conditions of the Creative Commons Attribution (CC BY) license (https://creativecommons.org/licenses/by/4.0/).
Share and Cite
MDPI and ACS Style
Wang, M.; Liang, X.; Li, Z. Research on the Evaluation Index System of the Soil Remediation Effect Based on Blockchain. Land 2021, 10, 1274. https://0-doi-org.brum.beds.ac.uk/10.3390/land10111274
AMA Style
Wang M, Liang X, Li Z. Research on the Evaluation Index System of the Soil Remediation Effect Based on Blockchain. Land. 2021; 10(11):1274. https://0-doi-org.brum.beds.ac.uk/10.3390/land10111274
Chicago/Turabian StyleWang, Menghua, Xuedong Liang, and Zhi Li. 2021. "Research on the Evaluation Index System of the Soil Remediation Effect Based on Blockchain" Land 10, no. 11: 1274. https://0-doi-org.brum.beds.ac.uk/10.3390/land10111274
Note that from the first issue of 2016, this journal uses article numbers instead of page numbers. See further details here.