
The Assessment of Density Bonus in Building Renovation Interventions. The Case of the City of Florence in Italy


1
Department of Architecture, University of Florence, Via della Mattonaia 14, 50121 Florence, Italy
2
Department of Planning, Design, and Technology of Architecture, Sapienza University of Rome, Via Flaminia 72, 00196 Rome, Italy
*
Author to whom correspondence should be addressed.
Land 2021, 10(12), 1391; https://0-doi-org.brum.beds.ac.uk/10.3390/land10121391
Submission received: 31 October 2021
/
Revised: 9 December 2021
/
Accepted: 11 December 2021
/
Published: 15 December 2021
/
Corrected: 13 October 2022
(This article belongs to the Special Issue Land Management in Territorial Planning: Analysis, Appraisal, Strategies for Sustainability Ⅱ)
Abstract
:The European Green Deal indicates the renovation of both public and private buildings as a key element for the improvement of energy efficiency in the building stock, in order to reach the goals of the document itself. New incentives, also including density bonus, can significantly contribute to foster diffuse actions. In Italy, the density bonus is under testing: the current framework has produced profitability for regeneration in some areas and unprofitability in others. This has led to a non-diffuse renewal, widening differences in richness and quality throughout territories subjected to the same reward measure. A territory is characterized by a high degree of typological and qualitative fragmentation and dissimilarity. Thus, the aim of the present work is the construction of a model that allows for identifying the entity of the reward measure in terms of density bonus. Density bonus can determine the feasibility of renovation interventions—in economic-financial terms and in relation to urban impact—taking into account the characteristics of the context (or micro-context) where they are performed. The research model is based on a Balance Sheet Model and is applied to the city of Florence. The model suggests an innovative approach where urban, landscape and environmental impacts produced by the density bonus are evaluated according to the economic amount needed for their mitigation. The expected results in the application of the model consist in the definition of an iso-bonus map organized by areas.
1. Introduction
The goals that the European Union (EU) aims to reach by 2050, thanks to the action plan named the “Green Deal”, include the elimination of greenhouse gases and the dissociation of economic growth from the use of natural resources [1].
The European Green Deal attributes a strong relevance to the theme of renovation in public and private buildings (intended both as the so-called heavy refurbishment, that is, interventions aimed at transforming building through a systematic set of works that can lead to a building wholly or partly different from the previous one and as demolition and reconstruction of buildings), as they represent one of the major sources of energy consumption in Europe. They are responsible for about 40% of the EU’s total energy consumption and for 36% of its greenhouse gas emissions [2].
In order to pursue the dual purpose of energy saving and economic growth, in 2020, the Commission published a new strategy to promote the building stock renovation, named “A Renovation Wave for Europe—Greening our buildings, creating jobs, improving lives” (a strategy synthetically named “Building Renovation”), which is being followed by several projects and programs with the aim of doubling the average European regenerative trend that nowadays (2021) is around 1% per year [3].
Hence, the renovation of both public and private buildings represents an essential action and a key initiative to promote energy efficiency in the building sector and to reach the goals established by the Green Deal [3] itself, also in the perspective of reducing land consumption [4].
Among 260 million building units in Europe [5], around 75% of the stock [5] cannot be considered energy efficient, whereas an efficient building is considered as such when at least 50% of the thermal and electric energy demand comes from renewable sources (Directive 2018/844/EU). The strong need for building stock renovation in Europe can be better understood by considering that 85–95% of the buildings that exist today will still be standing in 2050 [5].
In addition to energy needs, building stock renovation can find impulses from changes in individuals’ habits and customs. The existing building stock, in some cases, has become outdated and should therefore be adapted to new living needs; as many studies highlight [6,7,8,9], this process has strongly sped up in the last 2 years due to the SARS-COV-2 pandemic.
Regardless of this last aspect, the data related to the energy issue already show the importance of activating policies to implement the European Green Deal and the plans related to the Building Renovation in each Member State. Initiatives and tools that encourage the renovation of the existing building stock must therefore be planned.
The above highlights some issues related to the distribution modalities of public funding measures in support of renovation interventions and to the usage of other incentive measures, including new special urban planning tools (which originated in the 1980s, such as Urban Pilot Project, Urban and Urbact) and density bonus or tax reliefs to be arranged in combined ways, as well [10,11,12]. Despite the notable number of resources employed by the EU in the Next Generation EU [4] in support of the initiatives for the renovation of the European building stock, the ambitious goal to renovate 2% of the existing building stock per year needs to account for further incentive measures to encourage building renovation in parallel with direct public fundings.
Throughout the last 30 years in Europe, these experiences with new special urban planning tools have led Member States to develop similar regular planning tools within their legislative frameworks [13,14], aimed at “creating wealth from nothing”, mainly in the form of simplified derogations from territorial planning previsions in force [15,16]. However, new urban planning tools appear to be unsuitable for an expeditious building-scale renovation. These tools are indeed enacted in the same way as territorial planning programs, whose actuation requires larger time frames [16].
Density bonus and tax reliefs may instead produce positive impulses on building renovations in a short period of time. Density bonus is the object of the analysis carried out in the present work. Density bonus consists of the attribution of a building right that is higher than the existent one to real estate; such a building right, assigned as a result of the action of a building renovation, can be used to transform the building by expanding it (the expansion can be in surface or volume), or, in some cases, it can be converted into a “credit” to be used on another site. This incentive practice (also called gross floor area or GFA concession) is widely used in the United States of America, Brazil, Japan, Hong Kong, Singapore, France and Italy [17,18,19,20].
Italy has been one of the first EU countries to introduce direct incentives, such as density bonus through building right rewards for renovation, diffusely in several Italian regions [14]. However, the attribution of the incentive has apparently been “standardized” on the territory, according to a common pattern (generally, a percentage increase in addition to the possibility to derogate from intended uses). In other words, the determination of the bonus does not consider the specific characteristics of each single area and the economic differences between renovation interventions on the building stock from area to area.
This has made renovation interventions profitable in some areas and unprofitable in others, leading to a non-diffuse renovation that has increased the gap between territories.
The integration between direct public funding from Europe (in addition to the economic support deployed by Member States), with incentives such as density bonus, can be useful and crucial to increase the scope and the effectiveness of building renovation plans. At the same time, density bonus must be balanced and evaluated according to the specific characteristics of the different territories where it is applied, in order to expand and equalize the potential for renovation on the existing building stock. With reference to the specific Italian context analyzed in the present study, this also matches Mission 2, Component 3 of PNRR (Piano Nazionale di Ripresa e Resilienza, Italian Recovery and Resilience Plan), named “Energy Efficiency and Building Renovation”. In fact, this measure can contribute to the results established in M2C3.2, dedicated to energy renovation and seismic retrofitting of the building stock, concurrently with the objective of encouraging local investments [21].
Nonetheless, the present article will not discuss the repartition of direct public funding deriving from the measures enacted by the EU and their integration with incentives. Instead, it will focus on the mechanisms of equalized regulation through density bonus for building stock renovation. In fact, density bonus can contribute to the achievement of the objectives of the European Green Deal, specifically connected with the renovation of the existing building stock.
This contribution is part of the research activity concerning the study of models and techniques for evaluation within the decision-making processes aimed at defining policies, strategies and strategic measures for urban regeneration and construction. In Italy, this research field is included in the academic scientific disciplinary sector, named “ICAR22”, related to Real Estate Appraisal and Evaluation in Civil Engineering and Architecture. The following paragraphs present the results of research activities on the specific measures involving density bonus in regional and local frameworks (in Italy). This precedes the proposal of an appraisal model, designed to support the planning and regulation of renovation processes on the building stock under the jurisdiction of regional and local administrations. In fact, incentives such as density bonus are subjected to the legislation of regional or even local administrations, as they belong to the field of urban planning, which is under the competence of these levels of government in most European Member States [22].
Since a renovation intervention on a building represents a productive activity, the determination of its feasibility follows the business rules of financial and economic balance.
The specific objective of this work is to research, structure, test and validate evaluation tools in order to define policies encouraging urban regeneration through the preparation of sustainable strategic measures. Hence, the operational goal is the construction of an Economic Balance Sheet Model [23,24,25,26,27,28], aimed to find density bonus to make a renovation intervention feasible, excluding burden increases for the owner/tenant.
In order to test the operational capability of the proposed model, the experiment took place in a part of the territory of the Tuscany region in Italy, coinciding with the Municipality Area of the city of Florence.
The application of the methodology allows for the definition of an iso-bonus map, in order to support the choices of regional and local administration on legislative and regulative actions and territorial planning concerning the renovation of the existing building stock.
The main effect of the application of the Economic Balance Sheet Model consists of the possibility to control the increases in building interventions. This is crucial in a city like Florence, whose historical center is a UNESCO site (World Heritage List), in order to limit the phenomena of uncontrolled building expansion. In fact, this possibility is circumscribed only to cases where a financial impulse is needed to stimulate the renovation.
Considering the huge need for building renovation in Europe, density bonus represents a valid opportunity for many Member States, and therefore the study of the Italian case. The results of this work can be considered for a wider use at the community level, based on the obtained results.
2. Materials and Methods
2.1. Entity and Preconditions of Building Renovation
In order to understand the entity of the issue related to the renovation of building stock in the European Union, it is useful to present some data obtained from a review of the scientific literature. These data are related to: (i) the current condition of the existing European building stock [4]; (ii) the need of energy savings; and (iii) the need to avoid land consumption. Subsequently, the paper will analyze what these involve and how to act.
2.1.1. Current Condition of the Existing European Building Stock
In EU Member States, despite the total number of 260 million building units (for 446 million people), Eurostat data [4] still record a significant overpopulation rate for 17.2% of European people, which shows a decreasing trend, if compared to 19.1% in 2010. Yet, 33% of the population in the European community lives in “under-occupancy”, with a stable trend since 2010. Additional Eurostat data also highlight significant percentages related to technical-qualitative deficiencies in the building stock of EU Member States: 6.9% of buildings have serious deficiencies that do not allow heating during winter; 1.6% lack sanitary systems; and finally, as many as 12.7% present serious technical and structural problems on the roof. These data reveal an urgent need for renovation for no less than 30 million building units; this number is compounded by other minor urgencies that need to be solved by the end of the next decade.
2.1.2. Energy Savings
Following the directive on the energy performance of buildings (Directive 2010/31/EU), which was changed in 2018 (Directive 2018/844/EU) conjunctly with the directive on energy efficiency (Directive 2018/2002/EU), the EU aims to promote the realization of an energy-efficient and decarbonized building stock in each Member State by 2050. This will achieve the goals of energy efficiency, such as the reduction of CO2 emissions in EU by a percentage between 80% and 95% compared to 1990.
This directive has introduced long-term strategies for building stock renovation:
- The elaboration of a long-term strategy in each Member State, aimed to support the renovation of national, public and private buildings in order to achieve a decarbonized, highly energy-efficient building stock by 2050;
- The acceleration of the transformation of existing buildings into nearly zero-energy buildings by 2050, and the imposition of the nearly-zero energy requirement for all new constructions starting from 2021;
- The support for upgrading all buildings through smart technologies.
This context leads, in October 2020, to the adoption of the new, abovementioned strategy aimed to boost building renovation, named “A Renovation Wave for Europe—Greening our buildings, creating jobs, improving lives” (COM(2020)0662). Its objective is to at least double the annual energy renovation rate in the following 10 years, ensuring an improvement in energy and resource efficiency. This initiative is based on the measures agreed within the “Clean energy for all Europeans” package and includes demanding each Member State to publish a long-term building renovation strategy. Moreover, it outlines the key aspects of integrated national plans concerning the building sector, in relation to energy and climate.
2.1.3. Saving Soil
An additional transversal item is the zero-consumption objective, already established in 2006 with the “Thematic Strategy for Soil Protection” [36], then recalled in 2011 with the “Roadmap to a Resource Efficient Europe” [37], which proposes the goal of a net-zero land take rate in Europe by 2050, and was, finally, further reinforced by the European Parliament in 2013 with the approval of the “7th Environment Action Program” [38]. According to these documents, the objective of reducing soil consumption requires enacting good practices to mitigate the negative effects of land consumption and its most evident and irreversible manifestation: soil sealing.
The Commission deemed it appropriate to indicate action priorities and modalities to reach this objective and, in 2012, published the guidelines to “limit, mitigate or compensate soil sealing” [39]. The approach, indicated for the reduction of soil consumption and of its impacts, consists of the implementation of policies and actions aimed at limiting, mitigating and compensating soil sealing, to be defined in detail by the Member States.
In 2015, the UN Sustainable Development Agenda [40] defined the Sustainable Development Goals (SDGs) and indicated, among the others, some targets of particular interest for territory and soil, to be integrated in short-term and long-term national programs to reach by 2030:
- Ensure that land consumption does not exceed demographic growth (indicator 11.3.1);
- Provide universal access to safe, inclusive and accessible, green and public spaces;
- Reach a land degradation neutral world, as an essential item to maintain the functions and services of the ecosystem (indicator SDG 15.3.1).
Through the subscription to the Agenda, all states, including Italy, have accepted to monitor the objectives. These include specific ones on soil consumption, land use and land degradation.
2.1.4. How to Act
It is now a widespread notion that the objectives of energy saving and soil protection, diffusely shared throughout the community, impose a limitation to the use of new land, directing the future development of urbanized territories toward the regeneration of existing urbanized spaces (infrastructures and building stock) [41,42,43,44]. Hence, the transformation processes of the urban space must be preferentially planned by performing actions on existing spaces, filling the gap between the existing building stock and new needs. This also includes interventions of densification that allow for creating new functions within the “built” city, ensuring that the demand for new infrastructure services is controlled.
As the analysis of the preconditions of building renovation sheds light on the strategic and structural dimension of the community policies aimed at the renovation of the existing building stock, the funding modalities of these renewal processes deserve a particular interest.
In the EU, there are 3 funding modalities for building stock renovation: (1) direct public funding through direct payment; (2) indirect public funding through tax incentives, mainly related to the achievement of results concerning energy and seismic safety; and (3) density bonus. These forms of renovation incentives can occur separately or also conjunctly.
The present work explores the theme of density bonus, for which Italy can represent an experimental workshop that the other Member States can draw benefits from.
2.2. Density Bonus: Overview and Focus on the Italian Case
Density bonus is an approach, used primarily in the United States but also in other countries, aimed at encouraging urban regeneration. In particular, the density bonus allows a real estate developer or a real estate owner to increase building rights on a site as a reward for funding or for the achievement of public policy objectives.
Some significant experiences with density bonus have been implemented in the United States of America. This tool was born in New York in 1961 and was used to improve the quality of public spaces through premium concessions related to the improvement of public spaces (initially 3 square feet, later increased to 10 of building bonus for every 1 square foot of improvement of public spaces). By 2000, density bonus allowed for redeveloping in more than 500 public spaces in Manhattan. Density bonus is widely applied in the USA, including established practices in California, Maryland, Boston, Washington and Miami [45].
In São Paulo, Brazil, a similar approach was pioneered with the “outorga onerosa” program, which offered property owners the assignation of a co-construction bonus up to 20% of the existing building volume if they made a predetermined cash contribution to a public works improvement [46].
Hong Kong has promoted density bonus since 1994 to promote intensive development at transport nodes. In particular, density bonus has been offered in exchange for certain public goods. The idea is to leverage on private investments to realize infrastructures that are intended to facilitate pedestrian movement from underground stations to the ground level, while also enhancing the travel experience and providing public open space amenities [47].
In Japan, density bonus has been implemented in Nagoya, Osaka and Tokyo. A bonus floor area is granted for buildings that meet a certain energy efficiency standard as measured by the Japanese “CASBEE” rating (equivalent of the USA’s LEED system) [13].
In Singapore, among the various incentives contemplated in urban planning, density bonus is allowed if the project achieves certain standards. Specifically, the density bonus is related to the construction of condominium recreation areas, the conversion of excess parking to new uses, Green Mark certification, underground pedestrian col-links (which are also subject to a cash grant) and even the construction of landscaped terraces [47].
In France, the density bonus was regulated as part of the energy sector legislation of July 2005. Municipalities were allowed to grant a density bonus of up to 20% to promote sustainable construction and energy efficiency [17].
Italy can be considered, together with France, a pilot State in the EU, concerning the definition of strategies for the reduction of land consumption, based on densification processes as an incentive for urban regeneration (density bonus) [14].
Unlike Member States where regeneration processes are based on direct public funding, Italy has modeled the scenario for ongoing experimentation on indirect public funding: tax incentives—mainly related to the achievement of results in energy efficiency and seismic safety—and density bonus.
As of today (2021), in Italy, density bonus is determined in relation to the analysis of the urban destination; generally, the density bonus is applicable in urbanized areas or in areas designated for urbanization but not in an agricultural area. The density bonus is indistinctly defined as a percentage (generally between 20% and 30%) that does not consider the different typologies of territories. Moreover, these percentage increases should be sustained by the existing infrastructural network, but no detailed assessment is generally implemented in this regard [14,48].
The first experiences of “standardized” density bonus incentives have led to desultory renovation actions across the territory, concentrated in areas that showed more favorable conditions in terms of market appeal, while areas with less economic attractivity have been hardly affected by interventions. Even though there is not an explicit national regulation on renovation incentives, in some regions, specific regulations have been enacted in order to “reward” renovation interventions on the building stock. This category of interventions is constituted by “heavy refurbishment” and “demolition and reconstruction”. As of today (2021), 5 Italian regions have officially introduced density bonus for renovation, defining a parameter of maximum reward (in particular, the approach of the Tuscany region delegates the articulation of reward plans to urban planning tools). Emilia Romagna, Liguria and Campania, despite laying provisions for renovation interventions, do not use reward measures to support them, assigning instead other typologies of incentives, such as the reduction of concession fees (also included in the legislation of some of the regions that have introduced rewards). In the other regions, the topic of renovation is still tied to urban planning processes, without incorporating private interventions.
The density bonus enacted by several Italian regions has a foundation in the principle according to which, if a renovation intervention is not performed by a public administration nor supported by direct funding, it must be compatible not only with the conditions of urban development, but also with principles of economic-financial feasibility. Hence, this work proposes an original approach for the determination of density bonus. This approach considers a renovation intervention without public funding as a real estate initiative, subjected to the parameters for ordinary market investments, not only to the analysis of the compatibility with urban infrastructural supply.
The first applications of this policy have produced very limited effects on direct building renovation [49]. Following the analysis of the results in the main Italian cities (Rome and Milan), it has emerged that renovation interventions have been carried out mostly in qualified urban areas [50,51]. In fact, density bonus can be evaluated as the discounting of property incomes: in these areas, their value is sufficiently high to motivate the execution of renovation interventions; in other areas, where market appeal is lower, the entity of the bonus does not constitute a sufficient driving force, as it does not guarantee suitable incomes in relation to the risk.
For this reason, the success of renovation interventions, aside from the assessment of the impact on the urban context, on landscape and environment, can depend on the entity of incentives and thus, in particular if there is no direct funding, of the density bonus [52,53,54,55]. Following this reflection, if density bonus is deemed useful for renovation, determining their entity to satisfy the economic balance for the regeneration action results in being an important element.
2.3. Economic Balance Sheet Model
It should be noted that—with reference to density bonus—the impacts related to the increase of building rights are not only financial, but involve several fields (environmental, landscape, urban planning and infrastructures). Hence, this tool, despite its great potential, must be used only in cases where financial conditions are not suitable for a building renovation without incentives. These considerations justify the use of the Economic Balance Sheet Model.
The Economic Balance Sheet Model is widely used for the verification of the conditions of economic balance of a business [25,26]. It allows for the representation of the general balance and the specific balances of single business activities in a model. At the same time, the limits in the algorithmic description of a dynamic, open and non-mechanistic system—as a business is—are well-known [27,56]. However, these limits are less restrictive for a business activity consisting of a single intervention on a building.
It is now widely recognized that the Economic Balance Sheet Model, intended to check the balance related to the operations of income management of a business over a given period, is identified with the network of relationships between expense values (acquisition/use of production factors) and revenue values (production/sale of products/services) [23,24,25,26,27].
In a typical or average reference period, such as an accounting period or an n-th financial year, the model can be written as (1):
where fi ∗ pi* represents business expenses, r the expected return and qi ∗ Pi the expected revenues.
The present case also considers impacts and benefits, despite lacking a corresponding monetary value, as they are present in a business activity. Drawing from the operational practice of a cost-benefit analysis [57,58,59], 2 elements can be introduced in Equation (1): economic impacts (ei) and economic benefits (eb), representing the shadow prices of the impacts and the benefits generated by the business activity, respectively. Hence, the equation is written as (2):
The following condition confirms the economic balance (3):
Equation (3) shows that it is necessary to compensate non-pecuniary impacts with pecuniary benefits; if the condition of Equation (3) is not verified, there is an economic balance, but there is not a financial balance (this can only be accepted for public operations).
2.4. Research Method
Hence, a building renovation intervention can be intended as a business activity of a company working in real estate. This business depends on the satisfaction of conditions of financial and economic balance.
However, real estate is different from other business activities: it does not require deeply structured companies, and an external economic asset—other than the one employed in the single business activity—is not necessary.
Considering the above, Equation (2) takes this form in the real estate sector (4):
where:
AC (and MV−): acquisition cost, that is, the acquisition cost of the real estate, the core asset of the business; if the real estate is already available, its market value is considered;
RC: renovation costs, that is: (i) CapEx (Capital Expenditure), representing net cash outflows for the realization of investments in operating fixed assets or fixed investments, distinguished in this case from the acquisition cost; (ii) OpEx: Operating Expenses;
R = expected revenues as a function of expected returns;
MVre.bu. = market value of the renovated building, or of the renovated building asset; this parameter can be also indicated as MV+.
Equation (4) constitutes the base for an elaboration of the Economic Balance Sheet Model, aimed at the determination of density bonus in building renovation. Within the model, the latter represents the product share required to verify the financial and economic feasibility of the operation [60].
The definition of the model follows these assumptions:
- (1)
- The impacts on infrastructural demand, on landscape and environment determined by the renovation intervention must always be monetizable; specifically, their economic values are evaluated according to the actions needed to mitigate them, or in the mere monetization according to the principle of indemnity; hence, economic impacts are included in CapEx (mitigation actions) or in OpEx (indemnity) [61];
- (2)
- Since renovation interventions mainly involve private buildings, the economic benefit has not been considered;
- (3)
- The time variable has been assumed constant (business operation), without considering the heterogeneity of renovation cases, leading to different durations; it is assumed that in interventions that require longer periods, this would be overcome through an organizational upgrade and a related cost increase;
- (4)
- The business has been considered to have no asset, hence the acquisition cost of the asset to renovate has been included in the economic balance as the initial market value (MV−).
Equation (4) is now written as (5):
Including R in RC, introducing q as the quantity of the existing product to renovate and p as the reward that produces the economic balance of the renovation, Equation (5) can be written as (6):
Setting p as the unknown factor of the equation, the result is (7):
The implementation of the model requires the obtainment of renovation costs (8):
CapEx is calculated as follows, excluding the acquisition cost, or MV− (9):
where:
CC = summation of construction costs, comprising both the building (CCbuild) and the qualification of its context (CCurb).
MC = “real” (RMC) and “indemnifying” or administrative (AMC) mitigation costs, in case of renovation interventions with impacts on the infrastructural demand, landscape and environment, assuming that such impacts can be mitigated with specific additional interventions, or indemnities;
AC = administrative charges (related to the building intervention);
FC = finance charges (related to AC, CC e AC);
OpEx include (10):
where:
BC = business costs:
R is (11):
where:
r = is the expected return rate, depending on the typology of intervention.
3. Experimentation and Results
3.1. Experimentation Area
The Economic Balance Sheet Model has been used as a methodological support for the creation of an iso-bonus map in the city of Florence, in the Tuscany region in Italy, differentiated according to the various territorial areas. Iso-bonus areas have been chosen by following the definition of micro-zones determined by the Real Estate Market Observatory of the Revenue Agency. The classification of the examined areas (old town, central areas, semi-central areas and suburbs) has followed the denominations chosen by the Revenue Agency as well. Examined areas are listed in Table 1 that reports size and type (central areas, old town, semi-central areas, peripheric and suburbs).
The following operations have been performed for the implementation of the research model:
- CapEx (using Formula (9)) and OpEx (using Formula (10)) analysis for the estimation of renovation costs (Formula (8)), considering the specific and heterogeneous characteristics of the areas within the city of Florence;
- Market Analysis for the estimation of the market value in the examined areas, considering both the “to be restored” and “new” condition for estates (using Real Estate Market Observatory of the Revenue Agency database);
- Calculation of the density bonus for each area (using Formula (7)).
3.2. CapEx and Opex Analyses
CapEx has been estimated as follows.
The construction cost related to a “heavy refurbishment” (CCbuild) is affected by area typology (old town, central areas, semi-central areas and suburbs).
Urbanization costs (CCurb) have been assessed according to the current regulation (2021) in the city of Florence. In fact, these costs vary according to the size of the intervention (less than 2000 sqm; between 2000 sqm and 4000 sqm; more than 4000 sqm). Among the three, the mean scenario was chosen.
The entity of the construction tax (CCct) has been considered as well on the base of the current regulation. In fact, the tax varies according to the dimensional aspects of the housing units (smaller than 160 sqm; between 110 sqm and 160 sqm; larger than 160 sqm). The asset produced by the renovation was assumed to be comprised of between 110 sqm and 160 sqm in old town and central areas; in suburbs, smaller than 110 sqm.
Real mitigation costs (RMC) have not been considered, as they depend on the possible inclusion of the prescription in the orders permitting the renovation intervention, so they could not be determined in the present experimentation.
Administrative mitigation costs (AMC) have been estimated according to the resolution n. 2014/G/00207 of the city of Florence, assuming: (i) the unavailability of additional urban standards in old town and central areas, where adjacent lots often coincide with the shape of the building; (ii) the availability of 50% of the additional urban standards in semi-central areas, where the adjacent lots of the buildings usually have some free open spaces; (iii) the total availability of additional urban standards in the suburbs, where adjacent lots usually have wide open spaces; and (iv) the ratio between unavailable urban standards (UUS) and assumed as equal to 33%;
Administrative charges (AC) were considered for all areas and estimated as a 10% flat rate of the summation of construction cost, urbanization cost, construction tax, real and administrative mitigation cost.
Financial charges (FC) were considered for all areas, on the base of the debt capital and the time frame for design and construction, where the debt interest was only charged on the actuator. The time frame was set at 3 years. The cost of the debt capital, that represents the interest rate to apply, was equal to EurlRS/Euribor plus Spread.
OpEx has been evaluated through business costs and evaluated for all areas as a 5% flat rate of CapEx.
A CapEx analysis and an OpEx analysis allow for assessing renovation costs, consisting in the summation of each CapEx and OpEx that must be considered to renovate the building in each considered area typology. Table 3 reports the renovation costs for each area typology considered in the experimentation, assessed according to the results of the CapEx and OpEx analyses.
3.3. Market Analysis
Then, a Market Analysis was performed for the determination of the market value, in each of the examined areas. MV− has been chosen as the minimum price indicated by the Real Estate Market Observatory of the Revenue Agency, while the determination of MV+ has been evaluated in a different way, in order to resemble real market prices. In fact, it has been assessed by increasing the maximum price provided by the same source, by a share equal to: (i) 30% for the area B5; (ii) 20% for the areas B2, B6, B7 and B8; (iii) 10% for the remaining areas C2, C3, C4, C5, C6, C7, C9, C10, C11, C12, C13, C14, C15, D3, D4, D6, D7, D10, D11, D12, D13, D14, D15, D16, D17, D18, D19, D20 and E1.
These shares have been determined through a comparison by audit sampling between the maximum real estate prices of the Revenue Agency and real estate prices of new constructions obtained from Nomisma [62] and Real Value—from the Independent Research Institute Scenari Immobiliari [63]—databases.
Table 4 reports the results of the Market Analysis.
3.4. Density Bonus Calculation
The last step was the determination of the corresponding density bonus for each zone.
Table 5 reports the results of the application of the model. Evidently, the experimentation on a significantly extended territory (10,240 ha) required some assumptions concerning macro-areas and/or macro-categories of intervention. The results varied within areas, as the data used in the implementation of the research model (CapEx, OpEx and market value) were associated to micro-areas [64], with smaller extension and a higher level of detail.
For this reason, it was deemed appropriate to aggregate the single results in reward classes with a range of five percentage points, as this interval presented a stronger significance with the observed phenomenon.
3.5. Results Analysis
Interesting considerations emerged from the analysis of the results obtained with the application of the EBSC model, constituting a valid support for the management of the attribution of rewards.
In the city of Florence, without direct funding measures, building renovation is economically feasible:
- on 32.28% of the municipal area, with no need for incentives;
- on 17.91% of the municipal area, with a 1–5% bonus;
- on 12.41% of the municipal area, with a 6–10% bonus;
- on 4.40% of the municipal area, with a 16–20% bonus;
- on 15.10% of the municipal area, with a 21–25% bonus;
- on 5.43% of the municipal area, with a 31–35% bonus;
- on 5.52% of the municipal area, with a 36–40% bonus;
- on 5.39% of the municipal area, with a 41–45% bonus.
The summary results above show the bonus entity (Table 6): in two-thirds of the municipal area of Florence, urban regeneration is feasible with no, or very low, incentives; in 19.50% of the municipal area, a medium incentive is needed, and only 17.89% of the area requires high incentives.
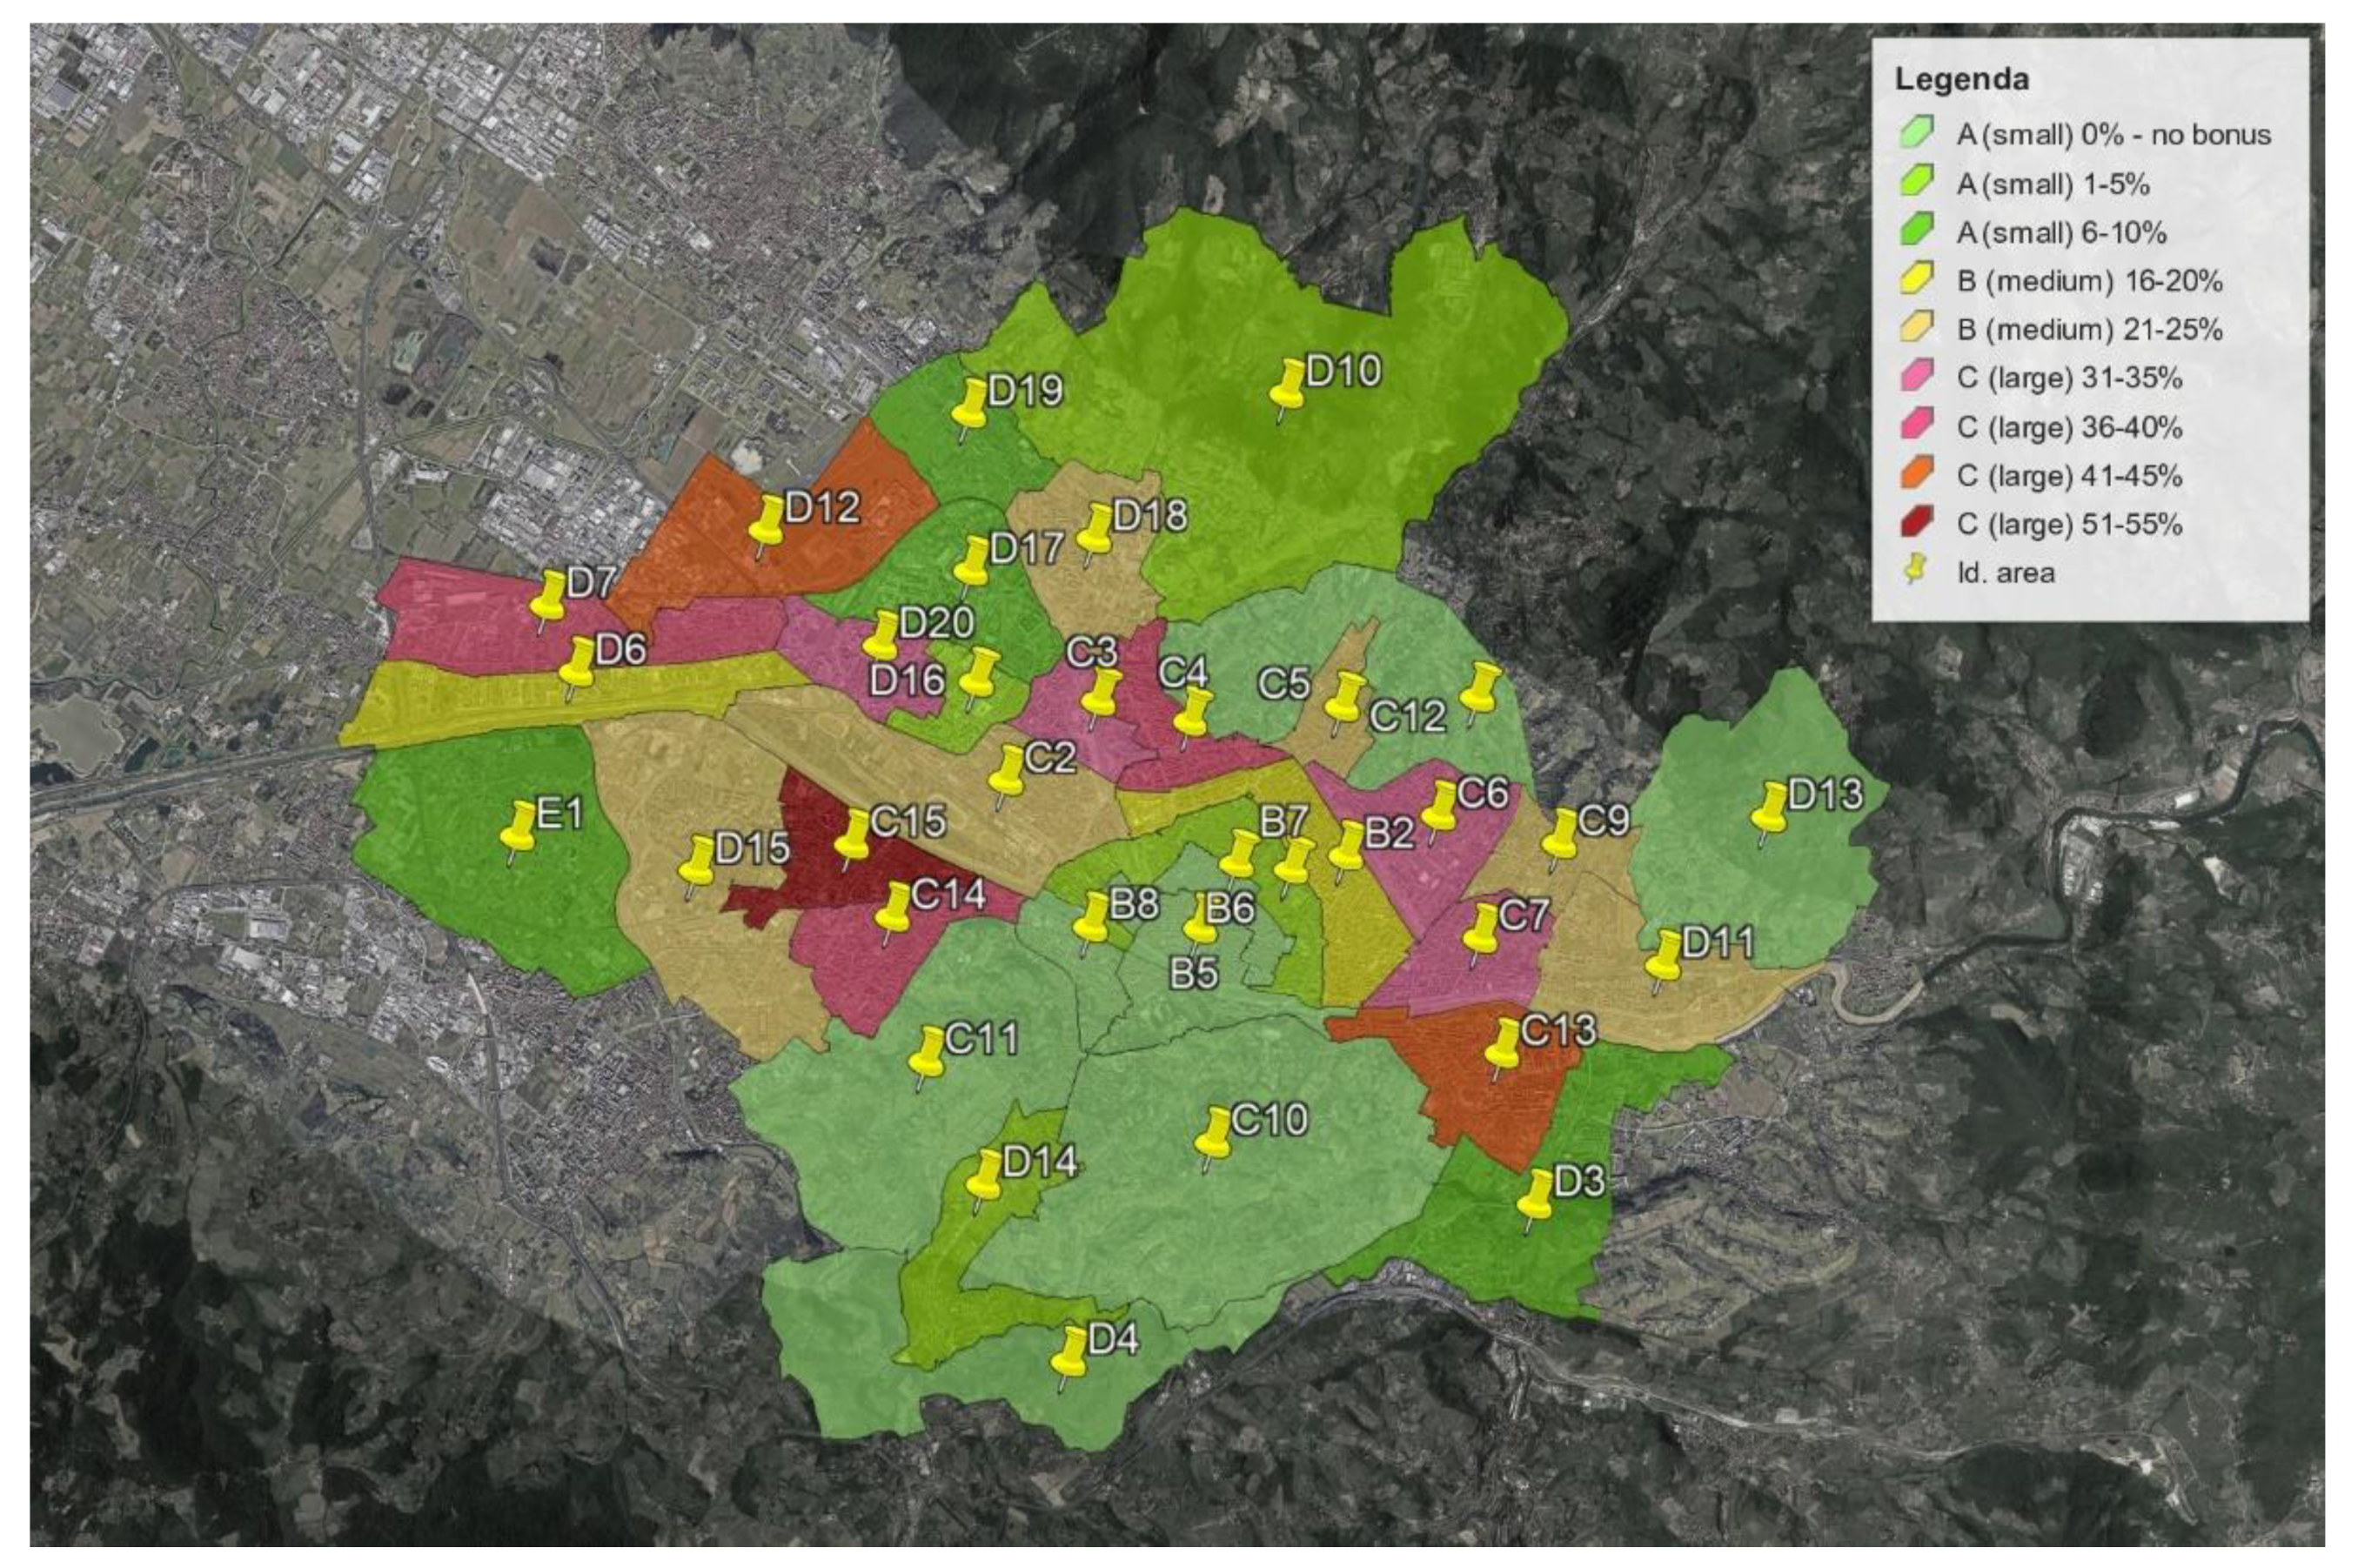
The geo-references of the results (graphical representations) of the application are shown in Figure 1.
4. Discussion and Conclusions
The results obtained through the application of the research model confirm the initial assumption, discussed in the second section, concerning the need for a specific calibration of density bonus as a function of the context where renovation takes place.
Density bonus can support the renovation of private and/or public buildings and contribute to the achievement of the objective of the European Green Deal concerning the energy savings of buildings. With reference to the Italian case, this also supports the achievement of the objective of Mission 2, Component 3 of PNRR “Energy Efficiency and Building Renovation”. In fact, it can increase opportunities, and results established in M2C3.2, specifically related to the energy renovation and seismic retrofit of the building stock, are in accordance with the objective of fostering local investments. However, this requires research for the correct management of the density bonus for building renovation that can be also combined with direct (specific financing support) or indirect public funding (tax incentives) measures.
However, an additional result emerges from the experimentation on the city of Florence. The results show how the need for density bonus to building renovation affects only a little more than one-third of the municipal area. The widespread and uncalibrated attribution of the density bonus to entire administrative territories, applied by many Italian regions, has revealed strong criticalities due to the risk of an uncontrolled increase in built volumes. The application of the Economic Balance Sheet Model, therefore, identifies the threshold of increase in building rights, or density bonus, needed to produce financial feasibility for a renovation intervention; this methodology can become a tool for urban planners to control the sustainable development of the territory.
The present work has discussed and evaluated density bonus for building renovation when performed through heavy refurbishments/demolition and reconstruction.
Finally, two considerations have emerged:
- The first one is specifically related to the research model and considers its limits and possible future developments;
- The second one is independent from the research model and concerns the effects of renovation interventions, supported by density bonus, on the context where this incentive is introduced.
Concerning the former, the research model, despite the significance of its results, provides “static” results, referring to renovation interventions defined aprioristically. In other words, the research model can provide the suitable percentage value for density bonus in a specific area if it receives an input related to a given typology of renovation intervention. In the present case, the chosen typology is “heavy refurbishment”; in order to determine the bonus for light or medium refurbishment, the research model requires a new implementation.
In further developments of the research model, an additional feature could be the capability of identifying the most suitable typology of renovation intervention according to the context, to the initial conditions, to other aspects of the real estate market (trade liveliness, supply and demand) and to the unit prices in the area. Moreover, other developments of the model could include the determination of the density bonus, not only according to financial and economic factors, but considering multi-dimensional aspects integrating environment, landscape and urban planning in the definition of the bonus. In addition, the results could be further validated through consultation with representatives of density bonus beneficiaries, local stakeholders and experts. In this sense, further developments of the research model may concern the integration of the Economic Balance Sheet Model with a Stakeholders Analysis, Beneficiary Analysis, Delphi Method or Focus Group.
The second, final consideration is directly related to the general meaning of renovation in urban regeneration.
Urban regeneration (or urban renewal) aims to produce an environmental improvement in urban areas through a renovation intended to enhance livability, building quality and resource efficiency. The final purpose is a multi-semantic and multi-disciplinary consciousness that requires surpassing the familiar notions of ‘renovation’, ‘recovery’, ‘reuse’ and ‘requalification’ as public and/or private actions for the growth of economic, cultural and social values [65]. In their place, a new, inclusive meaning that encompasses multi-scalar, multi-cultural and multi-disciplinary approaches [66,67] will be reached. Building renovation and urban renewal have a wide meaning, comprising all actions that restore integral quality in inhabited contexts, including functional, distributive and technological aspects of residences and common spaces, without forgetting energy issues, which represents one of the key factors for environmental quality [68,69].
Following this consideration, it must be pointed out that the density bonus produces “densification” effects, with often relevant impacts on environment, landscape and infrastructural demand, which, however, can be correctly controlled in a building project. Thus, when renovation is supported by density bonus, it seems essential to consider at the same time the effects that it produces on the other abovementioned aspects, in addition to the financial and economic ones.
In particular, it must be considered that this kind of regeneration incentive has among its weaknesses the effects of uncontrolled growth, resulting from the cumulative application. In fact, densification as a direct incentive produces an increase in building rights, releasing them from control measures, namely, urban plans, aimed at ensuring a balance within territorial systems (environmental and infrastructural). The proposed research model can significantly contribute to the reduction of this negative impact; according to the results of experimentation, it can limit the applicability of the density bonus to the areas where it can be concretely essential to activate building renovation.
Hence, it seems appropriate to envisage the introduction of specific urban planning tools (e.g., “density bonus plans”) to regulate the attribution of density bonus, rather than only statutory provisions (as in the Italian experience). Naturally, evaluation tools, such as the proposed Economic Balance Sheet Model, could be effectively implemented within that framework.
Author Contributions
Conceptualization, F.B.; data curation, F.B. and O.C.; formal analysis, F.B. and O.C.; funding acquisition, F.B. and O.C.; investigation, F.B. and O.C.; methodology, F.B.; project administration, F.B.; resources, F.B. and O.C.; software, F.B. and O.C.; supervision, F.B.; validation, F.B. and O.C.; visualization, F.B. and O.C.; writing—original draft, F.B.; writing—review & editing, F.B. and O.C. All authors have read and agreed to the published version of the manuscript.
Funding
This research received no external funding.
Data Availability Statement
All data underlying the results are available as part of the article, and no additional source data are required.
Conflicts of Interest
The authors declare no conflict of interest.
References
- European Commission. The European Green Deal. Brussels, 11.12.2019 COM (2019) 640 Final. Available online: https://ec.europa.eu/info/sites/default/files/european-green-deal-communication_en.pdf (accessed on 29 October 2021).
- Eurostat. Energy Data 2020 Edition. Available online: https://ec.europa.eu/eurostat/documents/3217494/11099022/KS-HB-20-001-EN-N.pdf/bf891880-1e3e-b4ba-0061-19810ebf2c64?t=1594715608000 (accessed on 29 October 2021).
- European Commission. A Renovation Wave for Europe—Greening Our Buildings, Creating Jobs, Improving Lives. Brussels, 14.10.2020 COM (2020) 662 Final. Available online: https://eur-lex.europa.eu/legal-content/EN/TXT/PDF/?uri=CELEX:52020DC0662&from=EN (accessed on 29 October 2021).
- Eurostat. Regional Yearbook Is an Online Eurostat Publication. Available online: https://ec.europa.eu/eurostat/documents/3217494/13389103/KS-HA-21-001-EN-N.pdf/1358b0d3-a9fe-2869-53a0-37b59b413ddd?t=1631630029904 (accessed on 29 October 2021).
- Eurostat. Quality of Housing. Available online: https://ec.europa.eu/eurostat/cache/digpub/housing/bloc-1c.html?lang=en (accessed on 29 October 2021).
- Kaklauskas, A.; Zavadskas, E.K.; Lepkova, N.; Raslanas, S.; Dauksys, K.; Vetloviene, I.; Ubarte, I. Sustainable Construction Investment, Real Estate Development, and COVID-19: A Review of Literature in the Field. Sustainability 2021, 13, 7420. [Google Scholar] [CrossRef]
- European Commission. Impact of COVID-19 Crisis on Construction. 2021. Available online: https://ec.europa.eu/eurostat/statisticsexplained/index.php?title=Impact_of_Covid-19_crisis_on_construction (accessed on 29 October 2021).
- Rabiei-Dastjerdi, H.; McArdle, G.; Matthews, S.A.; Keenan, P. Gap analysis in decision support systems for real-estate in the era of the digital earth. Int. J. Digital Earth 2020, 14, 1–18. [Google Scholar] [CrossRef]
- Sonn, J.W.; Kang, M.; Choi, Y. Smart city technologies for pandemic control without lockdown. Int. J. Urban Sci. 2020, 24, 149–151. [Google Scholar] [CrossRef]
- Bertoldi, P.; Economidou, M.; Palermo, V.; Boza-Kiss, B.; Todeschi, V. How to finance energy renovation of residential buildings: Review of current and emerging financing instruments in the EU. WIREs Energy Environ. 2021, 10, e384. Available online: https://0-wires-onlinelibrary-wiley-com.brum.beds.ac.uk/doi/epdf/10.1002/wene.384 (accessed on 29 October 2021). [CrossRef]
- Bianco, V.; Sonvilla, P.M. Supporting energy efficiency measures in the residential sector. The case of on-bill schemes. Energy Rep. 2021, 7, 4298–4307. [Google Scholar] [CrossRef]
- Amoruso, F.M.; Sonn, M.-H.; Chu, S.; Schuetze, T. Sustainable Building Legislation and Incentives in Korea: A Case-Study-Based Comparison of Building New and Renovation. Sustainability 2021, 13, 4889. [Google Scholar] [CrossRef]
- Diluiso, F.; Guastella, G.; Pareglio, S. Changes in urban green spaces’ value perception: A meta-analytic benefit transfer function for european cities. Land Use Policy 2021, 101, 105116. [Google Scholar] [CrossRef]
- Paolo Cirillo, G. La Premialità Edilizia, la Compensazione Urbanistica e Il Trasferimento dei Diritti Edificatori; Federalismi.it, Rome, Italy: 2019; Volume 20, pp. 1–27. Available online: https://www.federalismi.it/ApplOpenFilePDF.cfm?artid=40520&dpath=document&dfile=29102019211426.pdf&content=La%2Bpremialit%C3%A0%2Bedilizia%2C%2Bla%2Bcompensazione%2Burbanistica%2Be%2Bil%2Btrasferimento%2Bdei%2Bdiritti%2Bedificatori%2B%2D%2Bstato%2B%2D%2Bdottrina%2B%2D%2B (accessed on 29 October 2021).
- Conticelli, E.; Proli, S.; Tondelli, S. Integrating energy efficiency and urban densification policies: Two italian case studies. Energy Build. 2017, 155, 308–323. [Google Scholar] [CrossRef]
- Beghelli, S.; Guastella, G.; Pareglio, S. Governance fragmentation and urban spatial expansion: Evidence from europe and the united states. [Governance-Fragmentierung und urbane räumliche Expansion: Erkenntnisse aus Europa und den USA]. Rev. Reg. Res. 2020, 40, 13–32. [Google Scholar] [CrossRef]
- Paetz, M.M.D.; Pinto-Delas, K. From Red Lights to Green Lights: Town Planning Incentives for Green Building. In Proceedings of the Talking and Walking Sustainability International Conference, Auckland, New Zealand, 20–23 February 2007; Available online: https://www.thesustainabilitysociety.org.nz/conference/2007/papers/PAETZ-From%20Red%20Lights%20to%20Green%20Lights.pdf (accessed on 29 October 2021).
- Abair, J.W. Green buildings: When it means to be green and the evolution of green building laws. Urban Law 2008, 40, 623–632. [Google Scholar]
- Miller, N.; Spivey, J.; Florance, A. Does green pay off? J. Real Estate Portf. Manag. 2008, 144, 385–400. [Google Scholar] [CrossRef]
- Qian, Q.K.; Fan, K.; Chan, E.H.W. Regulatory incentives for green buildings: Gross floor area concessions. Build. Res. Inf. 2016, 44, 675–693. [Google Scholar] [CrossRef]
- Presidenza del Consiglio dei Ministri del Governo Italiano, Piano Nazionale di Ripresa e Resilienza (PNRR). 2021. Available online: https://www.governo.it/sites/new.governo.it/files/PNRR_2021_0.pdf (accessed on 29 October 2021).
- Battisti, F.; Campo, O.; Forte, F. A methodological approach for the assessment of potentially buildable land for tax purposes: The italian case study. Land 2020, 9, 8. [Google Scholar] [CrossRef]
- Bezemer, D.J. The economy as a complex system: The balance sheet dimension. Adv. Complex Syst. 2012, 15, 1250047. [Google Scholar] [CrossRef]
- Kulikova, L.I.; Garyntsev, A.G.; Gafieva, G.M. The Balance sheet as information model. Procedia Econ. Financ. 2015, 24, 339–343. [Google Scholar] [CrossRef]
- Rudd, A.; Siegel, L.B. Using an Economic Balance Sheet for Financial Planning. J. Wealth Manag. 2014, 162, 15–23. [Google Scholar] [CrossRef]
- Chlodnicka, H.; Zimon, G. Balance Sheet Model for Small Economic Entities. Econ. Soc. Dev. Book Proc. 2019, 6, 243–250. [Google Scholar] [CrossRef]
- Dichev, I.D. On the balance sheet-based model of financial reporting. Account. Horiz. 2008, 22, 453–470. [Google Scholar] [CrossRef]
- Mudita, K.; Ikhide, S. Balance sheet channel in developing countries: Review, evaluation and integration. J. Econ. Int. Financ. 2011, 2, 742–748. [Google Scholar]
- Belussi, L.; Barozzi, B.; Bellazzi, A.; Danza, L.; Devitofrancesco, A.; Fanciulli, C.; Scrosati, C. A review of performance of zero energy buildings and energy efficiency solutions. J. Build. Eng. 2019, 25, 100772. [Google Scholar] [CrossRef]
- Annunziata, E.; Frey, M.; Rizzi, F. Towards nearly zero-energy buildings: The state-of-art of national regulations in Europe. Energy 2013, 57, 125–133. [Google Scholar] [CrossRef]
- Vieites, E.; Vassileva, I.; Arias, J.E. European initiatives towards improving the energy efficiency in existing and historic buildings. Energy Procedia 2015, 75, 1679–1685. [Google Scholar] [CrossRef]
- Bastasin, C. Saving Europe: Anatomy of A Dream; Brookings Institution Press: Washington, DC, USA, 2015. [Google Scholar]
- Guarini, M.R.; Battisti, F. Benchmarking Multi-criteria Evaluation: A Proposed Method for the Definition of Benchmarks in Negotiation Public-Private Partnerships. In Proceedings of the Computational Science and Its Applications—ICCSA 2014. 14th International Conference, Guimarães, Portugal, 30 June–3 July 2014, Part III. Lecture Notes in Computer Science; Murgante, B., Ed.; Springer International Publishing: Cham, Switzerland, 2014; Volume 8581, pp. 208–223. [Google Scholar] [CrossRef]
- Torre, C.M.; Morano, P.; Tajani, F. Saving soil for sustainable land use. Sustainability 2017, 9, 350. [Google Scholar] [CrossRef]
- Kuhlman, T.; Reinhard, S.; Gaaff, A. Estimating the costs and benefits of soil conservation in Europe. Land Use Policy 2010, 27, 22–32. [Google Scholar] [CrossRef]
- European Commission. The Implementation of the Soil Thematic Strategy and Ongoing Activities. Brussels, 13.2.2012 COM (2012) 46 Final. Available online: https://eur-lex.europa.eu/LexUriServ/LexUriServ.do?uri=COM:2012:0046:FIN:EN:PDF (accessed on 29 October 2021).
- European Commission. Roadmap to a Resource Efficient Europe. Brussels, 20.9.2011 COM (2011) 571 Final. Available online: http://eur-lex.europa.eu/legal-content/EN/TXT/?uri=CELEX:52011DC0571 (accessed on 29 October 2021).
- European Commission. Decision No 1386/2013/EU of the European Parliament and of the Council of 20 November 2013 on A General Union Environment Action Programme to 2020 ‘Living Well, Within the Limits of Our Planet’. Available online: https://eur-lex.europa.eu/legal-content/EN/TXT/PDF/?uri=CELEX:32013D1386&from=EN (accessed on 29 October 2021).
- European Commission. Guidelines on Best Practice to Limit, Mitigate or Compensate Soil Sealing; Publications Office of the European Union: Luxembourg, 2012; ISBN 978-92-79-26210-4. [Google Scholar] [CrossRef]
- United Nations Development Programme. Available online: https://www.undp.org/sustainable-development-goals?utm_source=EN&utm_medium=GSR&utm_content=US_UNDP_PaidSearch_Brand_English&utm_campaign=CENTRAL&c_src=CENTRAL&c_src2=GSR&gclid=Cj0KCQjwt-6LBhDlARIsAIPRQcIHyMs9aHjYEr4DRaA3-br1xK4zq2e9ojJ1r0asCcnA0lwE7tMLSB0aAgydEALw_wcB (accessed on 29 October 2021).
- Guarini, M.R.; Chiovitti, A.; Battisti, F.; Morano, P. An Integrated Approach for the Assessment of Urban Transformation Proposals in Historic and Consolidated Tissues. In Computational Science and Its Applications—ICCSA 2017. ICCSA 2017. Lecture Notes in Computer Science; Gervasi, O., Ed.; Springer: Cham, Switzerland, 2017; Volume 10406. [Google Scholar] [CrossRef]
- Andersen, H.T. The new urban politics of Europe: The area-based approach to regeneration policy. In Governing European Cities; Routledge: London, UK, 2019; pp. 233–253. [Google Scholar]
- Natividade-Jesus, E.; Almeida, A.; Sousa, N.; Coutinho-Rodrigues, J. A case study driven integrated methodology to support sustainable urban regeneration planning and management. Sustainability 2019, 11, 4129. [Google Scholar] [CrossRef]
- Battisti, F.; Guarini, M.R. Public interest evaluation in negotiated public-private partnership. Int. J. Multicriteria Decis. Mak. 2017, 7, 54–89. [Google Scholar] [CrossRef]
- Density Bonus on World Bank Website. Available online: https://urban-regeneration.worldbank.org/node/20#:~:text=A%20density%20bonus%20is%20an,for%20specified%20public%20policy%20goals.&text=The%20density%20bonus%20program%20was%20introduced%20in%20New%20York%20City%20in%201961 (accessed on 5 December 2021).
- Zacharias, J.; He, J. Hong Kong’s urban planning experiment in enhancing pedestrian movement from underground space to the surface. Tunn. Undergr. Space Technol. 2018, 82, 1–8. [Google Scholar] [CrossRef]
- Urban Planning in Singapore. The Little Country with Big Plans. Available online: http://www.ratio.com.au/the-little-country-with-big-plans (accessed on 5 December 2021).
- Il Giornale Dell’Architettura. Available online: https://ilgiornaledellarchitettura.com/2020/04/22/rigenerazione-urbana-in-italia-facciamo-il-punto/ (accessed on 29 October 2021).
- Consiglio Nazionale degli Architetti, Pianificatori, Paesaggisti e Conservatori. Il Piano Nazionale per la Rigenerazione Urbana Sostenibile. Available online: http://www.awn.it/attachments/article/731/CNAPPC_Piano_Nazionale_per_la_Rigenerazione_Urbana_Sostenibile.pdf (accessed on 29 October 2021).
- Roberts, P.; Sykes, H. (Eds.) Urban Regeneration: A Handbook; Sage: New York, NY, USA, 1999. [Google Scholar]
- Cepiku, D.; Guga, E.; Marchese, B. Collaborative governance for urban regeneration in Italy. In Collaborative Governance for Local Economic Development; Routledge: London, UK, 2019; pp. 135–150. [Google Scholar]
- Trono, A.; Zerbi, M.C.; Castronuovo, V. Urban Regeneration and Local Governance in Italy: Three Emblematic Cases. In Local Government and Urban Governance in Europe; Springer: Cham, Switzerland; Berlin, Germany, 2017; pp. 171–192. [Google Scholar]
- Pogliani, L. Expanding inclusionary housing in Italy. J. Hous. Built Environ. 2014, 29, 473–488. [Google Scholar] [CrossRef]
- Saka, N.; Olanipekun, A.O.; Omotayo, T. Reward and compensation incentives for enhancing green building construction. Environ. Sustain. Indic. 2021, 11, 100138. [Google Scholar] [CrossRef]
- Falco, E.; Chiodelli, F. The transfer of development rights in the midst of the economic crisis: Potential, innovation and limits in Italy. Land Use Policy 2018, 72, 381–388. [Google Scholar] [CrossRef]
- Bobryshev, A.N.; Uryadova, T.N.; Lyubenkova, E.P.; Yakovenko, V.S.; Alekseeva, O.A. Analytical and management approaches to modeling of the accounting balance sheet. Life Sci. J. 2014, 11, 502–506. [Google Scholar]
- Layard, P.R.G. Cost-Benefit Analysis; Cambridge University Press: Cambridge, UK, 1994. [Google Scholar]
- Boardman, A.E.; Greenberg, D.H.; Vining, A.R.; Weimer, D.L. Cost-Benefit Analysis: Concepts and Practice; Cambridge University Press: Cambridge, UK, 2017. [Google Scholar]
- Brent, R.J. Applied Cost-Benefit Analysis; Edward Elgar Publishing: Cheltenham, UK, 2006. [Google Scholar]
- Guarini, M.R.; Battisti, F. A model to assess the feasibility of public-private partnership for social housing. Buildings 2017, 7, 44. [Google Scholar] [CrossRef]
- Fattinnanzi, E.; Acampa, G.; Battisti, F.; Campo, O.; Forte, F. Applying the depreciated replacement cost method when assessing the market value of public property lacking comparables and income data. Sustainability 2020, 12, 8993. [Google Scholar] [CrossRef]
- Nomisma. Real Estate Market Observatory. Available online: https://www.nomisma.it/servizi/osservatori/osservatori-di-mercato/osservatorio-immobiliare (accessed on 26 November 2021).
- Scenari Immobiliari Independent Research Institute. Real Value Database. Available online: https://realvalue.scenari-immobiliari.it/home (accessed on 26 November 2021).
- Real Estate Market Observatory of the Revenue Agency. Available online: https://www1.agenziaentrate.gov.it/servizi/Consultazione/ricerca.htm (accessed on 26 November 2021).
- Murtagh, B. Urban regeneration and the social economy. In The Routledge Companion to Urban Regeneration; Routledge: London, UK, 2013; pp. 219–228. [Google Scholar]
- Ishizaka, A.; Nemery, P. Multi-Criteria Decision Analysis: Methods and Software; John Wiley & Sons: Hoboken, NJ, USA, 2013. [Google Scholar]
- Capolongo, S.; Sdino, L.; Dell’Ovo, M.; Moioli, R.; Della Torre, S. How to assess urban regeneration proposals by considering conflicting values. Sustainability 2019, 11, 3877. [Google Scholar] [CrossRef]
- Garau, C.; Pavan, V.M. Evaluating urban quality: Indicators and assessment tools for smart sustainable cities. Sustainability 2018, 10, 575. [Google Scholar] [CrossRef]
- Daniels, B.; Zaunbrecher, B.S.; Paas, B.; Ottermanns, R.; Ziefle, M.; Roß-Nickoll, M. Assessment of urban green space structures and their quality from a multidimensional perspective. Sci. Total Environ. 2018, 615, 1364–1378. [Google Scholar] [CrossRef]
Figure 1.
Geo-references of results.


Table 1.
Examined areas.
| Examined Areas | |||
|---|---|---|---|
| Area Code and Name | Size (Hectares) | Type | |
| B2 | Lungarno-Donatello-Beccaria-Libertà | 208.5 | Central areas |
| B5 | Centro Storico (Signoria-Duomo-Pitti-San Niccolò) | 181 | Old town |
| B6 | Centro Storico (Stazione Centrale-San Lorenzo-Sant’Ambrogio) | 88 | |
| B7 | Centro Storico (Viali-Lungarno Vespucci-Lungarno della Zecca Vecchia) | 185 | |
| B8 | Centro Storico (San Frediano-Porta Romana) | 82.7 | |
| C2 | San Jacopino-Ponte alle Mosse-Cascine | 395 | Semi-central areas |
| C3 | Dalmazia-Romito | 95 | |
| C4 | Poggetto-Statuto-Ponte Rosso | 117 | |
| C5 | Le Cure | 80.5 | |
| C6 | Campo di Marte | 200.4 | |
| C7 | Madonnone-San Salvi-Bellariva | 140 | |
| C9 | Coverciano | 111 | |
| C10 | Bobolino-Poggio Imperiale -Pian dei Giullari | 917 | |
| C11 | Marignolle-Monte Oliveto-Le Campora | 614 | |
| C12 | La Pietra-Camerata | 464 | |
| C13 | Piazza Ferrucci-Ricorboli-Bandino-Viale Europa-Anconella | 218 | |
| C14 | Pignone-Legnaia-Soffiano-Monticelli | 160 | |
| C15 | Isolotto | 159 | |
| D3 | Nave a Rovezzano-Ponte a Ema | 373 | Peripheral |
| D4 | Cascine del Riccio-Certosa | 444 | |
| D6 | Periferica/Le Piagge | 242 | |
| D7 | Peretola-Brozzi-Quaracchi-San Donnino | 288 | |
| D10 | Careggi-Cercina-Trespiano | 1346 | |
| D11 | Varlungo-Rovezzano | 250 | |
| D12 | Cupolina-Osmannoro | 334 | |
| D13 | Settignano | 515 | |
| D14 | Galluzzo-Le Due Strade-San Gaggio | 225 | |
| D15 | Arcingrosso-San Bartolo a Cintoia-Ponte a Greve | 498 | |
| D16 | San Donato-Villa Demidoff-Toscanini | 77.9 | |
| D17 | Carlo del Prete-Firenze Nova-Nuovo Pignone-Mercafir | 225 | |
| D18 | Morgagni-Le Panche | 212 | |
| D19 | Castello-Il Sodo | 163 | |
| D20 | Novoli-Carraia | 121 | |
| E1 | Ponte a Greve-Ugnano-Mantignano | 510 | Suburbs |
| - | Total | 10,240 | - |
Table 2.
CapEx and OpEx analyses.
| CapEx Analysis (Hypothesis: Building Renovation, Residential Sector, 2000–4000 sqm) | |||
|---|---|---|---|
| Areas | Criterion | Estimated Value | |
| CCbuild | Old town | Limited traffic zone, lack of elevators, extra-ordinary inter-floor height, valuable constructive components | 1250 |
| Central areas | Unrestricted accessibility, material procurement limitations, high-rise buildings | 1100 | |
| Semi-central areas | Unrestricted accessibility, no limitations, ordinary inter-floor height, low-rise buildings | 1000 | |
| Peripheral | Possible urbanization deficiencies, no accessibility limitations, ordinary inter-floor height, various building typologies | 950 | |
| Suburbs | Possible urbanization deficiencies, no accessibility limitations, ordinary inter-floor height, low-rise buildings | 900 | |
| CCurb (building renovation) | All areas | q < 2000 sqm | 9.82 |
| 2000 sqm < q < 4000 sqm | 48.01 | ||
| q > 4000 sqm | 28.92 | ||
| CCct | Basic units > 160 sqm | 20% of “basic cost” | 23.39 |
| 110 sm < Basic units < 160 sqm | 18% of “basic cost” | 21.05 | |
| Basic units < 110 sqm | 16% of “basic cost” | 18.71 | |
| Basic cost | Residential use | 233.92 | |
| Real mitigation cost (RMC) | All areas | Depending on prescription; not considered | |
| Administrative mitigation cost (AMC)—unavailable urban standard (UUS) | Old town | Unavailable additional standards | 110 |
| Central areas | Unavailable additional standards | 110 | |
| Semi-central areas | Possibility of finding incremental standards in the measure of 50% | 55 | |
| Peripheral | Possibility of finding incremental standards in the measure of 100% | 0 | |
| Suburbs | Possibility of finding incremental standards in the measure of 100% | 0 | |
| Ratio GUA/UUS | - | 0.33 | |
| Administrative and technical charges (AC) | All areas | Flat rate of Ccbuild + Ccurb + CCct + RMC + AMC | 10.00% |
| Financial charges (FC) | All areas (hypothesis = 100% debt) | Flat rate of Ccbuild+ Ccurb + CCct + RMC + AMC + AC | 5% per year |
| OpEx Analysis | |||
| Business costs | All areas | Flat rate of CapEx | 5.00% |
Table 3.
Renovation costs from CapEx and OpEx analyses.
| Renovation Costs (All Inclusive) | ||
|---|---|---|
| Old town | €/sqm | 1730 |
| Central areas | €/sqm | 1660 |
| Semi-central areas | €/sqm | 1430 |
| Peripheral | €/sqm | 1230 |
| Suburbs | €/sqm | 1180 |
Table 4.
Market Analysis.
| Market Analysis | |||
|---|---|---|---|
| Area Code and Name | Market Values (€/sm) | ||
| To Be Renovated | New Building | ||
| B2 | Lungarno-Donatello-Beccaria-Libertà | 2900 | 4200 |
| B5 | Centro Storico (Signoria-Duomo-Pitti-San Niccolò) | 3500 | 5980 |
| B6 | Centro Storico (Stazione Centrale-San Lorenzo-Sant’Ambrogio) | 2950 | 4800 |
| B7 | Centro Storico (Viali-Lungarno Vespucci-Lungarno della Zecca Vecchia) | 3100 | 4680 |
| B8 | Centro Storico (San Frediano-Porta Romana) | 3200 | 4920 |
| C2 | San Jacopino-Ponte alle Mosse-Cascine | 2050 | 3080 |
| C3 | Dalmazia-Romito | 2150 | 3025 |
| C4 | Poggetto-Statuto-Ponte Rosso | 2550 | 3300 |
| C5 | Le Cure | 2600 | 3520 |
| C6 | Campo di Marte | 2500 | 3300 |
| C7 | Madonnone-San Salvi-Bellariva | 2450 | 3245 |
| C9 | Coverciano | 2550 | 3520 |
| C10 | Bobolino-Poggio Imperiale -Pian dei Giullari | 2750 | 4290 |
| C11 | Marignolle-Monte Oliveto-Le Campora | 2800 | 4620 |
| C12 | La Pietra-Camerata | 2800 | 4400 |
| C13 | Piazza Ferrucci-Ricorboli-Bandino-Viale Europa-Anconella | 2500 | 3190 |
| C14 | Pignone-Legnaia-Soffiano-Monticelli | 2250 | 3080 |
| C15 | Isolotto | 2200 | 2860 |
| D3 | Nave a Rovezzano-Ponte a Ema | 2000 | 3080 |
| D4 | Cascine del Riccio-Certosa | 2300 | 3520 |
| D6 | Periferica/Le Piagge | 1600 | 2585 |
| D7 | Peretola-Brozzi-Quaracchi-San Donnino | 1700 | 2475 |
| D10 | Careggi-Cercina-Trespiano | 2100 | 3300 |
| D11 | Varlungo-Rovezzano | 2150 | 2970 |
| D12 | Cupolina-Osmannoro * | 2000 | 2650 |
| D13 | Settignano | 2800 | 4400 |
| D14 | Galluzzo-Le Due Strade-San Gaggio | 2400 | 3520 |
| D15 | Arcingrosso-San Bartolo a Cintoia-Ponte a Greve | 2000 | 2860 |
| D16 | San Donato-Villa Demidoff-Toscanini | 1950 | 3080 |
| D17 | Carlo del Prete-Firenze Nova-Nuovo Pignone-Mercafir | 1900 | 3025 |
| D18 | Morgagni-Le Panche | 2150 | 2970 |
| D19 | Castello-Il Sodo | 1800 | 2860 |
| D20 | Novoli-Carraia | 2000 | 2750 |
| E1 | Ponte a Greve-Ugnano-Mantignano | 1950 | 2970 |
* direct data collection, OMI values not available.
Table 5.
Density bonus calculation.
| Elaboration Regarding Density Bonus | ||||
|---|---|---|---|---|
| Area Code and Name | Size (Hectares) | Minimum Bonus | Bonus Range | |
| B2 | Lungarno-Donatello-Beccaria-Libertà | 208.5 | 17% | 16–20% |
| B5 | Centro Storico (Signoria-Duomo-Pitti-San Niccolò) | 181 | −18% | no bonus |
| B6 | Centro Storico (Stazione Centrale-San Lorenzo-Sant’Ambrogio) | 88 | −4% | no bonus |
| B7 | Centro Storico (Viali-Lungarno Vespucci-Lungarno della Zecca Vecchia) | 185 | 3% | 1–5% |
| B8 | Centro Storico (San Frediano-Porta Romana) | 82.7 | −2% | no bonus |
| C2 | San Jacopino-Ponte alle Mosse-Cascine | 395 | 24% | 21–25% |
| C3 | Dalmazia-Romito | 95 | 35% | 31–35% |
| C4 | Poggetto-Statuto-Ponte Rosso | 117 | 36% | 36–40% |
| C5 | Le Cure | 80.5 | 24% | 21–25% |
| C6 | Campo di Marte | 200.4 | 34% | 31–35% |
| C7 | Madonnone-San Salvi-Bellariva | 140 | 35% | 31–35% |
| C9 | Coverciano | 111 | 22% | 21–25% |
| C10 | Bobolino-Poggio Imperiale -Pian dei Giullari | 917 | −4% | no bonus |
| C11 | Marignolle-Monte Oliveto-Le Campora | 614 | −12% | no bonus |
| C12 | La Pietra-Camerata | 464 | −6% | no bonus |
| C13 | Piazza Ferrucci-Ricorboli-Bandino-Viale Europa-Anconella | 218 | 42% | 41–45% |
| C14 | Pignone-Legnaia-Soffiano-Monticelli | 160 | 36% | 36–40% |
| C15 | Isolotto | 159 | 54% | 51–55% |
| D3 | Nave a Rovezzano-Ponte a Ema | 373 | 8% | 6–10% |
| D4 | Cascine del Riccio-Certosa | 444 | 0% | no bonus |
| D6 | Periferica/Le Piagge | 242 | 18% | 16–20% |
| D7 | Peretola-Brozzi-Quaracchi-San Donnino | 288 | 37% | 36–40% |
| D10 | Careggi-Cercina-Trespiano | 1.346 | 1% | 1–5% |
| D11 | Varlungo-Rovezzano | 250 | 24% | 21–25% |
| D12 | Cupolina-Osmannoro | 334 | 41% | 41–45% |
| D13 | Settignano | 515 | −12% | no bonus |
| D14 | Galluzzo-Le Due Strade-San Gaggio | 225 | 5% | 1–5% |
| D15 | Arcingrosso-San Bartolo a Cintoia-Ponte a Greve | 498 | 23% | 21–25% |
| D16 | San Donato-Villa Demidoff-Toscanini | 77.9 | 5% | 1–5% |
| D17 | Carlo del Prete-Firenze Nova-Nuovo Pignone-Mercafir | 225 | 6% | 6–10% |
| D18 | Morgagni-Le Panche | 212 | 24% | 21–25% |
| D19 | Castello-Il Sodo | 163 | 10% | 6–10% |
| D20 | Novoli-Carraia | 121 | 32% | 31–35% |
| E1 | Ponte a Greve-Ugnano-Mantignano | 510 | 9% | 6–10% |
Table 6.
Summary of the results.
| Summary of the Results | |||||
|---|---|---|---|---|---|
| Bonus Entity | Area of Application | Ratio | Bonus Entity | ||
| no bonus | sqm | 3305.70 | 32.28% | 62.60% | No bonus or small bonus |
| 1–5% | sqm | 1833.90 | 17.91% | ||
| 6–10% | sqm | 1271.00 | 12.41% | ||
| 11–15% | sqm | 0.00 | 0.00% | 19.50% | Medium bonus |
| 16–20% | sqm | 450.50 | 4.40% | ||
| 21–25% | sqm | 1546.5 | 15.10% | ||
| 26–30% | sqm | 0 | 0.00% | ||
| 31–35% | sqm | 556.4 | 5.43% | 17.89% | High bonus |
| 36–40% | sqm | 565 | 5.52% | ||
| 41–45% | sm | 552 | 5.39% | ||
| 46–50% | sqm | 0 | 0.00% | ||
| 51–55% | sqm | 159 | 1.55% | ||
| Total | 10,240.00 | 100.00% | |||
Publisher’s Note: MDPI stays neutral with regard to jurisdictional claims in published maps and institutional affiliations. |
© 2021 by the authors. Licensee MDPI, Basel, Switzerland. This article is an open access article distributed under the terms and conditions of the Creative Commons Attribution (CC BY) license (https://creativecommons.org/licenses/by/4.0/).
Share and Cite
MDPI and ACS Style
Battisti, F.; Campo, O. The Assessment of Density Bonus in Building Renovation Interventions. The Case of the City of Florence in Italy. Land 2021, 10, 1391. https://0-doi-org.brum.beds.ac.uk/10.3390/land10121391
AMA Style
Battisti F, Campo O. The Assessment of Density Bonus in Building Renovation Interventions. The Case of the City of Florence in Italy. Land. 2021; 10(12):1391. https://0-doi-org.brum.beds.ac.uk/10.3390/land10121391
Chicago/Turabian StyleBattisti, Fabrizio, and Orazio Campo. 2021. "The Assessment of Density Bonus in Building Renovation Interventions. The Case of the City of Florence in Italy" Land 10, no. 12: 1391. https://0-doi-org.brum.beds.ac.uk/10.3390/land10121391
Note that from the first issue of 2016, this journal uses article numbers instead of page numbers. See further details here.