
The Sanjiangyuan Nature Reserve Is Partially Effective in Mitigating Human Pressures


1
School of Public Administration, Nanjing Agricultural University, Nanjing 210095, China
2
School of Public Administration, China University of Geosciences, Wuhan 430074, China
*
Author to whom correspondence should be addressed.
Land 2022, 11(1), 43; https://0-doi-org.brum.beds.ac.uk/10.3390/land11010043
Submission received: 25 November 2021
/
Revised: 23 December 2021
/
Accepted: 24 December 2021
/
Published: 28 December 2021
(This article belongs to the Special Issue Land Use Change and Anthropogenic Disturbances: Relationships, Interactions, and Management)
Abstract
:Protected areas play significant roles in protecting biodiversity by mitigating human activities. As an indicator for human activities, the human footprint (HF) can be used to assess the effectiveness of protected areas. We developed a HF dataset for the Sanjiangyuan region in China after localizing the global HF model. Then we used it to assess the effectiveness of Sanjiangyuan nature reserve (SNR) in mitigating human pressures. Our results suggest that the HF value for the Sanjiangyuan region was generally low from 1995 to 2015, with a fluctuating increasing trend. The SNR is partially effective in mitigating human pressures. For 2005–2010, the HF values decreased both within and outside the reserve with more decreases for the outside. For the three functional zones of the SNR, our results show that the HF values decreased during 2005–2010 for all of them, with the largest decrease in the experimental area, and increased during 2010–2015, with the lowest increase in the core areas. The results we obtained are consistent with ecological indicator-based assessments. It is a challenge for the government to balance conservation and development in establishing Sanjiangyuan National Park.
1. Introduction
Human activities have greatly intensified since the Industrial Revolution, resulting in worldwide environmental degradation and biodiversity loss [1,2]. Many countries have established a series of protected areas to reduce human pressure on the ecosystem and protect biodiversity. Protected areas cover roughly 15.4% of Earth’s surface [3]; however, they have shortfalls in effectiveness [4]. There are 20 “Aichi Biodiversity Targets” set by the United Nations Conference on Biological Diversity in 2010, including “Address the underlying causes of biodiversity loss by mainstreaming biodiversity across government and society” and “Reduce the direct pressures on biodiversity and promote sustainable use” (https://www.cbd.int/sp/targets accessed on 15 December 2021). By 2020, however, none of them have been fully achieved, and only six goals have been partially achieved [5].
It has become increasingly important to assess whether protected areas are effective. At the global scale, the effectiveness of protected areas in implementing biodiversity measures [6], reducing forest loss [7], and protecting natural land cover [8] was assessed. At the national scale, some scholars evaluated the conservation effectiveness for amphibian biodiversity [9] and carnivores [10]. Moreover, some evaluation studies are also available at the regional scale [11,12,13]. These studies primarily focus on changes of species or ecosystem services, which has provided a good foundation for further studies. However, assessing changes in biodiversity and ecosystem services is not only time- and cost-consuming. It also requires integrating a great number of biotic and abiotic variables that are not fully comprehended and differ from period to period and area to area. As the targets of protected areas were achieved by reducing human activity, evaluating the change in human activity intensity should also be feasible. It is accurate and efficient because the human pressure data, including population density and land use intensity, is easier to obtain than biodiversity and ecosystem services data. Some studies have attempted to assess the effectiveness of protected areas from the perspective of human activity, including land use [14,15], roads [16], grazing [17,18], and energy consumption such as nighttime lights [19,20]. Nevertheless, most of them have investigated only one or two human impact factors, thus resulting in insufficient assessments.
Some researchers [21,22] mapped human footprint (HF), measuring human activities from multiple perspectives. It is a map that shows the impacts of human activity on the planet’s surface [21]. It measures the cumulative disturbance intensity of some categories of human pressures on ecosystems, including built environments, crop and pasture lands, population density, nighttime lights, roads and railways, and navigable waterways [23]. By contrast with collecting biodiversity and ecosystem services data, it is easier to obtain these satellite-based human pressure data. So HF has been widely adopted in studies at various scales. Specifically, at the regional scale, it has been used to evaluate the effectiveness of nature reserves in Tibet [24], the Hengduan Mountains region [25], and south Ecuador [26]. It has been mapped for Iran [27] and Argentina [28] at the national scale. At the global scale, it has been used to evaluate the effectiveness of global terrestrial nature reserves for different years [22,29,30]. These studies have shown that HF is increasingly being used to evaluate the effectiveness of nature reserves [27].
As the Yellow River, Yangtze River, and Mekong River source, the Sanjiangyuan region is rich in biodiversity and ecosystem services. China and the Chinese government have designated a nature reserve in this area known as Sanjiangyuan nature reserve (SNR), one of the largest in China situated in the Qinghai-Tibet plateau. In terms of biodiversity and ecosystem services, evaluating the SNR’s effectiveness is challenging because it is nearly impossible to collect data covering a long time on this remote plateau with a harsh natural environment. A more flexible way to assess its effectiveness is measuring HF and its changes after SNR is established.
Therefore, we developed an HF dataset for the Sanjiangyuan region in this study. We then revealed its spatial and temporal changes in the SNR from 1995 to 2015 to assess its effectiveness in mitigating human pressures. We also compared our results with previous studies in the Discussion section. Finally, some suggestions were formulated with regard to balancing conservation and development.
2. Materials and Methods
2.1. Study Area
The Sanjiangyuan region lies between 89°24′–102°23′ N and 31°39′–36°16′ E. It is located in the Qinghai-Tibet Plateau of China (Figure 1). It is one of the most biodiverse regions and provides many ecosystem services, such as water conservation [31]. The Qinghai provincial government established the Sanjiangyuan Provincial Nature Reserve in 2000, and it was later approved as a national nature reserve in 2003. Since 2005, the government has implemented a series of ecological measures, such as the Ecological Conservation and Construction Project [31]. The SNR covers an area of 152,000 km2, accounting for 41.9% of the Sanjiangyuan region and 21.1% of Qinghai Province. It is divided into three functional zones: the core, buffer, and experimental areas, which cover 20.5%, 25.8%, and 53.7% of the SNR, respectively.
Core areas are strictly protected lands. They are designated to protect typical natural ecosystems, fostering growth and reproduction of targeted wildlife, plants and organisms and their habitats by separating these areas from human activities. Buffer areas are important protected lands. They are outside core areas to assist conservation goals (i.e., address fragmentation), thus controlling the impact of threatening factors/processes while restoring slightly degraded ecosystems. Finally, experimental areas are protected lands in which consideration is given to both protection and utilization. They are outside core and buffer areas and are intended to provide natural defenses for core and buffer areas, thereby assisting with the recovery of degraded ecosystems within them.
2.2. HF Mapping
According to the global HF model [23] and taking the actual situation of SNR into account, we selected five categories of human pressures, i.e., population density, grazing intensity, land use intensity, roads, and nighttime lights to map HF for the Sanjiangyuan area. These pressures were quantified by their disturbance degree to the ecosystem and then summed cumulatively. The spatial resolution of HF was determined to be 1 km, based on all available datasets of human pressures.
2.2.1. Population Density
Generally, the higher the population density, the greater the demand for ecosystem products and services, as well as the greater the impact on the environment. Thus, we used population density as a category of human pressure, which is also included in global- [21,23] and regional-scale [24,27,32] models. Previous studies revealed that the World Pop dataset [33] (https://www.worldpop.org/ accessed on 19 December 2019) provides better accuracy in high attitude areas than other datasets. So we used it in this study, which has been updated annually since 2000, with a spatial resolution of 100 m. The data for 1995 was replaced with data for 2000 because the study period ran from 1995 to 2015. We resampled the data to 1 km.
The population in the Sanjiangyuan area is not evenly distributed, and the population in different areas varies widely. Therefore, processing with a logarithm can better represent the variability of the data without changing the nature of the data and the correlation relationship. According to the global model method [23,27], grids with population densities greater than 1000 people/km2 are assigned a score of 10, and grids with population densities less than or equal to 1000 people /km2 are assigned by Equation (1) to calculate the population pressure score to the ecosystem.
where popd(i,t) is the value of population pressure intensity of grid i for year t, and popden(i,t) is the population density of grid i for year t.
2.2.2. Land Use Activity
Land use is the most direct manifestation of human activity [34]. These land use activities have a significant impact on the environment, so we included land use in our HF model. Land use data were obtained from the Resources and Environment Science and Data Center, Chinese Academy of Science (http://www.resdc.cn/Default.aspx accessed on 15 March 2019). It covers the years from 1995 to 2015 at a spatial resolution of 1 km.
Different land use activities denote different levels of disturbance to the environment. Therefore, different land use types were used to characterize the various land use activities. Based on relevant studies [24,35] and the actual situation of the Sanjiangyuan region, land use activities were quantified and scored from 0 for the least disturbed to 10 for the most disturbed (Table 1). The grassland ecosystem is strongly perturbed by grazing because the Sanjiangyuan region is a traditional grazing area of China. However, it is difficult to distinguish whether grassland is used for grazing or not using satellite-based land use/cover data. Therefore, grazing intensity (sheep units per unit area) was used to denote the disturbance intensity of grazing on grassland ecosystems, and in this section a value of 0 was temporarily assigned for grassland.
2.2.3. Grazing Intensity
The Sanjiangyuan region lies in the hinterland of the Qinghai-Tibet Plateau, where grazing has become an essential source of income for residents. Grazing intensity was used to describe grazing that disturbs grassland ecosystems. It is measured by determining the number of livestock per unit grassland area over a particular period. The China Ecosystem Assessment and Ecological Security Database (http://www.ecosystem.csdb.cn/index.jsp accessed on 17 March 2019) provides county-level grazing intensity data for 2000 and 2010. We assessed human activity intensity at a 1 km scale, so the number of livestock in each county must be spatialized. Therefore, we used the net primary productivity of China in 2000 and 2010 (download from http://www.resdc.cn/Default.aspx accessed on 17 March 2019) as weights to calculate the spatial distribution of grazing intensity in the Sanjiangyuan region for 2000 and 2010. Based on studies related to regional scale conversion [36,37], we used Equation (2) to calculate its pressure score to the ecosystem.
where is the normalized grazing density of grid for year , ranging from 0 to 10. is the grazing density of grid for year , which is the rasterized county-level data. is a function that means to round a value.
2.2.4. Nighttime Lights
Nighttime lights, which were taken from National Oceanic and Atmospheric Administration (NOAA) (https://www.ngdc.noaa.gov/eog/dmsp.html accessed on 19 March 2019), indicate how much electrical energy is consumed. Its spatial resolution is 1 km, and the years are from 1992 to 2013. The data in 2015 was replaced by the data in 2013, due to the study period being from 1995–2015. There were obvious clustering characteristics in the nighttime lights data. So we used natural breaks to identify the classification intervals, then grouped the similar values appropriately to maximize the differences between the groups [38]. Specifically, data with digital number (DN) values ≤5 are assigned as 0, and data with 5 < DN values ≤ 10 are assigned as 1 until the data are assigned the maximum value of 10.
2.2.5. Roads
Road construction can disturb the ecosystem, leading to landscape fragmentation and biodiversity reduction. Different levels of roads contribute different degrees of disturbance to the ecosystem. Therefore, we used roads as the category of human pressure and assigned different scores for different levels of roads. Gao et al. [39] digitized the distribution of traffic networks, which provides a better understanding of the evolution of the traffic network in the Qinghai-Tibet Plateau from 1976 to 2016. It was used in this study to establish buffer zones and assign pressure values to the ecosystem (Table 2).
2.2.6. Summation of Influence Scores
Single pressures when in isolation can be negligible, but when they accumulate from several development projects co-occurring in a region, dire outcomes for biodiversity and ecosystems can result [40]. We calculated the cumulative human pressures on terrestrial lands using the well-established HF model [23], which has been verified and applied at various scales [24,32]. Pressures are not intended to be mutually exclusive, and many will co-occur in the same location [41]. The above-mentioned five categories of human pressures were then spatially aggregated to a cumulative score using Equation (3).
where is the HF value of grid for year t. , , , and are the disturbance intensities of population density, land use, roads construction, and energy consumption to the ecosystem in grid for year , respectively. The HF score ranges between 0 and 50 due to each human pressure ranging from 0 to 10.
2.3. Assessment of the Effectiveness in Reducing Human Pressures
We compared the changes of the HF value within and outside the SNR for periods 1995–2005 and 2005–2015. The year 2005 was taken as a demarcation point because effective conservation measures were not taken for the SNR until 2005. Equation (4) is as follows.
where is the change of the HF value of raster for period –.
In addition to the SNR, there are Hoh Xil and Lombo Reserves in the Sanjiangyuan region. The HF in these reserves is also affected by their respective conservation measures, so we removed these nature reserves when mapping the HF outside the SNR. Furthermore, different functional zones of nature reserves also have different management requirements for human activities. Therefore, we further analyzed the changes of HF in the three functional zones of the SNR from 1995 to 2015.
2.4. Validation Methods
We evaluated the accuracy of the HF values by comparing them with the cumulative human modification (HM) map ranging from 0.00 to 1.00 [42], which is a comprehensive spatial assessment of the impact of 13 human stressors across all terrestrial lands using the fuzzy algebraic sum algorithm. Our HF values were summed together per 1 km2 cell to produce a cumulative value that ranged from 0 to 50. Nevertheless, the fuzzy algebraic sum algorithm assumes that multiple human stressors tend to be accumulative but non-additive, which is different from our mapping method for HF.
The year of HM map is 2016. Therefore, we selected the HF map of the Sanjiangyuan region in 2015 for comparison. And the HF map was normalized to 0–1 for comparison.
Two statistics were used to determine HF performance, i.e., root mean squared error (RMSE) [43] and the Cohen kappa statistic of agreement [44]. When calculating the kappa statistic, ±20% was seen as agreement by Venter et al. [23] at the global scale, and we used ±10% as agreement at the regional scale, which is a higher evaluation standard. So the HF map was considered as a match to the HM map if the gap between them was within 10%. Then 100 points were randomly selected to calculate the kappa coefficients.
3. Results
3.1. Spatio-Temporal Changes of the HF for 1995–2015 in the Sanjiangyuan Region
The intensity of human activities in the Sanjiangyuan region was generally low from 1995 to 2015, with a fluctuating increasing trend. The average HF value in the Sanjiangyuan region was only 1.0307 in 20 years (Figure 2). The HF value was considerable in the eastern parts of the Sanjiangyuan region and low in its western parts.
The average HF value increased from 0.9885 in 1995 to 1.0161 in 2005, indicating human activity intensity was increasing for the Sanjiangyuan region. For 2005–2010, the average HF value decreased from 1.0161 to 0.9697. After that, it increased to 1.1857 in 2015. Spatially, the HF value is high in the east and south of the Sanjiangyuan region and low in the west of the region. Collectively, the spatial pattern of HF remained stable for the whole study period (Figure 2).
There was an increasing trend for population density, land use intensity, nighttime lights, and roads from 1995 to 2015. In particular, the pressure values of roads and population density increased by 0.0973 and 0.1612, respectively, over 20 years (Table 3). Nevertheless, grazing intensity showed a decreasing trend.
3.2. Effectiveness of the SNR in Mitigating Human Activities
3.2.1. Changes of the HF within and outside the SNR
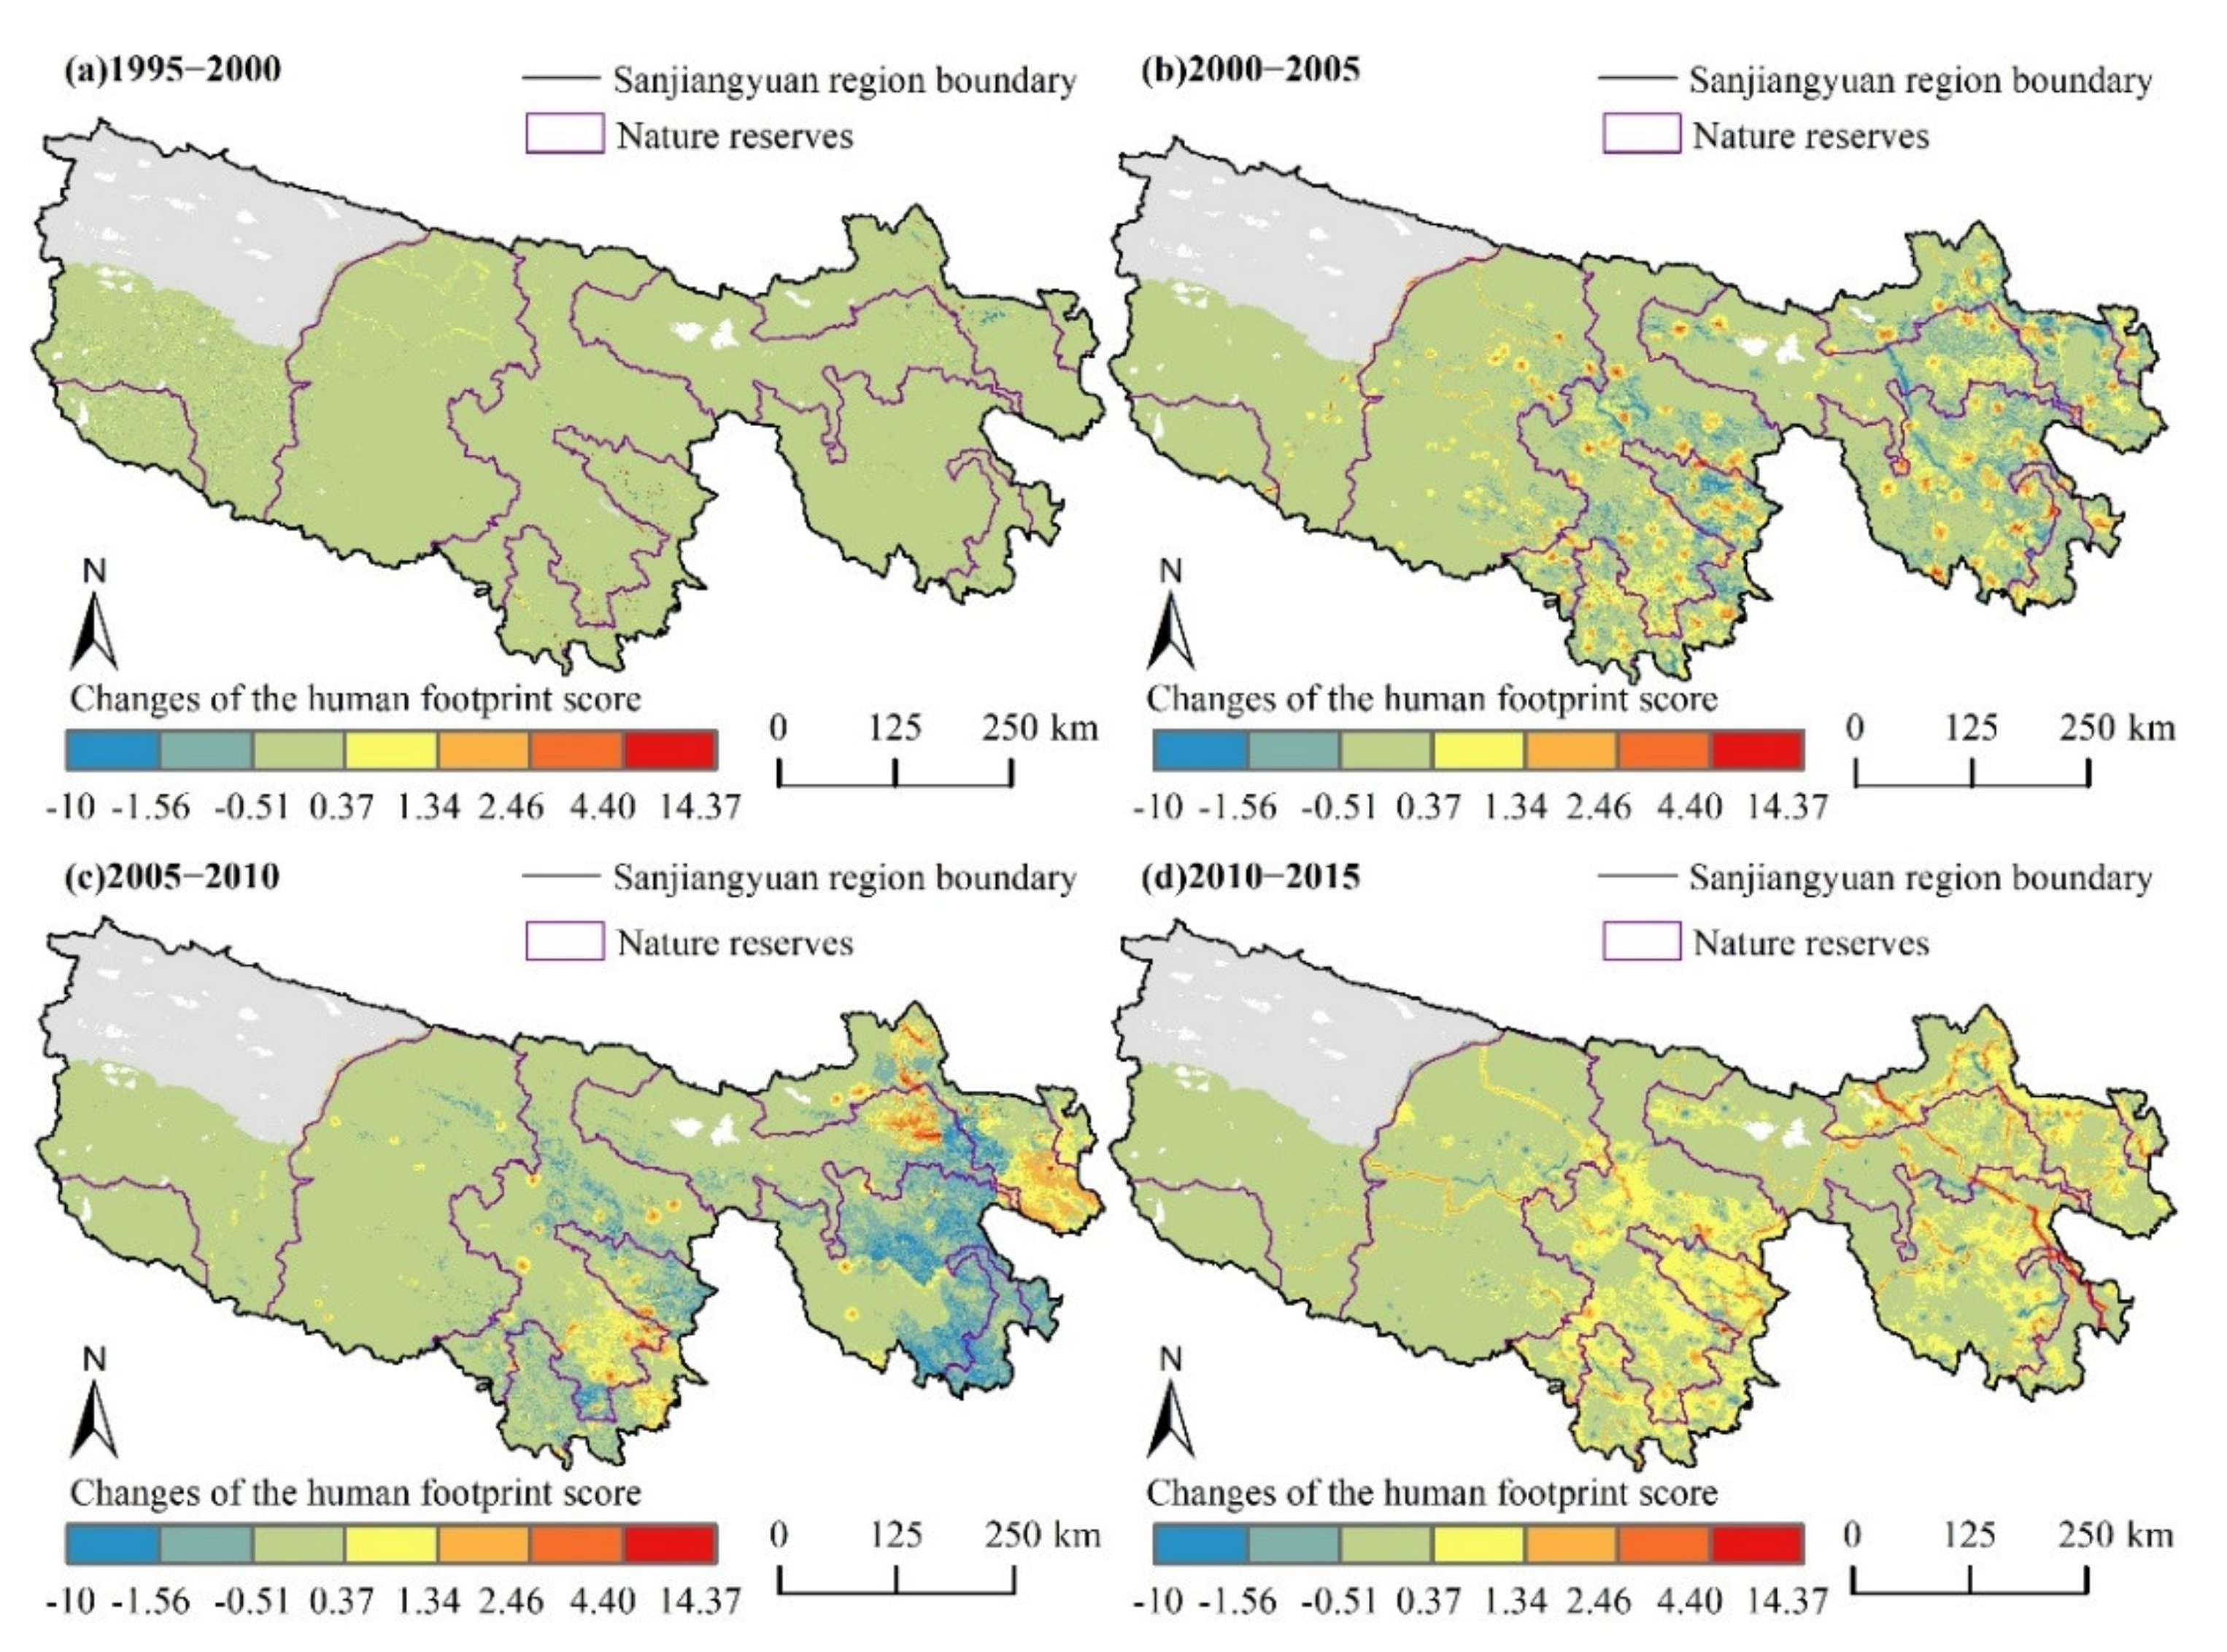
From 1995 to 2005, when there were few ecological measures in the SNR, the increase of HF value inside the SNR was always greater than that outside the area, and the increase occurred mainly in the central and eastern SNR (Figure 3). For 2005–2010, both the inside and outside of the SNR experienced a reduction in HF value, but the reduction was less for the inside than it was for the outside. And the decline was concentrated mainly outside the eastern SNR. From 2010 to 2015, the growth of the HF value inside the SNR was less than that outside the area, and the growth occurred mainly outside the central and eastern SNR (Figure 3).
The effectiveness of the measures in reducing the five categories of human pressures is also partially positive. The changes in population density within the SNR were greater than those outside the SNR until 2010. From 2010 to 2015, the changes in population density within the SNR were lower than those outside the SNR. This phenomenon suggests that controlling the population increase in the reserve didn’t work from 2005 to 2010, and had positive impacts only for 2010–2015 (Table 4).
From 1995 to 2000, the increase of land use intensity in the SNR was higher than that outside the SNR. After 2000, it was always lower in the reserve than outside of it. Encouragingly, the ecological measures reduced the land use intensity within the SNR from 2005 to 2010, but the remarkable changes were not sustained in the latter five years (Table 4). The results show the ecological measures played a positive role in reducing land use intensity from 2005 to 2010, but the role for 2010–2015 was weaker than that for 2005–2010.
The grazing intensity decreased within and outside the SNR for 2005–2010, but the decrease was higher inside the reserve than outside (Table 4). These results suggest that the ecological measures have been successful in reducing grazing disturbance, but there is a lack of more careful management within the reserve.
The increase of roads within the SNR was greater than outside before taking the conservation measures. After taking the measures, the increase of roads within the reserve had become less than outside. However, the human pressure values within the SNR rose from 0.0291 to 0.0789, and those outside the SNR rose from 0.0131 to 0.1008 (Table 4). The changes suggest that the conservation measures have regulated the disturbance of road construction in the SNR, but it didn’t decrease to the original level.
The increase of nighttime lights was more significant within the SNR than outside from 1995 to 2005. After 2005, the increase of nighttime lights in the SNR was always less than outside (Table 4), which indicates that the conservation measures have effectively regulated the disturbance degree of energy consumption from 2005 to 2015.
3.2.2. Changes of the HF in Each Functional Zone of the SNR
For 1995–2000, when there were no investments in the natural capital of the SNR, the HF values increased mainly in the experimental areas, then in the buffer areas, and finally in the core areas. After entering the 21st century, the growth of HF values was largest in the core areas, then in the buffer areas, and lastly in the experimental areas for the first five years. Encouragingly, there was a decrease in the HF values for the three functional zones from 2005 to 2010 since the conservation measures have been taken. The experimental areas have the largest reduction, followed by the core areas, and the buffer areas have the least. From 2010 to 2015, the growth of HF values was lowest in the core areas, followed by the buffer areas, and the experimental areas were highest (Table 5). The changes show that the conservation measures in the three functional zones were partially effective.
The land use intensity within the core areas had a maximum decrease of 0.0006 for 2005–2010, then increased slightly from 2010 to 2015 (Table 5). However, it still decreased a lot compared to the pre–2005 period. The results suggest that the measures mitigated land use intensity more effectively for 2005–2010 than for 2010–2015. Grazing was controlled well, with its pressure on the ecosystem decreasing by 0.0225 during 2005–2010. Unfortunately, the SNR failed to reduce the population density, road construction, and energy consumption, with their pressures even increasing more than those in the pre–2005 period.
In the buffer areas, grazing was effectively regulated through ecological measures from 2005 to 2010, with the pressure to the ecosystem decreasing by 0.0384 (Table 5). However, both population density and nighttime lights increased, rising to 0.0377 and 0.0002 for 2005–2010. And they were 0.1147 and 0.0001 for 2010–2015, which decreased compared to those for 2005–2010. These results indicate that the measures failed to reduce population density and energy consumption. A similar situation can be found for land use and road construction factors.
In the experimental areas, grazing was effectively mitigated from 2005 to 2010, with its pressure on the ecosystem decreasing by 0.1033 (Table 5). The pressure value of land use intensity decreased by 0.0002 from 2005 to 2010, but it increased by 0.0006 from 2010 to 2015. This change indicates that the conservation measures only reduced land use intensity for 2005–2010. Before implementing the conservation measures, the pressure values for population density and nighttime lights continued to rise by 0.0426 and 0.0012 from 2005 to 2010. Nevertheless, they decreased by 0.1541 and 0.0002 from 2010 to 2015, which indicates that the conservation measures only reduced population density and energy consumption for 2010–2015. Furthermore, the conservation measures were ineffective in regulating roads, as the pressure score for roads increased significantly from 2010 to 2015.
4. Discussion
4.1. Validation for the HF Model
Two points with null values were removed among the 100 randomly selected points, so the valid points were 98. We found a strong agreement between the HF and the HM. The RMSE for the 98 validation points was 0.0562 on a normalized 0–1 scale. The Kappa statistic was 0.859 (p < 0.01), also indicating strong agreement between the HF and the HM.
4.2. Comparisons with Global Datasets and Other Assessments
The global HF dataset [23] is currently the most representative human activity dataset. Therefore, we compared our dataset with the global dataset for the Sanjiangyuan region (Figure 4).
There are wide differences between the two datasets (Figure 4). The increase rate was −1.91% in our dataset, whereas it was 54.85% in the global dataset (Figure 4). In contrast, we included more land use types, including buildings, paved land, urban parks, rural settlements, dryland, and other woodlands, to denote human activities than the global dataset. Additionally, we calculated pressure values for five types of roads (expressways, railways, national-level highways, provincial-level roads, and county-level roads), while the global dataset calculated only two types (roads and railways). Thirdly, we selected more native categories of human pressures than those in the global dataset. Specifically, there are few navigable waterways in the Sanjiangyuan region, so they are excluded from our dataset. In addition, the Sanjiangyuan region has frequent grazing activities as it is a traditional pastoral area. Thus it was included in our dataset, and the number of livestock per unit grassland area was used in this study to denote grazing intensity. However, the global dataset considered pasture lands just using remotely sensed data, which is unreliable for the Sanjiangyuan region because it is difficult to distinguish whether the grasslands have been grazed or not in satellite images. Finally, the great uncertainty of the cropland layer used in the global dataset explains the vast differences between our results and the global datasets [36]. Therefore, our dataset is more accurate for the Sanjiangyuan region, which is more applicable for regional conservation planning [45].
We also compared our results with some other assessments. From the 1990s to 2004, conversion of land cover in the SNR was from a high to low ecological level, and it was from a low to high ecological level in 2004–2008 [46]. Our study shows the consistent conclusions that the HF values in the SNR increased gradually from 1995 to 2005, then decreased from 2005 to 2010. Yi et al. [47] found the average values of human digital footprints were low on the Tibetan Plateau, which still coincides with our results. Therefore, our assessment for effectiveness is reasonable and credible.
The assessments based on biodiversity and ecosystem services usually require many indicators, involving thousands of data and complex processing steps. These data are usually obtained from ground monitoring and field observations, which are costly and time-consuming. As a comparison, it is relatively easy and fast to collect human impact factors and then map the HF for the effectiveness assessment of protected areas. We recommend that this method be extended to more evaluations of the effectiveness of ecological protection projects.
4.3. Analyses of Differences in Conservation Effectiveness
Our results show that the conservation measures of the SNR succeeded partially in mitigating human pressures. The measures for 2005–2010 were effective, with the HF values decreasing both within and outside the reserve, although the HF values decreased more outside the reserve than inside. The measures during 2010–2015 were still partially effective considering the different conservation requirements of functional zones. The situation is similar to the five categories of human pressures, which is partially effective for some categories.
Grazing was mitigated most obviously in 2005–2010. In 2003, Qinghai Province started implementing a large-scale herding and grassland restoration project in the Sanjiangyuan region. In 2005, the Sanjiangyuan Ecological Conservation and Construction Project was officially launched. Due to these projects [46], the number of livestock in the reserve is significantly reduced. But compared with the decrease of human pressure within and outside the SNR, there is a lack of more careful management within the reserve. Population and road construction were effectively regulated in the SNR from 2010 to 2015, but their pressures on the ecosystem didn’t reduce to the original level. These are mainly due to some sites of the ecological migration project for relocation are still within the reserve [48], and the road network has many routes within the reserve [49].
Land use and energy consumption were effectively mitigated for 2005–2015. Ecological Conservation and Construction Project has contributed to vegetation growing [50] and improving the ecological cover [51]. The measures of the project, such as ecological mountain closure (sand) reforestation, artificial afforestation, and existing forest management, helped to mitigate the pressure of land use in the SNR. Energy consumption was mitigated mainly because of government actions. The government established regulations that prioritized protection and strictly followed it [52]. The regulation said that no production facilities should be constructed within the core and buffer areas; within the experimental areas, no production facilities that pollute the environment, destroy resources, or destroy the landscape shall be constructed.
The Sanjiangyuan national park was established in 2021. Official plans for the national park system clearly indicate that national parks will be set up to achieve a combination of ecological protection and sustainable development [53]. Our study found that the effectiveness of the SNR was partially effective. It is a challenge for the local government to learn from the conservation effectiveness of the past decades to improve the subsequent management measures and find a balance between development and conservation.
4.4. Limitations and Future Works
While we developed an HF dataset for the Sanjiangyuan region, limitations existed. The population density data in the Sanjiangyuan region for 1995 were replaced with those of 2000 because the data for 1995 was lacking. As such, roads data for 1995 was replaced with those of 1996, grazing intensity data for 1995 was replaced with those of 2000. Thus the HF for 1995 actually showed that in the early 2000s. We hope to obtain more accurate data to fill up this gap. In addition, different measures at different scales will have different efficiency. But the available information about the ecological measures mainly focuses on the whole SNR and less on the different functional zones since the SNR was established years ago. We also hope to obtain more ecological measures about different functional zones in the future. Finally, more human pressures can be included in the HF dataset. Nature reserves within the Sanjiangyuan region are at risk of accidental degradation due to the rapid development of tourism [54]; and other human activities are already exogenously polluting the lakes in the Sanjiangyuan region [55]. They are lacking in this study because of the difficulty of quantification.
One of the reasons for the slow progress on the Aichi Biodiversity Targets is that the well-being of people, indigenous peoples, and local communities in less developed regions of the world depends on biodiversity, but their production activities and consumption patterns are unsustainable [5]. Therefore, reconciling these biodiversity targets with socioeconomic needs remains a major challenge in implementing conservation policies [56]. Therefore, the HF could be applied in the future with more consideration of the socioeconomic factors that lead to its increase [57], which could help governments develop more rational policies to address the population’s poverty due to ecological conservation.
Our study shows that it is highly feasible to use the HF to assess the effectiveness of nature reserves in China, and the evaluation results are reasonable and credible. Although there are co-linearity problems in the five categories of human pressures, the cumulative HF value doesn’t change the general trend of each human pressure. It was proven reliable through Venter et al.’s robustness tests [23]. And it has been used to evaluate the effectiveness of conservation for some protected lands [24,26,27,32]. Some scholars have recognized the limited accuracy of the global human dataset at the regional scales [45], so it is necessary to map the HF for their regions [27]. Considering the vast area of China and the easy operation of HF, we suggest that it can be used to assess the effectiveness of all protected areas in the whole of China and other regions of the world.
5. Conclusions
After the localization of the global HF model, we developed a HF dataset for the Sanjiangyuan region and used it to assess the effectiveness of the SNR in mitigating human pressures from two perspectives: within and outside the SNR, and in functional areas. The main findings are as follows.
The SNR has achieved positive results in partially mitigating human pressures. From 1995 to 2005, before taking the ecological measures in the SNR, the increase of HF value inside the SNR was always greater than outside. For 2005–2010, both inside and outside of the SNR experienced a reduction in HF value, but the reduction was less for the inside than outside. From 2010 to 2015, the growth of HF value in the SNR was less than outside of it. The results are similar to the five categories of human pressures. The ecological measures in the three functional zones are also partially effective. For 1995–2000, when there were no investments in natural capital, the HF values increased mostly in the experimental areas, then in the buffer areas, and finally in the core areas. From 2005 to 2010, the human activities in the three functional zones were effectively reduced, but no more specific control measures were taken based on the different conservation requirements of each functional zone. From 2010 to 2015, the measures partially mitigated the human pressure considering the different conservation requirements of functional zones.
It is highly feasible to use the HF to assess the effectiveness of nature reserves. It has been a challenge for the local government to balance ecological conservation and economic development since the Sanjiangyuan National Park was established.
Author Contributions
Conceptualization, S.L.; methodology, S.L. and L.T.; software, S.L.; validation, S.L. and L.T.; formal analysis, L.T. and S.L.; investigation, L.T.; resources, S.L. and G.G.; data curation, L.T.; writing—original draft preparation, L.T.; writing—review and editing, S.L. and G.G.; visualization, L.T.; supervision, S.L., G.G. and L.T.; project administration, S.L. and G.G.; funding acquisition, G.G. and S.L. All authors have read and agreed to the published version of the manuscript.
Funding
This research was supported by the National Natural Science Foundation of China, grant number 41971245.
Institutional Review Board Statement
Not applicable.
Informed Consent Statement
Not applicable.
Data Availability Statement
Data are contained within the article.
Acknowledgments
The authors are particularly grateful to all researchers and institutes for providing data for this study. The authors are also very grateful to the editors and reviewers for their comments and suggestions on improving this study.
Conflicts of Interest
The authors declare no conflict of interest.
References
- Dirzo, R.; Raven, P.H. Global state of biodiversity and loss. Annu. Rev. Env. Resour. 2003, 28, 137–167. [Google Scholar] [CrossRef] [Green Version]
- Motesharrei, S.; Rivas, J.; Kalnay, E.; Asrar, G.R.; Busalacchi, A.J.; Cahalan, R.F.; Cane, M.A.; Colwell, R.R.; Feng, K.S.; Franklin, R.S.; et al. Modeling sustainability: Population, inequality, consumption, and bidirectional coupling of the Earth and Human Systems. Natl. Sci. Rev. 2016, 3, 470–494. [Google Scholar] [CrossRef] [Green Version]
- Xu, W.; Xiao, Y.; Zhang, J.; Yang, W.; Zhang, L.; Hull, V.; Wang, Z.; Zheng, H.; Liu, J.; Polasky, S.; et al. Strengthening protected areas for biodiversity and ecosystem services in China. Proc. Natl. Acad. Sci. USA 2017, 114, 1601–1606. [Google Scholar] [CrossRef] [Green Version]
- Watson, J.E.M.; Dudley, N.; Segan, D.B.; Hockings, M. The performance and potential of protected areas. Nature 2014, 515, 67–73. [Google Scholar] [CrossRef]
- Secretariat of the Convention on Biological Diversity. Global Biodiversity Outlook 5; World Trade Centre: Montreal, QC, Canada, 2020; pp. 5–19. [Google Scholar]
- Gray, C.L.; Hill, S.; Newbold, T.; Hudson, L.N.; Börger, L.; Contu, S.; Hoskins, A.J.; Ferrier, S.; Purvis, A.; Scharlemann, J. Local biodiversity is higher inside than outside terrestrial protected areas worldwide. Nat. Commun. 2016, 7, 12306. [Google Scholar] [CrossRef] [PubMed] [Green Version]
- Leberger, R.; Rosa, I.M.D.; Guerra, C.A.; Wolf, F.; Pereira, H.M. Global patterns of forest loss across IUCN categories of protected areas. Biol. Conserv. 2020, 241, 108299. [Google Scholar] [CrossRef]
- Joppa, L.N.; Pfaff, A. Global protected area impacts. Proc. R. Soc. 2011, 278, 1633–1638. [Google Scholar] [CrossRef] [Green Version]
- Chen, Y.; Zhang, J.; Jiang, J.; Nielsen, S.E.; He, F. Assessing the effectiveness of China’s protected areas to conserve current and future amphibian diversity. Divers. Distrib. 2017, 23, 146–157. [Google Scholar] [CrossRef]
- Terraube, J.; Van Doninck, J.; Helle, P.; Cabeza, M. Assessing the effectiveness of a national protected area network for carnivore conservation. Nat. Commun. 2020, 11, 2957. [Google Scholar] [CrossRef] [PubMed]
- Tammeleht, E.; Kull, A.; Parna, K. Assessing the importance of protected areas in human-dominated lowland for brown bear (Ursus arctos) winter denning. Mammal Res. 2020, 65, 105–115. [Google Scholar] [CrossRef]
- Jordaan, M.S.; Chakona, A.; van der Colff, D. Protected Areas and Endemic Freshwater Fishes of the Cape Fold Ecoregion: Missing the Boat for Fish Conservation? Front. Environ. Sci. 2020, 8, 502042. [Google Scholar] [CrossRef]
- Zeng, J.; Chen, T.; Yao, X.; Chen, W. Do Protected Areas Improve Ecosystem Services? A Case Study of Hoh Xil Nature Reserve in Qinghai-Tibetan Plateau. Remote Sens. 2020, 12, 471. [Google Scholar] [CrossRef] [Green Version]
- Benavidez-Silva, C.; Jensen, M.; Pliscoff, P. Future Scenarios for Land Use in Chile: Identifying Drivers of Change and Impacts over Protected Area System. Land 2021, 10, 408. [Google Scholar] [CrossRef]
- Vukomanovic, J.; Singh, K.K.; Vogler, J.B.; Meentemeyer, R.K. Protection status and proximity to public-private boundaries influence land use intensification near US parks and protected areas. Conserv. Sci. Pract. 2020, 2, e190. [Google Scholar]
- Poor, E.E.; Jati, V.I.M.; Imron, M.A.; Kelly, M.J. The road to deforestation: Edge effects in an endemic ecosystem in Sumatra, Indonesia. PLoS ONE 2019, 14, e0217540. [Google Scholar]
- Broder, L.; Tatin, L.; Danielczak, A.; Seibel, T.; Hochkirch, A. Intensive grazing as a threat in protected areas: The need for adaptive management to protect the Critically Endangered Crau plain grasshopper Prionotropis rhodanica. Oryx 2019, 53, 239–246. [Google Scholar] [CrossRef] [Green Version]
- Prowse, T.A.A.; O’Connor, P.J.; Collard, S.J.; Rogers, D.J. Eating away at protected areas: Total grazing pressure is undermining public land conservation. Glob. Ecol. Conserv. 2019, 20, e00754. [Google Scholar] [CrossRef]
- Andrade-Nunez, M.J.; Aide, T.M. Using nighttime lights to assess infrastructure expansion within and around protected areas in South America. Environ. Res. Commun. 2020, 2, 021002. [Google Scholar] [CrossRef]
- Li, G.Y.; Gao, J.X.; Li, L.Z.; Hou, P. Human pressure dynamics in protected areas of China based on nighttime light. Glob. Ecol. Conser. 2020, 24, e01222. [Google Scholar] [CrossRef]
- Sanderson, E.W.; Jaiteh, M.; Levy, M.A.; Redford, K.H.; Wannebo, A.V.; Woolmer, G. The Human Footprint and the Last of the Wild. BioScience 2002, 52, 891–904. [Google Scholar] [CrossRef]
- Venter, O.; Sanderson, E.W.; Magrach, A.; Allan, J.R.; Beher, J.; Jones, K.R.; Possingham, H.P.; Laurance, W.F.; Wood, P.; Fekete, B.M.; et al. Global terrestrial Human Footprint maps for 1993 and 2009. Sci. Data 2016, 3, 160067. [Google Scholar] [CrossRef] [Green Version]
- Venter, O.; Sanderson, E.W.; Magrach, A.; Allan, J.R.; Beher, J.; Jones, K.R.; Possingham, H.P.; Laurance, W.F.; Wood, P.; Fekete, B.M.; et al. Sixteen years of change in the global terrestrial human footprint and implications for biodiversity conservation. Nat. Commun 2016, 7, 12558. [Google Scholar] [CrossRef] [PubMed] [Green Version]
- Li, S.; Wu, J.; Gong, J.; Li, S. Human footprint in Tibet: Assessing the spatial layout and effectiveness of nature reserves. Sci. Total Environ. 2018, 621, 18–29. [Google Scholar] [CrossRef] [PubMed]
- Yin, L.; Dai, E.F.; Zheng, D.; Wang, Y.H.; Ma, L.; Tong, M. Spatio-temporal analysis of the human footprint in the Hengduan Mountain region: Assessing the effectiveness of nature reserves in reducing human impacts. J. Geogr. Sci. 2020, 30, 1140–1154. [Google Scholar] [CrossRef]
- Tapia-Armijos, M.F.; Homeier, J.; Draper Munt, D. Spatio-temporal analysis of the human footprint in South Ecuador: Influence of human pressure on ecosystems and effectiveness of protected areas. Appl. Geogr. 2017, 78, 22–32. [Google Scholar] [CrossRef]
- Karimi, A.; Jones, K. Assessing national human footprint and implications for biodiversity conservation in Iran. Ambio 2020, 49, 1506–1518. [Google Scholar] [CrossRef]
- Martinuzzi, S.; Radeloff, V.C.; Pastur, G.M.; Rosas, Y.M.; Lizarraga, L.; Politi, N.; Rivera, L.; Herrera, A.H.; Silveira, E.M.O.; Olah, A.; et al. Informing forest conservation planning with detailed human footprint data for Argentina. Glob. Ecol. Conserv. 2021, 31, e01787. [Google Scholar] [CrossRef]
- Geldmann, J.; Joppa, L.N.; Burgess, N.D. Mapping change in human pressure globally on land and within protected areas. Conserv. Biol. 2014, 28, 1604–1616. [Google Scholar] [CrossRef]
- Jones, K.R.; Venter, O.; Fuller, R.A.; Allan, J.R.; Maxwell, S.L.; Negret, P.J.; Watson, J.E.M. One-third of global protected land is under intense human pressure. Science 2018, 360, 788–791. [Google Scholar] [CrossRef] [Green Version]
- Zhang, H. Research on Ecological Conservation and Construction Project Planning of Sanjiangyuan in Qinghai Province; Qinghai People’s Press: Xining, China, 2012; p. 1. [Google Scholar]
- Dwiyahreni, A.A.; Fuad, H.A.H.; Muhtar, S.; Soesilo, T.E.B.; Margules, C.; Supriatna, J. Changes in the human footprint in and around Indonesia’s terrestrial national parks between 2012 and 2017. Sci. Rep. UK 2021, 11, 4510. [Google Scholar] [CrossRef]
- Stevens, F.R.; Gaughan, A.E.; Linard, C.; Tatem, A.J. Disaggregating census data for population mapping using random forests with remotely-sensed and ancillary data. PLoS ONE 2015, 10, e0107042. [Google Scholar]
- Lu, X.; Chen, C.; Fu, J.Q. IEEE Spatial-temporal Variation of LUCC in Zhoushan from 1985 to 2015 Using Remote Sensing Images. In Proceedings of the IGARSS 2018—2018 IEEE International Geoscience and Remote Sensing Symposium, Valencia, Spain, 22–27 July 2018; pp. 834–837. [Google Scholar]
- Li, S.; Bing, Z.; Jin, G. Spatially Explicit Mapping of Soil Conservation Service in Monetary Units Due to Land Use/Cover Change for the Three Gorges Reservoir Area, China. Remote Sens. 2019, 11, 468. [Google Scholar] [CrossRef] [Green Version]
- Li, S.C.; Zhang, Y.L.; Wang, Z.F.; Li, L.H. Mapping human influence intensity in the Tibetan Plateau for conservation of ecological service functions. Ecosyst. Serv. 2018, 30, 276–286. [Google Scholar] [CrossRef]
- Hu, J.; Wu, J.; Ma, M.; Nielsen, U.N.; Wang, J.; Du, G. Nematode communities response to long-term grazing disturbance on Tibetan plateau. Eur. J. Soil Biol. 2015, 69, 24–32. [Google Scholar] [CrossRef]
- Yin, X.; Wang, X.; Huang, R.; Gao, M. Response of Landscape Pattern Gradient to Human Activity Intensity in the Three Gorges Reservoir Area of Chongqing. Resour. Environ. Yangtze Basin 2018, 27, 2718–2732. [Google Scholar]
- Gao, X.; Cao, X.; Li, T.; Lv, M. Evolution of accessibility spatial pattern of the Qinghai-Tibet Plateau in 1976–2016. Acta Geogr. Sin. 2019, 74, 1190–1204. [Google Scholar]
- Raiter, K.G.; Possingham, H.P.; Prober, S.M.; Hobbs, R.J. Under the radar: Mitigating enigmatic ecological impacts. Trends Ecol. Evol. 2014, 29, 635–644. [Google Scholar] [CrossRef] [Green Version]
- Williams, B.A.; Venter, O.; Allan, J.R.; Atkinson, S.C.; Rehbein, J.A.; Ward, M.; Di Marco, M.; Grantham, H.S.; Ervin, J.; Goetz, S.J.; et al. Change in Terrestrial Human Footprint Drives Continued Loss of Intact Ecosystems. One Earth 2020, 3, 371–382. [Google Scholar] [CrossRef]
- Kennedy, C.M.; Oakleaf, J.R.; Theobald, D.M.; Baruch-Mordo, S.; Kiesecker, J. Managing the middle: A shift in conservation priorities based on the global human modification gradient. Glob. Chang. Biol. 2019, 25, 811–826. [Google Scholar] [CrossRef]
- Willmott, C.J.; Matsuura, K. Advantages of the mean absolute error (MAE) over the root mean square error (RMSE) in assessing average model performance. Clim. Res. 2005, 30, 79–82. [Google Scholar] [CrossRef]
- Viera, A.J.; Garrett, J.M. Understanding interobserver agreement: The kappa statistic. Fam. Med. 2005, 37, 360–363. [Google Scholar]
- Woolmer, G.; Trombulak, S.C.; Ray, J.C.; Doran, P.J.; Anderson, M.G.; Baldwin, R.F.; Morgan, A.; Sanderson, E.W. Rescaling the Human Footprint: A tool for conservation planning at an ecoregional scale. Landsc. Urban. Plan. 2008, 87, 42–53. [Google Scholar] [CrossRef]
- Shao, Q.; Zhao, Z.; Liu, J.; Fan, J. The characteristics of land cover and macroscopical ecology changes in the source region of three rivers on Qinghai-Tibet Plateau during last 30 years. Geogr. Res. 2010, 29, 1439–1451. [Google Scholar]
- Yi, J.; Du, Y.; Liang, F.; Tu, W.; Qi, W.; Ge, Y. Mapping human’s digital footprints on the Tibetan Plateau from multi-source geospatial big data. Sci. Total Envir. 2020, 711, 134540. [Google Scholar] [CrossRef]
- Liu, H. Research on compensation Mechanism and policy of ecological migration in Sanjiangyuan region. J. S. Cent. Univ. Natl. (Hum. Soc. Sci. Ed.) 2013, 33, 101–105. [Google Scholar]
- Zhu, G.; Zhao, K.; Liu, J.; Yang, F.; Gao, Y.; Lin, J.; Han, D.; Xu, H.; Jiang, J.; Sun, H. Study on Ecological Conflict and Coordination of Highway Network Planning—A Case Study of the Three-River Headwater Region of Qinghai-Tibet Plateau. J. Cap. Norm. Univ. (Nat. Sci. Ed.) 2020, 41, 57–63. [Google Scholar]
- Zhai, X.H.; Liang, X.L.; Yan, C.Z.; Xing, X.G.; Jia, H.W.; Wei, X.X.; Feng, K. Vegetation Dynamic Changes and Their Response to Ecological Engineering in the Sanjiangyuan Region of China. Remote Sens. 2020, 12, 4025. [Google Scholar] [CrossRef]
- Han, S.; Meng, Q.; Liu, H.; Peng, Y.; Han, J.; Jin, S.; Fan, S.; Xin, B.; He, L.; Li, H. Refined land-cover classification mapping using a multi-scale transformation method from remote sensing, unmanned aerial vehicle, and field surveys in Sanjiangyuan National Park, China. J. Appl. Remote Sens. 2021, 15, 014513. [Google Scholar] [CrossRef]
- The State Council. Regulations of the People’s Republic of China on natural reserves. State Counc. Bull. 1994, 12, 991–998. [Google Scholar]
- First National Park Receiving Strong Legal and Financial Support. Available online: http://www.chinadaily.com.cn/china/2017-03/09/content_28485917.htm (accessed on 9 March 2017).
- Chung, M.G.; Pan, T.; Zou, X.T.; Liu, J.G. Complex Interrelationships between Ecosystem Services Supply and Tourism Demand: General Framework and Evidence from the Origin of Three Asian Rivers. Sustainability 2018, 10, 4576. [Google Scholar] [CrossRef] [Green Version]
- Lu, S.J.; Si, J.H.; Hou, C.Y.; Li, Y.S.; Wang, M.M.; Yan, X.X.; Xie, M.; Sun, J.X.; Chen, B.J.; Li, S.S. Spatiotemporal distribution of nitrogen and phosphorus in alpine lakes in the Sanjiangyuan Region of the Tibetan Plateau. Water Sci. Technol. 2017, 76, 396–412. [Google Scholar] [CrossRef] [PubMed]
- Vilar, C.C.; Magris, R.A.; Loyola, R.; Joyeux, J.C. Strengthening the synergies among global biodiversity targets to reconcile conservation and socio-economic demands. Aquat. Conserv. 2020, 30, 497–513. [Google Scholar] [CrossRef]
- Sloan, S.; Sayer, J.A. Forest Resources Assessment of 2015 shows positive global trends but forest loss and degradation persist in poor tropical countries. Forest Ecol. Manag. 2015, 352, 134–145. [Google Scholar] [CrossRef] [Green Version]
Figure 1.
Location of the Sanjiangyuan region and the distribution of SNR and its functional zones (core, buffer, and experimental areas) [3].
Figure 1.
Location of the Sanjiangyuan region and the distribution of SNR and its functional zones (core, buffer, and experimental areas) [3].

Figure 2.
Spatio-temporal distributions of HF in the Sanjiangyuan region from 1995 to 2015.

Figure 3.
Spatio-temporal changes of HF within and outside of the SNR for 1995–2015.

Figure 4.
Comparison of the HF between the global dataset [23] (a1–a3) and this study (b1–b3) for the Sanjiangyuan region. Due to the differences between years of mapping, we compare the global dataset of 1993–2009 with ours of 1995–2010. (a1,a2) are normalized global dataset. (b1,b2) are normalized results from this study. (a3,b3) are the changes in the global dataset and our results.


Table 1.
Land use types and the corresponding human influence scores they represented based on relevant studies [24,35]. The land use data were obtained from Resources and Environment Science and Data Center, Chinese Academy of Science (https://www.resdc.cn/Default.aspx accessed on 15 March 2019).
Table 1.
Land use types and the corresponding human influence scores they represented based on relevant studies [24,35]. The land use data were obtained from Resources and Environment Science and Data Center, Chinese Academy of Science (https://www.resdc.cn/Default.aspx accessed on 15 March 2019).
| Land Use Type | Urban Built-Up | Other Construction Land | Rural Settlements | Dry Land | Other Woodlands | Forest-Land | Stream, Rivers, Reservoir/Ponds | Tidal Flat, Bottomland | Shrubland, WOODLAND | Lakes, Glaciers, and Permanent Snow | Unused Land |
|---|---|---|---|---|---|---|---|---|---|---|---|
| Score | 10 | 9 | 8 | 7 | 2 | 1 | 1 | 1 | 0 | 0 | 0 |
Table 2.
Human influence scores of different road levels to the ecosystem based on the relevant studies [23,24]. Road data were provided by Gao et al. [39].
| Road Type | Buffering Distance | ||
| 0–1 km | 1–2 km | 2–5 km | |
| Expressway | 10 | 6 | 3 |
| Railway | 8 | 4 | 1 |
| National-level highway | 8 | 4 | 2 |
| Provincial-level road | 4 | 2 | 1 |
| County-level road | 2 | 1 | 0 |
Table 3.
The disturbance value of five categories of human pressures to the ecosystem in the Sanjiangyuan area from 1995 to 2015.
Table 3.
The disturbance value of five categories of human pressures to the ecosystem in the Sanjiangyuan area from 1995 to 2015.
| Human Pressures | 1995 | 2000 | 2005 | 2010 | 2015 |
|---|---|---|---|---|---|
| Population density | 0.6150 | 0.6150 | 0.6205 | 0.6406 | 0.7763 |
| Land use intensity | 0.0385 | 0.0436 | 0.0444 | 0.0445 | 0.0456 |
| Grazing intensity | 0.2111 | 0.2111 | 0.2111 | 0.1422 | 0.1422 |
| Roads | 0.1180 | 0.1180 | 0.1370 | 0.1370 | 0.2153 |
| Nighttime lights | 0.0004 | 0.0004 | 0.0004 | 0.0032 | 0.0040 |
Table 4.
Changes of HF values within and outside of the SNR for 1995–2015.
| Human Pressures | Changes in Human Pressure Values | |||||||||
|---|---|---|---|---|---|---|---|---|---|---|
| 1995–2000 | 2000–2005 | 2005–2010 | 2010–2015 | 1995–2015 | ||||||
| within | outside | within | outside | within | outside | within | outside | within | outside | |
| Population density | 0.0000 | 0.0000 | 0.0020 | 0.0042 | 0.0371 | 0.0095 | 0.1323 | 0.1775 | 0.1714 | 0.1912 |
| Land use intensity | 0.0106 | 0.0008 | 0.0004 | 0.0015 | −0.0002 | 0.0005 | 0.0004 | 0.0015 | 0.0112 | 0.0043 |
| Grazing intensity | 0.0000 | 0.0000 | 0.0000 | 0.0000 | −0.0689 | −0.0900 | 0.0000 | 0.0000 | −0.0689 | −0.0900 |
| Roads | 0.0000 | 0.0000 | 0.0291 | 0.0131 | 0.0000 | 0.0000 | 0.0789 | 0.1008 | 0.1080 | 0.1139 |
| Nighttime lights | 0.0000 | 0.0000 | 0.0000 | −0.0002 | 0.0007 | 0.0057 | 0.0002 | 0.0015 | 0.0009 | 0.0070 |
| HF value | 0.0108 | 0.0008 | 0.0313 | 0.0176 | −0.0317 | −0.0746 | 0.2123 | 0.2815 | 0.2227 | 0.2253 |
Table 5.
Changes in the HF values in three functional zones of the SNR from 1995 to 2015.
| Functional Zones | Human Pressures | Changes in Human Pressure Values | ||||
|---|---|---|---|---|---|---|
| 1995–2000 | 2000–2005 | 2005–2010 | 2010–2015 | 1995–2015 | ||
| Core areas | Population density | 0.0000 | 0.0057 | 0.0219 | 0.0973 | 0.1249 |
| Land use intensity | 0.0089 | 0.0011 | −0.0006 | 0.0001 | 0.0095 | |
| Grazing intensity | 0.0000 | 0.0000 | −0.0225 | 0.0000 | −0.0225 | |
| Roads | 0.0000 | 0.0376 | 0.0000 | 0.0617 | 0.0993 | |
| Nighttime lights | 0.0000 | 0.0000 | 0.0000 | 0.0005 | 0.0005 | |
| HF value | 0.0093 | 0.0449 | −0.0015 | 0.1615 | 0.2142 | |
| Buffer areas | Population density | 0.0000 | −0.0014 | 0.0377 | 0.1147 | 0.1510 |
| Land use intensity | 0.0109 | 0.0001 | 0.0003 | 0.0003 | 0.0116 | |
| Grazing intensity | 0.0000 | 0.0000 | −0.0384 | 0.0000 | −0.0384 | |
| Roads | 0.0000 | 0.0312 | 0.0000 | 0.0544 | 0.0856 | |
| Nighttime lights | 0.0000 | 0.0000 | 0.0002 | 0.0001 | 0.0003 | |
| HF value | 0.0109 | 0.0299 | −0.0003 | 0.1695 | 0.2100 | |
| Experimental areas | Population density | 0.0000 | 0.0024 | 0.0426 | 0.1541 | 0.1991 |
| Land use intensity | 0.0111 | 0.0003 | −0.0002 | 0.0006 | 0.0118 | |
| Grazing intensity | 0.0000 | 0.0000 | −0.1033 | 0.0000 | −0.1033 | |
| Roads | 0.0000 | 0.0248 | 0.0000 | 0.0973 | 0.1221 | |
| Nighttime lights | 0.0000 | 0.0000 | 0.0012 | 0.0002 | 0.0014 | |
| HF value | 0.0112 | 0.0268 | −0.0600 | 0.2525 | 0.2305 | |
Publisher’s Note: MDPI stays neutral with regard to jurisdictional claims in published maps and institutional affiliations. |
© 2021 by the authors. Licensee MDPI, Basel, Switzerland. This article is an open access article distributed under the terms and conditions of the Creative Commons Attribution (CC BY) license (https://creativecommons.org/licenses/by/4.0/).
Share and Cite
MDPI and ACS Style
Tan, L.; Guo, G.; Li, S. The Sanjiangyuan Nature Reserve Is Partially Effective in Mitigating Human Pressures. Land 2022, 11, 43. https://0-doi-org.brum.beds.ac.uk/10.3390/land11010043
AMA Style
Tan L, Guo G, Li S. The Sanjiangyuan Nature Reserve Is Partially Effective in Mitigating Human Pressures. Land. 2022; 11(1):43. https://0-doi-org.brum.beds.ac.uk/10.3390/land11010043
Chicago/Turabian StyleTan, Linyi, Guancheng Guo, and Shicheng Li. 2022. "The Sanjiangyuan Nature Reserve Is Partially Effective in Mitigating Human Pressures" Land 11, no. 1: 43. https://0-doi-org.brum.beds.ac.uk/10.3390/land11010043
Note that from the first issue of 2016, this journal uses article numbers instead of page numbers. See further details here.