
Rethinking Legal Criteria for Assessing Compensation for Rural Land Expropriation: Towards a European Institutional Framework


Abstract
:1. Introduction
2. Study Area
3. Method
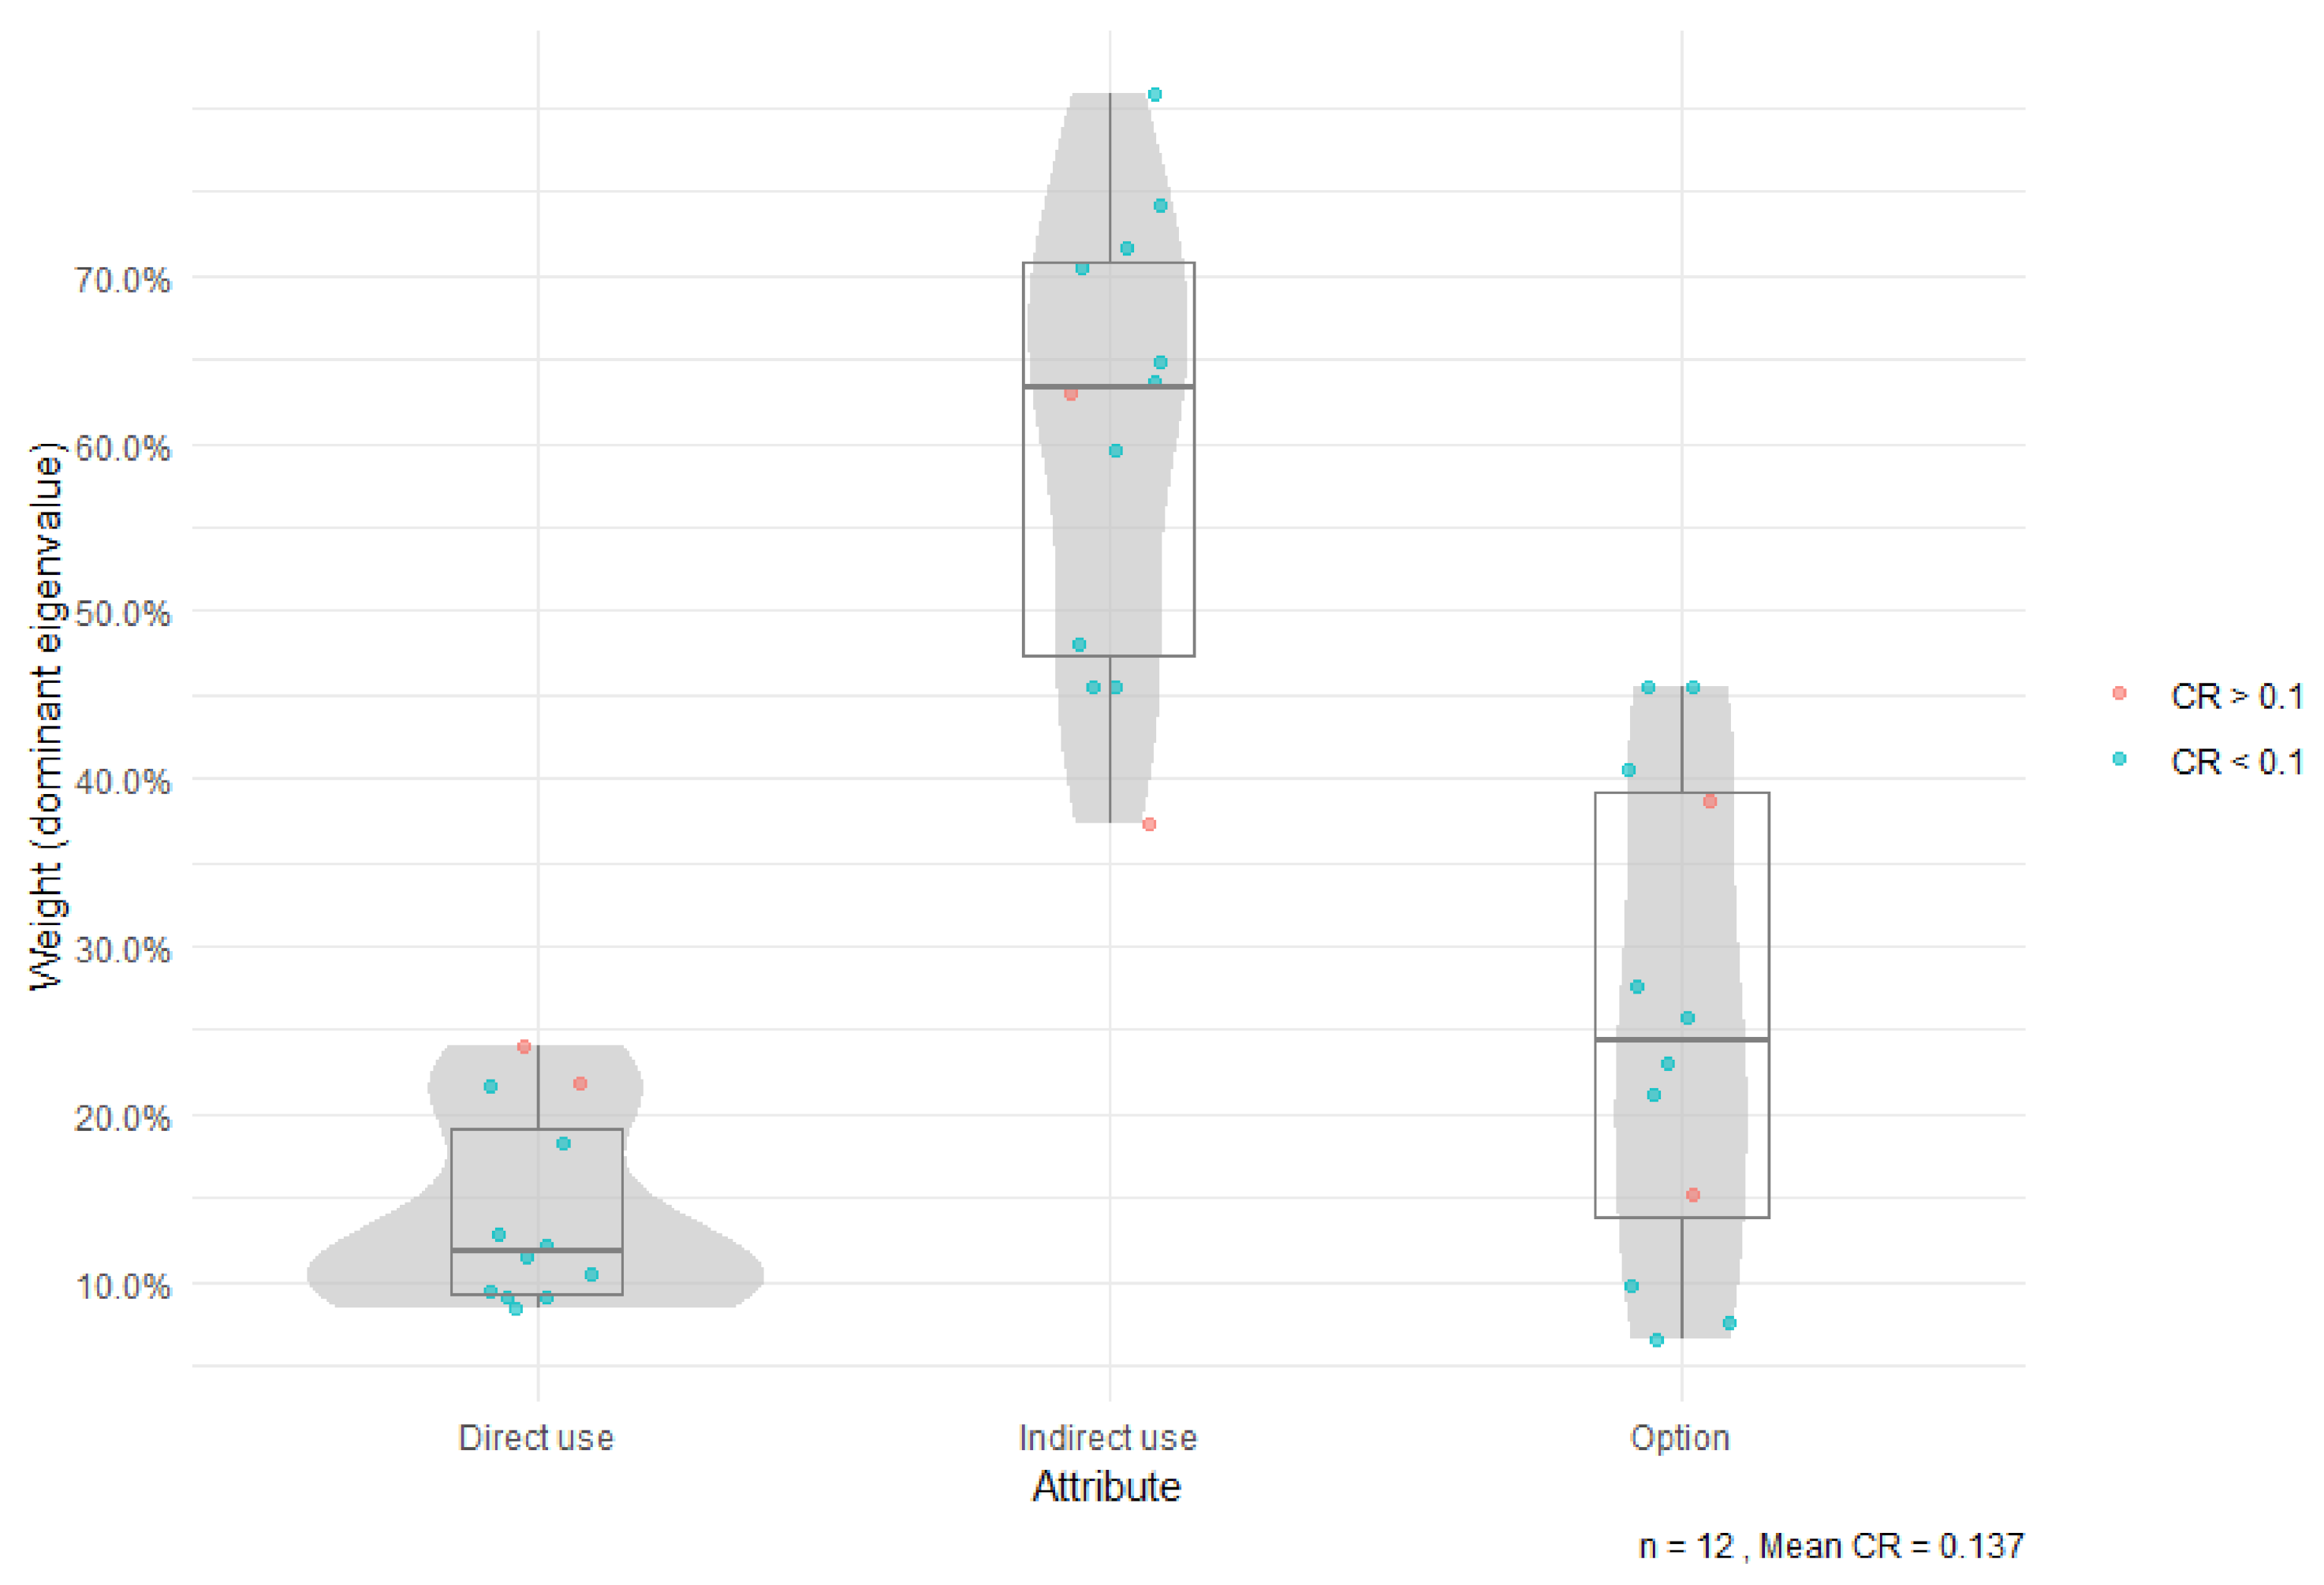
4. Results
5. Discussion
Consistency Analysis
6. Conclusions
Author Contributions
Funding
Informed Consent Statement
Data Availability Statement
Acknowledgments
Conflicts of Interest
Appendix A. Survey
Appendix A.1. Introduction
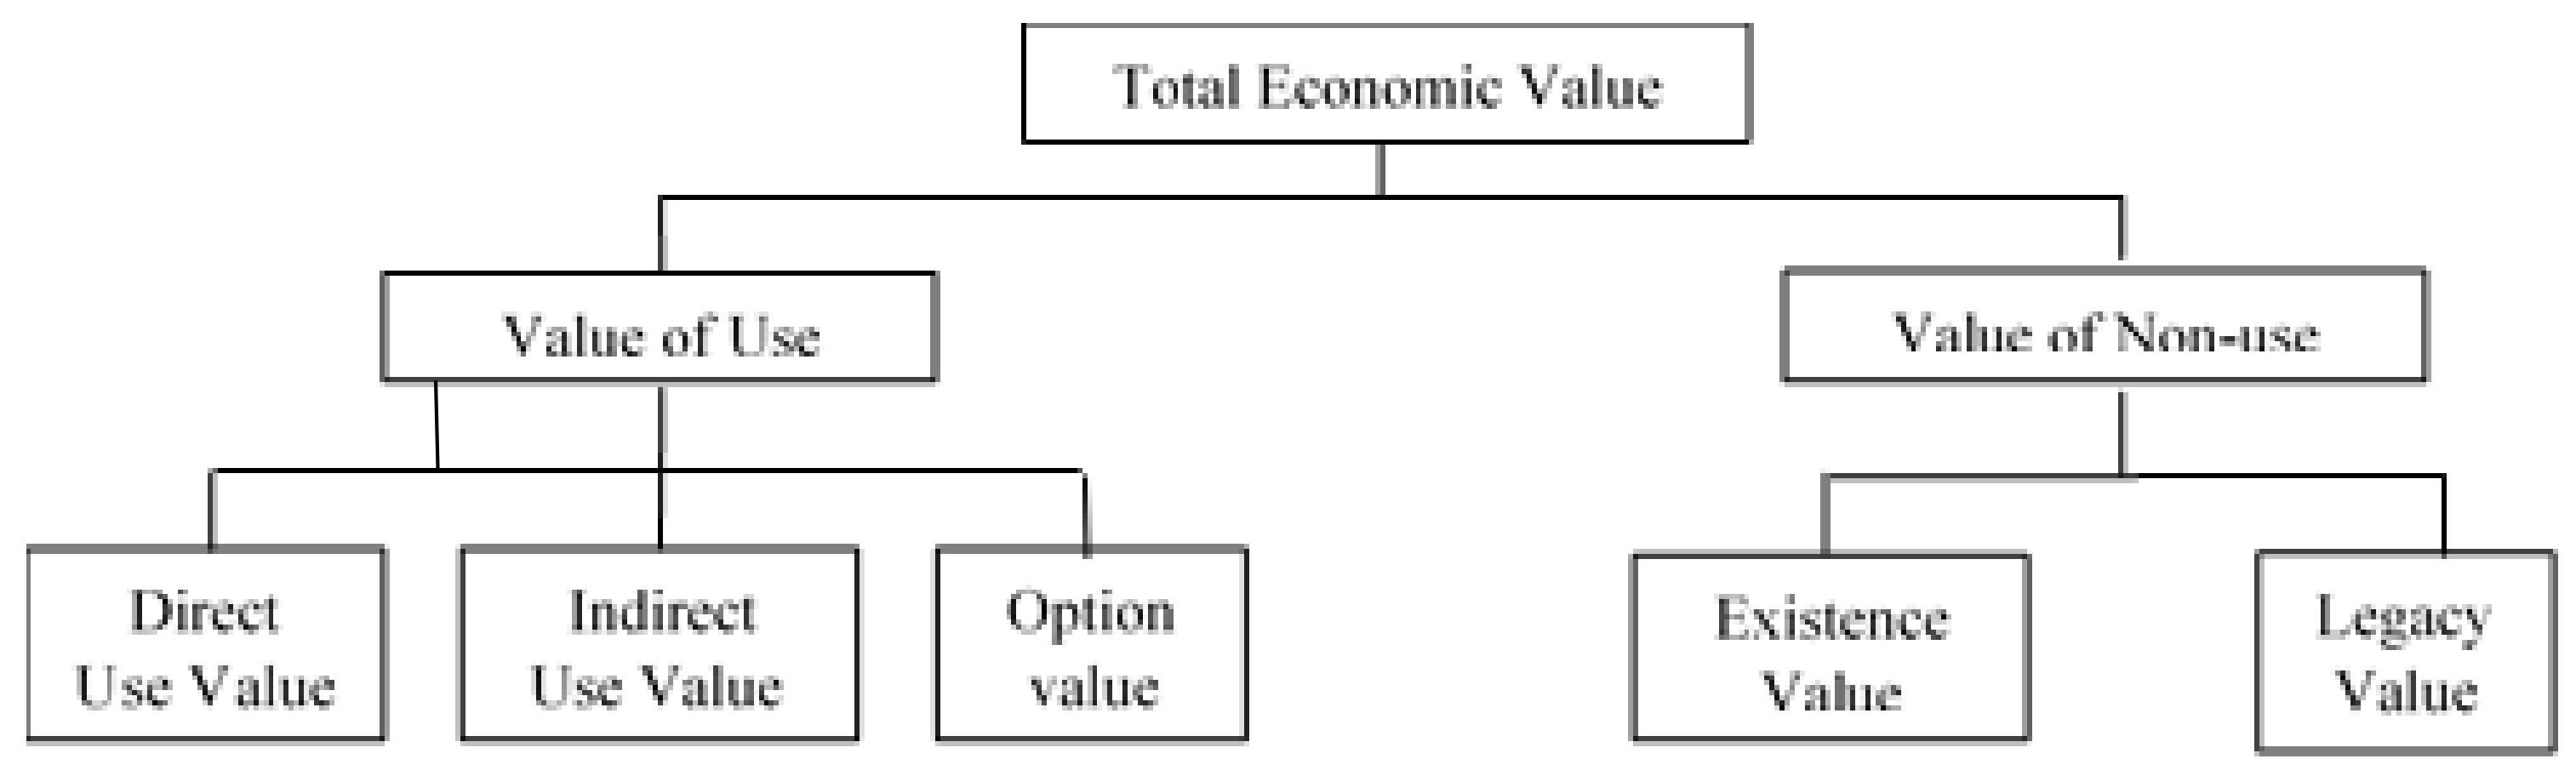
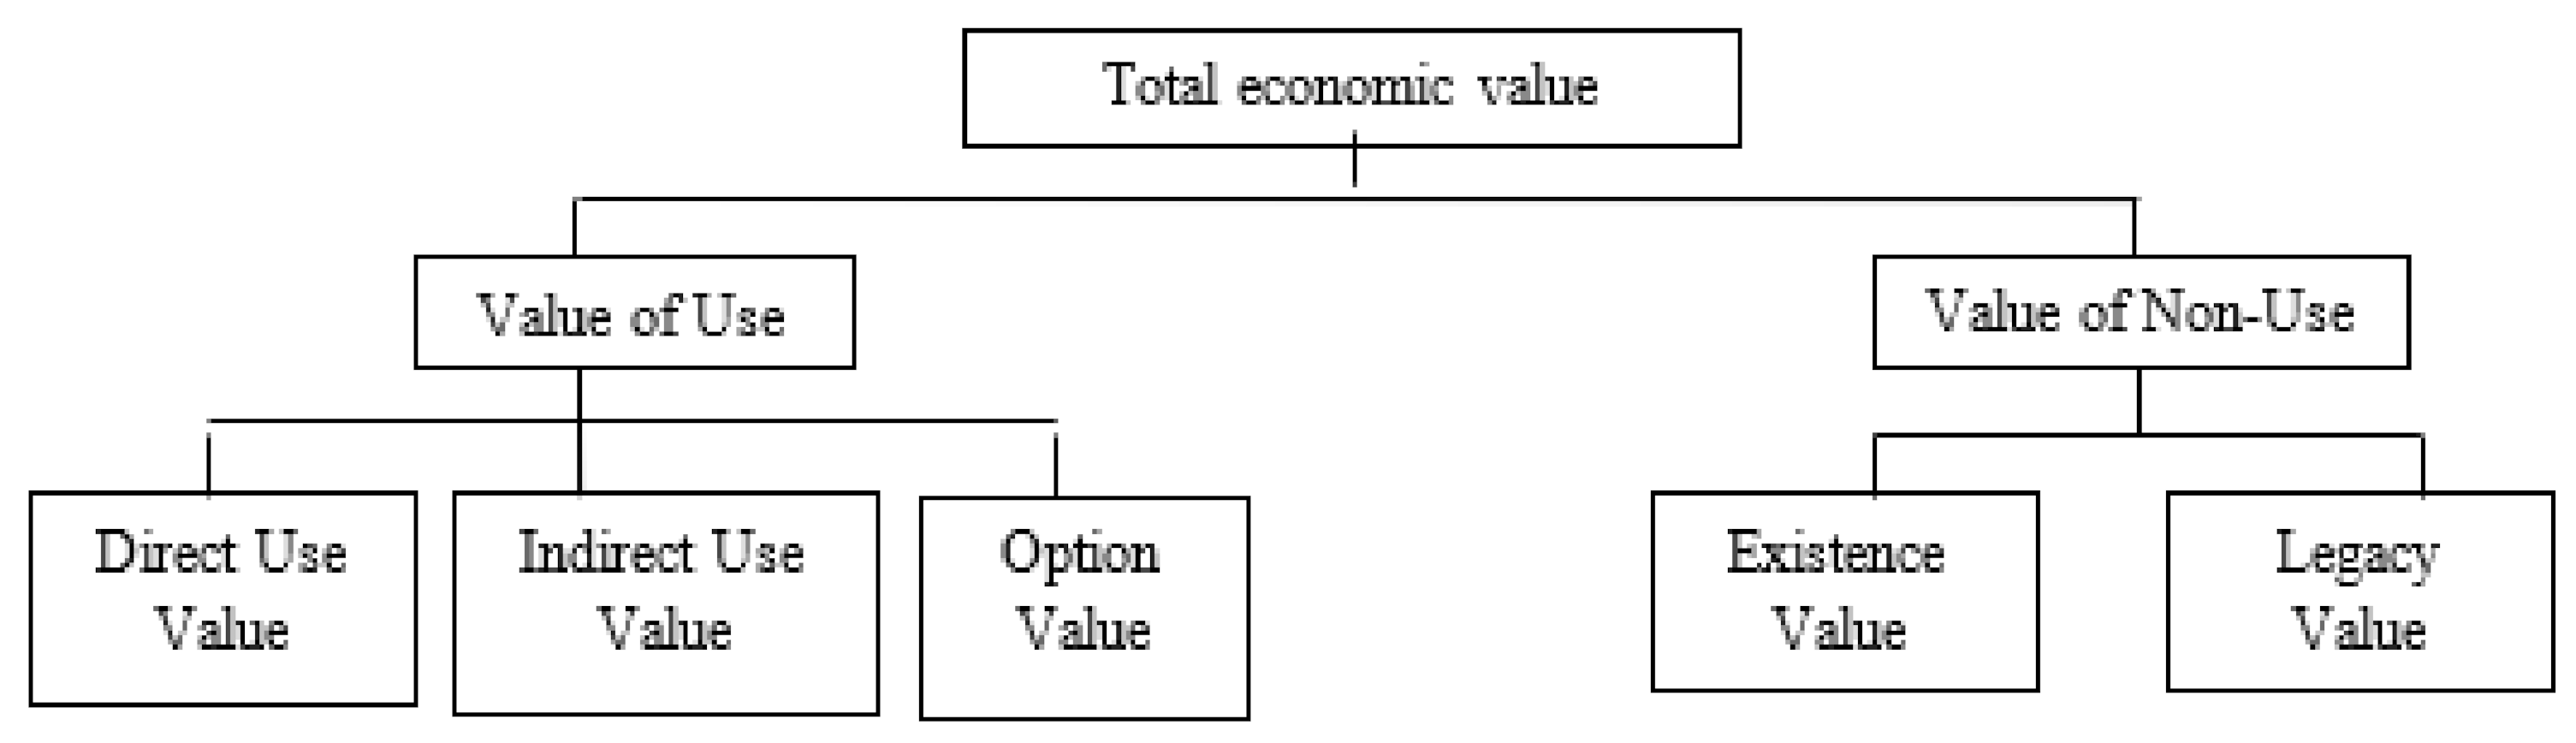
- Value of Use (V.U.): It is the value of the goods and services obtained by the people who use the environmental asset as an instrument; 1.1. either by directly exploiting the natural resources (agricultural cultivation, livestock exploitation, forestry exploitation, etc.), obtaining a market value or price from it, giving rise to what is known as direct use value (D.U.V.); 1.2. either by using the space indirectly through the provision of services that have no market value or price (CO2 fixation, nutrient retention, soil retention, aquifer recharge, support to other ecosystems, enjoyment of recreational areas, etc.), giving rise to what is known as indirect use value (I.U.U.V.); 1.3. I.U.); 1.3. either because the potential future use of the natural space is unknown (medicinal use of flora and fauna, etc.) and its loss produces in the person a loss of well-being, and therefore assigns a value to these uncertain or probable potential future uses. This is known as option value or quasi-option value (O.V.). Therefore, the use value is composed of the direct use value plus the indirect use value plus the option value (value of not closing the possibility of a future use of the good) or quasi-option value. (It is a somewhat more complex concept than option value, but both have the uncertainty that, in this case, has to do with the irreversibility of the decision maker’s erroneous decisions, either due to lack of scientific knowledge regarding the impact of the decision or due to lack of information).
- Value of Non-Use (V.N.U.): It is the value that environmental assets have for certain people, which has nothing to do with the use of the space. It is a value that is not linked to use. The two fundamental attributes of this value are: existence value (E.V.) and legacy value (L.V.). The existence value refers to the value assigned by certain people who are not users of the space and do not intend to be but who value positively the fact that the property exists. Its disappearance would cause a loss of welfare even if they do not use it or do not plan to do so in the future. Related to this concept would be, for example, use for research purposes. Preserving an environment, an ecosystem, a species makes it possible to preserve a laboratory for experimentation and research. Bequest value is the value assigned by people to an environmental good justified by the desire to preserve a given good for the enjoyment of future generations (intertemporal altruism).


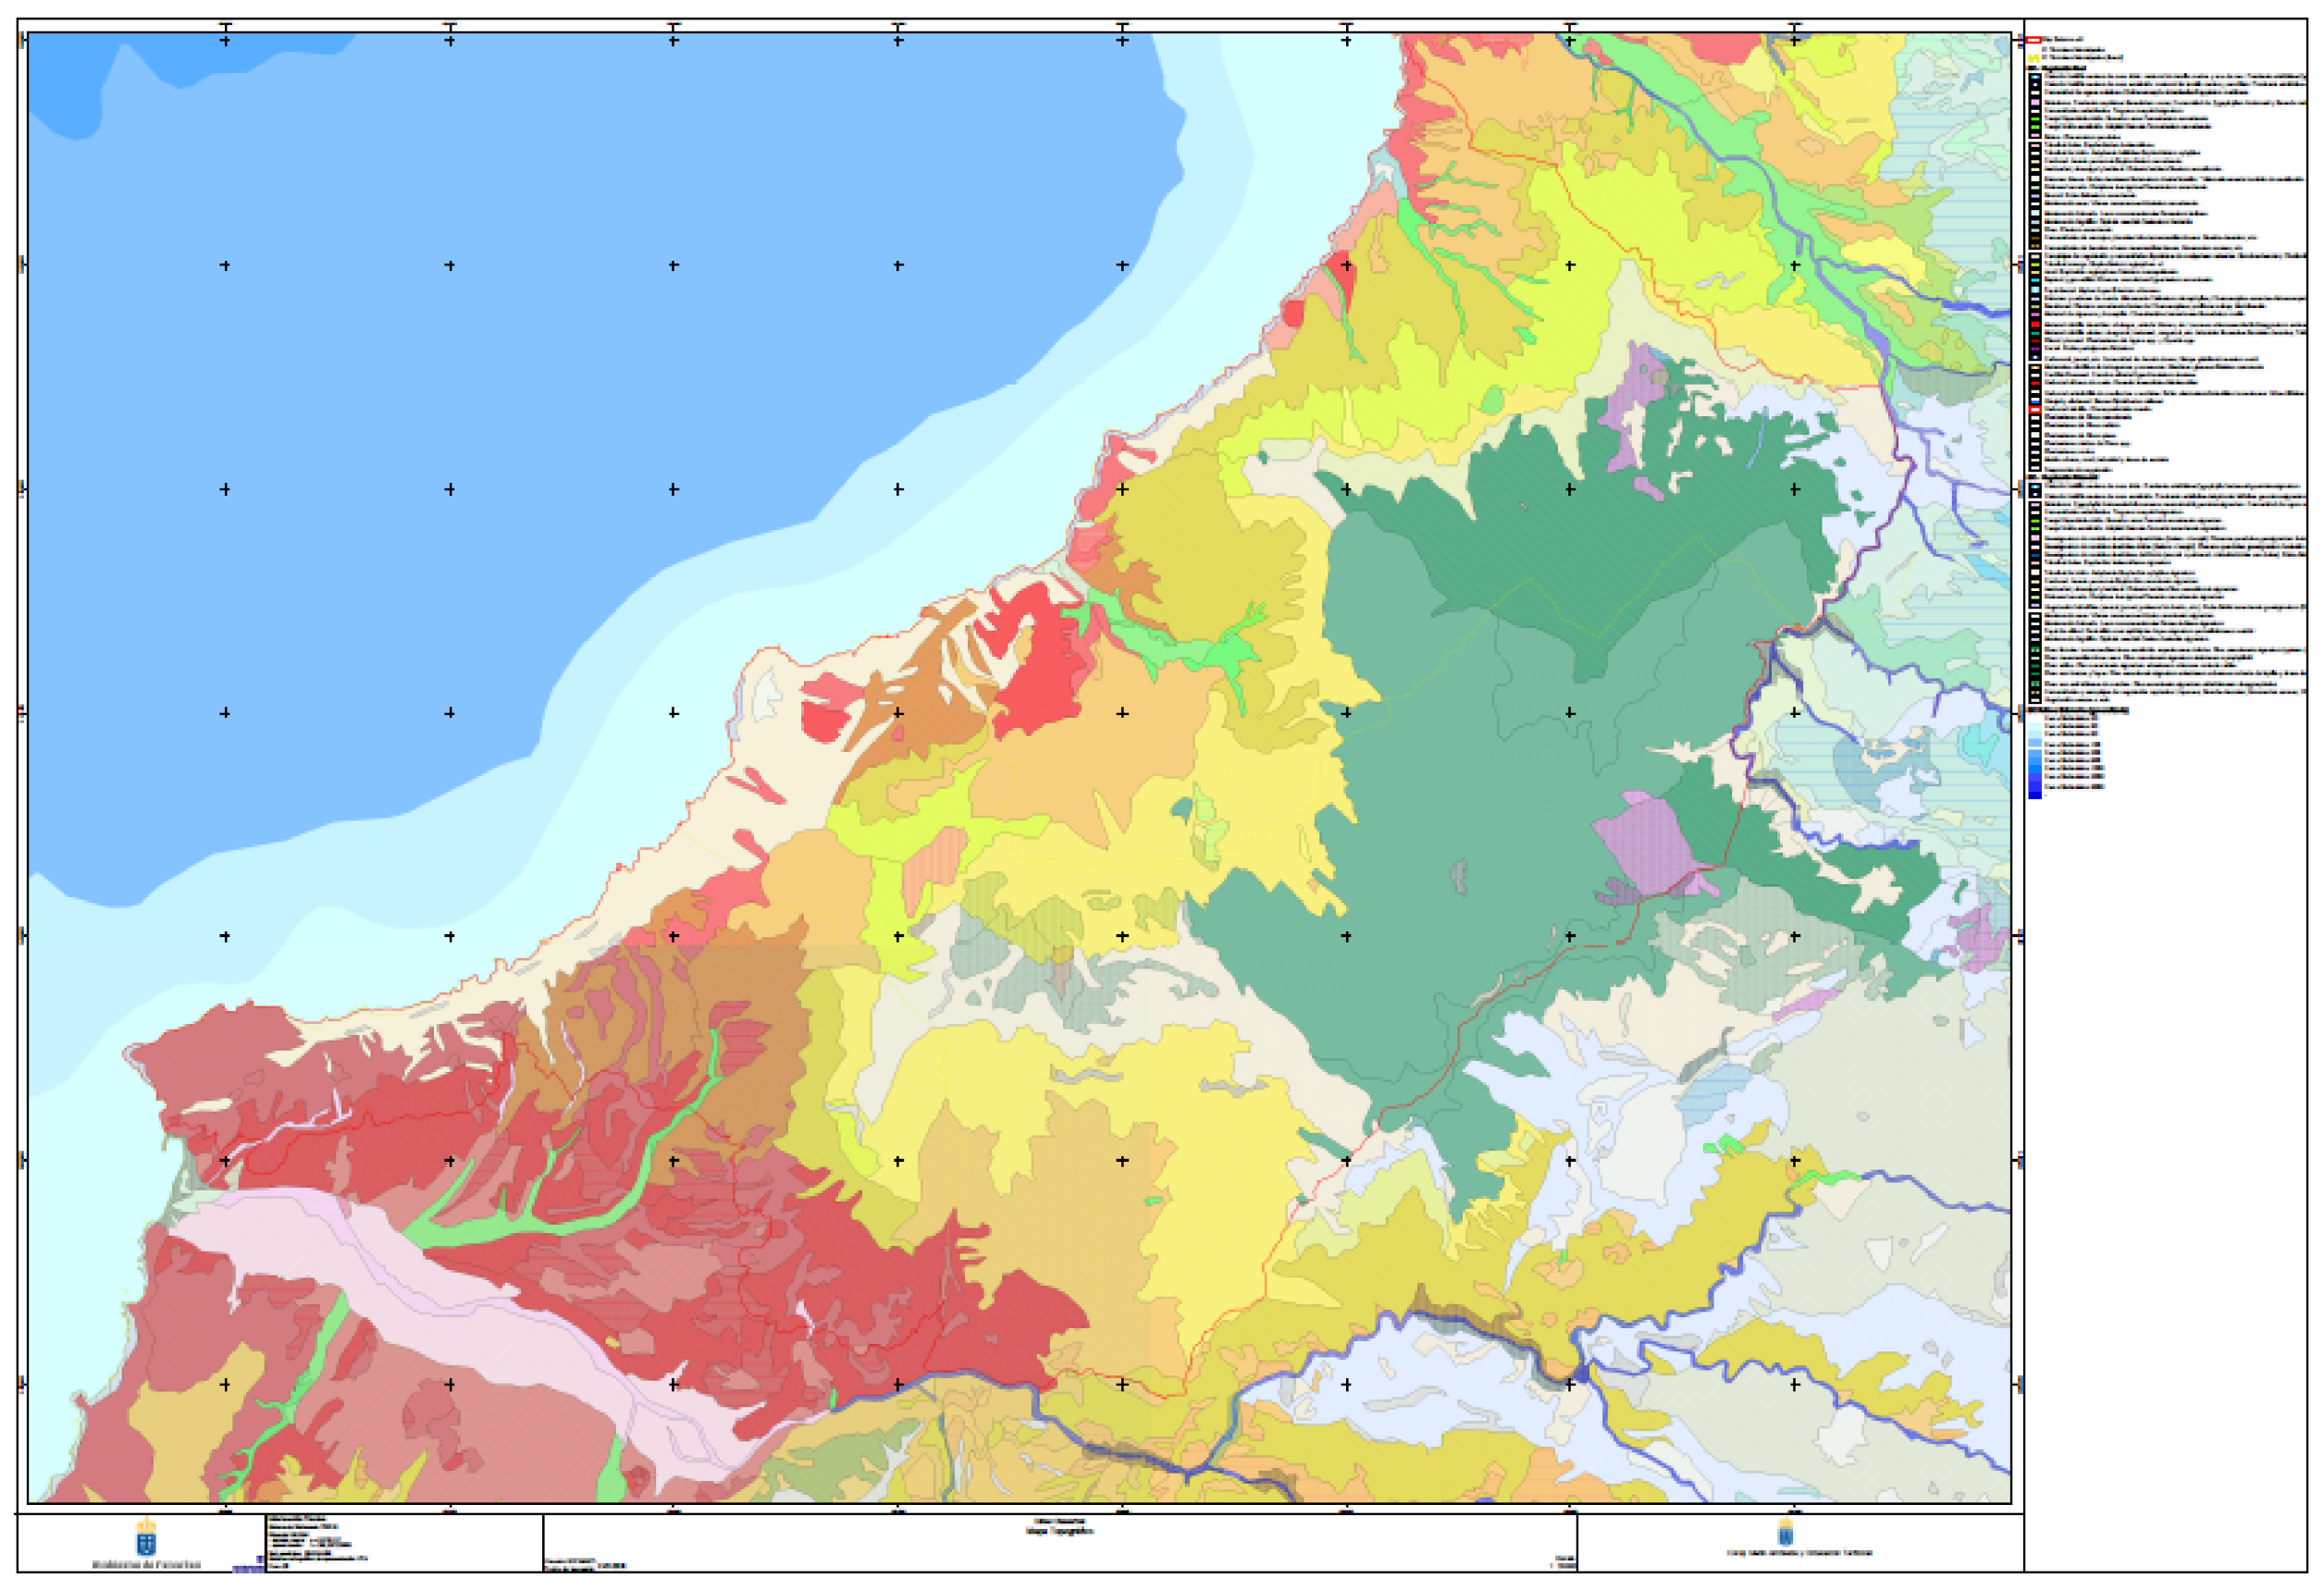
| Province: Las Palmas; Date of creation: 1987 N° Locations: Agaete, Artenara and la Aldea de San Nicolás. Its greatest singularity is the network of ravines, escarpments and massifs of this area that form an erosive landscape of contrasts, where natural elements of notable geomorphological interest can be identified. Tamadaba is home to one of the best preserved natural pine forests on the island, with a remarkable efficiency in hydrological catchment. Other well-preserved biosystems are those of the ravines and the cardonales and tabaibales of the lowlands, as well as the escarpment habitats. The Guayedra cliffs are home to several endangered species, some of which are exclusive to this area. In addition, certain endemic and endangered bird species find ideal nesting areas in the pine forests. From a cultural point of view, there are also some isolated and semi-abandoned farmhouses, and the archaeological importance of areas such as El Risco and the Guayedra valley. The entire area, with the exception of a sector in the town of El Risco, was considered an area of ecological sensitivity. This area has been declared a special protection zone for birds5 for the Conservation of Wild Birds.1 The coastal sector, from La Aldea to Agaete, is considered a point of geological interest because it allows “visualizing the external part of the Tejeda caldera, with areas of hydrothermal alteration (Los Quemados) and samples of the sillic facies that overflowed the caldera (El Risco)”. Within the territorial scope of the natural park there is a great variety of habitats in which plant communities of notable ecological value and more than 200 plant species develop. Up to 16 of these habitats are considered priority habitats by the Habitats Directive and include a strong endemic component and the presence of endangered species. Among the endemic species, there are six species that are exclusive to the park, most of them rock-dwelling species, 33 endemic species of Gran Canaria and 64 of the Canary Islands archipelago. The fauna is equally remarkable, especially birds and reptiles. Among the birds, two jewels of the Canarian avifauna stand out, such as the Gran Canarian woodpecker and the Gran Canarian blue chaffinch. In the whole area of the park, but especially in the lower areas, the Gran Canarian giant lizard can be observed, as well as the green or blue-tailed mullet. The invertebrates, much more numerous but more difficult to perceive, present a high degree of endemism, from those widely represented as the Gran Canarian grasshopper to the endemic beetle, exclusive of the fossil beach of Punta de las Arenas. Wherever there are coastal beaches, especially in Estancia del Manso and Punta de las Arenas, they are formed by mobile dunes. |
| Summary of environmental and socioeconomic services and products of Tamadaba NP | |
| Environmental and socioeconomic attributes Environmental and commercial products | Environmental and socioeconomic attributes Environmental and commercial products |
| Natural habitats representative of the ecological systems of the Canary Islands: natural pine forest, cardonales-tabaibales, escarpment habitats. | CO2 retention |
| Aquatic ecosystems | Aquifer recharge |
| Exclusive species of flora and fauna | Climate change protection |
| Endemic vertebrates and invertebrates | Water purification |
| Unique avifauna | Biomass exploitation |
| Traditional settlements | Agricultural, livestock and forestry resources |
| Handicrafts | Cultural services |
| Leisure and recreational activities | Natural heritage |
| Traditional agricultural, livestock, hunting and hydrological activities. | Biological diversity |
| Natural landscapes | Mineral resources, water resources |
| Presence of geomorphological structures and singular formations. | Tourism activities: hiking, guided tours… |
| Paleontological sites | Local products |
| Hydrological catchment | Research and educational services |
| Natural pine forest | Fishing exploitation |
| Archaeological importance: Risco Caído | Recreational uses: camping area, beaches,… |
| Archaeological importance: Guayedra Valley | |
| Q.0: Self-assessment: From 0 (=not at all) to 5 (=maximum), what is the degree of knowledge of Tamadaba N.P. that you consider you have? .......... (put the number). |
Appendix A.2. Valuation Methodology
| Grade of Importance | Definition | Explanation |
| 1 | Equal importance | Two activities that contribute equally to the objective. |
| 3 | Moderate importance | The experience and judgment of one activity is slightly in favor of the other. |
| 5 | Strong importance | The experience and judgment of one activity are strongly favored over the other. |
| 7 | Very high importance | One activity is favored over the other very strongly; its dominance is demonstrated in practice. |
| 9 | Extreme importance | The favorable evidence of one activity over the other is of the highest possible order of affirmation. |
| 2, 4, 6, 8 | For trade-offs between the above values | Sometimes it is necessary to interpolate a numerical judgment of commitment because there are no good figures to describe it. |
| 1, 1-1, 9 | For linked activities | When the elements are very close and almost indistinguishable, if the difference is minimal (1.1) and if it is maximal, within moderation, (1.9). |
| Name and surname: …………………………………….………………… |
| Academic Background: .………………………………………………… |
| Occupation: ……………………………………………………………… |
| (Note: the data will be treated anonymously) |
- A.
- Matrix Type 1 (2 × 2)_Criteria:
| Value of Use | Value of Non-Use | |
| Value of Use | 1 | |
| Value of Non-Use | 1 |
- B.
- Matrix_Type 2 (3 × 3)_Attributes_Criteria 1:
| Direct Use Value | Indirect Use Value | Option or Quasi-Option Value | |
| Direct use value | 1 | ||
| Indirect use value | 1 | ||
| Option or quasi-option value | 1 |
- C.
- Matrix_Type 3 (2 × 2)_Attributes_Criterion 2
| Existence Value | Bequest Value | |
| Existence value | 1 | |
| Bequest value | 1 |
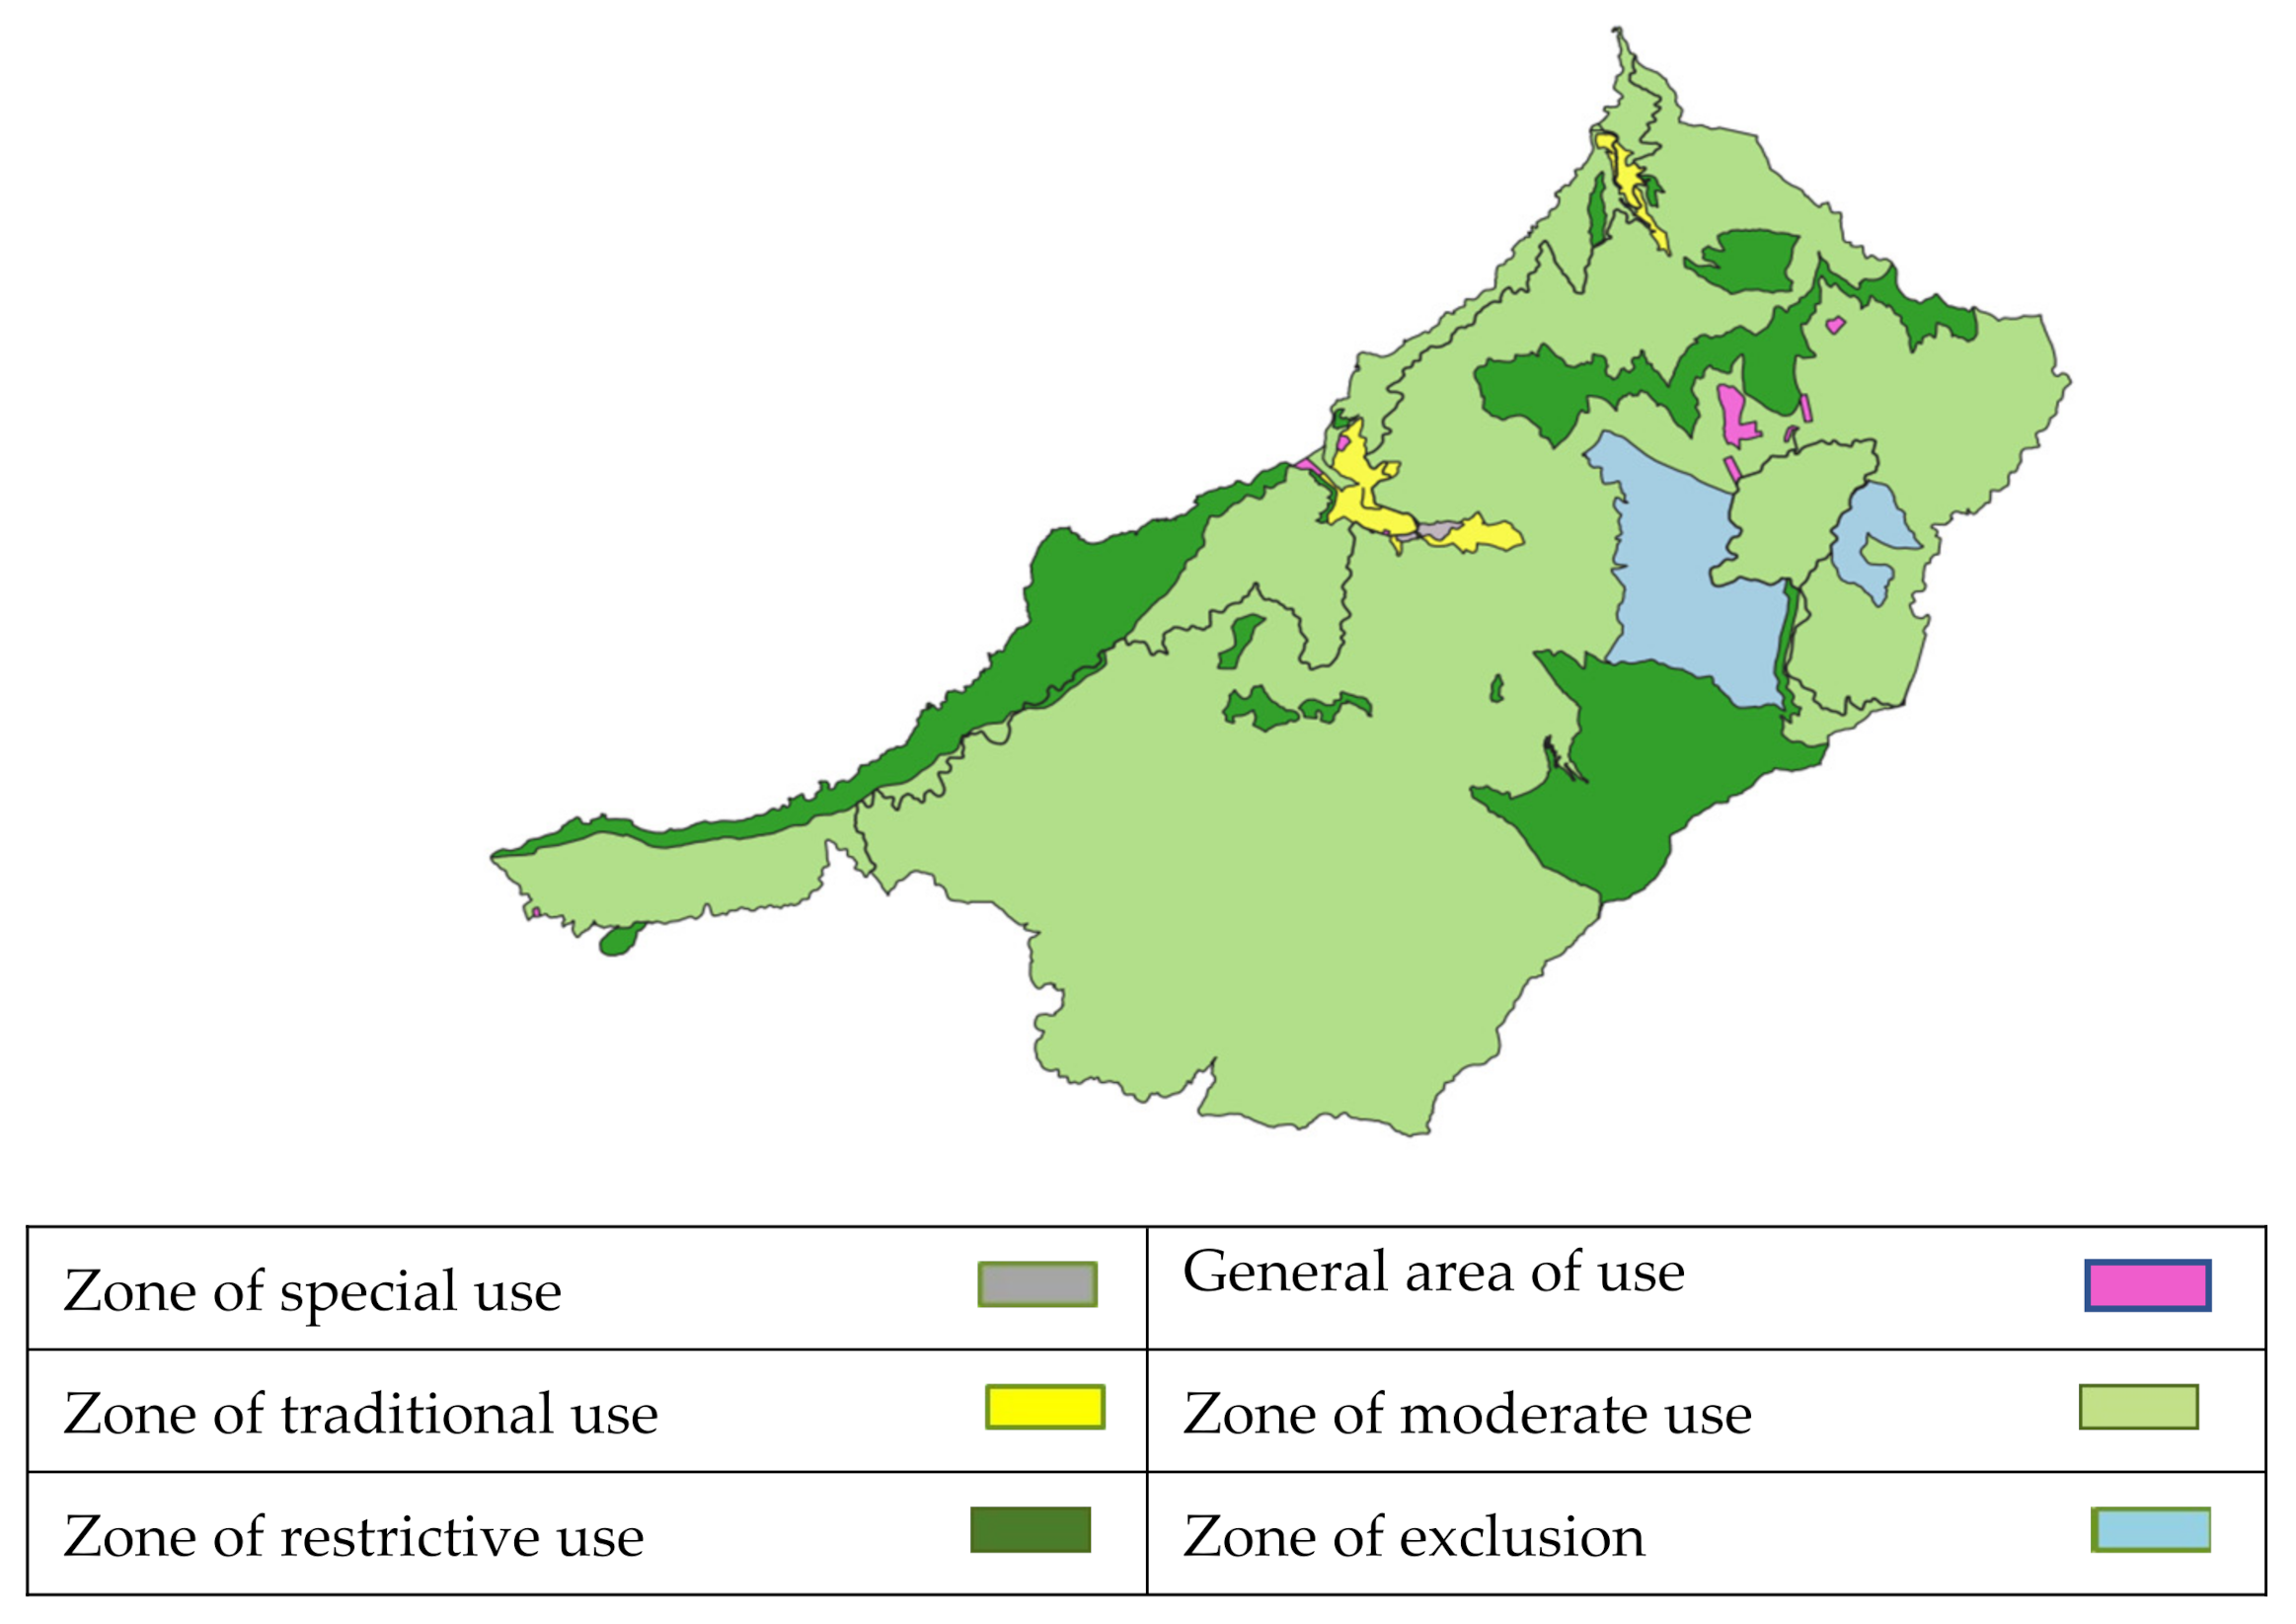
Appendix B. Map of the Natural Park of Tamadaba


References
- Bennett, N.J.; Di Franco, A.; Calo, A.; Nethery, E.; Niccolini, F.; Milazzo, M.; Guidetti, P. Local support for conservation is associated with perceptions of good governance, social impacts and ecological effectiveness. Conserv. Lett. 2019, 12, e12640. [Google Scholar] [CrossRef]
- European Commission. The EU Biodiversity Strategy to 2020; European Union: Luxembourg, 2011. [Google Scholar]
- Millennium Ecosystem Assessment (MEA). Ecosystems and Human Well-Being; Synthesis; Island Press: Washington, DC, USA, 2005. [Google Scholar]
- Nila, U.S.N.; Beierkuhnlein, C.; Jaeschke, A.; Hoffmann, S.; Hossin, L. Predicting the effectiveness of protected areas of Natura 2000 under climate change. Ecol. Process. 2019, 8, 13. [Google Scholar] [CrossRef]
- Torres Perez, F.J. Environment, Environmental Goods and Valuation Methods. Equidad Desarro. 2016, 25, 119–158. [Google Scholar] [CrossRef] [Green Version]
- Tsioumani, E. Fair and Equitable Benefit-Sharing in Agriculture: Reinventing Agrarian Justice; Routledge: London, UK, 2021. [Google Scholar]
- Anderson, D.A. Environmental Economics and Natural Resource Management; Routledge: London, UK, 2019. [Google Scholar]
- Arrow, K.J. Social Choice and Individual Values; Wiley: New York, NY, USA, 1951. [Google Scholar]
- Aznar Bellver, J.; Guijarro Martínez, F. Nuevos Métodos de Valoración: Modelos Multicriterio; Universitat Politécnica: Barcelona, Spain, 2012. [Google Scholar]
- Aznar Bellver, J.; Estruch Guitart, A.V. Valoración de Activos Ambientales; Universitat Politécnica: Barcelona, Spain, 2015. [Google Scholar]
- Aznar, J.; Guijarro, F.; Moreno-Jiménez, J.M. Mixed valuation methods: A combined AHP-GP procedure for individual and group multicriteria agricultural valuation. Ann. Oper. Res. 2011, 190, 221–238. [Google Scholar] [CrossRef]
- Azqueta, D.; Ferreiro, A. Análisis Económico y Gestión de Recursos Naturales; Alianza Editoral: Madrid, Spain, 1994. [Google Scholar]
- Brun, F. Multifunctionality of mountain forests and economic evaluation. For. Policy Econ. 2002, 4, 101–112. [Google Scholar] [CrossRef]
- Colina Vuelta, A.; García de la Fuente, L. Métodos directos e indirectos en la valoración económica de bienes ambientales. Aplicación al valor de uso recreativo del Parque Natural de Somiedo. Estud. Econ. Apl. 2004, 22, 729–730. [Google Scholar]
- Fisher, B.; Turner, R.K.; Morling, P. Defining and classifying ecosystem services for decision-making. Ecol. Econ. 2009, 68, 643–653. [Google Scholar] [CrossRef] [Green Version]
- Gordon, H.S. The economic theory of a common property resource: The fishery. J. Political Econ. 1954, 62, 124–142. [Google Scholar] [CrossRef]
- Nordhaus, W.D. Managing the Global Commons: The Economics of Climate Change; MIT Press: Cambridge, MA, USA, 1994. [Google Scholar]
- Pearce, D.W.; Turner, R.K. Economics of Natural Resources and the Environment; The John Hopkins University Press: Baltimore, MA, USA, 1990. [Google Scholar]
- Rodríguez García, L.; Curetti, G.; Garegnani, G.; Grilli, G.; Pastorella, F.; Paletto, A. La valoración de los servicios ecosistémicos en los ecosistemas forestales: Un caso de estudio en Los Alpes Italianos. Bosque 2016, 37, 41–52. [Google Scholar] [CrossRef] [Green Version]
- Coase, R.H. The problem of Social Cost. J. Law Econ. 1960, 2, 1–44. [Google Scholar] [CrossRef] [Green Version]
- Bertrand, E. La paradoja de Ronald Coase. Investig. Económica 2002, LXIl, 129–146. [Google Scholar]
- Bromley, D.W.; Vant, A. Choices without Prices without Apologies. J. Environ. Econ. Manag. 1994, 26, l29–l48. [Google Scholar]
- Cabañes Argudo, M.; Olmedillas Blanco, B. Coase y el medio ambiente: Funcionamiento del mercado y derechos de propiedad. Boletín Económico ICE Inf. Comer. Española 2000, 2665, 11–20. [Google Scholar]
- Bartke, S.; Schwarze, R. The economic role and emergence of professional valuers in real estate markets. Land 2021, 10, 683. [Google Scholar] [CrossRef]
- Akter, S.; Grafton, R.Q. Confronting uncertainty and missing values in environmental value transfer as applied to species conservation. Conserv. Biol. 2010, 24, 1407–1417. [Google Scholar] [CrossRef]
- Azqueta, D. Valoración Económica de la Calidad Ambiental; McGraw-Hill: Madrid, Spain, 1994. [Google Scholar]
- Beja, E.L. Subjective Well-Being Approach to Environmental Valuation: Evidence for Greenhouse Gas Emissions. Soc. Indic. Res. 2012, 109, 243–266. [Google Scholar] [CrossRef] [Green Version]
- Bellu, L.G.; Cistulli, V. Economic Valuation of Forest Recreation Facilities in the Liguria Region (Italy); Centre for Social and Economic Research on the Global Environment: Norwich, UK, 1997. [Google Scholar]
- Borzykowski, N.; Baranzini, A.; Maradan, D. A travel cost assessment of the demand for recreation in Swiss forests. Rev. Agric. Food Environ. Stud. 2017, 98, 149–171. [Google Scholar] [CrossRef]
- Elsasser, P.; Englert, H.; Hamilton, J. Landscape benefits of a forest conversion pro-gramme in North East Germany: Results of a choice experiment. Ann. For. Res. 2010, 53, 37–50. [Google Scholar]
- Faith, D.P.; Walker, P.A. Integrating conservation and development: Effective trade-offs between biodiversity and cost in the selection of protected areas. Biodivers. Conserv. 1996, 5, 431–446. [Google Scholar] [CrossRef]
- Garrod, G.D. Social & Environmental Benefits of Forestry Phase 2: Landscape Benefits; Centre for Research in Environmental Appraisal & Management, University of Newcastle: Newcastle, UK, 2002; 46p. [Google Scholar]
- Greiner, L.; Keller, A.; Grêt-Regameyb, A.; Papritz, A. Soil function assessment: Review of methods for quantifying the contributions of soils to ecosystem services. Land Use Policy 2017, 69, 224–237. [Google Scholar] [CrossRef]
- León, J.C. Double Bounded Survival Values for Preserving the Landscape of Natural Parks. J. Environ. Manag. 1996, 46, 103–118. [Google Scholar] [CrossRef]
- Medina, C.E.; Medina, Y.; Bocardo, E.F. Valoración económica del secuestro y almacenamiento de carbón en la puna seca del suroeste del Perú. Bosque 2020, 41, 165–172. [Google Scholar] [CrossRef]
- Paletto, A.; De Meo, I.; Grill, G.; Nikodinoska, N. Effects of different thinning systems on the economic value of ecosystem services: A case-study in a black pine peri-urban forest in Central Italy. Ann. For. Res. 2017, 60, 313–326. [Google Scholar]
- Ruiz-Agudelo, C.A.; Bello, L.C. El valor de algunos servicios ecosistémicos de los Andes colombianos? Transferencia de beneficios por meta-análisis. Univ. Sci. 2014, 19, 301–322. [Google Scholar]
- Zandersen, M.; Tol, R.S.J. A meta-analysis of forest recreation values in Europe. J. For. Econ. 2009, 15, 109–130. [Google Scholar] [CrossRef]
- Bawa, K.S.; Seidler, R. Natural forest management and conservation of biodiversity in tropical forests. Conserv. Biol. 1998, 12, 46–55. [Google Scholar] [CrossRef]
- FAO. El Estado de los Bosques del Mundo 2016. Los Bosques y la Agricultura: Desafíos y Oportunidades en Relación con el Uso de la Tierra; FAO: Roma, Italy, 2016; 119p. [Google Scholar]
- Führer, E. Forest functions, ecosystem stability and management. For. Ecol. Manag. 2000, 132, 29–38. [Google Scholar] [CrossRef]
- Gayoso, J.; Acuña, M.; Muñoz, R. Gestión sustentable de ecosistemas forestales: Caso predio San Pablo de Tregua, Chile. Bosque 2001, 22, 75–84. [Google Scholar] [CrossRef]
- Hockings, M.; Stolton, S.; Leverington, F.; Dudley, N.; Courrau, J. Evaluating Effectiveness: A Framework for Assessing the Management Effectiveness of Protected Areas, 2nd ed.; IUCN: Gland, Switzerland, 2006. [Google Scholar]
- Koch, A.; McBratney, A.; Lal, R. Global soil week: Put soil security on the global agenda. Nature 2012, 492, 186. [Google Scholar] [CrossRef] [PubMed]
- Kyaw, T.Y.; Germain, R.H.; Stehman, S.V.; Quackenbush, L.J. Quantifying forest loss and forest degradation in Myanmar’s “home of teak”. Can. J. For. Res. 2020, 50, 89–101. [Google Scholar] [CrossRef]
- Ninan, K.N.; Inoue, M. Valuing forest ecosystem services: Case study of a forest reserve in Japan. Ecosyst. Serv. 2013, 5, 78–87. [Google Scholar] [CrossRef]
- Pouta, E.; Rekola, M. The theory of planned behavior in predicting willingness to pay for abatement of forest regeneration. Soc. Nat. Resour. 2001, 14, 93–106. [Google Scholar]
- Riera, P.; Brey, R.; Mausar, R. Eficiencia y equidad de políticas forestales. Un análisis gráfico de equilibrio parcial. Cuad. Económicos ICE 2006, 71, 251–266. [Google Scholar]
- Tagliarino, N.K.; Bununu, Y.A.; Micheal, A.O.; De Maria, M.; Olusanmi, A. Compensation for Expropriated Community Farmland in Nigeria: An In-Depth Analysis of the Laws and Practices Related to Land Expropriation for the Lekki Free Trade Zone in Lagos. Land 2018, 7, 23. [Google Scholar] [CrossRef] [Green Version]
- World Bank. Land Governance Assessment Framework Final Report: Nigeria; World Bank: Washington, DC, USA, 2011. [Google Scholar]
- Palmer, D.; Fricska, S.; Wehrmann, B. Land Tenure Working Paper 11: Toward Improved Land Governance; FAO: Rome, Italy, 2009. [Google Scholar]
- Dax, T.; Schroll, K.; Machold, I.; Derszniak-Noirjean, M.; Schuh, B.; Gaupp-Berghausen, M. Land Abandonment in Mountain Areas of the EU: An Inevitable Side Effect of Farming Modernization and Neglected Threat to Sustainable Land Use. Land 2021, 10, 591. [Google Scholar] [CrossRef]
- Hoops, B. Rethinking Expropriation Law I: Rethinking Public Interest in Expropriation; Hoops, B., Marais, E.J., Mostert, H., Sluysmans, J.A.M.A., Verstappen, L.C.A., Eds.; Eleven International Publishing: Den Haag, The Netherlands, 2015. [Google Scholar]
- IVSC. International Valuation Standards Council Annual Report 2019–20; IVSC: London, UK, 2020. [Google Scholar]
- Lindsay, J. PPP Insights: Compulsory Acquisition of Land and Compensation in Infrastructure Projects; World Bank: Washington, DC, USA, 2012. [Google Scholar]
- Hiller, N.; Schefer, G. IEEP’s response to the EC public on the new soil strategy. H2020-Project Public Ecosystem Goods and Services from Land Management. In Unlocking the Synergies; Grant No. 633814; IEEP: London, UK, 2018; Available online: https://ieep.eu/work-areas/agriculture-and-land-management/sustainable-land-use/delivering-public-goods (accessed on 21 December 2021).
- Maes, J.; Egoh, B.; Willemen, L.; Liquete, C.; Vihervaara, P.; Schägner, J.P.; Grizzetti, B.; Drakou, E.G.; La Notte, A.; Zulian, G.; et al. Mapping ecosystem services for policy support and decision-making in the European Union. Ecosyst. Serv. 2012, 1, 31–39. [Google Scholar] [CrossRef]
- Malatesta, D.; Smith, C.R. Lessons from resource dependence theory for contemporary public and non-profit management. Public Adm. Rev. 2014, 74, 14–25. [Google Scholar] [CrossRef]
- Barba-Romero, S.; Pomerol, J. Decisiones Multicriterios: Fundamentos Teóricos y Utilización Práctica; Servicio de Publicaciones de la Universidad de Alcalá, Colección de Economía: Madrid, Spain, 1997. [Google Scholar]
- Díaz-Balteiro, L.; Alfranca, O.; González-Pachón, J.; Romero, C. Ranking of industrial forest plantations in terms of sustainability: A multicriteria approach. J. Environ. Manag. 2016, 180, 123–132. [Google Scholar] [CrossRef]
- Duke, J.; Aull-Hyde, R. Identifying public preferences for land preservation using the analytic hierarchy process. Ecol. Econ. 2002, 42, 131–145. [Google Scholar] [CrossRef]
- Fernández Martínez, P.; de Castro-Pardo, M.; Barroso, V.M. Assessing Sustainable Rural Development Based on Ecosystem Services Vulnerability. Land 2020, 9, 222. [Google Scholar] [CrossRef]
- Munda, G. Social multi-criteria evaluation: Methodological foundations and operational consequences. Eur. J. Oper. Res. 2004, 158, 662–677. [Google Scholar] [CrossRef]
- Munda, G. Measuring sustainability: A multi-criterion framework. Environ. Dev. Sustain. 2005, 7, 117–134. [Google Scholar] [CrossRef]
- Munda, G. Social Multi-Criteria Evaluation for a Sustainable Economy; Springer: Berlin/Heidelberg, Germany, 2007. [Google Scholar]
- Munda, G.; Saisana, M. Methodological considerations on regional sustainability assessment based on multicriteria and sensitivity analysis. Reg. Stud. 2011, 45, 261–276. [Google Scholar] [CrossRef]
- Nguyen, T.T.N.; Evans, E.A.; Migliaccio, K.W. Modelling decision-making regrading wetland services for wetland management in Tram Chim National Park, Vietnam. J. Environ. Econ. Policy 2016, 5, 28–48. [Google Scholar] [CrossRef]
- Romero, C. Economía de los Recursos Ambientales y Naturales, 2nd ed.; Alianza Editorial: Madrid, Spain, 1997. [Google Scholar]
- Rodríguez, S.A.; Parra-López, C.; Sayadi-Gmada, S.; Barandica, J.M.; Rescia, A.J. A multifunctional assessment of integrated and ecological farming in olive agroecosystems in southwestern Spain using the Analytic Hierarchy Process. Ecol. Econ. 2020, 173, 106658. [Google Scholar] [CrossRef]
- Strager, M.P.; Rosenberg, R.S. Incorporating stakeholder preferences for land conservation: Weights and measures in spatial MCA. Ecol. Econ. 2006, 58, 79–92. [Google Scholar] [CrossRef]
- Vatn, A. An institutional analysis of methods for environmental appraisal. Ecol. Econ. 2009, 68, 2207–2215. [Google Scholar] [CrossRef]
- Wolfslehner, B.; Vacik, H. Evaluating sustainable forest management strategies with the analytic network process in a pressure-state-response framework. J. Environ. Manag. 2008, 88, 1–10. [Google Scholar] [CrossRef]
- Aren, S.; Aydemir, S.D. The Factors Influencing Given Investment Choices of Individuals. Procedia Soc. Behav. Sci. 2015, 210, 126–135. [Google Scholar] [CrossRef] [Green Version]
- Manninen, K.; Koskela, S.; Antikainen, R.; Bocken, N.; Dahlbo, H.; Aminoff, A. Do circular economy business models capture intended environmental value propositions? J. Clean. Prod. 2018, 171, 413–422. [Google Scholar] [CrossRef] [Green Version]
- Rinaldi, F.; Jonsson, R. Accounting for uncertainty in forest management models. For. Ecol. Manag. 2020, 468, 118–186. [Google Scholar] [CrossRef]
- Volschenk, J.; Marius, U.; Smit, E. Creation and appropriation of socio-environmental value in coopetition. Ind. Mark. Manag. 2016, 57, 109–118. [Google Scholar] [CrossRef] [Green Version]
- Lancaster, K.J. A new approach to consumer theory. J. Political Econ. 1996, 74, 132–157. [Google Scholar] [CrossRef]
- Guijarro, F.; Tsinaslanidis, P. Analysis of the academic literature on environmental valuation. Int. J. Environ. Res. Public Health 2020, 17, 2386. [Google Scholar] [CrossRef] [Green Version]
- Lipovetsky, S. Priority vector estimation: Consistency, compatibility, precision. Int. J. Anal. Hierarchy Process 2020, 12, 577–591. [Google Scholar]
- Vaidya, O.S.; Kumar, S. Analytic hierarchy process: An overview of applications. Eur. J. Oper. Res. 2006, 169, 1–29. [Google Scholar] [CrossRef]
- Zahedi, F. A utility approach to the analytic hierarchy process. Math. Model. 1987, 9, 387–395. [Google Scholar] [CrossRef] [Green Version]
- Väinö, N.; Ahtiainen, H. Distributional Weights in Environmental Valuation and Cost-benefit Analysis: Theory and Practice. Ecol. Econ. 2018, 150, 217–228. [Google Scholar]
- Goyal, P.; Kumar, D.; Kumar, V. Application of multi-criteria decision analysis in the are of sustainability: A literature review. Int. J. Anal. Hierarchy Process 2020, 12, 512–545. [Google Scholar]
- Moreno, J.; Aguarón, J.; Escobar, U. Metodología Científica en Valoración y Selección Ambiental. Pesquisa Oper. 2001, 21, 1–16. [Google Scholar] [CrossRef] [Green Version]
- Saaty, R.W. The Analytic Hierarchy Process—What It Is and How It Is Used. Math. Model. 1987, 9, 161–176. [Google Scholar] [CrossRef] [Green Version]
- Saaty, T.L. The Analytic Hierarchy Process; McGraw-Hill: New York, NY, USA, 1987. [Google Scholar]
- Saaty, T.L. Decision-Making with the Ahp: Why Is the Principal Eigenvector Necessary. Eur. J. Oper. Res. 2003, 145, 85–91. [Google Scholar] [CrossRef]
- Saaty, T.L. Decision-making—The Analytic Hierarchy and Network Processes (Ahp/Anp). J. Syst. Sci. Syst. Eng. 2004, 13, 1–35. [Google Scholar] [CrossRef]
- Saaty, T.L.; Tran, L.T. On the Invalidity of Fuzzifying Numerical Judgments in the Analytic Hierarchy Process. Math. Comput. Model. 2007, 46, 962–975. [Google Scholar] [CrossRef]
- Nielsen, A.M.; Fei, S. Assessing the flexibility of the Analytic Hierarchy Process for prioritization of invasive plant management. NeoBiota 2015, 27, 25–36. [Google Scholar] [CrossRef] [Green Version]
- Linares, P.; Romero, C. Aggregation of preferences in an environmental economics context: A goal programming approach. Omega 2002, 31, 89–95. [Google Scholar] [CrossRef]
- López, R.; Climent, J.; Gil, L. From desert to cloud forest: The non-trivial phenotypic variation of Canary Island pine needles. Trees 2008, 22, 843–849. [Google Scholar] [CrossRef]
- Sagarin, R.D.; Turnipseed, M. The Public Trust Doctrine: Where Ecology Meets Natural Resources Management. Annu. Rev. Environ. Resour. 2012, 37, 473–496. [Google Scholar] [CrossRef]
- Spies, J.; Devisscher, T.; Bulkan, J.; Tansey, J.; Griess, V.C. Value-oriented criteria, indicators and targets for conservation and production: A multi-party approach to forest management planning. Biol. Conserv. 2019, 230, 151–168. [Google Scholar] [CrossRef]
- BOE. Real Decreto 1494/2011, de 24 de octubre, por el que se regula el Fondo de Carbono para una Economia Sostenible. Boletín Oficial Del Estado. 2011. Available online: https://www.boe.es/buscar/doc.php?id=BOE-A-2011-17631 (accessed on 2 December 2019).
- BOE. Real Decreto 1492/2011, de 24 de octubre, por el que se aprueba el Reglamento de valoraciones de la Ley de Suelo. Boletín Oficial Del Estado. 2015, pp. 61561–61567. Available online: https://www.boe.es/buscar/doc.php?id=BOE-A-2011-17629 (accessed on 2 December 2019).
- Glur, C. Ahp: Analytic Hierarchy Process. 2018. Available online: https://CRAN.R-project.org/package=ahp (accessed on 9 September 2021).
- Cho, F. Analytic Hierarchy Process for Survey. Data in R. 2019. Available online: https://cran.r-project.org/web/packages/ahpsurvey/vignettes/my-vignette.html (accessed on 9 September 2021).
- Cáceres-Hernández, J.J.; González-Gómez, J.I.; Nuez-Yánez, J.S.; Ramos-Henríquez, J.M. Impacto de la reforma del Régimen Especial de la Seguridad Social Agraria en la agricultura canaria. Econ. Agrar. Recur. Nat. 2012, 10, 183. [Google Scholar] [CrossRef] [Green Version]
- López, L.A.; Cadarso, M.A.; Gómez, N.; Tobarra, M.Á. Food miles, carbon footprint and global value chains for Spanish agriculture: Assessing the impact of a carbon border tax. J. Clean. Prod. 2015, 103, 423–436. [Google Scholar] [CrossRef]
- Harker, P.T. Incomplete pairwise comparisons in the Analytic Hierarchy Process. Math. Model. 1987, 9, 837–848. [Google Scholar] [CrossRef] [Green Version]
- Ferreira da Silva, E.; Fernandes da Silva, G.; Orfanó Figueiredo, E.; Ribeiro de Mendonça, A.; Junio de Oliveira Santana, C.; César Fiedlerb, N.; Pereira Martins Silva, J.; Otone Aguiar, M.; Silva Santos, J. Optimized forest planning: Allocation of log storage yards in the Amazonian sustainable forest management area. For. Ecol. Manag. 2020, 472, 118–231. [Google Scholar] [CrossRef]


| Distribution | Median | Average |
|---|---|---|
| Weibull | 5.19 | 12.54 |
| Lognormal | 4.45 | 16.53 |
| Gamma | 4.01 | - |
| loglogística | 4.50 | 66.92 |
| Exponential | 7.89 | 11.38 |
| Aij | Valid When Criterion i is Compared with Criterion j: |
|---|---|
| 1 | equally important |
| 3 | slightly more important |
| 5 | far more important |
| 7 | arguably more important |
| 9 | absolutely more important |
| Zone Typology | Purpose | Direct Use Value (€/m2) | Total Direct Use Value (€) |
|---|---|---|---|
| Zone of exclusion (397.6 ha.) | Use for scientific or conservation purposes (art.12 PRUG) | 2.99 | 11,904,529.67 |
| Zone of restricted use (1276.5 ha.) | Reduced public use (art.13 PRUG) | 38,219,648.20 | |
| Zone of moderate use (5714.3 ha.) | Public, forestry and agricultural use (art.14 PRUG) | 171,091,684.87 | |
| Zone of traditional use (94.6 ha.) | Traditional agricultural use (art.15 PRUG) | 8.98 | 8,497,246.34 |
| Zone of special use (7.1 ha.) | Pre-existing rural or urban settlements (art.17 PRUG) | 264.43 | 18,777,600.00 |
| General area of use (48.5 ha.) | Use for recreational and educational-environmental activities (art.16 PRUG). | 260.8 | 126,488,000.00 |
| Total Direct Use Value | 374,978,709.08 | ||
| Weights | Use/Non-Use Matrix | Direct Use Value/Indirect Use Value/Option Value/Existence Value/Legacy Value—Matrix | |||
|---|---|---|---|---|---|
| Aggregate Individual Preferences_Eigenvector | Standardized Vector | Aggregated Weights_Eigenvector | Standardized Vector | Final Weighting | |
| Direct use value | 0.44 | 0.54 | 0.13 | 0.1413 | 0.076 |
| Indirect Use Value | 0.58 | 0.6304 | 0.342 | ||
| Option Value | 0.21 | 0.2282 | 0.123 | ||
| Existence Value | 0.37 | 0.46 | 0.32 | 0.3809 | 0.175 |
| Legacy Value | 0.52 | 0.6190 | 0.284 | ||
| Total | 0.81 | 1 | 1 | ||
| Type of Value | Final Weighting | Value in Euros | Value per Use (€) | |
|---|---|---|---|---|
| Direct use value | 0.076 | 374,978,709.08 | Use | 2,669,256,337.00 |
| Indirect use value | 0.342 | 1,687,404,190.86 | ||
| Option value | 0.123 | 606,873,437.06 | ||
| Existence value | 0.175 | 863,437,816.96 | Non-use | 2,264,674,045.63 |
| Legacy value | 0.284 | 1,401,236,228.67 | ||
| Total economic value of the Tamadaba Natural Park | 4,933,930,382.63 | |||
| Stats. | Direct Use Value | Indirect Use Value | Option Value | Existence Value | Legacy Value |
|---|---|---|---|---|---|
| mean | 0.1441 | 0.6007 | 0.2550 | 0.4048 | 0.5951 |
| s.d. | 0.063 | 0.135 | 0.141 | 0.246 | 0.246 |
Publisher’s Note: MDPI stays neutral with regard to jurisdictional claims in published maps and institutional affiliations. |
© 2022 by the authors. Licensee MDPI, Basel, Switzerland. This article is an open access article distributed under the terms and conditions of the Creative Commons Attribution (CC BY) license (https://creativecommons.org/licenses/by/4.0/).
Share and Cite
Hernández-Alemán, A.; Cruz-Pérez, N.; Santamarta, J.C. Rethinking Legal Criteria for Assessing Compensation for Rural Land Expropriation: Towards a European Institutional Framework. Land 2022, 11, 194. https://0-doi-org.brum.beds.ac.uk/10.3390/land11020194
Hernández-Alemán A, Cruz-Pérez N, Santamarta JC. Rethinking Legal Criteria for Assessing Compensation for Rural Land Expropriation: Towards a European Institutional Framework. Land. 2022; 11(2):194. https://0-doi-org.brum.beds.ac.uk/10.3390/land11020194
Chicago/Turabian StyleHernández-Alemán, Anastasia, Noelia Cruz-Pérez, and Juan C. Santamarta. 2022. "Rethinking Legal Criteria for Assessing Compensation for Rural Land Expropriation: Towards a European Institutional Framework" Land 11, no. 2: 194. https://0-doi-org.brum.beds.ac.uk/10.3390/land11020194