Article

Ecological Recycling Agriculture to Enhance Agro-Ecosystem Services in the Baltic Sea Region: Guidelines for Implementation

1
Institute of Land Use Systems, Leibniz Centre for Agricultural Landscape Research (ZALF) e.V., 15374 Müncheberg, Germany
2
Biodynamic Research Institute, 15391 Järna, Sweden
*
Author to whom correspondence should be addressed.
Submission received: 29 April 2015 / Revised: 5 August 2015 / Accepted: 6 August 2015 / Published: 20 August 2015
(This article belongs to the Special Issue Agro(Eco)System Services—Supply and Demand from Fields to Society)

Abstract

:
Eutrophication caused by agriculture is an increasing ecological threat to the Baltic Sea. Modern, resource-efficient farming systems based on integrated plant and animal production, effective nutrient recycling and low external inputs can enhance multiple agro-ecosystem services, resulting in reduced pollution. Practical examples of such farming systems are not widespread. Therefore, the Baltic Ecological Recycling Agriculture and Society (BERAS) Implementation project aimed to foster this systemic shift. In this paper, agronomic strategies are described to improve nitrogen (N) efficiency for the conversion to ecological recycling agriculture (ERA). First, N farm gate balances of 22 farms in conversion are presented. They showed a large variation from −9 to 90 kg∙N∙ha−1∙a−1. Then, the use of guidelines and advisory tools to improve the nitrogen efficiency is described. The legume estimation trainer and nitrogen budget calculator help assess and optimize the nitrogen supply from legumes under farming conditions. The application of the crop rotation planning tool “ROTOR” guides advisors and farmers to identify agronomically and environmentally sound rotations. The tools can help overcome key agronomic constraints by implementing ERA. The necessity of accompanying measures from policy and the need to change food consumption patterns are discussed.

1. Introduction

Eutrophication is one of the most severe environmental problems for the coastal and marine ecosystems of the Baltic Sea, which has the world’s largest “dead” zones (close to 60,000 square kilometers), with concentrations of oxygen below 2 mL∙L−1 and an increasing occurrence of hypoxia in coastal areas [1,2,3]. Eutrophication is caused by excessive inputs of nutrients [3,4] and agriculture accounts for approximately 50% of the total nitrogen and phosphorus load to the Baltic Sea [5]. A similar situation occurs in the Gulf of Mexico, the second largest hypoxic ecosystem. In this area, agricultural sources contribute more than 70% of the nitrogen and phosphorus delivered to the Gulf of Mexico [6].
The type and intensity of a farming system has a major impact on ecological services beyond food production. Modern agricultural systems in Europe are very productive but only because they are highly dependent on external inputs [7,8]. The main inputs are mineral fertilizers produced with the help of fossil energy and protein fodder that is often imported from other countries. Both of these inputs are responsible for serious environmental problems. Mineral N-fertilizers cause severe greenhouse gas emissions and leaching to water bodies; the imported fodder causes deforestation to give way for, e.g., soybean [8]. Moreover, pesticide-based plant protection has led to vast ecological problems in the Baltic Sea and in many other ecosystems, posing a threat to humans [9].
In 1974, seven countries around the Baltic Sea signed the Helsinki Convention, a historical agreement to protect the Baltic marine environment. In 1987, all of the countries agreed that by 1995, there should be a 50% reduction of the nutrient load reaching the Sea based on the losses in 1987. This goal has not been achieved [10]. Recent results indicated that only 11 out of 189 “areas” of the Baltic Sea were classified as “areas not affected by eutrophication” [10]. If this trend cannot be reversed, the target of a good environmental status for the Baltic Sea that HELCOM adopted in 2007 with the Baltic Sea Action Plan (BSAP) [11] will not be met by 2021.
The enlargement of the EU into the Baltic region led to the intensification of agricultural production and increased fertilizer use in the catchment [4] and, therefore, greater pollution of the Baltic Sea [12,13]. Based on the official statistics from the respective countries around the Baltic Sea, Granstedt [8] demonstrated that the nitrogen surplus increased from 2000 to 2009 in the Baltic States (Lithuania, Latvia, Estonia) from below 10 kg up to 30 kg∙N∙ha−1∙a−1. In Poland, the nitrogen surplus increased from approximately 50 kg∙N∙ha−1 up to 70 kg∙N∙ha−1∙a−1. Poland is the largest exporter of riverine N and P to the sea, and it is expected to reduce N loads by ca. 25% and P loads by ca. 60% when compared to the average loads in 1997–2003 [14]. In Denmark, a reduction of only 20 kg N from a very high level of nearly 140 kg∙N∙ha−1∙a−1 was reached. Sweden and Finland remained at a surplus of approximately 80 kg∙N∙ha−1∙a−1 [8]. The total N surplus for Germany amounted 98 kg∙N∙ha−1∙a−1 for 2012, although this was approximately 20 kg less than in 2000 [15]. This means that the goal of a tolerable maximum of 60 kg∙N∙ha−1∙a−1 according to the European nitrate directive is still not visible [16,17].
It is important to stress that the N surplus in agriculture corresponds with the livestock density per hectare, as the nitrogen surplus can be up to 50% higher in regions with high animal densities [8,18,19]. In 2010, Denmark had the highest densities in the riparian countries with 1.86 livestock units (LU) per hectare, followed by Germany with 1.07 LU∙ha−1 [20]. However, there were high regional differences within the countries. In the German catchment area, the highest densities were found in Schleswig-Holstein, while Mecklenburg-Western Pomerania had only half as much [21]. Poland reached 0.72 LU∙ha−1, and the Baltic States reached approximately 0.3 LU∙ha−1 [20]. In Sweden, the average density was low (0.57 LU∙ha−1) but twice as high in the southern parts [22]. According to Larsson and Granstedt [22], the animal density of these specialized conventional farms was two to three times higher than the amount of fodder that can be produced on these farms. That is why high amounts of fodder have to be imported. Moreover, the manure production in these systems was much higher than what could be utilized in an ecologically sound manner in the conventional farm’s own crop production. Consequently, the nitrogen balance of those farms was very high, with up to 130 kg∙N∙ha−1∙a−1 [8].
Nutrient balances describe the magnitude of potential nutrient losses from farming systems to the environment. They are commonly accepted agri-environmental indicators for sustainability [23,24] and are used for policy recommendations, good agricultural practices and farm management [25]. In contrast to conventional systems, organic agricultural systems’ external inputs are greatly limited, as is the animal density. Many investigations comparing both systems showed significantly positive effects from organic farming concerning a broad range of biotic and abiotic indicators (e.g., [26,27,28,29]). In particular, farm gate nitrogen balances in different countries during the last 15 years showed huge differences between conventional and organic farms (Table 1 [23,30,31,32,33,34,35,36,37,38,39,40]). In total, the average N surplus of organic farms was 68% lower than on conventional farms. The data indicated that the level of 60 kg∙N∙ha−1∙a−1 was exceeded, on average, by all of the conventional studies except one. Only two studies in Denmark and Sweden identified higher values for organic farms, which were caused by high fodder import during the observed period.
Table 1. Studies reporting N surpluses of organic farms in comparison to conventional farms (*: arable farms, **: dairy farms).
Authors, CountryOrganic (kg·ha−1·a−1)Conventional (kg·ha−1·a−1)
Taube & Poetsch, Austria [30]2437
Schmid et al., Germany [31]364
Kelm et al., Germany [23] *2280
Haas et al., Germany [32]3180
Johnsson, Sweden [33]2790
Severin & Engelke, Germany [34]2297
Kelm et al., Germany [23] **42127
Schader et al., Luxemburg [35]35134
Gruber et al., Austria [36]4,4142
Oeborn et al., Sweden [37]25143
Scheringer, Germany [38]56143
Cedering & Flyjsoe, Sweden [39]71158
Kristensen et al., Denmark [40]104174
Consequently, the concept of ecological recycling agriculture (ERA) was previously developed by Granstedt [41]. ERA is based on the EU regulations for organic farming [42] and focuses on using local and renewable resources and on a high rate of farm internal nutrient recycling. Animal and crop production are integrated on each farm or farms in close proximity. High self-sufficiency in fodder production limits animal density and leads to a more even distribution of animals, geographically [8]. In ERA, nitrogen requirements are covered by the biological fixation of legumes and manure produced on the farm. Granstedt et al. [43] calculated that the application of the ERA-concept in all EU countries of the Baltic Sea Region would halve the N surplus, reduce the phosphorus surplus to zero and cause no pesticide pollution. Therefore, a systemic shift to ERA can help restore the ecological balance of the Baltic Sea. It would be even more efficient if stakeholders along the whole food chain included changes within the consumption patterns [22,44].
The ERA concept is rarely implemented, mainly because of knowledge gaps among practitioners, insufficient market development and the poor political willingness to reward resource-efficient farming systems [44]. In particular, organic farming in the Central and Eastern European Countries (CEEC) that joined the EU in 2004 needs special support for implementation [44]. Farmers need more practical information to assess and improve the nutrient fluxes within the farm, especially to optimize the nitrogen management through legume cultivation, as this is the most important N-source for ERA farms. This paper draws on the results from the Baltic Ecological Recycling Agriculture and Society (BERAS) Implementation project, filling the gaps of farmers’ knowledge and providing them adequate strategies and tools for implementing, assessing and improving ecological recycling agriculture to enhance multiple agro-ecosystem services in the Baltic Sea region.
The objectives were to (i) show the status quo of N balances of organic farms that are in conversion to ERA and (ii) demonstrate advisory tools to overcome key agronomic constraints with a focus on sufficient N supply through legumes and the planning of agronomically sound crop rotations.

2. Material and Methods

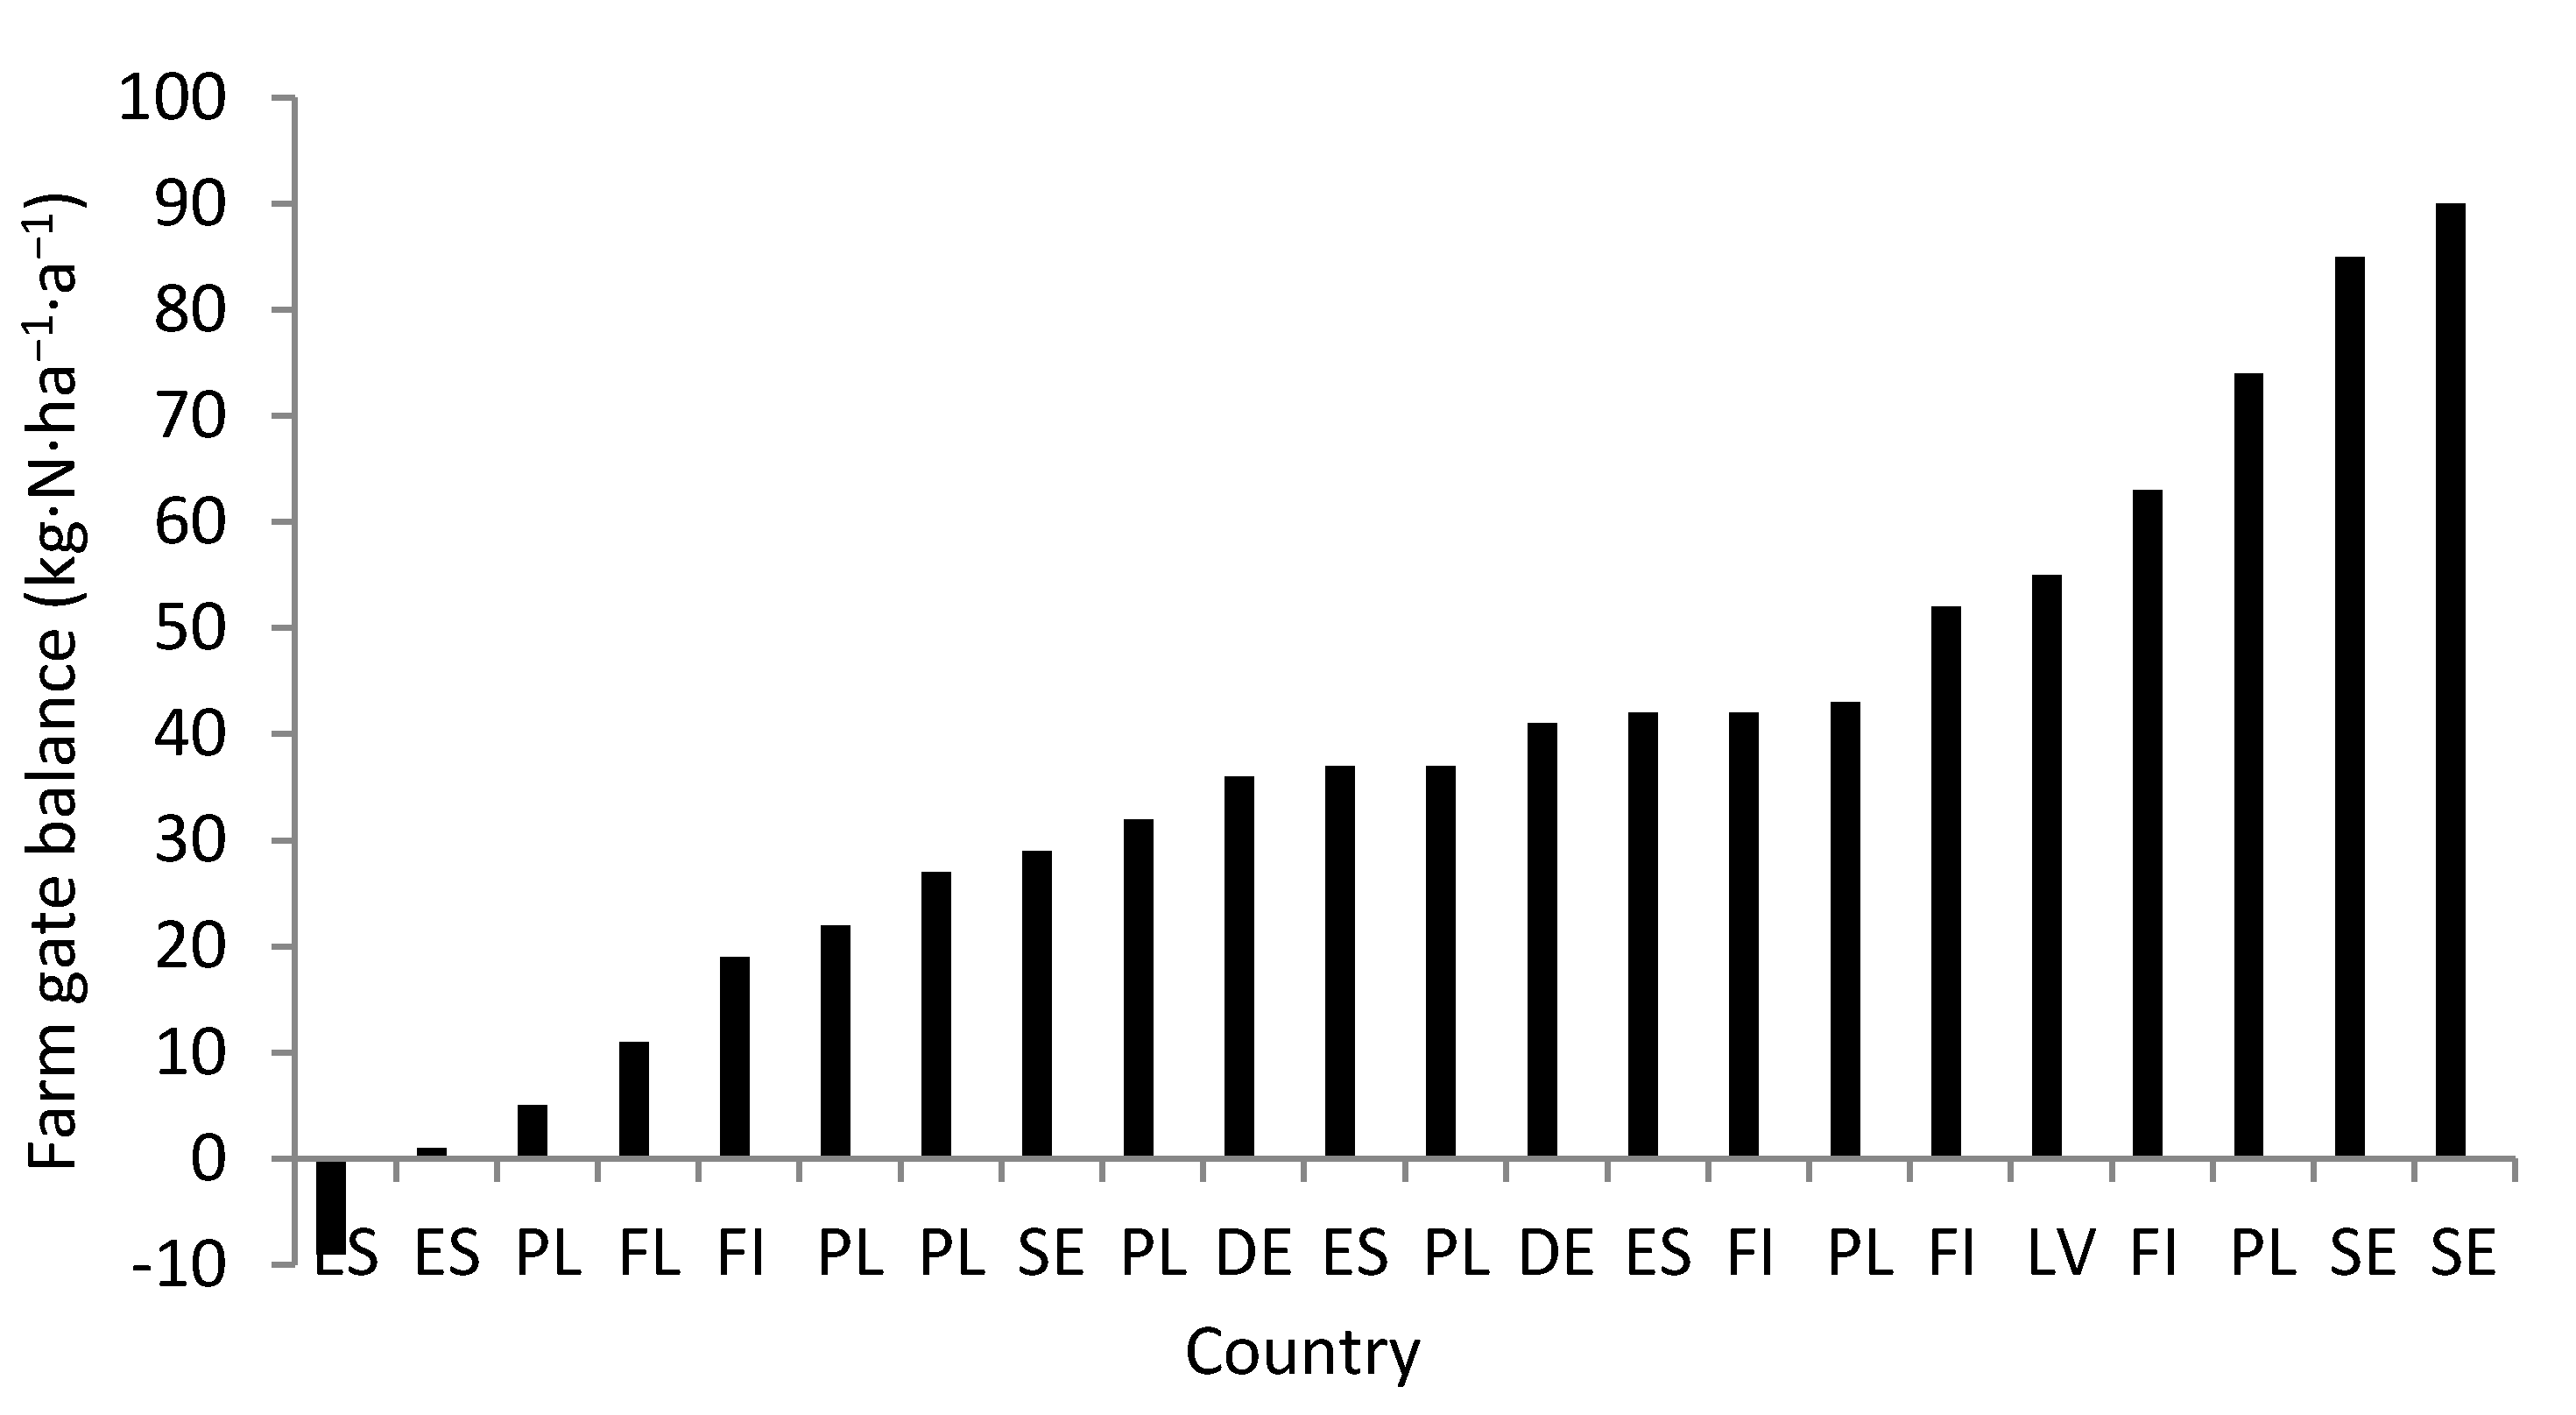
2.1. Farm Gate Nitrogen Balances

In collaboration with local advisors and farmers in the countries around the Baltic Sea, 22 organic farms and farms in conversion were selected to investigate nitrogen fluxes using farm gate balances. The standardized data collection was coordinated by the Biodynamic Institute in Sweden, while the calculations were conducted with the official STANK in Mind programme 2:1 [45] for farm gate balances from the Swedish Board of Agriculture, and averaged per farm, hectare and year. The calculations were based on the differences between the import (input) of nitrogen, including fertilizers from outside the farm, imported fodder and manure, nitrogen fixation and atmospheric nitrogen, and the export (output) of nutrients via sales of plant and animal products and exported manure [43]. In accordance with the methodology of farm gate balances, calculations of N-losses like N-leaching and gaseous N-losses were not included. N-losses via leaching were implemented in the crop rotation planning and evaluation tool ROTOR (see Section 2.2 (iii)). The investigations took place during 2011 and 2012.

2.2. Advisory Tools

Guidelines for the conversion to ERA, including relevant literature for resource-efficient agriculture, economics and marketing, were developed during an iterative process with advisors and scientists from countries around the Baltic Sea in five workshops [46]. A core group of 10 advisors and scientists coordinated the work, and 32 authors from different countries were involved to include country specific aspects. The guidelines were translated into the seven languages of the riparian countries to increase the transfer of knowledge to farmers and advisors. Here, we focus on three software tools that were included in the guidelines [46] to support their application:
(i)
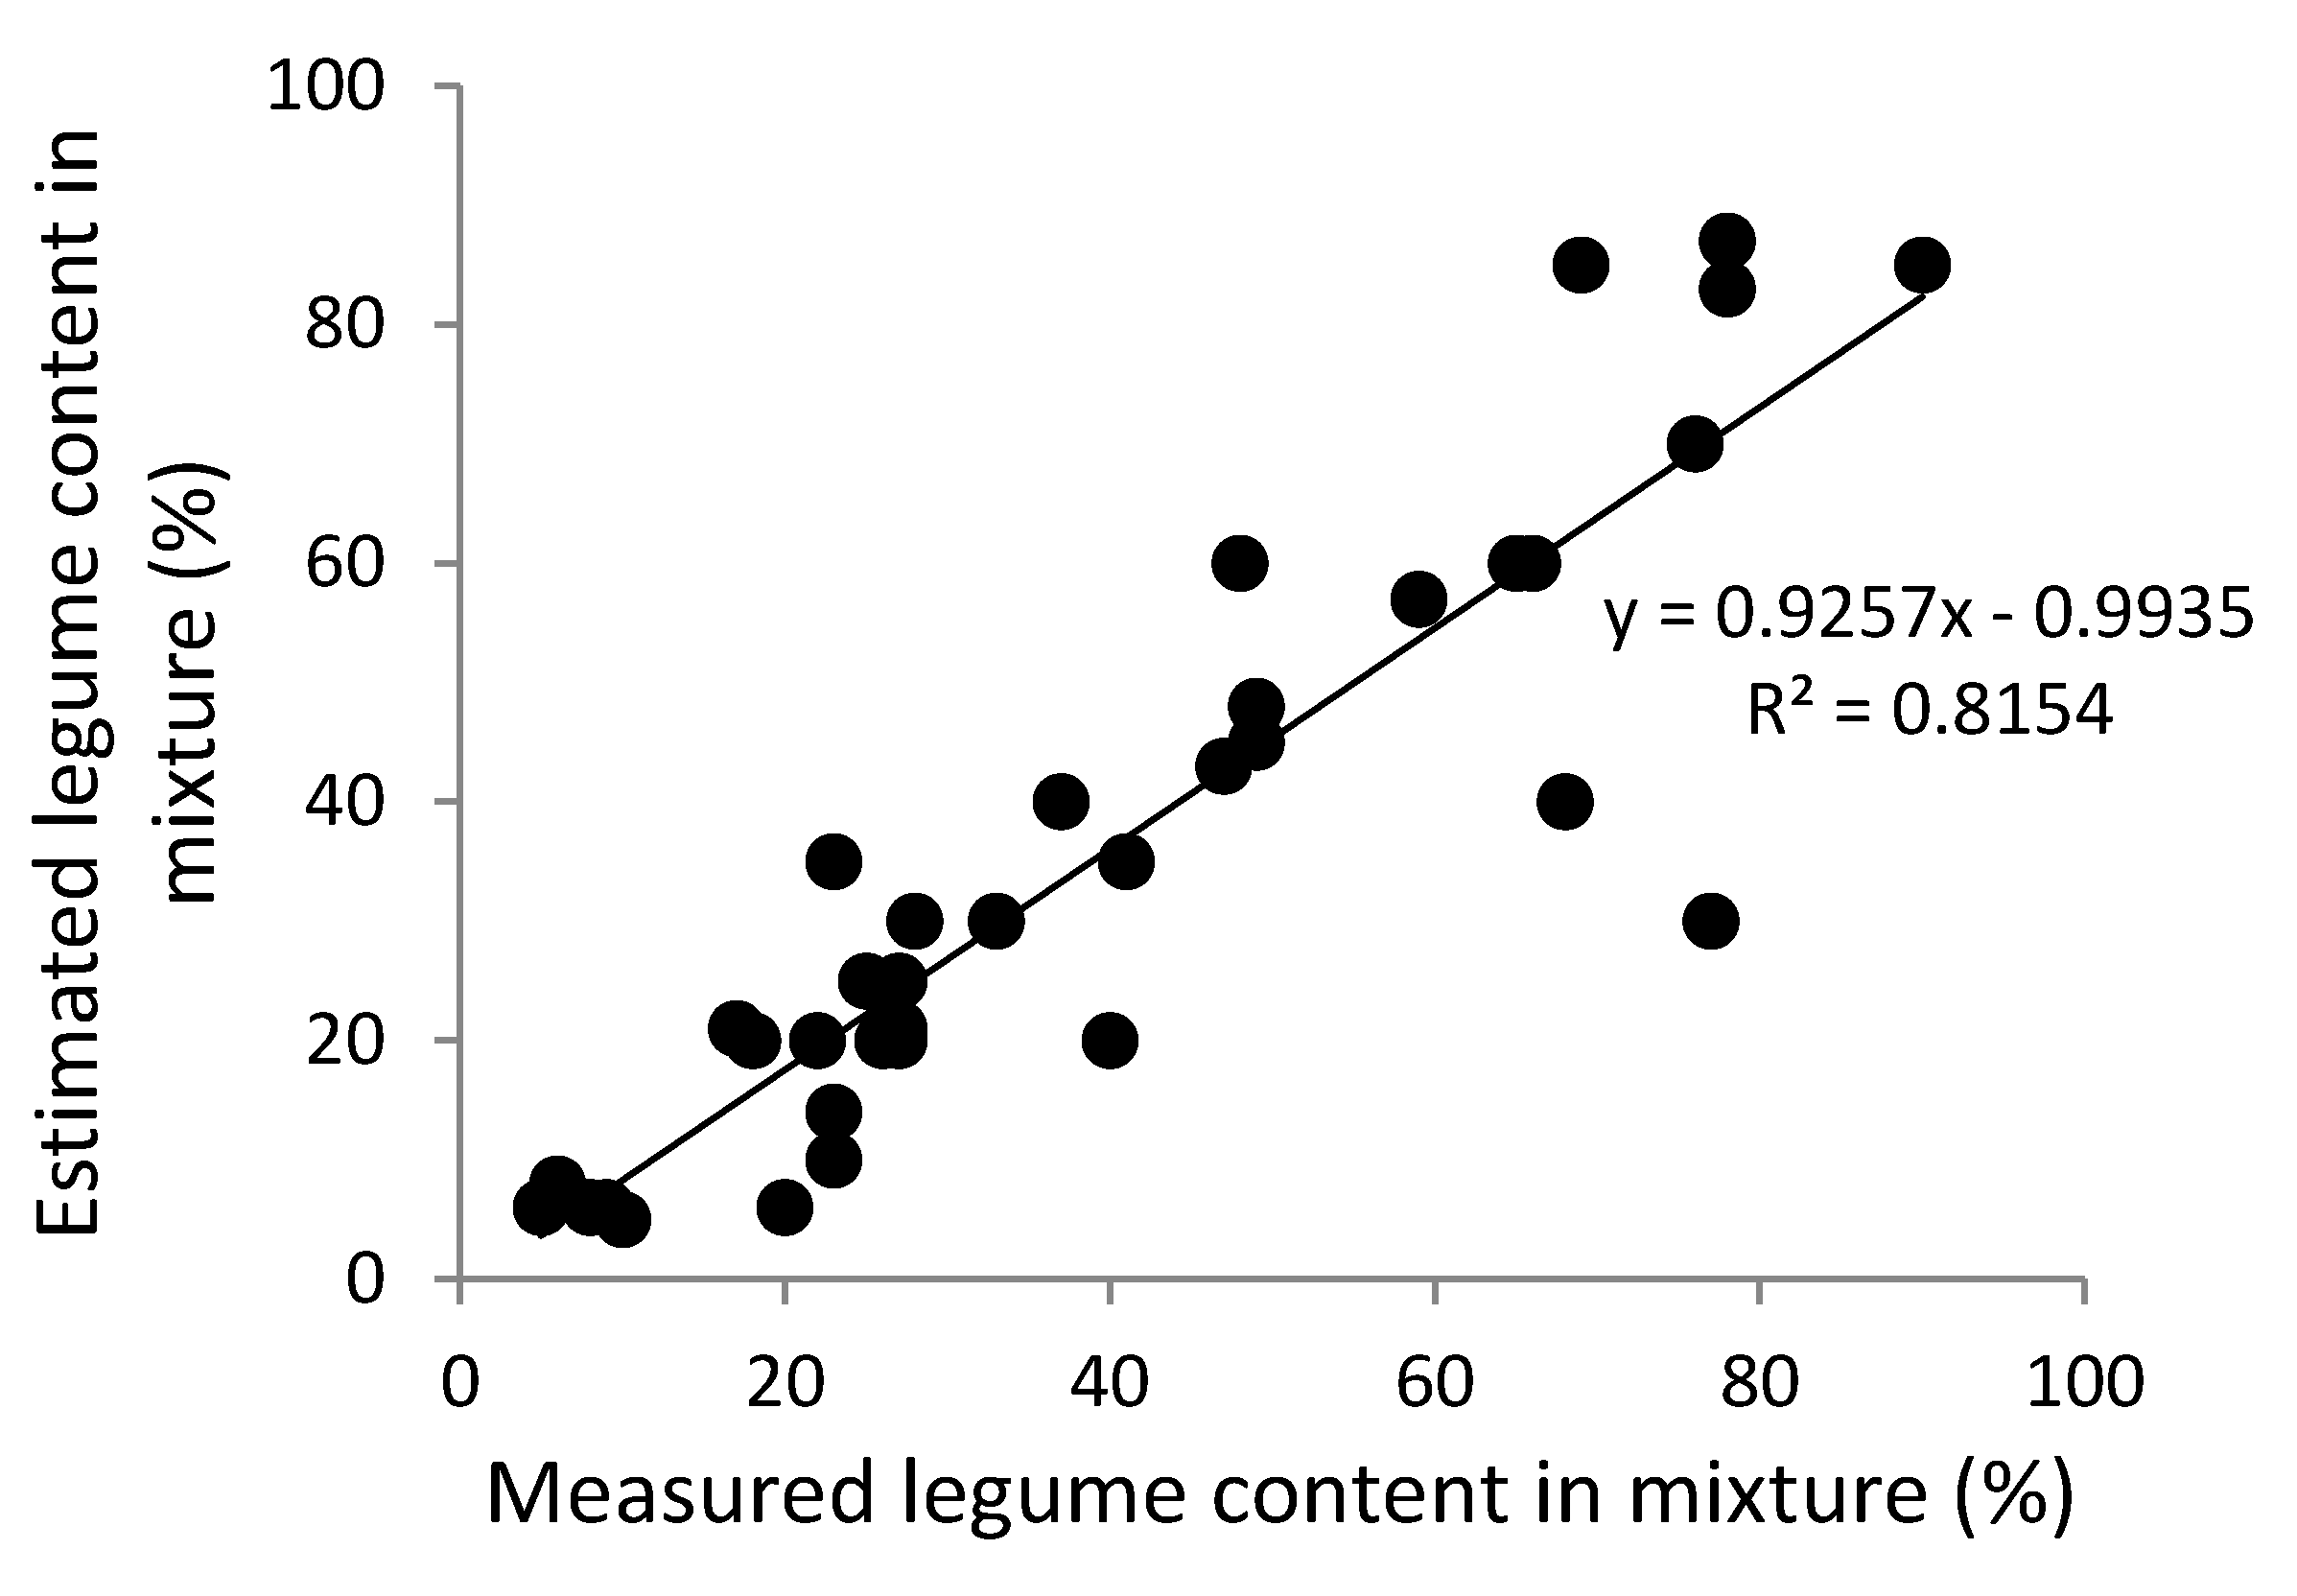
The nitrogen management from legumes is crucial within crop rotations. We present a computer based learning tool for a better estimation of the legume proportion in legume-grass leys. Pictures of various legume-grass mixtures at different stages of maturity are generated randomly and allow the user to estimate the legume percentage of dry matter yield by choosing one of five equidistance classes between 0% and 100%.
(ii)
To estimate the N input (as biological N fixation) and N output (through crop harvest) of one or several cuts of legume-grass mixtures, we present the nitrogen budget calculator. The yield is calculated from the crop height or it is entered as a value. The harvested yield at the 5 cm cutting height is calculated using official standard values for dry matter and harvest losses (green forage with 20% dry matter (DM) and 5% harvest losses, silage with 35% DM and 20% harvest losses, hay with 85% DM and 35% harvest losses, mulching with 20% DM and 10% gaseous losses through NH3-volatilisation [46]). The N content of the harvested crop is calculated according to the legume proportion with standard values. All of the values could be changed to implement other data. Further N losses (e.g., leaching and denitrification) are assumed to be balanced by the atmospheric deposition and non-symbiotic N-fixation and are therefore neglected.
(iii)
We present the crop rotation planning and evaluation tool ROTOR (ROTationORganic) to design crop rotations, using examples from different countries. ROTOR is used to evaluate organic crop rotations and to explore agro-ecological optimization strategies. It includes a nitrogen-module that calculates site- (soil type, annual and winter precipitation) and crop- (preceding and cover crop) specific annual N-balances for whole crop rotations including N-inputs (N-fixation, manure), N-removal and nitrate leaching. Additionally, a module is implemented to calculate the soil organic carbon (SOC) balances. A detailed description of the tool was provided by Bachinger and Zander [47]. ROTOR was originally calibrated for crops grown on sites in North-Eastern Germany. The tool was further adapted to allow the assessment of rotations in other countries of the Baltic Sea Region and the user interface was improved. ROTOR version 2.4 was used (free download at: www.zalf.de) for the application presented in this paper. Agronomists from Poland, Sweden and Germany provided yield data for an initial calibration and confirmed the plausibility of the model outputs. The assessment presented here included (i) nitrate-N leaching, (ii) nitrogen balance, (iii) SOC balance and (iv) infestation risks from problematic winter annual, spring annual and perennial weeds. Typical crop rotations from organic farms were provided by advisors. Optimization strategies (i.e., higher legume percentages, cover crops, manure application and changes in the crop sequence) were explored using the ROTOR planner.

3. Results

3.1. Farm Gate Nitrogen Balances

Livestock units in the investigated 22 farms ranged from 0.1 and 1.0 per hectare. Figure 1 shows the nitrogen surpluses and deficits between minus 9 to plus 90 kg∙N∙ha−1∙a−1, with an average of 37 kg∙N∙ha−1∙a−1. One farm with a negative N value was an extensively managed farm with 0.15 LU per ha, a low proportion of legumes in the rotation and no purchase of fodder. Four farms in conversion reached values above 60 kg∙N∙ha−1. Their rate of imported fodder was 30% to 50%, which contributed to the overall N surplus.
Figure 1. Farm gate N balances of 22 farms from Estonia (ES), Finland (FI), Germany (DE), Latvia (LV), Poland (PO) and Sweden (SE) in the Baltic Sea catchment area (2011–2012).
Land 04 00737 g001

3.2. Advisory Tools

The farming guidelines as comprehensive advisory materials for implementing ERA farming [46] present proven agronomic measures and optimization strategies for effective nutrient recycling within the farm and between different farm types during and after the conversion. The following tools are included in these guidelines. A focus is on the share of legumes in a rotation as a key factor for resource-efficient farming systems. To be self-sufficient in nitrogen, farms need to reach a proportion of 25%–30% legumes in the crop rotation. As nitrogen from clover-grass swards are the main N source, the specific proportion of clover in these mixtures must be taken into account. In Table 2, we present the total share of legumes in a 6-year rotation, taking the legume proportion of clover-grass swards into account. To achieve at least 25% legumes in the rotation, 33% of clover-grass with at least a proportion of 80% clover would be necessary. If less clover-grass was grown in the rotation, additional legumes (e.g., grain legumes) needed to be included.
Table 2. Calculation of the amount of legumes in a 6 year crop rotation.
Crop/Crop MixturePortion of the Crop in the 6-Year Rotation (%)Legume Portion in the Harvested Product (%)Total Share of Legumes in the Rotation (%)
2 years clover-grass333010
2 years clover-grass338025
1 year pea/oat intercropping17508
1 year grain legumes as fodder1710017

3.2.1. Legume Estimation Trainer

In practice, legume proportions can vary between <10% and >90%, depending on the amount of legume seed in the seed mixture, site conditions, management practices and duration of cultivation. The estimation of the legume percentage in the sward is essential to assess the nitrogen fixation from clover-grass on a farm level, but it is difficult to calculate under farming conditions. The estimation needs to be conducted in the field at harvesting time. A training tool for farmers and advisors allows them to practice and improve these skills in mixtures of legume-grass leys. During a course, 15 farmers and advisors from different countries trained their estimation skills with that tool. After a short training period, the estimated legume proportions were compared with the measured proportions and showed good estimation skills (Figure 2). Accurate estimations are a prerequisite for precise N-budgets e.g., using the nitrogen budget calculator and ROTOR.
Figure 2. Correlation between measured and estimated legume content in legume-grass mixtures for users of the legume estimation trainer after training.
Land 04 00737 g002

3.2.2. Nitrogen Budget Calculator

Farmers and advisors can use the N budget calculator for a quick assessment of N-fluxes in legume-grass mixtures based on a small number of input data, such as yield, harvesting method and legume proportion. The tool helps to assess the effect of different harvesting methods and the corresponding harvest losses of N-rich leaf material (case A) and different legume proportion (case B) as variable parameters on the N budget (Table 3). Varying N-budgets were caused by changes and ranged between −12 kg·ha−1 and 56 kg·ha−1 in case A, and −42 kg·ha−1 and 32 kg·ha−1 in case B. Especially by making hay (case A), higher harvest losses of N-rich leaves mean less N-removal, resulting in a more positive N-budget at the field level. To achieve a positive budget by making green forage, the legume proportion in the mixture should be above 50%. At least 50% legumes are necessary in case B as well. The legume proportion can be visualized with the legume estimation trainer.
Table 3. Calculation of the nitrogen budget with the N budget calculator.
Case A 1 Case B 2
Harvesting MethodN Budget (kg·ha−1) Legume Portion (%)N Budget (kg·ha−1)
Green forage−12 20−42
Silage4 40−12
Hay24 6013
Mulching56 8032
1: yield of 3 t·ha−1 and legume proportion of 40%; 2: yield of 3 t·ha−1 of green forage.

3.2.3. Crop Rotation Planner (ROTOR)

The advisors from the BERAS network assessed the crop rotations from farms in Sweden, Poland and Germany using ROTOR to quantify the current agronomic constraints and environmental impacts and to identify optimization strategies. In organic farms, sandy soils with low-to-medium soil quality in northeastern Germany and western Poland allowed yields of winter wheat of 3–4 t·ha−1. In southern Sweden, with better soils, the winter wheat yield was 5–6 t·ha−1. In the model, the percentage of legumes in the crop rotation and the percentage of legumes within the legume-grass mixture were simulated. The amount of manure was mainly applied to two crops in the rotation. As the number of animals must match the fodder production, the amount of manure is limited in ERA systems. In cattle farms with 1.0 LU per ha, approximately 8–9 t of farmyard manure is produced per year, depending on the stable system. Within a six year crop rotation, approximately 50 t per hectare could be applied.
Table 4 shows that low legume proportions in the legume-grass swards (30%) at all of the sites caused negative N-balances, which indicated an insufficient supply of N (rotations 1a, 2a, 3a, 4a, 5a, 5b, 6a). A feasible optimization strategy would be to increase the percentage of legumes in the legume-grass mixtures (up to 60%) or to grow additional grain legumes. Due to fairly low animal densities, the low amounts of N from manure could be compensated for with a higher proportion of legumes in the mixture (2d: 80%). Rotations 2a–2c and 4a–4b showed a moderate perennial weed infestation risk. ROTOR recommended additional mechanical weed control, best as stubble tillage after winter wheat (not shown in Table 4). Nitrate-N leaching was higher in the rotations with potatoes (rotation 5). Catch crops before silage maize and potatoes could only slightly reduce leaching (7% and 11%). The changes of the crop sequence by replacing maize with winter triticale reduced leaching by 44%. Replacing oat with winter triticale and growing potato with a catch crop in rotation 6 reduced leaching by 61% when compared to rotation 5. The C-balances were positive in all of the rotations, contributing to C-sequestration. The highest C-balances were achieved with high shares of legume-grass combined with an increased manure application (rotations 2c, 3c, 4a, 4b). For the C-balance, ROTOR does not take the percentage of legumes in the mixtures into account.
Table 4. Crop rotations and optimization strategies assessed with the crop rotation planning tool ROTOR.
Crop Rotations*Legume in LG (%)Legume in Rotation (%)Manure (t·ha−1 Rotation)N Leaching (kg·ha−1·a−1)N-Balance (kg·ha−1·a−1)C-Balance (kg·ha−1·a−1)Weed Infestation Risk (score)**
Perennial WeedsSpring WeedsWinter Weeds
Northeastern Germany, loamy sand (6-year rotations)
1aLG-LG-WW-SM-L-WR30275016−233390.00.70.3
1bLG-LG-WW-SM+CC-L-WR603850152350−0.20.70.2
2aLG-LG-WW-WT-O-WR30105010−23313−0.7−0.51.0
2bLG-LG-WW-WT-L-WR6037501513590.3−0.21.0
2cLG-LG-WW-WT-L-WR60378015185450.3−0.21.0
2dLG-LG-WW-WT-L-WP8037251522530.3−0.21.0
Southern Sweden, loam (5- and 7-year rotations)
3aLG-LG-LG-WW-F-WR-O30274015−403710.00.10.3
3bLG-LG-LG-WW-F-WR-O60404014−23710.00.10.3
3cLG-LG-LG-WW-F-WR-O60408014165530.00.10.3
4aLG-LG-LG-WW-O30184010−365430.2−0.40.0
4bLG-LG-LG-WW-O5030401015430.2−0.40.0
Western Poland, loamy sand (5-year rotations)
5aLG-WW-OP-PO-O30164028−33148−0.81.00.0
5bLG-WW-OP-PO+CC-O60226025−2288−1.01.0−0.2
6aLG-LG-WW-PO-WR30124013−25271−0.40.00.4
6bLG-LG-WW-PO+CC-WR602440115284−0.60.00.2
*LG = legume − grass mixtures, WW = winter wheat; PO = potato; PO + CC = potato with catch crop; WR = winter rye; WT = triticale; O = oat; SM = silage maize; SM + CC = silage maize with catch crop; L = lupin; F = faba bean; OP = oat − pea intercropping; cattle manure is applied with the default values implemented in ROTOR 2.4 (20% DM, 4 kg N t−1 FM, 20% N availability, 5% N application losses) to one or several crops in the rotation, values for the whole rotation; cereal straw harvested. ** Weed infestation risk was compared using a score from −4 up to +4, where negative values indicated a reduction and positive values indicated an increase in the infestation risk. For perennial weeds, values ≤ 0 and annual weeds values ≤ 1 were assumed to be manageable with common mechanical weed control [47].
In the German examples, the 6-year crop rotations with 2 years of legume-grass with a legume proportion of 60% in the mixture and lupin resulted in a good N supply with high environmental services, reducing agronomic constraints. In the Swedish examples, similar results occurred where 3 years of legume-grass was common. Crop rotations with potatoes in Poland needed at least 24% legumes in the rotation to reach a positive N balance and catch crops that reduced nitrate leaching.

4. Discussion

In this study, we focused on implementing strategies and advisory tools for the conversion to ecological recycling agriculture [8,41] to reduce nutrient losses from agriculture to the Baltic Sea. Based on the farm gate balances of organic farms, we showed both the need and the potential to improve the nitrogen efficiency on the farm level. We also described advisory tools as part of the guidelines [46] that can help overcome the key constraints of a sufficient nitrogen supply from legumes and to plan agronomically sound crop rotations.
The N-farm gate balances of the 22 developing ERA farms we investigated showed results similar (Figure 1) to the data reported by different studies for organic farms in Table 1. The high variation showed the potential for optimization strategies to avoid negative values as well as values above the allowed threshold of 60 kg∙N∙ha−1 per year [17]. One reason for the negative N balances could be an insufficient share of legumes in the crop rotations. The investigations of Kelm et al. [23] showed negative farm gate N balances on cash crop organic farms caused by the renunciation of legume-grass leys as the main crop in the rotation. The authors concluded that the legume catch crops plus grain legumes and organic fertilizers were not able to fill this N gap. Moreover, it must be taken into account that the sale of grains may lead to negative N balances. In organic farms, grain legumes should be used as protein fodder to contribute to internal N recycling via manure [48].
On the contrary, our own data showed that N surpluses occurred mainly on farms with a substantial import of fodder. Organic farming is increasing in the EU, and there are many different management systems ranging from non-livestock and low-input farms up to highly intensive specialized farms. Their environmental gains and optimization potentials are different. A way to increase their positive environmental impacts is to conduct targeted research within these farming systems [49,50].
We offer practical solutions to optimize the internal nitrogen efficiency using advisory tools. Resource-efficient farming systems strongly rely on legumes, mainly forage legumes [8]. The N-fixation of legumes is the main nitrogen input of ERA farms. To be highly self-sufficient in nitrogen, ERA farms need to reach a proportion of 25%–30% legumes in the crop rotation, mainly of perennial clover-grass leys. Therefore, it is essential to ensure a sufficient farm-internal nitrogen supply, which includes the optimization of N-input through symbiotic fixation. Moreover, it is necessary to improve the N-transfer to subsequent crops through farm- and site-specific crop rotation planning, including the effective use of the limited amounts of manure. There are also different strategies to avoid potential nitrate leaching after the plowing of legumes available (e.g., [46,51]).
In conventional systems, perennial legumes play a vanishingly small role, as they are mainly being replaced by maize for economic reasons [52]. However, legume-grass swards play a very important role, not just for N-fixation. They provide soil fertility and offer further multiple ecosystem benefits, such as plant health and wildlife biodiversity [29,50]. Moreover, they reduce greenhouse gas emissions and energy consumption by replacing mineral N fertilizer, and they reduce dependency on imported protein [32]. Therefore, the agro-ecosystem services provided by perennial legumes are high. For ruminants, legume-grass leys provide a valuable protein fodder.
As organic farming is nitrogen-limited, legumes are an efficient source of nitrogen for sustainable farming systems [53]. A precondition is that farmers and advisors are enabled to sufficiently estimate the legume proportion in the fields. With the help of the legume estimation trainer, farmers and advisors can learn and improve these skills (Figure 2). These data can be used with the N budget calculator to assess and improve the nitrogen efficiency of legume-grass swards. Negative N budgets indicate that the N-output exceeds the input and N is used from the soil resources. That means no N is contributed to the system and this management is not sustainable. On the other hand, positive N budgets lead to a net gain of N to the system which can be used by subsequent crops. To achieve positive N budgets, a change of management is required. Options are to increase the legume proportion, change the harvesting method or increase the yield (Table 3). In addition, the data can be used for crop rotation planning and optimization within ROTOR (Table 4).
Sustainable crop rotations require long-term strategic planning to build healthy soils, avoid phytosanitary risks, produce high-quality products and develop profitable farms [47,54]. Based on legumes, organic crop rotations provide a more diverse crop spectrum when compared to conventional farms [55], providing multifunctional benefits, including environmental and conservation goals [32,50]. With ROTOR, farmers can plan and evaluate complex crop rotations according to the site conditions, taking into account the legume proportion and limited amounts of manure due to the restrictions on stocking rates [56]. Moreover, weed infestation risks, carbon and nitrogen balances and the nitrate leaching potential were included. The results presented in Table 4 showed various management options to refine the given crop rotations to well-balanced nitrogen and agronomically and environmentally sound rotations. The results of the C balances indicated the explicit potential of C-sequestration in organic farming already determined by Gattinger et al. [29].
HELCOM [4] states that the intensified development of the industrial production of cattle, pigs and poultry in the Baltic Sea catchment area has led to the creation of a new segment of pollution point sources, adding significantly to nutrient loads. This fact supports the results of Granstedt [8], which showed that even tighter restrictions (e.g., on manure storage and the application or cultivation of catch crops) would have no effect over the long term, as long as major annual surpluses of plant nutrients, accumulated preferably on animal farms with high animal densities and high fodder purchase, continued. The ERA concept would limit the animal density per se without further restrictions [8].
Based on the nutrient reduction potential of resource-efficient agriculture [43], Larsson and Granstedt [22] addressed a further critical aspect concerning lower food production due to lower yields in ERA systems. Two meta-analyses showed that organic crop yields are 20% to 25% [57,58] lower than conventional crop yields. However, organic yields could be increased with a more efficient nutrient supply [58]. Larsson and Granstedt [22] showed, in different scenarios, that if the productivity of Swedish ERA-farms were introduced in Poland and the Baltic States, the same production of crop and animal products as the present average agriculture could be realized, provided that meat consumption was largely based on meat from ruminants.
Our current food system relies on the provision without the costs of a variety of ecosystem services [59]. The current specialized, highly intensive agriculture would not be profitable if the environmental costs were included and the “polluter-pays principle” was applied [59]. Freibauer et al. [60] published an overview of the need for agricultural research and development in the European Union. They recommended developing radically new farming systems by incorporating the true costs or benefits of different production systems. The new SRU report [24] emphasized that the existing legal regulations must be reformed and more strictly enforced (e.g., the Fertilizer Regulation and Water Framework Directive). They judged that the results of the Common Agricultural Policy reform were sobering and needed to be further reformed and implemented more ambitiously. Their recommendations coincided with the policy recommendations for ERA [61] to enhance agro-ecosystem services by fostering resource-efficient agriculture. These recommendations were to (a) implement more compulsory measures to better apply the polluter-pays principle; (b) raise a tax on nitrogen surplus; (c) raise a tax on mineral nitrogen fertilizer; (d) require greater limitations on stocking rates; (e) reward ecologically sound management systems; (f) give priority in advisory systems, environmental legislation, and agri-environmental support to measures that improve nutrient recycling instead of passive single mitigation measures; (g) gradually change food consumption patterns (less meat and food waste); and (h) better reflect environmental costs in the prices of animal products.
The BERAS project has successfully implemented a network of 24 learning centers (www.beras.eu), mainly on farms in all of the countries around the Baltic Sea, to disseminate the ERA concept. These centers will assist with transnational knowledge exchange and capacity building between farmers as well as informing consumers about the consequences of their diet to the environment. The consumer engagement concept “Diet for a Green Plant” offers a sustainable lifestyle with consumption of sufficient good food without threatening the environment of the Baltic Sea or the planetary boundaries. With the engagement of all of the actors in the food chain, the concept of a resource-efficient farming system could be realized in different parts of the world [7,14,44].

5. Conclusions

A systemic shift to resource-efficient farming systems to improve the environmental status of the Baltic Sea requires the involvement of all of the actors in the food chain. Farmers have a high responsibility, as they are at the beginning of that chain. This paper furthers the understanding of effective nitrogen recycling on the farm level, with a focus on legumes in crop rotations and adapting animal densities to on-farm fodder production. Embedded in a set of guidelines for the conversion to ERA farming are the software tools, the legume estimation trainer, N budget calculator and ROTOR, which contribute to capacity building among farmers and advisors. They provide support for increasing nitrogen efficiency on farm level as well as planning and assessing agronomically and environmentally sound crop rotations in different countries of the Baltic Sea catchment area. Learning centers implemented on ecological farms in all riparian countries within the BERAS project support the knowledge exchange among producers. At the same time, these centers can raise awareness of environmental impacts of food consumption among consumers, as they can promote sustainable farming systems by increasing the demand for these products. A broader international implementation of resource-efficient farming systems, such as the ERA concept, could be supported with a more tailored promotion of agro-ecosystem services as well as by more strictly enforcing and implementing the existing legal frameworks.

Acknowledgments

This work, as part of the BERAS Implementation project (www.beras.eu), was supported by the Baltic Sea Region Programme 2007–2013/Interreg IVB and partially financed by the European Union. We thank all farmers and advisors for their valuable cooperation and Jaroslaw Stalenga (IUNG, Poland) for the provision of data.

Author Contributions

K.S., M.R. and J.B. took part in writing the text and analyzing and interpreting data. W.K. and A.G. collected the bulk of the data. J.B. mainly developed the software tools. M.R. and J.B. performed the modeling. K.S., M.R., J.B. and J.H. finalized the text.

Conflicts of Interest

The authors declare no conflicts of interest.

References

  1. Diaz, R.J.; Rosenberg, R. Spreading dead zones and consequences for marine ecosystems. Science 2008, 321, 926–929. [Google Scholar] [CrossRef] [PubMed]
  2. Conley, D.J.; Bj̈orck, S.; Bonsdorff, E.; Carstensen, J.; Destouni, G.; Gustafsson, B.G.; Hietanen, S.; Kortekaas, M.; Kuosa, H.; Meier, H.E.M.; et al. Hypoxia-related processes in the Baltic Sea. Environ. Sci. Technol. 2009, 43, 3412–3420. [Google Scholar] [CrossRef] [PubMed]
  3. Carstensen, J.; Andersen, J.H.; Gustafsson, B.G.; Conley, D.J. Deoxygenation of the Baltic Sea during the last century. Proc. Natl. Acad. Sci. USA 2014, 111, 5628–5633. [Google Scholar] [CrossRef] [PubMed]
  4. Phyälä, M; Fleming-Lehtinen, V; Laamanen, M. Eutrophication Status of the Baltic Sea 2007–2011: A Concise Thematic Assessment; HELCOM: Helsinki, Finland, 2014. [Google Scholar]
  5. HELCOM. The Fifth Baltic Sea Pollution Load Compilation (PLC-5). Baltic Sea Environment Proceedings No. 128. p. 220. Available online: www.helcom.fi (accessed on 26 April 2015).
  6. Blesh, J.; Drinkwater, L.E. The impact of nitrogen source and crop rotation on nitrogen mass balances in the Mississippi River Basin. Ecol. Appl. 2013, 23, 1017–1035. [Google Scholar] [CrossRef] [PubMed]
  7. Altieri, M.A.; Nicholls, C.I. Agroecology scaling up for food sovereignty and resiliency. Sustain. Agric. Rev. 2012, 11, 1–29. [Google Scholar]
  8. Granstedt, A. Farming for the Future: With a Focus on the Baltic Sea Region; BERAS Implementation Reports; Södertörns Högskola: Huddinge, Sweden, 2012; Volume 2. [Google Scholar]
  9. Kattwinkel, M.; Kühne, J.-V.; Foit, K.; Liess, M. Climate change, agricultural insecticide exposure, and risk for freshwater communities. Ecol. Appl. 2011, 21, 2068–2081. [Google Scholar] [CrossRef] [PubMed]
  10. HELCOM. Eutrophication in the Baltic Sea. An Integrated Thematic Assessment of the Effects of Nutrient Enrichment in the Baltic Sea Region; Baltic Sea Environment Proceedings No. 115B; Helsinki Commission: Helsinki, Finland, 2009; p. 148. [Google Scholar]
  11. HELCOM. Baltic Sea Action Plan. In Proceedings of the HELCOM Extraordinary Ministerial Meeting, Krakow, Poland, 15 November 2007; p. 101. Available online: http://www.helcom.fi/Documents/Baltic%20sea%20action%20plan/BSAP_Final.pdf (accessed on 26 April 2015).
  12. Gustafsson, B.G.; Schenk, F.; Blenckner, T.; Eilola, K.; Meier, H.E.M.; Müller-Karulis, B.; Neumann, T.; Ruoho-Airola, T.; Savchuk, O.P.; Zorita, E. Reconstructing the development of baltic sea eutrophication 1850–2006. Ambio 2012, 41, 534–548. [Google Scholar] [CrossRef] [PubMed]
  13. Chen, Q.; Kozar, O.; Li, F.; Pekonen, A.; Saarman, P. Eutrophication in the Baltic Sea—Characteristics and challenges. In Presented at the HENVI Workshop, Helsinki University Centre for Environment, Helsinki, Finland, 12 May 2014; p. 23. Available online: http://www.helsinki.fi/henvi/teaching/Reports_14/01_Eutrophication_in_the_Baltic_Sea.pdf (accessed on 26 April 2015).
  14. Pastuszak, M.; Kowalkowski, T.; Kopiński, J.; Stalenga, J.; Panasiuk, D. Impact of forecasted changes in Polish economy (2015 and 2020) on nutrient emission into the river basins. Sci. Total Environ. 2014, 493, 32–43. [Google Scholar] [CrossRef] [PubMed]
  15. JKI/ILR. Stickstoffüberschuss der Landwirtschaft (Gesamtbilanz). Institut für Pflanzenbau und Bodenkunde, Julius Kühn Institut (JKI), Braunschweig und Institut für Landschaftsökologie und Ressourcenmanagement (ILR), Justus-Liebig-Universität Gießen. Available online: http://www.umweltbundesamt.de (accessed on 26 April 2015).
  16. SRU. Novellierung der Düngeverordnung: Nährstoffüberschüsse wirksam begrenzen. Available online: http://www.umweltrat.de (accessed on 26 April 2015).
  17. BMEL. Verordnungsentwurf zur Neuordnung der guten fachlichen Praxis beim Düngen. Available online: http://www.vhe.de/fileadmin/vhe/pdfs/Publikationen/Standpunkte/DueV_Entwurf_18_12_2014.pdf (accessed on 26 April 2015).
  18. UBA. Umweltbelastungen der Landwirtschaft. Stickstoff. Available online: http://www.uba.de (accessed on 26 April 2015).
  19. Halberg, N.; Kristensen, E.S.; Kristensen, I.S. Nitrogen turnover on organic and conventional mixed farms. J. Agric. Environ. Ethics 1995, 8, 30–51. [Google Scholar] [CrossRef]
  20. Eurostat. Available online: http://epp.eurostat.ec.europa.eu/portal/page/agriculture/data/database (accessed on 26 April 2015).
  21. Bäurle, H.; Tamásy, C. Regionale Konzentrationen der Nutztierhaltung in Deutschland; Institut für Strukturforschung und Planung in agrarischen Intensivgebieten Universität Vechta (ISPA): Vechta, Germany, 2012; Volume 79, pp. 2–89. [Google Scholar]
  22. Larsson, M.; Granstedt, A. Sustainable governance of the agriculture and the Baltic Sea—Agricultural reforms, food production and curbed eutrophication. Ecol. Econ. 2010, 69, 1943–1951. [Google Scholar] [CrossRef]
  23. Kelm, M.; Loges, R.; Taube, F. N-Auswaschung unter ökologischer und konventioneller Praxisbetriebe in Norddeutschland—Ergebnisse aus dem Projekt COMPASS. In Zwischen Tradition und Globalisierung; Zikeli, S., Claupein, W., Dabbert, S., Kaufmann, B., Müller, T., Valle Zárate, A., Eds.; Beiträge zur 9; Wissenschaftstagung Ökologischer Landbau: Hohenheim, Germany, 2007; pp. 29–32. [Google Scholar]
  24. SRU. Nitrogen: Strategies for Resolving an Urgent Environmental Problem. 2015, p. 12. Available online: www.umweltrat.de (accessed on 26 April 2015).
  25. Hülsbergen, K.; Rahmann, G. (Eds.) Klimawirkungen und Nachhaltigkeit ökologischer und konventioneller Betriebssysteme—Untersuchungen in einem Netzwerk von Pilotbetrieben; Johann Heinrich von Thünen Institut: Braunschweig, Germany, 2013; p. 412.
  26. Bengtsson, J.; Ahnström, J.; Weibull, A.C. The effects of organic agriculture on biodiversity and abundance: A meta-analysis. J. Appl. Ecol. 2005, 42, 261–269. [Google Scholar] [CrossRef]
  27. Mondelaers, K.; Aertsens, J.; van Huylenbroeck, G. A meta-analysis of the differences in environmental impacts between organic and conventional farming. Br. Food J. 2009, 111, 1098–1119. [Google Scholar] [CrossRef] [Green Version]
  28. Rahmann, G. Biodiversity and organic farming: What do we know? Landbauforsch. vTI Agric. For. Res. 2011, 3, 189–208. [Google Scholar]
  29. Gattinger, A.; Muller, A.; Haeni, M.; Skinner, C.; Fliessbach, A.; Buchmann, N.; Maeder, P.; Stolze, M.; Smith, P.; Scialabba, N.E.-H.; et al. Enhanced top soil carbon stocks under organic farming. Proc. Natl. Acad. Sci. USA 2012, 109, 18226–18231. [Google Scholar] [CrossRef] [PubMed]
  30. Taube, F.; Poetsch, E.M. On-farm nutrient balance assessment to improve nutrient management on organic dairy farms. Grassl. Sci. Eur. 2001, 6, 225–234. [Google Scholar]
  31. Hülsbergen, K.-J.; Rahmann, G. Klimawirkungen und Nachhaltigkeit ökologischer und konventioneller Betriebssysteme: Untersuchungen in einem Netzwerk von Pilotbetrieben; Thünen Report No. 8; Thünen-Institut: Braunschweig, Germany, 2013. [Google Scholar] [CrossRef]
  32. Haas, G.; Wetterich, F.; Köpke, U. Comparing intensive, extensified and organic grassland farming in southern Germany by process life cycle assessment. Agric. Ecosyst. Environ. 2001, 83, 43–53. [Google Scholar] [CrossRef]
  33. Jonsson, S. The Öjebyn-Project—Organic Production of Food; Rapport 5: SLU; Department of Agricultural Research for Northern Sweden, Öjebyn, Swedish University of Agricultural Sciences: Röbäcksdalen, Umeå, Sweden, 2004. [Google Scholar]
  34. Severin, K.; Engelke, L. Nährstoffbilanzen und -gehalte im Boden. Landwirtschaftskammer Niedersachsen. 20 Jahre BDF. Available online: http://www.lbeg.niedersachen.de (accessed on 26 April 2015).
  35. Schader, C.; Müller, A.; Zimmer, S.; Aendekerk, R.; Lioy, R.; Reding, R.; Turmes, S.; Conter, G.; Adam, S.; Dahlem, R.; et al. Vergleichende ökonomisch-ökologische analyse von biologisch und konventionell wirtschaftenden Betrieben in Luxemburg; IBLA und FiBL; 2014. Available online: http://www.ibla.lu/ibla/images/stories/pdf/oeko_oeko/endbericht (accessed on 26 April 2015).
  36. Gruber, L.; Steinwender, R.; Guggenberger, T.; Plakolm, G. Vergleich zwischen biologischer und konventioneller Wirtschaftsweise im Grünlandbetrieb—3. Mitteilung: Nährstoffbilanzen auf Feld/Stall-Basis und Hoftor-Basis. Die Bodenkult. 2001, 52, 183–195. [Google Scholar]
  37. Oeborn, I.; Andrist-Rangel, Y.; Askegaard, M.; Grant, C.A.; Watson, C.A.; Edwards, A.C. Critical aspects of potassium management in agricultural systems. Soil Use Manage. 2005, 21, 102–112. [Google Scholar] [CrossRef]
  38. Scheringer, J. Nitrogen on dairy farms: balances and efficiency. Gött. Agrarwiss. Beitr. 2002, 10, 1–146. [Google Scholar]
  39. Cederberg, C.; Flysjö, A. Life Cycle Inventory of 23 Dairy Farms in South-Western Sweden; SIK-rapport 728 2004; SIK—The Swedish Institute for Food and Biotechnology: Gothenburg, Sweden, 2004; Available online: http://www.lrf.se/globalassets/dokument/om-lrf/branscher/lrf-mjolk/forskningsrapporter/ (accessed on 26 April 2015).
  40. Kristensen, I.S.; Halberg, N.; Nielsen, N.; Dalgaard, T. Denmark Part II: N Turnover on Danish Mixed Dairy Farms; Report 83; Danish Institute of Agricultural Sciences, Department of Agroecological Research Group of Farming Systems: Tjele, Denmark, 2005; Available online: http://www.agrsci.dk (accessed on 26 April 2015).
  41. Granstedt, A. Increasing the efficiency of plant nutrient recycling within the agricultural system as a way of reducing the load to the environment—Experience from Sweden and Finland. Agric. Ecosyst. Environ. 2000, 80, 169–185. [Google Scholar] [CrossRef]
  42. EC No. 843/2007: EU-Öko-Verordnung. Available online: http://www.boelw.de/oekoverordnung0.html (accessed on 26 April 2015).
  43. Granstedt, A.; Schneider, T.; Seuri, P.; Thomsson, O. Ecological recycling agricultureto reduce nutrient pollution to the Baltic Sea. Biol. Agric. Hortic. 2008, 26, 279–307. [Google Scholar] [CrossRef]
  44. Larsson, M.; Morin, L.; Hahn, T.; Sandahl, J. Institutional barriers to organic farming in Central and eastern European countries of the Baltic Sea region. Agric. Food Econ. 2013, 1, 16. [Google Scholar] [CrossRef] [Green Version]
  45. Linder, J. Kurskompendium om växtnäringsbalanser, miljönyckeltal,jämförelsevärden och olika sätt att tolka balanser. In Jämförelsevärden för Tolkning av Växtnäringsbalanser; Jordbruksverket, greppa näringen: Jönköping, Sweden, 2008; pp. 1–26. Available online: http://www.jordbruksverket.se (accessed on 12 March 2015).
  46. Stein-Bachinger, K.; Reckling, M.; Granstedt, A. Ecological Recycling Agriculture. Guidelines for Farmers and Advisors; Volume I: Farming Guidelines; BERAS: Järna, Sweden, 2013; p. 136. Available online: www.beras.eu (accessed on 26 April 2015).
  47. Bachinger, J.; Zander, P. ROTOR, a tool for generating and evaluating crop rotations for organic farming systems. Eur. J. Agron. 2007, 26, 130–143. [Google Scholar] [CrossRef]
  48. Schmidtke, K. How to optimise symbiotic nitrogen fixation in organic crop rotations. In Proceedings of the ISOFAR Conference “Organic Agriculture in Asia”, Seoul, South Korea, 13–14 March 2008; pp. 1–19.
  49. Müller-Lindenlauf, M.; Deittert, C.; Köpke, U. Assessment of environmental effects, animal welfare and milk quality among organic dairy farms. Livest. Sci. 2010, 128, 140–148. [Google Scholar] [CrossRef]
  50. Stein-Bachinger, K.; Fuchs, S. Protection strategies for farmland birds in legume-grass leys as trade-offs between nature conservation and farmers’ needs. Org. Agric. 2012, 2, 145–162. [Google Scholar] [CrossRef]
  51. Haas, G. Wasserschutz im Ökologischen Landbau. Bundesprogramm Ökologischer Landbau. 2009, pp. 1–62. Available online: http://www.orgprints.org (accessed on 26 April 2015).
  52. Peyraud, J.L.; Le Gall, A.; Lüscher, A. Potential food production from forage legume-based-systems in Europe: An overview. Ir. J. Agric. Food Res. 2009, 48, 115–135. [Google Scholar]
  53. Peoples, M.B.; Herridge, D.F.; Ladha, J.K. Biological nitrogen fixation: An efficient source of nitrogen for sustainable agricultural production. Plant Soil 1995, 174, 3–28. [Google Scholar] [CrossRef]
  54. Mohler, C.L.; Johnson, S.E. Crop Rotation on Organic Farms. A Planning Manual; Natural Resource, Agriculture and Engineering Service (NRAES), Cooperative Extension: Ithaca, NY, USA, 2009; pp. 1–155. Available online: http://www.nraes.org (accessed on 26 April 2015).
  55. Freyer, B. Fruchtfolgen—Konventionell, Integriert, Biologisch; Verlag Eugen Ulmer: Stuttgart, Germany, 2003. [Google Scholar]
  56. Stein-Bachinger, K.; Werner, W. Effect of manure and crop yield and quality in an organic agricultural system. Biol. Agric. Hortic. 1997, 14, 221–235. [Google Scholar] [CrossRef]
  57. De Ponti, T.; Rijk, B.; Van Ittersum, M.K. The crop yield gap between organic and conventional agriculture. Agric. Syst. 2012, 108, 1–9. [Google Scholar] [CrossRef]
  58. Seufert, V.; Ramankutty, N.; Foley, J.A. Comparing the yields of organic and conventional agriculture. Nature 2012, 485, 229–242. [Google Scholar] [CrossRef] [PubMed]
  59. Wramner, P. Conversion to ecological recycling agriculture (ERA) in the Baltic Area—Proposed action the framework of the BERAS implementation projec. In Conversion to Ecological Recycling Agriculture and Society; Granstedt, A., Pentti, S., Eds.; BERAS: Järna, Sweden, 2013; pp. 161–194. Available online: http://beras.eu/wp-content/uploads/2013/09/Conversion-to-Ecological-Recycling-Agriculture-and-Society-reviderad-utg%C3%A5va.pdf (accessed on 26 April 2015).
  60. Freibauer, A.; Mathijs, E.; Brunori, G.; Damianova, Z.; Faroult, E.; Gomis, J.G.; O’Brien, L.; Treyer, L. Sustainable food consumption and production in a resouce-constrained world. In European Commission—Standing Committee on Agricultural Research (SCAR), 3rd Foresight Exercise; European Commission: Bruessels, Belgium, 2011; pp. 1–150. Available online: https://ec.europa.eu/research/agriculture/scar/pdf/scar_feg3_final_report_01_02_2011.pdf (accessed on 26 April 2015).
  61. Einarsson, P. Policy Interventions for Ecological Recycling Agriculture. Available Options for Governments in the Baltic Sea Region. BERAS Implementation Reports No. 1. 2012, p. 42. Available online: http://beras.eu/wp-content/uploads/2013/08/policy-interventions-for-ecological-recycling-agriculture.pdf (accessed on 26 April 2015).

