Land Use and Land Cover Changes and Their Effects on the Landscape of Abaya-Chamo Basin, Southern Ethiopia


1
Management of Crop Water Stress in the Tropics and Subtropics (490g), Institute of Agricultural Sciences in the Tropics (Hans-Ruthenberg-Institute) (490), University of Hohenheim, 70599 Stuttgart, Germany
2
Center for Development Research (ZEF), University of Bonn, 53113 Bonn, Germany
3
Rural Development Theory and Policy (490a), Institute of Agricultural Sciences in the Tropics (Hans-Ruthenberg-Institute) (490), University of Hohenheim, 70599 Stuttgart, Germany
*
Author to whom correspondence should be addressed.
Land 2018, 7(1), 2; https://0-doi-org.brum.beds.ac.uk/10.3390/land7010002
Submission received: 2 December 2017
/
Revised: 30 December 2017
/
Accepted: 4 January 2018
/
Published: 7 January 2018
(This article belongs to the Special Issue Understanding Our Planetary Home: New Directions in Land Use/Land Cover (LULC) Analysis)
Abstract
:This study uses a combination of remote sensing data, field interviews and observations, and landscape indices to examine the dynamics of land use and land cover (LULC), identify their driving forces, and analyze their effects on the landscape of Abaya-Chamo Basin (ACB) between 1985, 1995, and 2010. The results reveal that the landscape of ACB has changed considerably during the past 25 years between 1985 and 2010. The main changes observed imply a rapid reduction in shrubland (28.82%) and natural grassland (33.13%), and an increase in arable land (59.15%). The basin has become more fragmented and formed less connected patches in 2010 compared to 1985. Rapid population growth, internal migration, policy shifts, and regime change were identified as the key driving forces of LULC changes in ACB. The LULC changes and related trend of increasing landscape fragmentation in the basin increased soil erosion, the volume of surface runoff, and sediment transport in the landscape and, consequently, affected the levels and water quality of the lakes found in the rift floor. Furthermore, the destruction and fragmentation of shrubland and natural grassland led to the decline of wild plants and animals previously prominent in the basin. Therefore, protective measures that take into consideration the economic, social, and ecological dynamics of the basin are urgently needed to save the aquatic and terrestrial ecosystems of the basin from further damage.
1. Introduction
The impact of human activities on ecosystems has long been recognized and, now, there is increasing evidence to support the hypothesis that we have entered into an Anthropocene [1]. Human activities have been documented as one of the main driving forces of LULC changes and simultaneous changes in natural environments [2]. In turn, LULC changes greatly influence, among others, the spatial pattern of a landscape [3,4], the availability of ecosystem goods and services [5], and increase vulnerability of regional biomes and human well-being to climate change [6]. Continuously studying and monitoring LULC changes are particularly important in understanding the dynamics and predicting the patterns and trend of changes in a natural landscape and associated ecosystems at local, regional, and global scales, and to provide evidence-based support to improve land management policies and practices [7,8].
Several studies related to LULC changes in Ethiopia have indicated that the country has experienced rapid and increasingly pronounced LULC changes since the second half of the 20th century [9,10,11,12,13,14]. Most of these studies have documented a considerable expansion of cropland at the expense of other LULC types in the country. For example, Ariti et al. and Garedew et al. [9,15] reported the expansion of cropland at the expense of forest, woodlands, grasslands, and water in the Central Rift Valley. Similarly, Gashaw et al. [16] reported a reduction of forest, shrubland, and grassland between 1985 and 2015 in Andassa watershed in the Blue Nile Basin as a result of the expansion of cultivated land in the area. Increases in cultivated land at the expense of pastureland, forestland, and woodland were also observed in hilly-mountainous areas in the central highlands [14]. However, there are also other studies which have documented a different trend of LULC changes in the country. For example, Nyssen et al. [17] reported natural forest regrowth in the uplands of Bela-Welleh catchment in northern Ethiopia. Bewket and Solomon [13] also reported the expansion of open grassland and riparian vegetation cover, along with cultivated areas and settlements, in Gish Abay watershed in the Blue Nile Basin. Inappropriate agricultural practices, drought induced migration, high human and livestock population, and government land policy have been frequently reported as the main drivers of LULC changes in the country [9,11,12,13,17,18]. Remote sensing images and aerial photographs, often supplemented with data from field observations, interviews, and group discussions, have been the major data sources for many of these studies. Linking information obtained through Earth observation (EO) with social science approaches is helpful in gaining a comprehensive understanding of LULC changes [19]. However, it is often inadequate to quantitatively describe the changes in the structure and pattern of a landscape [19,20,21]. Indices of landscape patterns, on the other hand, provide an insight on the effects of LULC changes in composition and configuration of patches within class or landscape levels [22]. Analyzing and interpreting such data over time plays a critical role in monitoring changes, and facilitates identification of driving forces that bring changes in the landscape [20]. Several studies have integrated landscape metrics with LULC classifications derived from remote sensing images to quantify the patterns of a landscape and relate to the processes driving the changes [4,20,23]. For example, Wang and Wang [4] used LULC data derived from remote sensing images, in combination with landscape metrics, to evaluate changes in the landscape of Yanqi Basin, China. Narumalani et al. [20] applied a similar approach to trace anthropogenic processes in the landscape of northeastern Iowa, USA. The spatial patterns of landscapes in Ethiopia, as with most tropical regions, relate significantly to anthropogenic influences. Therefore, integration of landscape metrics with satellite remote sensing technique provides the key to unravelling the economic and social factors driving the processes of landscape modification [24]. Previous studies of LULC changes in Ethiopia, however, have placed little emphasis on quantifying and interpreting changes in landscape spatial pattern, even though such data is crucial for planning sustainable land use systems and resource management practices in the country.
ACB is home to one of the most remarkable aquatic and terrestrial ecosystems of the Main Ethiopian Rift (MER). The basin is known for its diverse plant and animal species composition, and is considered as one of the biodiversity hotspots in Ethiopia [25]. However, it has been threatened in recent years due to rapid population growth and resettlement, as well as expansion of agricultural and irrigation activities in the landscape [26,27,28]. For the last few decades, an increasing demand for fuelwood and wood for construction, land clearing for agricultural expansion and irrigation activities, and bush burning for pasture have greatly modified the landscape and affected the water quality of lakes found in the basin [29,30,31]. High rates of LULC changes have been reported for the southern part of the basin [27,32,33]. However, none of these studies have sought to map LULC dynamics and quantify landscape pattern changes in time and space for the entire basin and analyze their effects on the landscape in the context of upstream-downstream linkages. As a result, little information exists on the dynamics taking place in the entire landscape of the basin. Previously attempted conservation measures, which have not considered the scope of linkages between changes in the basin as a whole such as the Nech Sar National Park, have suffered from pressure coming from the surrounding areas due to resource degradation and deteriorating agricultural productivity. The measures were also less effective in changing the trend of resource loss on the landscape level and demand costly measures, resulting in conflicts with communities [34].
There have been a number of studies on the effects of LULC changes on the spatial patterns of the landscape and water quality of lake basins [4,23,35]. Thus, some studies suggested the study of LULC changes as a critical step that should be considered in the environmental protection strategy and sustainable resource management of lake basins. For the ACB, such study is crucial and urgent given the increasing and alarming intensity of anthropogenic activities in the landscape, and the need for implementing environmental protection policies in the basin. Therefore, this study aims to examine the dynamics of LULC in ACB between 1985, 1995, and 2010; to identify the major driving forces of the LULC changes and the consequences associated with these changes; and to quantify landscape metrics in time and space for the entire basin to track changes in the landscape.
2. Materials and Methods
2.1. Study Area
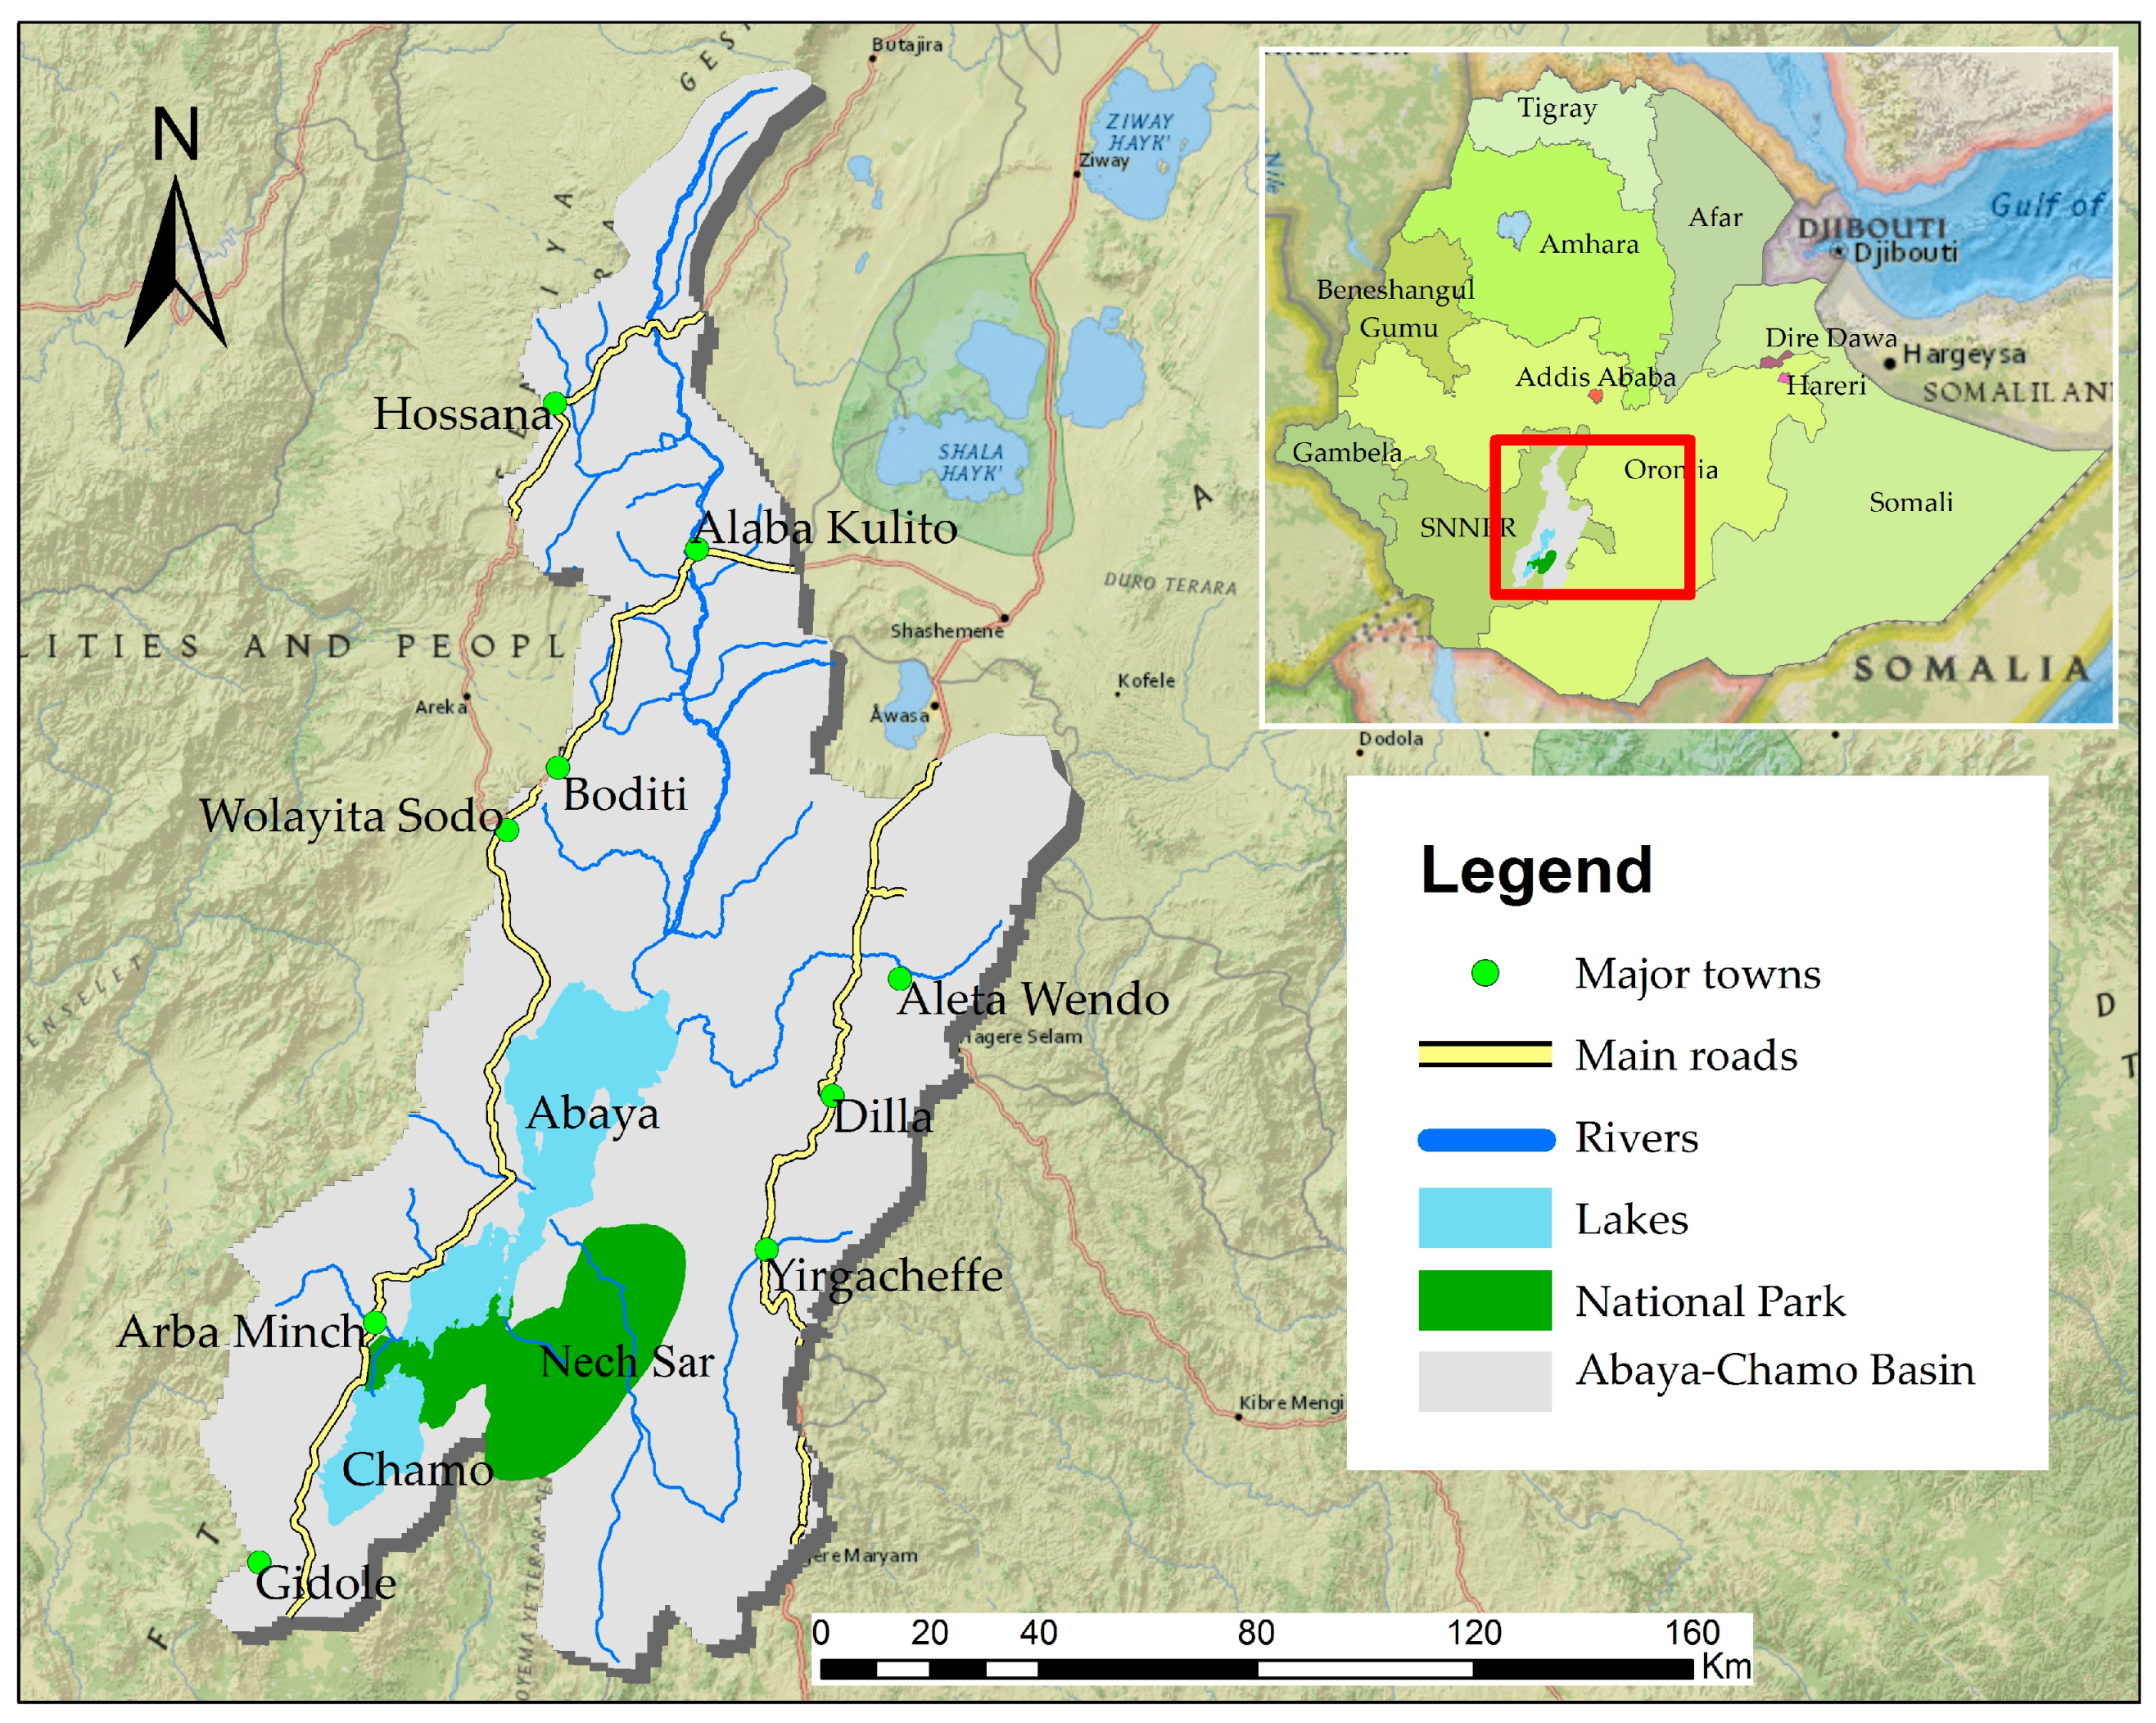
The study was conducted in ACB, which comprises the southern section of the MER and adjacent highlands in Southern Ethiopia. The basin is geographically located between 5° to 8° N and 37° to 38.5° E, with an area of about 18,600 km2, including fresh water bodies [36] (Figure 1). ACB is mainly dominated by a hot semi-arid tropical climate with mean annual rainfall and temperature ranging from 665 mm to 1240 mm and 8.8 °C to 31.2 °C, respectively [29]. The climate is further characterized by a typical bimodal rainfall pattern with peaks in April/May and August/September, a high rate of evaporation (about 2300 mm per year on average), and dominated by warm temperature throughout the year. The land feature of ACB shows a remarkable topographic variation over a short distance ranging from 1082 m above sea level (m.a.s.l.) near the lake shore in the rift floor to above 3500 m.a.s.l. in the Gughe mountain range in the highlands [36,37]. The influences of topography on local climate, soil, vegetation, and settlement patterns can easily be observed in the basin as one travels away from the rift floor and climbs into the highlands. Nitisols, Acrisols, Luvisols, and Vertisols are the dominant soil types in the mid to highland areas of the basin, while Fluvisols are predominant in the rift floor and areas around the lakes [38]. According to Getahun [39], savannah and deciduous woody vegetation cover types were most dominant in the lower altitude areas of the basin, whereas tropical mountain rainforest was the most dominant cover type in the high altitude parts of the basin. However, the current situation seems quite different due to the effect of livestock and agricultural expansion in low altitude areas, and the expansion of coffee and cereal cultivation in the mid to high altitude areas of the basin. The basin encompasses one national park (Nech Sar National Park), two big low-lying lakes (Lake Abaya and Lake Chamo), and other crater lakes, numerous rivers, and seasonal streams which drain into the lakes (Figure 1). The lakes are used for transportation, fishery, and tourism purposes, whereas the tributaries are used for irrigation. Based on the 2007–2037 population projection for Ethiopia, more than 5 million people will inhabit the basin by 2020 [40], and it is a home for more than 10 ethnic groups in the country.
2.2. Data Sources and Pre-Processing
The study area was not entirely contained within a single Landsat scene; five Landsat images were required to get complete coverage of the study area. Therefore, a total of fifteen Level 1 Landsat scenes (both from Thematic Mapper (TM) and Enhanced Thematic Mapper (ETM)) of three acquisition years (1985, 1995, and 2010) with less than 10% cloud cover were acquired from path 68, row 55, 56 and path 69, row 54, 55, 56 for the months of December, January, and February. These months correspond to the dry season in the study area. The acquisition years were selected deliberately to coincide with a nationwide drought and famine in the 1980s, and regime change and subsequent policy shift of the country in the 1990s. All scenes used in this study were obtained from the website of the U.S. Geological Survey (USGS), Earth Resources Observation and Science (EROS) Center. The Level 1 products were originally corrected for geometric and terrain distortion by the image provider using ground control points and the digital elevation model (DEM) [41]. However, their consistencies across the three accusation years were further assessed in this study. In addition, multi-temporal or multi-sensor images have scene-to-scene variability caused by the effects of solar zenith angles, earth-sun distance, atmospheric influence, and sensor differences [42,43]. Such data needs to be pre-processed in order to reduce scene-to-scene variability so that the data can be put on the same radiometric scale to reflect true changes on the ground [42,43]. The absolute correction method was applied in all images using the image-based dark-object subtraction (DOS) model as described by Chander et al. [42], Paolini et al. [43], and Song et al. [44]. All the parameters required for the calibration were obtained from either the image measurements, Level 1 product header file, the USGS Earth Explorer/GloVis online interfaces information, and/or computation from the above inputs. Once pre-processing and mosaicking of the images were completed, the area of interest was subset with the aid of vector boundary layer of the study area using the inbuilt mosaicking tool in ERDAS IMAGINE®2014 (Intergraph Corporation, Madison, AL, USA).
Interviews and group discussions were conducted in seven representative woredas (the fourth administrative level of Ethiopia equivalent to districts) of the basin to verify the accuracy of the classified images and further understand the possible major drivers and consequences of LULC changes in the basin. The woredas were selected based on their representativeness for traditional agro-ecological zones of the country (Table 1). The woredas selected were: Arba Minch Zuria and Damot Weyde, which represent warm semi-arid lowlands (Kolla); Aleta Wendo and Damot Gale as representatives of mild sub-humid midland areas (Weyna Dega); and Hula and Chencha to represent cool and humid highlands (Dega). A total of 75 individuals (25 from each Agro-climatic Zone) who have been living in the survey area over 25 years were selected and asked to describe LULC, and the possible major drivers and consequences of LULC changes in the particular area the person resided for the observation years. Rankings were given to the identified drivers and consequences of LULC changes, and the most common drivers and consequences of the changes were further elaborated during the group discussions. Coordinates of the area were collected using GPS, and all other available ancillary data such as a national LULC map, the 1984 topographic map (1:50,000), Google Earth, and available aerial photos of the year 1975, which cover part of the study area, were consulted during the selection of GPS points and thereafter in the classification processes. All images and ancillary data used in this study are in common coordinate system, Universal Transverse Mercator (UTM) Zone 37N of WGS1984 datum.
2.3. Land Use and Land Cover Classification, Accuracy Assessment, and Change Detection
Based on the ground truth information, information from previous studies in the area, and expert opinions, nine LULC classes were identified following the Coordination of Information on the Environment (CORINE) land cover classification system [46]. The CORINE land cover nomenclature is initially intended to provide consistent land cover legend suitable for remotely sensed data for the member states of the European Community. However, new nomenclatures have been defined latter by different bodies and adapted into the European CORINE land cover system to suit the conditions of countries in Africa, and Central and South America, which have different biomes than Europe [47]. In the current study, the expanded classification system was adopted in such a way that it can capture the local characteristics and suit the purpose of this study (Table 2).
A pixel-based supervised image classification with maximum likelihood algorithm was used to classify the images. Supervised image classification is a recommended classification approach to yield good results when satisfactory training data and detailed information about the study area is available [48,49]. Ancillary data such as topographic maps, aerial photos, GPS records, and the LULC history of the study area obtained during field interviews were used to select the points. Post-classification refinement [50] was applied using the information obtained from ancillary data, normalized difference vegetation index (NDVI), and expert opinions to improve the accuracy of the classification. Post-classification change detection was carried out by comparing the LULC image-maps on pixel-by-pixel basis [51]. A change that was extracted from the three observation years was presented in change metrics to get “where’’ and “from-to” information of change direction for the reference time interval i.e., 1985–1995, 1995–2010, and 1985–2010 [52]. Changes were calculated for each LULC classes as the percentage of the difference in area between a final year, A + 1 and an initial year, A. The overall accuracies of the classification and accuracies of the individual classes are presented in Table 3.
2.4. Landscape and Class Metrics Analyses
FRAGSTATS software version 4.2 was used to compute the landscape and class metrics. The software can be run standalone or as an extension of GIS application to make the calculations and analysis of landscape structural patterns more handy in categorical maps at patch, class, and landscape levels [53]. FRAGSTAT software provides a comprehensive set of metrics at the patch, class, and landscape levels grouped into area and edge, shape, core, contrast, diversity, and aggregation [53]. Landscape metrics were computed for the entire basin, whereas class metrics were performed for patch types. The three most dominant patch types which showed high temporal change (arable land, shrubland, and natural grassland) were selected to perform the class metrics. Patch level analysis was not considered in this study because only a few primary measurements can be made from the analysis [53]. Few indices that capture the major properties of a landscape were carefully selected to make interpretation of the analyses simple, reduce redundant information and increase relevance of the metrics to aspect of the landscape being quantified [53,54]. The following landscape metrics were selected, namely, number of patches (NP), mean patch size (MPS), aggregation index (AI), largest patch index (LPI), and contagion (CONTAG). LPI and MPS correspond to area metrics, whereas NP, AI, and CONTAG correspond to aggregate metrics. LPI, MPS, and NP are best considered metrics in providing indications of the degree of fragmentation in the landscape [21], while CONTAG and AI measure patch aggregation or plumpness at the landscape level. Complete description of these metrics and their equation for computation can be found in FRAGSTATS documentation [53].
3. Results
3.1. Land Use and Land Cover Dynamics and Landscape Pattern Change
The results presented in Table 4 reveal that LULC of ACB has changed significantly since 1985. A considerable reduction of shrubland, heterogeneous agricultural areas, and natural grassland were observed in the landscape between 1985 and 2010 (Figure S1). The share of shrubland declined by 28.82%, natural grassland by 33.13%, and heterogeneous agricultural areas by 14.17% in the study periods (Table 4). The reduction was larger for natural grassland and lower for shrubland during the first time period of 1985–1995, compared to the second time period of 1995–2010. On the contrary, arable land, inland wetlands, and built-up areas showed a net increase between 1985 and 2010. Arable land increased by 37.2%, inland wetlands by 25.52%, and built-up areas by 230.0% (Table 4). Arable land and inland wetlands greatly increased during the second period compared to the first period, whereas the reverse was true for built-up areas. Considering 1985 as the base year, built-up areas, although covering a much smaller proportion of the landscape in both time periods, increased at a much higher rate than any other LULC classes. Inland wetlands uniformly increased in both time periods, whereas inland waters, forests, and coffee agroforestry were not changed in the study periods (Table 4).
Between 1985 and 2010, natural grassland, shrubland, and heterogeneous agricultural areas were mainly converted to arable land (Table 5). Part of the natural grassland was also converted to shrubland predominantly inside the protected area (Nech Sar National Park), whereas in other parts of the basin, shrubland, and coffee agroforestry were converted to natural grassland and heterogeneous agricultural areas, respectively. Although shrubland, heterogeneous agricultural areas, and natural grassland gained from other LULC classes, at the same time, they lost much of their shares to other LULC classes, showing a net loss. Arable land exhibited a larger increase in the basin, and much of the proportion of its net increase was gained from the conversion of shrubland and natural grassland. Land use modifications also occurred among arable land, heterogeneous agricultural areas, and coffee agroforestry in the mid to highland areas of the basin. Relatively greater modifications took place from heterogeneous agricultural areas to arable land, and coffee agroforestry to heterogeneous agricultural areas (Table 5). Inland waters, inland wetlands, and built-up areas exhibited a high persistence for the past 25 years between 1985 and 2010 (diagonal bold values in Table 5), while heterogeneous agricultural areas, arable land, and coffee agroforestry showed a moderate persistence. Shrubland, natural grassland, and forests showed less persistence than the other LULC classes in the landscape of the basin. In general, 67.2% of the basin has remained unchanged, while 32.8% has shown some degree of change in 25 years between 1985 and 2010.
Similarly, as anthropogenic LULC changes continue in the basin, the landscape becomes more fragmented and forms small and isolated patches, indicated by increased NP, and decreased MPS and CONTAG between 1985 and 2010 (Table 6). In a given landscape area, an increased NP, and decreased MPS and CONTAG, over time indicate fragmentation and formation of isolated patches in the landscape and hence an increase in degradation. Comparing the metrics between 1985 and 2010, increased NP with decreased MPS and CONTAG implies a strengthening of landscape fragmentation in the basin. The class level analysis which focuses on three dominant patch types clearly indicates that agricultural expansion was the main driver of landscape fragmentation in the basin. Mean patch size of arable land increased between 1985 and 2010, despite increased NP and decreased AI in the same period. An increased MPS of arable land was mainly attributed to the consolidation of arable land in mild sub-humid and cool and humid highland areas, whereas an increased NP and decrease AI of arable land was due to the expansion of arable land in warm semi-arid areas of the basin. As the LULC changes were increased in the warm semi-arid areas of the basin, the landscape formed interspersed patches of mainly arable land, shrubland, and natural grassland and, as a result, increased NP. This is also confirmed by an increased NP of arable land and shrubland, and decreased MPS and AI of both shrubland and natural grassland in the study period. The LPI decreased substantially for shrubland and showed quite a small difference for arable land and natural grassland in the same period. AI decreased in all the three classes in the study period. The reduction of LPI and AI of shrubland patch type indicated degradation of natural habitats in the basin.
3.2. Drivers and Consequences of Changes on the Landscape
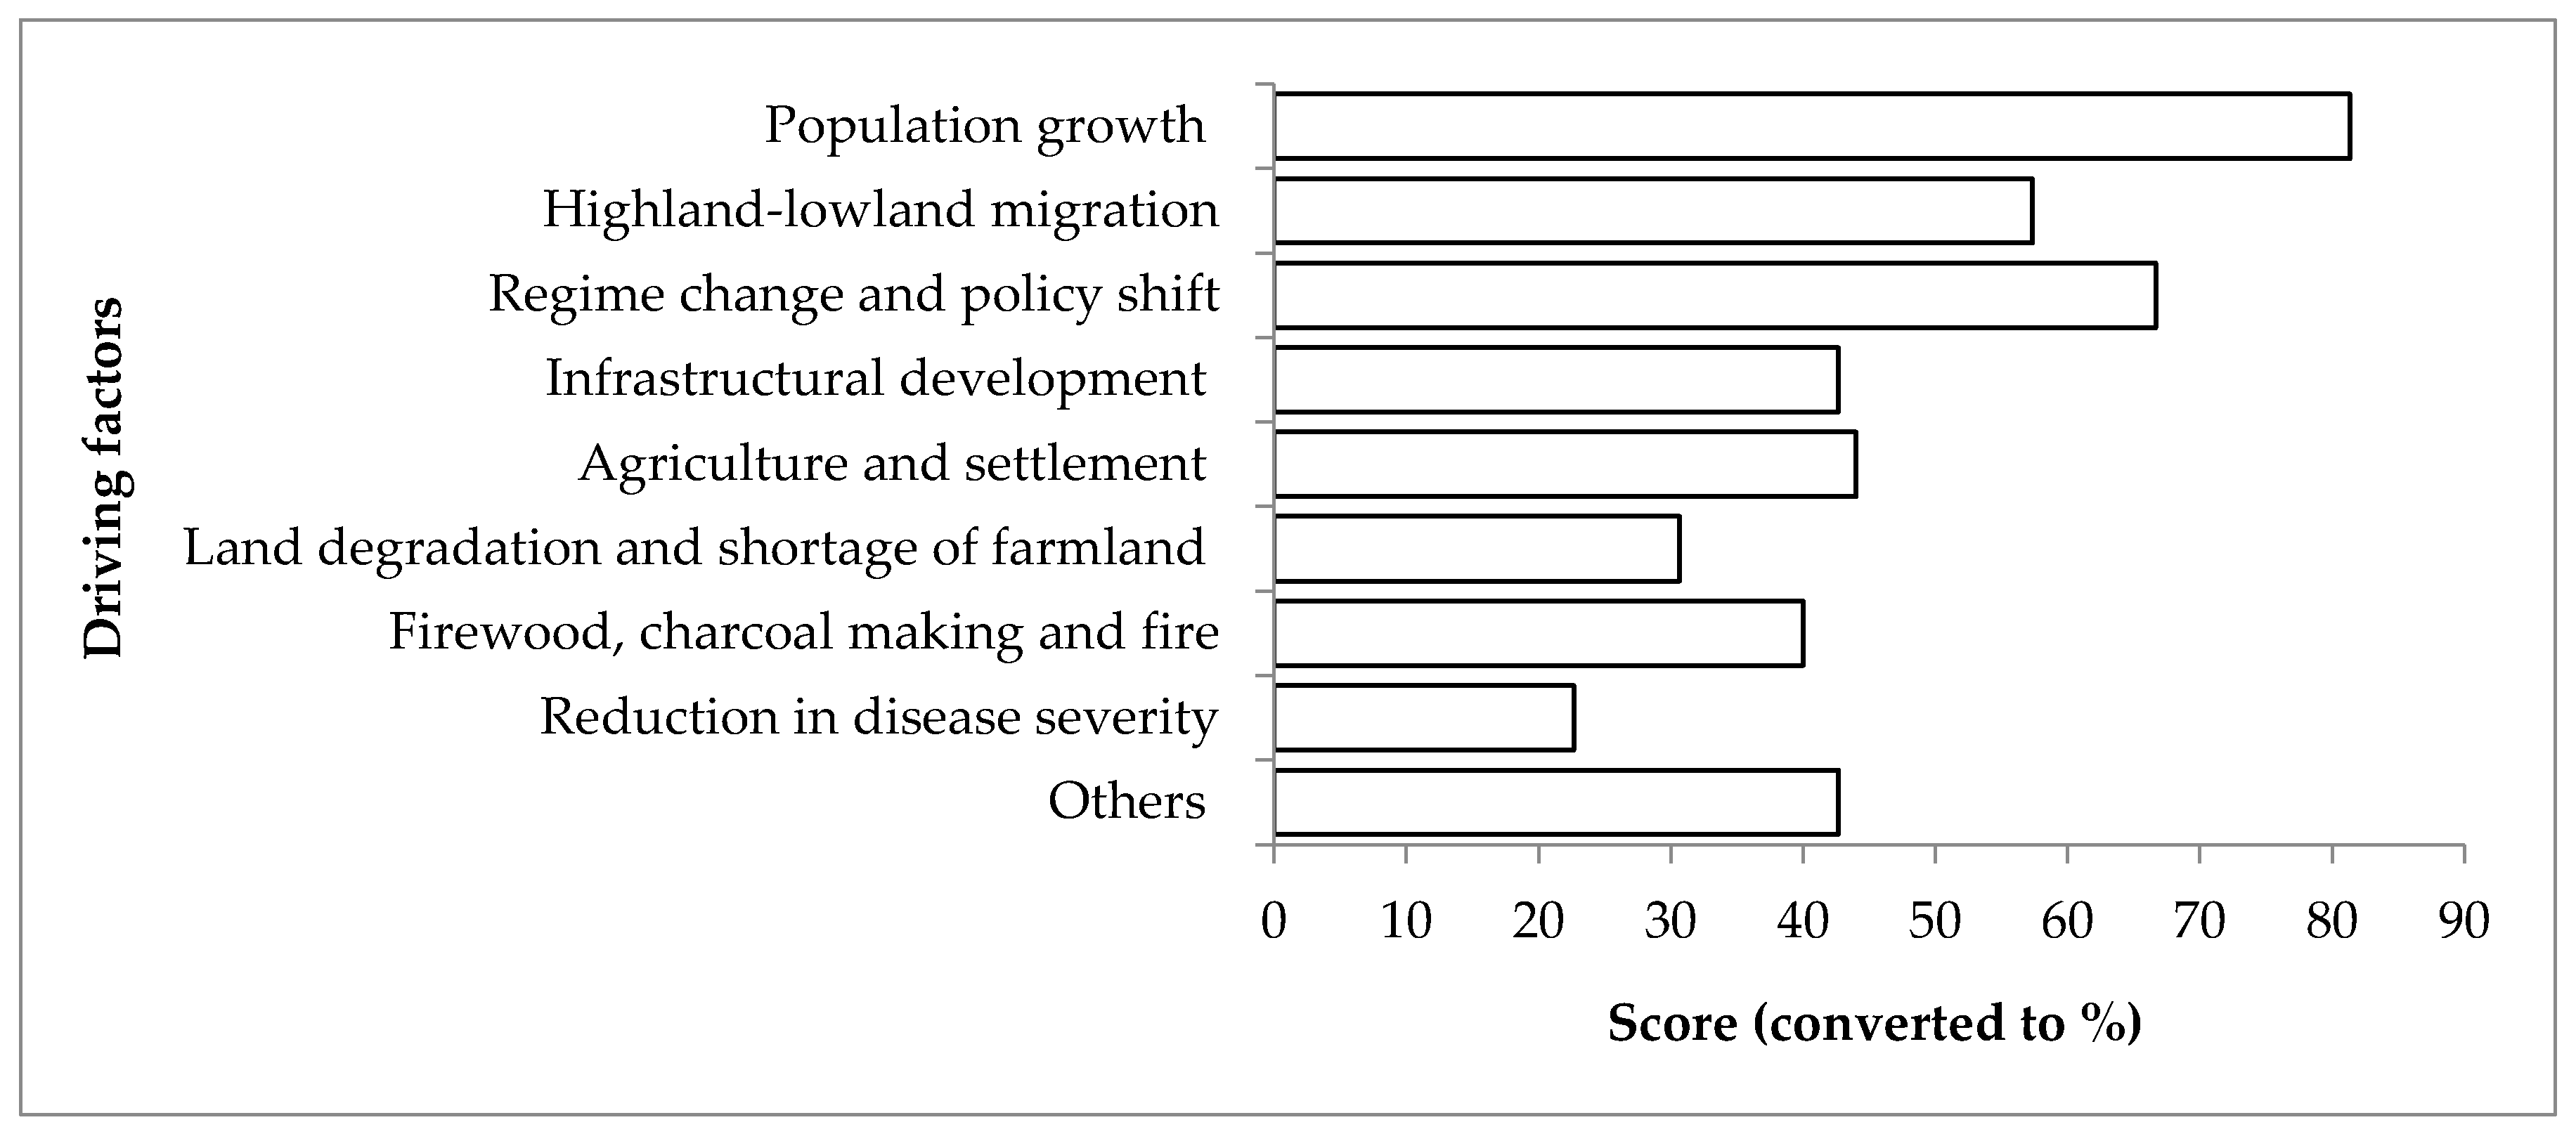
Combinations of driving factors were responsible for the observed changes in LULC in ACB between 1985 and 2010 (Figure 2). From a range of different drivers, more than eight were perceived by the respondents as being important to LULC changes in the study area. According to the respondents, agricultural expansion as a result of population growth, highland-lowland migration, as well as regime change and subsequent policy shift of the current government, were the key driving forces of LULC changes in ACB in the past 25 years between 1985 and 2010. The respondents stated that a high influx of migrants to warm semi-arid lowland areas mainly from cool and humid highlands of the basin took place, particularly after the severe drought of 1984/85 and more frequently after the 1991 regime change, which resulted in a rapid expansion of settlement and agricultural areas in the basin. The informants further indicated that migrants played a significant role in the reduction of shrubland areas surrounding Lake Abaya and Lake Chamo, whereas the resettlement programs played a significant role in the reduction of grassland in other areas of the basin. Infrastructural development in the form of roads, rural electrification, modern irrigation facilities, charcoal making, and firewood selling were also mentioned as important drivers of changes mostly in the lowland areas. Other drivers were mentioned by respondents and agricultural officers during the discussions as localized possible cases of LULC changes in the basin, such as the emergence of villages and small towns along the main roads, the expansion of small enterprises such as wood workshops, the expansion of commercial farms and cash crops such as banana, cotton and khat, and the redistribution of land (mostly shrubland and communal grasslands) to landless farmers and military veterans.
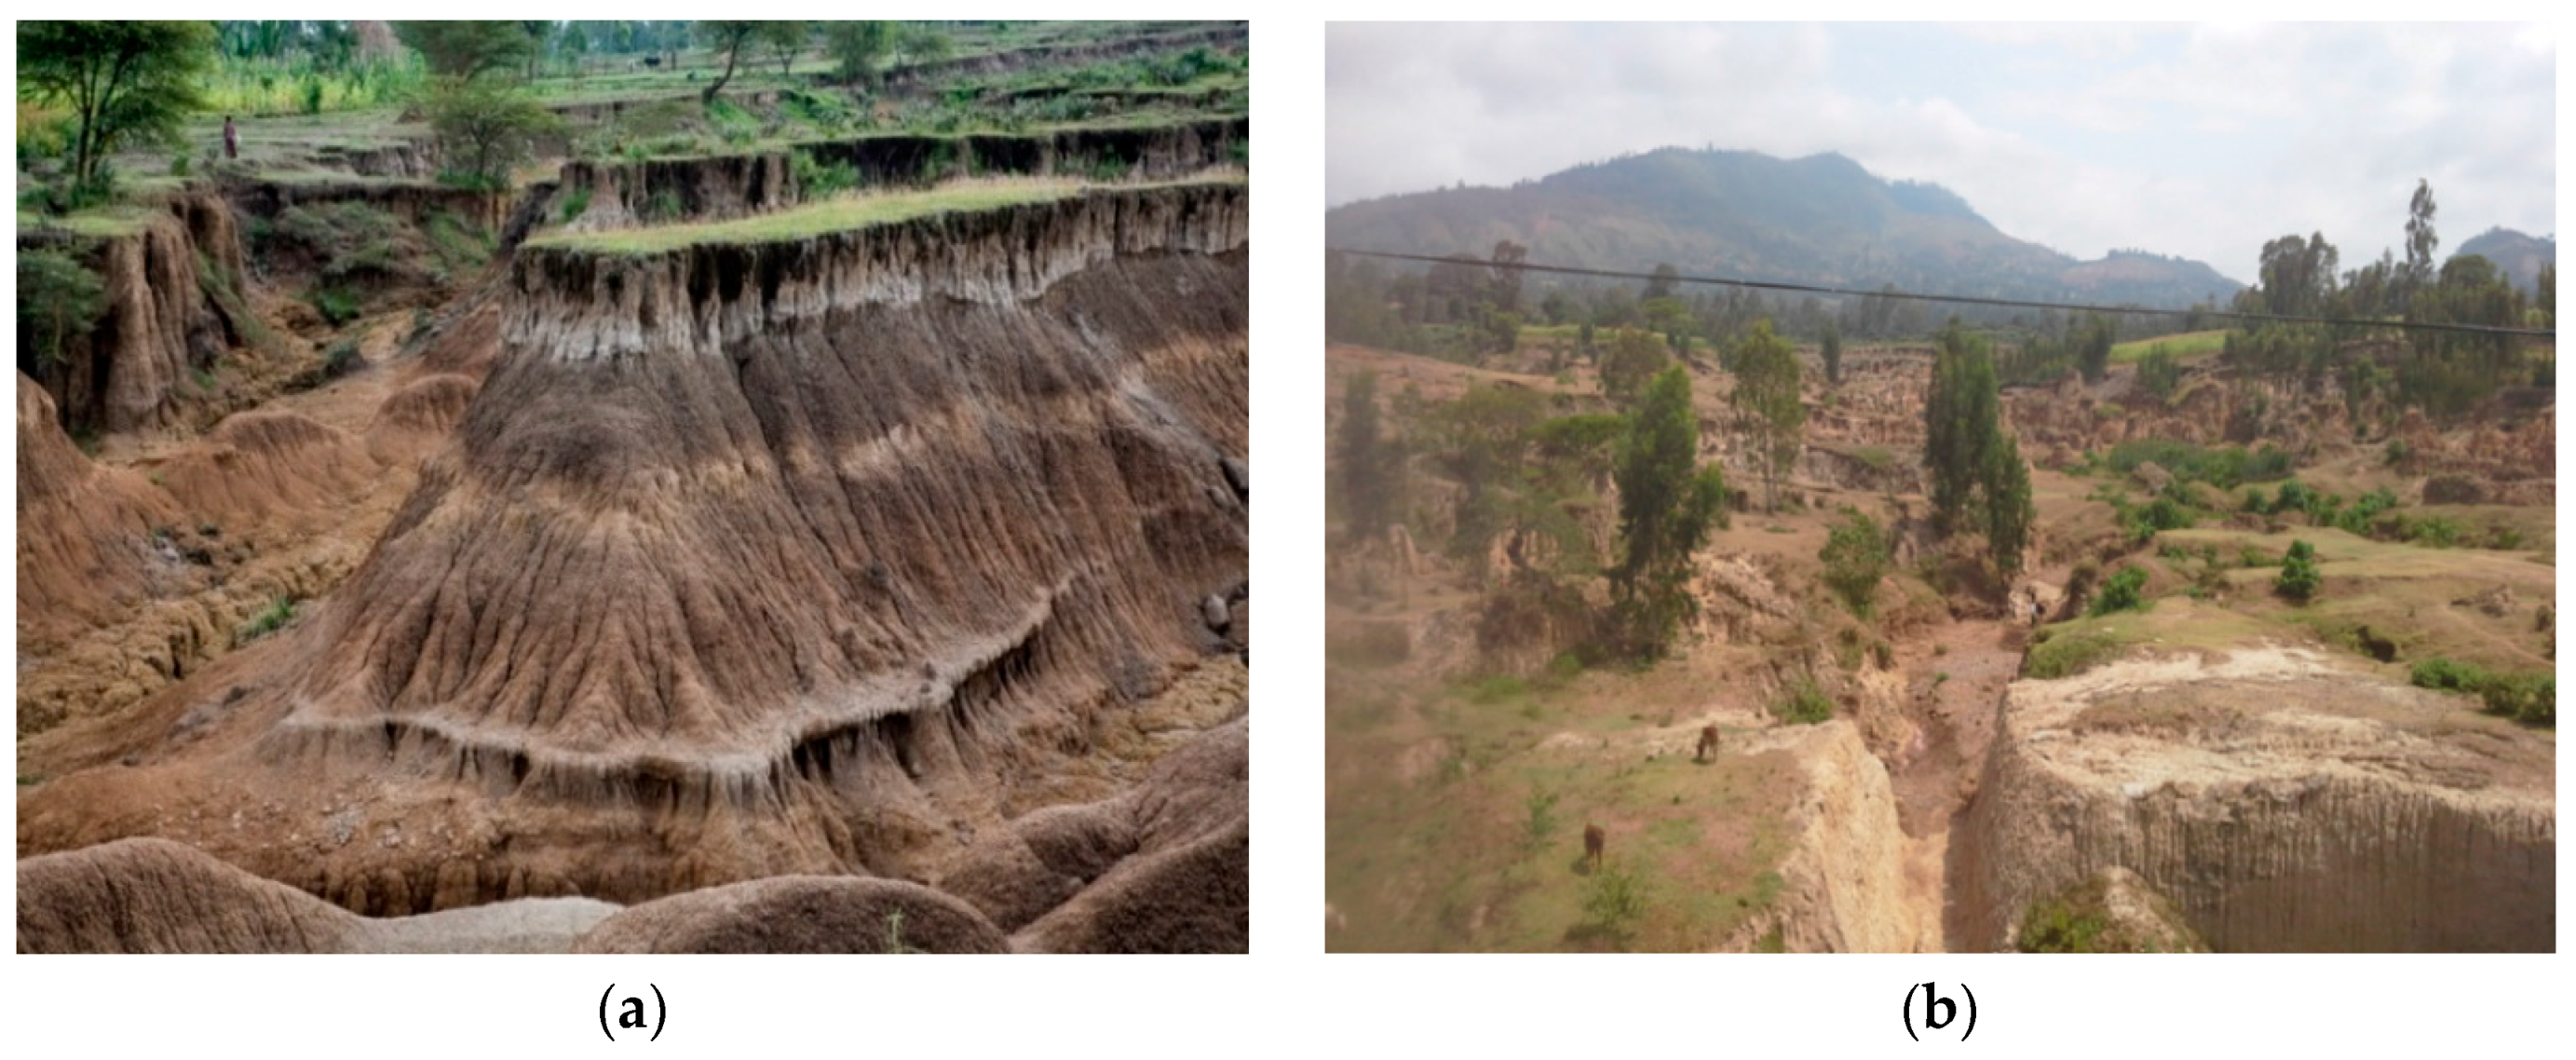
The respondents mentioned soil erosion and land degradation as the most notable effects of LULC changes in the basin. They considered soil erosion and degradation as the main reasons for the decline of agricultural production, especially in the highlands. Field observations verified the existence of severe soil erosion and land degradation problems in all surveyed woredas of the basin (Figure 3). The disappearance of multipurpose indigenous tree species such as Cordia africana Lam. (locally called Wanza) and Aningeria adolfi-friederici (Engl.) (locally called Qerero), diminishing of grazing lands and reduction in the abundance of medicinal plant species were other consequences of LULC mentioned by the respondents. They further indicated that the continuing reduction of the grazing lands was a source of conflict among different ethnic groups living in the basin, as well as between protected areas and surrounding communities. The problem of grazing lands was very severe in the Sidama and Gedeo zones, and we observed a high proportion of households without livestock during the survey time. The respondents also mentioned the reduction (in some cases local extinction) of wildlife as other effects of LULC changes in the basin. However, they mentioned this as a positive outcome of LULC changes. A few of the respondents also mentioned the growing attacks of migratory birds on their crops.
4. Discussion
ACB has experienced a substantial and increasing rate of LULC changes and landscape fragmentation over the past 25 years between 1985 and 2010. Both arable land and shrubland were the major LULC classes that account for almost half of the landscape in the first time period between 1985 and 1995. However, the situation changed in the second period between 1995 and 2010, with arable land becoming a major LULC class dominating the landscape of the basin. In both periods, LULC conversions were negligible in mild sub-humid midland and cool and humid highland areas of the basin, despite the presence of high population pressure on the landscape (Figure S2), indicating that a high population density has less influence on LULC changes of those areas. This is mainly because most suitable land in mild sub-humid midland and cool and humid highland areas was already under arable land, coffee agroforestry, and heterogeneous agriculture, and readily convertible land to new arable uses was in great shortage in these parts of the basin. On the other hand, the high population pressure and shortage of land in those areas compelled the farmers to move into warm semi-arid lowlands of the basin where shrubland, natural grassland, forests, inland wetlands, and inland waters dominate the landscape. The warm semi-arid lowlands of the basin remain a favorite destination for the immigrant farmers (either voluntarily or as part of a government resettlement plan) and, as a result, experienced a greater degree of LULC changes and landscape fragmentation between 1985 and 2010.
The first period was characterized by expansion of arable land, accompanied by a reduction in the natural grassland, and to some extent, shrubland in the landscape of the basin. This was the period when severe drought and famine affected the country, and nationwide planned resettlement and villagization programs were implemented by the government to combat the effects of drought and increase agricultural productivity [55]. The programs aimed to move farmers from densely populated highlands and drought affected areas into compact settlements in sparsely populated potential areas mostly located in the lowlands [56]. During the first period, the implementation of resettlement and villagization programs in the basin highly emphasized the problem of food shortage, with little attention to proper impact studies. As in other parts of the country, the outcome of the programs in the basin is often visible through expansion of farmlands by converting areas covered with natural vegetation often more aggressively by newcomers in the process of establishing themselves, with their cultural background that differs from the original inhabitants who have adapted to the system through generations [57]. For example, the resettlements at Ledo in Guji Zone, Boreda in Gamo Gofa Zone, and Bilate in Wolayita Zone significantly reduced grassland and shrubland covers in those areas. Similarly, the redistribution of communal areas of mostly grasslands to landless farmers and military veterans played a significant role in the reduction of grassland areas in mild sub-humid midland and cool and humid highlands, contributing to the reduction of livestock populations in those areas due to shortage of grazing lands. However, the farmers in these areas heavily rely on enset-coffee system, and the absence of livestock was not a serious threat to their food security and ability to cope with drought and other sources of risks. Similarly, a significant reduction of grassland was observed in the southern part of the basin as a result of a rapid population growth and subsequent conversion of grassland to arable land. Other studies conducted in the southern part of the basin have also documented similar observations. For example, Assefa and Bork [27] reported a reduction of grassland in the southern part of the basin around Chencha and Arba Minch as a result of rapid population growth and agricultural expansion in the areas. Wagesho [33] reported a reduction in grassland in Bilate and Hare catchments due to the expansion of settlement and agricultural activities in the landscape. LULC changes due to the effect of resettlement have been documented in other parts of the country as well. Yonas et al. [58] reported high degradation of rangelands in southwestern Ethiopia following the government resettlement program. Similarly, Reid et al. [10] reported rapid LULC changes in Ghibe valley, southwestern Ethiopia, caused by the combined effects of resettlement and drought induced migration from some areas of northern Ethiopia.
A relatively large tract of shrubland was removed from the landscape of the basin during the second period between 1995 and 2010. The reduction of shrubland was particularly higher in areas located in the west and south of Lake Chamo and Lake Abaya, mainly due to agricultural expansion in the area. Similarly, shrubland located near urban areas and main roads were reduced due to an increasing demand of wood for fuel and construction by city dwellers. The second period largely corresponds to regime change, followed by social, economic, and political transformation in the country, and the absence of clear land tenure system and weak government during regime change in the country, which created free access to land located in the warm semi-arid lowlands of the basin. Many farmers, particularly from the highlands of Gamo Gofa, Kore and part of Derashe and Guji areas, seized the opportunity and migrated to the area either to find new land to cultivate or generate income from sales of charcoal, firewood, and construction materials to support their livelihoods. As an increasing number of people moved into this part of the basin, the need for more farmland and requirement of wood for fuel and construction increased rapidly, and caused significant reductions of shrubland and expansion of cropland and settlement in the landscape. Additionally, the establishment of new regional boundaries which divide the basin based on ethnicities, and the emergence of new market opportunities for cash crops like banana, cotton, and khat played an additional role for LULC changes in the second period. The expansion of banana and cotton production by both small-scale farmers and commercial farms was one of the main causes for the reduction of shrubland cover in Arba Minch Zuria, Mirab Abaya and Bilate areas. A more recent expansion of infrastructure and irrigation facilities in the basin also contributed to LULC changes in the second period.
Agricultural expansion related to population growth, migration, shifts in government policy, and regime change is one of the key driving forces behind LULC changes in ACB. Population growth, immigration, and regime change have often been reasons for LULC changes in many parts of the country as well. For example, the government-owned Munesa-Shashemene forestry project lost most of its forest cover to cultivated land during the 1991 government change [59]. Similarly, Tekle [60] reported destruction of shrubs and small trees during the same period in Southern Wello in northern Ethiopia. Tsegaye et al. [58] reported reduction of woodland cover in northern Afar due to a high influx of immigrants from the Tigray highlands following famine in the 1980s.
Rapid population growth as a result of both birth and migration has greatly modified the landscape of ACB. The issues of population growth and a very limited scope to expand agricultural area and/or lack of appropriate technology to improve productivity in the existing area are prominent in the midland and highland areas of the basin. Migration out of areas suffering from land scarcity and low productivity to ecologically marginal areas of the basin, and converting more land to crop cultivation and settlements, are some of the responses of the population. This, additionally driven by infrastructural development and a reduction of vector-borne diseases in the lowlands, has resulted in a reduction and extensive fragmentation of shrublands and natural grasslands located in the warm semi-arid lowland areas of the basin. Due to a higher rate of rural poverty and very few employment opportunities to absorb rural labor, population growth is often correlated with LULC changes in Ethiopia [61]. This is often the case in other countries in African [62,63]. However, population growth does not necessarily result in LULC changes, and environmental degradation in economies that are creating a large number of new jobs in other sectors or land productivity growth can be achieved using agricultural intensification. For example, land abandonment (cropland to grassland) and afforestation (the expansion of forest on cropland and grassland) are reported as the most prominent drivers of landscape change in Europe [19,64]. Agricultural intensification contributed to the abandonment and subsequent reforestation of least suitable plots in Vietnam [65].
The expansion of agricultural activities in the landscape of ACB at the expense of natural vegetation, and fragmentation of the remaining shrubland and natural grasslands, has great ecological consequences in the basin. Some of the observed consequences of LULC changes in the basin included severe soil erosion and land degradation in mild sub-humid midland and cool and humid highland areas, and increased runoff [33] and sediment yield [33,66,67] from the catchment to rivers and lakes found in warm semi-arid lowland areas. This is due to reduction of shrubland and natural grassland, which play a significant role in modifying surface hydrology, and soil erosion process and reducing sediment flow in the landscape [68]. They act as filters or barriers controlling the flows of surface runoff and sediments originated in mild sub-humid and cool and humid highland areas of the basin before it enters rivers, lakes, and wetlands found in the rift floor. The reduction of shrubland and natural grassland covers, and subsequent expansion of cultivated land in the basin, alter this important ecological function and, consequently, affect the volume and water qualities of the lakes found in the rift floor. Fluctuations in the level of Lake Abaya (the biggest lake of the basin) have been observed since the beginning of measurements in the 1970s [66]. The lake level decreased continually until 1989, and has increased continuously since then, despite annual precipitation in the catchment and major tributaries remaining stagnant or even showing a negative trend [26,66]. The result of GIS analysis indicated that the surface area of Lake Abaya reduced by 1.2% in the first period and increased by 2.9% in the second period. The slight reduction of Lake Abaya during the first period was possibly attributed to the effect of severe drought incidences in the 1980s [66], while the increase in the second period was primarily associated with the effects of LULC changes in the basin. According to Schϋtt and Thiemann [66], the climatic conditions and geological factors of the basin considered to have less influence on the increasing level of Lake Abaya. LULC changes, on the other hand, were perhaps the most important factor affecting the water level of Lake Abaya. LULC changes have been affecting the water level of the Lake Abaya directly by increasing surface runoff and sediment yield from the catchments, and indirectly by the obstruction of surface outflow from Lake Abaya to Lake Chamo as a result of high sediment deposition in the channel by Kulfo River [66]. Surface outflow from Lake Abaya to Lake Chamo as a form of overflow is one factor regulating the water level of Lake Abaya. Termination of the overflow of Lake Abaya, and an increased surface runoff from the catchments, helped the lake to store more water and thereby increased its level. Increased runoff and Lake Abaya water levels impacted the size of nearby wetlands. Increased sediment deposition, on the other hand, reduced the storage capacity of the lake and affected its water quality and productivities. Rapid concentration of nutrients, reduced water transparency, the solubility of oxygen, and primary productivity have been observed in the lake [29,30,67]. As a result, the lake has significantly lower fish populations than the neighboring Lake Chamo, despite its size, which is twice as big as the latter lake [67,69]. This was also further confirmed by individuals working on both lakes as fishermen during our field visit.
On the contrary, Lake Chamo (the second biggest lake of the basin) has shrunk by 9.3% between 1985 and 2010. High irrigation activities on the tributaries, and the reduction then final termination of Lake Abaya overflow to Lake Chamo, were reported as the main reasons for the reduction of Lake Chamo [66,70]. The ongoing shrinkage of Lake Chamo affects the suitable fish breeding grounds and creates an opportunity for farmers to expand their farms and cattle grazing areas into the shoreline and lacustrine plains, which fragmented grazing and basking sites of hippopotamus and other reptiles inhabiting the lake. The negative impacts of these changes are also evident in reduced fish stocks and tourist attraction of the lake.
As arable land continues to expand in warm semi-arid lowland areas of the basin, the landscape experienced a greater degree of fragmentation and formed smaller and isolated patches, mainly comprised of smaller interspersed patches of arable land, shrubland, and natural grassland. The fragmentation of vast areas of shrubland and natural grassland into small and isolated patches may support the claim that ACB is gradually degraded due to increasing human activities in the landscape. Shrubland and natural grassland found in the basin are valuable resources for traditional beekeeping and plants used for medicinal purposes for human and livestock by local communities. They are also important habitats for large mammal and bird species, including those Palaearctic and intra-Africa migrants, as well as those endemic to the country [71]. The observed continuous destruction and fragmentation of important natural vegetation in the basin reduced the ecological services they provided to the community, as well as greatly affected the role of the landscape for biodiversity conservation. Continuous reduction of habitat patch size and isolation affects composition and diversity of species in the landscape [72] and the populations of animals that the landscape can support [73]. This is one of the main factors which contributed to sharp reduction and, in some cases, local extinction of plants and wildlife previously prominent in the area.
5. Conclusions
This study has highlighted and illustrated the process and connotations of a landscape level understanding for sustainable land management planning by taking the case of ACB, which is of vital environmental, social, and economic importance in Ethiopia. LULC changes and simultaneous landscape fragmentation are the main underlying factors for ecosystem change in ACB. The main characteristics of the LULC changes observed in ACB imply a reduction in the total amount of shrubland and natural grassland, and a significant increase in agricultural area. These changes continuously alter the spatial patterns of the landscape, and greatly modify the entire landscape of the basin. The driving factors for the LULC changes in the ACB were both national and regional/ local in origin. Rapid population growth in warm semi-arid areas of the basin as a result of immigration and policy change in the country are considered the most important driving factors for LULC changes in the basin between 1985, 1995, and 2010. Therefore, intervention measures that take into account the socio-political and ecological dynamics of the basin need to be in place in order to streamline the immigration and resettlement processes (either voluntarily or as part of the government plan) into warm semi-arid areas of the basin.
Landscape changes as a result of LULC, and simultaneous landscape pattern changes, are ongoing phenomena in the basin. LULC changes, and the related trend of increasing arable land expansion and reduction of natural vegetation in the basin, may lead to drastic changes in the drainage patterns and water flows. These may alter the vegetation, nutrient levels, and related processes, and damage the aquatic and terrestrial biodiversity of the basin, unless restoration actions are taken soon to save the basin from further damages. Despite its richness in biodiversity, which makes it a rare habitat, and the socioeconomic value ACB has, efforts on the management and restoration plan for conservation and sustainable utilization of its resources are not adequate. This study has achieved a useful milestone to contribute to the development of relevant management approaches for the basin. However, to strengthen the knowledge base, it is recommended that the effect of landscape change on the basin’s biodiversity and resources need be quantified in the future to pinpoint vulnerable species that need urgent conservation attention and introduce sustainable resource management practices in the basin, respectively. At the same time, positive steps should be taken through an innovative approach which combines resource management measures with research. Commitments of the government and concerned NGOs, working closely with local communities through participatory approaches, may facilitate efforts to reverse the current trend of LULC changes in the basin. As the area needs urgent action, sustainable land management approaches should be integrated with the traditional farming and non-farming uses of land in the basin. Combining practical action with research can help practice to be supported with scientific evidence. Therefore, the involvement of research centers and higher education institutions, particularly Arba Minch University, is a good strategy.
Supplementary Materials
The following are available online at www.mdpi.com/2073-445X/7/1/2/s1, Figure S1: LULC Map of ACB in 1985 (a), 1995 (b) and 2010 (c); Figure S2: Population density in ACB in 1998 (a) and 2007 (b).
Acknowledgments
This study was partly financed by STUBE Baden-Württemberg (A Student Program for students from Africa, Asia and Latin America). We are grateful. We are also grateful to the University of Hohenheim for the provision of software and computer facilities needed for this study.
Author Contributions
A.W.Y. and M.C. conceived and designed the study; W.D. designed the questionnaire; A.W.Y. collected and analyzed the data and wrote the paper; G.K. took part in paper writing; M.C., G.K. and W.D. critically reviewed the paper and provided comments on the contents and structure of the paper.
Conflicts of Interest
The authors declare no conflict of interest.
References
- Smith, B.D.; Zeder, M.A. The onset of the Anthropocene. Anthropocene 2013, 4, 8–13. [Google Scholar] [CrossRef]
- Bennett, A.F.; Saunders, D.A. Habitat fragmentation and landscape change. In Conservation Biology for All; Sodhi, S.N., Ehrlich, R.P., Eds.; Oxford University Press: New York, NY, USA, 2010; pp. 88–104. ISBN 15434060. [Google Scholar]
- Kabba, V.T.S.; Li, J. Analysis of land use and land cover changes, and their ecological implications in Wuhan, China. J. Geogr. Geol. 2011, 3, 104–118. [Google Scholar] [CrossRef]
- Wang, S.; Wang, S. Land use/land cover change and their effects on landscape patterns in the Yanqi Basin, Xinjiang (China). Environ. Monit. Assess. 2013, 185, 9729–9742. [Google Scholar] [CrossRef] [PubMed]
- Lawler, J.J.; Lewis, D.J.; Nelson, E.; Plantinga, A.J.; Polasky, S.; Withey, J.C.; Helmers, D.P.; Martinuzzi, S.; Pennington, D.; Radeloff, V.C. Projected land-use change impacts on ecosystem services in the United States. Proc. Natl. Acad. Sci. USA 2014, 111, 7492–7497. [Google Scholar] [CrossRef] [PubMed]
- Salazar, A.; Baldi, G.; Hirota, M.; Syktus, J.; McAlpine, C. Land use and land cover change impacts on the regional climate of non-Amazonian South America: A review. Glob. Planet. Chang. 2015, 128, 103–119. [Google Scholar] [CrossRef]
- Lu, D.; Mausel, P.; Brondízio, E.; Moran, E. Change detection techniques. Int. J. Remote Sens. 2004, 25, 2365–2401. [Google Scholar] [CrossRef]
- Cotter, M.; Berkhoff, K.; Gibreel, T.; Ghorbani, A.; Golbon, R.; Nuppenau, E.A.; Sauerborn, J. Designing a sustainable land use scenario based on a combination of ecological assessments and economic optimization. Ecol. Indic. 2014, 36, 779–787. [Google Scholar] [CrossRef]
- Ariti, A.T.; van Vliet, J.; Verburg, P.H. Land-use and land-cover changes in the Central Rift Valley of Ethiopia: Assessment of perception and adaptation of stakeholders. Appl. Geogr. 2015, 65, 28–37. [Google Scholar] [CrossRef]
- Reid, R.S.; Kruska, R.L.; Muthui, N.; Taye, A.; Wotton, S.; Wilson, C.J.; Mulatu, W. Land-use and land-cover dynamics in response to changes in climatic, biological and socio-political forces: The case of southwestern Ethiopia. Landsc. Ecol. 2000, 15, 339–355. [Google Scholar] [CrossRef]
- Muluneh, A. Synthesis of Research on Land Use and Land Cover Dynamics in the Ethiopian Highlands. Available online: http://www.unulrt.is/static/fellows/document/unu-lrt_2010_alemayehu-muluneh.pdf (accessed on 30 May 2015).
- Kindu, M.; Schneider, T.; Teketay, D.; Knoke, T. Land Use/Land Cover Change Analysis Using Object-Based Classification Approach in Munessa-Shashemene Landscape of Ethiopian Highlands. Remote Sens. 2013, 5, 2411–2435. [Google Scholar] [CrossRef]
- Bewket, W.; Abebe, S. Land-use and land-cover change and its environmental implications in a tropical highland watershed, Ethiopia. Int. J. Environ. Stud. 2013, 70, 126–139. [Google Scholar] [CrossRef]
- Minta, M.; Kibret, K.; Thorne, P.; Nigussie, T.; Nigatu, L. Land use and land cover dynamics in Dendi-Jeldu hilly-mountainous areas in the central Ethiopian highlands. Geoderma 2018, 314, 27–36. [Google Scholar] [CrossRef]
- Garedew, E.; Sandewall, M.; Söderberg, U.; Campbell, B.M. Land-use and land-cover dynamics in the central rift valley of ethiopia. Environ. Manag. 2009, 44, 683–694. [Google Scholar] [CrossRef] [PubMed]
- Gashaw, T.; Tulu, T.; Argaw, M.; Worqlul, A.W. Evaluation and prediction of land use/land cover changes in the Andassa watershed, Blue Nile Basin, Ethiopia. Environ. Syst. Res. 2017, 6, 17. [Google Scholar] [CrossRef]
- Nyssen, J.; Simegn, G.; Taha, N. An upland farming system under transformation: Proximate causes of land use change in Bela-Welleh catchment (Wag, Northern Ethiopian Highlands). Soil Tillage Res. 2009, 103, 231–238. [Google Scholar] [CrossRef]
- Tsegaye, D.; Moe, S.R.; Vedeld, P.; Aynekulu, E. Land-use/cover dynamics in Northern Afar rangelands, Ethiopia. Agric. Ecosyst. Environ. 2010, 139, 174–180. [Google Scholar] [CrossRef]
- Bürgi, M.; Bieling, C.; von Hackwitz, K.; Kizos, T.; Lieskovský, J.; Martín, M.G.; McCarthy, S.; Müller, M.; Palang, H.; Plieninger, T.; et al. Processes and driving forces in changing cultural landscapes across Europe. Landsc. Ecol. 2017, 32, 2097–2112. [Google Scholar] [CrossRef]
- Narumalani, S.; Mishra, D.R.; Rothwell, R.G. Change detection and landscape metrics for inferring anthropogenic processes in the greater EFMO area. Remote Sens. Environ. 2004, 91, 478–489. [Google Scholar] [CrossRef]
- Southworth, J.; Munroe, D.; Nagendra, H. Land cover change and landscape fragmentation—Comparing the utility of continuous and discrete analyses for a western Honduras region. Agric. Ecosyst. Environ. 2004, 101, 185–205. [Google Scholar] [CrossRef]
- Nagendra, H.; Munroe, D.K.; Southworth, J. From pattern to process: Landscape fragmentation and the analysis of land use/land cover change. Agric. Ecosyst. Environ. 2004, 85, 111–115. [Google Scholar] [CrossRef]
- Zhao, Y.; Zhang, K.; Fu, Y.; Zhang, H. Examining land-use/land-cover change in the lake Dianchi Watershed of the Yunnan-Guizhou plateau of Southwest China with remote sensing and GIS techniques: 1974–2008. Int. J. Environ. Res. Public Health 2012, 9, 3843–3865. [Google Scholar] [CrossRef] [PubMed]
- Southworth, J.; Nagendra, H.; Tucker, C. Fragmentation of a Landscape: Incorporating landscape metrics into satellite analyses of land-cover change. Landsc. Res. 2002, 27, 253–269. [Google Scholar] [CrossRef]
- Ethiopian Wildlife and Natural History Society. Ethiopia. In Important Bird Areas in Africa and Associated Islands: Priority Sites for Conservation; Fishpool, L.D.C., Evans, M.I., Eds.; BirdLife Conservation; Pisces Publications: Newbury/Berkshire, UK; BirdLife International: Cambridge, UK, 2001; pp. 291–336. ISBN 187435720X. [Google Scholar]
- Schϋtt, B.; Thiemann, S.; Wenclawiak, B. Deposition of modern fluvio-lacustrine sediments in Lake Abaya, South Ethiopia—A case study from the delta areas of Bilate river and Gidabo river, Northern Basin. Geomorphol. NF 2005, 138, 131–151. [Google Scholar]
- Assefa, E.; Bork, H. Dynamics and driving forces of agricultural landscapes in Southern Ethiopia: A case study of the Chencha and Arbaminch areas. J. Land Use Sci. 2016, 11, 278–293. [Google Scholar] [CrossRef]
- Assefa, E.; Bork, H.-R. Deforestation and forest management in Southern Ethiopia: Investigations in the Chencha and Arbaminch areas. Environ. Manag. 2014, 53, 284–299. [Google Scholar] [CrossRef] [PubMed]
- Teklemariam, A.; Wenclawiak, B. Water quality monitoring within Lake Abaya-Chamo drainage basin. In Lake Abaya Research Symposium 2004—Catchment and Lake Research; Thiemann, S., Förch, G., Eds.; University of Siegen: Siegen, Germany, 2005; pp. 109–118. [Google Scholar]
- Teffera, F.E.; Lemmens, P.; Deriemaecker, A.; Brendonck, L.; Dondeyne, S.; Deckers, J.; Bauer, H.; Gamo, F.W.; De Meester, L. A call to action: Strong long-term limnological changes in the two largest Ethiopian Rift Valley lakes, Abaya and Chamo. Inland Waters 2017, 7, 129–137. [Google Scholar] [CrossRef]
- Tibebu Kassawmar, N.; Ram Mohan Rao, K.; Lemlem Abraha, G. An integrated approach for spatio-temporal variability analysis of wetlands: A case study of Abaya and Chamo lakes, Ethiopia. Environ. Monit. Assess. 2011, 180, 313–324. [Google Scholar] [CrossRef] [PubMed]
- Tadele, K.; Förch, G. Impact of land use/cover change on streamflow: The case of Hare River Watershed, Ethiopia. In Lake Abaya Research Symposium 2007—Lake and Catchment Research; Förch, G., Ed.; University of Siegen: Siegen, Germany, 2009; pp. 147–153. [Google Scholar]
- Wagesho, N. Catchment dynamics and its impact on runoff generation: Coupling watershed modelling and statistical analysis to detect catchment responses. Int. J. Water Resour. Environ. Eng. 2014, 6, 73–87. [Google Scholar] [CrossRef]
- Kelboro, G.; Stellmacher, T. Protected areas as contested spaces: Nech Sar National Park, Ethiopia, between “local people”, the state, and NGO engagement. Environ. Dev. 2015, 16, 63–75. [Google Scholar] [CrossRef]
- Mati, B.M.; Mutie, S.; Gadain, H.; Home, P.; Mtalo, F. Impacts of land-use/cover changes on the hydrology of the transboundary Mara River, Kenya/Tanzania. Lakes Reserv. Res. Manag. 2008, 13, 169–177. [Google Scholar] [CrossRef]
- Ayenew, T.; GebreEgziabher, M. Landscapes and Landforms of Ethiopia; Billi, P., Ed.; World Geomorphological Landscapes; Springer: Dordrecht, The Netherlands, 2015; ISBN 978-94-017-8025-4. [Google Scholar]
- Ebinger, C.J.; Yemane, T.; Woldegabriel, G.; Aronson, J.L.; Walter, R.C. Late Eocene-Recent volcanism and faulting in the southern main Ethiopian rift. J. Geol. Soc. Lond. 1993, 150, 99–108. [Google Scholar] [CrossRef]
- Blumberg, S.; Schütt, B. Character of lake floor sediments from central Lake Abaya, South Ethiopia. In Lake Abaya Research Symposium 2004—Catchment and Lake Researcha; Förch, G., Ed.; University of Siegen: Siegen, Germany, 2005; pp. 1–10. [Google Scholar]
- Getahun, A. Agricultural systems in Ethiopia. Agric. Syst. 1978, 3, 281–293. [Google Scholar] [CrossRef]
- CSA (Central Statistics Agency). Population Projection for Ethiopia 2007–2037. The 2012 Inter-Censual Population Survey; CSA: Addis Ababa, Ethiopia, 2013. [Google Scholar]
- USGS (United States Geological Survey) Interface Informaion. Available online: http://landsat.usgs.gov//landsatcollections.php (accessed on 30 May 2016).
- Chander, G.; Markham, B.L.; Helder, D.L. Summary of current radiometric calibration coefficients for Landsat MSS, TM, ETM+, and EO-1 ALI sensors. Remote Sens. Environ. 2009, 113, 893–903. [Google Scholar] [CrossRef]
- Paolini, L.; Grings, F.; Sobrino, J.A.; Munoz, J.C.J.; Karszenbaum, H. Radiometric correction effects in Landsat multi-date/multi-sensor change detection studies. Int. J. Remote Sens. 2006, 27, 685–704. [Google Scholar] [CrossRef]
- Song, C.; Woodcock, C.E.; Seto, K.C.; Lenney, M.P.; Macomber, S.A. Classification and change detection using Landsat TM data: When and how to correct atmospheric effects? Remote Sens. Environ. 2001, 75, 230–244. [Google Scholar] [CrossRef]
- Dejene, A. Integrated Natural Resources Management to Enhance Food Security: The Case for Community-Based Approaches in Ethiopia; FAO: Rome, Italy, 2003. [Google Scholar]
- Bossard, M.; Feranec, J.; Otahel, J. The Revised and Supplemented Corine Land Cover Nomenclature; European Environment Agency: Copenhagen, Denmark, 2000. [Google Scholar]
- Jaffrain, G. Corine Land Cover Outside of Europe—Nomenclature Adaptation to other Bio-Geographical Regions Studies and Project from 1990 to 2010. Available online: http://projects.eionet.europa.eu/leac/library/cube/land_cover/clc-out-of-europe (accessed on 30 May 2015).
- Currit, N. Development of a remotely sensed, historical land-cover change database for rural Chihuahua, Mexico. Int. J. Appl. Earth Obs. Geoinform. 2005, 7, 232–247. [Google Scholar] [CrossRef]
- Kuemmerle, T.; Radeloff, V.C.; Perzanowski, K.; Hostert, P. Cross-border comparison of land cover and landscape pattern in Eastern Europe using a hybrid classification technique. Remote Sens. Environ. 2006, 103, 449–464. [Google Scholar] [CrossRef]
- Lu, D.; Weng, Q. A survey of image classification methods and techniques for improving classification performance. Int. J. Remote Sens. 2007, 28, 823–870. [Google Scholar] [CrossRef]
- Jensen, J.R. Introductory Digital Image Processing: A Remote Sensing Perspective, 2nd ed.; Prentice Hall: Saddle River, NJ, USA, 1996; ISBN 978-0131453616. [Google Scholar]
- Mas, J.-F. Monitoring land-cover changes: A comparison of change detection techniques. Int. J. Remote Sens. 1999, 20, 139–152. [Google Scholar] [CrossRef]
- McGarigal, K. FRAGSTATS v4: Spatial Pattern Analysis Program for Categorical and Continuous Maps. Available online: http://www.umass.edu/landeco/research/fragstats/documents/fragstats.help.4.2.pdf (accessed on 6 September 2016).
- Yang, X.; Liu, Z.H.I. Quantifying landscape pattern and its change in an estuarine watershed using satellite imagery and landscape metrics. Int. J. Remote Sens. 2005, 26, 5297–5323. [Google Scholar] [CrossRef]
- Woube, M. Effects of Resettlement Schemes on the Biophysical and Human Environments: The Case of the Gambela Region, Ethiopia; Universal Publishers: Boca Raton, FL, USA, 2005; ISBN 1-58112-483-X. [Google Scholar]
- Rahmato, D. The Peasant and the State: Studies in Agrarian Change in Ethiopia 1950s–2000s; Addis Ababa University Press: Addis Ababa, Ethiopia, 2009; ISBN 9789994452248 999445224X. [Google Scholar]
- Stellmacher, T.; Eguavoen, I. The Rules of Hosts and Newcomers: Local Forest Management after Resettlement in Ethiopia. Available online: http://bestbridge.org/wp-content/uploads/2014/01/Local-forest-management-Till-Stellmacher-full-paper1.pdf (accessed on 30 May 2016).
- Yonas, B.; Beyene, F.; Negatu, L.; Angassa, A. Influence of resettlement on pastoral land use and local livelihoods in southwest Ethiopia. Trop. Subtrop. Agroecosyst. 2013, 16, 103–117. [Google Scholar]
- Dessie, G.; Christiansson, C. Forest decline and its causes in the South-Central Rift Valley of Ethiopia: Human impact over a one hundred year perspective. AMBIO A J. Hum. Environ. 2008, 37, 263–271. [Google Scholar] [CrossRef]
- Tekle, K. Natural regeneration of degraded hillslopes in Southern Wello, Ethiopia: A study based on permanent plots. Appl. Geogr. 2001, 21, 275–300. [Google Scholar] [CrossRef]
- Hailemariam, S.; Soromessa, T.; Teketay, D. Land Use and Land Cover Change in the Bale Mountain Eco-Region of Ethiopia during 1985 to 2015. Land 2016, 5, 41. [Google Scholar] [CrossRef]
- Ouedraogo, I.; Tigabu, M.; Savadogo, P.; Compaore, H.; Oden, P.C.; Ouadba, J.M. Land cover change and its relation with population dynamics in Burkina Faso, West Africa. Land Degrad. Dev. 2010, 21, 453–462. [Google Scholar] [CrossRef]
- Estes, A.B.; Kuemmerle, T.; Kushnir, H.; Radeloff, V.C.; Shugart, H.H. Land-cover change and human population trends in the greater Serengeti ecosystem from 1984–2003. Biol. Conserv. 2012, 147, 255–263. [Google Scholar] [CrossRef]
- Plieninger, T.; Draux, H.; Fagerholm, N.; Bieling, C.; Bürgi, M.; Kizos, T.; Kuemmerle, T.; Primdahl, J.; Verburg, P.H. The driving forces of landscape change in Europe: A systematic review of the evidence. Land Use Policy 2016, 57, 204–214. [Google Scholar] [CrossRef]
- Meyfroidt, P.; Lambin, E.F. The causes of the reforestation in Vietnam. Land Use Policy 2008, 25, 182–197. [Google Scholar] [CrossRef]
- Schϋtt, B.; Thiemann, S. Kulfo River, South Ethiopia as a regulator of lake level changes in the Lake Abaya-Lake Chamo system. Zbl. Geol. Paläont 2006, 1, 129–143. [Google Scholar]
- Schütt, B.; Wenclawiak, B. Off-site effects of soil erosion in the environment of Lake Abaya, South Ethiopia. DIE ERDE 2010, 141, 217–233. [Google Scholar]
- Zuazo, V.H.D.; Pleguezuelo, C.R.R. Soil-erosion and runoff prevention by plant covers. A review. Agron. Sustain. Dev. 2008, 28, 65–86. [Google Scholar] [CrossRef]
- Gebre-Mariam, Z. The effects of wet and dry seasons on concentrations of solutes and phytoplankton biomass in seven Ethiopian rift-valley lakes. Limnologica 2002, 179, 169–179. [Google Scholar]
- Awulachew, S.B. Modelling natural conditions and impacts of consumptive water use and sedimentation of Lake Abaya and Lake Chamo, Ethiopia. Lakes Reserv. Res. Manag. 2006, 11, 73–82. [Google Scholar] [CrossRef]
- Duckworth, J.W.; Evans, M.I.; Safford, R.J.; Telfer, M.G.; Timmins, R.J.; Chemere, Z. A Survey of Nechisar National Park, Ethiopia: Report of the Cambridge Ethiopia Ground-Water Forest Expedition 1990; International Council for Bird Preservation: Cambridge, UK, 1992. [Google Scholar]
- Forman, R.; Godron, M. Landscape Ecology; John Wiley and Sons: New York, NY, USA, 1986; ISBN 978-0-471-87037-1. [Google Scholar]
- Bender, D.J.; Contreras, T.A.; Fahrig, L. Habitat loss and population decline: A meta-analysis of the patch size effect. Ecology 1998, 79, 517–533. [Google Scholar] [CrossRef]
Figure 1.
Map of the study area.

Figure 2.
Drivers of LULC changes between 1985 and 2010 in ACB.

Figure 3.
Soil erosion and land degradation in Wolayita (a) and Kembata Tembaro (b) zones in Bilate catchment, ACB.
Figure 3.
Soil erosion and land degradation in Wolayita (a) and Kembata Tembaro (b) zones in Bilate catchment, ACB.


Table 1.
Traditional Agro-climatic Zones and their physical characteristics.
| Zone | Altitude (m) | Rainfall (mm/year) | Length of Growing Period (d) | Average Annual Temperature (°C) |
|---|---|---|---|---|
| Wurch (cold and moist) | 3200 plus | 900–2200 | 211–365 | >11.5 |
| Dega (cool and humid) | 2300–3200 | 900–1200 | 121–210 | 17.5/16.0–11.5 |
| Weyna Dega (cool sub-humid) | 1500–2300/2400 | 800–1200 | 91–120 | 20.0–17.5/16.0 |
| Kolla (warm semi-arid) | 500–1500/1800 | 200–800 | 46–90 | 27.5–20 |
| Berha (hot arid) | under 500 | under 200 | 0–45 | >27.5 |
Source: [45].
Table 2.
Land use and land cover (LULC) classes and their descriptions.
| LULC Class | Description |
|---|---|
| Inland waters | Water courses like rivers and streams, and water bodies like lakes and ponds |
| Forests | All type of forests and woodland |
| Shrubland | Bush or shrub-dominated land with isolated trees always with a lower range of grass |
| Arable land | Regularly ploughed land for growing rain-fed and/or irrigated crops with some border trees |
| Heterogeneous agricultural areas | Annual crops mixed with permanent crops and some woody vegetation usually eucalyptus trees |
| Coffee agroforestry | Coffee plantations with mixed shade trees, Enset, Khat and fruits trees |
| Natural grassland | Grassland with low productivity often situated in plains, rough ground, or rocky areas |
| Inland wetlands | Non-forested areas seasonally or permanently waterlogged |
| Built-up areas | Continuous and discontinuous impervious layers and aggregated buildings of all kinds |
Table 3.
Accuracy assessment of classified images.
| LULC Class | Accuracy (%) | |||||
|---|---|---|---|---|---|---|
| 1985 | 1995 | 2010 | ||||
| Producer’s | User’s | Producer’s | User’s | Producer’s | User’s | |
| Inland waters | 86.67 | 92.86 | 86.67 | 100.0 | 93.33 | 100.0 |
| Forests | 77.78 | 87.50 | 80.56 | 76.19 | 84.44 | 92.68 |
| Shrubland | 85.83 | 87.29 | 87.50 | 89.48 | 91.67 | 88.71 |
| Arable land | 80.83 | 78.86 | 80.00 | 89.70 | 85.83 | 83.74 |
| Heterogeneous agricultural areas | 89.17 | 95.54 | 88.33 | 93.81 | 89.17 | 87.70 |
| Coffee agroforestry | 88.89 | 91.95 | 83.33 | 88.24 | 88.89 | 87.91 |
| Natural grassland | 90.00 | 72.97 | 80.33 | 77.45 | 86.93 | 85.71 |
| Inland wetlands | 86.67 | 92.86 | 73.33 | 91.67 | 86.67 | 96.30 |
| Built-up areas | 66.67 | 90.91 | 60.67 | 100 | 64.29 | 90.00 |
| Overall Accuracy | 85.58 | 83.15 | 87.73 | |||
| Kappa Coefficient | 0.83 | 0.81 | 0.86 | |||
Table 4.
LULC changes of Abaya-Chamo Basin (ACB), Southern Ethiopia in 1985, 1995, and 2010.
| LULC Class | Absolute Area Cover (km2) | LULC Changes between the Periods with Relative to the Basis * (%) | |||||||
|---|---|---|---|---|---|---|---|---|---|
| 1985 | 1995 | 2010 | 1985–1995 | 1995–2010 | 1985–2010 | ||||
| Area | (%) | Area | (%) | Area | (%) | ||||
| Inland waters | 1432.4 | 7.48 | 1432.8 | 7.48 | 1434.1 | 7.49 | 0.03 | 0.09 | 0.12 |
| Forests | 531.6 | 2.78 | 530.9 | 2.77 | 522.5 | 2.73 | −0.13 | −1.58 | −1.71 |
| Shrubland | 4478.9 | 23.39 | 4076.5 | 21.29 | 3188.2 | 16.65 | −8.98 | −21.79 | −28.82 |
| Arable land | 4454.0 | 23.28 | 6043.4 | 31.57 | 7088.6 | 37.02 | 35.75 | 17.24 | 59.15 |
| Heterogeneous agricultural areas | 2519.1 | 13.15 | 2312.1 | 12.08 | 2162.1 | 11.29 | −8.22 | −6.49 | −14.17 |
| Coffee agroforestry | 2226.3 | 11.63 | 2144.3 | 11.20 | 2216.8 | 11.58 | −3.68 | 3.38 | −0.43 |
| Natural grassland | 3205.7 | 16.74 | 2264.6 | 11.83 | 2143.8 | 11.20 | −29.36 | −5.33 | −33.13 |
| Inland wetlands | 291.2 | 1.52 | 328.5 | 1.72 | 365.5 | 1.91 | 12.82 | 11.26 | 25.52 |
| Built-up areas | 7.5 | 0.1 | 10.6 | 0.14 | 25.0 | 0.33 | 40.00 | 135.72 | 230.00 |
* changes between the periods were calculated as 100 × (A + 1 − A)/A, where: A = area of a LULC type, the classes defined for 1985 were taken as a basis.
Table 5.
Transition matrix showing LULC changes (%) in ACB between 1985 and 2010.
| Final State (2010) | Total 1985 | Loss | ||||||||||
|---|---|---|---|---|---|---|---|---|---|---|---|---|
| Inland Waters | Forests | Shrubland | Arable Land | Heterogeneous Agricultural Areas | Coffee Agroforestry | Natural Grassland | Inland Wetlands | Built-Up Areas | ||||
| Initial state (1985) | Inland waters | 7.20 | 0.05 | 0.06 | 0.12 | 0.01 | 0.00 | 0.04 | 0.00 | 0.00 | 7.48 | 0.28 |
| Forests | 0.04 | 1.11 | 0.69 | 0.58 | 0.09 | 0.01 | 0.16 | 0.10 | 0.00 | 2.78 | 1.67 | |
| Shrubland | 0.10 | 1.11 | 11.72 | 6.18 | 0.00 | 0.74 | 3.21 | 0.33 | 0.00 | 23.39 | 11.67 | |
| Arable land | 0.05 | 0.00 | 0.00 | 19.93 | 0.38 | 2.08 | 0.81 | 0.00 | 0.03 | 23.28 | 3.35 | |
| Heterogeneous agricultural areas | 0.01 | 0.03 | 0.10 | 4.28 | 8.54 | 0.00 | 0.16 | 0.00 | 0.03 | 13.15 | 4.62 | |
| Coffee agroforestry | 0.00 | 0.00 | 0.46 | 0.50 | 2.25 | 8.50 | 0.01 | 0.00 | 0.01 | 11.63 | 3.13 | |
| Natural grassland | 0.04 | 0.42 | 3.56 | 5.42 | 0.12 | 0.23 | 6.72 | 0.20 | 0.02 | 16.73 | 10.01 | |
| Inland wetlands | 0.04 | 0.01 | 0.06 | 0.01 | 0.00 | 0.02 | 0.10 | 1.28 | 0.00 | 1.52 | 0.24 | |
| Built-up areas | 0.00 | 0.00 | 0.00 | 0.00 | 0.00 | 0.00 | 0.00 | 0.00 | 0.04 | 0.04 | 0.00 | |
| Total 2010 | 7.49 | 2.73 | 16.65 | 37.02 | 11.29 | 11.58 | 11.2 | 1.91 | 0.13 | |||
| Gain | 0.29 | 1.62 | 4.93 | 17.10 | 2.75 | 3.08 | 4.49 | 0.62 | 0.09 | |||
| Net Change | 0.01 | −0.05 | −6.74 | 13.74 | −4.02 | −0.05 | −5.53 | 0.38 | 0.09 | |||
Table 6.
Landscape metrics for selected LULC at the landscape and class levels, 1985–2010.
| NP (#) | MPS (ha) | LPI (ha) | AI (%) | CONTAG (%) | ||||||
|---|---|---|---|---|---|---|---|---|---|---|
| 1985 | 2010 | 1985 | 2010 | 1985 | 2010 | 1985 | 2010 | 1985 | 2010 | |
| Landscape level | 319,739 | 391,504 | 6.00 | 4.90 | 5.67 | 5.64 | 46.80 | 44.90 | ||
| Class level | ||||||||||
| Arable land | 101,877 | 127,223 | 4.37 | 5.05 | 13.41 | 13.82 | 85.07 | 84.63 | ||
| Shrubland | 95,551 | 114,546 | 4.69 | 3.25 | 13.76 | 3.31 | 81.93 | 78.02 | ||
| Natural grassland | 63,456 | 61,622 | 5.05 | 3.48 | 2.32 | 2.36 | 83.61 | 82.92 | ||
© 2018 by the authors. Licensee MDPI, Basel, Switzerland. This article is an open access article distributed under the terms and conditions of the Creative Commons Attribution (CC BY) license (http://creativecommons.org/licenses/by/4.0/).
Share and Cite
MDPI and ACS Style
WoldeYohannes, A.; Cotter, M.; Kelboro, G.; Dessalegn, W. Land Use and Land Cover Changes and Their Effects on the Landscape of Abaya-Chamo Basin, Southern Ethiopia. Land 2018, 7, 2. https://0-doi-org.brum.beds.ac.uk/10.3390/land7010002
AMA Style
WoldeYohannes A, Cotter M, Kelboro G, Dessalegn W. Land Use and Land Cover Changes and Their Effects on the Landscape of Abaya-Chamo Basin, Southern Ethiopia. Land. 2018; 7(1):2. https://0-doi-org.brum.beds.ac.uk/10.3390/land7010002
Chicago/Turabian StyleWoldeYohannes, Ashebir, Marc Cotter, Girma Kelboro, and Wubneshe Dessalegn. 2018. "Land Use and Land Cover Changes and Their Effects on the Landscape of Abaya-Chamo Basin, Southern Ethiopia" Land 7, no. 1: 2. https://0-doi-org.brum.beds.ac.uk/10.3390/land7010002
Note that from the first issue of 2016, this journal uses article numbers instead of page numbers. See further details here.