Tree Wind Breaks in Central Asia and Their Effects on Agricultural Water Consumption
by
 ,
,
Niels Thevs
1,*, 
Alina Joana Gombert
2,
Eva Strenge
3,
Roland Lleshi
4,
Kumar Aliev
1 and
Begaiym Emileva
1 1
World Agroforestry, Central Asia Office, Bishkek 720001, Kyrgyzstan
2
Julius Kühn-Institute, Institute for Bee Protection, 38104 Braunschweig, Germany
3
Institute of Water Quality and Resource Management, Technical University of Vienna, 1040 Vienna, Austria
4
Faculty Forest and Environment, Eberswalde University for Sustainable Development, 16225 Eberswalde, Germany
*
Author to whom correspondence should be addressed.
Land 2019, 8(11), 167; https://0-doi-org.brum.beds.ac.uk/10.3390/land8110167
Submission received: 26 August 2019
/
Revised: 2 November 2019
/
Accepted: 4 November 2019
/
Published: 6 November 2019
(This article belongs to the Special Issue Drought, Land Use and Soil)
Abstract
:Across Central Asia, agriculture largely depends on irrigation due to arid and semi-arid climatic conditions. Water is abstracted from rivers, which are largely fed by glacier melt. In the course of climate change, glaciers melt down so that a reduced glacier volume and reduced water runoffs are expected to be available for irrigation. Tree wind breaks are one option to reduce water consumption in irrigated agriculture and build resilience against climate change. This paper therefore assesses the water consumption of major crops in Kyrgyzstan and adjacent areas, i.e., cotton (Gossypium hirsutum L.), wheat (Triticum aestivum L.), corn (Zea mays L.), rice (Oryza sativa L.), potato (Solanum tuberosum L.), and barley (Hordeum vulgare L.) in combination with tree wind breaks. Crop water consumption was assessed through the Penman Monteith approach. Tree wind break types investigated were single rows from poplars (Populus spec.) and multiple rows with understory vegetation by elm (Ulmus minor L.) and poplar, respectively. Tree water consumption was determined through sapflow measurements. The seasonal reference evapotranspiration (ETo) for field crops was 876–995 mm without wind breaks and dropped to less than half through multiple row wind breaks with understory vegetation (50 m spacing). Tree water consumption was 1125–1558 mm for poplar and 435 mm for elm. Among the wind break crop systems, elm wind breaks resulted in the highest reductions of water consumption, followed by single row poplars, at spacing of 50 and 100 m, respectively. However, elm grows much slower than poplar, so poplars might be more attractive for farmers. Furthermore, single row wind breaks might by much easier to be integrated into the agrarian landscape as they consume less space.
1. Introduction
Central Asia refers to the region from the Caspian Sea in the west to Mongolia and northwest China in the east. This region is covered by drylands and mountains [1,2,3]. Except for northern Kazakhstan, Agriculture is restricted to rivers valleys, e.g., the Amu Darya, Syr Darya, Chui, or Talas, and to the forelands of the mountains like the northern slopes of the Tianshan [1]. Agriculture depends on irrigation throughout the growing season or at least during summers, as the climate is semi-arid to arid. This makes agriculture the major water consumer across Central Asia. In this study, the term water consumption and evapotranspiration are used as synonyms following the definition of “water consumption” as a loss of water from a given system through either evaporation/evapotranspiration or the incorporation of water into harvested biomass [4].
Water for irrigation is abstracted from the rivers, with the desiccation of the Aral Sea being the most prominent result of this water consumption [3]. Climate change is expected to lead to water shortages for irrigation during the second half of this century, as well as more frequent heat waves [2,5].
Currently, flood and furrow irrigation are the most prevalent irrigation methods across Central Asia, in particular in the post-Soviet countries. Against the background of increasingly expected water scarcity, water consumption in agriculture needs to be reduced through improved irrigation methods and/or through proper crop selection and agroforestry. Drip irrigation or plastic mulch can substantially reduce water consumption, as shown in Xinjiang, China [6,7].
Under conditions of lacking capital and water infrastructure suitable for drip or sprinkler irrigation, agroforestry systems, in particular tree wind breaks, are an option to reduce water consumption in irrigated agriculture. Such tree wind breaks were promoted during Soviet Union times and had a long tradition before [8], but they were largely cut down, as people urgently needed fuel wood to compensate for the collapse of regular energy supplies after the collapse of Soviet Union [9]. Now, most countries of Central Asia have stated the importance of agroforestry and/or tree wind breaks as part of their forestry and agriculture related strategies, as reported in [9] and further literature there.
Tree wind breaks reduce the water consumption (evapotranspiration) of crops, as found under many conditions in the former Soviet Union [8,10,11,12] and beyond [13,14]. Crop water consumption is reduced, mainly because those wind breaks substantially reduce wind speed [14]. A minor effect of reducing crop water consumption is that the air temperature is lower and air humidity is higher inside a tree wind break system [13,14]. Wind speed on the leeward side of tree wind breaks can be reduced to almost zero within a distance of five-times the shelterbelt tree height. At distances of 15–20 times the tree wind break height, wind speed has been found to be about half of open field wind speed. At distances of 25–30 times tree height, wind speed has been found to reach 70% of open field wind speed [11]. This source [11] described a reduction of wind speed by 36% for a whole tree wind break systems with all its different distances from the wind breaks compared to open field wind speed. In [14] though, in a distance of 25 times tree height, wind speed was only reduced to 90% compared to open field conditions. Air temperature decreased by 1 °C through the impact of tree wind breaks in [15]. Crop water consumption was reduced by 15–30% through the impact of tree wind breaks [11,16], while [10] found a reduction of crop water consumption by 15–20%. Evapotranspiration was substantially decreased as far as 300 m leeward of tree wind breaks with a tree height of 8–10 m [17]. On the upwind side, evapotranspiration was reduced by 35–45% compared to open field conditions less than 50 m away from tree wind breaks [17].
Next to reducing water consumption in agriculture, in a number of tree wind break and crop combinations, crop yields are increased compared to open field conditions, as listed by [18] for the Soviet Union and other locations under temperate climates, as seen by [19] for northern China and as seen by [20] for African countries. In particular for Central Asia, [17] measured wheat yields and potato yields increased by 20–30% and 37% compared to open field conditions, respectively, in a tree wind break system in the Kazakh steppe.
Literature findings have been based on the tree wind breaks of multiple rows of trees, often combined with shrubs as understory vegetation, i.e., the type which was propagated during Soviet Union times. Such a type was studied in [21] as well. Today, small stretches of this wind break type still remain, but if people plant new tree wind breaks, they opt for single rows largely from poplars (Populus spec. L.) without any understory vegetation. Therefore, this paper includes these single row tree wind breaks and thus partly builds on [21]. The literature cited above have mainly focused on the effects of tree wind breaks on crops but do not address the trees as water consumers or sources of income.
Against this background, this paper aims to assess the water consumption of major crops in Kyrgyzstan and adjacent areas in combination with major types of tree wind breaks. The crops taken into account were corn (Zea mays L.), wheat (Triticum aestivum L.), potato (Solanum tuberosum L.), and barley (Hordeum vulgare L.) for the Chui Valley (northern Kyrgyzstan and southeastern Kazakhstan) and cotton (Gossypium hirsutum L.), rice (Oryza sativa L.), and corn (Zea mays L.) for the Ferghana Valley (Jalalabad Region in Kyrgyzstan). Crop water consumption was assessed through climate data and the calculation of the Penman Monteith approach [22]. The wind break types investigated were single rows from poplars and multiple rows with understory vegetation by elm (Ulmus minor L.) and poplar (Populus spec. L.), respectively. The water consumption of trees in the wind breaks was determined through sapflow measurements following the procedure of [23]. The impact of wind breaks on climate data and subsequently crop water consumption was measured with field climate stations and calculated for different potential tree wind break systems with a model developed in GRASS GIS, an open source GIS and remote sensing software.
2. Materials and Methods
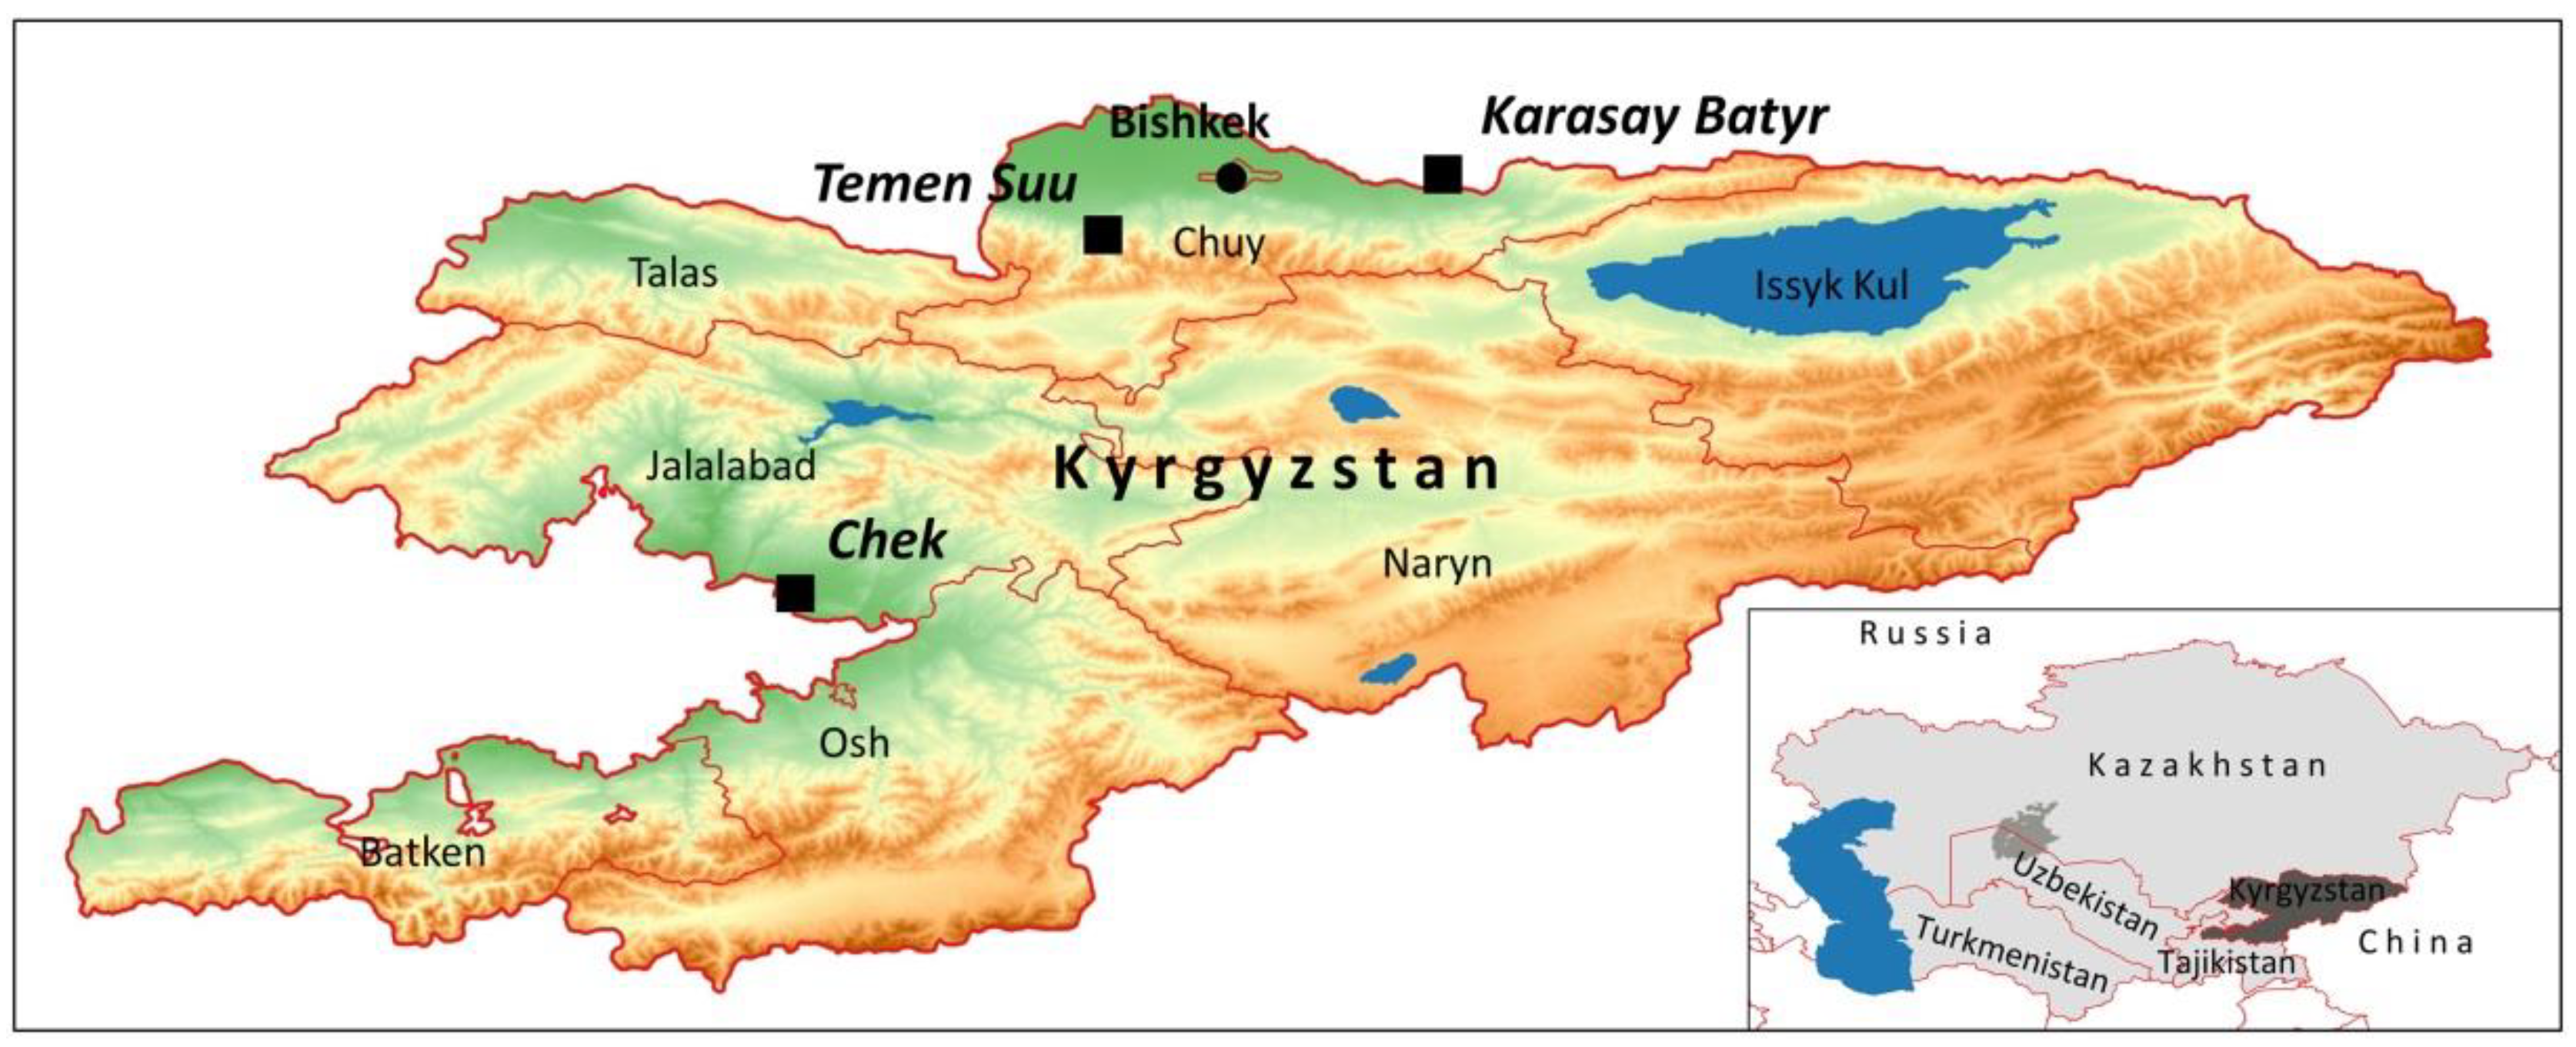
This study was carried out for two tree wind break types, which were (i) single row wind breaks and (ii) multiple row wind breaks with shrub understory vegetation. The former consists of poplars, while the latter is planted by poplars or elm. The single row type was studied at the two sites of Chek and Karasay Batyr (Figure 1). The multiple row type was investigated at the sites of Karasay Batyr and Temen Suu (Figure 1). Single row tree wind breaks from poplars are distributed throughout Kyrgyzstan and adjacent areas, and they are is the most common type for newly planted tree wind breaks. The multiple row type was only found in Northern Kyrgyzstan and adjacent areas in south eastern Kazakhstan.
Chek village is located on the border between Kyrgyzstan and Uzbekistan on an elevation of 639 m and represents the intensive irrigated agriculture of the provinces Jalalabad, Osh, and Batken as well as adjacent areas of Uzbekistan (Figure 1). The major crops of this area are cotton, corn, and rice. Karasay Batyr, at an elevation of 1095 m, is on the northern bank of Chui River, i.e., located in Kazakhstan, and represents the conditions of the upper Chui Valley. Temen Suu is located on an elevation of 941 m in the plain north of the Tianshan Mountains. The forehills of the Tianshan are 3 km south of the site Temen Suu. The major crops in Karasay Batyr and Temen Suu are wheat, corn, barley, potato, and Lucerne.
In all sites, soils receive water from snow melt and rain fall in winter and spring (Table 1). However, from late spring through summer the climate is hot and dry, more pronounced in Chek than in the two other sites (Table 1), so that crops need to be irrigated. Irrigation is done through furrows. Soils across all study sites have a texture of silt to clayey silt, as revealed by soil profiles which were manually drilled to a depth of 100 cm.
In this study, field data on micro climate were collected to assess the impact of single row (in Chek Village) and multiple row tree wind breaks (in Temen Suu Village). At each of the two locations, a climate station was placed as a control out of the fetch of wind breaks. Four climate stations were operated within the fetch of the given tree wind break at different distances from the tree wind break in order to capture data for leeward and upwind conditions. The climate stations were placed along lines perpendicular to the tree wind break. Thereby, the climate stations had to be relocated every two-to-three weeks, and their distances to the tree wind breaks had to be changed, in order not to disturb farm operations. In total, the climate stations were used during the whole growing seasons. All climate stations were equipped with sensors for air temperature (VP-4, air humidity (VP-4), wind speed (DS-2), wind direction (DS-2), and solar radiation from Meter and recorded these data every minute with an EM50 logger from Meter. Sensors were mounted 2 m above soil surface.
The climate data of the four stations in the fetch of the tree wind break were used to fit relationships with the distance to the wind break as independent variable and deviations of the climate data from the control as dependent variable. Thereby, the distance to the wind break (D) was expressed as multiples of tree wind break height (H). These relationships allowed us to calculate profiles of the microclimate, in particular wind speed, across a crop field depending on the direction of a given tree wind break and the distances between wind breaks.
The climate data of the control climate stations (solar radiation, air temperature, air humidity, and wind speed) were aggregated to daily values, in order to calculate the reference evapotranspiration (ETo) and crop evapotranspiration (ETc) for the crops investigated without any tree wind break impact, following the procedures of [22] and [24]:
with
- ETo—Reference evapotranspiration [mm/d]
- Rn—Net radiation [MJ/m² d]
- G—soil heat flux [MJ/m² d]
- T—Air temperature at 2 m height [°C]
- u2—Wind speed at 2 m height [m/s]
- es—Saturation vapor pressure [kPa]
- ea—Actual vapor pressure [kPa]
- Δ—Slope vapor pressure curve [kPa/°C]
- γ—Psychrometric constant [kPa/°C].
Variables beyond the climate data were calculated according to the set of formulae given in [20].
ETo refers to a short grass vegetation of 100% vegetation coverage and 12 cm height, which is not water stressed. The crop evapotranspiration (ETc) is calculated as:
with
ETc = ETo × Kc
- ETc—crop evapotranspiration [mm/d]
- ETo—Reference evapotranspiration [mm/d]
- Kc—crop coefficient.
Crop coefficients (Kc) were obtained from [21] for wheat, corn, potato, and barley in Chui Valley and through field observations for cotton, rice, and corn in Chek.
In a second step, a local GIS model was developed for each site and tree wind break type in order to calculate the ETc impacted by tree wind breaks and tree water consumption together. In this model, daily climate data layers were used, and these were adjusted according to the micro climate profiles mentioned above. This GIS model was implemented in GRASS GIS (https://grass.osgeo.org/).
In this model, square shaped tree wind break systems of different square sizes—50 × 50 m, 100 × 100 m, 200 × 200 m, 400 × 400 m, 500 × 500 m, 750 × 750 m, and 1000 × 1000 m—were laid over a representative field structure of each study site. The relationships fitted for changes of climate data in dependence of distance to the wind break were used in this GIS model to calculate an altered daily air temperature, air humidity, wind speed, solar radiation, and, finally, the ETo and ETc for each pixel of this GIS model. The ground resolution of this GIS model was 1 × 1 m. The input data of daily climate data came from the control climate stations in Chek (2017), Temen Suu (2018), and Karasay Batyr [21].
The water consumption of the tree wind breaks was also included on this model. Tree water consumption was measured through the sapflow method put forth by [23] and as used in [24,25,26,27] for sites covered by this study. The tree water consumption for poplars in a single row wind break was measured in Chek in 2017 [25]. The tree water consumption for poplar and elm trees in a multiple row wind break was measured in 2016 by [25] and [27] in Karasay Batyr and Sokuluk, respectively, both located in Chui Valley.
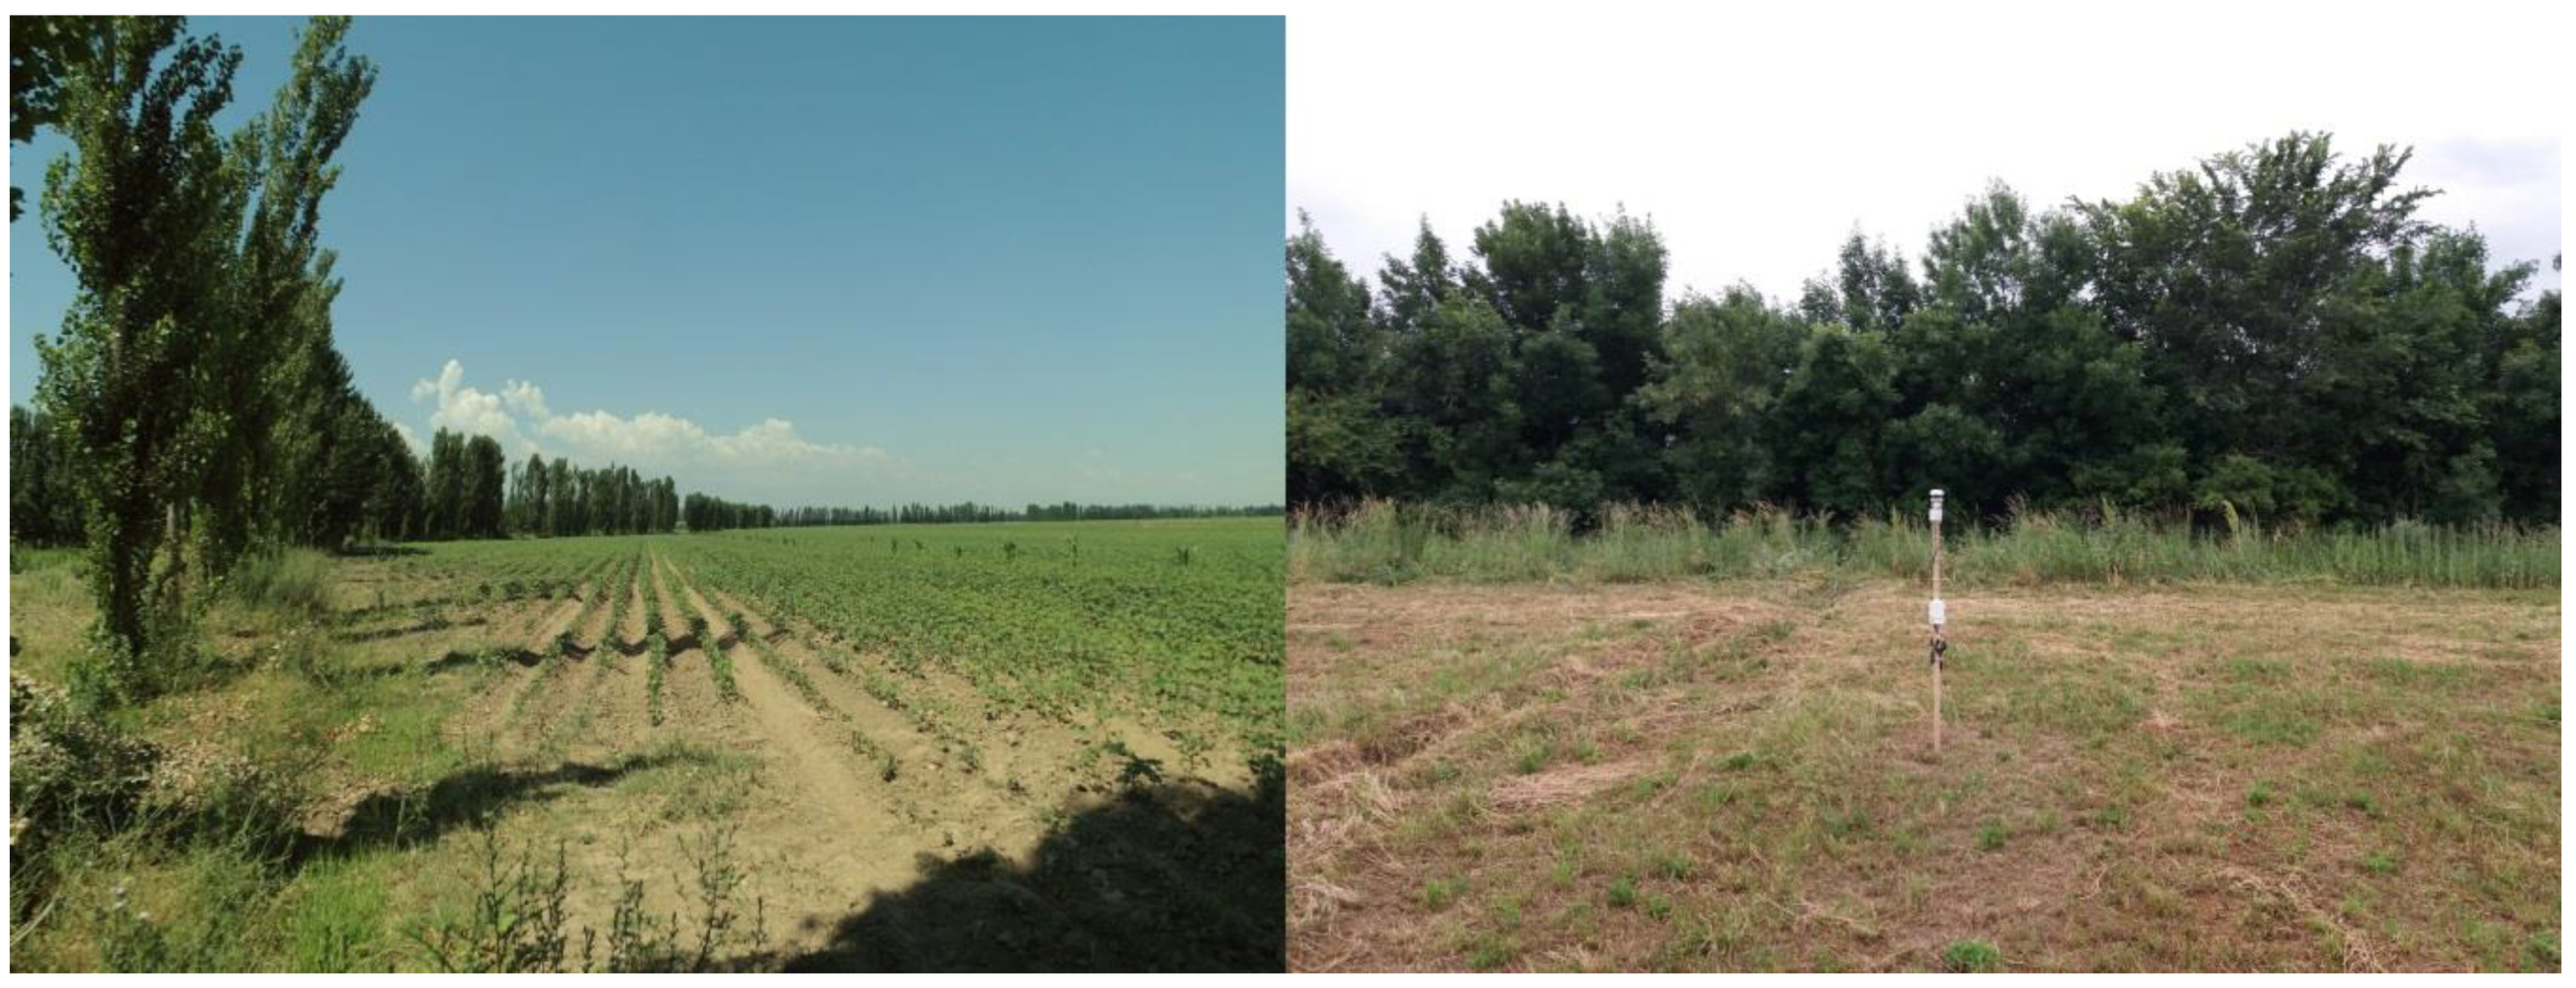
In Chek, a representative tree wind break of a single row of poplars was chosen to measure its tree water consumption and impact on the climate data of adjacent fields in 2017 [26]. The tree wind break was oriented in north–south direction and therefore shelters against prevailing easterly winds. Populus nigra var. pyramidalis (local variety name: Bistrohod or California), had an average height of 14 m. This wind break type was 6 m wide (crown area). This width was used to convert the sapflow measurement results into water consumption given in mm. In the GIS model, it was assumed that the field crops cover the space outside the crown area of the tree wind break. The distance between trees was 1 m, and the crowns covered a width of 6 m. Cotton and small fields with rice were grown adjacent to the tree wind break (Figure 2). This type of tree wind break was also assumed for Karasay Batyr.
In Temen Suu, the impact of a multi row tree wind break with understory vegetation on the climate data of adjacent fields was measured in 2018. The tree wind break was composed of elm (Ulmus minor) and Acacia spec., with berry shrubs as understory vegetation (Figure 2). The tree wind break ran in the 81°–261° direction in order to shelter against the prevailing south winds, which come down from the nearby Tianshan Mountains (Figure 1). The average tree height of the shelterbelt was 10 m. Its crown area was 15 m wide. As for the single row tree wind break, this width was used to convert the sapflow measurement results into water consumption expressed in mm. In the GIS model, it was also assumed that the field crops covered the space next to the crown area of the tree wind break but not underneath the crown area of the trees.
3. Results
The reference evapotranspiration (ETo) was 945, 939, and 876 mm in Chek (in 2017), Karasay Batyr (in 2016), and Temen Suu (in 2018), respectively. The monthly averages of the ETo and relevant climate data, as measured during this study, are listed in Table 2.
The development stages from which the crop coefficients (Kc) were derived are given underneath in Table 3.
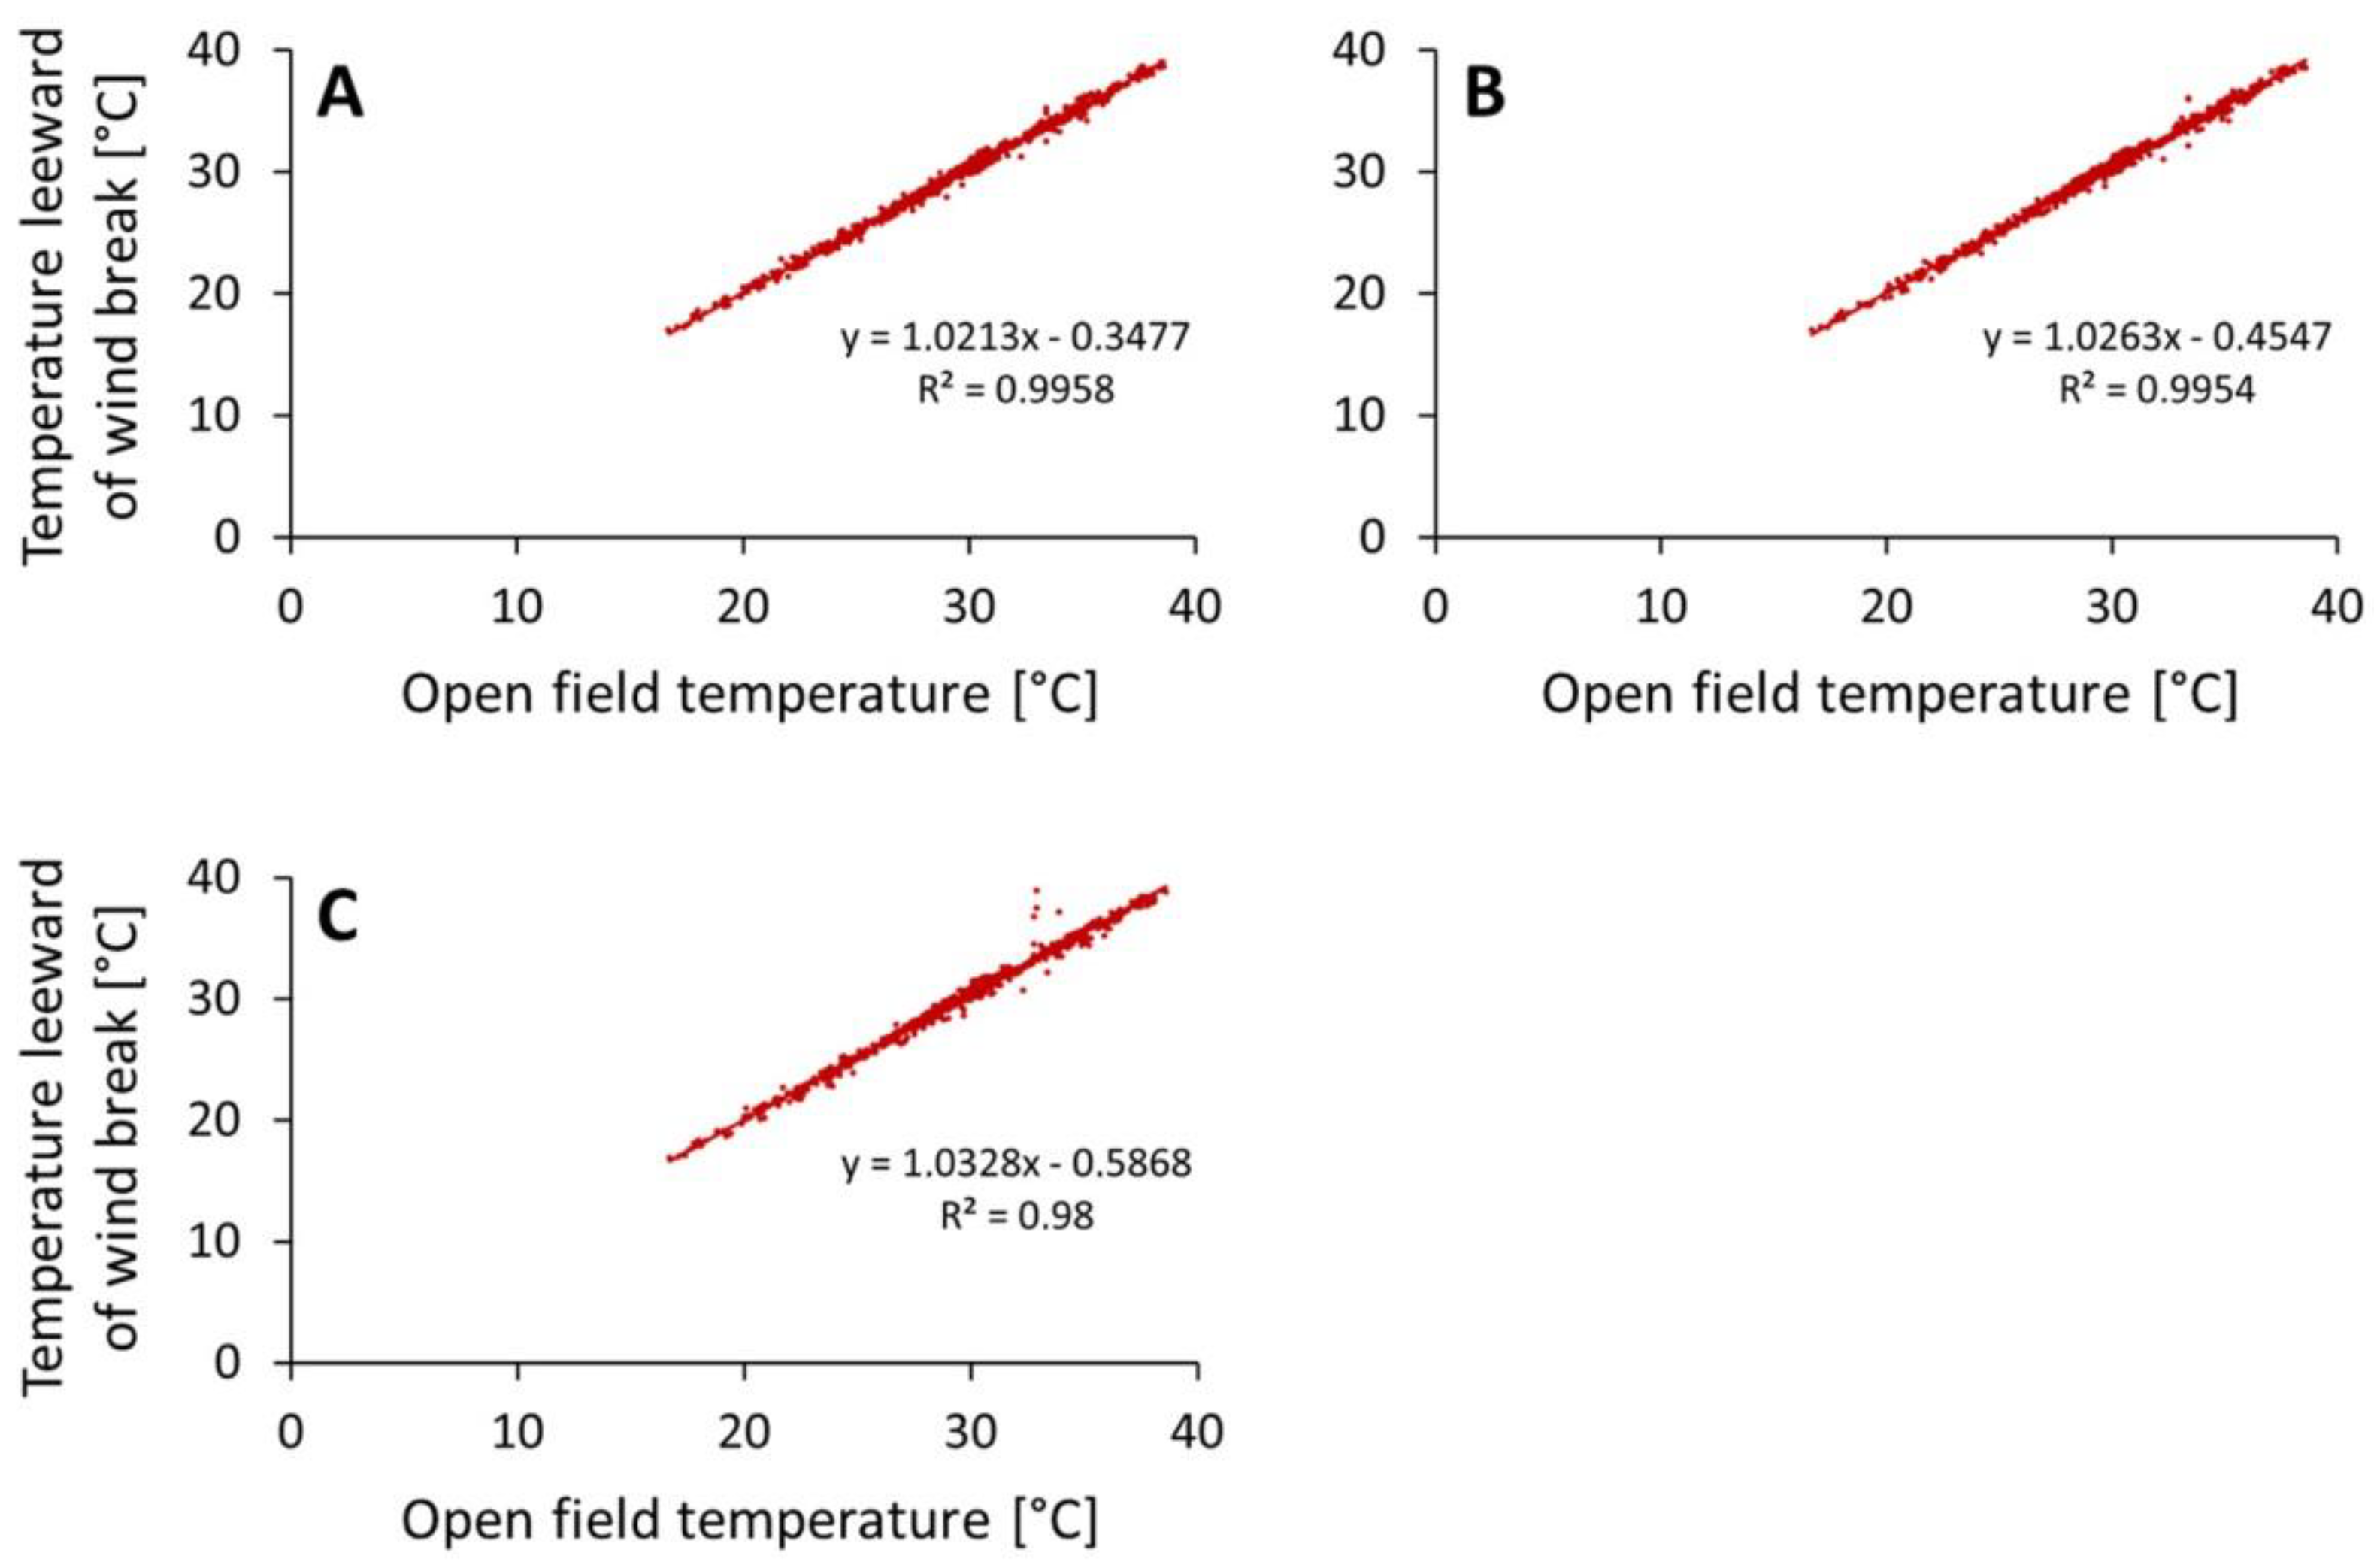
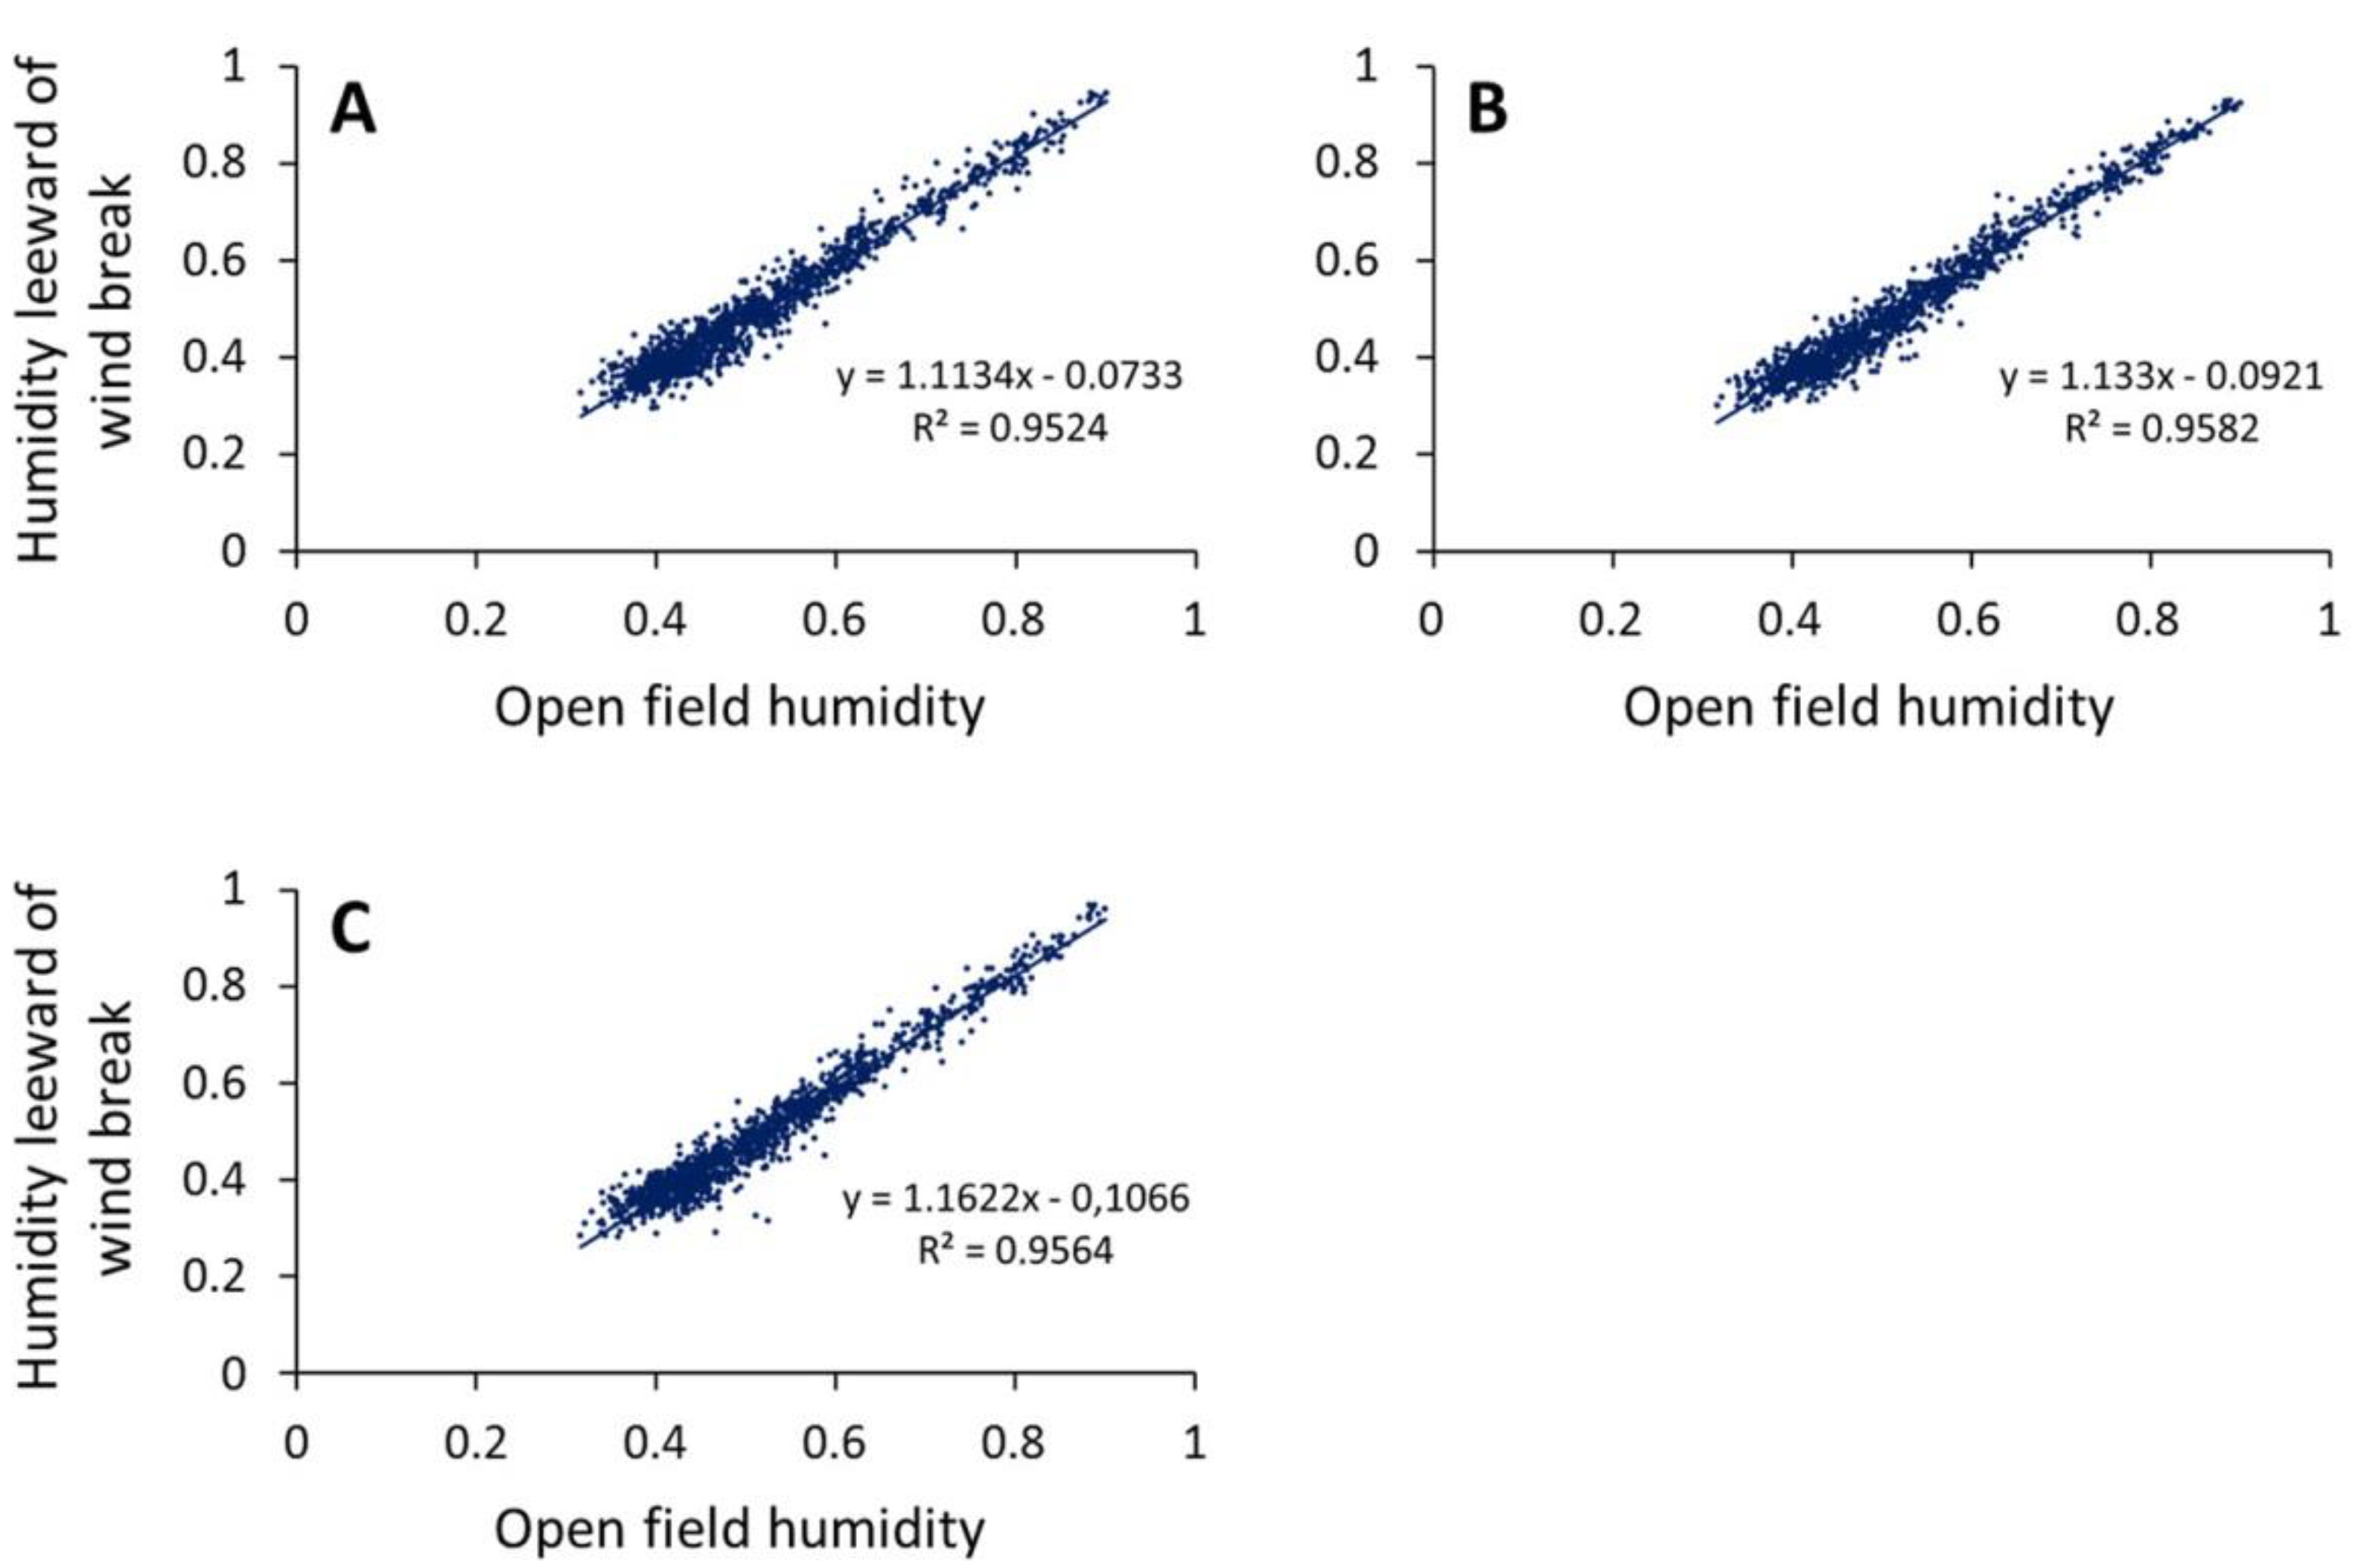
Tree wind breaks did not impact the temperature, air humidity, and radiation of the crop fields, except for in close vicinity of the wind break (i.e., 2 * H and closer), but they showed substantial effects on wind speed leeward of the wind breaks up to a distance of 40–50 * H. The air temperature, air humidity, radiation, and wind speed of the control versus microclimate stations are shown in Figure 3, Figure 4, Figure 5 and Figure 6, respectively, for the single row tree wind break in Chek for the period 4–19 July 2017 as an example. In this time period, the climate stations had been placed in distances from the tree wind break of between 13.7 and 30 * H. No consistent effect was measured upwind.
Micro climate in close vicinity to the tree wind break (2 * H and closer) was only measured in April and May at the single row tree wind break, because, afterwards, the farmer used that space to drive along his field plot. In Figure 7, wind speed adjacent to the single row tree wind break is shown.
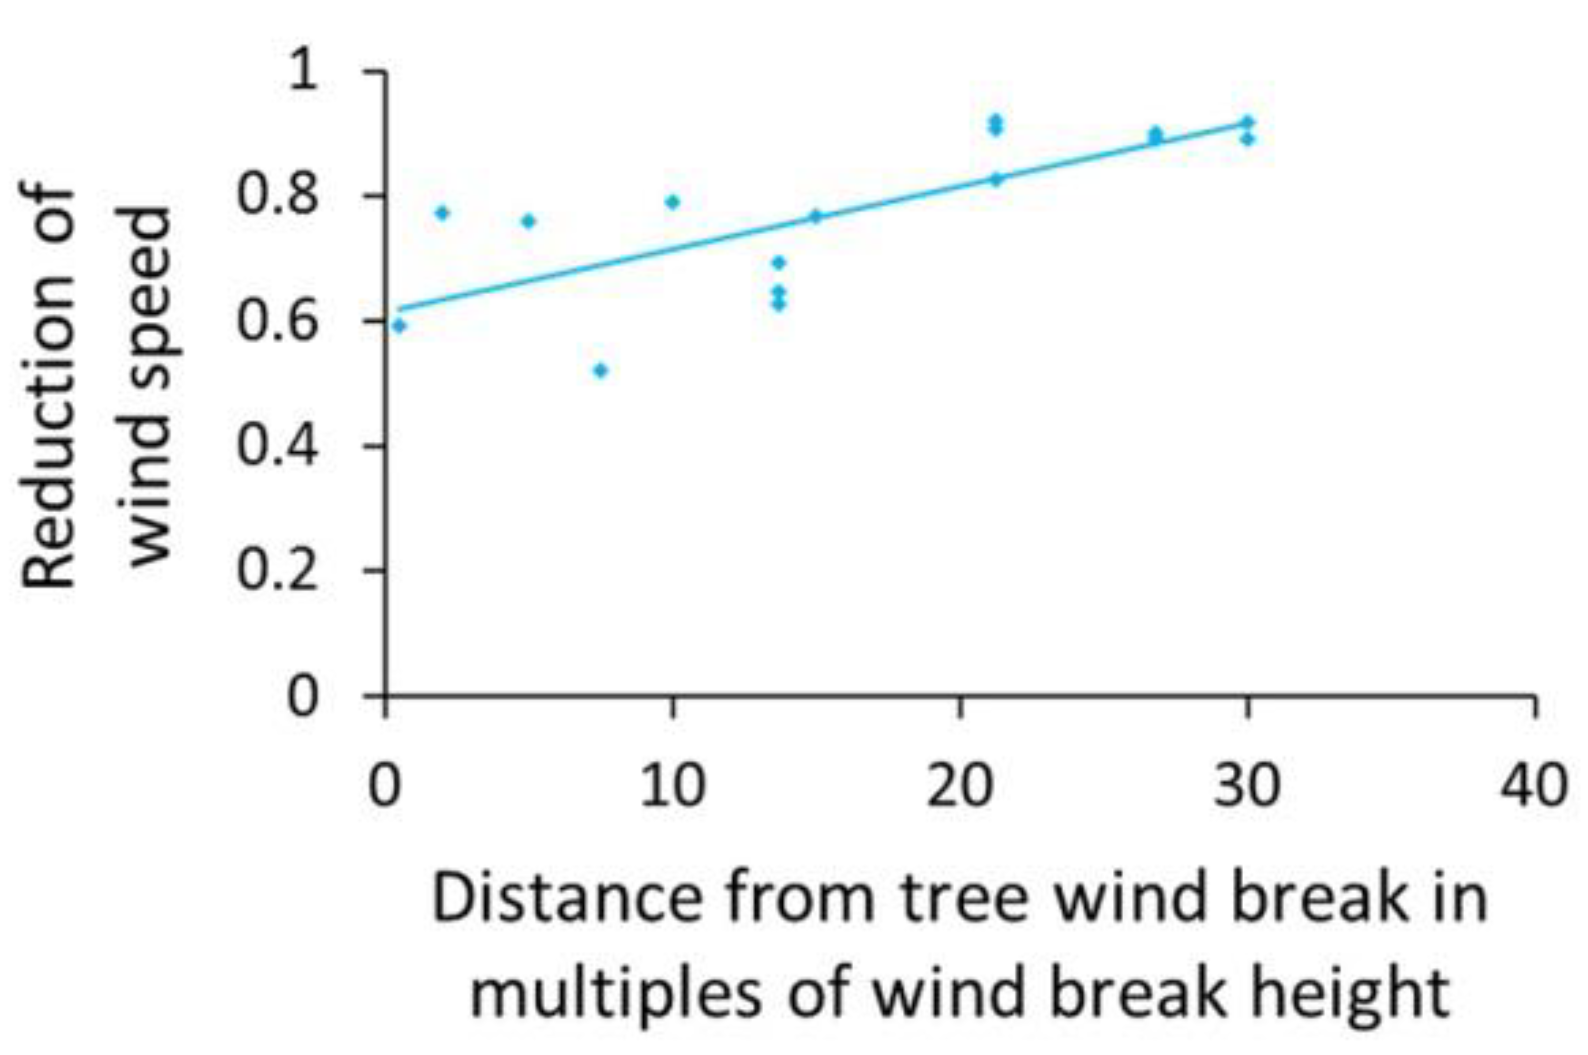
Finally, for the single row tree wind breaks the following relationship was fitted (Figure 8):
Wind speed reduction = 0.0101 × D + 0.614 (R² = 0.58),
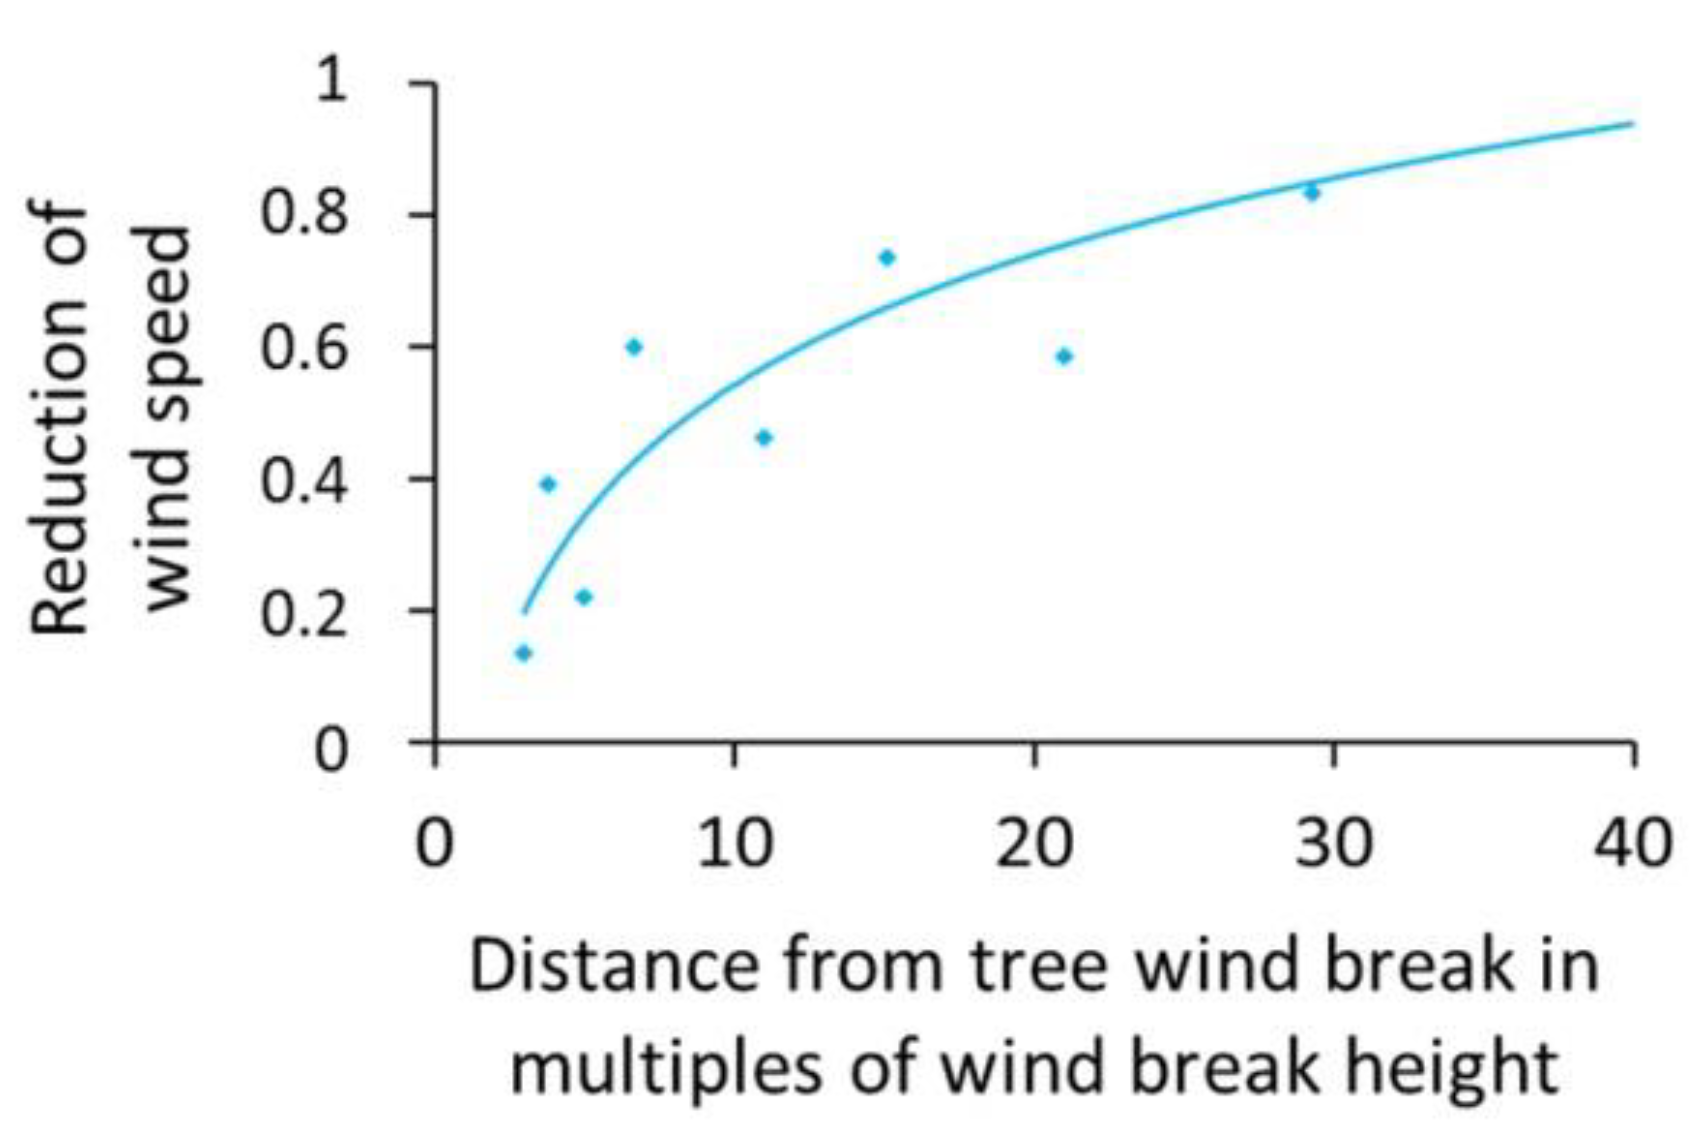
For the multiple row tree wind breaks with understory vegetation this relationship was fitted (Figure 9):
Wind speed reduction = 0.2859 × ln(D + 1) − 0.1159 (R² = 0.86),
D refers to the distance from the tree wind break expressed in multiples of the average tree height of the tree wind break. The relationship for the single row tree wind break applies for D < 38, i.e., when further away from the tree wind break than 38× the tree height, the wind speed is the same as under open field conditions. The relationship for the multiple row tree wind break was found to apply for D > 0.5 and D < 48.5.
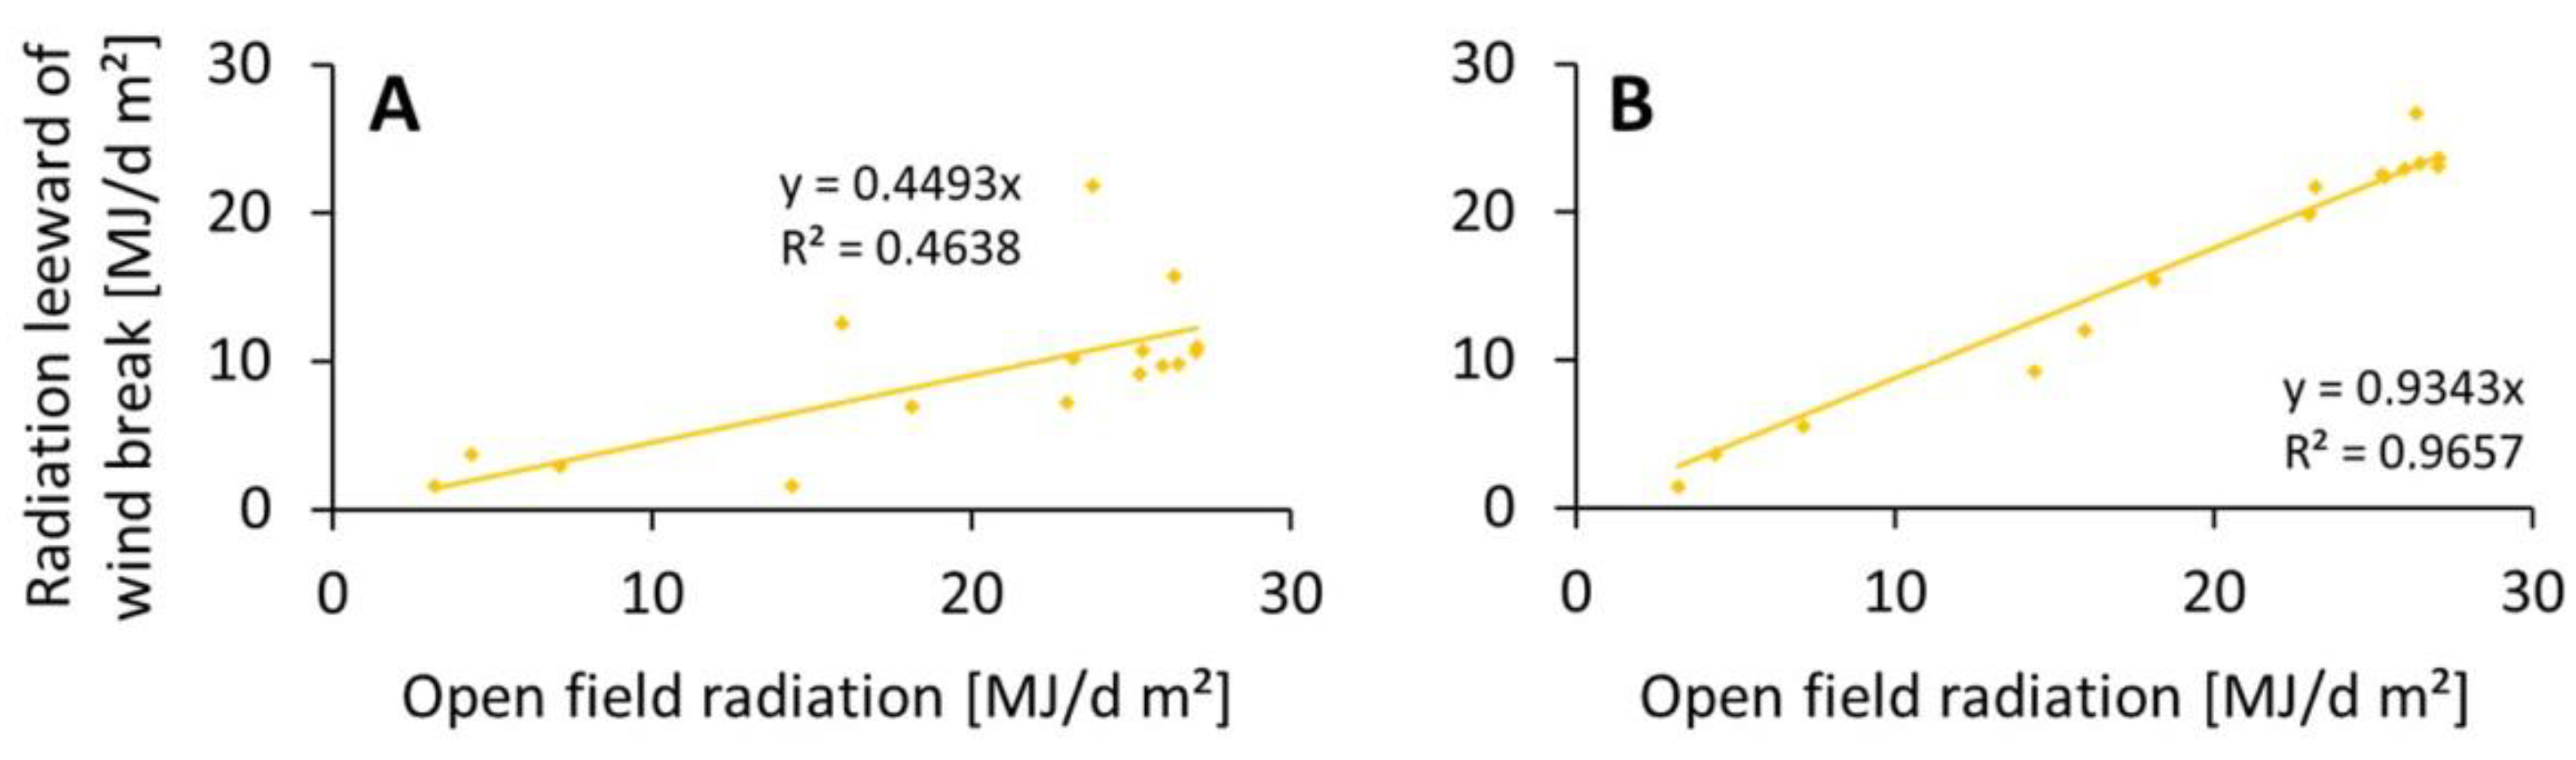
Temperature, air humidity, and radiation were only impacted in the close vicinity of the tree wind breaks, whereby the impact on radiation was much more substantial than on temperature and air humidity. Therefore, in Figure 10, only data for the radiation adjacent to the tree wind break are shown. The relationships used are given in Table 4. In the cases of temperature and air humidity, there was only a slight impact closer than 1.5 times the tree wind break height. Further away from the tree wind break, the data of the control climate stations were used also to calculate the ETo and ETc within the given tree wind break systems. In Temen Suu, there was a drive way for farm machinery adjacent to the tree wind break so that no climate station was placed adjacent to that tree wind break. Instead, the changes of microclimate for temperature, humidity, and radiation adjacent to the multiple row tree wind break were obtained from the single row tree wind break.
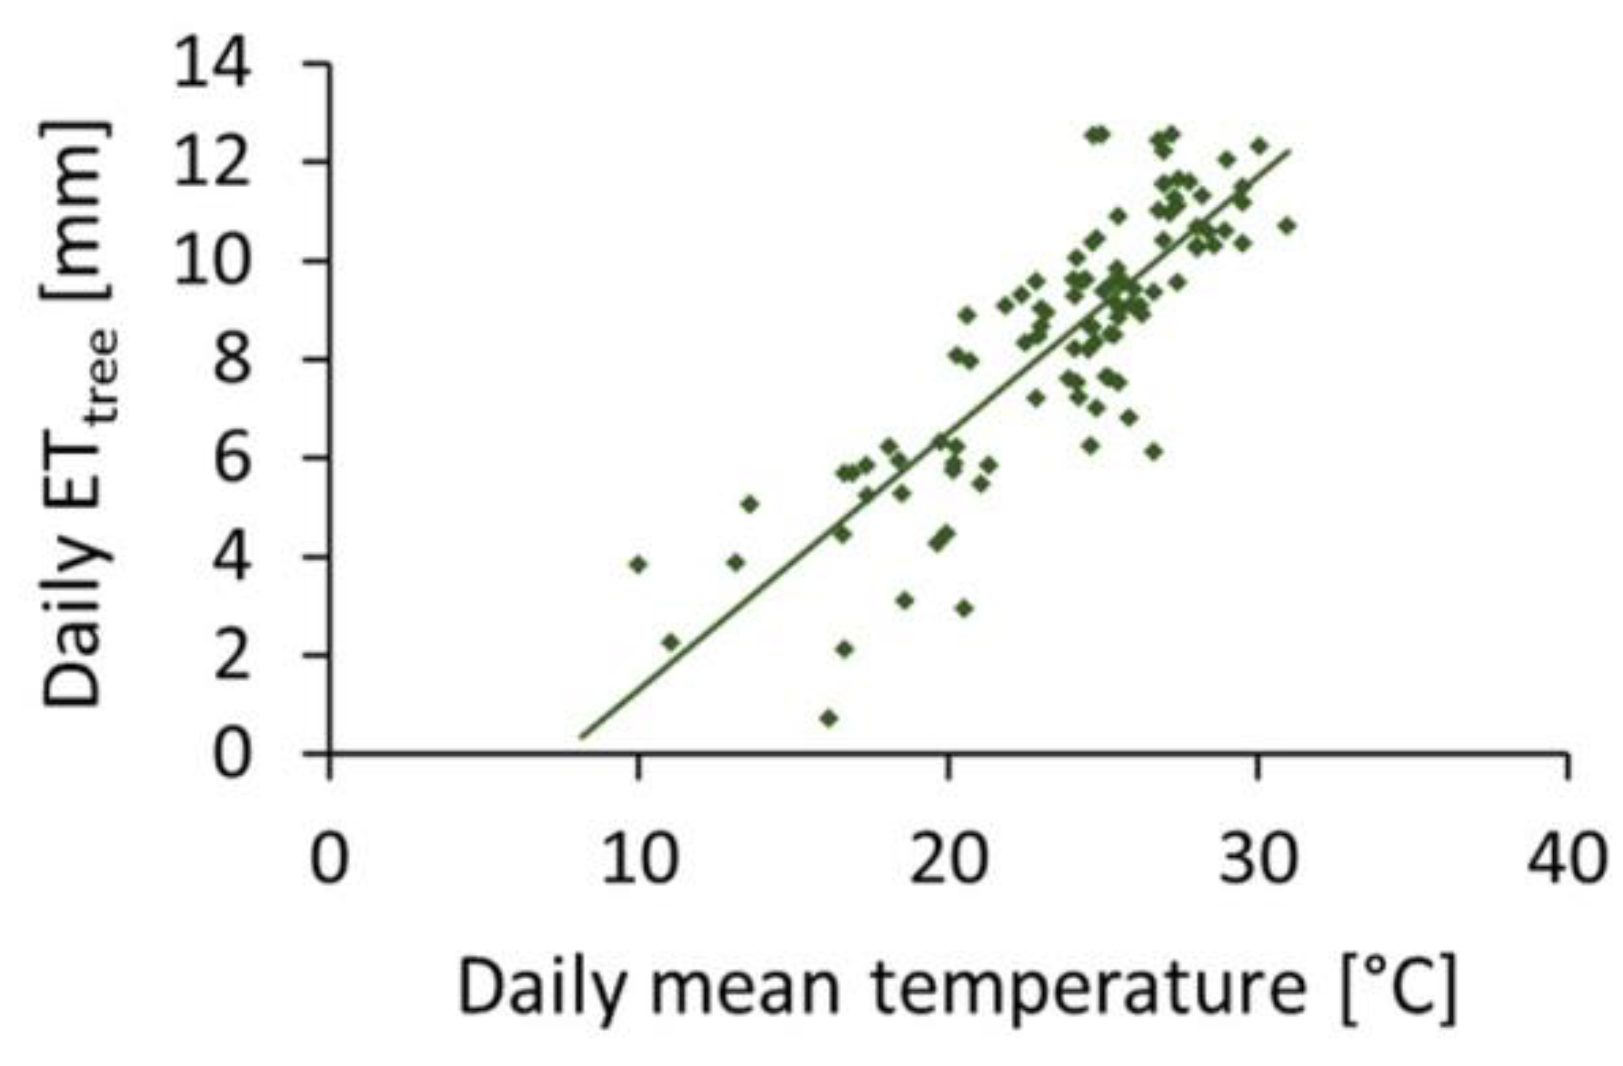
Data on tree water consumption, measured through the sapflow method, were taken from [26] for poplars from single row wind breaks, from [25] for elm, and [21,27] for poplars in the multiple row wind break. With regard to water consumption of the tree wind breaks (ETtrees), it was found that poplars from the single row wind breaks had the closest relationship with the daily average temperature (Tmean):
ETpoplars single row = 0.5198 × Tmean − 3.8827, R² = 0.7,
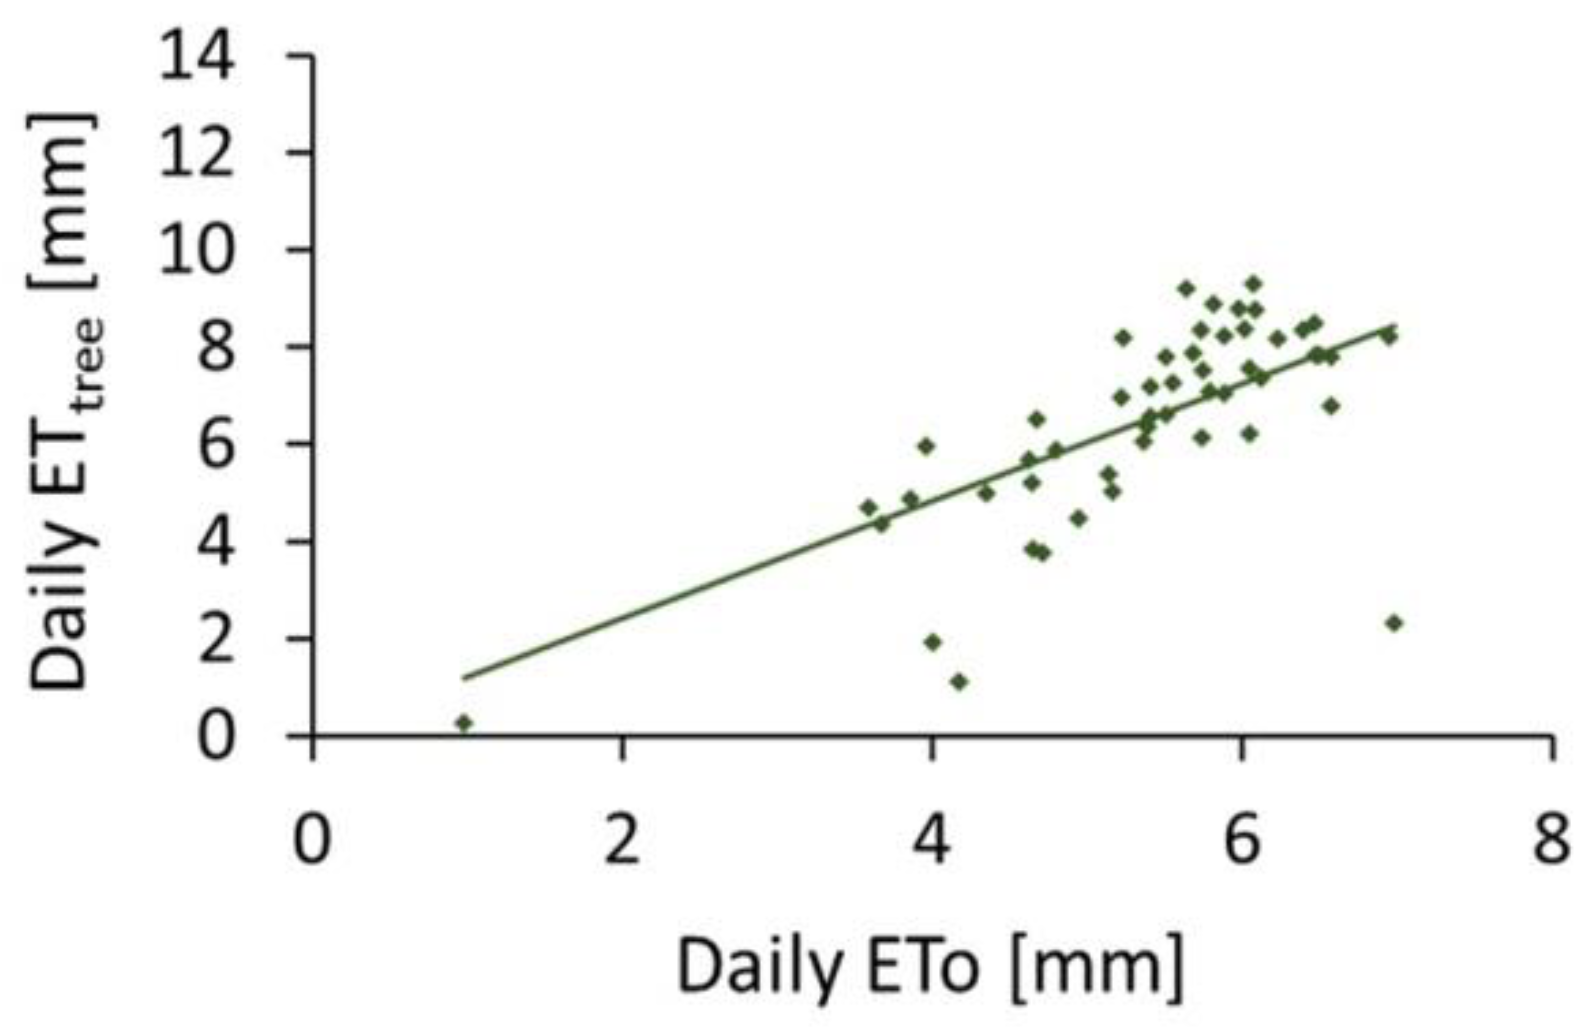
In contrast, the water consumption of trees in the multiple poplar row wind breaks was most closely related to the ETo, as:
ETtrees poplar multiple row = 1.2075 × ETo, R² = 0.49,
The water consumption of elm was calculated as follows, whereby 0.22 was the average Kc value calculated from the ETo and the tree evapotranspiration as measured through the sapflow method:
ETelm = 0.22 × ETo,
This was done because the climate station attached to the sapflow measurement only provided data during short periods of the growing seasons so that it was more appropriate to use this average Kc value instead of correlations with climate features.
The evapotranspiration of the shrub understory vegetation was calculated as follows for elm and poplar multiple row wind breaks:
with Coverageshrubs = 0.8, Kcshrubs = 1.05
ETshrubs = Coverageshrubs × Kcshrubs × EToshrubs,
For the calculation of the EToshrubs, Rs wind break as for close vicinity to tree wind breaks was used, and wind speed was set to 0.01 m/s. These assumptions were inherited from a microclimate measurement inside a multiple row shelterbelt by [25].
The ETo on the crop fields between the tree wind breaks was substantially reduced by the effect of tree wind breaks. Thus, under a 50 × 50 m tree wind break system with single row poplars, the ETo was reduced by 36%. A 1000 × 1000 m tree wind break system with single row poplars still yielded a reduction of 5% (Table 5). The effect of the multiple row tree wind break was more pronounced than the effect of the single row wind breaks, as a 50 × 50 m tree wind break system with multiple elm and poplar rows reduced ETo by 47% and 55%, respectively. This is in line with the much stronger wind speed reduction by multiple row wind breaks in particular close to the wind breaks (Figure 8 and Figure 9). The 1000 × 1000 m tree wind break system with multiple elm rows also yielded an ETo reduction of 5% like the single row wind break (Table 5).
The tree wind break water consumption of single row poplars in Chek and Karasay Batyr and multiple row elm and poplar wind breaks was 1558, 1125, 435 and 1300 mm, respectively.
The crop evapotranspiration (ETc) in the Ferghana Valley, Chek, was highest for cotton (904 mm) followed by corn with 838 mm and rice with 812 mm. On the sites in the Chui Valley, Karasay Batyr and Temen Suu, corn had the highest ETc, followed by wheat, potato, and barley (Table 6). Therefore, the ETc values of the of corn in Karasay Batyr and Temen Suu, 1035 and 900 mm, respectively, were higher than the ETc of corn in the Ferghana Valley (only 838 mm).
All crop tree wind break systems consumed less water than the corresponding crops without a wind break, except for most of the crops combined with a 50 × 50 m grid of multiple row poplar tree wind breaks. In total, the most pronounced reduction in water consumption was attained by the 50 × 50 m grid with multiple row elm tree wind breaks, e.g., the water consumption of corn was reduced from 900 (ETc) to 455 mm when combined with such a 50 × 50 m grid of multiple row elm tree wind breaks, which is a reduction by 49% (Table 6). The water consumption of these multiple row elm wind break crop systems increased with the grid size becoming larger.
The second highest reduction in water consumption was found under the impact of single row tree wind breaks from poplars (Table 6). In Karasay Batyr, the water consumption of corn without any tree wind break was reduced from 1035 (ETc) to 754 mm, i.e., a reduction of 27%, with a wind break grid of 100 × 100 m, including the water consumption of the trees. In the case of cotton in Chek, Ferghana Valley, the water consumption of cotton was reduced from 904 (ETc) to 761 mm, i.e., 16%, also with a wind break grid of 100 × 100 m, including the water consumption of the trees (Table 6). Among those tree wind breaks, grid sizes of 100 × 100 m resulted in the highest reductions of water consumption, except for barley in Karasay Batyr. The water consumption of these wind break systems increased with increasing grid size, whereby the water consumption of a 500 × 500 m wind break system already surpassed the corresponding water consumptions of a 50 × 50 m wind break system (Table 6).
Multiple row wind breaks from poplars achieved the lowest reduction of water consumption. A system of corn in combination with poplars in a 100 × 100 m grid of a multiple row poplar wind break consumed 736 mm, a reduction by 10% compared to corn without any tree wind break (900 mm at Temen Suu; Table 6). With regard to different reductions of water consumption under different grid sizes, the systems of corn with these multiple row poplar wind breaks behaved similar to corn combined with single row tree wind breaks. The most pronounced reduction of water consumption was found with a 100 × 100 m grid, and water consumption increased with increasing grid size, as shown in Table 6.
The combination of barley, potato, and wheat with a 50 × 50 m grid of multiple row poplar wind breaks consumed more water than the corresponding crops without tree wind breaks. Only with larger grid sizes did the water consumption of these tree wind break systems dropped below the water consumption of crops without tree wind breaks—200 × 200 m for barley and 100 × 100 m for potato and wheat. In contrast to the former two tree wind break types, multiple row poplar wind break systems showed their lowest water consumption at grid sizes of 400 × 400 m with barley and potato and 200 × 200 m with wheat, respectively. Beyond these grid sizes, water consumption increased similar to the other tree wind break systems (Table 6).
4. Discussion
The ETc values in this study were in the range of [28], who measured water consumption of corn with values between 741 and 841 mm in Texas with a lysimeter under sprinkler irrigation. The wheat ETc calculated from climate data from Almaty [29] was the same as the wheat ETc under the open field conditions of this study. Annual corn water consumption in the Heihe Basin in northwest China was 668 mm [30]. This value is lower than the ETc of corn under all assumptions in this study, because corn in the Heihe Basin was grown under plastic mulch, which considerably reduced evaporation from the soil surface during the initial crop development stage. The cotton ETc in this study, 904 mm (Table 6), was slightly higher than the 807 mm as measured with a lysimeter near Tashkent [31]. In this study, the daily average water consumption of the single row poplar tree wind break in the Ferghana Valley was 7.3 mm or 45 L per tree on average [26], which is in the range of the result by [32] for Populus fremontii in Arizona but lower than the findings of [33], who measured 16.6–137.9 L per day and tree for a fast growing columnar hybrid of Populus nigra. The water consumption of poplars, in particular the single row wind break, was higher in this study than, e.g., [34], who found 1.7–5.6 mm for Populus gansuensis in northwest China and [35] who measured 3–24 L per day for Populus alba var pyramidalis in northwest China as well. This difference can possibly be explained by the very small crown area of the poplar trees, as well as through the single row wind break arrangement and an upwind fetch of more than 1 km, which exposes the trees more to the dry ambient air compared to a plantation or denser wind break system.
In contrast to [21], most tree wind break systems in this study consumed less water than crops without tree wind breaks. This difference can be explained, as in [21], firstly the assumptions regarding wind speed that its reduction by tree wind breaks was more conservative than the wind speed reductions found in this study, and, secondly, multiple row poplar tree wind breaks were investigated with poplars significantly older and of higher DBH than the poplars considered in this study.
The reduction of the ETo under shelterbelts in this study was between 5% and 55% and between 18% and 27% for 200 × 200 m grids of single row and multiple row tree wind breaks, respectively. These values are in the range of the reduction of crop water consumption as suggested by the literature from Soviet Union times [9,10,16] but higher that of [13].
The most pronounced reductions of the ETo just of the crops (not considering trees) were found with the multiple row wind breaks at small grid sizes, e.g., 50 × 50 and 100 × 100 m. This can be explained by the wind speed reduction by these multiple row wind breaks, which was much more significant in close distances to the wind break compared to the single row wind breaks (Figure 8 and Figure 9). In the large grid sizes, 500 × 500 m and more, the effect to reduce water consumption was similar between the single row and the multiple row wind breaks. However, the high water consumption of poplars over-compensated the reduction of crop water consumption through the multiple row wind breaks. In particular, the 50 × 50 m grid of the poplar multiple row wind break consumed so much water that the overall water consumption of barley, potato, or wheat combined with such a multiple row poplar wind break system was higher than water consumption of the crops without a wind break (Table 6). The multiple row poplar wind breaks attained an overall reduction of water consumption at grid sizes of 400 × 400 m and larger, with the strongest reduction at grid sizes of 400 × 400 and 500 × 500 m (785 and 799 mm, respectively, compared to the ETc of corn of 900 mm, as shown in Table 6). This coincides with the grid sizes that were most widely used during Soviet Union times [8,9,10,16].
The water consumption of elm trees is much lower than that of poplars, which explains the low water consumption of elm tree wind break systems. In particular, with small grid sizes (up to 200 × 200 m) the substantial reduction wind speed in combination with low water consumption of elm trees resulted in an overall low water consumption of these systems.
The single row poplar wind break resulted in a higher reduction of the overall water consumption, compared to the multiple row poplar tree wind breaks. Though their effect on wind speed reduction in smaller grids was less pronounced compared to multiple tree rows, a significantly smaller number of trees were needed to establish a single row wind break system, which reduces the water consumption by the tree wind break. At larger grid sizes, the water consumption of single row and multiple row tree wind break systems became similar because the trees occupied a small part of the agricultural landscape so that the different tree water consumptions did not contribute much to the overall water consumption of the given tree wind break system.
5. Conclusions
In this study, the effect of tree wind breaks on water consumption in irrigated agriculture for Kyrgyzstan and adjacent areas was studied. Here, single row wind breaks from poplars and multiple row wind breaks from elm and poplar were studied, as these are the only remaining tree wind break types in the study region. Overall, the effect of reducing the total water consumption in irrigated agriculture was found to be the largest through the use of multiple row elm wind breaks, followed by single row poplar wind breaks, and smallest by multiple row poplar wind breaks. However, elm grows much slower than poplar, so from an economic perspective, poplars might be more attractive for farmers. Furthermore, single row wind breaks might be much easier to integrate into an agrarian landscape, as they consume less space.
Author Contributions
Conceptualization, methodology, writing—original draft preparation, review and editing, N.T.; investigation, data curation, and formal analysis, A.J.G. and E.S.; investigation, R.L.; visualization and writing—review and editing, K.A. and B.E.
Funding
This study was undertaken with support from the Federal Ministry of Economic Cooperation and Development of Germany (BMZ), through the Advisory Service on Agricultural Research for Development (BEAF) under Deutsche Gesellschaft für Internationale Zusammenarbeit (GIZ), Germany. BMZ funded a research grant of 100,000 EUR and a six-month internship for Eva Strenge, in order to collect sap flow data. Niels Thevs’ position as an integrated expert at the World Agroforestry Center as well as the sapflow equipment and the climate stations were co-funded by BMZ as part of the Center for International Migration and Development (CIM) program.
Acknowledgments
We thank the land owners and village administrations in the study sites for their support and permission to work on their land. Furthermore, we thank the reviewers for their valuable comments.
Conflicts of Interest
The authors declare no conflict of interest.
References
- CACILM and ADB (Central Asian Countries Initiative for Land Management and Asian Development Bank). Central Asia Atlas of Natural Resources. CACILM and ADB: Manila, Philippines, 2010. Available online: http://www.adb.org/sites/default/files/publication/27508/central-asia-atlas.pdf (accessed on 10 February 2019).
- Reyer, C.P.O.; Otto, I.M.; Adams, S.; Albrecht, T.; Baarsch, F.; Cartsburg, M.; Eden, A.; Ludi, E.; Marcus, R.; Mengel, M.; et al. Climate change impacts in Central Asia and their implications for development. Reg. Environ. Chang. 2017, 17, 1639–1650. [Google Scholar] [CrossRef]
- Karthe, D. Environmental changes in central and east Asian drylands and their effects on large central and east Asian lakes and their effects on major river-lake systems. Quat. Int. 2018, 475, 91–100. [Google Scholar] [CrossRef]
- Hoekstra, A.Y.; Chapagain, A.K.; Aldaya, M.M.; Mekonnen, M.M. The Water Footprint Assessment Manual: Setting the Global Standard; Earthscan: London, UK, 2011. [Google Scholar]
- Unger-Shayesteh, K.; Vorogushyn, S.; Farinotti, D.; Gafurov, A.; Duethmann, D.; Mandychev, A.; Merz, B. What do we know about past changes in the water cycle of Central Asian headwaters? A review. Glob. Planet. Chang. 2013, 110, 4–25. [Google Scholar] [CrossRef]
- Feike, T.; Mamitimin, Y.; Li, L.; Abdusalih, N.; Doluschitz, R. Development of agricultural land and water use and its driving forces in the Aksu-Tarim Basin, P.R. China. Environ. Earth Sci. 2015, 73, 517–531. [Google Scholar] [CrossRef]
- Rumbaur, C.; Thevs, N.; Disse, M.; Ahlheim, M.; Brieden, A.; Cyffka, B.; Duettmann, D.; Feike, T.; Frör, O.; Gärtner, P.; et al. Sustainable management of river oases along the Tarim River (SuMaRiO) in Northwest China under conditions of climate change. Earth Syst. Dyn. 2015, 6, 83–107. [Google Scholar] [CrossRef] [Green Version]
- Schroeder, W.R.; Kort, J. Shelterbelts in the Soviet Union. J. Soil Water Conserv. 1989, 44, 130–134. [Google Scholar]
- UNECE/FAO. Forest Landscape Restoration in the Caucasus and Central Asia; Geneva Timber and Forest Discussion Paper, 72. ECE/TIM/DP/72; Forestry and Timber Section: Geneva, Switzerland, 2019; Available online: http://www.unece.org/fileadmin/DAM/timber/publications/DP-72-flr-cca-en.pdf (accessed on 18 June 2019).
- Albenskii, A.V.; Kalashnikov, A.F.; Ozolin, G.P.; Nikitin, P.L.; Surmach, G.P.; Kulik, N.F.; Senkevich, A.A.; Kasyanov, F.M.; Pavlovskii, E.S.; Roslyakov, N.V. Agroforestry Melioration; Lesnaya promyshlennost: Moscow, Russia, 1972. [Google Scholar]
- Vasilyev, M.E. Melioration through Forests and Harvest; Kainar: Almaty, Kazakhstan, 1980. [Google Scholar]
- Puri, S.; Bangarwa, K.S. Effects of trees on the yield of irrigated wheat crop in semi-arid regions. Agrofor. Syst. 1992, 20, 229–241. [Google Scholar] [CrossRef]
- Perry, C.H.; Woodall, C.W.; Liknes, G.C.; Schoeneberger, M.M. Filling the gap: Improving estimates of working tree resources in agricultural landscapes. Agrofor. Syst. 2009, 75, 91–101. [Google Scholar] [CrossRef]
- Alemu, M.M. Ecological benefits of trees as windbreaks and shelterbelts. Int. J. Ecosyst. 2016, 6, 10–13. [Google Scholar] [CrossRef]
- Dokuchaev Scientific Research Institute of Agriculture. Agroforestry Melioration of Vegetable Cultures and Potato; Voronesh Publishing House: Voronesh, Russia, 1961. [Google Scholar]
- Stepanov, A.M. Agroforestry Melioration in Irrigated Lands; Agropromizdat: Moscow, Russia, 1987. [Google Scholar]
- Susa, N.I. Agroforestry Melioration; Governmental Publishing House for Agriculture: Moscow, Russia, 1959. [Google Scholar]
- Kort, J. Benefits of windbreaks to field and forage crops. Agric. Ecosyst. Environ. 1988, 22–23, 165–190. [Google Scholar] [CrossRef]
- Zheng, X.; Zhu, J.; Xing, Z. Assessment of the effects of shelterbelts on crop yields at the regional scale in Northeast China. Agric. Syst. 2016, 143, 49–60. [Google Scholar] [CrossRef]
- Stigter, C.J.; Mohammed, A.E.; Nasr, A.; Nawal, K.; Onyewotu, L.O.Z.; Oteng’i, S.B.B.; Kainkwa, R.M.R. Agroforestry solutions to some African wind problems. J. Wind Eng. Ind. Aerodyn. 2002, 90, 1101–1114. [Google Scholar] [CrossRef]
- Thevs, N.; Strenge, E.; Aliev, K.; Eraaliev, M.; Lang, P.; Baibagysov, A.; Xu, J.C. Tree shelterbelts as an element to improve water resource management in Central Asia. Water 2017, 9, 842. [Google Scholar] [CrossRef]
- Allen, R.G.; Pereira, L.S.; Raes, D.; Smith, M. Crop Evapotranspiration—Guidelines for Computing Crop Water Requirements; FAO Irrigation and Drainage Paper 56; FAO: Rome, Italy, 1998. [Google Scholar]
- Granier, A. Une nouvelle méthode pour la mesure du flux de sève brute dans le tronc des arbres. Ann. Sci. For. EDP Sci. 1985, 42, 193–200. [Google Scholar] [CrossRef]
- Zotarelli, L.; Dukes, M.D.; Romero, C.C.; Migliaccio, K.W.; Morgan, K.T. Step by step calculation of the Penman-Monteith Evapotranspiration (FAO-56 Method). Inst. Food Agric. Sci. Univ. Fla. 2010. Available online: http://www.agraria.unirc.it/documentazione/materiale_didattico/1462_2016_412_24509.pdf. (accessed on 5 November 2019).
- Strenge, E. Sap Flow Characteristics of Populus Alba and Ulmus Minor in Shelterbelt Systems in Central Asia and Their Interaction with The Local—Microclimate. Master’s Thesis, University of Trier, Trier, Germany, 2017. [Google Scholar]
- Gombert, A.J. Estimating Water Consumption of Poplar Shelterbelt Based on Sap Flow. Bachelor’s Thesis, Rhine-Waal University of Applied Sciences, Faculty of Life Sciences, Kleve, Germany, 2018. [Google Scholar]
- Strenge, E.; Thevs, N.; Aliev, K.; Eraaliev, M.; Lang, P.; Baibagysov, A. Water consumption of Populus alba trees in tree shelterbelt systems in Central Asia. Cent. Asian J. Water Resour. 2018, 4, 48–62. [Google Scholar] [CrossRef]
- Howell, T.A.; Tolk, J.A.; Schneider, A.D.; Evett, S.R. Evapotranspiration, yield, and water use efficiency of corn hybrids differing in maturity. Agron. J. 1998, 90, 3–9. [Google Scholar] [CrossRef]
- Thevs, N.; Nurtazin, S.; Beckmann, V.; Salmurzauly, R.; Akimalieva, A. Water consumption of agriculture and natural ecosystems along the Ili River in China and Kazakhstan. Water 2017, 9, 207. [Google Scholar] [CrossRef]
- Hochmuth, H.; Thevs, N.; He, P. Water allocation and water consumption of irrigation agriculture and natural vegetation in the Heihe River watershed, NW China. Environ. Earth Sci. 2015, 73, 5269–5279. [Google Scholar] [CrossRef]
- Zheleznyh, V.; Risbekov, Y.U. Analysis of Experimental Investigations on Lizimeters Comparatively with Data on Cotton Field. 1987. Available online: http://www.cawater-info.net/bk/water_land_resources_use/english/iptrid/uz_34.pdf (accessed on 15 March 2019).
- Schaeffer, S.M.; Williams, D.G. Transpiration of Desert Riparian Forest Canopies Estimated from Sap Flux. 1998. Available online: http://www.tucson.ars.ag.gov/salsa/archive/publications/ams_preprints/schaeffer.PDF (accessed on 17 March 2019).
- Muller, E.; Lambs, L. Daily variations of water use with vapor pressure deficit in a plantation of I214 poplars. Water 2009, 1, 32–42. [Google Scholar] [CrossRef]
- Chang, X.; Zhao, W.; Zhang, Z.; Su, Y. Sap flow and tree conductance of shelter-belt in arid region of China. Agric. For. Meteorol. 2006, 138, 132–141. [Google Scholar] [CrossRef]
- Xu, X.; Tong, L.; Li, F.; Kang, S.; Qu, Y. Sap flow of irrigated Populus alba var. pyramidalis and its relationship with environmental factors and leaf area index in an arid region of Northwest China. J. For. Res. 2011, 16, 144–152. [Google Scholar] [CrossRef]
Figure 1.
Location of the three study sites of Chek and Temen Suu, both in Kyrgyzstan, and Karasay Batyr, in Kazakhstan.
Figure 1.
Location of the three study sites of Chek and Temen Suu, both in Kyrgyzstan, and Karasay Batyr, in Kazakhstan.

Figure 2.
Single row tree wind break from poplars at the study site Chek (left) and multiple row wind break with elm and shrub understory vegetation in Temen Suu (right).
Figure 2.
Single row tree wind break from poplars at the study site Chek (left) and multiple row wind break with elm and shrub understory vegetation in Temen Suu (right).

Figure 3.
Air temperature of open field conditions (Topen field) versus temperature (Twind break) leeward of the single row tree wind break at the following distances from the tree wind break: 13.7 * H (in subgraph A), 21.25 * H (in subgraph B), and 26.8 * H (in subgraph C). Distances are expressed in multiples of wind break tree height (H).

Figure 4.
Air humidity of open field conditions (RHopen field) versus air humidity (RHwind break) leeward of the single row tree wind break at the following distances from the tree wind break: 13.7 * H (in subgraph A), 21.25 * H (in subgraph B), and 26.8 * H (in subgraph C). Distances are expressed in multiples of the wind break tree height (H).

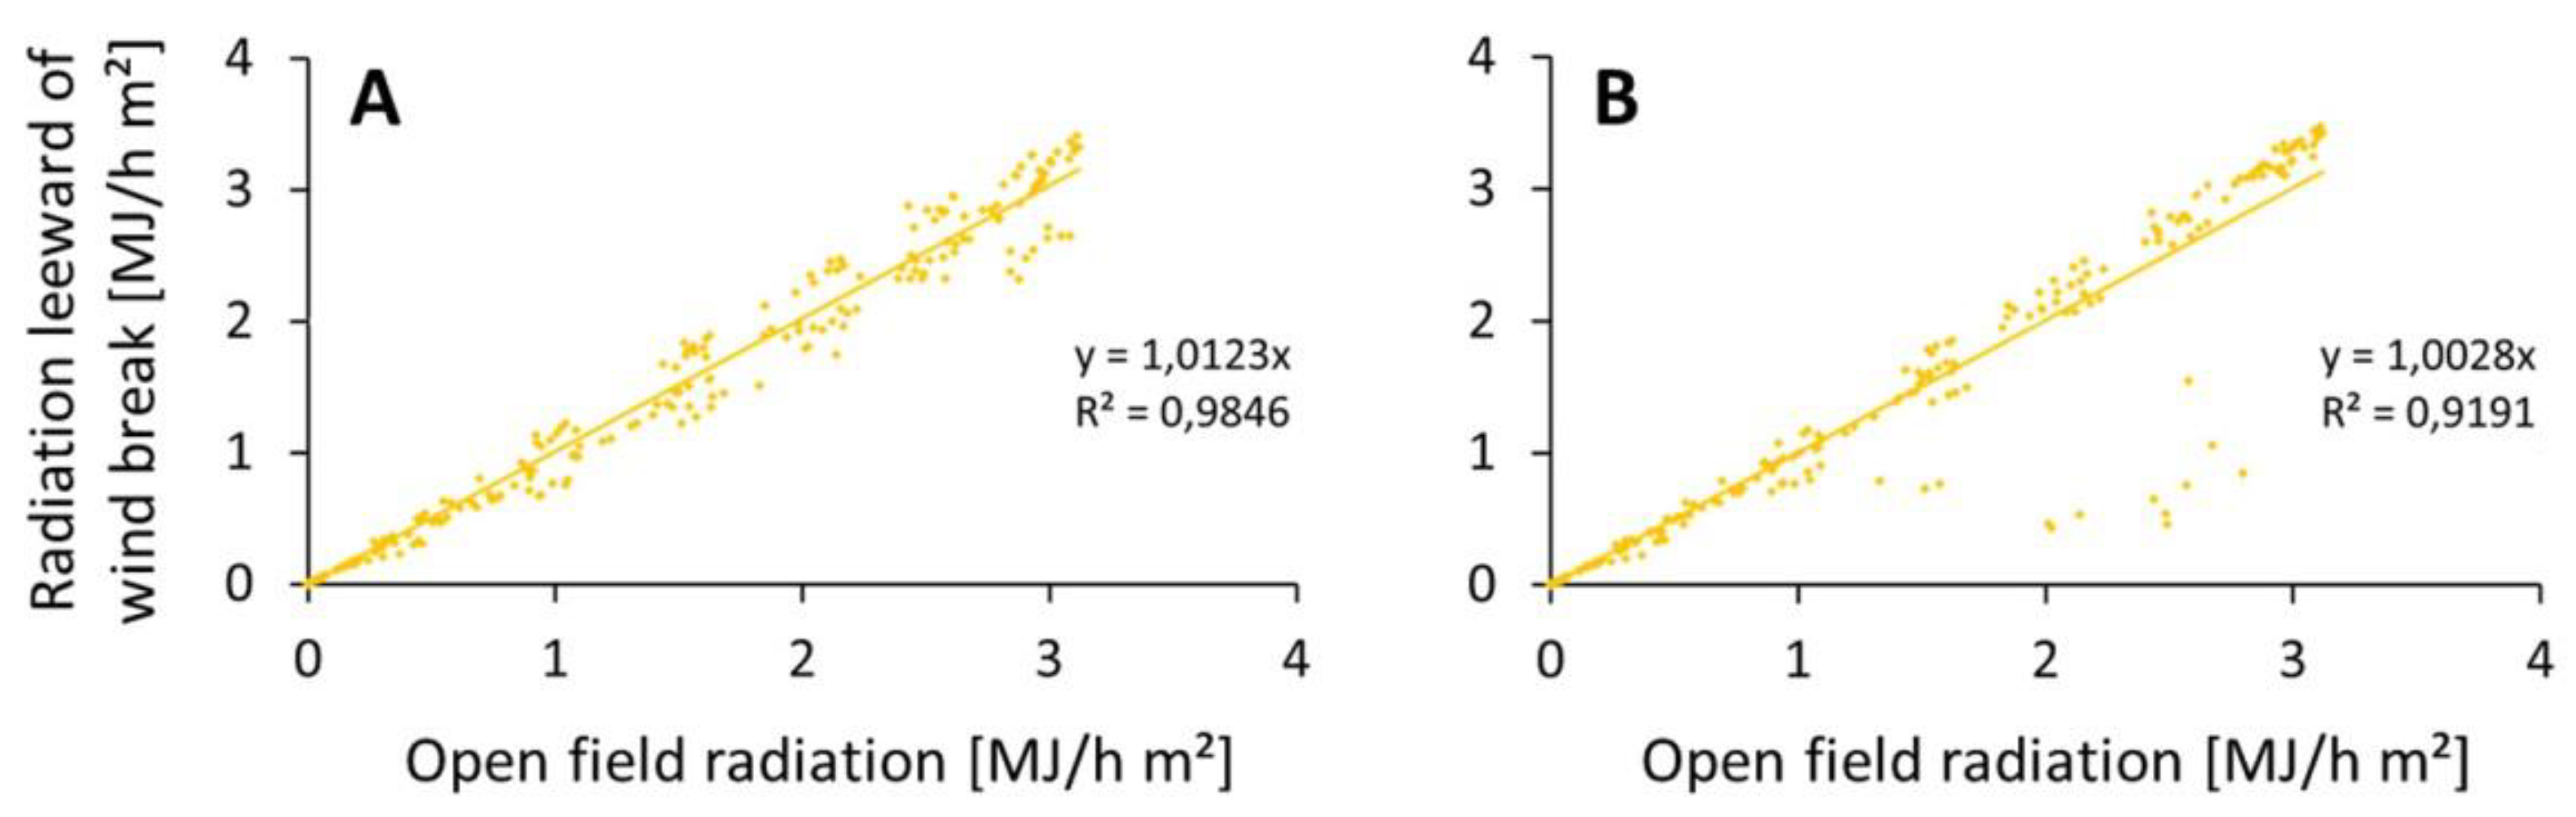
Figure 5.
Radiation of open field conditions (Rs open field) versus radiation (Rs wind break) leeward of the single row tree wind break at the following distances from the tree wind break: 21.25 * H (in subgraph A) and 26.8 * H (in subgraph B). Distances are expressed in multiples of the wind break tree height (H).

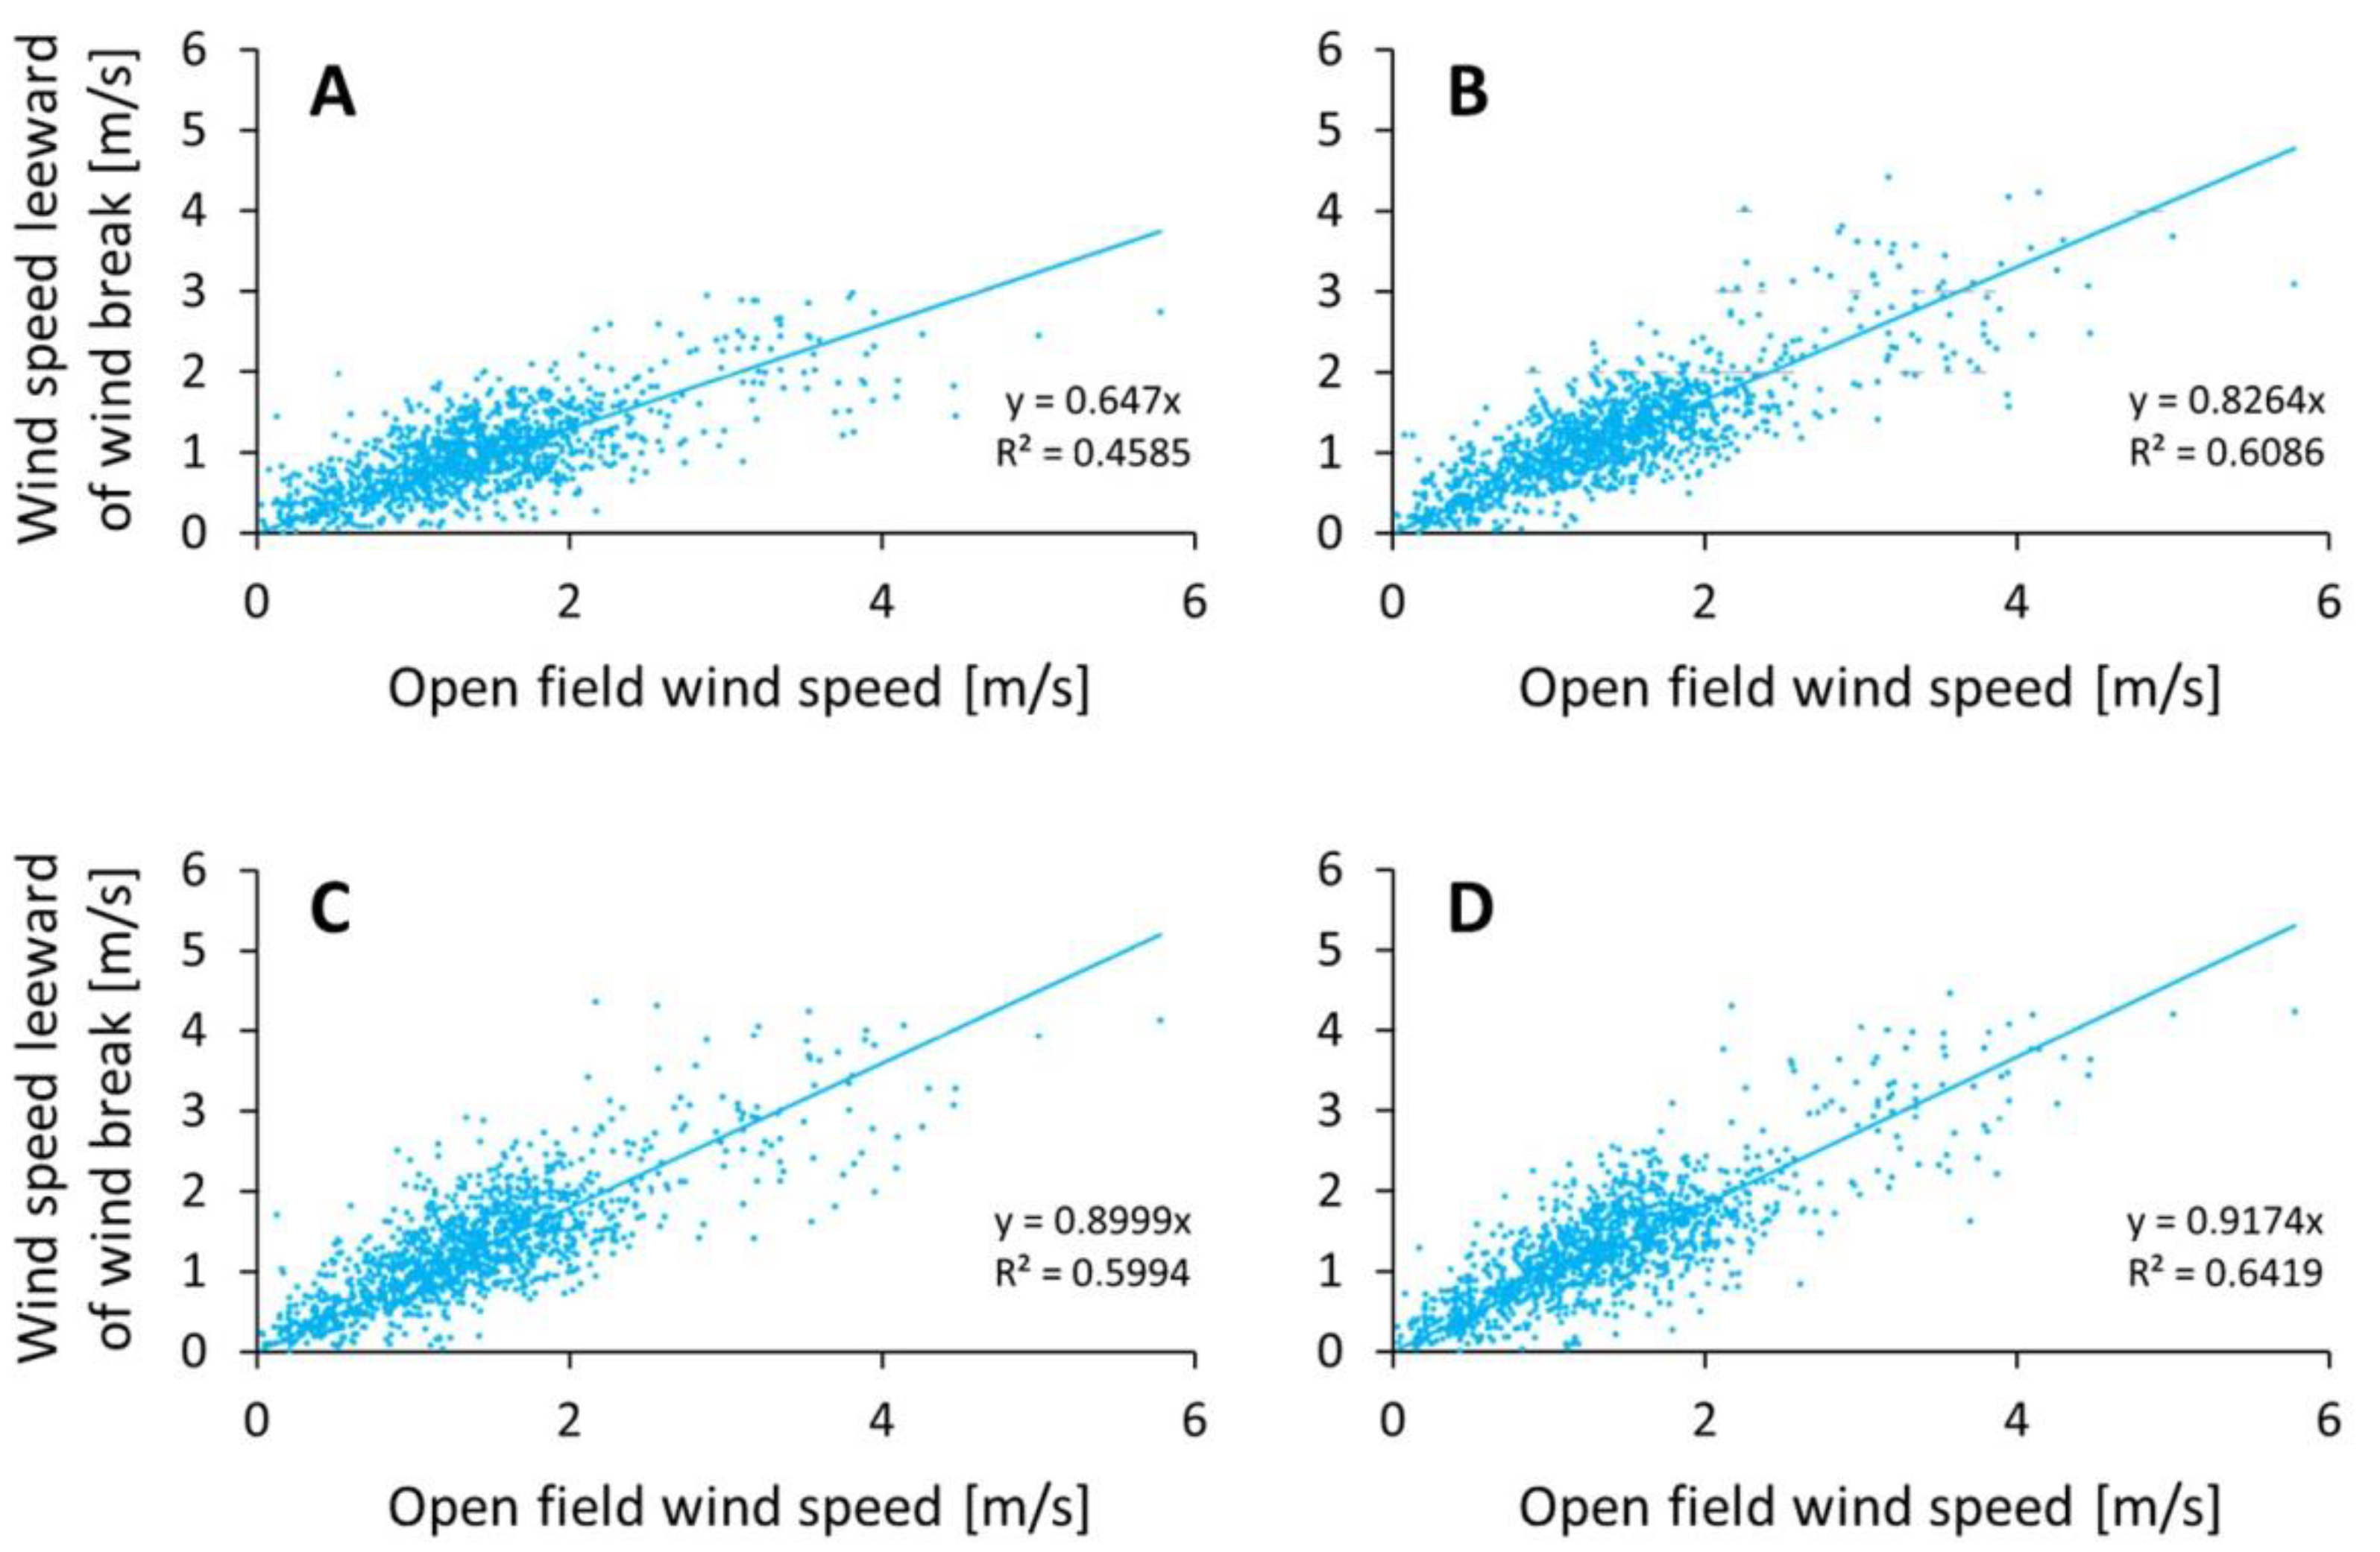
Figure 6.
Wind speed of open field conditions (Wind speed open field) versus wind speed (Wind speed wind break) leeward of the single row tree wind break at the following distances from the tree wind break: 13.7 * H (in subgraph A), 21.25 * H (in subgraph B) 26.8 * H (in subgraph C), and 30 * H (in subgraph D). Distances are expressed in multiples of the wind break tree height (H).

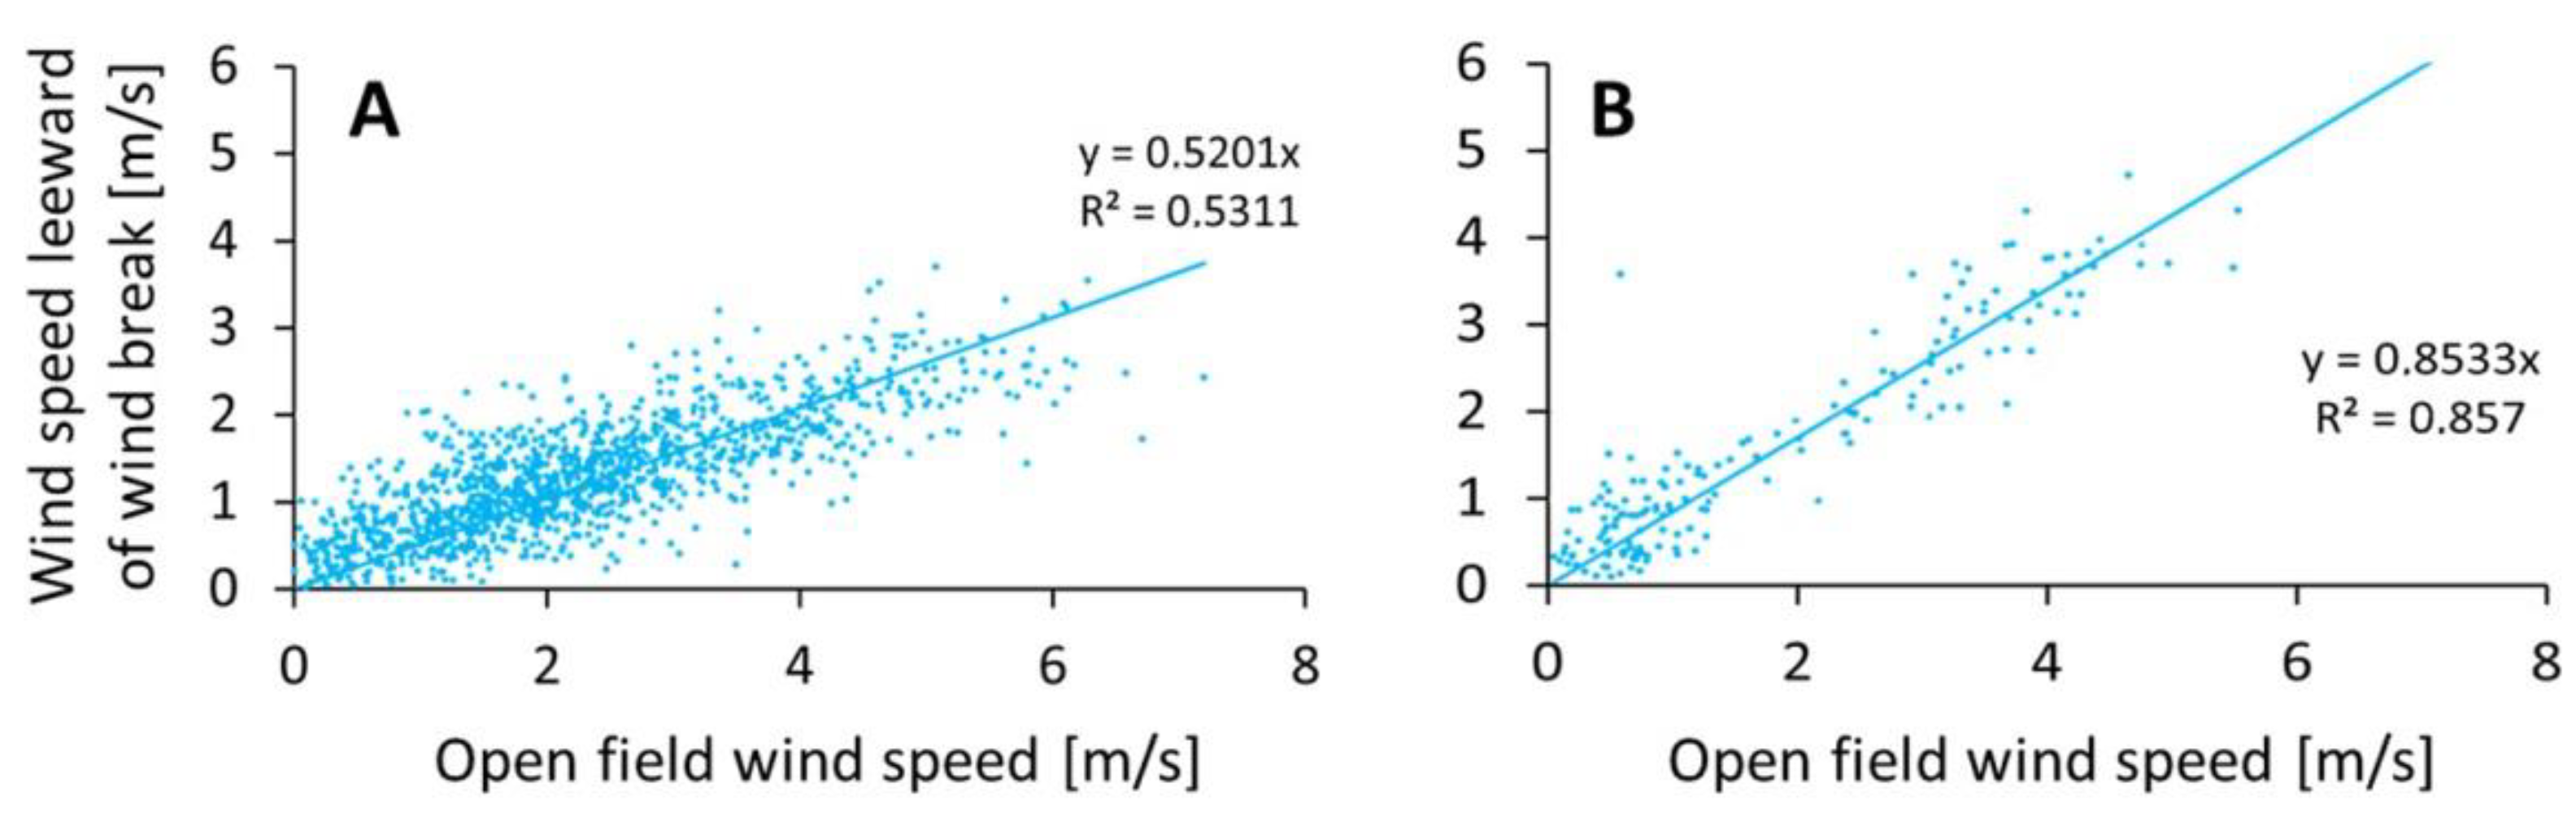
Figure 7.
Wind speed of open field conditions (Wind speed open field) versus wind speed (Wind speed wind break) leeward of the single row tree wind break adjacent to the wind break at the following distances from the tree wind break: 0.5 * H (in subgraph A) and 2 * H (in subgraph B). Distances are expressed in multiples of the wind break tree height (H). Time period of measurements: A—19 April to 3 May, B—4 May to 25 May.

Figure 8.
Reduction of wind speed along increasing distance from the single row tree wind break. The reduction of wind speed is given as multiples of open field wind speed.
Figure 8.
Reduction of wind speed along increasing distance from the single row tree wind break. The reduction of wind speed is given as multiples of open field wind speed.

Figure 9.
Reduction of wind speed along increasing distance from the multiple row tree wind break with understory vegetation. The reduction of wind speed is given as multiples of open field wind speed.
Figure 9.
Reduction of wind speed along increasing distance from the multiple row tree wind break with understory vegetation. The reduction of wind speed is given as multiples of open field wind speed.

Figure 10.
Radiation of open field conditions (Rs open field) versus radiation (Rs wind break) leeward of the single row tree wind break at the following distances from the tree wind break: 0.5 * H (in subgraph A) and 2 * H (in subgraph B). Distances are expressed in multiples of wind break tree height (H). Measurement time was from 19 April to 3 May.

Figure 11.
Daily mean air temperature versus tree water consumption (ETtrees) of a single row poplar tree wind break. For the formula of this trend line, see Equation (5).
Figure 11.
Daily mean air temperature versus tree water consumption (ETtrees) of a single row poplar tree wind break. For the formula of this trend line, see Equation (5).

Figure 12.
Daily ETo versus tree water consumption (ETtrees) of a multiple row poplar tree wind break. For the formula of this trend line, see Equation (6).
Figure 12.
Daily ETo versus tree water consumption (ETtrees) of a multiple row poplar tree wind break. For the formula of this trend line, see Equation (6).


Table 1.
Monthly average climate data from Bazarkorgon (16 km from Chek), Kara Balta (17 km from Temen Suu), and Kemin (5 km from Karasay Batyr) for the growing season, i.e., from April to October, 112 years observation (http://www.weatherbase.com).
Table 1.
Monthly average climate data from Bazarkorgon (16 km from Chek), Kara Balta (17 km from Temen Suu), and Kemin (5 km from Karasay Batyr) for the growing season, i.e., from April to October, 112 years observation (http://www.weatherbase.com).
| Month | Temperature [°C] | Relative Air Humidity [%] | Wind Speed [m/s] | Precipitation [mm] |
|---|---|---|---|---|
| Bazarkorgon | ||||
| April | 14.2 | 58.8 | 1.9 | 64.7 |
| May | 19 | 52.7 | 2 | 54.5 |
| June | 23.3 | 45 | 2 | 28.7 |
| July | 24.8 | 47 | 1.8 | 15.1 |
| August | 23 | 51.3 | 1.7 | 7.9 |
| September | 18.2 | 54.4 | 1.5 | 8.3 |
| October | 11.7 | 62.5 | 1.3 | 43.5 |
| Kara Balta | ||||
| April | 11.4 | 57.4 | 2.2 | 60.9 |
| May | 16.2 | 53.8 | 2.2 | 58.2 |
| June | 20.8 | 46.1 | 2.2 | 37.5 |
| July | 23.3 | 44.2 | 2.2 | 19.8 |
| August | 21.6 | 45.2 | 2.1 | 12.2 |
| September | 16.5 | 47.8 | 2.1 | 12.5 |
| October | 9.7 | 57.5 | 2 | 37 |
| Kemin | ||||
| April | 8.9 | 53.5 | 1.9 | 38 |
| May | 13.5 | 52.2 | 1.9 | 46.2 |
| June | 17.6 | 47 | 2.2 | 32.6 |
| July | 20.4 | 43.9 | 2.2 | 25.6 |
| August | 19.5 | 42.5 | 1.8 | 19.8 |
| September | 14.5 | 44.6 | 1.9 | 13.1 |
| October | 7.5 | 54.1 | 1.9 | 20.1 |
Table 2.
Monthly averages of the temperature, air humidity (RH), wind speed, solar radiation (Rs), and reference evapotranspiration (ETo) for the three study sites of Chek, Karasay Batyr, and Temen Suu, as measured during this study.
Table 2.
Monthly averages of the temperature, air humidity (RH), wind speed, solar radiation (Rs), and reference evapotranspiration (ETo) for the three study sites of Chek, Karasay Batyr, and Temen Suu, as measured during this study.
| Month | Temperature [°C] | RH | Wind Speed [m/s] | Rs [MJ/d m²] | ETo [mm/d] |
|---|---|---|---|---|---|
| Chek (in 2017) | |||||
| April | 15.2 | 0.6 | 1.9 | 18.6 | 3.5 |
| May | 22.0 | 0.6 | 1.5 | 22.1 | 4.9 |
| June | 24.2 | 0.6 | 2.1 | 23.4 | 5.7 |
| July | 26.5 | 0.6 | 1.1 | 23.3 | 5.3 |
| August | 23.9 | 0.6 | 1.2 | 20.6 | 4.5 |
| September | 22.2 | 0.6 | 2.1 | 16.5 | 4.0 |
| October | 15.9 | 0.6 | 1.9 | 12.2 | 2.4 |
| Karasay Batyr (in 2016) | |||||
| April | 12.7 | 0.6 | 2.0 | 20.5 | 3.5 |
| May | 16.5 | 0.5 | 2.0 | 24.0 | 4.6 |
| June | 21.3 | 0.5 | 1.9 | 26.8 | 5.9 |
| July | 22.0 | 0.5 | 2.0 | 22.3 | 5.3 |
| August | 21.2 | 0.4 | 2.2 | 22.0 | 5.4 |
| September | 19.9 | 0.4 | 2.3 | 16.0 | 4.4 |
| October | 8.7 | 0.6 | 2.3 | 12.8 | 2.2 |
| Temen Suu (in 2018) | |||||
| April | 11.5 | 0.7 | 1.9 | 19.9 | 3.1 |
| May | 14.9 | 0.6 | 2.0 | 23.2 | 4.3 |
| June | 20.2 | 0.5 | 2.1 | 23.6 | 5.3 |
| July | 23.1 | 0.5 | 1.9 | 25.1 | 5.9 |
| August | 21.6 | 0.5 | 2.0 | 20.5 | 4.9 |
| September | 15.4 | 0.5 | 1.8 | 16.8 | 3.4 |
| October | 9.9 | 0.6 | 1.7 | 12.7 | 2.0 |
Table 3.
Development stages and crop coefficient (Kc) values of the investigated crops after field observations. The Kc during development stage is interpolated linearly from the Kc of the initial stage to the Kc of the mid stage. The late Kc is interpolated linearly from the Kc of the mid stage to the Kcend, which is given in the table. Definitions of the development stages and Kc values were obtained from [22].
| Development Stage | Initial | Development | Mid-Stage | Late |
|---|---|---|---|---|
| Chek | ||||
| Cotton | 13 April to 9 May Kc = 0.35 | 10 May to 26 June | 27 June to 24 August Kc = 1.2 | 25 August to 17 October Kc = 0.7 |
| Corn | 12 April to 11 May Kc = 0.7 | 12 May to 29 June | 30 June to 29 August Kc = 1.4 | 30 August to 2 October Kc = 0.6 |
| Rice | 15 May to 14 June Kc = 1.05 | 15 June to 13 July | 14 July to 12 September Kc = 1.2 | 13 September to 12 October Kc = 0.8 |
| Karasay Batyr and Temen Suu | ||||
| Barley | 4 April to 19 April Kc = 0.7 | 20 April to 14 May | 15 May to 23 June Kc = 1.5 | 24 June to 11 July Kc = 0.25 |
| Corn | 26 May to 8 June Kc = 0.7 | 9 June to 24 July | 25 July to 15 October Kc = 1.2 | 16 October to 24 October Kc = 0.61 |
| Potato | 3 April to 28 April Kc = 0.7 | 29 April to 14 June | 15 June to 15 July Kc = 1.15 | 16 July to 15 August Kc = 0.76 |
| Wheat | 15 April to 4 May Kc = 0.7 | 5 May to 29 May | 30 May to 28 July Kc = 1.15 | 29 July to 28 August Kc = 0.25 |
Table 4.
Changes of temperature (T [°C]), air humidity (RH), and solar radiation (Rs [MJ/d*m²]) under impact of tree wind breaks. H refers to the height of the tree wind break. Tmin, Tmax, RHmin, and RHmax refer to daily temperature and humidity minima and maxima, respectively, as used for the ETo calculations following the procedure of [20]. Rs is the daily sum of solar radiation. Tmin wind break, Tmax wind break, RHmin wind break, RHmax wind break and Rswind break refer to daily temperature and humidity minima and maxima, respectively, as well as the solar radiation as changed by the impact of tree wind breaks.
| Tree Wind Break Type | Single Row Tree Wind Break | Multiple Row Tree Wind Break with Understory Vegetation |
|---|---|---|
| Minimum temperature | ||
| Closer than 1.5 × H | Tmin wind break = 1.0007 × Tmin + 0.4506 | Tmin wind break = 0.8962 × Tmin + 0.9625 |
| Further than 1.5 × H | No change | No change |
| Maximum temperature | ||
| Closer than 1.5 × H | Tmax wind break = 1.008 × Tmax − 0.1053 | TmAX wind break = 0.9522 × Tmax + 1.5854 |
| Further than 1.5 × H | No change | No change |
| Minimum air humidity | ||
| Closer than 1.5 × H | RHmin wind break = 1.0216 × RHmin − 0.0165 | No change |
| Further than 1.5 × H | No change | No change |
| Maximum air humidity | ||
| Closer than 1.5 × H | RHmax wind break = 1.1087 × RHmax − 0.0945 | No change |
| Further than 1.5 × H | No change | No change |
| Radiation | ||
| Closer than 1 × H (along north–south running tree wind breaks)/Closer than 0.5 × H (north of east–west running tree wind breaks) | Rs wind break = Rs × 0.4493 | Rs wind break = Rs × 0.4493 |
| Between 1 × H and 4 × H (along north–south running tree wind breaks)/between 0.5 × H and 2 × H (north of east–west running tree wind breaks) | Rs wind break = Rs × 0.9343 | Rs wind break = Rs × 0.9343 |
Table 5.
ETo [mm] of open field conditions and under impact of different wind break types and grid sizes.
Table 5.
ETo [mm] of open field conditions and under impact of different wind break types and grid sizes.
| Tree Wind Break | ETo [mm] | |||
|---|---|---|---|---|
| Type | No Tree Wind | Wind Break Grid Sizes | ||
| break | 50 × 50 m | 200 × 200 m | 1000 × 1000 m | |
| Single row poplar Chek | 945 | 607 | 779 | 899 |
| Single row poplar Karasay Batyr | 995 | 822 | 944 | |
| Multiple row elm | 876 | 466 | 701 | 832 |
| Multiple row poplar | 876 | 397 | 641 | 806 |
Table 6.
Water consumption–evapotranspiration (ET) of crops without tree wind breaks (ETc) and with tree wind breaks of different grid sizes.
Table 6.
Water consumption–evapotranspiration (ET) of crops without tree wind breaks (ETc) and with tree wind breaks of different grid sizes.
| Crop and Tree | ET [mm] | |||||||
|---|---|---|---|---|---|---|---|---|
| Wind Break Type | No Tree Wind Break (ETc) | ET of Crops and Trees of Tree Wind Break Systems of Grid Size [m] | ||||||
| 50 | 100 | 200 | 400 | 500 | 750 | 1000 | ||
| Single row wind break, poplars, Chek | ||||||||
| Corn | 838 | 754 | 718 | 728 | 756 | 766 | 785 | 791 |
| Cotton | 904 | 788 | 761 | 777 | 811 | 823 | 844 | 852 |
| Rice | 812 | 743 | 702 | 708 | 733 | 743 | 760 | 767 |
| Single row wind break, poplars, Karasay Batyr | ||||||||
| Barley | 611 | 497 | 496 | 510 | 515 | 523 | 529 | |
| Corn | 1035 | 754 | 787 | 830 | 844 | 865 | 882 | |
| Potato | 699 | 549 | 556 | 576 | 582 | 593 | 602 | |
| Wheat | 753 | 582 | 594 | 618 | 625 | 638 | 648 | |
| Multiple row wind break, elm, Temen Suu | ||||||||
| Barley | 572 | 370 | 409 | 461 | 504 | 516 | 530 | 542 |
| Corn | 900 | 455 | 565 | 672 | 762 | 786 | 813 | 839 |
| Potato | 648 | 388 | 443 | 508 | 563 | 578 | 594 | 610 |
| Wheat | 701 | 402 | 469 | 543 | 605 | 622 | 641 | 659 |
| Multiple row wind break, poplar, Temen Suu | ||||||||
| Barley | 572 | 763 | 599 | 561 | 546 | 547 | 551 | 555 |
| Corn | 900 | 835 | 736 | 752 | 785 | 799 | 820 | 840 |
| Potato | 648 | 777 | 628 | 603 | 600 | 604 | 612 | 620 |
| Wheat | 701 | 789 | 651 | 635 | 640 | 646 | 657 | 667 |
© 2019 by the authors. Licensee MDPI, Basel, Switzerland. This article is an open access article distributed under the terms and conditions of the Creative Commons Attribution (CC BY) license (http://creativecommons.org/licenses/by/4.0/).
Share and Cite
MDPI and ACS Style
Thevs, N.; Gombert, A.J.; Strenge, E.; Lleshi, R.; Aliev, K.; Emileva, B. Tree Wind Breaks in Central Asia and Their Effects on Agricultural Water Consumption. Land 2019, 8, 167. https://0-doi-org.brum.beds.ac.uk/10.3390/land8110167
AMA Style
Thevs N, Gombert AJ, Strenge E, Lleshi R, Aliev K, Emileva B. Tree Wind Breaks in Central Asia and Their Effects on Agricultural Water Consumption. Land. 2019; 8(11):167. https://0-doi-org.brum.beds.ac.uk/10.3390/land8110167
Chicago/Turabian StyleThevs, Niels, Alina Joana Gombert, Eva Strenge, Roland Lleshi, Kumar Aliev, and Begaiym Emileva. 2019. "Tree Wind Breaks in Central Asia and Their Effects on Agricultural Water Consumption" Land 8, no. 11: 167. https://0-doi-org.brum.beds.ac.uk/10.3390/land8110167
Note that from the first issue of 2016, this journal uses article numbers instead of page numbers. See further details here.