Farmers’ Perspective on Agriculture and Environmental Change in the Circumpolar North of Europe and America


1
Thünen Institute of Climate-Smart Agriculture, Bundesallee 68, 38116 Braunschweig, Germany
2
Agriculture and Agri-Food Canada, Central Experimental Farm, Ottawa, ON K1A 0C6, Canada
3
Institute of Physicochemical and Biological Problems in Soil Science, RAS, Institutskaya st. 2, 142290 Pushchino, Russia
*
Author to whom correspondence should be addressed.
Land 2019, 8(12), 190; https://0-doi-org.brum.beds.ac.uk/10.3390/land8120190
Submission received: 18 November 2019
/
Revised: 3 December 2019
/
Accepted: 6 December 2019
/
Published: 9 December 2019
Abstract
:Climate change may increase the importance of agriculture in the global Circumpolar North with potentially critical implications for pristine northern ecosystems and global biogeochemical cycles. With this in mind, a global online survey was conducted to understand northern agriculture and farmers’ perspective on environmental change north of 60° N. In the obtained dataset with 67 valid answers, Alaska and the Canadian territories were dominated by small-scale vegetable, herbs, hay, and flower farms; the Atlantic Islands were dominated by sheep farms; and Fennoscandia was dominated by cereal farming. In Alaska and Canada, farmers had mostly immigrated with hardly any background in farming, while farmers in Fennoscandia and on the Atlantic Islands mostly continued family traditions. Accordingly, the average time since conversion from native land was 28 ± 28 and 25 ± 12 years in Alaska and Canada, respectively, but 301 ± 291 and 255 ± 155 years on the Atlantic Islands and in Fennoscandia, respectively, revealing that American northern agriculture is expanding. Climate change was observed by 84% of all farmers, of which 67% have already started adapting their farming practices, by introducing new varieties or altering timings. Fourteen farmers reported permafrost on their land, with 50% observing more shallow permafrost on uncultivated land than on cultivated land. Cultivation might thus accelerate permafrost thawing, potentially with associated consequences for biogeochemical cycles and greenhouse gas emissions. About 87% of the surveyed farmers produced for the local market, reducing emissions of food transport. The dynamics of northern land-use change and agriculture with associated environmental changes should be closely monitored. The dataset is available for further investigations.
1. Introduction
The vast boreal and arctic landmass of the world’s eight northernmost countries is covered by virtually pristine, sparsely populated ecosystems. Extreme and unfavourable environmental conditions in the Circumpolar North, including large areas with permanently frozen soil, short growing seasons, and the long absence of daylight, limit human population development and land-based activities [1]. Although indigenous people have used the land for reindeer grazing for centuries and millennia [2], the area used for agriculture is very small. For example, only 0.2% of the total land surface of Alaska is used for agricultural production [3]. In comparison, 39% of the European land surface is covered by agricultural land [4]. As the world’s population continues to grow and land suitable for agriculture in other regions of the world is fully exploited, many may look to the north to expand agricultural opportunities, particularly as climate change makes this possible [5,6].
The greatest increase in air temperature is predicted to occur in the high northern latitudes, with up to 11 °C warmer mean annual temperatures by the end of the century in the most pessimistic scenario [7]. All aspects of ecosystems are expected to be profoundly affected, as currently assessed in numerous temperature manipulation experiments. Northern societies might also be affected by climate change in various ways: Hovelsrud et al. [8] noted the impacts on economy, infrastructure, health, livelihoods, culture and identity. Agriculture is related to all of these societal aspects and is likely to become a very dynamic sector in the Circumpolar North in the mid-term. Popular media tend to describe current agricultural developments in some northern circumpolar regions as ‘agricultural boom’ [9,10], although this might not necessarily be reflected in recent agricultural statistics for the respective regions. Beck et al. [11] computed an updated global Köppen-Geiger climate classification map and showed that by the end of the century (2071–2100), the prevailing subarctic Dfc climate in the Circumpolar North will have changed to Dfb (warm summer, continental, or hemiboreal) and Dfa (hot summer, continental) climates, which equals the climate of the US wheat belt or Central Europe today. Tchebakova et al. [12] projected that the northern border for agricultural production may shift as far north as the Arctic Circle (66° N) and that the area suitable for agricultural production in central Siberia could increase by 50–85% by the end of the century. Furthermore, a global crop model predicted that the direct physiological effect of increased atmospheric CO2 and temperature will lead to the most pronounced positive changes in crop yields in high northern latitudes [13]. At the same time, climate change is also favouring the expansion of certain pests, as observed in Russia in the period 1976–2012 for certain locusts and the Colorado beetle [14].
Warming-induced permafrost thaw might well be a major driver facilitating the northward expansion of agriculture. Based on the prior moderate warming scenario of the Intergovernmental Panel on Climate Change (A1B), Schaefer et al. [15] predicted a 29–59% decrease in the global permafrost area and a 53–97 cm increase in active layer thickness by 2200. Permafrost soils are currently cultivated to a presumably small, yet unquantified extent [2,16], with few consequences quantified for permafrost dynamics and related fluxes of energy, carbon, nutrients, and water in these soils. Furthermore, apart from altered biogeochemical cycles and processes in the soil, the introduction of agriculture to native ecosystems is acknowledged as having extensive ecological, biophysical, and societal consequences [17].
Finally, global drivers may not be the only factors that foster land-use change in the Circumpolar North; regional drivers may also play a role. For example, the meat-based diets of indigenous people are in transition to more market food-based diets, including grains and vegetables [18]. At the same time, imported food is very costly and often of compromised quality, increasing the demand for locally grown food in remote areas, especially fly-in communities [19,20]. In certain regions of the Circumpolar North, local food insecurity is a major and troubling issue; for example, about 90% of all Inuit children in the Canadian territory of Nunavut experience hunger on a regular basis [21]. The discovery of natural resources, such as oil, in the northwest arctic Russia or Alaska’s North Slope [22] can also amplify the infrastructural and demographic development of certain regions, with potential effects on land-use patterns. For example, agricultural development commenced with the gold rush at the end of the 19th century along the Yukon River in Northwest Canada and Alaska.
The agricultural sector in northern circumpolar regions might currently be small when expressing its proportion to either total global agricultural production or total land area in the global north; however, it is important to understand its nature for the abovementioned reasons. Beyond general agricultural statistics, not much is known about farming in these relatively extreme environments on a global scale. A comprehensive characterisation of the specifics of northern agriculture, farmers’ interactions with the environment, and their perception of environmental change could provide a crucial basis for predicting future agricultural development and associated changes in consumption-based greenhouse gas emissions in the northern circumpolar regions of the globe. The objective of this study therefore was to conduct a global online farmer survey and derive a comprehensive dataset on multiple aspects of agriculture north of 60° N based on farmers’ perspectives.
2. Materials and Methods
2.1. Survey and Dataset
The online questionnaire was compiled in English and Russian using SoSciSurvey.de, a professional free German software tool for online surveys [23]. The aim was to reach farmers north of 60° N latitude, which approximately encompasses the northern boreal and arctic climate zones. The questions were organised into four thematic blocks: (i) general characteristics of the farm and infrastructure, (ii) farm history, motivation, and origin of the farmer, (iii) climate change and environmental constraints, and (iv) sociodemographics. The open text (OT) answer type was chosen when: (i) it was not clear what kind of answer to expect or (ii) the variable was continuous. Only if the range of possible answers could be narrowed down to several categories was multiple choice (MC) chosen as the answer type. A third type of answer was a combination of MC and OT (MC/OT), when farmers were given the option to choose ‘other’ over the given options and then explain what ‘other’ was.
The first block in the survey included 12 questions about the type (MC/OT) and size (OT) of the farm, fertilisation (MC), crops grown (OT), livestock (OT), extra feedstock (OT), greenhouse proportion of the farm (OT), distance and time to the next settlement (OT), major customers (OT), municipal power supply (OT), renewable power production (OT), and the proportion of produced renewable energy out of total energy demand (OT).
The second block contained a total of 10 questions on the duration of their farming north of 60° N (OT), the farmers’ origins (MC/OT), whether the farmers belonged to an indigenous group (MC), when the land was first cleared of native vegetation (OT), the reason for farming north of 60° N (OT), the major challenge of northern farming (OT), whether people in the nearest community appreciate local food (OT) and want local agriculture to grow (OT), and whether farming was the only income (MC).
The third block contained 15 questions on climate change observations (MC/OT), potential changes in farming practice as an adaptation to climate change (OT), potential development of the agricultural sector due to climate change (MC), what wildlife problems the farmers encounter (OT) and if these problems have changed with climate change (OT), what other environmental problems farmers face (OT), what the largest impact of farming would be on the environment in their area (OT), if and at what depth farmers observed permafrost underlying cultivated land (MC), if and at what depth farmers observed permafrost underlying adjacent uncultivated land (MC), if there were any signs of thermokarst on their cultivated land and, if so, what kind (MC), if farmers observed any changes in permafrost depth and if this was due to climate change or land-use change (MC), the average soil texture (MC), the average organic matter content (OT), and the abundance of peaty areas on the farmland (OT). Finally, there were four socio-economic questions on gender (MC), age (MC), formal education (MC/OT), and farming background (MC/OT).
The survey was launched on 24 January 2019 and closed on 23 April 2019. It was distributed in multiple ways on the internet. Lists of farmers’ emails were obtained from diverse websites to contact farmers directly. Agricultural extension services, consultancies, and scientists were also asked to distribute the announcement. Finally, the social media platform, Facebook, was used to directly contact farmers with active profiles or post the survey announcement to farmers’ associations or networks. Farmers gave informed consent to participate in the study and the ethics committee of the life science faculty of the Technical University of Braunschweig approved the study (official number FV-2019-15, approval date 28/10/2019).
A total of 151 farmers clicked the link and looked at the survey and, of these, 67 contributions were valid (success rate of 44%). A valid contribution was predefined as having at least 51% of the questions answered. For the 67 valid contributions, an average of 94% of all questions was answered. The approximate location of the farm, as shown in Figure 1, was derived from the question on the nearest settlement and therefore does deviate slightly from the actual location. Five farms in Alaska were located south of 60° N, but were not excluded, since this longitude served only as a rough definition of the target regions. Despite a Russian translation of the survey and several distribution efforts, no data was collected from Siberia, which might be related to insufficient internet access in certain regions (Kurganova 2019, personal communication). The 67 contributions were clustered into four different regions, which are characterised by distinct environmental conditions and thus presumably by distinct agricultural practices: Alaska, Canada, Atlantic Islands and northern Continental Europe (Fennoscandia) (Table 1). The number of farms surveyed was not proportionally distributed with regard to actual numbers of farm operations: In Alaska, Canadian territories, Greenland, and Faroe Islands, 2.6%, 10%, 1.8%, and 4.1% of the total agricultural operations were surveyed, respectively, while in Fennoscandia and Iceland, the number of farm operations was much larger (e.g., 47.633 farms in Finland), so that only a very small proportion of total farms was surveyed. The dataset might thus not be representative for all farm operations in the Circumpolar North outside Siberia. For the majority of questions in this study, this was not a precondition. It was more important, that all regions were covered to a certain extent and with a similar sample size. Climate data, i.e., mean annual temperatures (MAT) and mean annual precipitation (MAP), were derived from a climate database with regionalised weather station data from 1982–2012 for the given nearest settlement to each of the 67 sites (climate-data.org). Average values are presented in Table 1.
2.2. Data Analysis
For a statistical analysis of the data, we introduced categories to group non-continuous open text answers. For example, the open text question ‘why do you farm north of the 60° N latitude?’ was answered in many and diverse ways, while two contrasting major reasons were given: ‘lifestyle’ and ‘family roots’. Answers such as ‘I love it here’, ‘lifestyle’, ‘we want to live here’, ‘love farming’, ‘wild untrampled land’, ‘love the north and it’s a challenge’ were summarised as ‘lifestyle’, while ‘it’s home’, ‘that is where I live’, ‘I was born here’, and ‘family farm since 1920’ were summarised as ‘family roots’. Any answer that did not fit into these categories was summarised as ‘other’. When ‘other’ was used, a rough categorisation was given along with the presentation of the respective results. The obtained categories were then used to calculate proportions of each category in each region. Consequently, the proportion referred to the total number of farmers per region answering the specific question, not to the total number of farmers per region. This was done to omit the category ‘no answer’. The number of answering farmers was acknowledged when presenting the results. In the case of multiple answers per farm, e.g., open text listings, either the proportion of farmers mentioning the individual category (in the case of climate adaptation measures) or the proportion of the category in the total number of mentioned cases (in the case of wildlife problems per region) was calculated. Differences between regions in proportions of categorical variables were tested for significance using the chi-square test of independence. For the test, counts of cases instead of proportions were used in each cell [25]. For continuous variables, analysis of variance (ANOVA) was used to test differences between regions for significance. Data were square root-transformed or log-transformed whenever necessary to ensure approximate normal distribution. Significance was assessed at p < 0.05. Statistical and graphical analyses were performed with the statistical software R, version 3.5.2 [26].
3. Results and Discussion
3.1. General Characterisation of Agriculture North of the 60° N Latitude
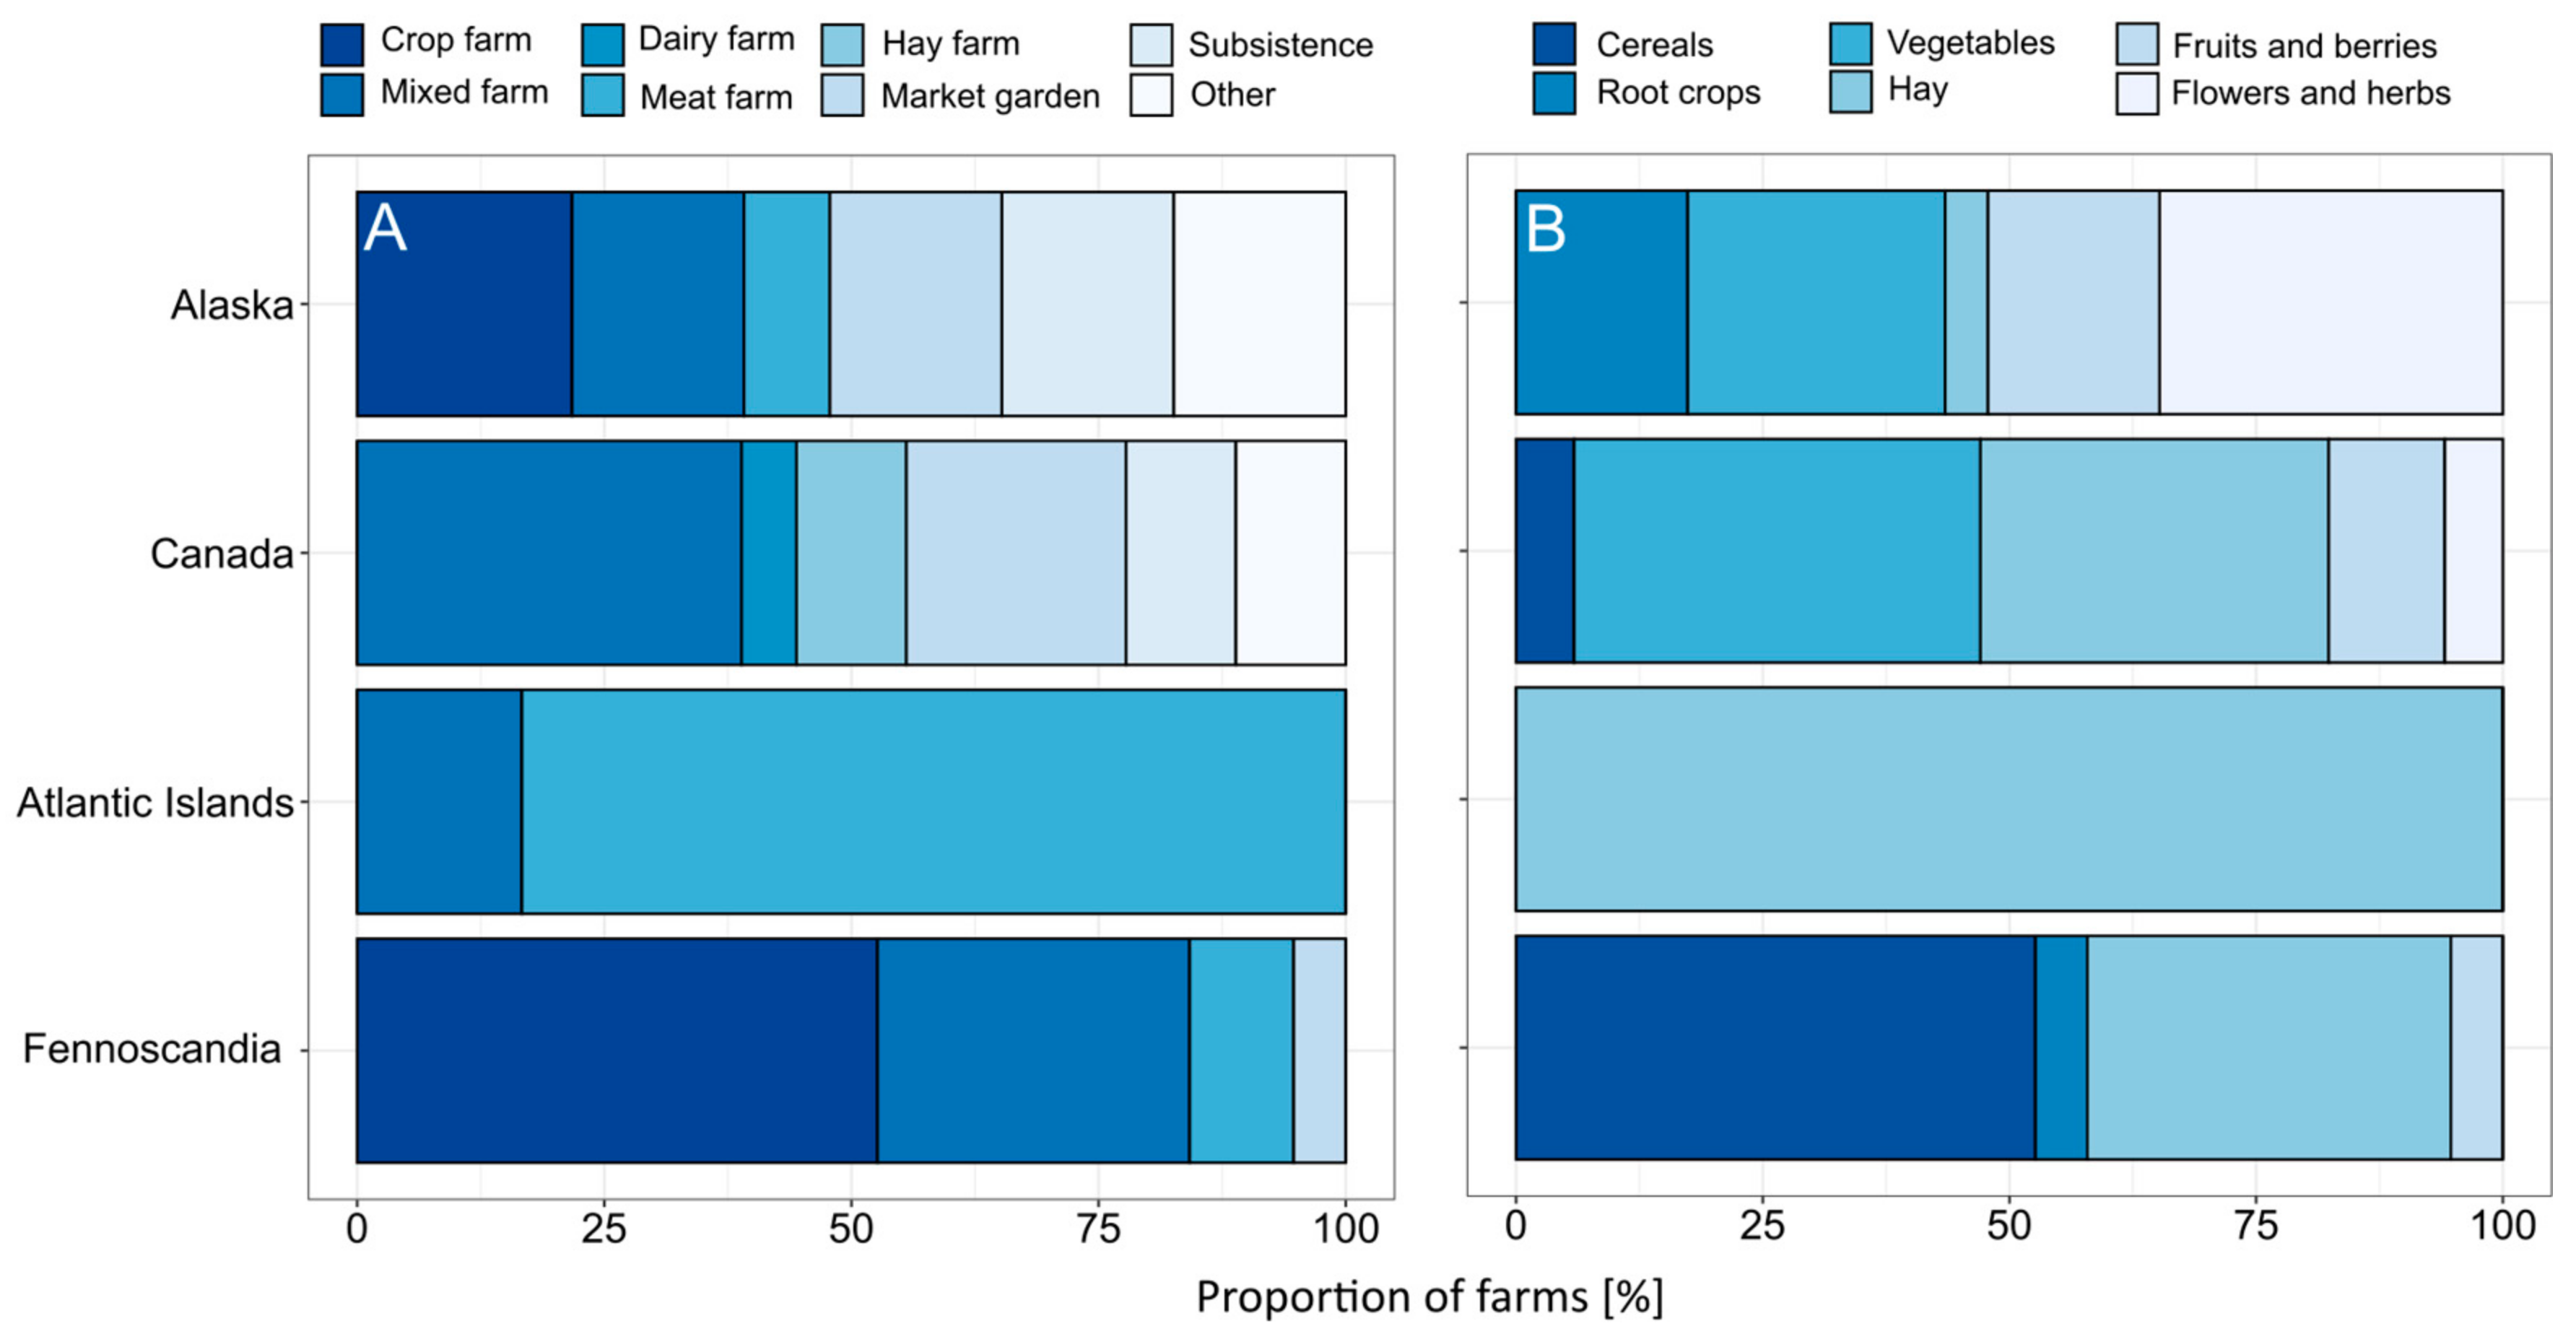
Within the survey, a significant difference was found between the regions regarding the abundance of farm types and major crops (p < 0.001). In Alaska and the Canadian territories, the agricultural sector was characterised by a high diversity in farming systems, ranging from subsistence farms and market gardens to larger crop or mixed farms. Accordingly, hay and specialised crops, such as vegetables, fruits and berries, flowers and herbs, were the dominant agricultural crops there. Alaskan agriculture has been characterised as ‘outpost agriculture’, specialising in the supply of horse fodder and some ‘luxury’ items for local communities—Primarily government employees [27]. In the past decade, peony (Paeonia spec L.) production for the US cut-flower market especially has become a blooming business in Alaska [28]. This is due to the fact that Alaskan peonies fill the July–September gap, which is related to the peony blossom between April and June in the northern hemisphere and from October in the southern hemisphere. In the dataset, the importance of flower farming to Alaskan agriculture was revealed by the fact that one third of all Alaskan farms had ‘flowers and herbs’ as the main crop, with two out of seven growing primarily or only herbs, and five out of seven growing primarily or only flowers. With a total of 142 Canadian farms in 2016 as compared to 1000 Alaskan farms [3], the agricultural sector in Canada north of 60° N latitude is much smaller. The fact that hay and vegetables are the major crops in the Canadian territories is in line with agricultural statistics [29], indicating that approximate representativeness of the survey can be assumed. Subsistence farming was also found to play a considerable role in Alaska and Canada (Figure 2A), underlining the small-scale character of agriculture in these regions. When excluding one outlier of 920 ha, the average area of cultivated land per farm in Alaska was 1.2 ± 1.7 ha, while in Canada it was 25 ± 46 ha. On the Atlantic Islands, agriculture is traditionally dominated by sheep farming, introduced by the Vikings in medieval times [30]. This explains the homogeneous patterns for the variables, farm type and major crop, which were dominated by meat farms and hay, respectively. When excluding an outlier of 2500 ha in Greenland, the average area of cultivated or grazed land was 166 ± 187 ha. In contrast, the northern provinces of Finland, Norway, and Sweden are dominated by crop farms and cereals as the major crop, which is also consistent with agricultural statistics [31,32,33]. With 52 ± 32 ha, the average farm size in the Scandinavian countries was well above that in Alaska and Canada. Thus, despite the different number of observations per region as well as the relatively low number of observations in Fennoscandia in relation to the high number of farms, the observed ranges in farm types and agricultural product matched well with agricultural statistics. It can therefore be assumed that the contributing farmers approximately represented their respective regions with regard to farm type and major crops.
Furthermore, 43% of all the investigated farms had livestock, of which 86% bought extra animal feed. The remaining 14% (five farms), none of which bought any extra feed, were certified organic. The overall proportion of organic farms was 36%, which is not representative of northern circumpolar agriculture; however, in Finland, the majority of contributions came from organic farmers, who were reached by a shared link in a forum for organic agriculture.
Unfortunately, Russian farmers could not be reached directly with the survey to evaluate the Russian perspective on northern agriculture in the context of climate change. Literature on northern agriculture in Russia beyond official statistics is also scarce (Kurganova 2019, personal communication). Due to the large size of the land surface north of 60° N that is in Russia, this represents a major shortcoming of this global survey. Similar to the other northern regions, the north of Russia is sparsely populated: the Circumpolar North (north of 60° N) occupies about 20% of the total area of the Russian Federation, whereas its population comprises only 4.5% of the total Russian population [34]. Agriculture is a traditional part of life for local people north of 60° N. The share of milk and egg production in northern Russian territories is no more than 0.9–1.5% of the total amount in Russia. Cereal production also plays a minor role here. The area occupied by grain crops is about 107,000 ha, which is less than 0.1% of the total area of grain crops in Russia [34]. Reindeer husbandry is the only branch of agriculture that develops mainly beyond the Arctic Circle. Traditional local activities (such as reindeer husbandry, fishing, hunting, and gathering wild plants) provide the basis of the food for the indigenous people of the northern territories.
3.2. Infrastructure and Farm Product Distribution
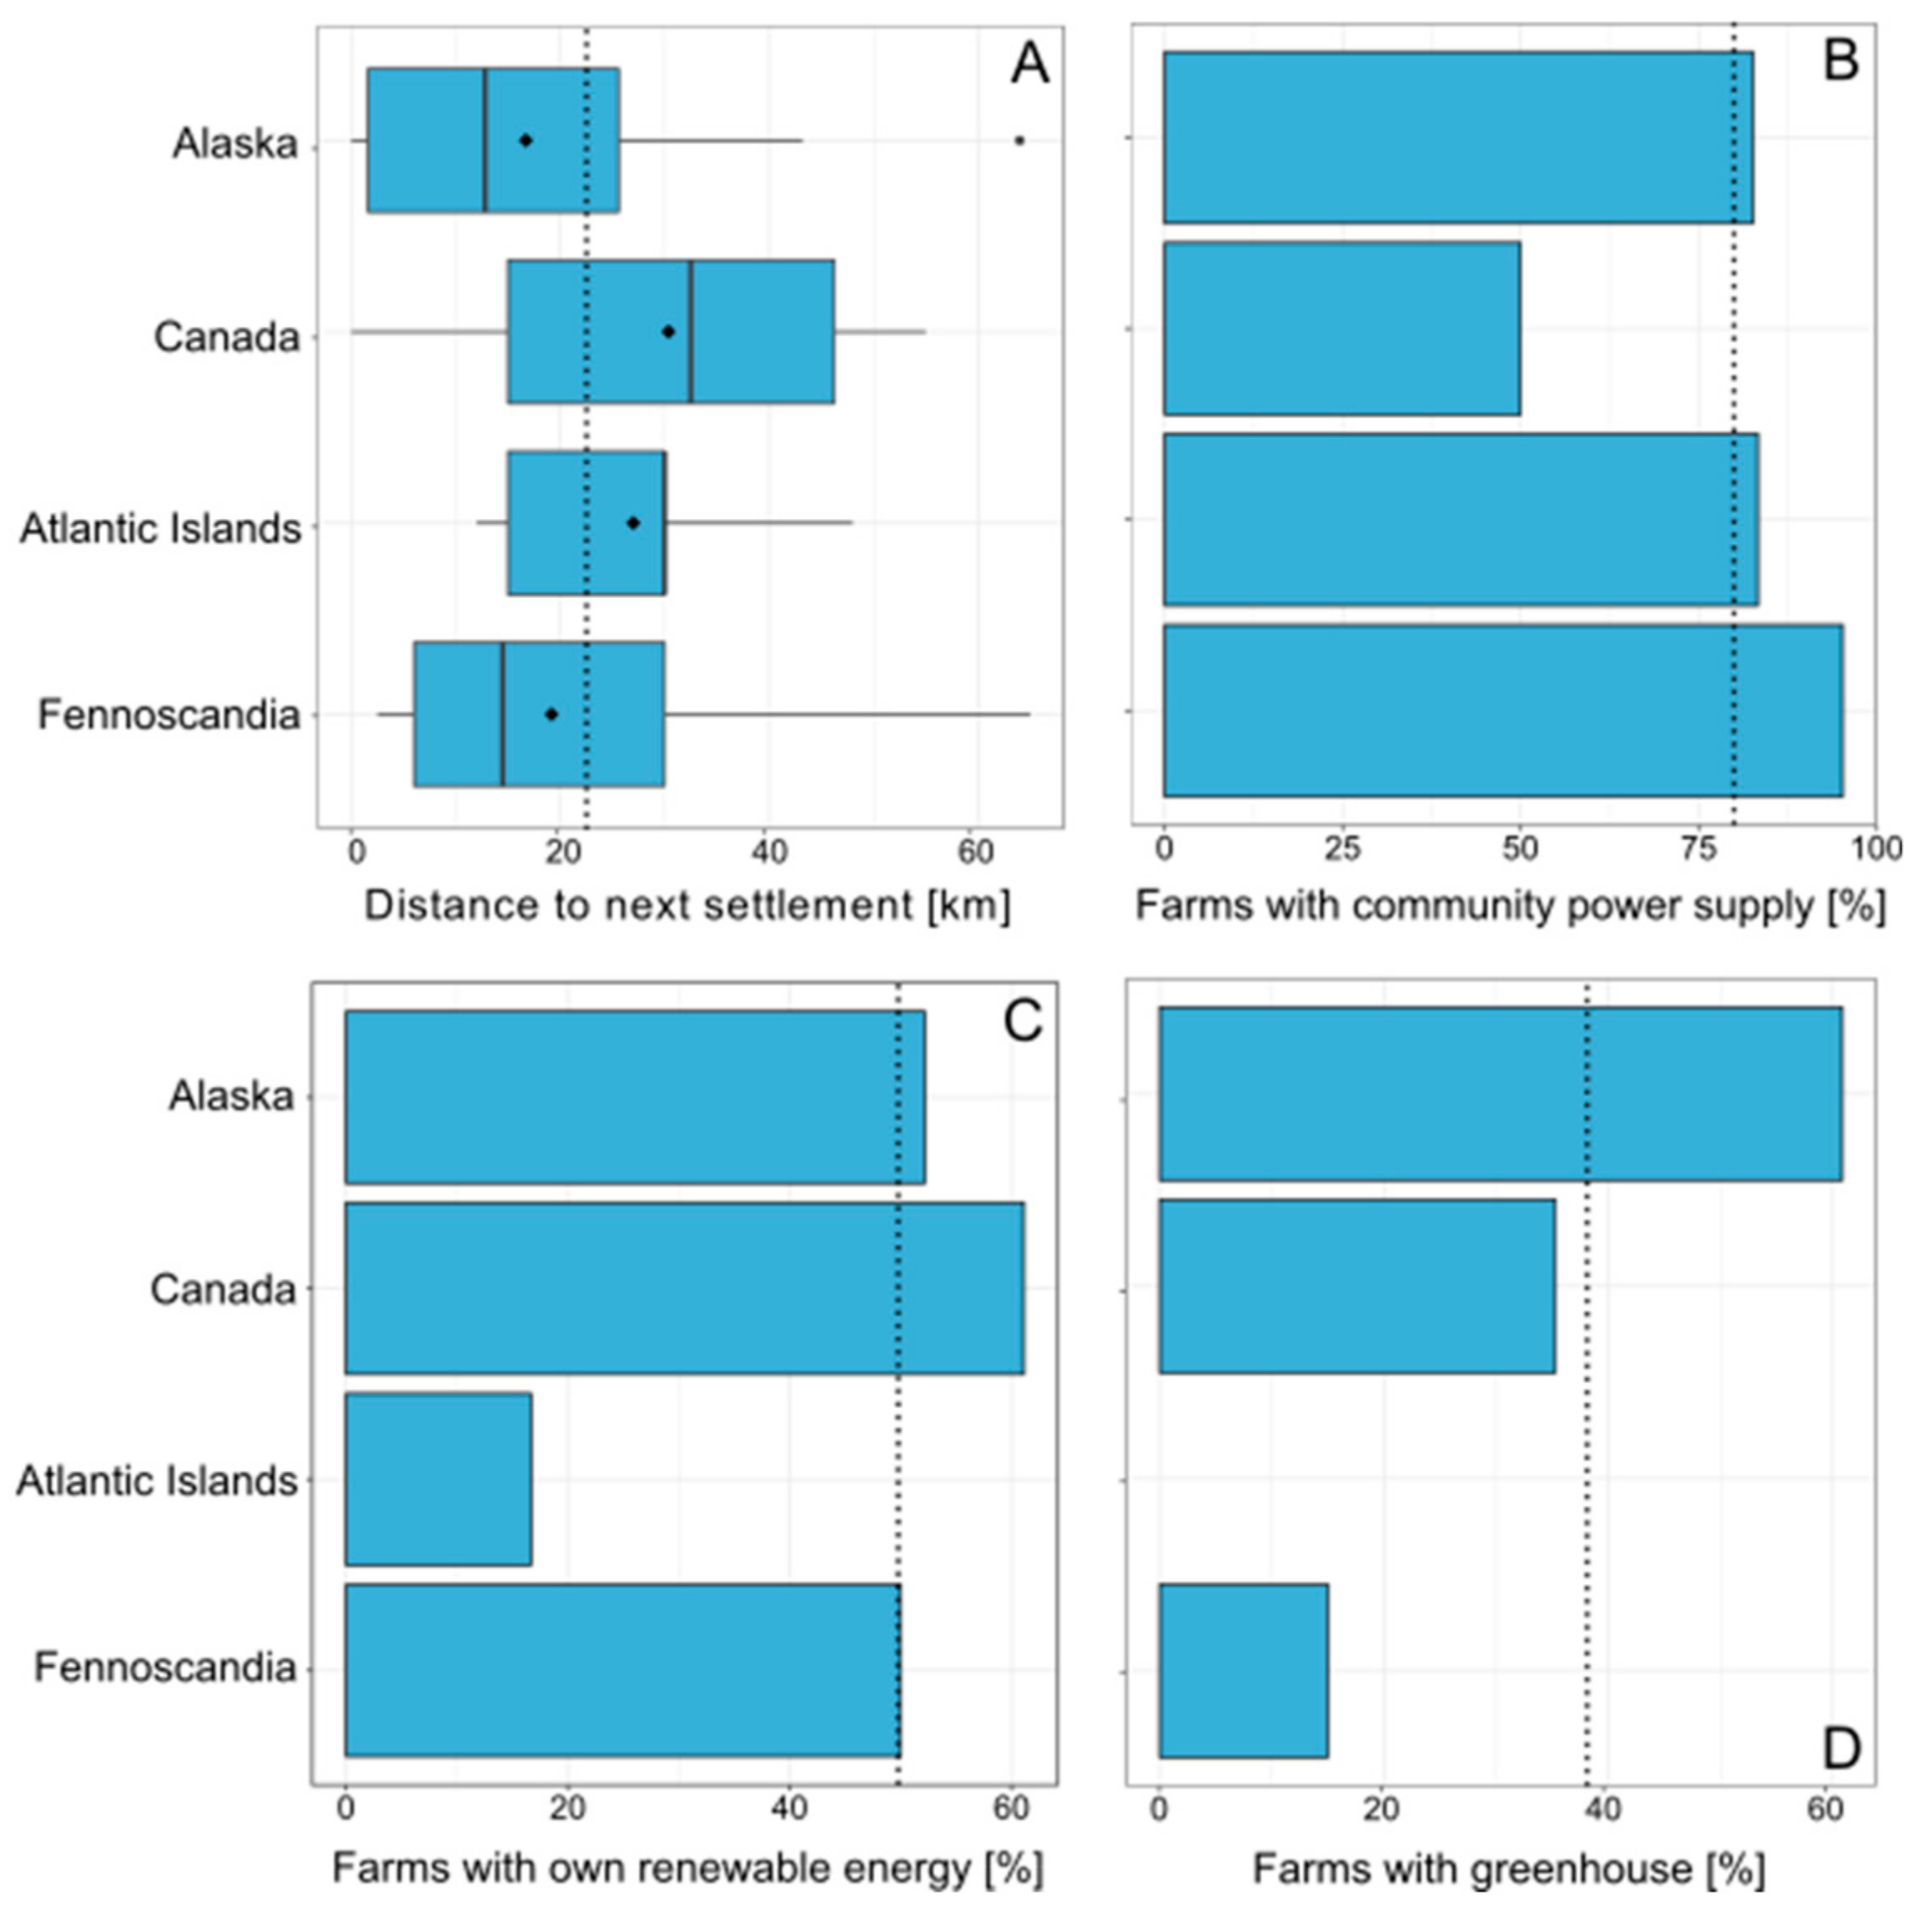
With an average distance of 22 ± 14 km (Figure 3A) or 27 ± 38 minutes by motorised vehicles to the next settlement, farms in the northern circumpolar region were relatively remote. Although no significant difference was detected across regions, farms in Canada tended to be the most remote. This was confirmed by other infrastructural parameters: in Canada, only 50% of all farms had a community power supply (Figure 3B), while in Fennoscandia 95% of all farms had access to the electricity network. Consequently, farms in Canada had the highest share of farms with self-produced renewable energy (Figure 3C). The proportion of farms with greenhouses was highest in Alaska, followed by Canada, which is likely driven by farm type followed by climatic conditions. In this survey, meat farmers on the Atlantic islands did not rely on greenhouses. Greenhouse production of fruits and vegetables, however, is a common feature of local agriculture in Iceland in particular [35] due to the availability of geothermal energy.
A total of 87% of all surveyed farmers were producing their food for local communities, distributing it through farm gate sales, farmers’ markets, and cooperatives or selling it to local restaurants. Only 13% (8 out of 62 answering farmers) were producing food for the respective national market. Those mainly consisted of several peony farms in Alaska producing for the US flower market, as well as cereal farms in Finland producing for the ‘industry’. Farming was the only income for just 24% of all farmers in the survey; of those 15 farmers, only two were exporting their products or selling them to retail markets. The majority of full-time farmers comprised those producing for their local communities. This indicates that northern farmers are likely to be able to make a living by providing agricultural products to nearby communities.
3.3. Farmers’ Backgrounds, Origins, and Motivations
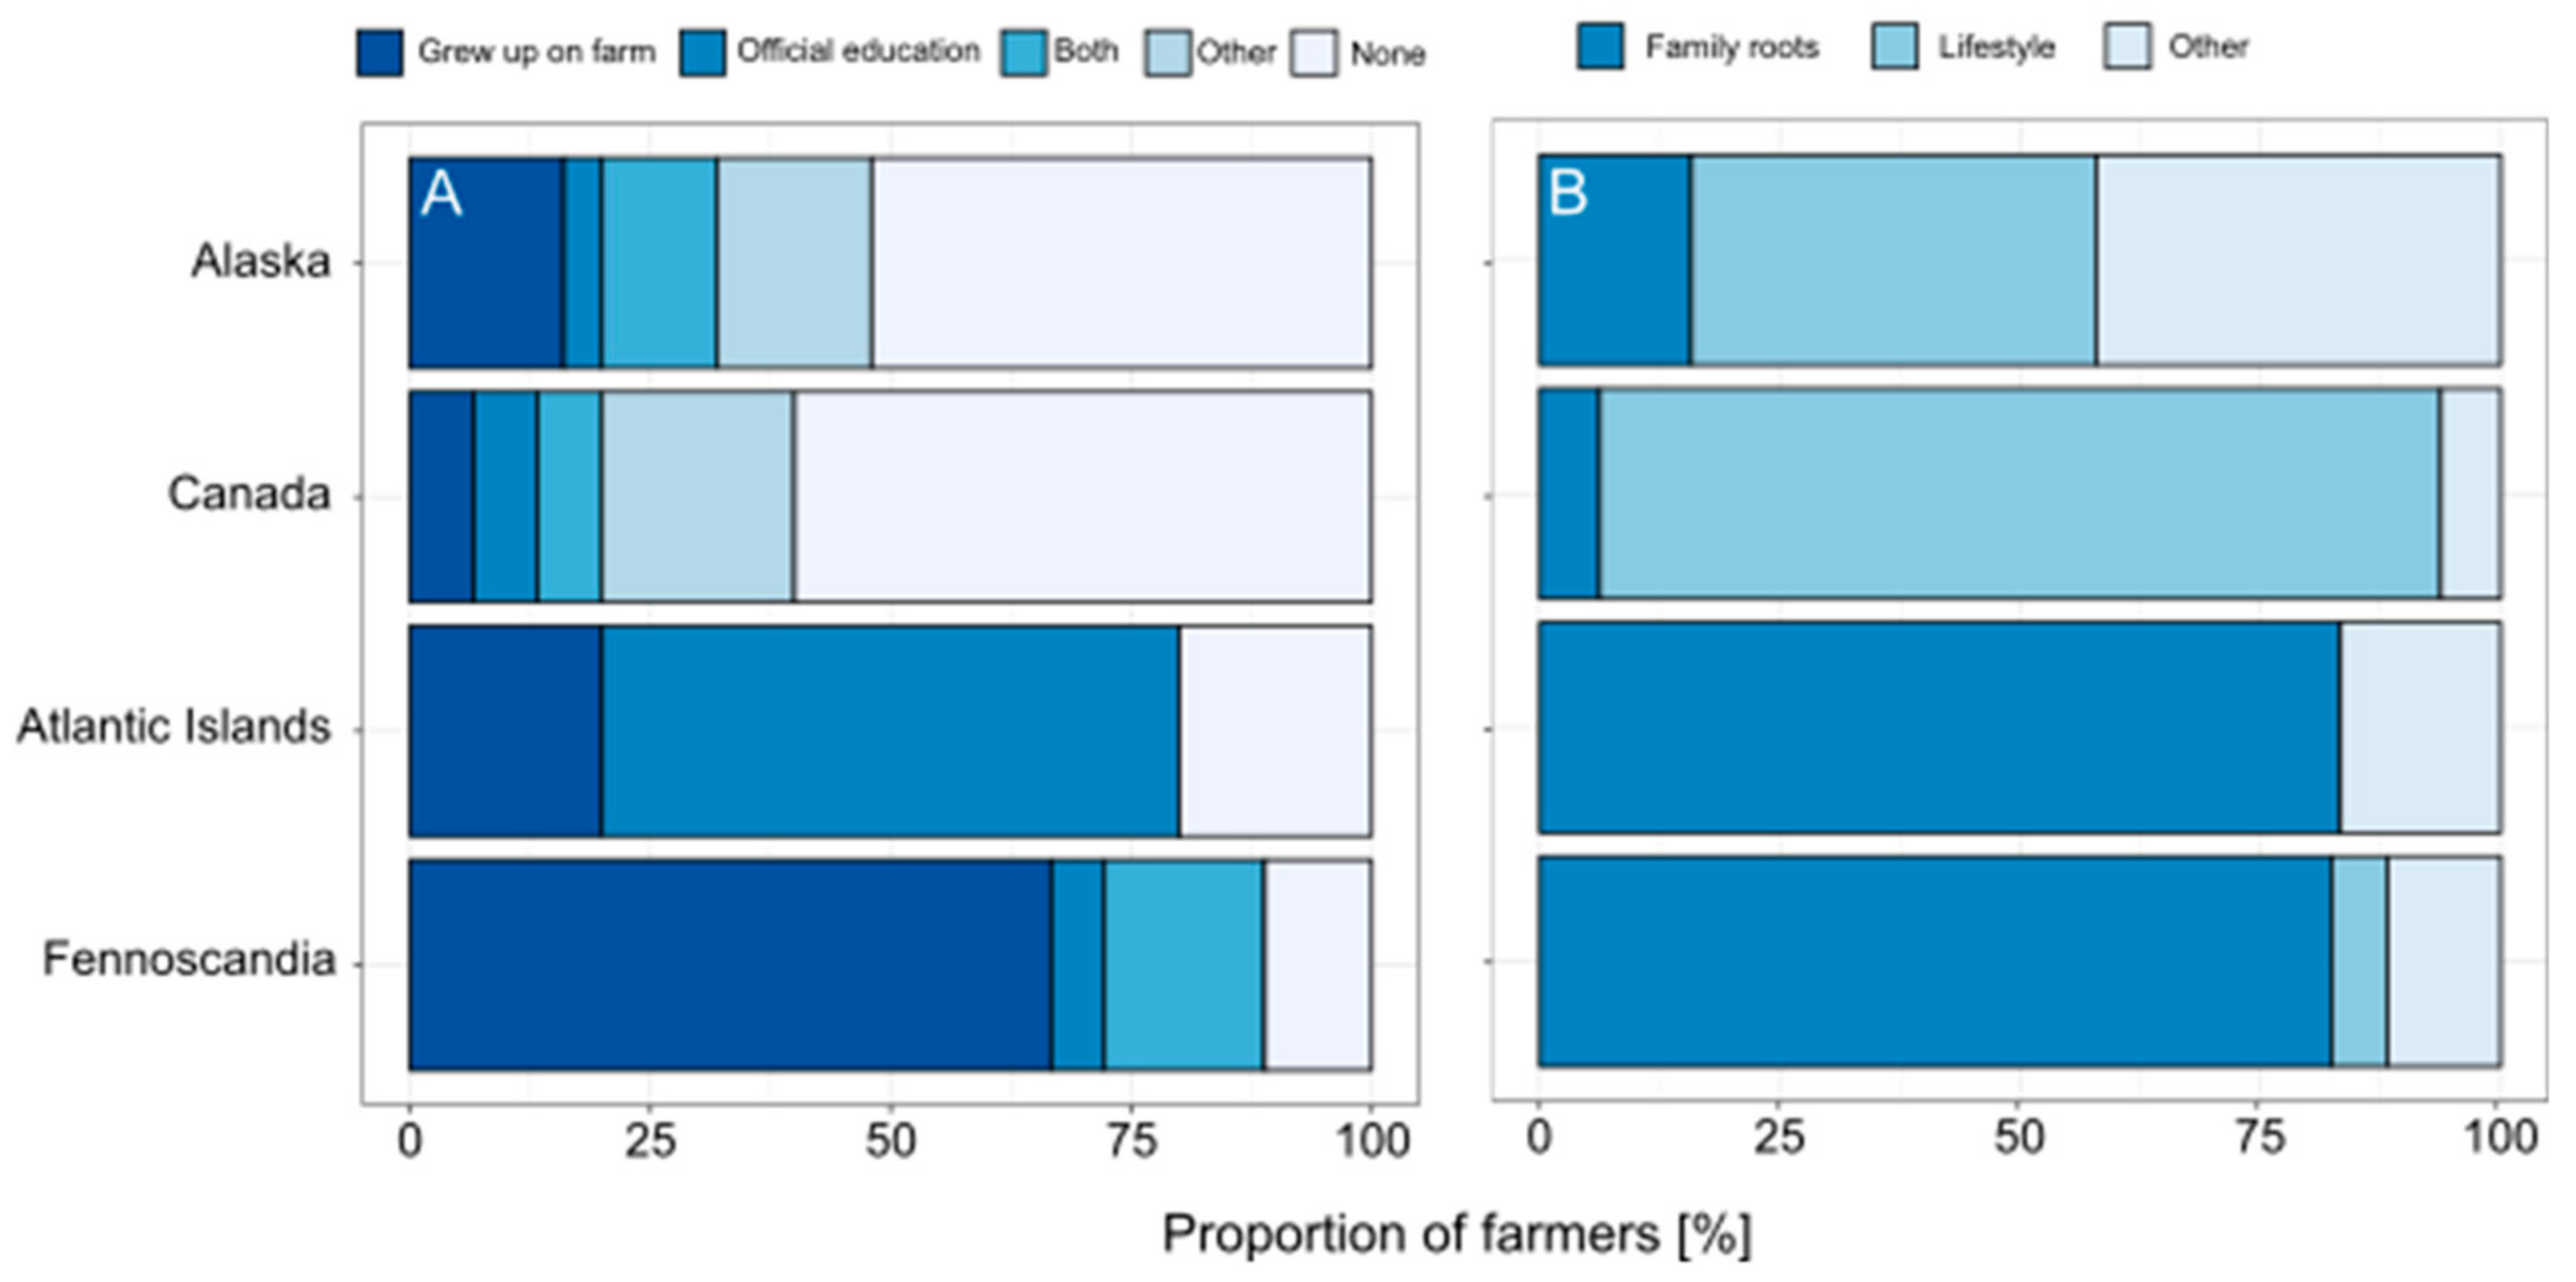
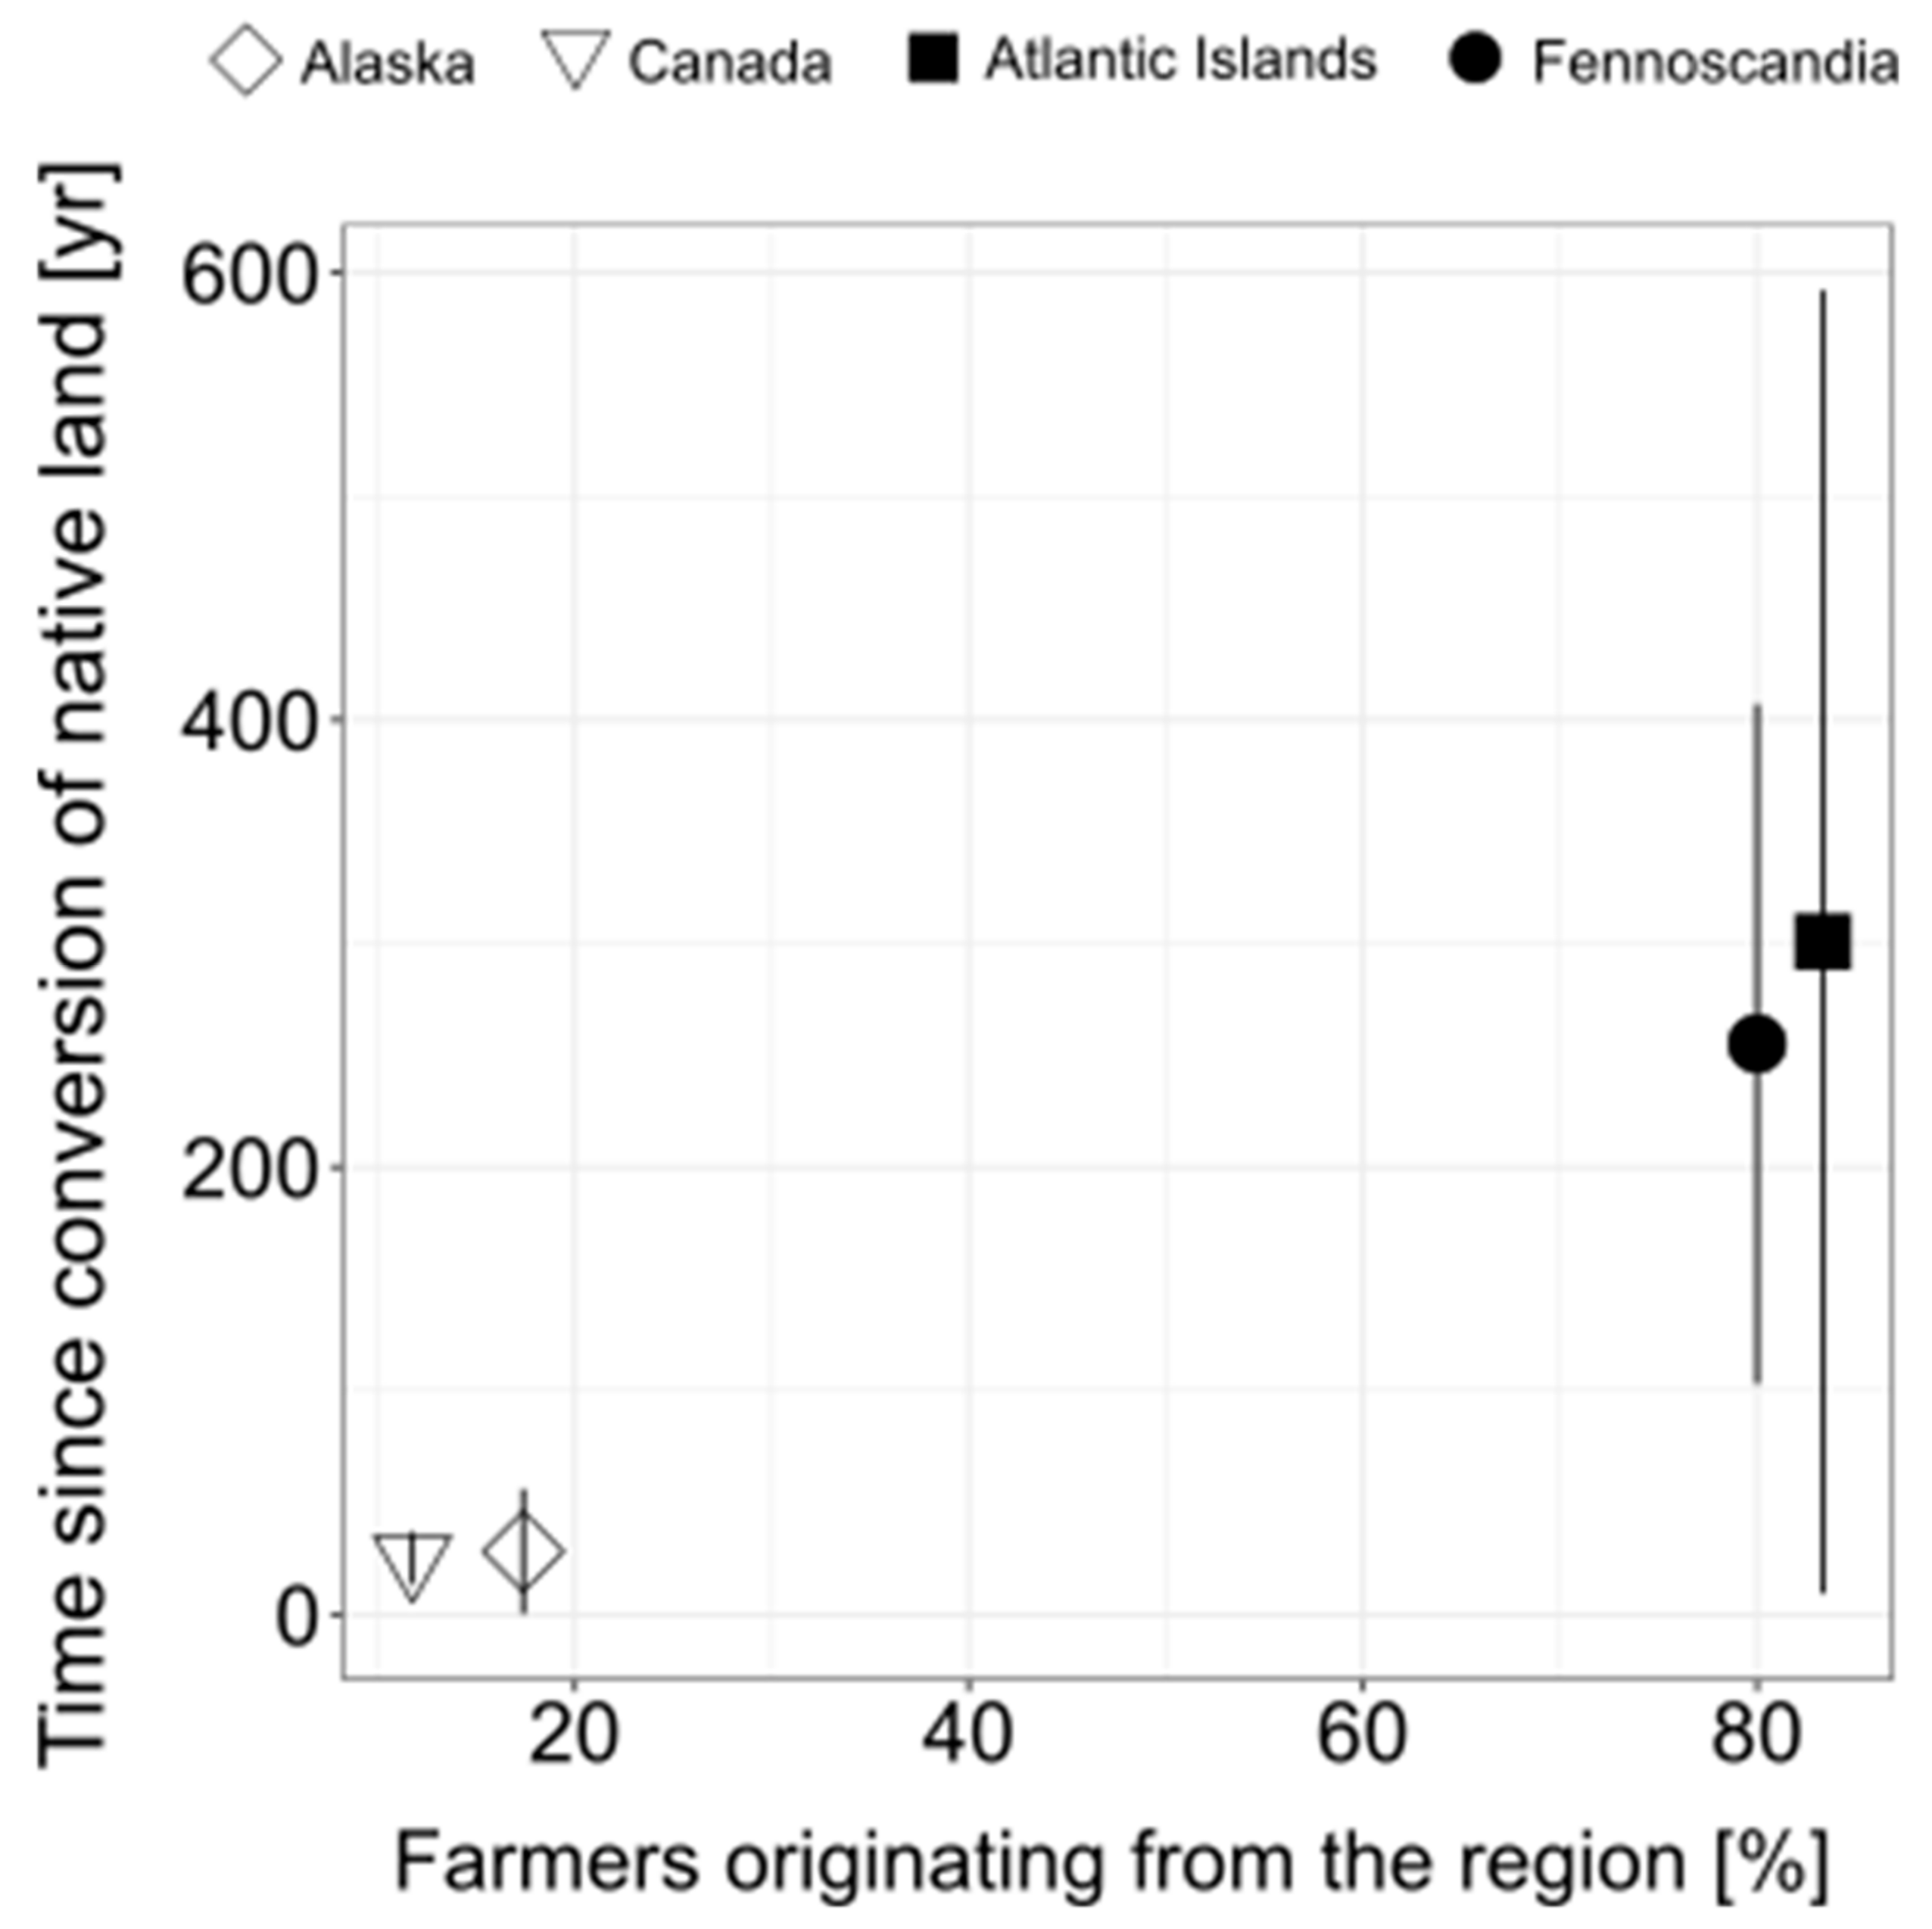
For farmers’ agricultural backgrounds (Figure 4A), a significant difference was found between the regions (p < 0.001). In Alaska and Canada, 50% and 60% of all farmers, respectively, had no background or education in agriculture, while on the Atlantic Islands and in Fennoscandia, the majority of farmers were educated either by growing up on farms or at official agricultural education institutions. This fits the fact that farming in Alaska and Canada is mostly driven by lifestyle decisions or other diverse reasons, while ‘family roots’ was the major reason for farming north of 60° N on the Atlantic Islands and in Fennoscandia (Figure 4B). The proportion of farmers who actively moved to the far north of Europe to develop agricultural production seemed rather limited compared to North America. This was also indicated by the low proportions (<20%) of European farmers who did not originate from the region in which they were farming (Figure 5). Farmers in Alaska, the Yukon Territory, or northwest territories of Canada came from all over the US, Canada, or Europe and intentionally moved to these relatively remote areas; in contrast, the vast majority (>80%) of farmers on the Atlantic Islands and in Fennoscandia originated in their respective regions. These observations correlated well with the average age of the farms: average time since conversion from native land in Alaska and Canada was less than 30 years, i.e., only one generation, whereas on the Atlantic Islands and in Fennoscandia, the first conversion dated back as far as 255 ± 155 and 301 ± 291 years, respectively. The observation that 80% of the surveyed current farmer generation in North America did not originate from there might indicate upcoming agricultural growth in those regions. Moreover, it fits well with demographic developments in those regions: the population of Alaska increased almost linearly from 100,000 in 1946 to 736,000 in 2018 [36], which equals an annual growth rate of 8.8%. The same is true for the population of the Canadian territories. The population of the Yukon Territory increased linearly from 5000 to 40,000 between 1941 and 2018 (annual growth rate of 11%) [37]. In contrast, Finland has a current annual population growth rate of 0.34% [38]. There might be multiple reasons why the north of North America is attractive to many, including industrial and mining developments. The results of this survey indicate that at least for the population group of farmers, lifestyle decisions, i.e., leaving civilisation behind for a self-sufficient life, might be a major driver. The latest technical developments, e.g., the internet and numerous possibilities to produce electricity from renewable sources, might have facilitated this trend in the last few decades. As yet there are no clear indications that these trends are directly related to climate change.
3.4. Agricultural Development
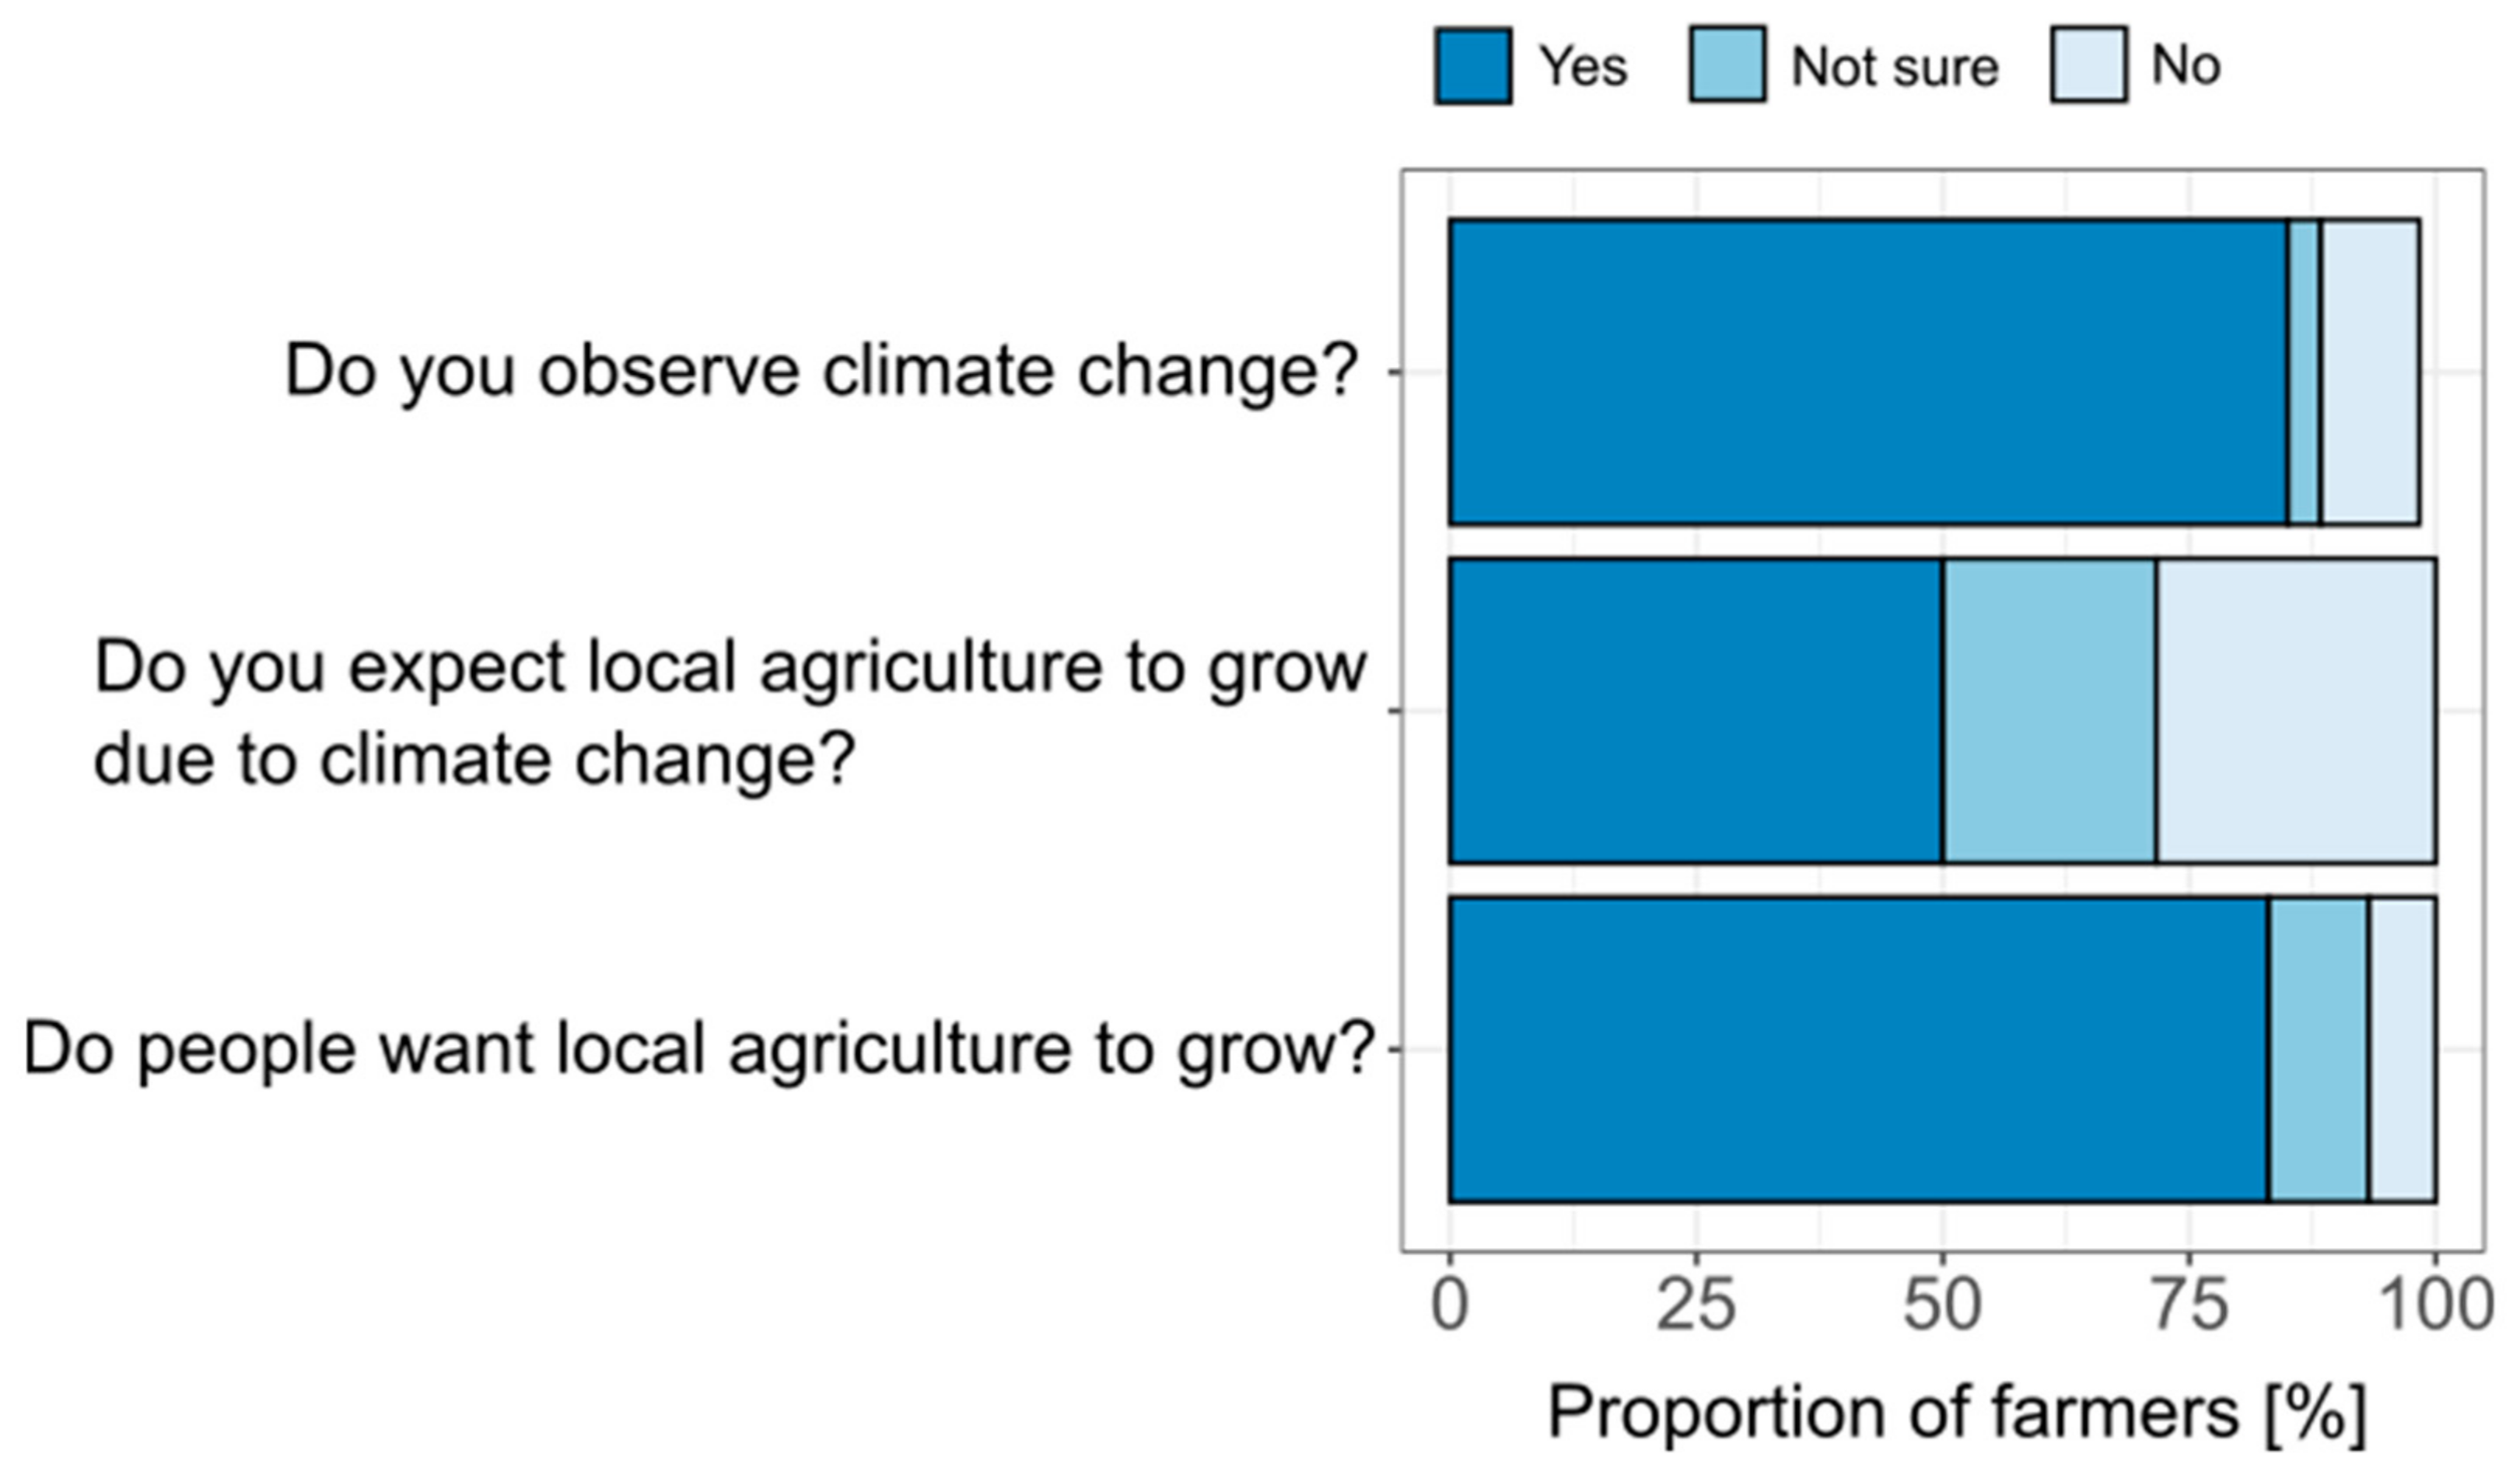
The distinct population dynamics of the investigated regions, as well as the results of this survey, suggest that further climate change-driven alterations to the agricultural sector in the Circumpolar North, at least in some regions, can be expected. In the survey, farmers were asked to predict agricultural development in their region (Figure 6). With low variation between regions, 50% of all farmers expected local agriculture to grow due to climate change, while the remaining 50% were not convinced of this. Questions about two potential main drivers of agricultural development were answered more decisively: 84% of all farmers observed climate change in their respective area and 80% estimated that people in their nearest community want local agriculture to grow (Figure 5). Furthermore, the question about the major challenge of farming north of the 60° N latitude was answered with climate-related challenges (e.g., short growing season, unpredictable frost, and cold climate) by 69%, soil-related challenges (e.g., poor soil, stones in the ground, and permafrost) by 11%, and others (lack of infrastructure, limited market, access to quality breeding stock, shipping costs, and support) by 20%. This is in contrast to the analysis of Stevenson et al. [39], who stated that socioeconomic challenges might be the greatest hindrance to agriculture in the specific case of Alaska as compared to environmental, geophysical, and biological challenges. In the present study, the short growing season was the climate-related challenge mentioned most often. For example, in Whitehorse and Dawson, the two major agricultural areas in the Yukon Territory, the average length of the frost-free season is 62 and 55 days, respectively. The length of the frost-free season is projected to increase to 116 and 100 days, respectively, in Whitehorse and Dawson in the Representative Concentration Pathway (RCP) 8.5 scenario by 2081 (https://climateatlas.ca/). Therefore, a major hurdle for agricultural production is about to disappear in the mid-term.
3.5. Perception of Climate change and Other Environmental Constraints
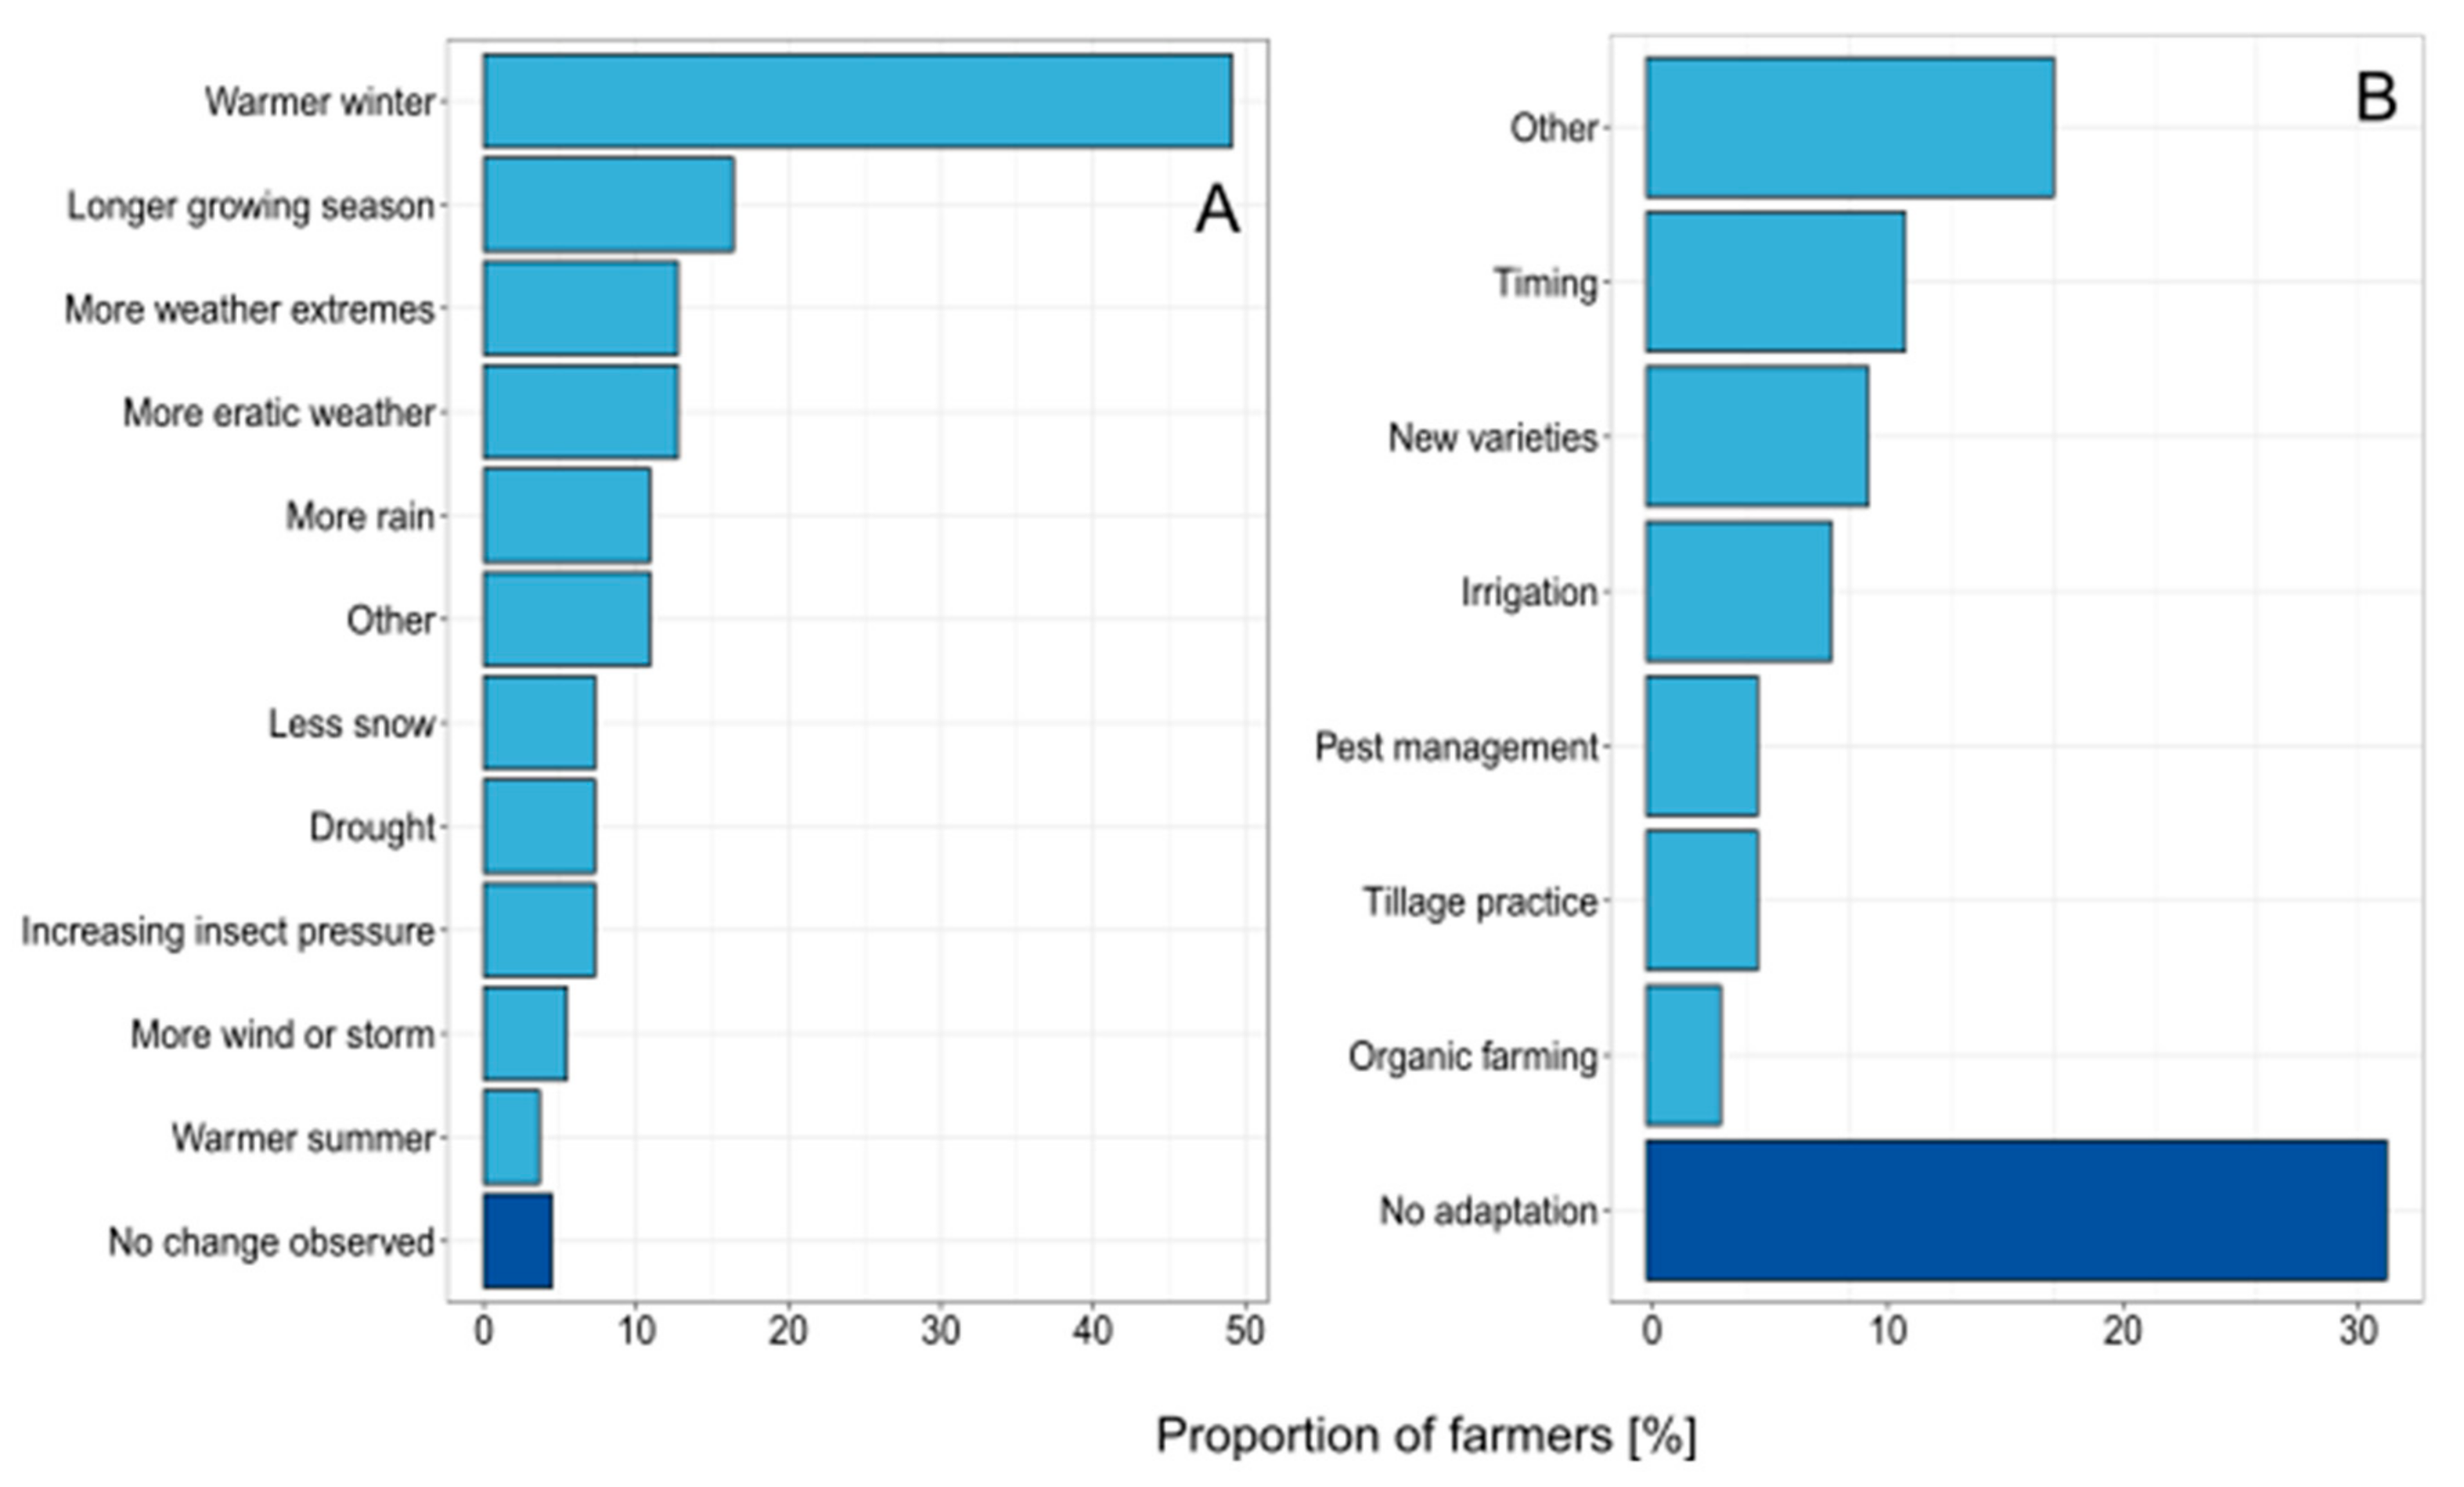
Climate change has been observed by the majority of farmers (84%). The specific change most often observed was a warmer winter (Figure 7). This is in line with several studies reporting climate change-driven changes in snow-packed conditions [40,41], but it is still remarkable that these trends are observable even without respective technological means. In contrast, only very few farmers observed warmer summers. A longer growing season, as a consequence of global warming, was the second highest response about climate change, which is in accordance with phenological data from North America and Europe [42]. As opposed to many other regions of the world, a longer growing season could indeed be beneficial for agricultural production in northern circumpolar regions [13]. More unstable weather, i.e., weather extremes and more erratic weather, were also observed by farmers.
In accordance with observed climate change, many farmers (67% of those who observed climate change) had started to adapt their farming practices. This is in line with other studies reporting farmers’ awareness of climate change and undertaken adaptation efforts [43]. The most common adaptations were ‘timing’ and ‘growing new varieties’, which again suggests generally improved conditions for diversified agricultural production in the global north. Furthermore, the implementation of irrigation as well as changes in tillage practice were mentioned as responses to increasing drought, while adjusted pest management has become necessary for some farmers due to increasing insect pressure. For both questions, no clear regional differences were observed.
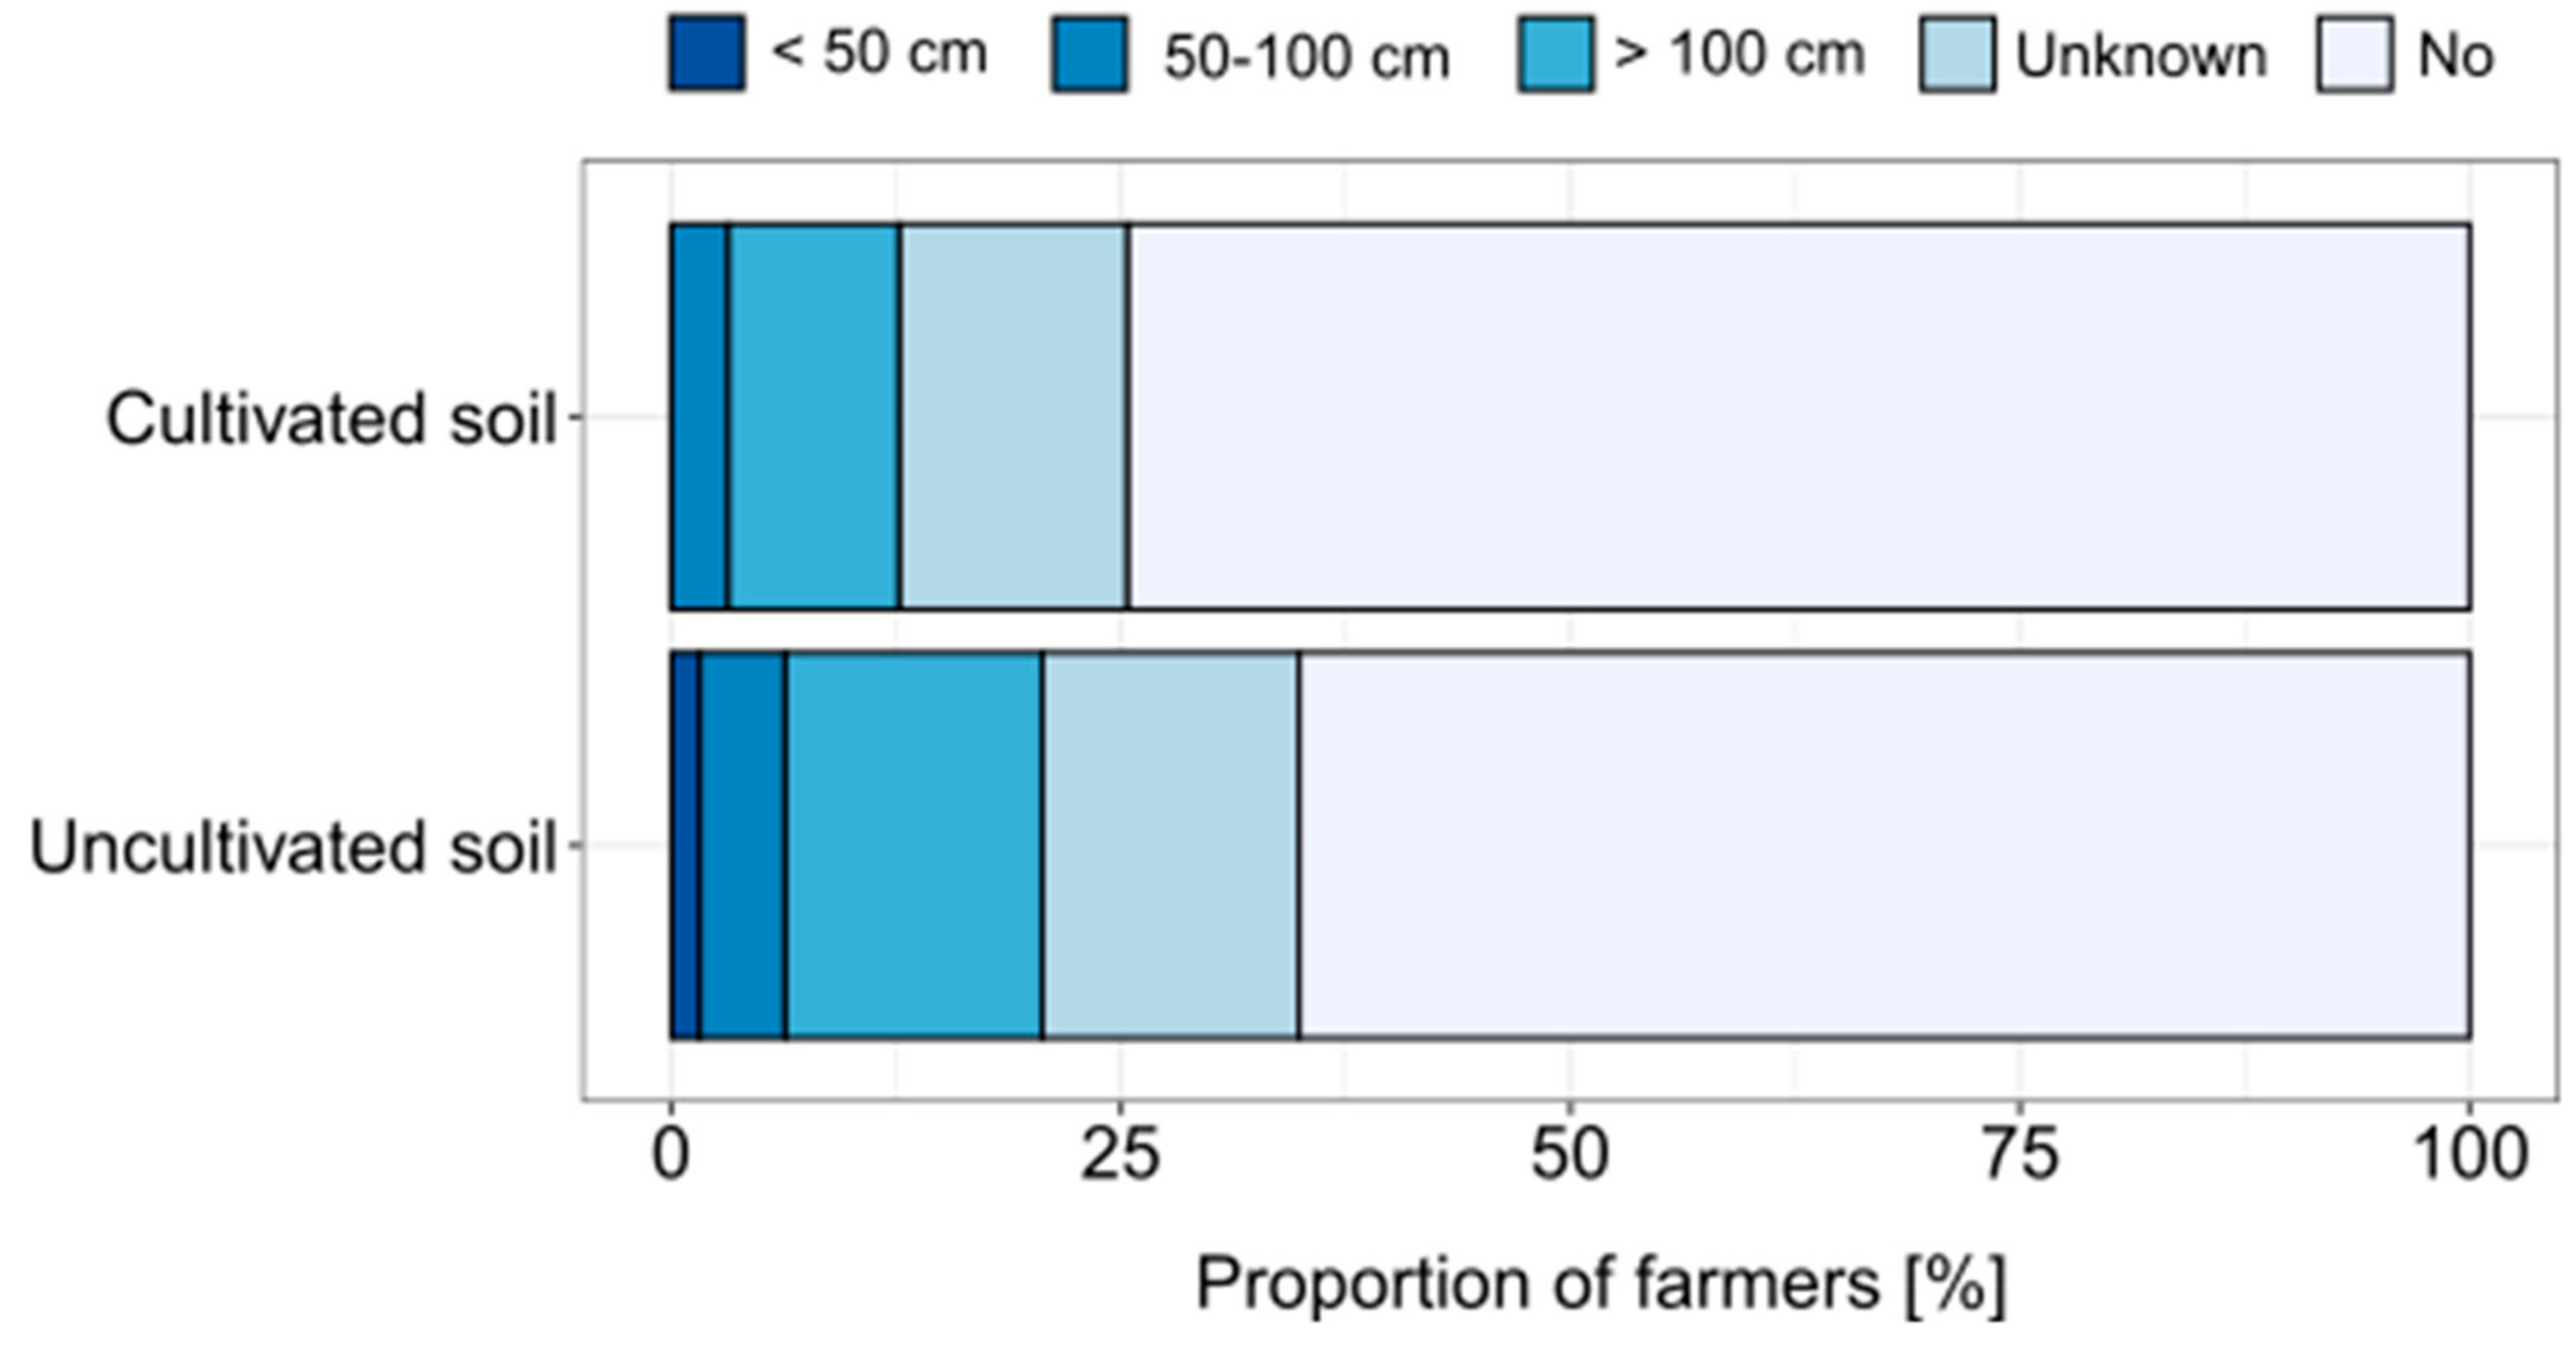
A total of 14 farmers had permafrost underlying their agricultural land or the adjacent uncultivated land. Two additional reports of permafrost from southern Finland were assumed to be unreliable due to a mean annual air temperature of >4 °C in the respective regions. For cultivated soil, 17% of all farmers reported permafrost, while for uncultivated soil, mostly under boreal forest cover, 25% of all farmers reported permafrost (Figure 8). Permafrost also tended to be shallower under uncultivated land. A direct comparison showed that 7 out of 14 farmers reported a deeper or completely thawed permafrost under cultivated land as compared to uncultivated land, while the other seven reported the same depth of permafrost for both land cover types (Table 2). Finally, 6 out of 14 farmers observed changes in the permafrost depth due to land-use change, two observed changes due to climate change, and six observed no changes in permafrost depth. Furthermore, eight farmers observed thermokarst on their land, i.e., a microrelief typical for thawing permafrost including large cracks in the soil as well as hammocks and hollows [44]. Four of these eight farmers also noticed a shallower permafrost depth (permafrost closer to the surface) in the uncultivated land. Despite a lack of statistical significance, these results suggest that permafrost thawing is accelerated by land-use change from boreal forest or shrubland to croplands or pastures. This has been suggested earlier [16] and is most likely related to changes in surface energy balance, with more direct radiation and less albedo in agricultural land. To date, such micrometeorological studies in northern circumpolar regions are restricted to natural shifts in land cover, such as shrub encroachment in the tundra [45,46]. It can also be expected that the introduction of agriculture to previously forested areas may have a strong impact on soil temperature and moisture and thus permafrost abundance and dynamics. The results of this study suggest that land-use change might even have a greater impact on permafrost thawing than climate change (Table 2); however, such perceptions might be biased by the fact that land-use change effects are more immediately visible, while climate change is a slow process with a transitional effect on permafrost thawing. Nonetheless, northern agriculture in subarctic areas of discontinuous permafrost is likely to accelerate soil biogeochemical cycles, which should be considered in situ, e.g., by adjusting farming practices or in biogeochemical models predicting carbon fluxes between land and atmosphere. To date, the research focus regarding greenhouse gas emissions and carbon loss from thawing permafrost soils has mainly been on unmanaged tundra ecosystems [47,48].
Apart from permafrost dynamics, the high abundance of peatlands in the global Circumpolar North poses a risk of increased CO2 emissions from agricultural land-use. Gorham [49] estimated a total of 449 Pg carbon being stored in northern peatland, which is expected to release large amounts of CO2 upon drainage and warming. In the present study, 39% of all farmers had peaty areas on their land. This particular aspect was not evaluated in more detail to determine the areal extent of peatland areas under cultivation or how those peatlands are currently managed. For future land development, it is important to consider peatlands as unsuitable for cropping.
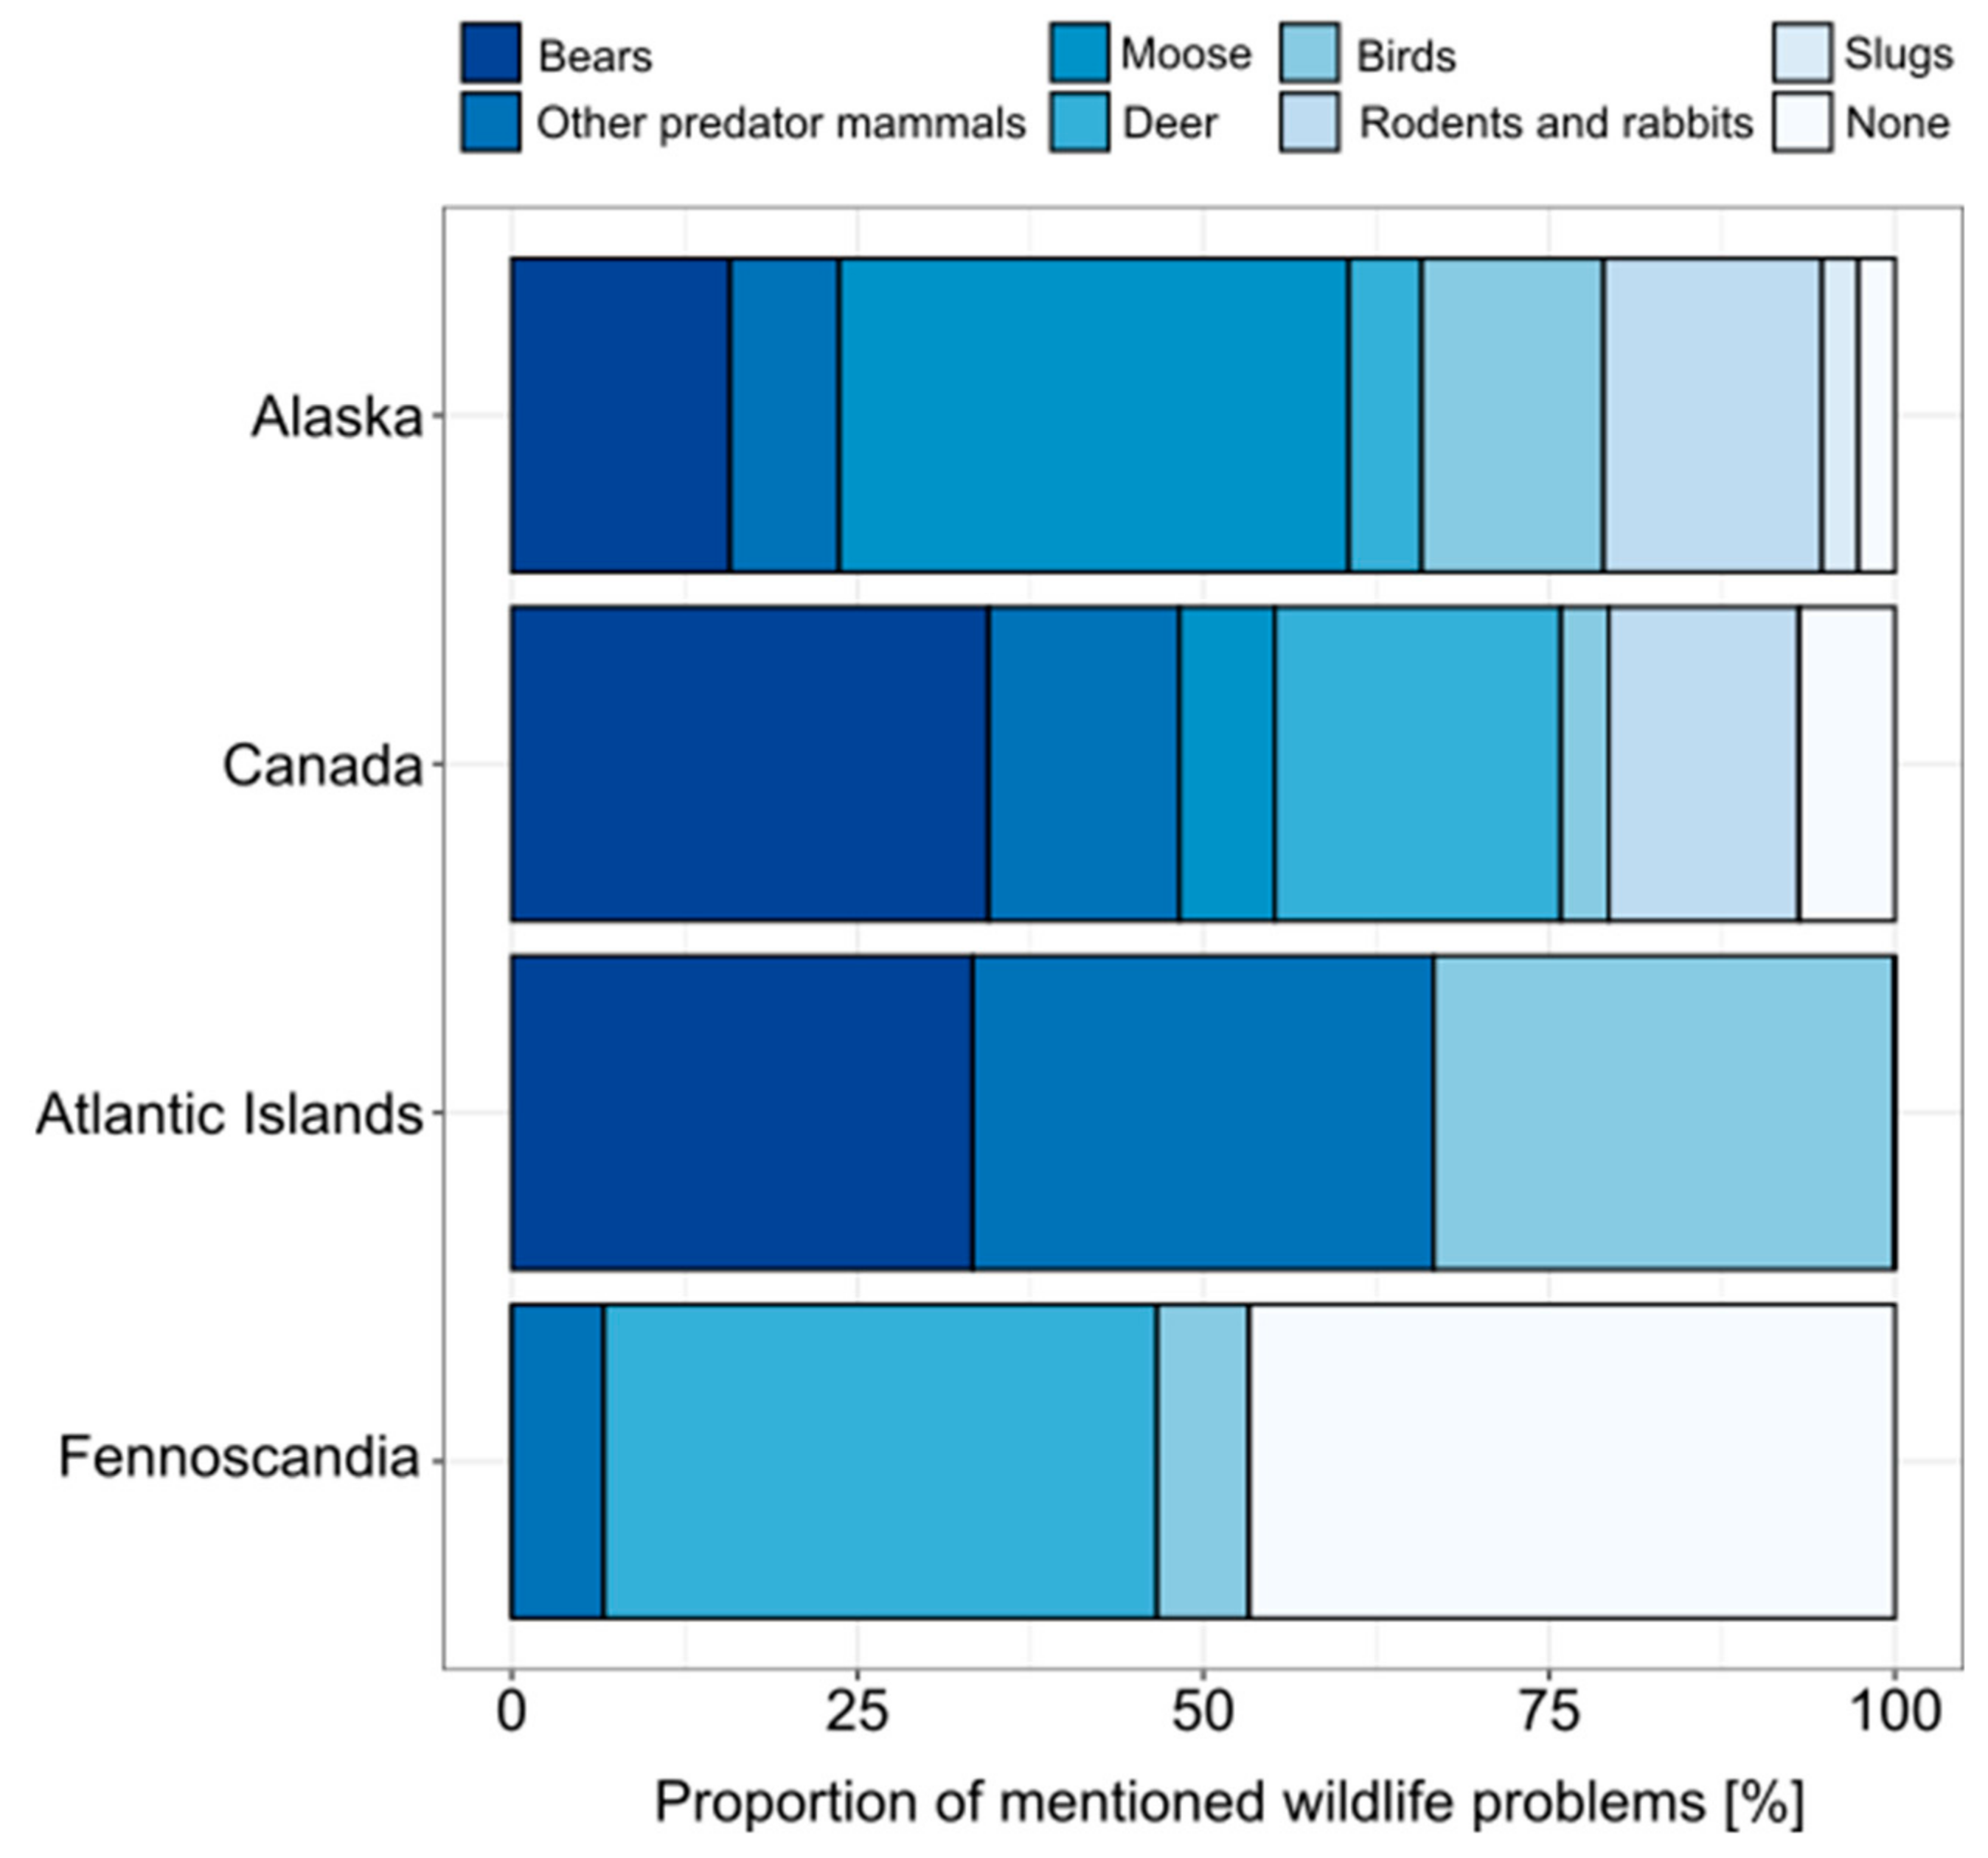
As a consequence of the remoteness and relatively small anthropogenic impact on northern circumpolar ecosystems, wildlife problems or conflicts are significantly more abundant in North America and the Atlantic Islands than in the north of Fennoscandia (Figure 9). In northern Fennoscandia, only 55% of all farmers experienced wildlife problems, with deer being the most abundant group of species. In contrast, 95% of the farmers in Alaska were facing wildlife problems. In Canada and the Atlantic Islands, bears and other predator animals were the most often mentioned group of species. This is partly related to the fact that most of the farms on the Atlantic Islands are livestock farms; however, it might also be related to the fact that agriculture development per se is an anthropogenic expansion into the natural habitat of bears and other predators. In Fennoscandia, the agricultural landscape is more developed; centuries ago, natural ecosystems were converted into managed land, with known consequences for the habitat of large mammals, such as bears [50]. In Alaska, moose was most often mentioned by farmers as being problematic. In total, only four farmers noticed a clear change in wildlife problems due to global warming. Answers given were: ‘slug eggs don’t get frozen and all can hatch’, ‘aphids have increased’, ‘deer were not here when it was colder’, and ‘polar bears coming during unusual periods’. Nonetheless, it can be summarised that climate change per se, as well as ecosystem responses to it, are being noticed by farmers and farming practices are also being adapted.
3.6. Northern Agriculture and Greenhouse Gas Emissions
Many regions in the global Circumpolar North rely on the import of food by land or sea due to a lack of local food supply. For example, Alaska is estimated to provide only five to ten percent of its food demand by in-state agriculture [51]. Long transport distances of food to those remote areas not only affect food price and quality, but also the carbon footprint of food consumption in northern communities. Despite the fact that the impact of food miles in the context of sustainable food production [52] is still being debated, local food production will strongly cut CO2 emissions related to food transportation. Moreover, a large proportion of farmers in Alaska and Canada are producing off-grid and are completely reliant on self-produced renewable energy (Figure 3). An expansion of northern agriculture to increase the proportion of locally produced food requires conversions of native land, which is generally associated with considerable soil organic matter losses and thus CO2 emissions [53]. Those losses are likely to be more pronounced when permanently frozen soil or peatland is broken and drained [54,55]. It is therefore doubtful whether the overall carbon footprint of food consumption of northern communities would be reduced by a greater food supply through local agricultural production. To assess this, more data on land-based emissions after land-use change are essential. The same is true in order to evaluate the carbon footprint of certain niche products, such as Alaskan peonies, that are or will be produced in the far north for the national or global market.
4. Conclusions
On a global scale, agriculture north of 60° N is currently of limited economic and ecological importance and restricted to a small part of the vast northern land surface. This is one likely reason for the limited understanding of the specifics of global northern agriculture. In the course of climate change, however, a northward expansion of agriculture is a likely scenario in the near future. The farmers’ survey conducted, although of limited sample size and with a certain regional bias, revealed that climate change is already being observed by farmers and adaptions are already being made. Among other management adjustments, new varieties of crops are being tested and the timing of some field operations is being changed due to longer growing seasons. In particular, in the coldest regions evaluated, i.e., Alaska and the Canadian territories, people have been immigrating in recent decades to clear land and commence small-scale farming, often beyond civilisation. This has understudied effects on the subarctic environment, including conflicts with wild animals, accelerated permafrost thawing, and greenhouse gas emissions associated with land-use change. A profound understanding of the emissions associated with land-use change is necessary to judge whether or not local food production in remote areas to partly replace expensive food imports will reduce the carbon footprint of northern food consumption.
Author Contributions
C.P. conceptualised the paper, collected and analysed the data and wrote the first draft, J.S. assisted in conceptualisation, data collection, artwork and writing, E.G. and I.K. assisted in conceptualisation and writing.
Funding
This study was funded by the German Research Foundation in the framework of the project ‘Breaking the ice— Consequences of northwards extending agriculture for soil organic matter cycling under a changing climate’.
Acknowledgments
We are grateful to all farmers who participated in this survey.
Conflicts of Interest
The authors declare no conflict of interest.
Data Availability Statement
The whole questionnaire including raw data is accessible via doi 10.17605/OSF.IO/J9TY5.
References
- Kummu, M.; Varis, O. The world by latitudes: A global analysis of human population, development level and environment across the north–south axis over the past half century. Appl. Geogr. 2011, 31, 495–507. [Google Scholar] [CrossRef]
- Ping, C.L. Cold-region soils. In Encyclopedia of Soils in the Environment; Hillel, D., Ed.; Elsevier: Oxford, UK, 2005; pp. 268–276. [Google Scholar]
- USDA. USDA’s National Agricultural Statistics Service—Alaska Field Office (Part of the Northwest Regional Field Office). 2019. Available online: https://www.nass.usda.gov/Statistics_by_State/Alaska/index.php (accessed on 2 December 2019).
- EEA. Landscapes in Transition-An Account of 25 Years of Land Cover Change in Europe; EEA: Luxembourg, 2017. [Google Scholar]
- Dale, V.H. The relationship between land-use change and climate change. Ecol. Appl. 1997, 7, 753–769. [Google Scholar] [CrossRef]
- Rosenzweig, C.; Iglesias, A.; Yang, X.-B.; Epstein, P.R.; Chivian, E. Climate change and extreme weather events; implications for food production, plant diseases, and pests. Glob. Chang. Hum. Health 2001, 2, 90–104. [Google Scholar] [CrossRef]
- IPCC. Climate Change 2013: The Physical Science Basis. Contribution of Working Group I to the Fifth Assessment Report of the Intergovernmental Panel on Climate Change; Stocker, T.F., Qin, D., Plattner, G.-K., Tignor, M.M.B., Allen, S.K., Boschung, J., Nauels, A., Xia, Y., Bex, V., Midgley, P.M., Eds.; Cambridge University Press: Cambridge, UK; New York, NY, USA, 2013; p. 1535. [Google Scholar]
- Hovelsrud, G.K.; Poppel, B.; van Oort, B.; Reist, J.D. Arctic Societies, Cultures, and Peoples in a Changing Cryosphere. Ambio 2011, 40, 100–110. [Google Scholar] [CrossRef] [Green Version]
- Nobel, J. Farming in the Arctic: It Can Be Done. In Modern Farmer. 2013. Available online: https://modernfarmer.com/2013/2010/arctic-farming/ (accessed on 28 August 2019).
- Di Salvo, M. Greenland reaps benefits of global warming. Independent. 2013. Available online: https://www.independent.co.uk/environment/climate-change/greenland-reaps-benefits-of-global-warming-8555241.html (accessed on 28 August 2019).
- Beck, H.E.; Zimmermann, N.E.; McVicar, T.R.; Vergopolan, N.; Berg, A.; Wood, E.F. Present and future Köppen-Geiger climate classification maps at 1-km resolution. Sci. Data 2018, 5, 180214. [Google Scholar] [CrossRef] [PubMed] [Green Version]
- Tchebakova, N.; Parfenova, E.; Lysanova, G.; Soja, A. Agroclimatic potential across central Siberia in an altered twenty-first century. Environ. Res. Lett. 2011, 6, 045207. [Google Scholar] [CrossRef]
- Rosenzweig, C.; Parry, M.L. Potential impact of climate change on world food supply. Nature 1994, 367, 133–138. [Google Scholar] [CrossRef]
- Katsov, V.; Semenov, S.; Alekseev, G.; Ananicheva, M. Second Roshydromet Assessment Report on Climate Change and its Consequences in the Russian Federation. Mosc. Roshydromet 2014. [Google Scholar]
- Schaefer, K.; Zhang, T.; Bruhwiler, L.; Barrett, A.P. Amount and timing of permafrost carbon release in response to climate warming. Tellus B 2011, 63, 165–180. [Google Scholar] [CrossRef]
- Grünzweig, J.M.; Valentine, D.W.; Chapin, F.S. Successional Changes in Carbon Stocks After Logging and Deforestation for Agriculture in Interior Alaska: Implications for Boreal Climate Feedbacks. Ecosystems 2015, 18, 132–145. [Google Scholar] [CrossRef]
- Lambin, E.F.; Meyfroidt, P. Land use transitions: Socio-ecological feedback versus socio-economic change. Land Use Policy 2010, 27, 108–118. [Google Scholar] [CrossRef]
- Kuhnlein, H.V.; Receveur, O.; Soueida, R.; Egeland, G.M. Arctic indigenous peoples experience the nutrition transition with changing dietary patterns and obesity. J. Nutr. 2004, 134, 1447–1453. [Google Scholar] [CrossRef] [PubMed]
- Kuhnlein, H.V. Benefits and risks of traditional food for Indigenous Peoples: Focus on dietary intakes of Arctic men. Can. J. Phys. Pharmacol. 1995, 73, 765–771. [Google Scholar] [CrossRef] [PubMed]
- Chen, A.; Natcher, D. Greening Canada’s Arctic food system: Local food procurement strategies for combating food insecurity. Can. Food Stud. 2019, 6, 140–154. [Google Scholar] [CrossRef] [Green Version]
- Egeland, G.M.; Pacey, A.; Cao, Z.; Sobol, I. Food insecurity among Inuit preschoolers: Nunavut Inuit Child Health Survey, 2007–2008. Can. Med. Assoc. J. 2010, 182, 243–248. [Google Scholar] [CrossRef] [PubMed] [Green Version]
- Kumpula, T.; Pajunen, A.; Kaarlejärvi, E.; Forbes, B.C.; Stammler, F. Land use and land cover change in Arctic Russia: Ecological and social implications of industrial development. Glob. Environ. Chang. 2011, 21, 550–562. [Google Scholar] [CrossRef]
- Leiner, D.J. SoSCi Survey (Version 3.1.06). Available online: https://www.soscisurvey.de/ (accessed on 10 January 2019).
- Fischer, G.; Nachtergaele, F.O.; Prieler, S.; Teixeira, E.; Tóth, G.; Van Velthuizen, H.; Verelst, L.; Wiberg, D. Global Agro-Ecological Zones (GAEZ v3. 0)-Model Documentation; IIASA: Laxenburg, Austria; FAO: Rome, Italy, 2012. [Google Scholar]
- McHugh, M.L. The chi-square test of independence. Biochem. Med. 2013, 23, 143–149. [Google Scholar] [CrossRef] [Green Version]
- Dalgaard, P. R Development Core Team R: A language and Environment for Statistical Computing; R Foundation for Statistical Computing: Vienna, Austria, 2010. [Google Scholar]
- Francis, K.E. Outpost Agriculture: The Case of Alaska. Geogr. Rev. 1967, 57, 496–505. [Google Scholar] [CrossRef]
- Auer, J.D.; Holloway, P.S. An Introduction to Harvesting and Selling Alaska Cut Flower Peonies; Agricultural and Forestry Experiment Station: Fairbanks, AK, USA, 2008. [Google Scholar]
- Government of Yukon. Yukon Agriculture State of the Industry Report; Government of Yukon, Department of Energy, Mines and Resources, Agricultural Branch: Whitehorse, YT, Canada, 2018.
- Hermanns-Audardóttir, M. The Early Settlement of Iceland. Results based on excavations of a Merovingian and Viking farm site at herjólfsdalur in the westman islands, Iceland. Nor. Archaeol. Rev. 1991, 24, 1–9. [Google Scholar] [CrossRef]
- Statistics Norway. 2019. Available online: https://www.ssb.no/en/jord-skog-jakt-og-fiskeri (accessed on 2 September 2019).
- Statistics Finland. 2019. Available online: https://www.stat.fi/til/maa_en.html (accessed on 2 September 2019).
- Statistics Sweden. 2019. Available online: http://www.statistikdatabasen.scb.se/pxweb/en/ssd/ (accessed on 2 September 2019).
- Rosstat. Regions of Russia, Socio-economic Indicators. Available online: www.gks.ru (accessed on 25 September 2019).
- Butrico, G.M.; Kaplan, D.H. Greenhouse Agriculture in the Icelandic Food System. Eur. Countrys. 2018, 10, 711–724. [Google Scholar] [CrossRef] [Green Version]
- State of Alaska. Department of Labor and Workforce Development. Research and Analysis, 2019. Available online: http://live.laborstats.alaska.gov/pop/ (accessed on 2 October 2019).
- World Population Review. 2019. Available online: http://worldpopulationreview.com/canadian-provinces/yukon-population/ (accessed on 2 October 2019).
- World Population Review. 2019. Available online: http://worldpopulationreview.com/countries/finland-population/ (accessed on 2 October 2019).
- Stevenson, K.T.; Rader, H.B.; Alessa, L.; Kliskey, A.D.; Pantoja, A.; Clark, M.; Smeenk, J.; Giguère, N. Sustainable agriculture for Alaska and the circumpolar North: Part II. Environmental, geophysical, biological and socioeconomic challenges. Arctic 2014, 67, 296–319. [Google Scholar] [CrossRef] [Green Version]
- Mote, P.W. Climate-Driven Variability and Trends in Mountain Snowpack in Western North America. J. Clim. 2006, 19, 6209–6220. [Google Scholar] [CrossRef]
- Marshall, A.M.; Abatzoglou, J.T.; Link, T.E.; Tennant, C.J. Projected Changes in Interannual Variability of Peak Snowpack Amount and Timing in the Western United States. Geophys. Res. Lett. 2019, 46. [Google Scholar] [CrossRef] [Green Version]
- Hogda, K.A.; Karlsen, S.R.; Solheim, I. Climatic change impact on growing season in Fennoscandia studied by a time series of NOAA AVHRR NDVI data. Scanning the Present and Resolving the Future. In Proceedings of the IEEE 2001 International Geoscience and Remote Sensing Symposium (Cat. No. 01CH37217), Sydney, Australia, 9–13 July 2001; pp. 1338–1340. [Google Scholar]
- Ricart, S.; Olcina, J.; Rico, A.M. Evaluating public attitudes and farmers’ beliefs towards climate change adaptation: Awareness, perception, and populism at European level. Land 2019, 8, 4. [Google Scholar] [CrossRef] [Green Version]
- Burn, C.R.; Smith, M. Development of thermokarst lakes during the Holocene at sites near Mayo, Yukon Territory. Permafr. Periglac. Process. 1990, 1, 161–175. [Google Scholar] [CrossRef]
- Eugster, W.; Rouse, W.R.; Pielke Sr, R.A.; McFadden, J.P.; Baldocchi, D.D.; Kittel, T.G.F.; Chapin, F.S.; Liston, G.E.; Vidale, P.L.; Vaganov, E.; et al. Land–atmosphere energy exchange in Arctic tundra and boreal forest: Available data and feedbacks to climate. Glob. Chang. Biol. 2000, 6, 84–115. [Google Scholar] [CrossRef]
- Euskirchen, E.; Bennett, A.; Breen, A.; Genet, H.; Lindgren, M.; Kurkowski, T.; McGuire, A.; Rupp, T. Consequences of changes in vegetation and snow cover for climate feedbacks in Alaska and northwest Canada. Environ. Res. Lett. 2016, 11, 105003. [Google Scholar] [CrossRef]
- Schuur, E.A.; Vogel, J.G.; Crummer, K.G.; Lee, H.; Sickman, J.O.; Osterkamp, T. The effect of permafrost thaw on old carbon release and net carbon exchange from tundra. Nature 2009, 459, 556. [Google Scholar] [CrossRef]
- Koven, C.D.; Ringeval, B.; Friedlingstein, P.; Ciais, P.; Cadule, P.; Khvorostyanov, D.; Krinner, G.; Tarnocai, C. Permafrost carbon-climate feedbacks accelerate global warming. Proc. Natl. Acad. Sci. USA 2011, 108, 14769–14774. [Google Scholar] [CrossRef] [Green Version]
- Gorham, E. Northern Peatlands: Role in the Carbon Cycle and Probable Responses to Climatic Warming. Ecol. Appl. 1991, 1, 182–195. [Google Scholar] [CrossRef]
- Mattson, D.J. Human Impacts on Bear Habitat Use. Bears: Their Biology and Management. Bears Their Biol. Manag. 1990, 8, 33–56. [Google Scholar] [CrossRef]
- Fazzino, D.V.; Loring, P.A. From crisis to cumulative effects: Food security challenges in Alaska. Napa Bull. 2009, 32, 152–177. [Google Scholar] [CrossRef]
- Coley, D.; Howard, M.; Winter, M. Local food, food miles and carbon emissions: A comparison of farm shop and mass distribution approaches. Food Policy 2009, 34, 150–155. [Google Scholar] [CrossRef]
- Poeplau, C.; Don, A.; Vesterdal, L.; Leifeld, J.; Van Wesemael, B.; Schumacher, J.; Gensior, A. Temporal dynamics of soil organic carbon after land-use change in the temperate zone—Carbon response functions as a model approach. Glob. Chang. Biol. 2011, 17, 2415–2427. [Google Scholar] [CrossRef]
- Grünzweig, J.M.; Sparrow, S.D.; Chapin, F.S. Impact of forest conversion to agriculture on carbon and nitrogen mineralization in subarctic Alaska. Biogeochemistry 2003, 64, 271–296. [Google Scholar] [CrossRef]
- Tiemeyer, B.; Albiac Borraz, E.; Augustin, J.; Bechtold, M.; Beetz, S.; Beyer, C.; Drösler, M.; Ebli, M.; Eickenscheidt, T.; Fiedler, S. High emissions of greenhouse gases from grasslands on peat and other organic soils. Glob. Chang. Biol. 2016, 22, 4134–4149. [Google Scholar] [CrossRef]
Figure 1.
Map of the Circumpolar North, with circles indicating the approximate location of the farms that contributed to the survey.
Figure 1.
Map of the Circumpolar North, with circles indicating the approximate location of the farms that contributed to the survey.

Figure 2.
Proportions of (A) farm type (answered by all farmers) and (B) the major crop (answered by 66 out of 67 farmers) of each farm for all regions (chi-squared p < 0.001 for A and B). In A, the category ‘other’ comprised flower farm, plant nursery, tree fruits and berries farm, and medicinal herbs farm.

Figure 3.
(A) Distance to the next settlement (answered by 62 out of 67 farmers), (B) proportion of farms with a community power supply (answered by all farmers contributing to the survey), (C) proportion of farms with their own renewable energy (answered by all farmers), and (D) proportion of farms using a greenhouse for part of the agricultural production for all regions (answered by 66 out of 67 farmers). Dashed line indicates the average value of all farms. In plot A, diamonds indicate mean values for each region and the filled circle indicates an outlier.

Figure 4.
Bar charts showing (A) what kind of agricultural education the farmers had (answered by 63 out of 67 farmers) and (B) the reasons for farming north of the 60° N latitude (answered by 60 out of 67 farmers). Pearson’s chi-squared test was significant with p < 0.001 for (A,B). For (A), ‘other’ comprised different answers such as ‘lifelong interest in growing’, ‘exposed to grandparents’ farm’, ‘different internships’, ‘extensive literature studies’, and ‘jobs on farms’; for (B), categories were formed after grouping all given answers (open text). Answers such as ‘it’s my home’, ‘I live here’, and ‘family farm since 1920’ were summarised as ‘family roots’; answers such as ‘I love farming’, ‘we love living here, wild untrampled land’, and ‘I love where I live’ were summarised as ‘lifestyle’; and the category ‘other’ comprised answers such as ‘unique peony season’, ‘grow cold weather flowers’, or ‘because we need the farmers here’.

Figure 5.
Average time since conversion of native land (57 out of 67 farmers) plotted against the average proportion of farmers originating from the region (66 out of 67 farmers) with error bars indicating standard deviations.
Figure 5.
Average time since conversion of native land (57 out of 67 farmers) plotted against the average proportion of farmers originating from the region (66 out of 67 farmers) with error bars indicating standard deviations.

Figure 6.
Proportion of responses to different questions related to farmers’ perception of climate change and agricultural development. These questions were answered by 61 (question 1), 63 (question 2), and 61 (question 3) out of 67 farmers, respectively.
Figure 6.
Proportion of responses to different questions related to farmers’ perception of climate change and agricultural development. These questions were answered by 61 (question 1), 63 (question 2), and 61 (question 3) out of 67 farmers, respectively.

Figure 7.
Bar plots showing (A) the proportion of farmers observing a specific change (or no change) in weather, potentially as a feature of climate change (58 out of 67 farmers) and (B) the proportion of farmers observing climate change and adapting (or not) their farming practices (answered by 58 out of 67 farmers). In (A), the category ‘other’ comprised ‘visually’, ‘wetter summers’, ‘later winter’, ‘glaciers melting’, ‘sea star wasting disease’, and ‘occasional infestations of cutworms and grasshoppers not seen before’. In (B), the category ‘other’ comprised ‘more mulching in wintertime’, ‘hydroponics’, ‘still learn’, ‘try to observe more carefully’, ‘better drainage’, and ‘change from wrapped bales to bunkers’.

Figure 8.
Proportion of farmers observing a certain depth of permafrost for cultivated and adjacent uncultivated soils (63 out of 67 farmers, Pearson’s chi-squared test p = 0.68).
Figure 8.
Proportion of farmers observing a certain depth of permafrost for cultivated and adjacent uncultivated soils (63 out of 67 farmers, Pearson’s chi-squared test p = 0.68).

Figure 9.
Proportion of problems with specific types of wildlife experienced by farmers in all regions (61 out of 67 farmers, Pearson’s chi-squared test p < 0.001).
Figure 9.
Proportion of problems with specific types of wildlife experienced by farmers in all regions (61 out of 67 farmers, Pearson’s chi-squared test p < 0.001).


Table 1.
Regional coverage of the dataset with numbers of farmers participating in the survey (n), average mean annual temperature (MAT, °C) and average mean annual precipitation (MAP, mm) with standard deviations, length of the growing period (LGP, number of days per year, as derived from the Food and Agricultural Organization of the United Nations (FAO) classification of global agro-ecological zones [24]), abundance of certain soil texture classes (sandy, loamy, or clayey; number of answers in the survey), and abundance of peat on the farmed area (number of answers in the survey).
| Region | Subregion | n | MAT | MAP | LGP | Sandy | Loamy | Clayey | Peat |
|---|---|---|---|---|---|---|---|---|---|
| Alaska | Alaska | 23 | 2.2 ± 2.2 | 762 ± 691 | 90–149 | 9 | 9 | 4 | 8 |
| Canada | Yukon Territory | 15 | –1.7 ± 1.6 | 286 ± 23 | 60–119 | 5 | 4 | 6 | 5 |
| Northwest Territories | 3 | –4.8 ± 1.6 | 303 ± 40 | 90–119 | 1 | - | - | 1 | |
| Atlantic Islands | Iceland | 4 | 4.8 ± 0.3 | 1060 ± 249 | 90–149 | 2 | 2 | - | 2 |
| Greenland | 1 | 0.2 | 888 | 90–149 | 1 | - | - | 1 | |
| Faroe Islands | 1 | 5.4 | 1478 | 180–209 | - | 1 | - | 1 | |
| Fennoscandia | Finland | 15 | 3.8 ± 1.0 | 607 ± 49 | 120–179 | 2 | 6 | 4 | 5 |
| Sweden | 2 | 3.6 ± 1.7 | 685 ± 355 | 120–179 | - | 2 | - | 1 | |
| Norway | 3 | 3.5 ± 4.4 | 1163 ± 877 | 120–179 | 1 | 2 | - | 1 | |
| Total | 67 | 1.6 ± 3.1 | 642 ± 510 | 60–209 | 21 | 26 | 14 | 25 |
Table 2.
Summary of the survey questions on permafrost depth in cultivated and uncultivated land and the observed changes in permafrost depth and its drivers. Only farms with realistic permafrost abundance were evaluated (n = 14). Answers are given in total counts and relative proportion.
Table 2.
Summary of the survey questions on permafrost depth in cultivated and uncultivated land and the observed changes in permafrost depth and its drivers. Only farms with realistic permafrost abundance were evaluated (n = 14). Answers are given in total counts and relative proportion.
| Topic | Answer | Total | % |
|---|---|---|---|
| Land-use effect on permafrost | Deeper permafrost in cultivated land | 7 | 50 |
| Equal permafrost in cultivated and native land | 7 | 50 | |
| Observed change in permafrost depth | Yes, due to land-use change | 6 | 43 |
| Yes, due to climate change | 2 | 14 | |
| No | 6 | 43 |
© 2019 by the authors. Licensee MDPI, Basel, Switzerland. This article is an open access article distributed under the terms and conditions of the Creative Commons Attribution (CC BY) license (http://creativecommons.org/licenses/by/4.0/).
Share and Cite
MDPI and ACS Style
Poeplau, C.; Schroeder, J.; Gregorich, E.; Kurganova, I. Farmers’ Perspective on Agriculture and Environmental Change in the Circumpolar North of Europe and America. Land 2019, 8, 190. https://0-doi-org.brum.beds.ac.uk/10.3390/land8120190
AMA Style
Poeplau C, Schroeder J, Gregorich E, Kurganova I. Farmers’ Perspective on Agriculture and Environmental Change in the Circumpolar North of Europe and America. Land. 2019; 8(12):190. https://0-doi-org.brum.beds.ac.uk/10.3390/land8120190
Chicago/Turabian StylePoeplau, Christopher, Julia Schroeder, Ed Gregorich, and Irina Kurganova. 2019. "Farmers’ Perspective on Agriculture and Environmental Change in the Circumpolar North of Europe and America" Land 8, no. 12: 190. https://0-doi-org.brum.beds.ac.uk/10.3390/land8120190
Note that from the first issue of 2016, this journal uses article numbers instead of page numbers. See further details here.