Assessing Riyadh’s Urban Change Utilizing High-Resolution Imagery


1
King Abdulaziz University, Al Ehtifalat Street, Jeddah 21589, Saudi Arabia
2
Geospatial Information Sciences, School of Economic, Political and Policy Sciences, The University of Texas at Dallas, 800 W Campbell Road, Richardson, TX 75080, USA
*
Author to whom correspondence should be addressed.
Land 2019, 8(12), 193; https://0-doi-org.brum.beds.ac.uk/10.3390/land8120193
Submission received: 28 October 2019
/
Revised: 3 December 2019
/
Accepted: 3 December 2019
/
Published: 13 December 2019
Abstract
:The implications of change on local processes have attracted significant research interest in recent times. In urban settings, green spaces and forests have attracted much attention. Here, we present an assessment of change within the predominantly desert Middle Eastern city of Riyadh, an understudied setting. We utilized high-resolution SPOT 5 data and two classification techniques—maximum likelihood classification and object-oriented classification—to study the changes in Riyadh between 2004 and 2014. Imagery classification was completed with training data obtained from the SPOT 5 dataset, and an accuracy assessment was completed through a combination of field surveys and an application developed in ESRI Survey 123 tool. The Survey 123 tool allowed residents of Riyadh to present their views on land cover for the 2004 and 2014 imagery. Our analysis showed that soil or ‘desert’ areas were converted to roads and buildings to accommodate for Riyadh’s rapidly growing population. The object-oriented classifier provided higher overall accuracy than the maximum likelihood classifier (74.71% and 73.79% vs. 92.36% and 90.77% for 2004 and 2014). Our work provides insights into the changes within a desert environment and establishes a foundation for understanding change in this understudied setting.
1. Introduction
Change at various scales, and the implications for local-level processes, has attracted significant research interest in recent times [1,2]. Within urban settings, change has received a significant amount of attention over the past decade or so, with urban forests and green spaces the primary focus [3,4,5]. Our ability to keep track of change within urban settings has been enhanced by the rapid development of remote sensing technology and the associated high-resolution data they make available [6,7,8]. Simultaneously, the scientific community has developed data analysis methods and tools that have allowed for the extraction of timely information on urban processes [2,9,10,11,12,13,14,15,16,17,18,19,20]. In fact, the availability of data and methods for urban landscapes is now providing scholars with the ability to use spatially referenced data and analysis methods to predict urban change processes [21], and to respond to challenges related to environmental and ecological sustainability within urban centers [22]. However, while significant progress has been made in mapping urban changes and predicting urban growth [20], the diversity of urban processes seen across the globe and the factors that drive urban change have left several geographical areas underexplored. For example, while urban green spaces and forests have been widely covered, changes within desert environments have been underassessed.
Urbanization is a global phenomenon that has varied rates and trends across geographical regions [23]. As a socioeconomic process, urbanization is dynamic and transforms the rural landscape [24]. Due to the physical and morphological conditions, economic state, population growth, political situation, policies, and social behaviors that vary from one region to another, predicting patterns of urban growth is complicated [25]. Nevertheless, significant progress has been made in understanding urban processes, including the importance of performing spatiotemporal analyses of urban growth to understand the characteristics and consequences of growth and how this is manifested from one location to another [8,21,25,26,27,28,29,30,31]. One of the critical factors that have emerged from recent studies in urban processes and change is that in trying to understanding future growth within urban centers, it is critical to first understand and document the physical conditions within a city. Despite the significant progress made in understanding urban growth, our knowledge of urban change has not been uniform across all settings, a fact especially manifested in the states of the Middle East and North Africa.
The urban centers of the Middle East and North Africa are undergoing rapid transformation, including significant growth in the youth population, and an urbanization trend that will result in large numbers of people settling in major cities [30]. Still, the analysis of the changes occurring within Middle Eastern cities remains incomplete. This is particularly critical as the territory of the Middle East and North Africa is 11.2 million km2—larger than the United States (9.8 million km2), China (9.5 million km2), and the European Union (4.3 million km2). To date, only a few studies have focused on urban processes and change within the Middle East. Among the studies completed in the region was the work of Aljoufie et al. [8], who used cellular automata-based land-use and transport data to examine change in the Saudi Arabian city of Jeddah. Nevertheless, the critical economic processes that make studying cities critical—population growth, political situations, and policies [25]—across the globe are relevant to the Middle East. For instance, Hasbani [32] posited that, between 2006 and 2013, GDP in the Middle East grew by 43% compared to 20% in the USA and 15% in the EU. During the same period, the population grew by 10%, compared to a population growth of 7% in the USA and 4% in the EU and China. Furthermore, Hasbani [32] predicted that the population of the Middle East would double in the next 30 years. When coupled with the fact that the GDP of the region accounts for 4% of global GDP and that this is expected to grow at a rate of 4% per annum, it is critical that efforts be made to understand the region’s major cities and their growth. This paper sets out to provide insights into change within one of the Middle East’s major and fastest-growing cities—Riyadh—and provide an assessment of the general status of change within the city over a 10-year period.
Riyadh is Saudi Arabia’s capital city, and over the years it has experienced a substantial amount of change. Riyadh has been identified as one of the fastest-growing cities in Saudi Arabia, recording a doubling of its population—from 4 million in 2004 to 8 million in 2016 [33]. Due to the rate of growth observed in Riyadh, the city is now recognized as one of the fastest-growing in the world by population [34], and the recent focus and policy development by the Saudi government to transition to a new economy [35] will more than likely see continued growth.
Despite the high level of historical change within Riyadh, only a few studies have been completed to examine its growth. Al-Sahhaf [36] used SPOT 4 data to examine the changes between 1994 and 1999, while Alqurashi et al. [9] used Landsat TM data to examine change between 1985 and 2014. Although both studies showed urban expansion in Riyadh, they lacked a sufficiently long timeframe to fully appreciate the changes taking place within the city at a time of rapid population growth. Furthermore, given Thapa and Murayama’s [25] observation of the need for spatiotemporal analysis of urban centers, this paper seeks to establish a basis for understanding past change, while allowing for future projections to be made. With the foregoing in mind, the overarching goal of this paper was to examine and quantify growth in Riyadh over the period 2004–2014. This timeframe coincided with a period of high population growth and allowed for the determination of whether urban expansion occurred simultaneously. We hypothesized that, as Riyadh’s population grew, urban areas, as measured through impervious surfaces, would have increased similarly to keep pace with the need for housing and transportation. Therefore, we expected the sand or desert areas of Riyadh to be converted to impervious surfaces. Specifically, this paper set out to address the overarching question of what aspects of Riyadh’s urban landscape changed over the period under consideration and what such changes suggest for future growth in the city. Our analysis utilized high spatial resolution SPOT 5 data, and we compared the performance of two imagery classification approaches, the maximum likelihood classifier (MLC) and an object-oriented classifier (OOC). Despite the existence of two previous studies [9,36] on Riyadh, reference data on land cover to aid in completing a classification were not publicly available. To remedy this situation, our study used a GIS tool, ESRI’s Survey 123 data collector, to engage local people to understand how they perceived change in Riyadh. Consequently, through a low-cost method we engaged Riyadh’s citizens to collect reference data to assess change in the city. Following this introduction, we provide an overview of Riyadh and the changes observed over the years, a description of the methods employed, and an overview of our findings. Our paper lays the foundation for studying finer-scale change within Riyadh and understanding how economic and social drivers influence such change and urban growth.
2. Materials and Methods
2.1. Study Area
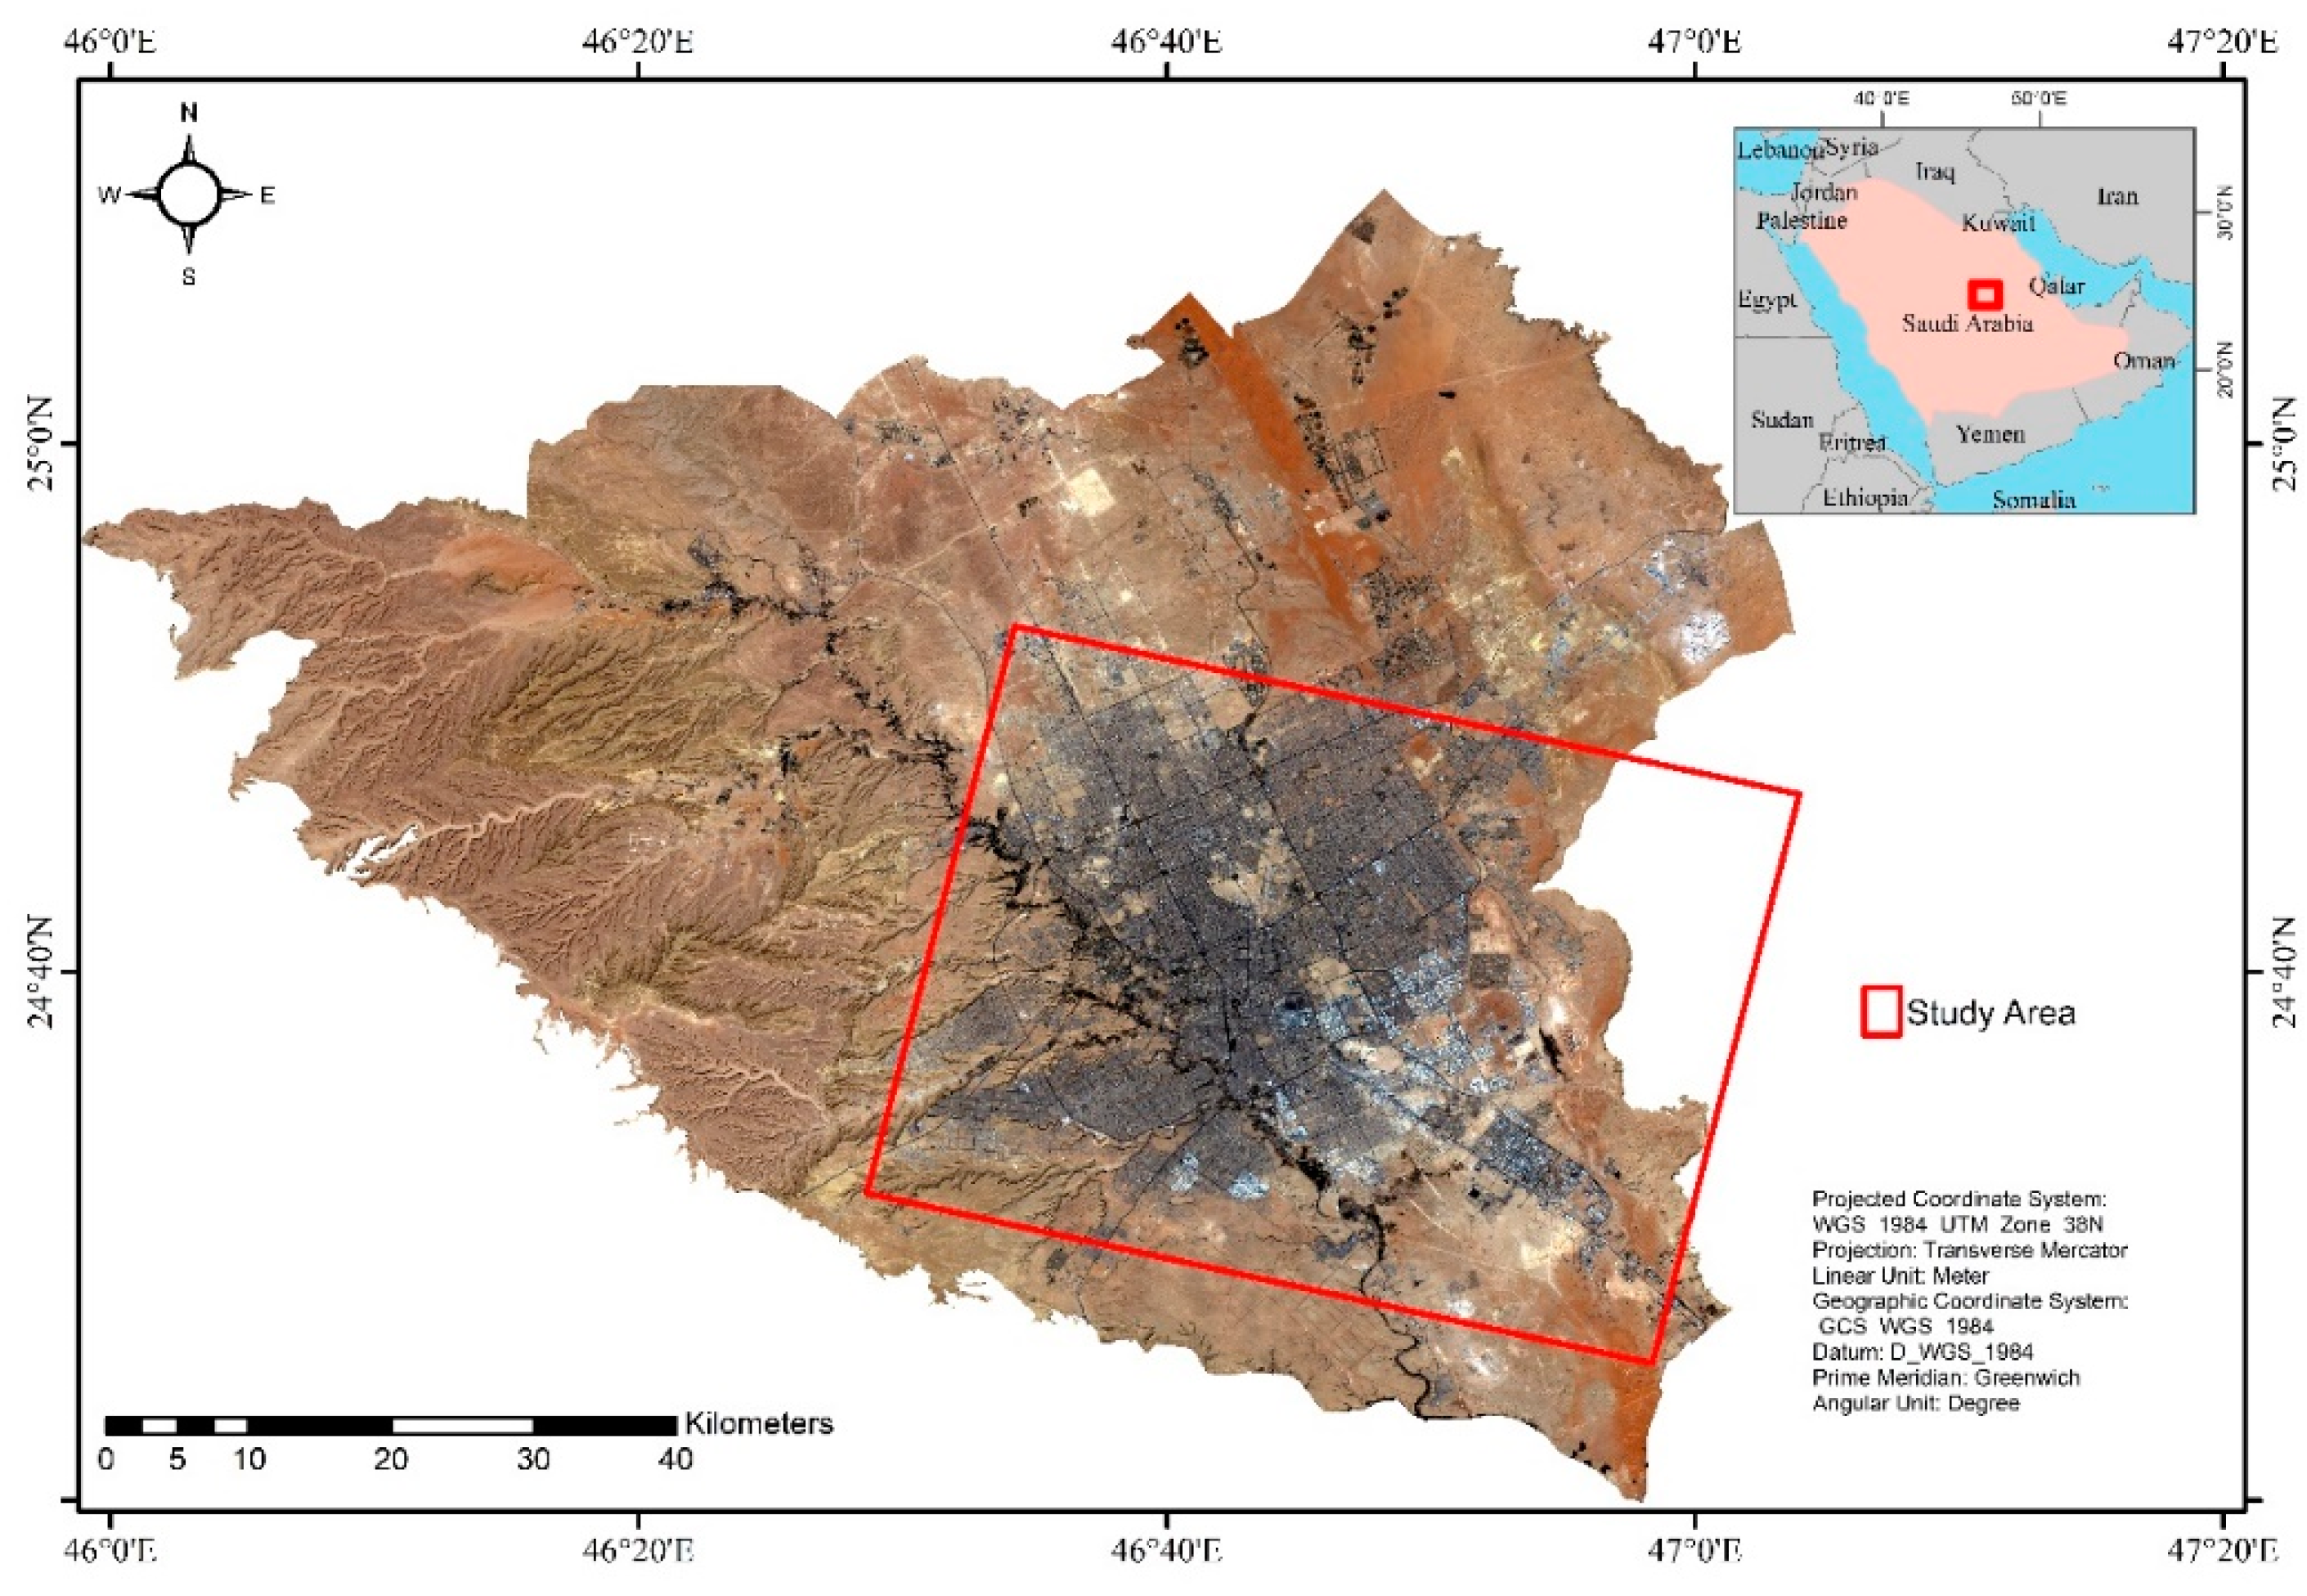
Riyadh is located between 24°20′N and 25°20′N latitude and 46°00′E and 47°10′E longitude (Figure 1) and is one of the fastest-growing cities in the world [34]. Since 1932, the size of what is considered municipal Riyadh has doubled at least 1000 times [37], while the population has doubled more than 200 times [37]. More recently, official government statistics have suggested that Riyadh’s population doubled between 2004 and 2016 [33]. Internal migration is the main reason for the growth in Riyadh’s population, with people moving from other parts of Saudi Arabia for jobs, to attend one of the three universities located in the city, and to gain access to government-related services. The fact that Riyadh is the seat of government and the country’s main business center helps to explain why people move here for jobs, with 62% of people who move to the city gaining employment [37]. The fact that Riyadh is a growing city and holds unique political and economic significance has meant that, historically, the state has earmarked a part of the national budget for the city’s development [38]. Given Riyadh’s historical change and its rapidly increasing population, we expected our analysis to show that its urban area had expanded over the years to accommodate the increasing population.
To study the changes in Riyadh over the period 2004–2014, we focused on four land cover classes: urban areas (buildings of various types), roads, soil, and vegetation (see Table 1). The area under consideration covered the main municipal center of Riyadh (Figure 1), and for the purposes of this analysis, we considered the area that indicated the presence of impervious surfaces.
2.2. Data and Image Pre-Processing
We obtained two images from Système Pour l’Observation de la Terre (SPOT 5) collected in 2004 and 2014 (Table 2) from King Abdulaziz City for Science and Technology (KACST) to assess change in Riyadh. Each image covered an area of approximately 3600 km2 and was projected in WGS 1984, Zone 38. The SPOT 5 data used in this analysis were pan-sharpened by merging the multispectral data (10 m resolution) with the panchromatic data (2.5 m). Therefore, the image spatial resolution was 2.5 m and allowed us to use the three multispectral bands—green (500–590 nm), red (610–680 nm), and near-infrared (780–890 nm)—and panchromatic data in imagery classifications. To develop a sense of how the landscape changed over the years and arrive at the land cover classes (Table 1), we completed a ‘virtual reconnaissance’ of the area using Google Earth imagery from 2004 to 2014. The ‘virtual reconnaissance’ allowed us to gain a sense of the landscape and arrive at realistic land cover classes (Table 1) for completing the imagery classification processes. Gaining a virtual sense of the study area was necessary as reference data for Riyadh were not publicly available at the time of our analysis. The reconnaissance exercise allowed us to approach the classification processes with some knowledge of the landscape.
Before completing image classification, the SPOT 5 imagery was pre-processed through a relative atmospheric correction method, rather than an absolute atmospheric correction [39] as appropriate meteorological data were not available for the study area at the time of analysis. Through the relative atmospheric correction process, a dark-object subtraction (DOS) method was used, whereby the value of the darkest pixel in each band of the image was subtracted from the value of each pixel to arrive at a more accurate representation of the study area at the time of image acquisition. We opted to complete the DOS as there were various areas within the images that contained significant shadows and shaded areas that had the potential to impact our classification results. The DOS was completed using the Band Minimum algorithm in ENVI 5 for each of the two images. Once the DOS was completed, each image was rectified and projected in the same space to allow for comparison across the study’s timeframe.
2.3. Image Classification
To study how Riyadh changed over the 2004–2014 timeframe, we compared the results of a maximum likelihood classification (MLC) with an object-oriented classification (OOC). These methods have been described extensively elsewhere [17,40], so we only provide brief details of each approach here. For both classification methods, we obtained more than 50 homogenous areas of interest to guide the classification process.
The MLC classification was completed in ERDAS Imagine. For each of the four land cover classes (Table 1), we obtained homogenous areas of interest (AOI) in the SPOT 5 datasets for 2004 and 2014. The spectral data from each of the AOI were treated as samples to represent each class across the images. The AOI data for each class were then merged to arrive at a statistical representation of each class to train the classification algorithm. Training area selection was guided by using our insights obtained from the virtual reconnaissance exercise completed using the Google Earth imagery of the study area. The data derived from the AOI were tested to ensure they were homogenous and allowed for the variability contained in the dataset to be appreciated. Once homogenous and distinct training samples were obtained for each land cover class (see Table 1), the data were used to run the MLC classifier in ERDAS Imagine for the 2004 and 2014 images.
The object-oriented classification was completed using the eCognition Developer 9 software. The first step in the object-oriented classification was to segment the SPOT imagery into homogenous units. Details on the theory and background of the image segmentation process can be found elsewhere [41,42,43,44,45]. Through the image segmentation process, a group of pixels with similar spectral and spatial properties was grouped into an object [45]. There is no perfect segmentation algorithm [46] and there is still discussion in the imagery analysis community on the optimum size of segments required to achieve the maximum classification accuracy. With this in mind, we followed the guidance of the eCognition manual and a previous study [45] to adopt the standard classification procedure. The first step was to assign appropriate values to three parameters: shape (Ssh), compactness (Scm), and scale (Ssc). These parameters are used to segment objects or pixels with similar spectral and spatial signatures. eCognition allows the analyst to use weights ranging from 0 to 1 for the shape and compactness factors. Myint et al. [45] noted that these two parameters control the homogeneity of objects, while the shape factor adjusts spectral homogeneity versus the shape of objects. Furthermore, Myint et al. [45] noted that the compactness factor determines the object shape between smooth boundaries and compact edges. The scale parameter controls the object size that matches the user’s required level of detail and can be considered the most crucial parameter of image segmentation. Object sizes can be determined by applying different numbers in the scale function of eCognition. A higher number for scale (e.g., 100) generates larger homogeneous objects (similar to a smaller cartographic or mapping scale), whereas a smaller number [10] will lead to smaller objects [45]. In our study, we set the shape parameter (Ssh) to 0.1 to give less weight to the shape and more attention to spectrally homogeneous pixels. The compactness parameter (Scm) and smoothness were set to 0.5 to balance the compactness and smoothness of objects. After testing different scale levels and parameter values, we determined that a scale level of 50 was most appropriate for our study.
2.4. Change Detection
To understand how Riyadh changed over the study period, we completed a post-classification comparison change detection [40] and compared the MLC results with those of the OOC. The advantage of using the post-classification change detection analysis is that it provides “From‒To” change information for each class in our study area [40]. As the output of the change detection process is dependent on the quality of the classified product, it was essential that the classification accuracy be as high as possible [47]. In our case, we aimed for an overall accuracy of 70% for each of the two images across the two classification methods. We chose 70% as reference data were not available for both periods and our perception of the landscape in the past was dependent on Riyadh residents’ memories of their city, as described below.
2.5. Accuracy Assessment
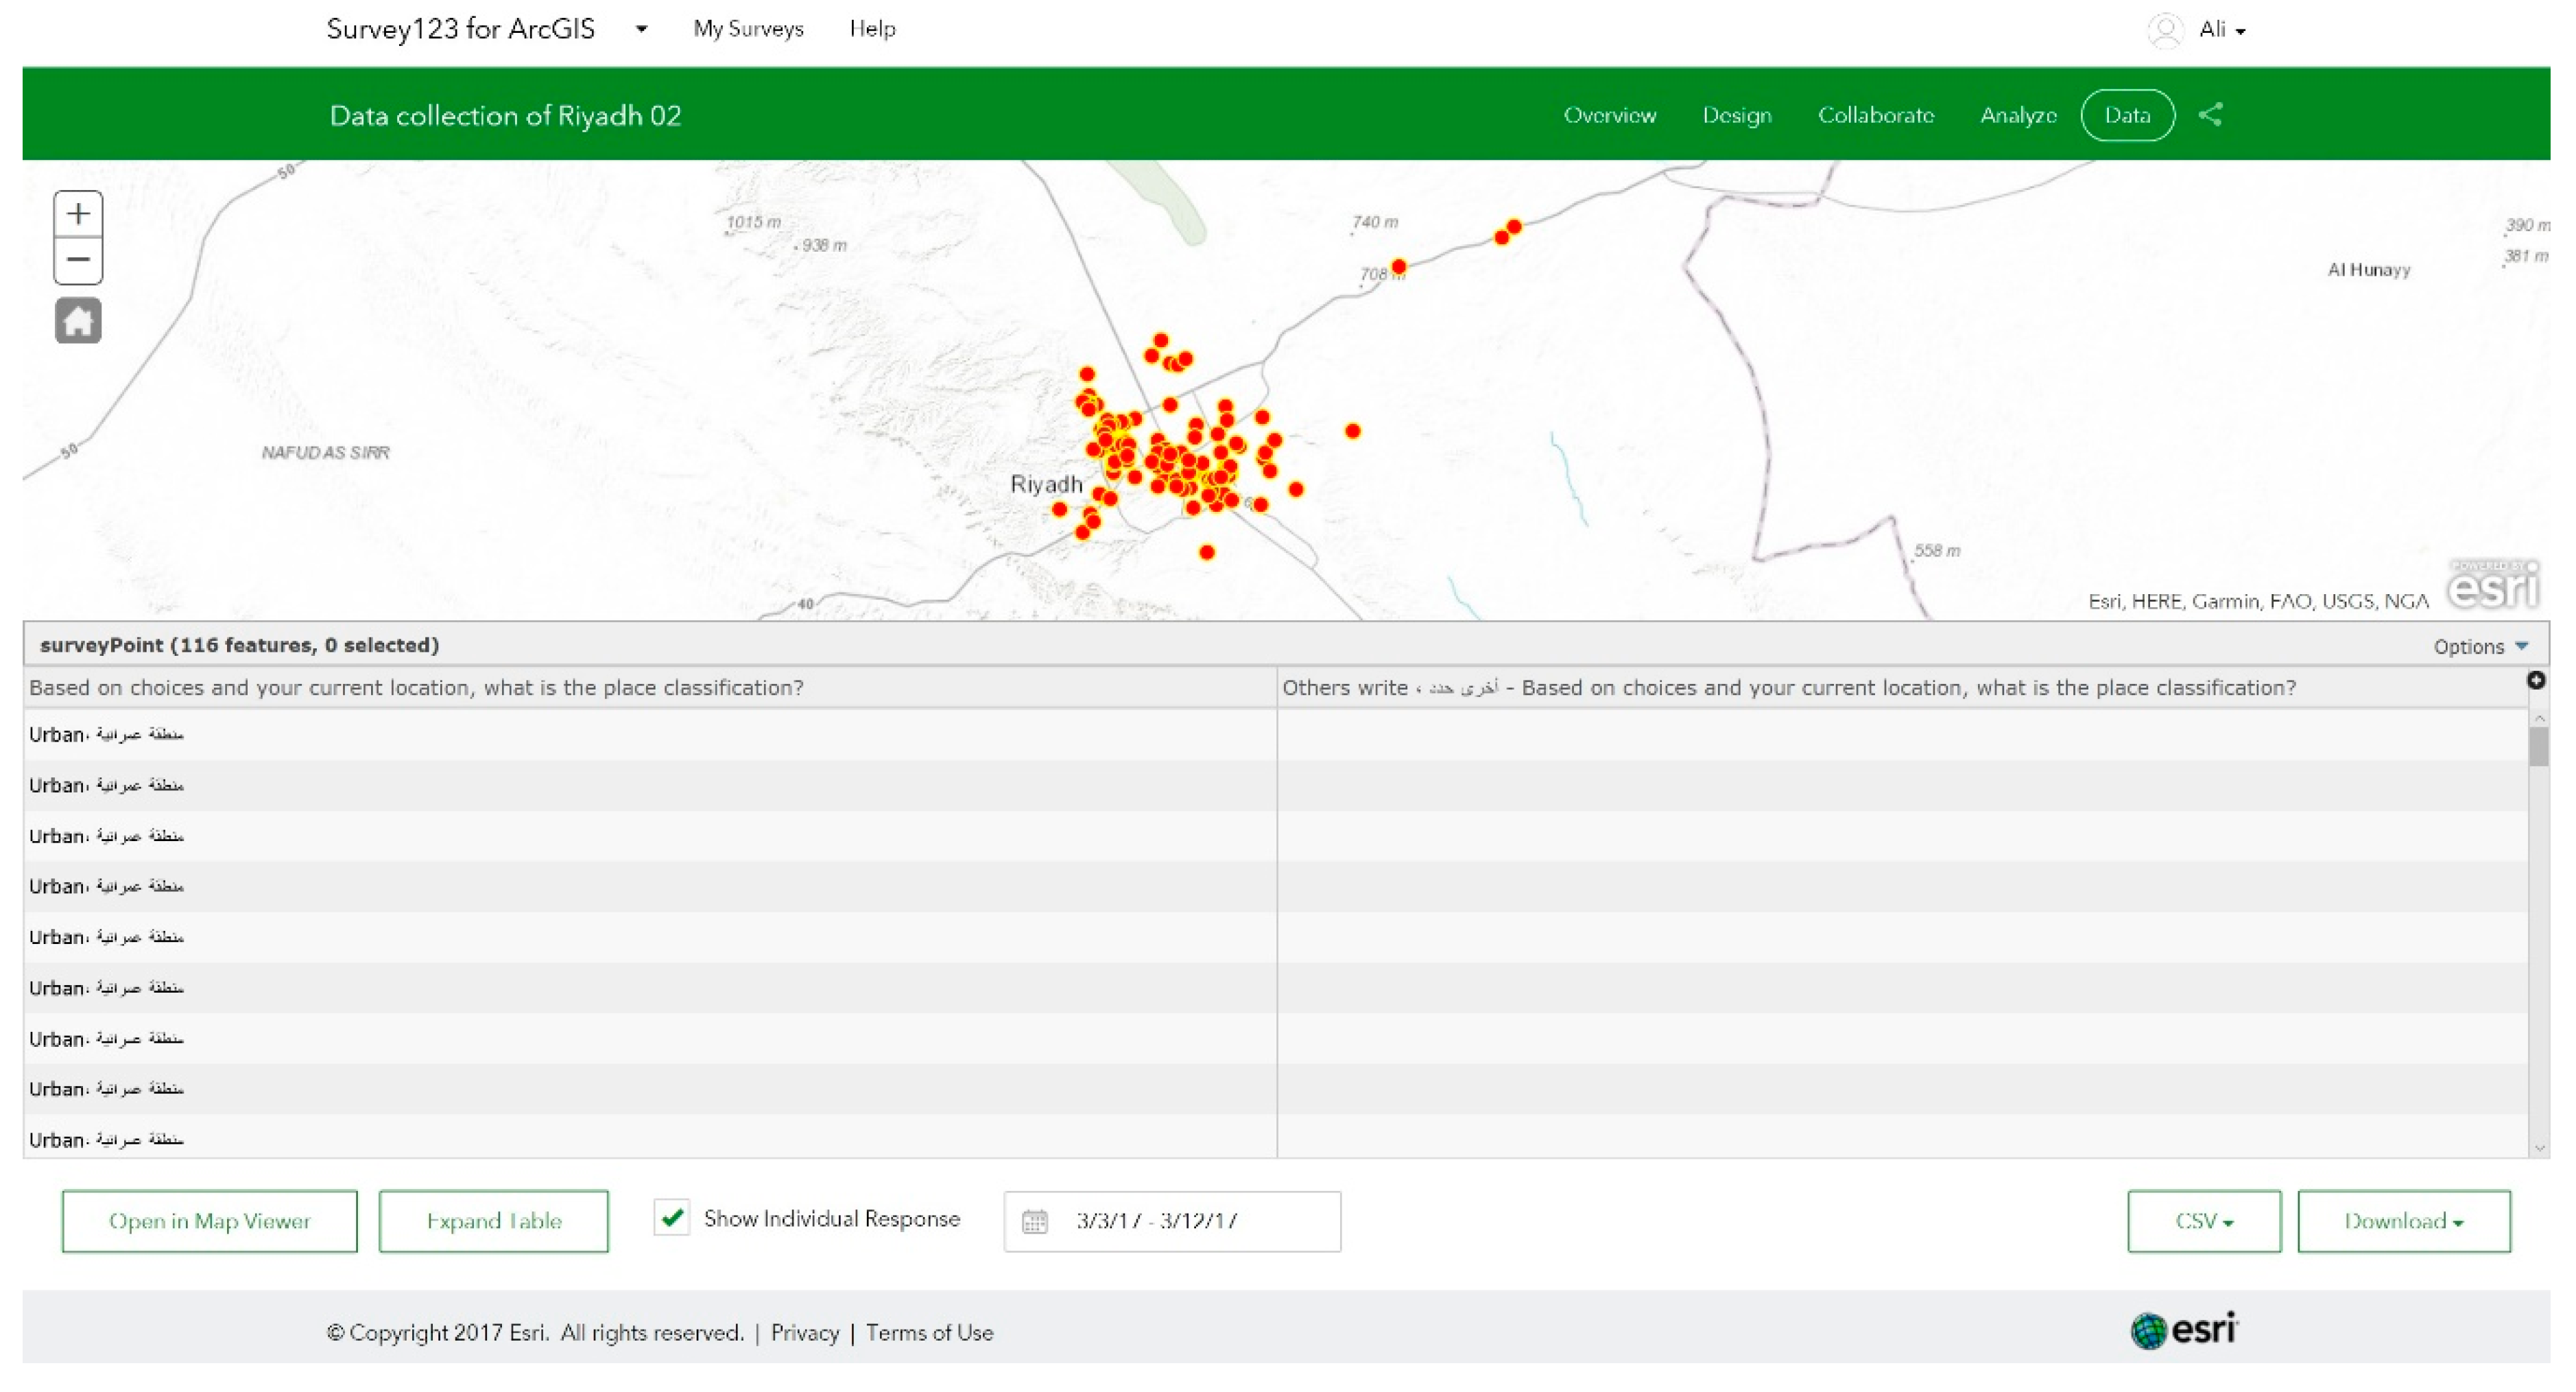
As reference data were not publicly available at the time of this study, we obtained same using a two-step approach. First, we developed a mobile GIS tool using ESRI’s Survey 123 (Figure 2). The first author traveled to Riyadh and obtained reference data for each of the four classes (Table 1) in January 2019. For each class, we obtained points, recorded their locations using a Trimble GPS unit, and classified them into one of the four classes. The second step involved recruiting local people and asking them to provide their classification of the landscape. We consulted 10 volunteers who were native to Riyadh, had lived in the city from at least 2004, and had knowledge of the landscape. We provided each volunteer with the Survey 123 tool, which contained portions of the SPOT imagery as a background and the points the first author obtained. Our classification of that point was hidden from volunteers. Each volunteer was asked to classify the point based on their recollection of the area in 2004 and 2014. Once the volunteers provided their classification, it was saved in the database. Each volunteer’s classification was then compared with our classification as of 2019. Only our points and classifications that had 100% agreement with our volunteers were kept for further analysis. For example, if we observed “road” in 2019, but the volunteers classified the point as “vegetation,” this point was removed from further analysis. Upon the completion of the cross-validation process with volunteers, we obtained 50 unique points for each class that were used to compute an accuracy assessment.
The points we obtained allowed us to follow a stratified random sampling design to assess the accuracy of the classified output of the two classification methods. The advantage of using the stratified random sampling method is that the size of classes does not influence whether they get included in the classification accuracy assessment [48], where the weight of each class in the classified output image is taken into account. We used geographic information systems (GIS) tools to compute the proportion of each of the four land cover classes in the classified products. We then computed the estimated proportion of area in cell i, j to construct an error matrix (Equation (1)) of the estimated proportions [49]. The known area proportions of the map classes (Wi) were incorporated into the stratified estimators of overall (Equation (2)) and producer accuracies (Equation (3)) to account for different sampling intensities in different strata. Once the error matrix area proportions were estimated (Equation (1)), the user’s (U^_i; Equation (4)) and producer’s (P^_j) accuracy for any category and overall map accuracy (O^_) were estimated directly from the estimated error matrix [49]. The Kappa statistic (Equation (5)) was computed for each of the four classified products.
where are map categories represented in rows and are the referenced categories represented in columns of the error matrix.
3. Results
3.1. Riyadh’s Land Cover Classes over Time
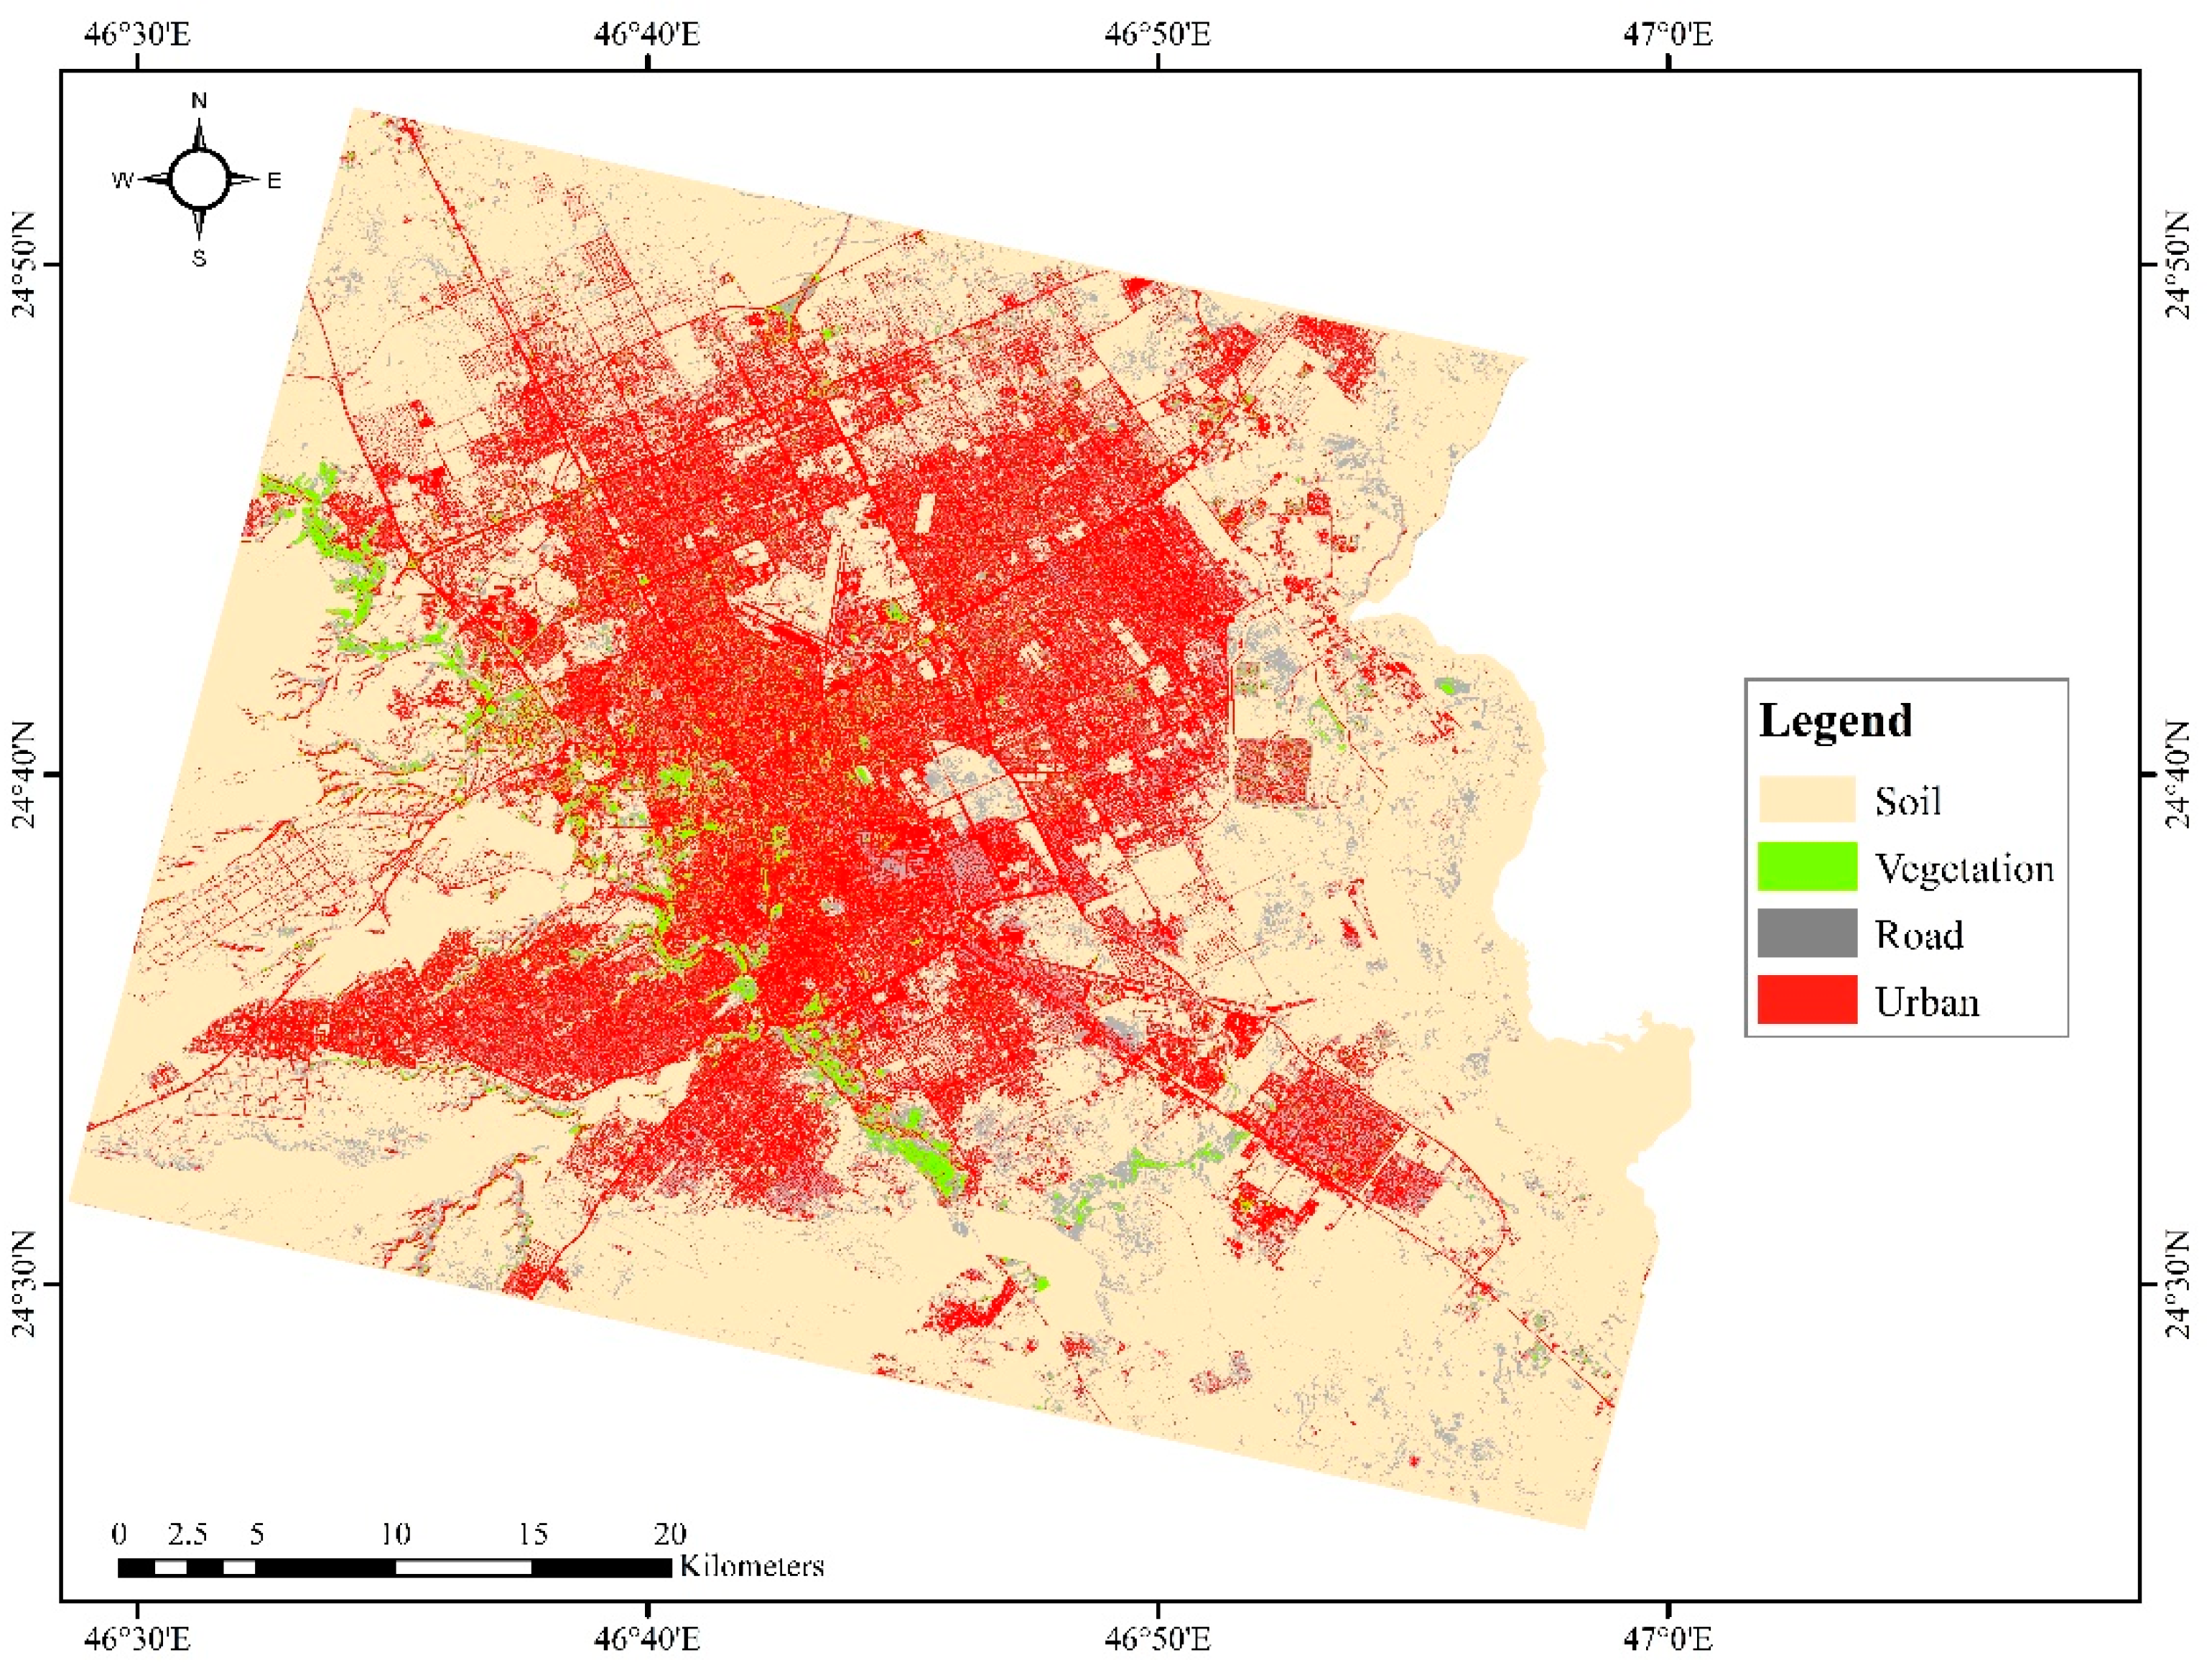
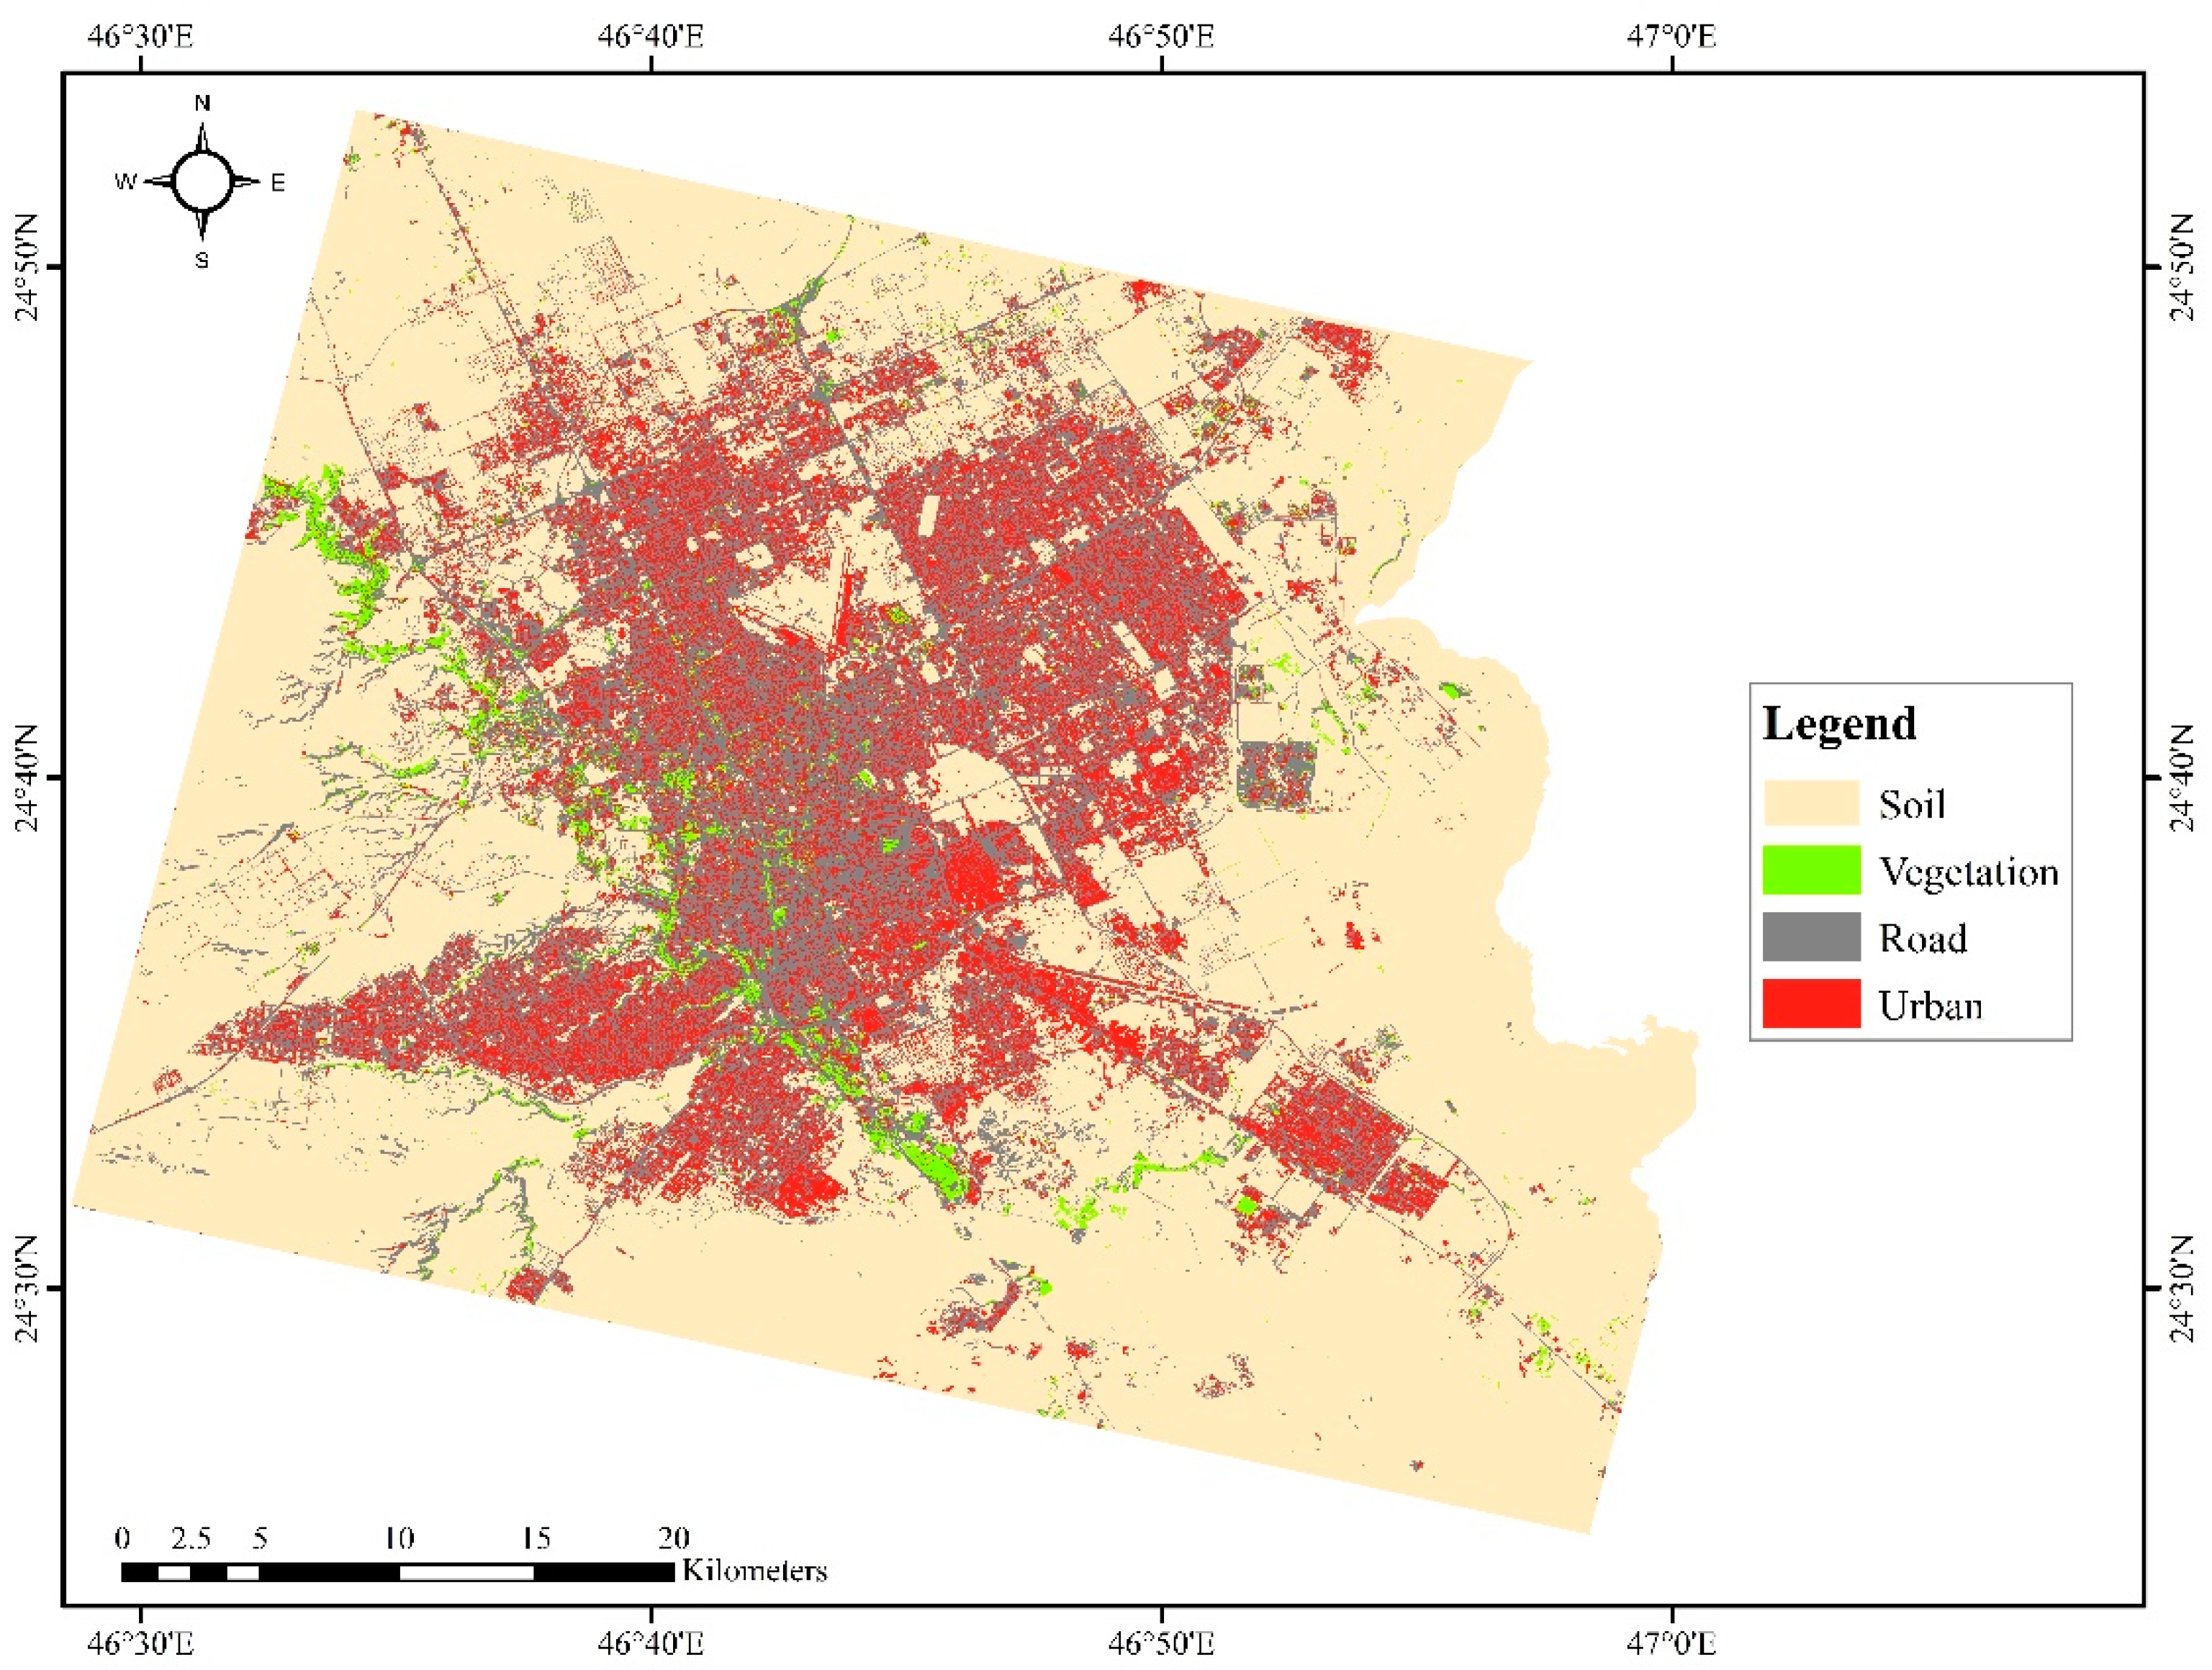
Riyadh was dominated by soil (desert) in 2004, according to the MLC and OOC classification methods (Table 3), and declined substantially by 2014 (see Figure 3, Figure 4, Figure 5 and Figure 6). Despite the two classification methods showing different proportions of the city being covered by soil in 2004, both showed a 14% decline in soil by 2014. Our assessment further showed that Riyadh changed substantially over the 10-year period under consideration, with the soil being replaced or covered by the three other land cover classes. The previously undeveloped soil was primarily converted to impervious surfaces, either roads or buildings, as the city expanded (Table 3; Figure 3). In essence, both the MLC and OOC classification methods showed that urban expansion had occurred in Riyadh. The amount of change observed was consistent with a rapidly growing city. Below we explore the changes observed based on the classified outputs of the two classification methods (Figure 3, Figure 4, Figure 5 and Figure 6). Overall, the OOC classifier gave higher classification accuracies than the MLC classifier.
3.2. Maximum Likelihood Classifier
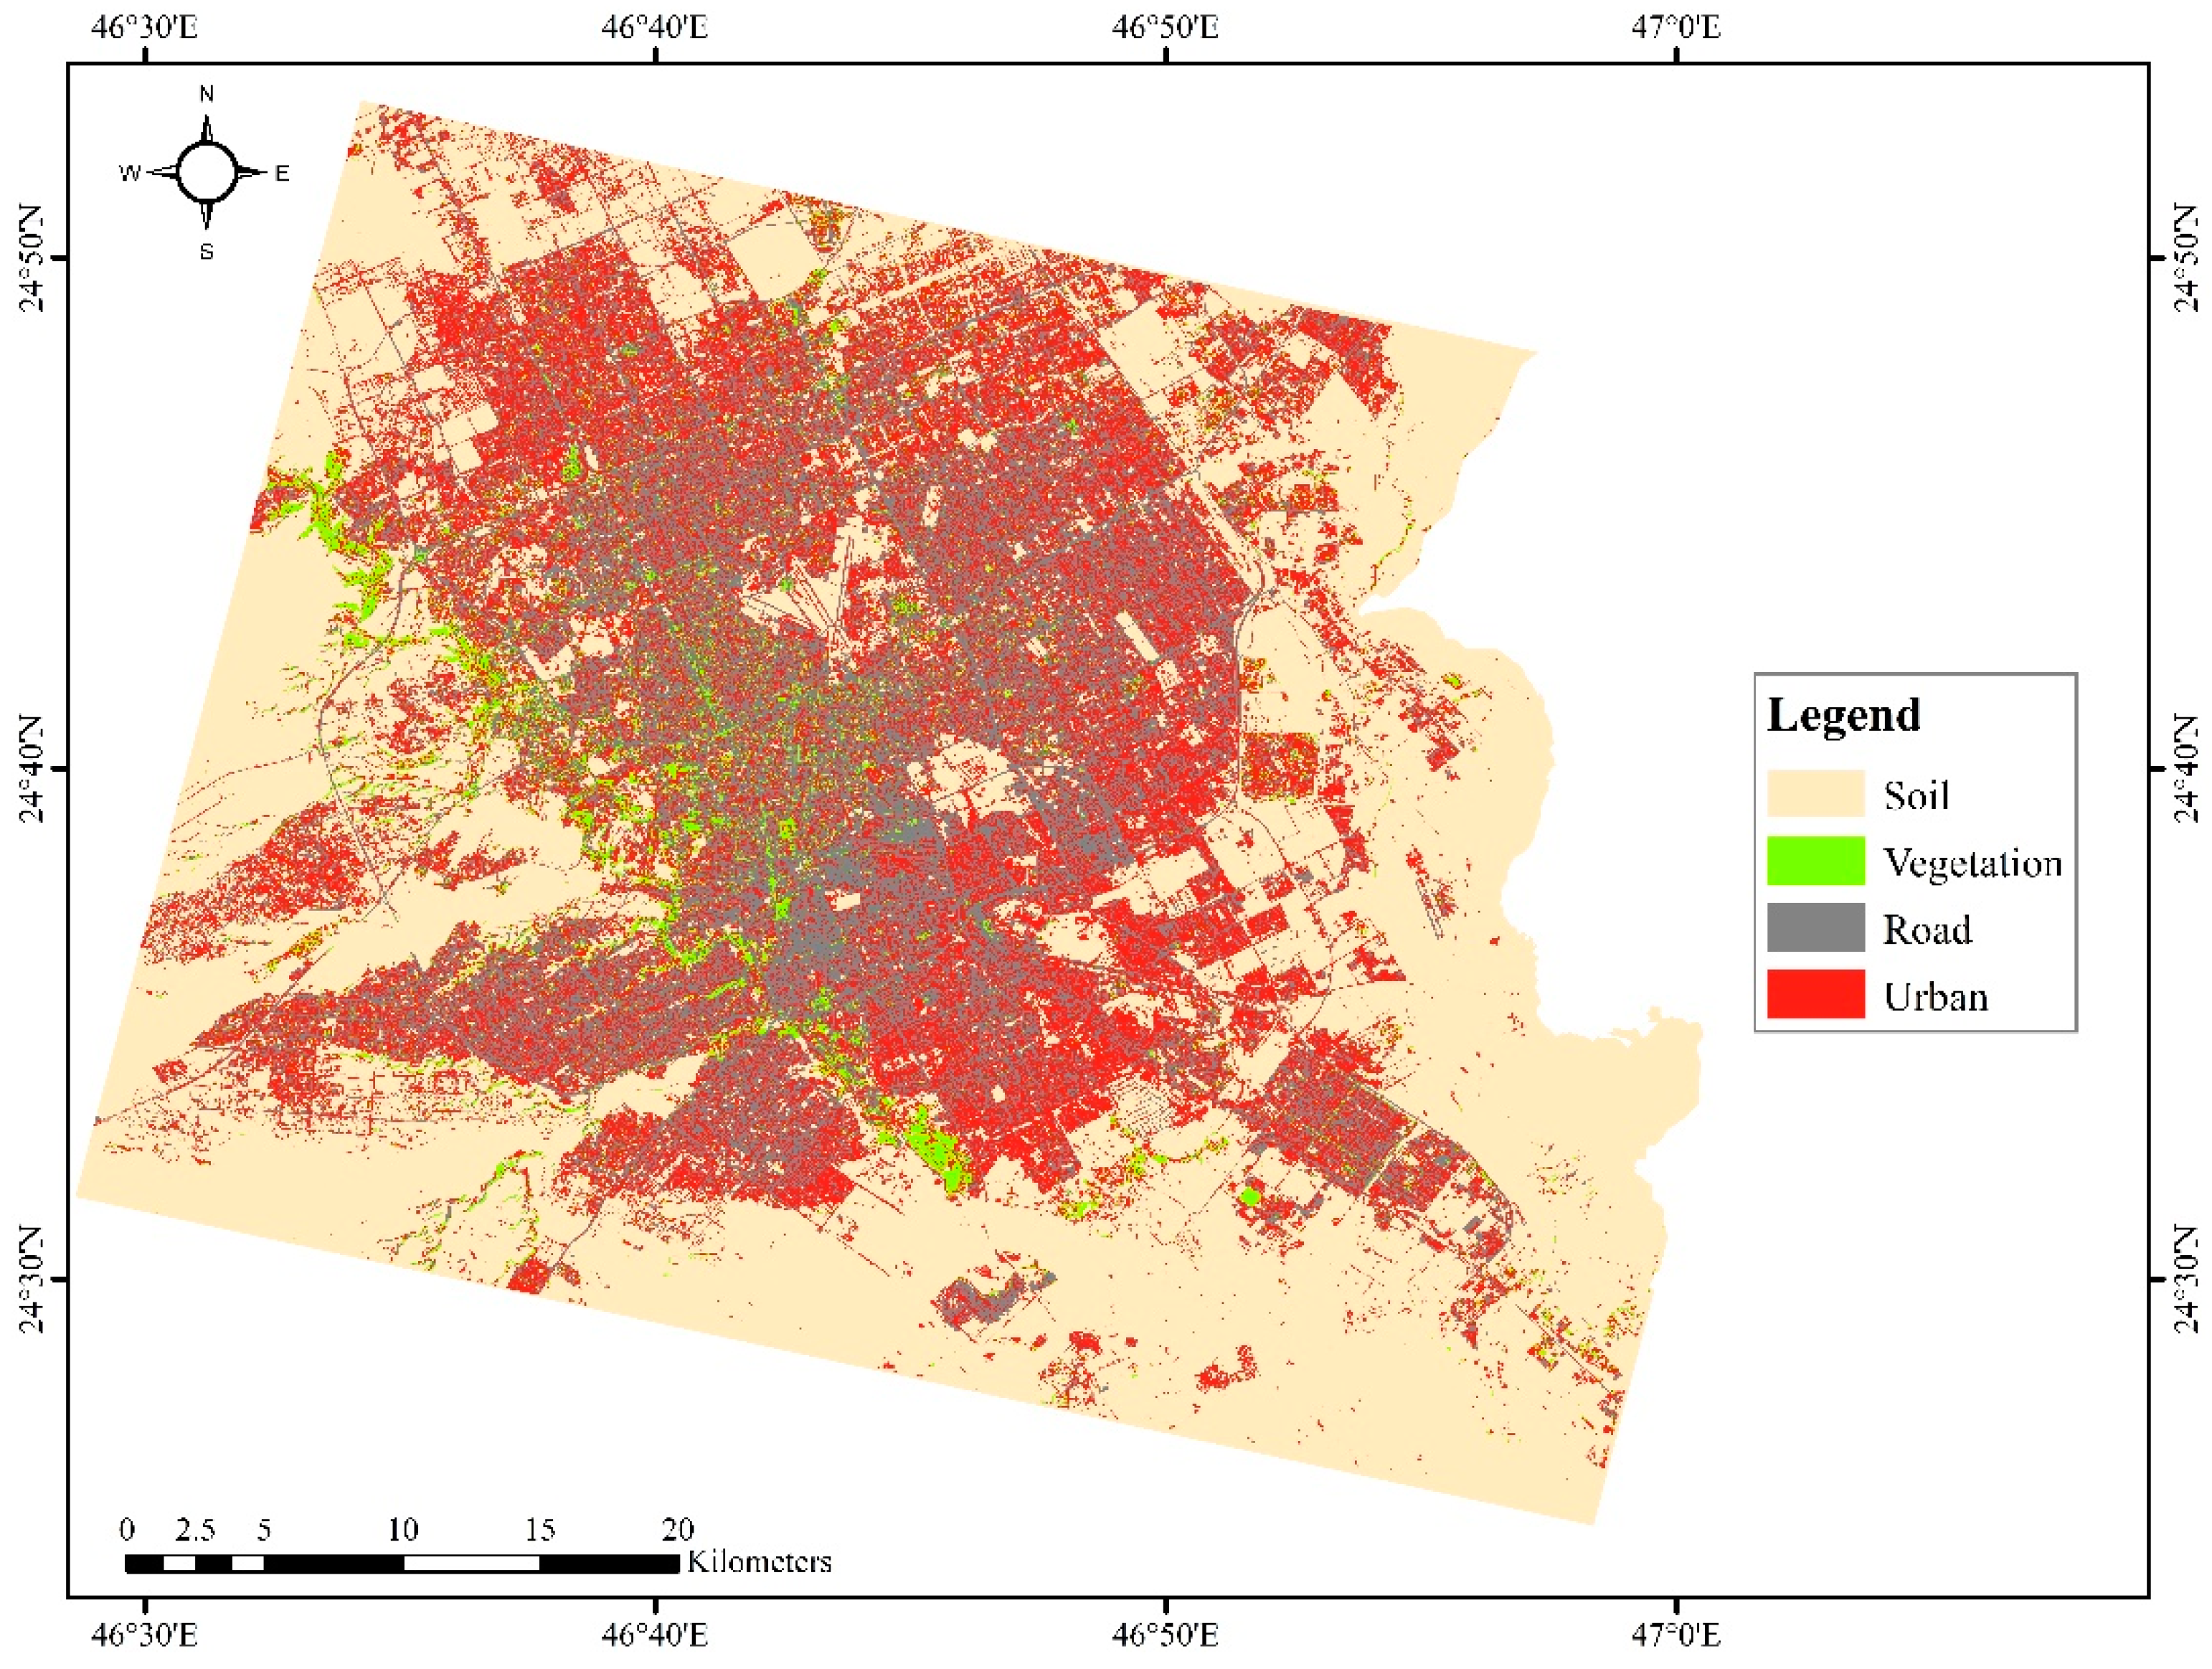
The MLC method showed that undeveloped soil accounted for a large portion of Riyadh (55%) in 2004 (Table 3). The area covered by impervious surfaces (roads and buildings) was approximately 42% of the study area in 2004, while vegetation accounted for just 3%. The 2014 classification showed that the soil area reduced by 14% over the 10 years, accounting for 41% of land cover. The areas covered by impervious surfaces, roads, and urban areas increased by 15.12% from 2004 to 2014, accounting for 57% of Riyadh’s land cover in 2014. In a sense, therefore, over the 10-year period, the area covered by soil and impervious surfaces had an inverse relationship with impervious surfaces, increasing as soil cover declined.
3.3. Object-Oriented Classifier
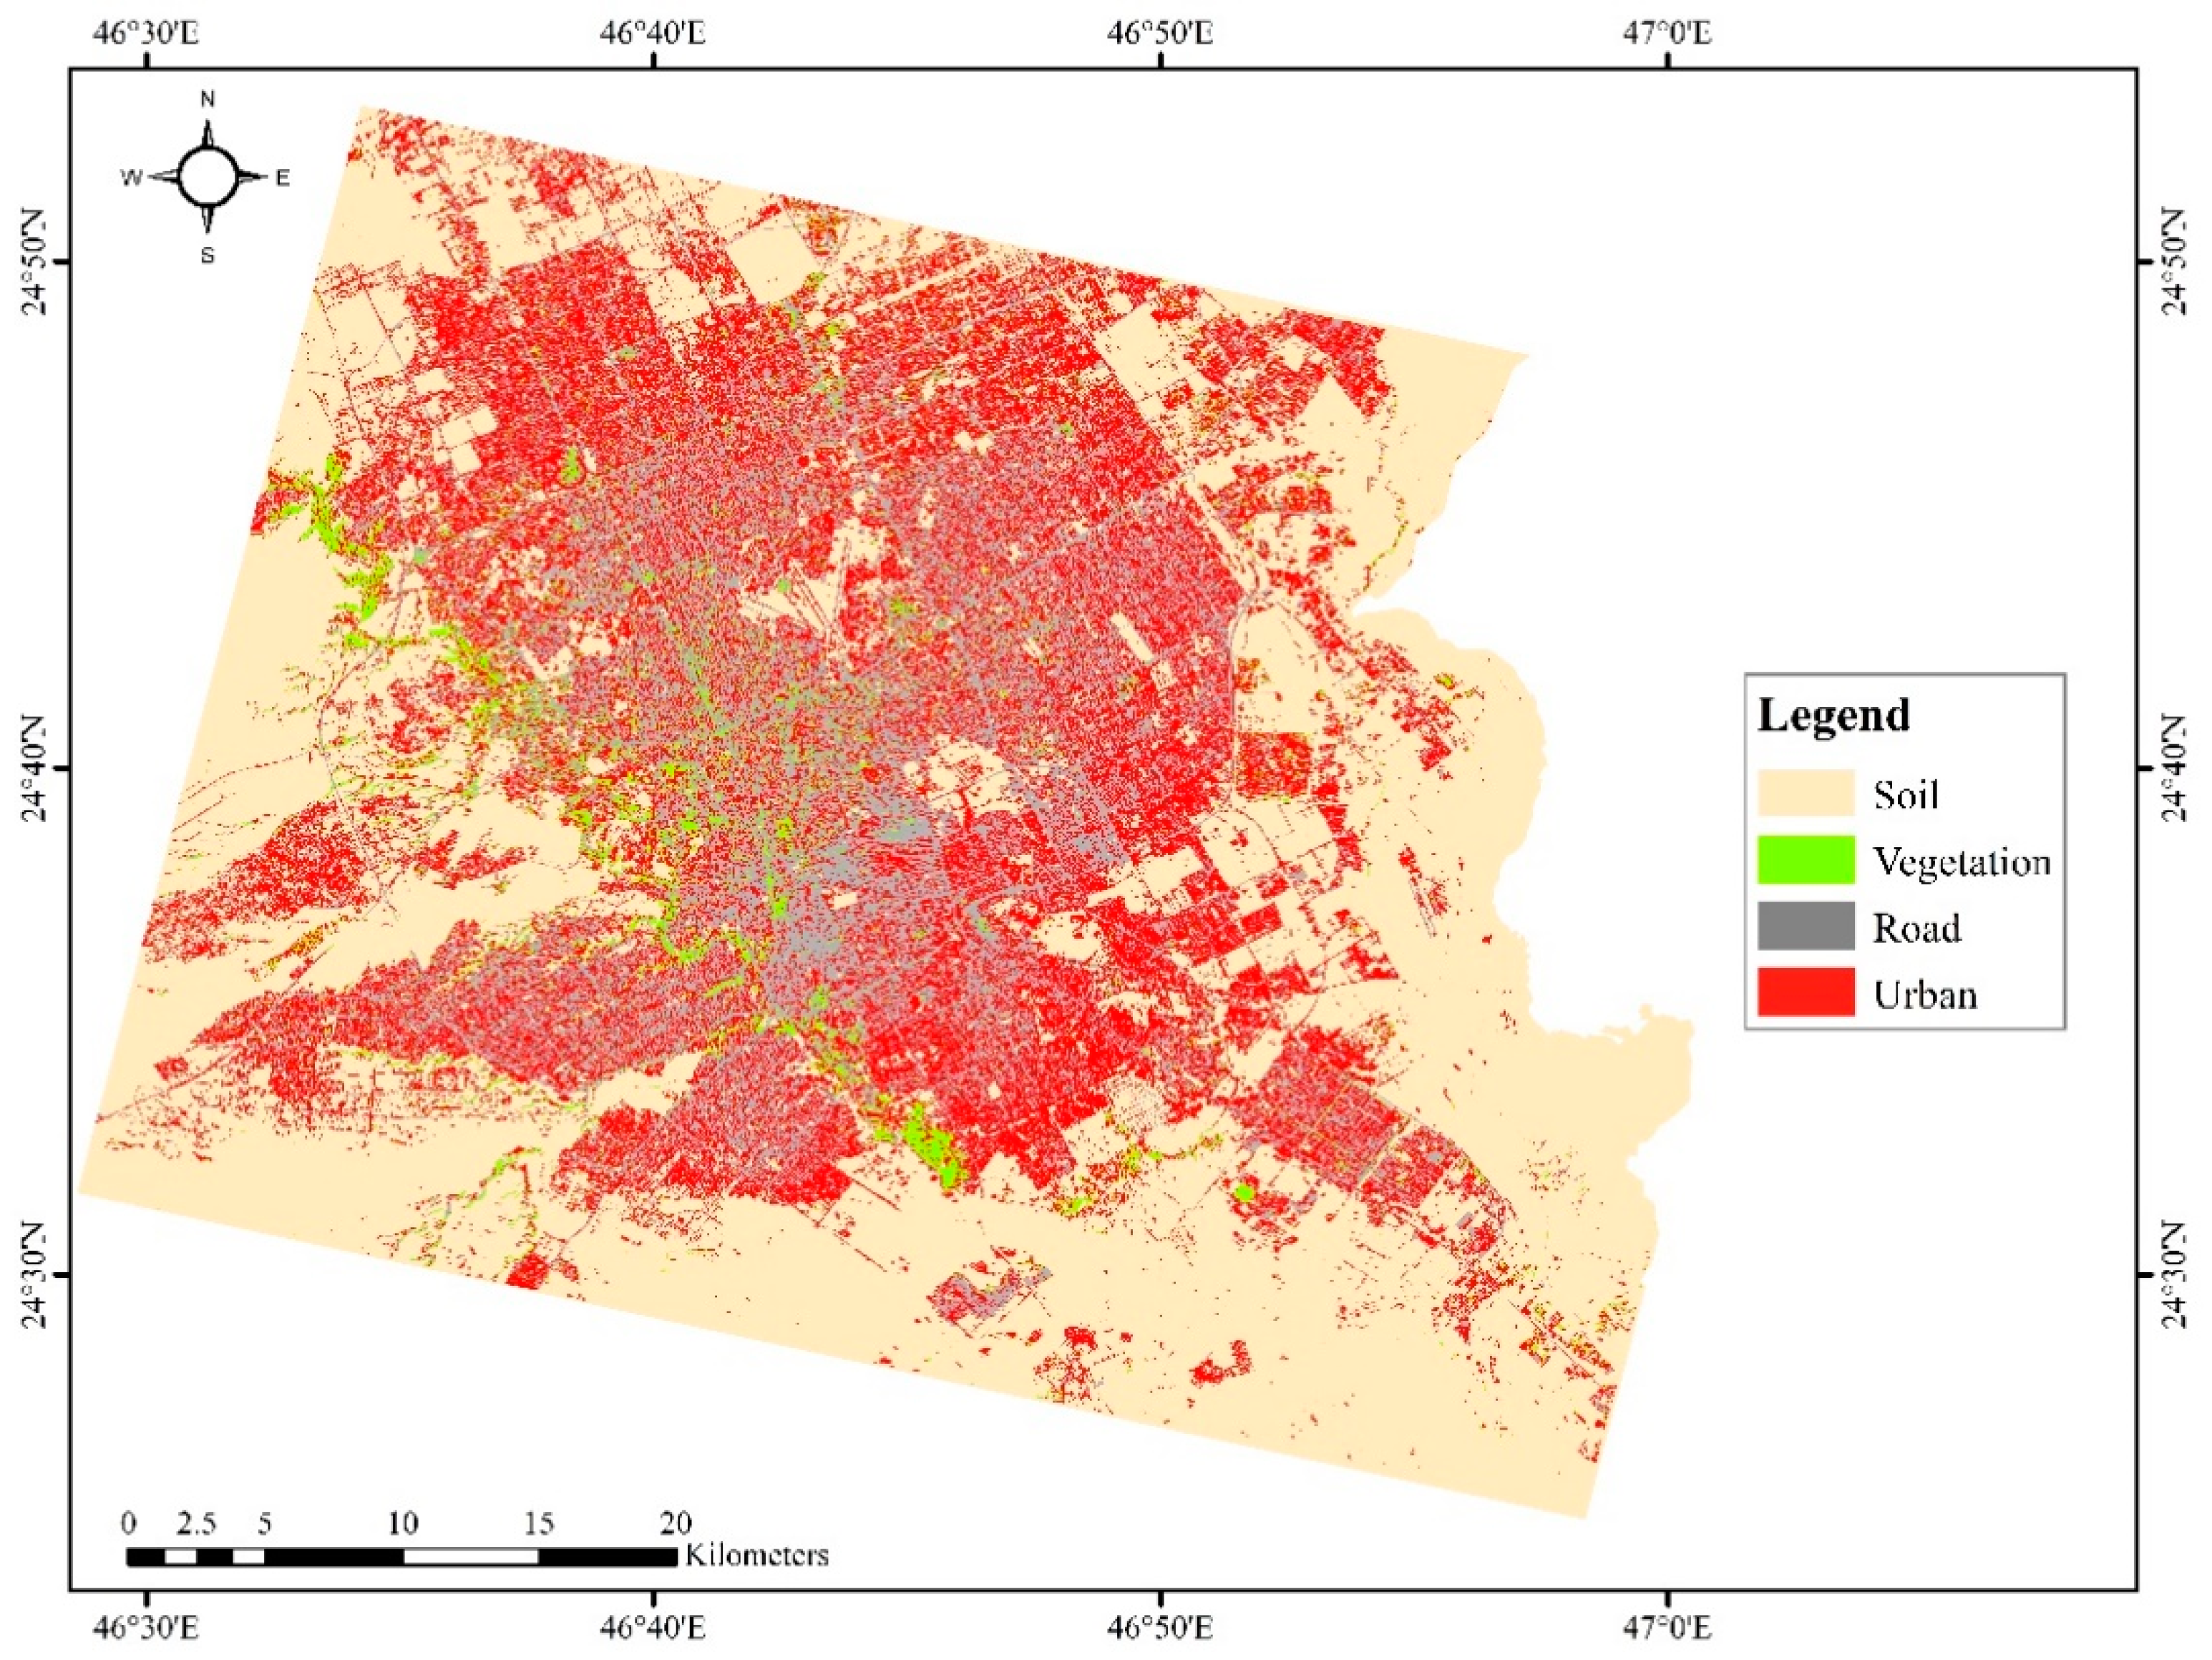
The results of the object-oriented classifier differed from those obtained via the MLC method. Like MLC, the OOC showed the overall pattern of soil dominating the study area in 2004 (62%), while impervious surfaces (roads and urban areas) represented 36% of land cover. By 2014, the soil area had decreased by 14.25%, while impervious surfaces increased by 12.37% (Table 3) to account for 48.44% of land cover. While the OOC method showed soil dominating the study area in 2004, the soil and impervious surface classes (roads and urban) accounted for almost identical proportions of the study area in 2014. Interestingly, while the MLC method showed that vegetation area decreased between 2004 and 2014 (Table 3), the OOC classification showed an increase in vegetation cover from 2.03% in 2004 to 3.90% in 2014. While the change in vegetation cover in the OOC method was small, it was nonetheless interesting to note that this method showed that vegetation was introduced into Riyadh.
3.4. Accuracy Assessment
The post-classification change detection method confirmed the change in land cover types, as observed through the two classification methods. The overall accuracies of the classified products were 73.79% and 90.77% for the MLC method in 2004 and 2014, respectively, and 74.71% and 92.36% for the OOC method (Table 4). While the overall accuracy for the 2004 products was lower than is generally accepted in the literature, the 2014 classifications were within the range of expected results for completing a change detection analysis. Our accuracy assessment results demonstrated the difficulty of going back in time to complete imagery classifications. When the two classifications were compared, the mean overall accuracy of the OOC classification method was slightly higher than that of the MLC method, suggesting that the OOC method is perhaps more suitable for this landscape.
The weighted error matrix (Table 4) showed there was some confusion between the various classes in both classification methods. For the MLC classification in 2004, urban areas and soil were confused, and urban areas were also confused with roads. In addition to the overall accuracy of the MLC method being low in the 2004 classification output, the user accuracy and producer accuracy were also lower for each class (Table 4) than the OOC classification outputs. The 2014 MLC classification showed improved producer and user accuracy for all classes, except for the vegetation class, where the user accuracy declined to 24%. The OOC classification, while having a higher overall accuracy than the MLC method, still showed low user’s accuracy (25%) for the vegetation class in 2004. However, for 2014 the user accuracy increased to 83% for the vegetation class, with every other class showing an increase in user accuracy.
3.5. Change Detection
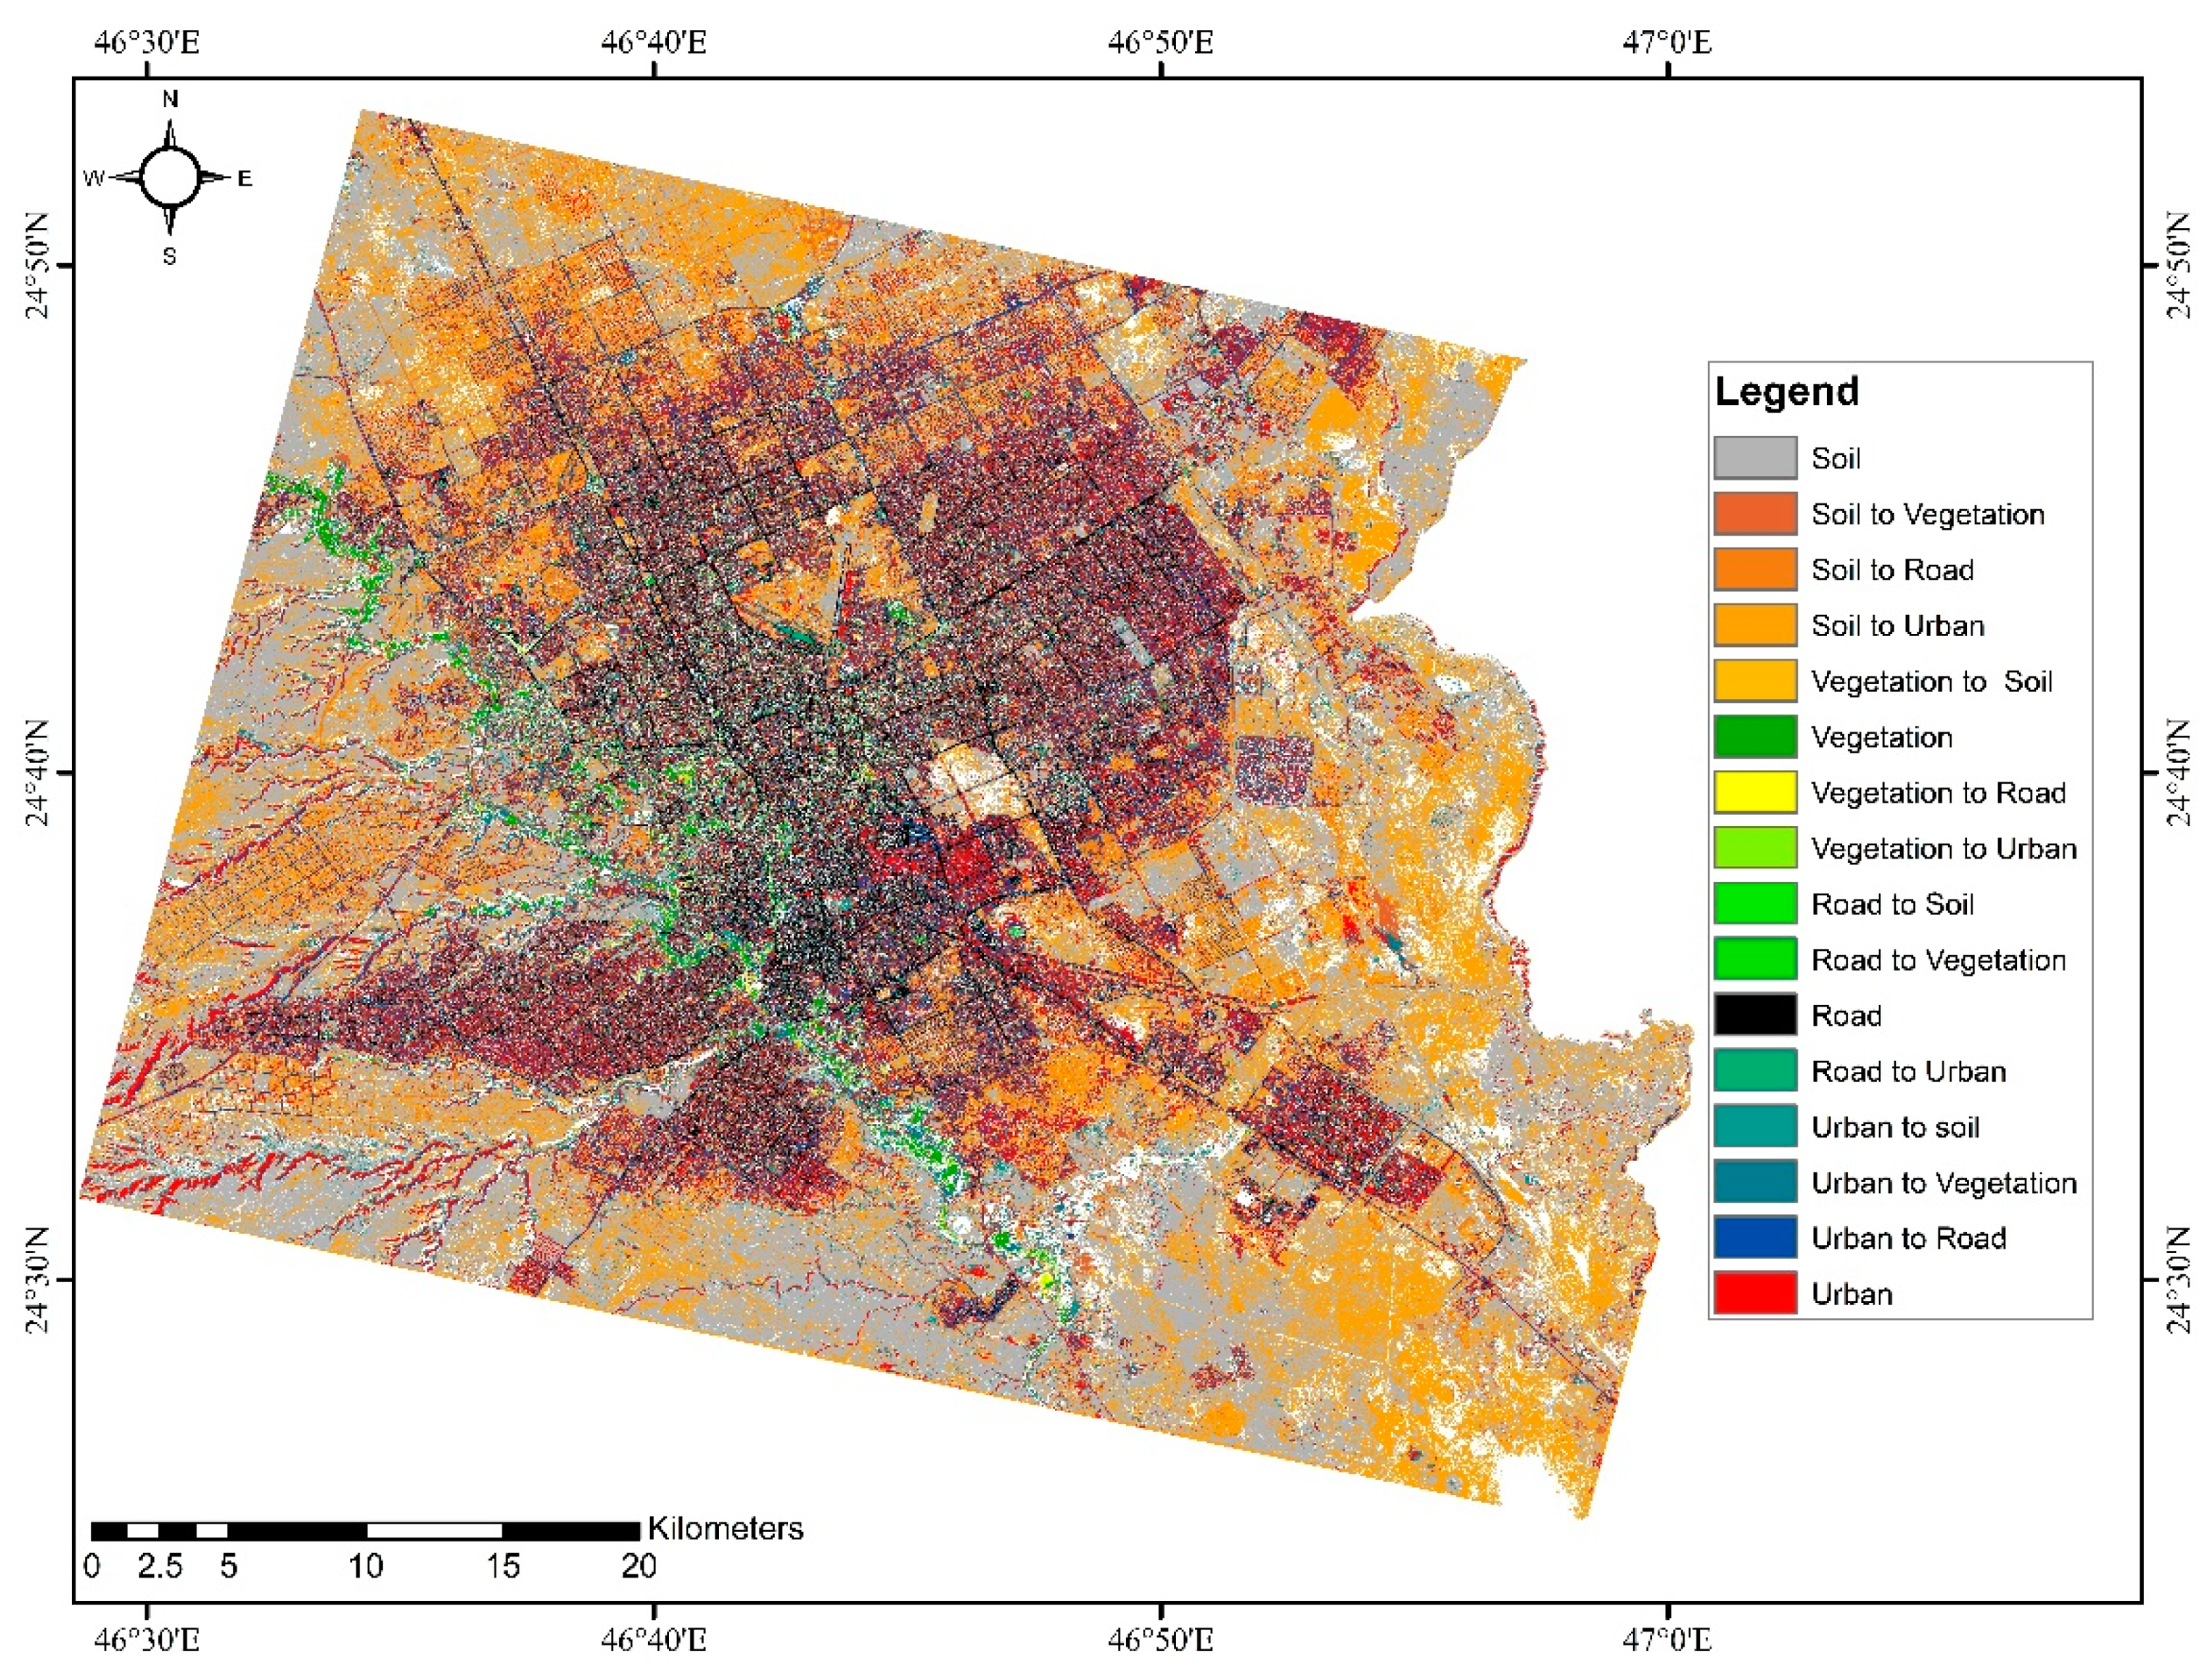
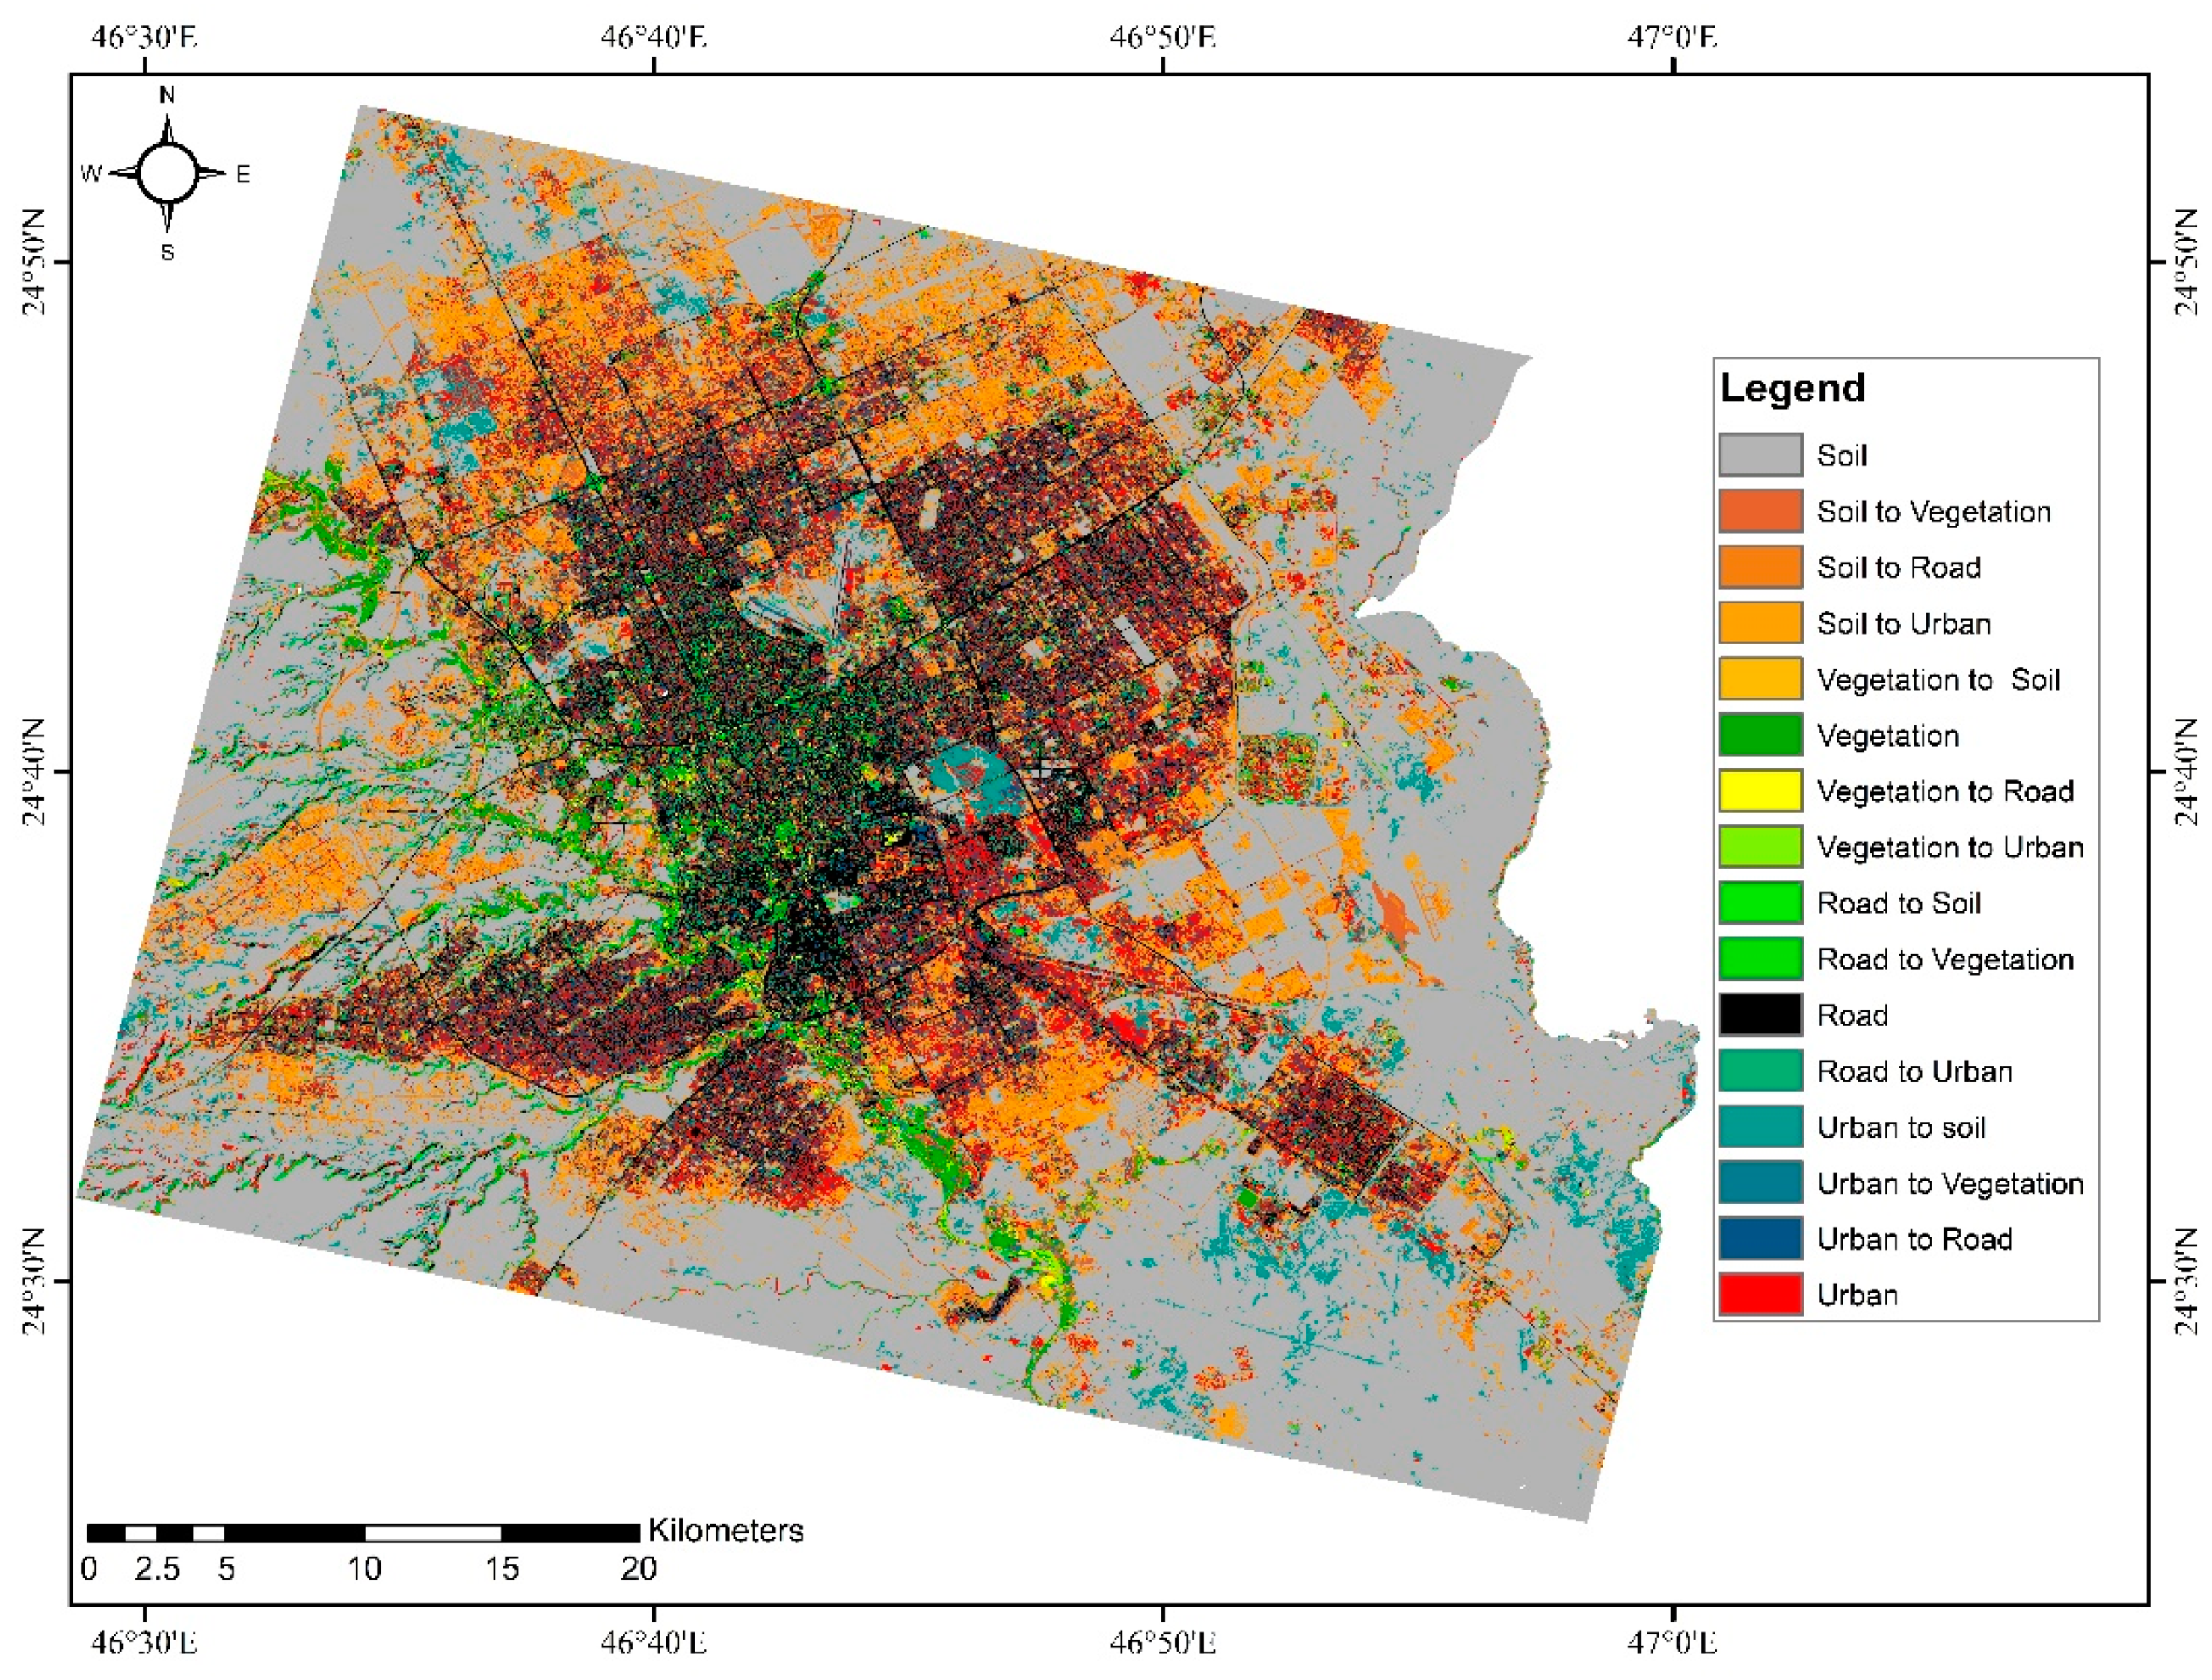
The overall patterns of change observed in the MLC and OOC methods were confirmed through the post-classification change detection analysis (Figure 7 and Figure 8). Both methods showed that the soil surfaces, or deserts, of Riyadh, were converted to impervious surfaces, either roads or buildings. While the two methods disagreed over how much soil area was converted to urban areas (10.37% in OOC and 26.69% in MLC), the overall pattern confirmed the expansion of Riyadh. Additional contrasts were observed between the MLC method and OOC in the way vegetated areas changed. We also found that, in addition to soil being converted to urban areas, soil was also converted to vegetation in both methods. Our analysis also showed that roads were converted to vegetation and built-up areas, urban areas were converted to soil, and urban areas were converted to vegetation and roads, even though these changes accounted for a very small proportion of the overall change (Figure 8).
4. Discussion
This paper set out to examine how the city of Riyadh changed over the period 2004–2014, utilizing SPOT 5 data and imagery classification techniques. Our analysis showed that the city’s urban area expanded substantially over the years, moving into what may have previously been considered unproductive land. Both methods employed to analyze change showed that, as the population of the city increased, the urban area similarly grew. Our analysis showed that urban areas, as measured by the presence of impervious surfaces, rapidly replaced undeveloped soil or desert surfaces. In completing this work, our analysis has made a few observations that are relevant to the changes observed in urban settings broadly, and the city of Riyadh in particular. Below we summarize some of these observations.
First, our analysis found a substantial change in terms of urban areas, including for housing and roads, encroaching into the rural environment, as has been observed for other urban settings across the globe [2,3,21,22]. From our analysis and the initial view of what changed in Riyadh, the areas that have been newly occupied by impervious surfaces may be viewed as unproductive ‘desert’ land. However, such a characterization may not necessarily be accurate, and there is a need to understand, from the perspective of ecosystem services and broader global processes, the implications of these areas being converted to urban areas. There may also be implications for cultural processes within the city, including for ecosystem services residents may have derived from the area. Furthermore, as Saudi Arabia embarks on Vision 2030, a highly publicized urban expansion endeavor, it will be interesting to see what urban planning processes that will impact Riyadh. Other scholars (for example, Shukla and Jain [24]) have noted that, in Indian settings, most urban expansion has been unplanned. Our future analysis will attempt to understand how policy decisions guided the expansion observed in Riyadh from past satellite data and how it compares to growth in the city in the future and with other urban areas across the world. In addition, as Vision 2030 unfolds, Riyadh remains an important seat of power and maintains many pull factors for migration, and it will be essential to observe how policymakers plan for the delivery of services to this city as the population grows. Furthermore, with reference to Jensen’s [40] urban development cycle, our analysis showed that there was a change in vegetation cover in Riyadh (see Table 3). The two classification methods did, however, show different outcomes. From the MLC classification, vegetation cover decreased, while the OOC showed that vegetation cover increased. Given the urban expansion processes observed, the latter outcome seems more likely. Based on the first author’s observations of the city and the data collection, it appears the OOC classification best matched the reality on the ground. Growth in tree-like vegetation areal coverage is generally not the norm in urban settings [2], except in older cities, but in many arid and semi-arid environments, growth in vegetation cover is plausible. In these settings, as Jensen [40] noted for other places, the advancement of housing may lead to people planting lawns once they have established a house. However, from a resource management perspective and considering the need to deliver services to the city, the geographical location of Riyadh makes it heavily dependent on water delivery from outside the city. The growth of lawns and similar vegetation will require imported water, which is expensive. Homeowners in Riyadh have been planting lawns in recent times, and there is now a strong effort to find grass and other vegetation that is suitable for the city’s conditions. However, given our data were collected over a short period and our analysis was based on a sample, ascertaining the direction in movement of vegetation cover will be subject of future research. Changes in vegetation cover, in particular the increase in vegetation, will changes the ecosystem dynamics of the city in the long run. Therefore, future work will seek to discover why there was a discrepancy in vegetation cover observed in the two methods. We will also seek to observe what changes in vegetation cover may mean for processes such as the urban heat island effect and water usage within the city.
Secondly, there is a lot of work unfolding on understanding what changes in land cover within the world’s major cities may mean for future growth [7,8,21,25,26,27,28,29,30,31]. In this sense, we view our work as a first step for Riyadh, and envision that a series of research activities aimed at understanding how the city has grown and what this may mean for the trajectory of growth in the future, particularly considering that it is one of the Middle East’s largest cities [32], will be a subject that will attract our attention. Our work has documented, from a remote sensing perspective and using tools that measure the accuracy of our analysis (see Table 4), the types and extent of changes in Riyadh. Our future analysis will compile data on the economic, demographic, and policy fronts that seek to understand the underlying drivers of the changes observed to determine whether it is possible to predict future growth. Future work will seek to understand how changes in oil prices, population growth, and other factors in Saudi Arabian urban areas may impact change in Riyadh. Such data are important for understanding how growth patterns, the economy, and policy development may impact urbanization [25] in other Middle Eastern cities that have similar characteristics as Riyadh. Being able to connect policy advancements to the growth of impervious surfaces will help us to understand factors that may impact the habitability of the world’s fastest-growing urban centers.
Thirdly, our analysis is the most recent to examine urban expansion in Riyadh, capturing change during a period of substantial population growth [31]. Our study is one of many concerned with utilizing remotely sensed data to better understand urban processes [21,22,50,51]. Our results were in line with the observations made by previous studies completed in Riyadh [9,32,36], which have all noted that Riyadh’s urban areas have expanded. The land cover classes that we used to measure and track urban expansion, impervious surfaces, roads, etc. allowed us to see how housing and transportation networks in Saudi Arabia’s capital have moved to areas of land that may have been considered marginal in the past (Figure 7 and Figure 8). Our work used slightly different classes compared to previous work and put forward an accuracy assessment regime that was nonexistent in previous efforts. It is therefore impossible to compare our results with those of previous studies, yet our work offers insights into patterns of change that we expect will be characteristics of Riyadh.
Finally, our accuracy assessment method adopted an approach that allowed us to collaborate with the citizens of Riyadh to understand what past conditions have been like in the city. While Google Earth gives a very good representation of what past conditions were like in the city, our approach of engaging local people provided invaluable data and allowed us to draw on the perceptions of residents of the city to understand how features changed over time. Utilizing the mobile Survey 123 tool turned out to be an efficient and effective option for collecting reference data. Future work in the city will engage local people, including policymakers, in an attempt to understand the factors that drive change in the city, especially in light of the government of Saudi Arabia embarking on its Vision 2030 initiative (https://vision2030.gov.sa/en), a development that will undoubtedly have implications for rates of migration into Riyadh.
5. Conclusions
Our paper set out to understand how change has occurred in one of the Middle East’s fastest-growing cities, Riyadh. Unlike previous work that sought to understand urban green spaces and forests, our focus was on assessing changes within a desert environment. Our results showed that urban expansion is occurred even in these settings. Whether there are implications for urban green spaces, as measured here by changes in vegetation cover, was inconclusive from our analysis as the two methods gave different results. Our visit to the area suggested that more green spaces are indeed being established in Riyadh. How these are changing over time and the implications these have for global-level processes is a question that requires deeper analysis. Questions like whether the residents of Riyadh desire to have green spaces developed as the city grows and where these should be placed also need to be addressed. Increasing green spaces will have implications for water availability and consumption, the urban heat island, and ecological processes in the region. Similarly, whether residents of Riyadh have a desire for alternative routes of transportation (as opposed to roads) can also have implications for livability in the city. Such questions will be addressed as part of our future research agenda. Our work has therefore allowed us to gauge the status of change within one of the Middle East’s fastest-growing cities and provides the foundation for understanding the drivers and implications of change—in particular, urban growth in an area of the world that has not attracted much attention in the literature.
Author Contributions
The methods were developed by A.A. with support from A.R.C. The manuscript was written by A.R.C. and A.A.
Funding
There are no funding sources for this paper. The authors are grateful to King Abdulaziz City for Science and Technology (KACST), which may use the satellite imagery available. We are grateful to the volunteers in Riyadh who took the time to respond to our survey of land cover classes, which allowed us to measure the accuracy of our imagery classifications. We are also grateful to three anonymous reviewers whose comments helped us to improve the quality of this manuscript.
Conflicts of Interest
The authors declare no conflicts of interest.
References
- Nowosad, J.; Stepinski, T.F.; Netzel, P. Global assessment and mapping of changes in mesoscale landscapes: 1992–2015. Int. J. Appl. Earth Obs. Geoinf. 2019, 78, 332–340. [Google Scholar] [CrossRef] [Green Version]
- Ellis, E.A.; Mathews, A.J. Object-based delineation of urban tree canopy: Assessing change in Oklahoma City, 2006–2013. Comput. Environ. Urban Syst. 2019, 73, 85–94. [Google Scholar] [CrossRef]
- Wolch, J.R.; Byrne, J.; Newell, J.P. Urban green space, public health, and environmental justice: The challenge of making cities ‘just green enough’. Landsc. Urban Plan. 2014, 125, 234–244. [Google Scholar] [CrossRef] [Green Version]
- Taylor, L.; Hochuli, D.F. Defining greenspace: Multiple uses across multiple disciplines. Landsc. Urban Plan. 2017, 158, 25–38. [Google Scholar] [CrossRef] [Green Version]
- M’Ikiugu, M.M.; Kinoshita, I.; Tashiro, Y. Urban green space analysis and identification of its potential expansion areas. Procedia Soc. Behav. Sci. 2012, 35, 449–458. [Google Scholar] [CrossRef] [Green Version]
- Alganci, U.; Sertel, E.; Ozdogan, M.; Ormeci, C. Parcel-level identification of crop types using different classification algorithms and multi-resolution imagery in southeastern Turkey. Photogramm. Eng. Remote Sens. 2013, 79, 1053–1065. [Google Scholar] [CrossRef]
- Aljoufie, M.; Zuidgeest, M.; Brussel, M.; van Maarseveen, M. Spatial–temporal analysis of urban growth and transportation in Jeddah City, Saudi Arabia. Cities 2013, 31, 57–68. [Google Scholar] [CrossRef]
- Aljoufie, M.; Zuidgeest, M.; Brussel, M.; van Vliet, J.; van Maarseveen, M. A cellular automata-based land use and transport interaction model applied to Jeddah, Saudi Arabia. Landsc. Urban Plan. 2013, 112, 89–99. [Google Scholar] [CrossRef]
- Alqurashi, A.F.; Kumar, L.; Sinha, P. Urban land cover change modelling using time-series satellite images: A case study of urban growth in five cities of Saudi Arabia. Remote Sens. 2016, 8, 838. [Google Scholar] [CrossRef] [Green Version]
- Chen, Y.; Li, X.; Liu, X.; Ai, B.; Li, S. Capturing the varying effects of driving forces over time for the simulation of urban growth by using survival analysis and cellular automata. Landsc. Urban Plan. 2016, 152, 59–71. [Google Scholar] [CrossRef]
- Deep, S.; Saklani, A. Urban sprawl modeling using cellular automata. Egypt. J. Remote Sens. Space Sci. 2014, 17, 179–187. [Google Scholar] [CrossRef] [Green Version]
- Hu, Z.; Lo, C.P. Modeling urban growth in Atlanta using logistic regression. Comput. Environ. Urban Syst. 2007, 31, 667–688. [Google Scholar] [CrossRef]
- Nong, Y.; Du, Q. Urban growth pattern modeling using logistic regression. Geo-Spat. Inf. Sci. 2011, 14, 62–67. [Google Scholar] [CrossRef]
- Jat, M.K.; Choudhary, M.; Saxena, A. Application of geo-spatial techniques and cellular automata for modelling urban growth of a heterogeneous urban fringe. Egypt. J. Remote Sens. Space Sci. 2017, 20, 223–241. [Google Scholar] [CrossRef]
- Mustafa, A.; Cools, M.; Saadi, I.; Teller, J. Coupling agent-based, cellular automata and logistic regression into a hybrid urban expansion model (HUEM). Land Use Policy 2017, 69, 529–540. [Google Scholar] [CrossRef] [Green Version]
- Blaschke, T.; Lang, S.; Hay, G.F. (Eds.) Object-Based Image Analysis: Spatial Concepts for Knowledge-Driven Remote Sensing Applications; Springer: Berlin/Heidelberg, Germany, 2008. [Google Scholar]
- Navulur, K. Multispectral Image Analysis Using the Object-Oriented Paradigm; CRC Press, Taylor and Frances Group: Boca Raton, FL, USA, 2007. [Google Scholar]
- Qihao, W. Remote Sensing and GIS Integration: Theories, Methods, and Applications: Theory, Methods, and Applications; McGraw Hill Professional: New York, NY, USA, 2010. [Google Scholar]
- Kabisch, N.; Selsam, P.; Kirsten, T.; Lausch, A.; Bumberger, J. A multi-sensor and multi-temporal remote sensing approach to detect land cover change dynamics in heterogeneous urban landscapes. Ecol. Indic. 2019, 99, 273–282. [Google Scholar] [CrossRef]
- Zurqani, H.A.; Post, C.J.; Mikhailova, E.A.; Allen, J.S. Mapping Urbanization Trends in a Forested Landscape Using Google Earth Engine. Remote Sens. Earth Syst. Sci. 2019. [Google Scholar] [CrossRef]
- Tripathya, P.; Kumar, A. Monitoring and modelling spatio-temporal urban growth of Delhi using Cellular Automata and geoinformatics. Cities 2019, 90, 52–63. [Google Scholar] [CrossRef]
- Bhatta, B.; Saraswati, S.; Bandyopadhyay, D. Urban sprawl measurement from remote sensing data. Appl. Geogr. 2010, 30, 731–740. [Google Scholar] [CrossRef]
- Lal, K.; Kumar, D.; Kumar, A. Spatio-temporal landscape modeling of urban growth patterns in Dhanbad Urban Agglomeration, India using geoinformatics techniques. Egypt. J. Remote Sens. Space Sci. 2017, 20, 91–102. [Google Scholar] [CrossRef]
- Shukla, A.; Jain, K. Critical analysis of rural-urban transitions and transformations in Lucknow city, India. Remote Sens. Appl. Soc. Environ. 2019, 13, 445–456. [Google Scholar] [CrossRef]
- Thapa, R.B.; Murayama, Y. Scenario based urban growth allocation in Kathmandu Valley, Nepal. Landsc. Urban Plan. 2012, 105, 140–148. [Google Scholar] [CrossRef]
- Clarke, K.C.; Hoppen, S.; Gaydos, L. A self-modifying cellular automaton model of historical urbanization in the San Francisco Bay area. Environ. Plan. B Plan. Des. 1997, 24, 247–261. [Google Scholar] [CrossRef] [Green Version]
- Dubovyk, O.; Sliuzas, R.; Flacke, J. Spatio-temporal modelling of informal settlement development in Sancaktepe district, Istanbul, Turkey. ISPRS J. Photogramm. Remote Sens. 2011, 66, 235–246. [Google Scholar] [CrossRef]
- Feng, Y.; Liu, Y.; Tong, X.; Liu, M.; Deng, S. Modeling dynamic urban growth using cellular automata and particle swarm optimization rules. Landsc. Urban Plan. 2011, 102, 188–196. [Google Scholar] [CrossRef]
- Jokar Arsanjani, J.; Helbich, M.; Kainz, W.; Darvishi, B.A. Integration of logistic regression, Markov chain and cellular automata models to simulate urban expansion. Int. J. Appl. Earth Obs. Geoinf. 2013, 21, 265–275. [Google Scholar] [CrossRef]
- Mitsova, D.; Shuster, W.; Wang, X. A cellular automata model of land cover change to integrate urban growth with open space conservation. Landsc. Urban Plan. 2011, 99, 141–153. [Google Scholar] [CrossRef]
- Santé, I.; García, A.M.; Miranda, D.; Crecente, R. Cellular automata models for the simulation of real-world urban processes: A review and analysis. Landsc. Urban Plan. 2010, 96, 108–122. [Google Scholar] [CrossRef]
- Hasbani, G. The 3 Types of City Shaping the Middle East. 2015. Available online: https://www.weforum.org/agenda/2015/05/the-3-types-of-city-shaping-the-middle-east/ (accessed on 26 October 2019).
- General Authority of Statistics. 2017. Available online: https://www.stats.gov.sa/en (accessed on 26 October 2019).
- The TelegraphThe World’s 20 Fastest Growing Cities. 2017. Available online: http://www.telegraph.co.uk/travel/lists/fastest-growing-cities-in-the-world/fastest17/ (accessed on 26 October 2019).
- Kingdom of Saudi Arabia. 2019. Available online: https://vision2030.gov.sa/en (accessed on 26 October 2019).
- Al-Sahhaf, N.A. The Use of Remote Sensing and Geographic Information System Technologies to Detect, Monitor, and Model Urban Change in Riyadh, Saudi Arabia. Ph.D. Thesis, University of California, Santa Barbara, CA, USA, 2000. [Google Scholar]
- The High Commission for the Development of Arriyadh. Population Study of Riyadh City (1437H). 2016. Available online: http://www.ada.gov.sa/idc/groups/public/documents/AR_ADA_Researches/007523.pdf (accessed on 26 October 2019).
- Makky, G.A.W. The booming growth of the city of Riyadh and its effect on the housing market. GeoJournal 1986, 13, 133–141. [Google Scholar] [CrossRef]
- Duro, D.C.; Franklin, S.E.; Dubé, M.G. A comparison of pixel-based and object-based image analysis with selected machine learning algorithms for the classification of agricultural landscapes using SPOT-5 HRG imagery. Remote Sens. Environ. 2012, 118, 259–272. [Google Scholar] [CrossRef]
- Jensen, J.R. Introductory Digital Image Processing: A Remote Sensing Perspective; Prentice Hall, University of South Carolina: Upper Saddle River, NJ, USA, 2005. [Google Scholar]
- Blaschke, T. Object based image analysis for remote sensing. ISPRS J. Photogramm. Remote Sens. 2010, 65, 2–16. [Google Scholar] [CrossRef] [Green Version]
- Hay, G.J.; Castilla, G. Geographic Object-Based Image Analysis (GEOBIA): A new name for a new discipline. In Object-Based Image Analysis: Spatial Concepts for Knowledge-Driven Remote Sensing Applications; Blaschke, T., Lang, S., Hay, G.F., Eds.; Springer: Berlin/Heidelberg, Germany, 2008; pp. 75–90. [Google Scholar]
- Im, J.; Jensen, J.R.; Hodgson, M.E. Object-based land cover classification using high posting density lidar data. Giscience Remote Sens. 2008, 45, 209–228. [Google Scholar] [CrossRef] [Green Version]
- Myint, S.W.; Giri, C.P.; Wang, L.; Zhu, Z.; Gillette, S. Identifying mangrove species and their surrounding land use and landcover classes using an object oriented approach with a lacunarity spatial measure. GISci. Remote Sens. 2008, 45, 188–208. [Google Scholar] [CrossRef]
- Myint, S.W.; Gober, P.; Brazel, A.; Grossman-Clarke, S.; Weng, Q. Per-pixel vs. object-based classification of urban land cover extraction using high spatial resolution imagery. Remote Sens. Environ. 2011, 115, 1145–1161. [Google Scholar] [CrossRef]
- Munoz, X.; Freixenet, J.; Cufi, X.; Marti, J. Strategies for image segmentation combining region and boundary information. Pattern Recognit. Lett. 2003, 24, 375–392. [Google Scholar] [CrossRef]
- Arzandeh, S.; Wang, J. Monitoring the change of phragmites distribution using satellite data. Can. J. Remote Sens. 2003, 29, 24–35. [Google Scholar] [CrossRef]
- Stehman, S.; Foody, G.M. The SAGE Handbook of Remote Sensing. Accuracy Assessment; Sage Publications: New York, NY, USA, 2009; pp. 129–145. [Google Scholar]
- Olofsson, P.; Foody, G.M.; Stehman, S.V.; Woodcock, C.E. Making better use of accuracy data in land change studies: Estimating accuracy and area and quantifying uncertainty using stratified estimation. Remote Sens. Environ. 2013, 129, 122–131. [Google Scholar] [CrossRef]
- Lv, Z.Y.; Liu, T.F.; Zhang, P.; Benediktsson, J.A.; Lei, T.; Zhang, X.K. Novel Adaptive Histogram Trend Similarity Approach for Land Cover Change Detection by Using Bitemporal Very-High-Resolution Remote Sensing Images. IEEE Trans. Geosci. Remote Sens. 2019. [Google Scholar] [CrossRef]
- Shi, C.; Pun, C.-M. Adaptive multi-scale deep neural networks with perceptual loss for panchromatic and multispectral images classification. Inf. Sci. 2019, 490, 1–17. [Google Scholar] [CrossRef]
Figure 1.
Study area.

Figure 2.
The Survey123 data collector developed for this study.

Figure 3.
The outputs of the maximum likelihood classification for 2004.

Figure 4.
The outputs of the maximum likelihood classification for 2014.

Figure 5.
The outputs of the object-oriented classification for 2004.

Figure 6.
The outputs of the object-oriented classification for 2014.

Figure 7.
Changes in Riyadh over the period 2004–2014 as per the maximum likelihood classification.

Figure 8.
Changes in Riyadh over the period 2004–2014 as per the object-oriented classification.


Table 1.
Riyadh’s land cover classes and descriptions.
| Land Cover Class | Descriptions |
|---|---|
| Road | Roadways, parking lots, asphalt-covered surfaces |
| Vegetation | Trees, shrubs, crops, palms (e.g., date Phoenix dactylifera L. and other species) |
| Soil | Land, open area, undeveloped soil surfaces |
| Urban areas | Houses, commercial buildings |
Table 2.
The remotely sensed data used in this study and their respective characteristics.
| Date | Time of Acquisition | Description Coordinate Reference System | Spatial Resolution (m) | Number of Spectral Bands | |
|---|---|---|---|---|---|
| SPOT 5 | 05-02-2004 | 07:40:52 | WGS 84 | 2.5 | 4 |
| 23-01-2014 | 07:04:31 | WGS 84 | 2.5 | 4 |
Table 3.
The proportions of the study area occupied by each land-cover class over the period 2004–2014.
Table 3.
The proportions of the study area occupied by each land-cover class over the period 2004–2014.
| MLC | OOC | |||
|---|---|---|---|---|
| Land Cover Class | 2004 | 2014 | 2004 | 2014 |
| Soil | 54.93% | 41.42% | 61.91% | 47.66% |
| Vegetation | 3.04% | 1.43% | 2.03% | 3.90% |
| Road | 25.47% | 38.08% | 21.55% | 21.92% |
| Urban | 16.56% | 19.07% | 14.52% | 26.52% |
Table 4.
Accuracy assessment for the maximum likelihood classification and object-oriented classification for 2004 and 2014.
Table 4.
Accuracy assessment for the maximum likelihood classification and object-oriented classification for 2004 and 2014.
| Reference Data | |||||||||
|---|---|---|---|---|---|---|---|---|---|
| OOC 2004 | Soil | Vegetation | Road | Urban | Producer Accuracy (%) | User Accuracy (%) | Overall ACCURACY | Kappa Coefficient | |
| Classified data | Soil | 0.442 | 0.000 | 0.076 | 0.101 | 95.12% | 71.43% | 74.71% | 0.75 |
| Vegetation | 0.000 | 0.019 | 0.001 | 0.001 | 67.97% | 95.00% | |||
| Road | 0.000 | 0.000 | 0.177 | 0.039 | 68.62% | 82.05% | |||
| Urban | 0.023 | 0.009 | 0.005 | 0.109 | 43.71% | 75.00% | |||
| 0.465 | 0.028 | 0.258 | 0.249 | ||||||
| OOC 2014 | |||||||||
| Soil | 0.465 | 0 | 0.012 | 0 | 100.00% | 97.56% | 92.36% | 0.84 | |
| Vegetation | 0 | 0.032 | 0.007 | 0 | 70.09% | 80.85% | |||
| Road | 0 | 0.006 | 0.176 | 0.037 | 86.97% | 80.56% | |||
| Urban | 0 | 0.007 | 0.007 | 0.251 | 87.27% | 94.44% | |||
| 0.465 | 0.045 | 0.203 | 0.29 | ||||||
| MLC 2004 | |||||||||
| Soil | 0.444 | 0.000 | 0.058 | 0.047 | 97.88% | 80.85% | 73.79% | 0.68 | |
| Vegetation | 0.000 | 0.030 | 0.000 | 0.001 | 52.82% | 97.30% | |||
| Road | 0.010 | 0.005 | 0.149 | 0.091 | 63.07% | 58.49% | |||
| Urban | 0.000 | 0.022 | 0.029 | 0.115 | 45.34% | 69.57% | |||
| 0.454 | 0.056 | 0.236 | 0.254 | ||||||
| MLC 2014 | |||||||||
| Soil | 0.404 | 0.000 | 0.011 | 0.000 | 96.06% | 97.44% | 90.77% | 0.91 | |
| Vegetation | 0.000 | 0.014 | 0.000 | 0.000 | 58.10% | 100.00% | |||
| Road | 0.017 | 0.000 | 0.315 | 0.050 | 95.22% | 82.61% | |||
| Urban | 0.000 | 0.010 | 0.005 | 0.175 | 77.92% | 91.89% | |||
| 0.420 | 0.025 | 0.330 | 0.225 | ||||||
© 2019 by the authors. Licensee MDPI, Basel, Switzerland. This article is an open access article distributed under the terms and conditions of the Creative Commons Attribution (CC BY) license (http://creativecommons.org/licenses/by/4.0/).
Share and Cite
MDPI and ACS Style
Alghamdi, A.; Cummings, A.R. Assessing Riyadh’s Urban Change Utilizing High-Resolution Imagery. Land 2019, 8, 193. https://0-doi-org.brum.beds.ac.uk/10.3390/land8120193
AMA Style
Alghamdi A, Cummings AR. Assessing Riyadh’s Urban Change Utilizing High-Resolution Imagery. Land. 2019; 8(12):193. https://0-doi-org.brum.beds.ac.uk/10.3390/land8120193
Chicago/Turabian StyleAlghamdi, Ali, and Anthony R. Cummings. 2019. "Assessing Riyadh’s Urban Change Utilizing High-Resolution Imagery" Land 8, no. 12: 193. https://0-doi-org.brum.beds.ac.uk/10.3390/land8120193
Note that from the first issue of 2016, this journal uses article numbers instead of page numbers. See further details here.