Article

The Urbanization Run-Up in Italy: From a Qualitative Goal in the Boom Decades to the Present and Future Unsustainability

Department of Civil and Environmental Engineering, University of L’Aquila, Via Gronchi, 18, 67100 L’Aquila, Italy
*
Author to whom correspondence should be addressed.
Submission received: 5 August 2020 / Revised: 21 August 2020 / Accepted: 24 August 2020 / Published: 27 August 2020

Abstract

:
The research presented in the paper intends to overcome an information gap on the evolution of urbanized surfaces in Italy which in the studies carried out so far have never been available. The only historical data on this form of land use date back to the 1950s, and were extracted from a national cartography created by the Military Geographic Institute. The next chronological section available was then that of the noughties, already digital. However, much more frequent data were processed by the ten-year censuses by the National Institute of Statistics, but concerning buildings and not urbanized areas. By processing building census data, this study has put together some novel information on land take dynamics between the end of World War II and the year 2000, highlighting the more intensive processes that occurred at an extraordinary rate in the ‘70′s and ‘80′s, obtaining unprecedented information on the speed of transformation of the territory in these decades of economic boom. Through this method, we were able to obtain numerous geographical indications previously lacking on a national scale, highlight the yet significant vigor of this phenomenon and develop an inferential scenario.

Graphical Abstract

1. Introduction

In Italy, land take has never been governed strictly at any level, as evidenced by various papers [1,2,3], but merely recorded in terms of its magnitude over time.
Given the mentioned lack of control, even detailed information on development dynamics has only started to be produced in the past five years or so. However, there is a significant gap regarding previous developments, especially the post-World War II economic boom period when growth of urbanized surfaces and built-up parts was at its peak and extremely fast-paced. Following a 10-year study, in 2015 has been published the amount of artificialized land measured in the period between the end of WWII and the early ‘60′s, using the only information available to this end, described in the following section “Materials and Methods” [4]. This time period has the high resolution (1:5000–1:10.000) regional land use maps (LUM), that covered the entire national territory in the first decade of 2000, as its only comparison layer with an equal level of detail.

1.1. State of Art and Available Data

The estimate of the urban evolution on the Italian territory has been the object of numerous research activities in past years, which have been expressed in an increasingly precise way as the technologies available have improved. The earliest example carried out in Italy dates back to 1980 with the national research IT.URB.80, coordinated by Giovanni Astengo [5] which, despite an important effort by 88 researchers in 12 Italian Universities he was able to study land take samples on very narrow sections of the twenty national regions.
In more recent years, research has been produced by the National Observatory on Land Use, established by the the INU (Urban Planning National Institute) (http://www.inu.it/attivita_inu/ONCS_2.html) which, however, made use of comparatively recent information bases (late 1970s). Other authors have highlighted the ways of modifying the landscape using large-scale national databases or European standards such as CLC (Corine Land Cover) [6,7] deriving from a satellite remote sensing on a nominal scale of 1:100,000 [8,9]. Other data have been processed by ISTAT (National Statistical Institute) and the information derives from the census that the Institute conducts at national level [10] and, in particular, referring to companies operating in the agricultural sector.
Besides the ISPRA-SNPA data [11,12,13] and ISTAT [14], other contributions in italian language of research bodies and non-profit associations that have been working on the topic for a long time cannot be overlooked. The Politecnico di Milano, with its CRCS (Center for Research on Land Take) has been publishing a report on urbanization in Italy for some years [15] and, on localized study areas and recent chronological sections, have addressed the long-term evolution of the residential building [16] or on regional areas the dynamics of urbanized areas [17,18,19,20,21,22]
Over the past years, these recording efforts—Currently carried out by the most authoritative national statistics and data collection agencies such as the Central Institute of Statistics (Istituto Centrale di Statistica—ISTAT) and the Higher Institute for Environmental Protection and Research (Istituto Superiore per la Protezione e la Ricerca Ambientale—ISPRA)—Have reached excellent levels in terms of both spatial resolution and monitoring frequency.
The lack of data collection on urban growth is also due to the low efficiency of Italian planning which, since the 1980s, has been repeatedly emphasized by even authoritative researchers, but mainly with works in Italian [23,24,25].
In other countries, on the contrary, the modeling of urban growth has been a very active research issue, even with the use of advanced computational methods for a long time, with research widely placed in the international scientific literature [26,27,28,29,30,31], which can also make use of numerous synthesis and review works [32,33,34,35].

1.2. Research Proposal

Despite the proliferation of attention on the subject by large groups of researchers, over the past 50 years, in Italy no cartographical data with significant resolution were produced on how urban land has evolved at intermediate and homogenous time intervals throughout the country, such as those available in other countries, for example the USA with time intervals between 1920, 1950, 1980 and 2010 [36] or other countries [37,38,39,40,41,42]). Available data on the extent of urbanized parts only concern recent years, while there is a total lack of data for the period between the ‘50′s and 1990 and it is precisely evolution in this period of time that this work intends to investigate.
It is important to consider that it was a period when settlement transformation occurred at an extraordinarily fast pace. After the end of the Second World War, between 1949 and 1963, thanks to the Marshall Plan [43] and the INA-Casa Program (National Insurance Institute-Housing Program), an extraordinary number of residential buildings were built (more than 20,000 with 350,000 accommodations).
Only some fragmentary data on this fundamental time period that changed the face of the entire country can be retrieved from a few regions/provinces/municipalities, while data covering the entire national territory is unavailable. However, since the ‘60′s, ISTAT has conducted historical surveys of buildings broken down per construction decades and therefore covering the time periods of the ‘70′s, ‘80′s and ‘90′s as well. The data obtained from the ten-year censuses of the ISTAT are in tabular format only and therefore not geographically referenced.
In our study we linked the geographical information on urbanized surfaces available in the two known time periods (1950s and 2000) with the chronological distribution of buildings. We assumed that their presence tallies with a certain spread of urbanized areas and that therefore their size will be consistent with the growth of built-up volumes. There are surely some significant approximations tied to the matching of areas occupied by buildings with those covered by appurtenances. The proposed research therefore intends to cover, using only available data, the information gap on the evolution of urbanized surfaces present between 1950 and 2000 and this is the characteristic that distinguishes it from the others mentioned in the introduction. However, outside historical city centers, this ratio varies considerably over time and so we can rely on the fact that, to some extent, large-scale differences are absorbed. At any rate, we then tested our model by comparing it with the long-term statistical scenario (2050) developed by ISPRA and were able to acknowledge that two inferential results converge greatly.

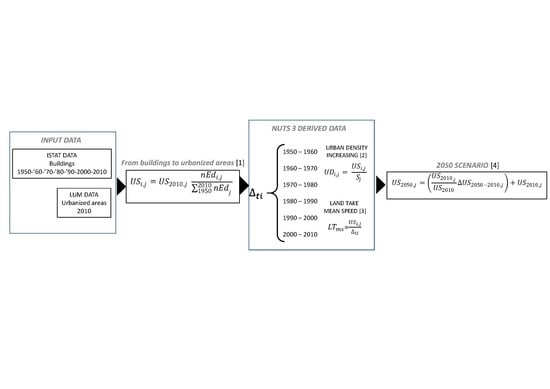
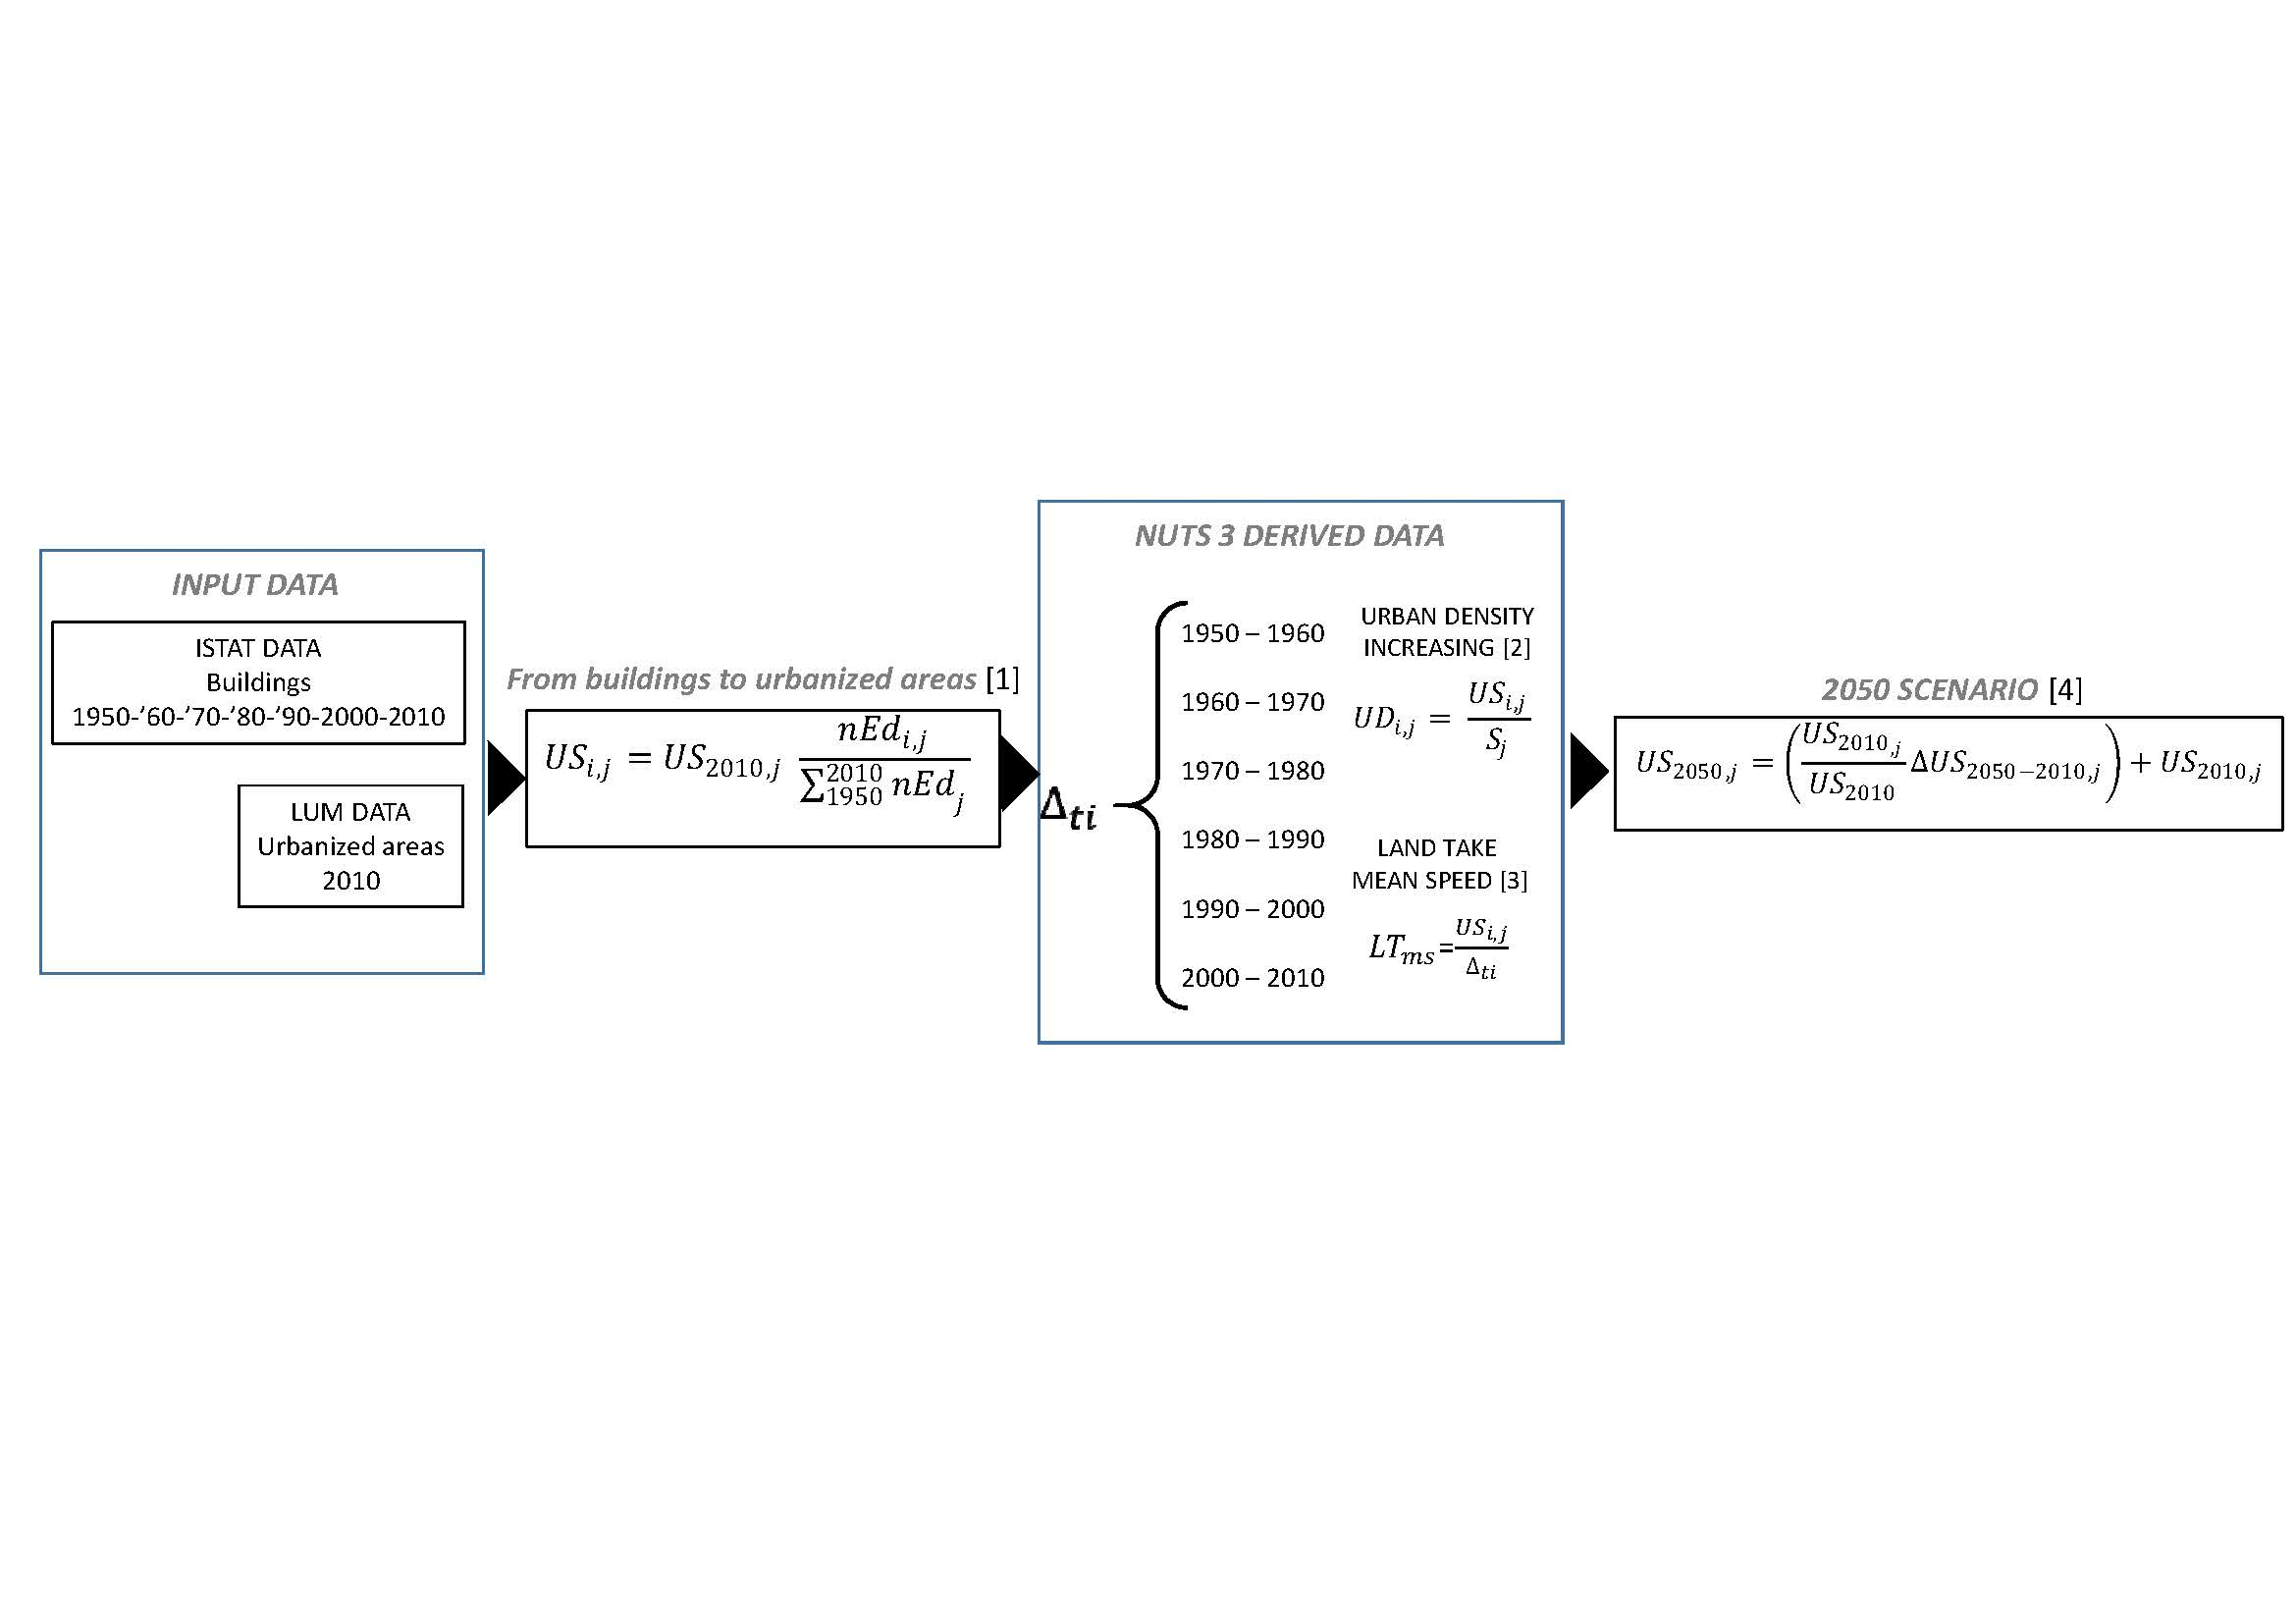
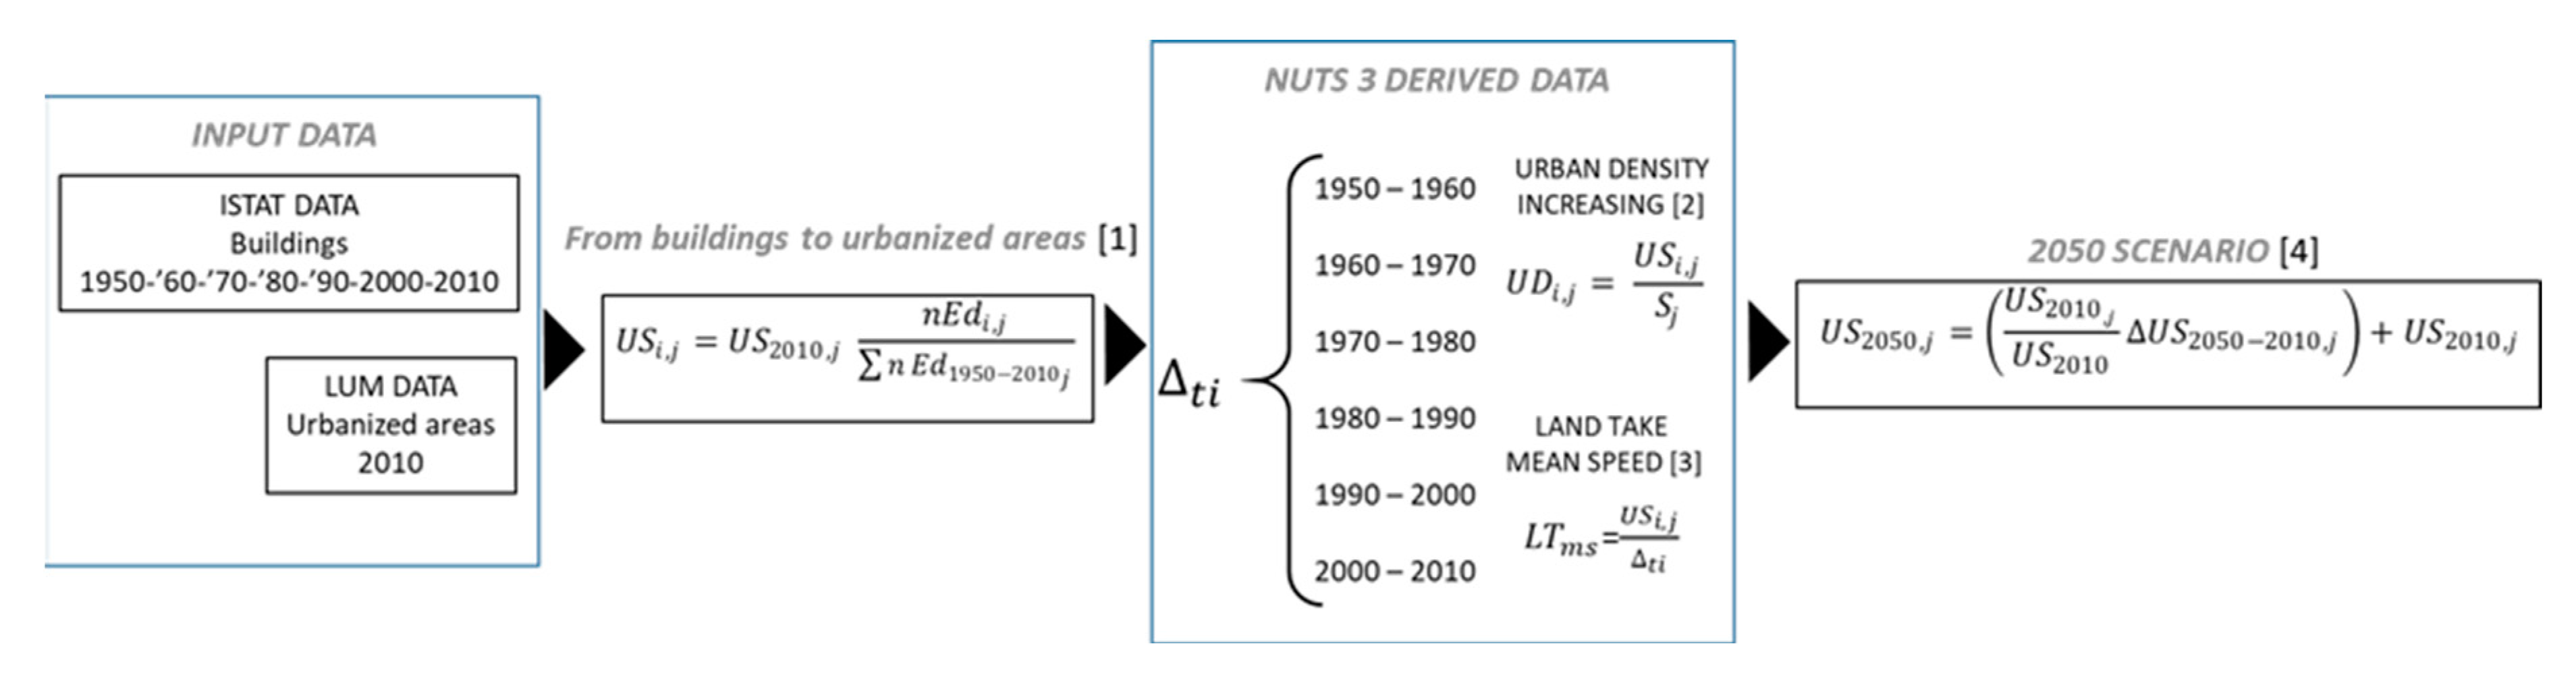
2. Materials and Methods

Some basic data have already been illustrated by the authors of this work previously [44] and are recalled here. In the study presented in this paper, as our starting measurement data, we used the paper maps published by the Italian Military Geographic Institute at a scale of 1:25,000 with an update between 1949 and 1962 [45] and organized in 3545 elements. The urbanized parts ((parking areas, streets within neighborhoods, goods storage and handling areas and various other structures) have been digitized after geo-referencing the raster maps. The urban surfaces after 2000 come from land use maps made by the regions (LUM) from aerial photos and updated between 2000 and 2008. In evaluating these regional data, certain tolerances must be taken into account in their mutual compatibility, due to partially different methods of detection also linked to the variations with which the urban settlement develops in the different regions. In fact, it should not be forgotten that Italy is a morphologically very complex country and this heterogeneity also conditions the location and the shape of the urban parts [46,47]. More up-to-date and efficient data were produced from 2015 onwards by the National Environmental Research Institute [48]. http://groupware.sinanet.isprambiente.it/uso-copertura-e-consumo-di-suolo/library. Monitoring occurs through the production of a national land use map on a raster basis (regular grid), using data from Copernicus and, in particular, the Sentinel-2 mission [49,50] launched in June 2015, that provides multispectral data with a 10-m resolution, suitable for both photo-interpretation and semi-automatic classification processes, but they were not used in this research because they include extra-urban roads.
Instead, the demographic data we used comes from ISTAT censuses that every ten years have been producing information on the inhabitants residing in Italian municipalities since 1861 (Table 1).
Our study has helped extrapolate urban dynamics in intermediate historical periods between 1950 and 2010 through information on the time of construction of buildings in the 110 Provinces (NUTS 3 [51], produced by ISTAT (Istituto National di Statistica) since 1918 through the collection of decennial census data: http://dati-censimentopopolazione.istat.it/Index.aspx?DataSetCode=DICA_EDIFICIRES), available per province cluster (NUTS 3) (Figure 1).
As a matter of fact, ISTAT provides similar historical data for municipality clusters (NUTS 4) too, but considering residential buildings only and not total buildings.
The buildings censused by ISTAT until 1960 are almost 6 million, while another 8,700,000 were erected between 1960 and 2010. However, working directly on building data is not very significant, as in Italy, more than in other countries, differences in size can be huge and there is no way of credibly calculating volumes: the only extractable data is the per capita distribution of buildings, which dropped from 8.4 inhab/building in 1960 to 4.0 in 2010. Instead, linking urbanized areas to buildings is relatively easier, although the model we used also entails a broad range of uncertainties. It is certainly true that areas follow the location of erected volumes, but there is no clear-cut match between building-covered surfaces and land property with a cover ratio that can vary greatly. On average, in historical city centers, it nears 100%, while in post-WWII urban areas it can vary from a minimum of 20–30% to a maximum of 70–80%. Figures depend largely on the various uses made of buildings, e.g., residential, production or commercial. Considering the 6 decennial time periods provided by ISTAT regarding buildings (until 1960, 1970, 1980, 1990, 2000 and 2010), urbanized areas and the corresponding density for every j-teenth province have been estimated using the following relations:
U S i , j = U S 2010 , j   n E d i , j   n   E d 1950 2010 j
U D i , j =   U S i , j S j
where USi,j = Urban surface in the i-teenth time period (with variable i between 1950, 1960, 1970, 1980, 1990, 2001 and 2010) in the j-teenth province, US2010,j = Urban surface in the 2010 time period in the j-teenth province, nEdi,j = Number of buildings in the i-teenth time period in the j-teenth province,   n   E d 1950 2010 j   = Total number of buildings from 1950 to 2010 in the j-teenth province, UDi,j = Urban density in the i-teenth time period in the j-teenth province, Sj = Area of the j-teenth province (NUTS 3).
The sequence of method steps that will be used in the result section is anticipated in the scheme of Figure 2 where the analytical relations used to calculate the various quantities are indicated, with their progressive number.

3. Results

A parameter that has varied greatly between the end of the ‘50′s and the present day is the cover ratio defined as C r = S e d L P , that is to say as the ratio between the surface covered by one building or groups of buildings (Sed) and the corresponding private land property (LP), used as appurtenances (parking lots, green areas, private car traffic and pedestrian paths) of residential, production and commercial buildings. It is important to take into account that LP is a part of US included in relation [1] since US = LP + Su1 + Su2 where Su1 is the surface used for public roads and Su2 the surfaces used for public utilities. Until the ‘50′s, the LP was approximately 900 m2 on average, while it increased two-fold in urbanized areas erected between the 1950s and 2010, for obvious reasons tied to the change in building types. As a matter of fact, there is a greater demand for parking and maneuvering areas as a result of the increase in high dispersion, low density residential buildings and production/commercial/office buildings, all typically marked by large urbanized surfaces and limited built-up areas. In Figure 3 the trend curves relating to the two growth trends of the urbanized area from 1950 to 1980 and from 1990 to 2010 have been traced. Considering the ten-year average urban growth rates in the two periods, calculated by means of functions1 [3], the two projections to 2050 were made.
α 1 = U D 1980 U D 1950 3 1 ;   α 2 = U D 2010 U D 1990 1
where: α1 = ten-year average rate of variation of urban density (UD) in the chronological interval 1950–1980, α2 = ten-year average rate of variation of urban density (UD) in the chronological interval 1990–2010.
Figure 3 clearly shows that the slope of the land take curve determined by the previously mentioned INA-CASA program continued for another twenty years after the end of the program, showing the first signs of a downturn only in the mid-1980s. At this point, saturation and the first signs of a market crisis came into play and produced their more significant effects starting from 2000. The vigor of those 35 years post-WWII was extraordinary and had it not been for the building sector crisis and market saturation, it would have led the country towards a 13% urbanization density (the highest Italian regional density found only in Lombardy) in 2050! The average land take rate has been estimated to range between 70 and 80 ha per day in the fifty years post WWII, but the diagram in Figure 2 shows that in the twenty-year period between 1960 and 1980 peaks of almost 100 ha/day were reached, that is to say very close to the mark reached in Germany until 2000 (129 ha/day), before the enactment of legislation to curb land take in 2002 [52,53,54,55,56]. Once this phenomenon was mitigated between 1990 and 2010, this parameter settled at a fairly high value of about 40 ha/day.
Figure 4 clearly shows that the rate slowed down after 1980 from North to South, but that in some areas, such as the Po Valley, the area of Rome and Salento in Puglia, land take is still significant.
The application of equations [1] and [2] helps map urbanization density per time period and provincial district (NUTS 3) shown in Figure 5, as well as mean urbanization rates in the different periods analyzed.
In the 1950–1960 decade central and northern Italy and the Naples-Rome stretch change face, while in the following ten years the North consolidates the levels reached and urbanization increases southwards. The conditions in the ‘80′s, as shown in Figure 3, are of initial stabilization with a configuration that persists to the present day.
It is interesting to note the “resistance” to urban spread from a geographical perspective: the Apennines and the Maremma area hold until the ‘70′s, after which only the central Apennines, a few areas of the Alps (Valle d’Aosta and Bolzano), Basilicata and central-eastern Sardinia continue to hold. In the following decades, however, there was surely slower local intensification that mainly concerned the geographical system of the Po Valley, the hinterland of Rome, Sicily and Salento. Today, there are only very few, morphologically harsh or economically disadvantaged, medium-low density territorial sections with clear signs of pressure, such as the central Apennines and Basilicata. Following the stagnation witnessed until 2000, it is important to highlight the renewed increase in the hinterland of Naples, the area north of Rome and the Tuscan coast. The development of the scenario at 2050 for the NUTS 3 provincial districts is based on the following relation linking proportionally disaggregated values with those measured in 2010.
U S 2050 , j = ( U S 2010 , j U S 2010 Δ U S 2050 2010 , j ) + U S 2010 , j
L T m s = U S i , j Δ t i   ( m 2 / day )
where US2050,j = Urban surface scenario at 2050 in the j-teenth province, Δ S 2050 2010 , j = Difference between surface estimated from the inferential curve for 2050 (Figure 3) and 2010 in the j-teenth province, L T m s   = land take mean speed ( Δ t i   =   days in ten years ) .
The diagram in Figure 3 already includes a sector scenario for the next thirty years and shows that the current trend underway since 1990 and confirmed in the past two decades, can potentially lead to a 2% increase in national density by 2050 (from 6.8% to 8.8%). The expected value of 8.8% is equivalent to an additional 700,000 ha (700 km2) approximately over the next thirty years. It is possible to perform a preliminary validation test of the model using the ISPRA data [13]. Indeed, the results come close to the estimates of this source dated 2018 that talks about 800,000 ha approximately, including however the entire road network. ISPRA actually puts forward three scenarios based on different economic and political conditions:
(a)
818 km2 of land lost between 2017 and 2050 in case of gradual reduction, zero in 2050, of the land take rate provided for by the bill debated at the Senate between 2016 and 2017;
(b)
1672 km2 in case the rate of the past year is maintained—A rather low rate due to the economic crisis;
(c)
Between 700 and 800 km2 in case economic recovery increases the land take rate to the mean or maximum values of the past decades.
Aside from the indication suggested by hypothesis (b), based on a far too short time period to be reliable, the values obtained in hypotheses (a) and (c) are in line with those formulated in our study, although based on different approaches, and so the results can be considered statistically reasonable. Some differences, that emerge even in the comparisons made below, depend on the fact that ISPRA data do not include waterways, but comprise interurban roads, as mentioned earlier.
ISPRA again [12] recalls that Europe and the United Nations call for the protection of land, environmental heritage, landscape and the recognition of the value of natural capital. Furthermore, they urge us to bring net land take to zero by 2050 [57], make it fall into line with demographic growth and not to increase land degradation by 2030 [58].
Linking urbanization dynamics to population dynamics is surely one of the soundest aspects which legislation should refer to and would help raise control to more efficient standards than today. Figure 6 shows the steady growth over time of the per capita urbanization index, due to the fact that urbanized surfaces have increased despite the substantial stability of the demographic curve. This ratio is also highlighted in all the provinces analyzed (Figure 6) where urbanized areas have grown despite extremely varying trends. In at least one third of the sample, these trends were negative, while for another third they were below +20%. Despite these demographic conditions, urbanization growth was rarely below 200%.
Based on the average decennial rate, which today can be estimated starting from 1980 (1.6%), the demographic projection for 2050 suggests an additional population of 3,800,000 inhabitants, against an increase in land take estimated at 700,000 ha, raising per capita urbanization from 350 to 435 m2/inhab. (Figure 7).

4. Discussion

The research presented in the paper is the only one that reconstructs the scenario of retrospective land take between the 1950s and 2000 with seven temporal sections, however, as already indicated in the previous introduction, it fits into a dense pattern of others studies and research, published mainly in italian language. The same methodology could be interesting to reapply if in the future data are available on the different types of buildings/urbanized areas, which are currently still too little detailed. As has already been stated several times, the most widespread and reliable institutional data come from ISPRA e SNPA [13] and the foregoing considerations show that land take in Italy has not ceased and the magnitude of recent dynamics is certified precisely by the ISPRA annual reports. This is clearly a phenomenon that fluctuates greatly from year to year owing to innumerable political, economic and social events affecting a large number of variables that can hardly be identified in their entirety. It is important to bear in mind that in Italy urban transformation control is left entirely in the hands of the almost 8000 municipalities and therefore cannot be tracked or monitored at higher levels. As mentioned in our Introduction, we can only measure the effects after changes have actually occurred, but the meaning of this can only be interpreted over a period of at least five years. The previously mentioned ISPRA can provide data on a multi-monthly basis, but it is clear that even extreme variations can be expected from one short period to another. For example, the data extrapolated from November 2015 to June 2016 certify that 50 km2 of land were converted for urban use equivalent to an average rate of almost 30 ha/day [11]. These are residual land take dynamics amounting to as much as 34% compared to the mean of the past 50 years (80 ha/day), suggesting that the vigor of this phenomenon is hardly negligible. In terms of sampled simulation, it is important to bear in mind that 50 km2 are more or less equivalent to the surface of a city like Modena, a town of almost 200,000 inhabitants in the Po Valley. However, in the following report on the 2016–2017 period, ISPRA again (2018), estimates an increase of 52.1 km2, but this time on an annual basis, which is equivalent to 14.2 ha/day, that is to say a halved rate compared to the previous period.
All the data quoted concern, however, quite recent chronological sections (from the 1990s onwards) and, in the cases in which they go further back, they refer to restricted areas for which measured data are available. So the substantial difference between the present research and other one is in fact precisely in having made an estimate of the chronological evolution of the phenomenon over seven time sections, calculating the trend curve in a detailed way between the 1950s and 2000. So, as mentioned earlier, reliable estimates can be made over longer time periods. However, given the lack of targeted national legislation, it may be held that urban growth is not coming to a halt and is controlled only by economic and real estate market trends that have been undoubtedly affected by supply saturation over the past few years. The figures at stake are at any rate alarming. The 2050 scenario described in this paper, which estimated about an additional 700,000 ha, is matched by a sampled simulation equal to over twenty-fold the current size of Rome within the ring road: a quantity of urbanized surfaces that would be distributed in provinces, according to the scheme of the map shown in Figure 5, 90% of which would affect flatlands, as evidenced by various sources [59,60]. An excerpt of this map (Figure 8) shows that, according to a statistical assessment based on previous years, the only provinces that would retain a mean urbanization density below 2% are mountain provinces, such as Aosta (3261 km2) and L’Aquila (5048 km2) or economically weak ones such as Matera (3479 km2), accounting for an overall surface below 4% of the national one.

5. Conclusions

As has been said and clarified in the introduction and results section, the objective of the work presented was to calculate the progression dynamics of urban growth between 1950 and 2010 in the chronological sections 1960, 1970, 1980 and 1990 for the which the country has no homogeneous cartographic surveys. These data were obtained from the only analytical information available for these periods provided by ISTAT, but concerning the buildings and not the urbanized areas. This calculation procedure revealed urban growth rates that were not known, particularly between the 1960s and 1980s, with peaks of almost 100 ha per day comparable to those in European countries such as Germany. This assessment also made it possible to derive a fairly reliable scenario curve for 2050.
The data and dynamics described clearly show that Italy is faced with a territorial emergency owing to the excessive pressure—mostly outside any form of strategic control—exerted by urbanization. To tackle this issue, it will be necessary to swiftly produce national legislation first, followed by highly effective regional legislation from an operational standpoint.
The control of the land take phenomena, and of the policies and techniques of inversion of its excess, have already been addressed by some authors [61,62,63,64,65,66,67], however, it is clear that “molecular” planning [68], performed almost autonomously by municipalities as mentioned earlier, will not help govern land take in any way. These NUTS 4 local governments plan and manage the construction of all the parts forming settlements in a minute territorial grid of about 37 km2 (average surface of Italian municipalities), that in 20% of cases is even below 10 km2. For the time being the matter has not gone beyond the technical and scientific debate, although some policy-makers have started to consider it in recent years. There are 11 draft laws on land that have been at a standstill in parliament for a long time, while some regions are working on regional legislation. The idea that is gaining ground is undoubtedly positive (no net land take) and based on a mechanism to balance the size of newly transformed parts and regenerated blighted areas. However, these procedures are in fact unfeasible without a control room to monitor planning and actions and organize the very complex stages of compensating newly constructed parts and regenerated areas. And it is unthinkable that municipalities can act independently achieving significant results outside rules fixed at higher levels.
On the basis of these last considerations, it seems rather clear that a control room like the one proposed will have to be managed by the regions and not by the municipalities, which will have to be technically able to provide their planning tools, and related updates, in standard formats such as to allow assessments of land use. A procedure of this type is already present in many Italian regions as regards the environmental assessments of the plans and therefore could easily be extended also to the extent of new urbanization. It is well known that the Italian regions have a different degree of ability and maturity in governing their territories, but currently it can be assumed that they all possess the technical background to monitor urban growth phenomena in a uniform and comparable way, provided they are guided by national rules that are currently not present. There are numerous examples of national direction on the activity of the regions, and one of the most significant is given by the legislative decree 22.1.2004, n.42 which obliges the latter to draw up a landscape plan on their entire territory of competence, so it would be possible to apply an instrument of this type also to the town planning instruments of the municipalities. The different and heterogeneous physical, economic, social, administrative and developmental morphologies of the Italian regions will certainly not make easy an attempt to regularize the territorial planning procedures for the purpose of measuring and controlling urbanization, but it is clear that without centralized information each objective to limit or reverse the land take over time is likely to fail.
The method presented shows in fact how the dynamics studied have been very inhomogeneous for geographical areas and chronological sections and the lack of constant information over time, clearly due in the past also to the unavailability of adequate technologies, has led the country to passively suffer the phenomenon of land take without ever checking it. Since 1996, however, the first European digital data on land use (CLC), and therefore also on urbanization, has been available, which are combined with the data on construction already produced by ISTAT. Therefore it will be possible from now on to use the monitoring method presented in the paper at each territorial level, passing directly from the size of the buildings to that of the relative urbanizations with acceptable tolerances.
The latter consideration is also linked to a key issue that needs to be urgently tackled and concerns the ability of public bodies and communities to anticipate ex ante settlement transformation prospects, that is to say regularly have zonal and dimensional indications of urban development plans. Today, this is not possible, since these data are not accessible in their entirety and easily, so monitoring of settlement development focuses only on what has already occurred (see studies and previously mentioned ISPRA reports). As a result it is not possible to govern processes before they actually occur. As mentioned earlier, this situation is basically caused by the central (exclusive) role played by municipalities in urban planning, whereby “real” information on the use of land can only be consulted at this spatial micro-level. Consequently, Italy is faced with the problem of the lack of supra-municipal strategic planning, as well as tools at lower levels, such as the regional mosaicking of municipal plans that could provide useful information on what will happen in a ten-year timespan. We believe that the situation we have described deserves to be handled as an emergency, as suggested by the title of this paper. The problems that the work carried out has shown, due to the lack of government surveys neglected for decades on urban evolution, can be very useful for those countries that are currently experiencing rapid growth, to convince research institutions to systematically and constantly collect data on urbanized surfaces, not limited to their quantity, but extended to the quality and typology of buildings and urbanized areas. These data are of fundamental importance in the future in order to be able to implement policies to correct the transformations and adaptive control on a phenomenon that is of capital importance for every nation.

Author Contributions

Conceptualization, Writing—original draft, Supervision, B.R.; Data curation, L.F., F.Z.; Software, A.M. All authors have read and agreed to the published version of the manuscript.

Funding

This research received no external funding.

Acknowledgments

We thank Cheryl Di Lorenzo for her precious collaboration in the preparation of the text. and the anonymous reviewers who, with their comments, have allowed us to significantly improve the quality of the paper.

Conflicts of Interest

The authors declare no conflict of interest.

References

  1. Romano, B.; Zullo, F.; Marucci, A.; Fiorini, L. Vintage Urban Planning in Italy: Land Management with the Tools of the Mid-Twentieth Century. Sustainability 2018, 10, 4125. [Google Scholar] [CrossRef] [Green Version]
  2. Fiorini, L.; Zullo, F.; Marucci, A.; Romano, B. Land take and landscape loss: Effect of uncontrolled urbanization in Southern Italy. J. Urban Manag. 2019, 8, 42–56. [Google Scholar] [CrossRef]
  3. Strollo, A.; Smiraglia, D.; Bruno, R.; Assennato, F.; Congedo, L.; De Fioravante, P.; Giuliani, C.; Marinosci, I.; Riitano, N.; Munafò, M. Land consumption in Italy. J. Maps 2019, 16, 113–123. [Google Scholar] [CrossRef]
  4. Romano, B.; Zullo, F.; Fiorini, L.; Marucci, A.; Ciabo, S. Land transformation of Italy due to half a century of urbanisation. Land Use Policy 2017, 67, 387–400. [Google Scholar] [CrossRef]
  5. Astengo, G.; Nucci, C. (Eds.) It.Urb.80, Rapporto Sullo Stato Dell’ubanizzazione in Italia; Quaderni di Urbanistica Informazioni, 8; INU: Rome, Italy, 1990. [Google Scholar]
  6. Bossard, M.; Feranec, J.; Otahel, J. Corine Land Cover Technical Guide; EEA Technical report 40; European Environment Agency: Copenhagen, Danmark, 2000; p. 105.
  7. APAT. La Realizzazione in Italia del Progetto Europeo Corine Land Cover 2000; Rapporti 36/2005; APAT: Roma, Italy, 2005. [Google Scholar]
  8. Falcucci, A.; Maiorano, L. Land Use and Misuse: Landscape Changes in Italy since. In Riconquistare Il Paesaggio, La Convenzione Europea del Paesaggio e La Conservazione della Biodiversità in Italia; Teofili, C., Clarino, S., Eds.; MIUR: Rome, Italy, 2008; pp. 176–187. [Google Scholar]
  9. Berdini, P. Il Consumo di Suolo in Italia: 1995–2006; Democrazia e diritto, 1; FAngeli: Milano, Italy, 2009; pp. 60–73. [Google Scholar]
  10. ISTAT. Rapporto Annuale La situazione del Paese nel; ISTAT: Rome, Italy, 2009.
  11. ISPRA. Consumo di Suolo, Dinamiche Territoriali e Servizi Ecosistemici; ISPRA: Rome, Italy, 2017; p. 186.
  12. Munafò, M.; Marinosci, I. Consumo di Suolo, Dinamiche Territoriali e Servizi Ecosistemici; ISPRA: Rome, Italy, 2018; p. 280.
  13. Munafò, M. (Ed.) Consumo di Suolo, Dinamiche Territoriali e Servizi Ecosistemici; Edizione 2019; Report SNPA; ISPRA: Roma, Italy, 2019; p. 224. ISBN 9788844809645.
  14. ISTAT. Forme, Livelli e Dinamiche Dell’Urbanizzazione in Italia; ISTAT: Rome, Italy, 2017; p. 350. ISBN 9788845819162.
  15. Arcidiacono, A.; Di Simine, D.; Ronchi, S.; Salata, S. (Eds.) Consumo di Suolo, Servizi Ecosistemici e Green Infrastructures: Caratteri Territoriali, Approcci Disciplinari e Progetti Innovativi; CRCS: Milan, Italy, 2018; p. 185. [Google Scholar]
  16. Abbatini, D.; Ferrara, A. Il consumo di suolo nelle principali realtà urbane letto attraverso le fonti censuarie: Lettura delle dinamiche di lungo periodo dell’edificato residenziale. In La Dimensione Europea del Consumo di Suolo e le Politiche Nazionali; Arcidiacono, A., Di Simine, D., Oliva, F., Ronchi, S., Salata, S., Eds.; CRCS, INU: Milan, Italy, 2017; pp. 89–92. [Google Scholar]
  17. Martellozzo, F.; Clarke, K.C. Measuring urban sprawl, coalescence, and dispersal: A case study of Pordenone, Italy. Environ. Plan. B. 2011, 38, 1085–1104. [Google Scholar] [CrossRef]
  18. Torre, C.; Bonifazi, A.; Arcidiacono, A.; Ronchi, S.; Salata, S. (Eds.) Il Consumo di Suolo in Puglia—2017; MitoLab Bari: Bari, Italy; CRCS: Milan, Italy, 2017; p. 342. [Google Scholar]
  19. Ferrara, A.; Lipizzi, F.; Mugnoli, S. Il consumo di suolo nelle principali realtà urbane letto attraverso le fonti censuarie: Livelli, forme e recente dinamica. In La Dimensione Europea del Consumo di Suolo e le Politiche Nazionali; Arcidiacono, A., Di Simine, D., Oliva, F., Ronchi, S., Salata, S., Eds.; CRCS, INU: Milan, Italy, 2017; pp. 93–98. [Google Scholar]
  20. Bellingeri, D.; Fasolini, D. Il monitoraggio multitemporale del consumo di suolo a scala regionale in Lombardia: Analisi integrata della cartografia DUSAF e di dati satellitari. In La Dimensione Europea del Consumo di Suolo e le Politiche Nazionali; Arcidiacono, A., Di Simine, D., Oliva, F., Ronchi, S., Salata, S., Eds.; CRCS, INU: Milan, Italy, 2017; pp. 99–103. [Google Scholar]
  21. Cosentino, C.; Amato, F.; Murgante, B. “Population-Based Simulation of Urban Growth: The Italian Case” Study. Sustainability 2018, 10, 4838. [Google Scholar] [CrossRef] [Green Version]
  22. Martellozzo, F.; Amato, F.; Murgante, B.; Clarke, K.C. Modelling the impact of urban growth on agriculture and natural land in Italy to 2030. Appl. Geogr. 2018, 91, 156–167. [Google Scholar] [CrossRef] [Green Version]
  23. Salzano, E. La Città Sostenibile; Edizioni della Autonomie: Roma, Italy, 1992; p. 445. [Google Scholar]
  24. Gibelli, M.C.; Salzano, E. No Sprawl; Alinea: Firenze, Italy, 2006. [Google Scholar]
  25. Indovina, F. (Ed.) Dalla Città Diffusa All’Arcipelago Metropolitano; Angeli: Milan, Italy, 2009; p. 298. ISBN 9788856811704. [Google Scholar]
  26. Lagarias, A. Urban sprawl simulation linking macro-scale processes to micro-dynamics through cellular automata, an application in Thessaloniki, Greece. Appl. Geogr. 2012, 34, 146–160. [Google Scholar] [CrossRef]
  27. Maktav, D.; Erbek, F.S. Analysis of urban growth using multi-temporal satellite data in Istanbul, Turkey. Int. J. Remote Sens. 2005, 26, 797–810. [Google Scholar] [CrossRef]
  28. Zhang, Q.; Ban, Y.; Liu, J.; Hu, Y. Simulation and analysis of urban growth scenarios for the Greater Shanghai Area, China. Comput. Environ. Urban Syst. 2011, 35, 126–139. [Google Scholar] [CrossRef]
  29. Al-shalabi, M.; Billa, L.; Pradhan, B.; Mansor, S.; Al-Sharif, A.A. Modelling urban growth evolution and land-use changes using GIS based cellular automata and SLEUTH models: The case of Sana’a metropolitan city, Yemen. Environ. Earth Sci. 2013, 70, 425–437. [Google Scholar] [CrossRef]
  30. Mustafa, A.; Teller, J. Self-Reinforcing Processes Governing Urban Sprawl in Belgium: Evidence over Six Decades. Sustainability 2020, 12, 4097. [Google Scholar] [CrossRef]
  31. Dadashpoor, H.; Azizi, P.; Moghadasi, M. Analyzing spatial patterns, driving forces and predicting future growth scenarios for supporting sustainable urban growth: Evidence from Tabriz metropolitan area, Iran. Sustain. Cities Soc. 2019, 47, 101502. [Google Scholar] [CrossRef]
  32. Herold, M.; Goldstein, N.C.; Clarke, K.C. The spatiotemporal form of urban growth: Measurement, analysis and modelling. Remote Sens. Environ. 2003, 86, 286–302. [Google Scholar] [CrossRef]
  33. Sudhira, H.S.; Ramachandra, T.V.; Jagadish, K.S. Urban sprawl: Metrics, dynamics and modelling using GIS. Int. J. Appl. Earth Obs. Geoinf. 2004, 5, 29–39. [Google Scholar] [CrossRef]
  34. Triantakonstantis, D.; Mountrakis, G. Urban Growth Prediction: A Review of Computational Models and Human Perceptions. J. Geogr. Inf. Syst. 2012, 4, 26323. [Google Scholar] [CrossRef] [Green Version]
  35. Li, X.; Gong, P. Urban growth models: Progress and perspective. Sci. Bull. 2016, 61, 1637–1650. [Google Scholar] [CrossRef]
  36. Barrington-Leigh, C.; Millard-Ballb, A. A century of sprawl in the United States. Proc. Natl. Acad. Sci. USA 2015, 112, 8244–8249. [Google Scholar] [CrossRef] [Green Version]
  37. Robinson, I.M. Canadian Urban Growth Trends: Implications for a National Settlement Policy; University of British Columbia Press: Vancouver, BC, Canada; London, UK, 1981; 154p. [Google Scholar]
  38. Masek, J.G.; Lindsay, F.E.; Goward, S.N. Dynamics of urban growth in the Washington DC metropolitan area, 1973–1996, from Landsat observations. Int. J. Remote Sens. 2000, 21, 3473–3486. [Google Scholar] [CrossRef]
  39. He, Q.; Song, Y.; Liu, Y.; Yin, C. Diffusion or coalescence? Urban growth pattern and change in 363 Chinese cities from 1995 to 2015. Sustain. Cities Soc. 2017, 35, 729–739. [Google Scholar] [CrossRef]
  40. Abrantes, P.; Fontes, I.; Gomes, E.; Rocha, J. Compliance of land cover changes with municipal land use planning: Evidence from the Lisbon metropolitan region (1990–2007). Land Use Policy 2016, 51, 120–134. [Google Scholar] [CrossRef]
  41. Nicolau, R.; David, J.; Caetano, M.; Pereira, J.M.C. Ratio of Land Consumption Rate to Population Growth Rate—Analysis of Different Formulations Applied to Mainland Portugal. ISPRS Int. J. Geo-Inf. 2019, 8, 10. [Google Scholar] [CrossRef] [Green Version]
  42. He, Q.; Zeng, C.; Xie, P.; Tan, S.; Wu, J. Comparison of urban growth patterns and changes between three urban agglomerations in China and three metropolises in the USA from 1995 to 2015. Sustain. Cities Soc. 2019, 50, 101649. [Google Scholar] [CrossRef]
  43. Raftopoulos, R. Italian Economic Reconstruction and the Marshall Plan—A Reassessment; PIFO Politische Italien-Forschung: Giessen, Germany, 2009; p. 27. [Google Scholar]
  44. Romano, B.; Fiorini, L.; Marucci, A.; Zullo, F. Urban Growth Control DSS Techniques for De-Sprinkling Process in Italy. Sustainability 2017, 9, 1852. [Google Scholar] [CrossRef] [Green Version]
  45. Romano, B.; Zullo, F. Models of Urban Land Use in Europe: Assessment tools and criticalities. Int. J. Agric. Environ. Inf. Syst. 2013, 4, 80–97. [Google Scholar] [CrossRef]
  46. Lavalle, C.; Niederhuber, M.; McCormick, N.; Demicheli, L. The MURBANDY/MOLAND methodology, and its potential to support sustainable city development. In Proceedings of the 12th International Symposium Computer Science for Environmental Protection: Environmental Information for Planning, Politics and the Public, Bonn, Germany, 4–6 October 2000; Cremers, A.B., Greve, K., Eds.; Metropolis-Verlag: Marburg, Germany, 2000. [Google Scholar]
  47. Kasanko, M.; Barredo, J.I.; Lavalle, C.; McCormick, N.; Demicheli, L.; Sagris, V.; Brezger, A. Are European Cities Becoming Dispersed? A Comparative Analysis of Fifteen European Urban Areas. Landsc. Urban Plan. 2006, 77, 111–130. [Google Scholar] [CrossRef]
  48. ISPRA. Il Consumo di Suolo in Italia; ISPRA: Rome, Italy, 2015; 90p.
  49. Gascon, F.; Cadau, E.; Colin, O.; Hoersch, B.; Isola, C.; López Fernández, B.; Martimort, P. Copernicus Sentinel-2 mission: Products, algorithms and Cal/Val. In Proceedings of the SPIE 9218, Earth Observing Systems XIX, San Diego, CA, USA, 17–21 August 2014. [Google Scholar]
  50. Geudtner, D.; Torres, R.; Snoeij, P.; Davidson, M.; Rommen, B. Sentinel-1 System capabilities and applications. In Proceedings of the 2014 IEEE Geoscience and Remote Sensing Symposium, Quebec City, QC, Canada, 13–18 July 2014. [Google Scholar] [CrossRef]
  51. EUROSTAT. Regions in the European Union–Nomenclature of Territorial Units for Statistics NUTS 2006/EU-27; European Commission: Luxembourg, 2007. [Google Scholar]
  52. Bundesregierung. Unterrichtung Durch die Bundesregierung—Bodenschutzkonzepte der Bundesregierung; Deutscher Bundenstag: Bonn, Germany, 1985. [Google Scholar]
  53. Bundesregierung. Perspektiven fur Deutsch–Land—Unsere Strategie fur Eine Nachhaltige Ent–Wicklung; Drucksache 15/4100; Deutscher Bundestag: Berlin, Germany, 2002. [Google Scholar]
  54. Siedentop, S. Monitoring urban sprawl in Germany: Towards a GIS-based measurement and assessment approach. In Proceedings of the IALE World Congress, Wageningen, The Netherlands, 8–12 July 2007. [Google Scholar]
  55. Henger, R.; Bizer, K. Tradable planning permits for land use control in Germany. Land Use Policy 2010, 27, 843–852. [Google Scholar] [CrossRef]
  56. Illy, A.; Hornych, C.; Schwartz, M.; Rosenfeld, M.T.W. Urban Growth in Germany—The Impact of Localization and Urbanization Economies; IWH Discussion Papers 19; Halle Institute for Economic Research: Halle, Germany, 2009; pp. 1–53. [Google Scholar]
  57. Decoville, A.; Scheinder, M. Can the 2050 zero land take objective of the EU be reliably monitored? A comparative study. Land Use Sci. 2016, 11, 331–349. [Google Scholar] [CrossRef]
  58. UN. Transforming our World: The 2030 Agenda for Sustainable Development; A/RES/70/1; United Nations: New York, NY, USA, 2015. [Google Scholar]
  59. Enne, G.; d’Angelo, M.; Madrau, S.; Zucca, C. Urbanization and Desertification in European Mediterranean Coastal Areas: A Case Study in North-Western Sardinia (Alghero, Italy); Encyclopedia of Life Support Systems (EOLSS); UNESCO: Paris, France, 2002; Volume II, pp. 56–61. [Google Scholar]
  60. Ceccarelli, T.; Bajocco, S.; Perini, L.; Salvati, L. Urbanisation and Land Take of High Quality Agricultural Soils—Exploring Long-term Land Use Changes and Land Capability in Northern Italy. Int. J. Environ. Res. 2014, 8, 181–192. [Google Scholar] [CrossRef]
  61. MacDonald, D.; Crabtree, J.; Wiesinger, G.; Dax, T.; Stamou, N.; Fleury, P.; Gutierrez Lazpita, J.; Gibon, A. Agricultural abandonment in mountain areas of Europe: Environmental consequences and policy response. J. Environ. Manag. 2000, 59, 47–69. [Google Scholar] [CrossRef]
  62. Verburg, P.H.; Schot, P.P.; Dijst, M.J.; Veldkamp, A. Land use change modelling: Current practice and research priorities. GeoJournal 2004, 61, 309–324. [Google Scholar] [CrossRef]
  63. Squires, G.D. (Ed.) Urban Sprawl: Causes, Consequences & Policy Responses; The Urban Institute Press: Washington, DC, USA, 2002; p. 368. [Google Scholar]
  64. Tachieva, G. Sprawl Repair Manual; Island Press: London, UK, 2010; p. 305. ISBN 9781597267311. [Google Scholar]
  65. Talen, E. Sprawl retrofit: Sustainable urban form in unsustainable places. Environ. Plan. B 2011, 38, 952–978. [Google Scholar] [CrossRef]
  66. Conticelli, E.; Proli, S.; Tondelli, S. Integrating energy efficiency and urban densification policies: Two Italian case studies. Energy Build. 2017, 155, 308–323. [Google Scholar] [CrossRef]
  67. Salata, S.; Peccol, E.; Borsato, O. A Framework to Evaluate Land Take Control Policy Efficiency in Friuli Venezia Giulia, Italy. Sustainability 2019, 11, 6406. [Google Scholar] [CrossRef] [Green Version]
  68. Romano, B.; Zullo, F.; Fiorini, L.; Marucci, A. Molecular no smart-planning in Italy 8000 municipalities in action throughout the country. Sustainability 2019, 11, 6467. [Google Scholar] [CrossRef] [Green Version]
Figure 1. Study area and NUTS 3 (Province) subdivision.
Land 09 00301 g001
Figure 2. Methodological flow chart.
Land 09 00301 g002
Figure 3. Overall diagram of the dynamics of urbanized areas following the Marshall Plan and subsequent dynamics with an inferential projection until 2050. Land take rates during the different time periods are also shown.
Land 09 00301 g003
Figure 4. Geographical indication of urbanization rates calculated for the different periods analyzed.
Land 09 00301 g004
Figure 5. Gradual increase in urbanization density, with respective rates and land take mean speed ( L T m s ) , in the NUTS 3 administrative territories used as calculation bases in our study. The black box indicates the total amount of urbanized area in the 1950s.
Land 09 00301 g005
Figure 6. Bar chart showing the variation in urbanized areas compared to the population variation curve in the 110 provincial areas NUTS 3.
Land 09 00301 g006
Figure 7. The curves show the comparison between population and urbanization dynamics against per capita urbanization in the periods analyzed and in the 2050 scenario.
Land 09 00301 g007
Figure 8. The only Italian provinces that in the hypothetical 2050 scenario would still retain a mean urbanization density below 2%.
Land 09 00301 g008
Table 1. Data used for research.
Service Provider.Data TypeData SourceTime SectionAccuracyComments
IGMI—Italian Military Geographic Instituteurbanized areasPaper maps1950s1:25,000Paper maps with digitized and georefenced urbanized surfaces
Regionsurbanized areasDigital maps2000_20081:5000-1:10,000Partially inhomogeneous in the type of survey and in the detail, but available for all regions in a restricted chronological interval
ISTAT - National Institute of StatisticsbuildingsTabledecades from 1918 to 2011 A construction generally of unitary conception and execution with the following characteristics: with its own independent structure, containing spaces that can be used permanently by people for residential use (housing) and/or for the production of goods and services (offices, studios, laboratories, etc.), bounded by walls, external or partitions, and by roofs, equipped with at least one access from the outside.
demographic dynamicsTabledecades from 1861 to 2011

