Effects of Urbanization on Farmland Size and Diversified Farm Activities in Japan: An Analysis Based on the Land Parcel Database

Policy Research Institute, Ministry of Agriculture, Forestry and Fisheries, Tokyo 100-0013, Japan
Land 2020, 9(9), 315; https://0-doi-org.brum.beds.ac.uk/10.3390/land9090315
Submission received: 3 August 2020
/
Revised: 1 September 2020
/
Accepted: 2 September 2020
/
Published: 4 September 2020
(This article belongs to the Special Issue Sustainability and Peri-Urban Agriculture)
Abstract
:Peri-urban agriculture (PUA) has been widely regarded as a sub-field of multifunctional agriculture for improving the sustainability of urban environments. However, urban sprawl has both negative and positive effects on peri-urban farming, and the research on this issue in Japan is insufficient. This study aims to demonstrate the spatial distribution of farmland parcels in Tokyo and Osaka metropolitan areas and explore the synergistic effect of distance from cities and urban sprawl on the size of farmland parcels and farm-diversified activities such as direct marketing, farming experience, and environmentally friendly practices. Ordinary Least Squares (OLS) and Poisson regression analyses were used with a nationwide agricultural land parcel Geographic Information System (GIS) database (Tokyo metropolitan area = 1,939,162 and Osaka metropolitan area = 1,507,072 parcels), in Japan, to specify the farmland locations and calculate the extent of urban sprawl. The results revealed that more than 50% of farmlands in the targeted areas were located within 4 km from the boundaries of densely inhabited districts (DIDs). Furthermore, with a decreasing distance from a DID, the urban sprawl had more positive effects on farmland parcel sizes and farm-diversified activities. These findings imply that PUA has a wider presence in Japan, and the peri-urban farmers may be capable of utilizing the multifunctional nature of intensively sprawled urban environments.

1. Introduction
Urban agriculture has attracted global attention from urban planners and researchers because of its multifunctionality. According to Zasada [1], multifunctionality is “aimed at spatial and temporal integration of land uses and functions beyond traditional food production, with such uses including aesthetic and recreational values, nature conservation, or hydrological balance”. Furthermore, he states that “the multifunctionality paradigm in particular represented a suitable pathway to the development of peri-urban agriculture” and categorizes the multifunctionality of peri-urban agriculture (PUA) into environmental quality and cultural landscapes, leisure and recreation, and regional food supply. Wilson [2] also points to the factors necessary for strong multifunctionality, which means a non-productive approach to farming is particularly evident in PUA. The various functions of urban agriculture summarized in the literature review are as follows: production, energy conservation, waste management, biodiversity, microclimate control, urban greening, economic revitalization, community socialization, human health, cultural heritage, and education [3].
In Japan, a legislation aiming to utilize the multifunctionality of PUA was passed only recently, in 2015. Rapid economic growth from the late 1950s onward has led to an uneven growth of urban fringe areas, including their expansion into large farmland areas [4,5]. Given that other Asian megacities face similar problems around urban sprawls as Japan does, understanding how best to utilize the multifunctionality of agricultural land in peri-urban areas may be an important factor in achieving sustainable urban development in these areas [6]. Based on studies in Japan and China, for example, various amenities from urban farming activities tend to be preferred by creative classes that are expected to contribute to such development [7,8]. Moreover, peri-urban areas in Tokyo showed the highest potential to supply vegetable because of the mixture in agricultural and urban land uses [9].
The general definition of urban agriculture offered by the United Nations Food and Agriculture Organization (FAO) is “an industry located within (intra-urban) or on the fringe (peri-urban) of a town, city, or metropolis, which grows and raises, processes, and distributes a diversity of agricultural products, using largely human, land, and water resources, products, and services found in or around that urban area” [10] (p. 21). In this study, the term peri-urban agriculture (PUA) is used to include agriculture in both urban and peri-urban areas. Professional urban agriculture can be distinguished from urban gardening in terms of the importance of their commercial objectives [11]. This study only focuses on commercial urban farming because a large number of commercial farms exist in PUA in Japan.
Historically, professional farmers in Japan have tended to be owner-occupiers in urban or peri-urban areas. The benefits of multifunctional PUA have recently been reevaluated; thus, policies promoting PUA often require farmers to more effectively utilize the multifunctional nature of their land [1,11]. Moreover, commercial farmers in PUA have a history of diversifying into more customer-oriented enterprises, such as direct marketing, food processing, agritourism, and education [12,13]. In other words, these farmers try to incorporate the multifunctional externalities of PUA into their management strategies through farm diversification activities. Similarly, to sustain the development of a peri-urban agroecosystem, “it is essential to find a methodology able to conjugate cultural, environmental, and ecological values with economic and social needs” [14]. According to Gullino et al. [14], there are four aspects of multifunctional agriculture: opening to the national and international markets, developing new farm activities, integrating approach with environmental aims, and making local markets deeper. These insights are useful for investigating the characteristics of PUA.
An economic geography approach is helpful for understanding PUA. According to the early models of agriculture proposed by Von Thünen, PUA offers advantages in terms of lower transportation costs from a farm to a city; thus, vegetables, fruit, milk, and other dairy products are all suitable for PUA [15]. In fact, peri-urban areas in Tokyo and Osaka were among the most famous production centers for these products, before improvements in transport infrastructure and production technology made farms in rural areas more competitive. Urban sprawl during the rapid economic growth from the late 1950s onward led to a substantial deterioration in farming conditions in many urban and peri-urban areas. Responding to these less favorable conditions, many peri-urban farmers adopted farm diversification strategies as an alternative to conventional production.
As a result, Tokyo and Osaka became the most famous areas for farm diversified activities. According to the Census of Agriculture and Forestry in 2015, the prefectures where diversified farms rate exceeded 30% were only Tokyo (57%), Kanagawa (39%), Osaka (31%), and Kyoto (30%). It is suggested that the agriculture in metropolitan areas more deeply depends on farm diversification strategy than the agriculture in rural areas. In addition to Tokyo and Kanagawa, the Tokyo metropolitan area generally includes Saitama and Chiba prefecture. Osaka, Kyoto and Hyogo prefecture construct Osaka metropolitan area. It means that those prefectures are geographically and economically related. However, few pieces of research on peri-urban agriculture in Japan targeted those large metropolitan areas.
Consequently, the progress of urbanization that threatens the peri-urban farmers would also be opportunities for them to develop novel business models. Studies on farm diversification in western countries have indicated that the shorter the distance between farms and cities, the more the farms will diversify their businesses [12,13,16,17,18,19]. In addition, according to another article, the effects of urbanization on farmland price, transportation cost, and population growth rate are more influential in farmlands within 50 km of the urban area [20]. Another study also indicates that the urban proximity and the width of the nearest urban road distort the farmland price [21]. Farmland prices around city centers are more subject to value-added farm activities and the quality of the surrounding environment [22]; therefore, net agricultural returns tend to be higher in peri-urban areas than in rural areas [23]. Other theoretical studies show that the expected time of farmland conversion reaches a minimum at approximately 10 km from the city center; on the other hand, with a decreasing distance from the city, the expected time also slightly increases [24]. This is because a large increase in the value of peri-urban farmland makes farmers intensively use their management resources and continue farming.
The results of these studies support our view that urbanization is an opportunity for peri-urban farmers. It is, however, necessary to understand both the positive and negative effects of urbanization on farm business management in megacities where the urban sprawl had historically aggravated farming conditions. Only this approach makes it possible to discuss the conditions of sustainability of PUA from a wider perspective. This approach also provides many implications for Sustainable Development Goals of the United Nations (SDGs). For example, peri-urban agriculture may benefit from the urban growth and may contribute to make the cities more resilient. On the other hand, the rapid urban expansion in itself may worsen the quality of life of urban dwellers in many ways. Then, the sustainable development of both urban cities and peri-urban agriculture should be pursued.
The first objective of this study is to reveal the spatial characteristics of farmland parcels and farm management in peri-urban areas in Japan, using the latest agricultural land parcel geographic information system (GIS) database, HUDE (which means “farmland parcel” in Japanese) polygon, from 2019, in Japan. The second objective is to analyze the effects of urbanization on PUA, especially on farmland parcel size, farm diversification activities, and environmentally friendly farming practices. We focus on the synergistic effect of distance from the cities and urban sprawl because it can be regarded as a potential source of the PUA’s multifunctionality. That is, in highly urbanized areas, the more the surrounding environment is sprawled, the more the business opportunities there may be for peri-urban farmers. This study is expected to promote research on the practical conditions in urban settings, to make peri-urban farmers more sustainable.
2. Hypothesis
Theoretically, the boundary between urban and rural areas is based on the difference in net returns to agricultural production and urban uses. In a classical model, the net return from agriculture is constant regardless of the distance from the city center. On the other hand, the net return from commercial and housing use declines with a decreasing distance to the city center. Thus, the city boundary will extend within peri-urban areas, where the net return from urban use exceeds the return from agriculture. In further rural areas, agricultural production becomes a major land-use type.
The net return from agriculture will, on the contrary, increase within peri-urban areas because of the low transportation cost and the demand of urban residents for high-value crops. As shown in the Introduction, an increase in the farmland price and net agricultural return is proportional to the proximity to a city center [22,23]. In addition to this perspective, it is necessary to consider the effect of multifunctionality on business models and PUA profitability. In other words, farm diversification into direct marketing, farming experience, and agritourism can be implemented by utilizing its multifunctional nature, such as through social interaction, education, scenery, and environmental protection. These farm activities may be more profitable in a city center than in an urban fringe.
Despite the advantages of multifunctionality, the relationship between farm diversification and urbanization is still unclear. For example, a study in Germany indicated that urban proximity promotes direct marketing and recreational farming [17]. Similarly, farmers’ subjective proximity to urban areas positively correlates with farm diversification activities [13]. In Japan, the percentage of diversified farms in the Kanto region exhibits spatial autocorrelation around central Tokyo [25]. On the contrary, according to studies on farm diversification in Italy, the number of diversified farms increases in proportion to an increase in the distance from a city center [16,26].
The evidence suggests that multifunctionality will vary in each urban setting. This also implies that the locational conditions of farmlands within urban areas affect the opportunities for various farm activities. This study measures urban sprawl as a representative index of the extent to which a farmland is encroached by urban land uses. Although the definitions of urban sprawl can vary, the statement of Jaeger et al. [27], “the spilling-over of urban-type building into suburban and agrarian areas”, or “process of the spilling-over of settlement areas and excessive use of the open landscape by unsystematic, mostly weakly condensed extensions of settlement areas in the fringes of urban agglomerations” [28], suggests that urban sprawl is the uncontrolled spilling-over of urban land uses into peri-urban areas. While a number of previous studies are concerned with the effects of urban sprawl on farmland protection, relatively few studies aim to assess the characteristics of farm management within intensively sprawled urban environments.
Although urban sprawl generally aggravates the conditions for agricultural production, it is possible for peri-urban farmers to offset this negative effect by utilizing highly urbanized environments with business opportunities. According to Zasada [1], “Enabling the co-existence of different types of land use in a close spatial context, multifunctionality is characterized by synergies, jointness, and a mitigation of conflict situations”. In addition, local and regional embeddedness is required to establish “strong multifunctionality”, which will change the minds of various stakeholder groups [2]. In the case of PUA, farmers can build social capital or trust with urban residents by interacting with them [29]. Furthermore, peri-urban farmers are said to have entrepreneurial attributes to survive a long-term urban pressure [30]. Yoshida et al. [31] demonstrate that entrepreneurial peri-urban farmers tend to diversify their businesses and adopt value-added crops or innovative marketing methods.
In summary, the profitability of PUA is determined by a balance between bad production conditions and better business opportunities from the multifunctionality of PUA. Several studies imply that more urbanized areas have potential business opportunities and entrepreneurial farmers. In view of the above, we propose three hypotheses:
Hypotheses 1.
Proximity to a city center has a positive effect on diversified farm activities.
Hypotheses 2.
Urban sprawl has a negative effect on diversified farm activities.
Hypotheses 3.
The synergistic effect of distance from cities and urban sprawl is negative on diversified farm activities.
In this study, farm-diversified activities are defined as not only structural diversification [12], such as direct marketing, farm experience, and agritourism, but also as environmentally friendly farming practices, such as manure management and reduction of chemical fertilizer and pesticides. In general, urban residents are more interested in environmental protection and food security; thus, eco-friendly farming will potentially attract them. These hypotheses are novel in that the effect of urban sprawl is explicitly treated. The third hypothesis means that only farmers adjacent to city centers can utilize the multifunctional nature of intensively sprawled urban areas. This type of spatial analysis can be completed by using the nationwide agricultural land parcel GIS database supplied by the Ministry of Agriculture, Forestry, and Fisheries in Japan from 2019. In terms of sustainable PUA development, the social and environmental functions of farming activities should be evaluated. The next section sets the framework of this study and then details the analytical process.
3. Methodology
3.1. Targeted Areas and Datasets
The empirical analysis of this study requires some considerations for targeted areas and datasets. First, we selected two metropolitan areas, Tokyo and Osaka, which are the largest cities in Japan. The Tokyo metropolitan area has already proved to be an area where a number of farms within the city have diversified into direct marketing, farming experience, and agritourism [31]. The Osaka metropolitan area, however, has unique characteristics, such as a number of paddy fields within the city, which may affect the relationship between peri-urban agriculture and urbanization. The comparison of these two metropolitan areas can provide insights into the nature of PUA in Japan. In this study, Kanagawa, Chiba, and Saitama prefectures were selected apart from the Tokyo metropolis, and Kyoto and Hyogo prefectures were selected apart from the Osaka prefecture, as the targeted areas. We then defined the former group as the Tokyo metro area and the latter group as the Osaka metro area.
As shown in Table 1, the population density of Tokyo, Kanagawa, and Osaka exceeds 3000 persons/km2, and the densely inhabited district (DID) percentage of these areas is also higher than that of other prefectures. On the other hand, the total agricultural sales of Chiba, Saitama, and Hyogo exceed 100 billion yen. Only Kyoto is less dense and has less agricultural production. Sales of vegetables, fruits, and flower products in Tokyo, Kanagawa, Saitama, and Osaka account for more than half of the total agricultural sales.
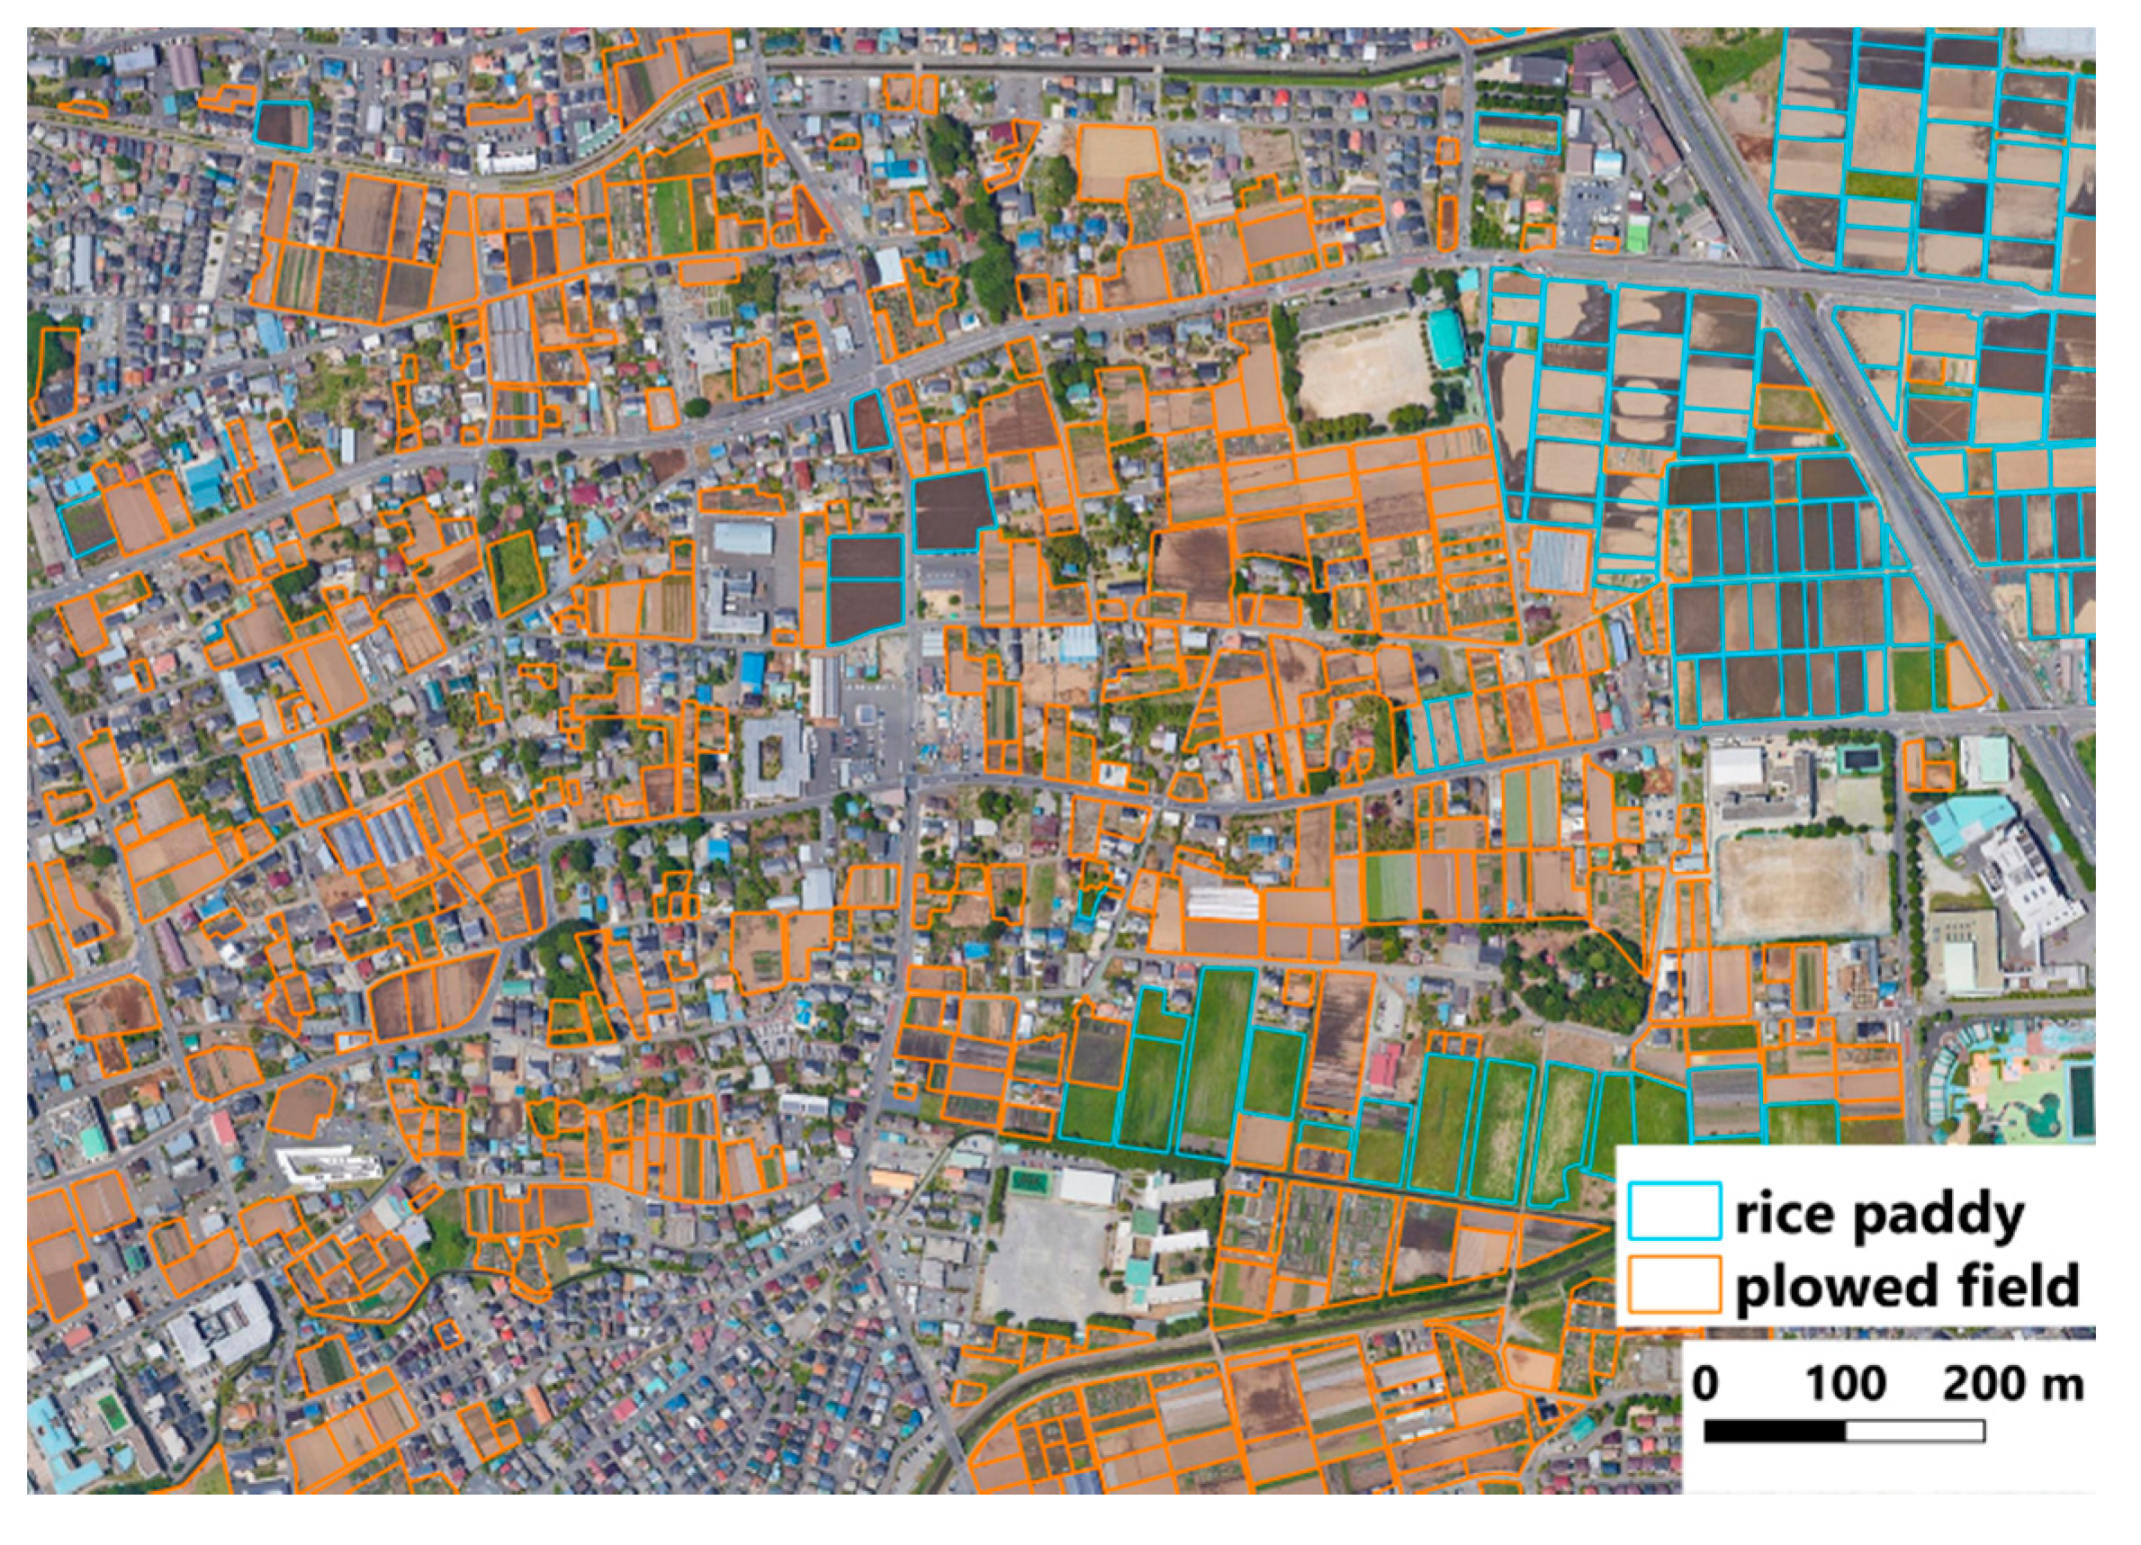
Second, the nationwide agricultural land parcel GIS database, called HUDE polygon, was used for data on the spatial location, size, and farmland types. This database was built by using satellite images. The number of agricultural land parcels (hereafter called “farmland parcel”) in the Tokyo metro area and Osaka metro area was 1,939,162 and 1,507,072, respectively. As an example, Figure 1 shows that farmland parcels on the left are intensively sprawled by urban land uses, but farmland parcels on the right are less sprawled.
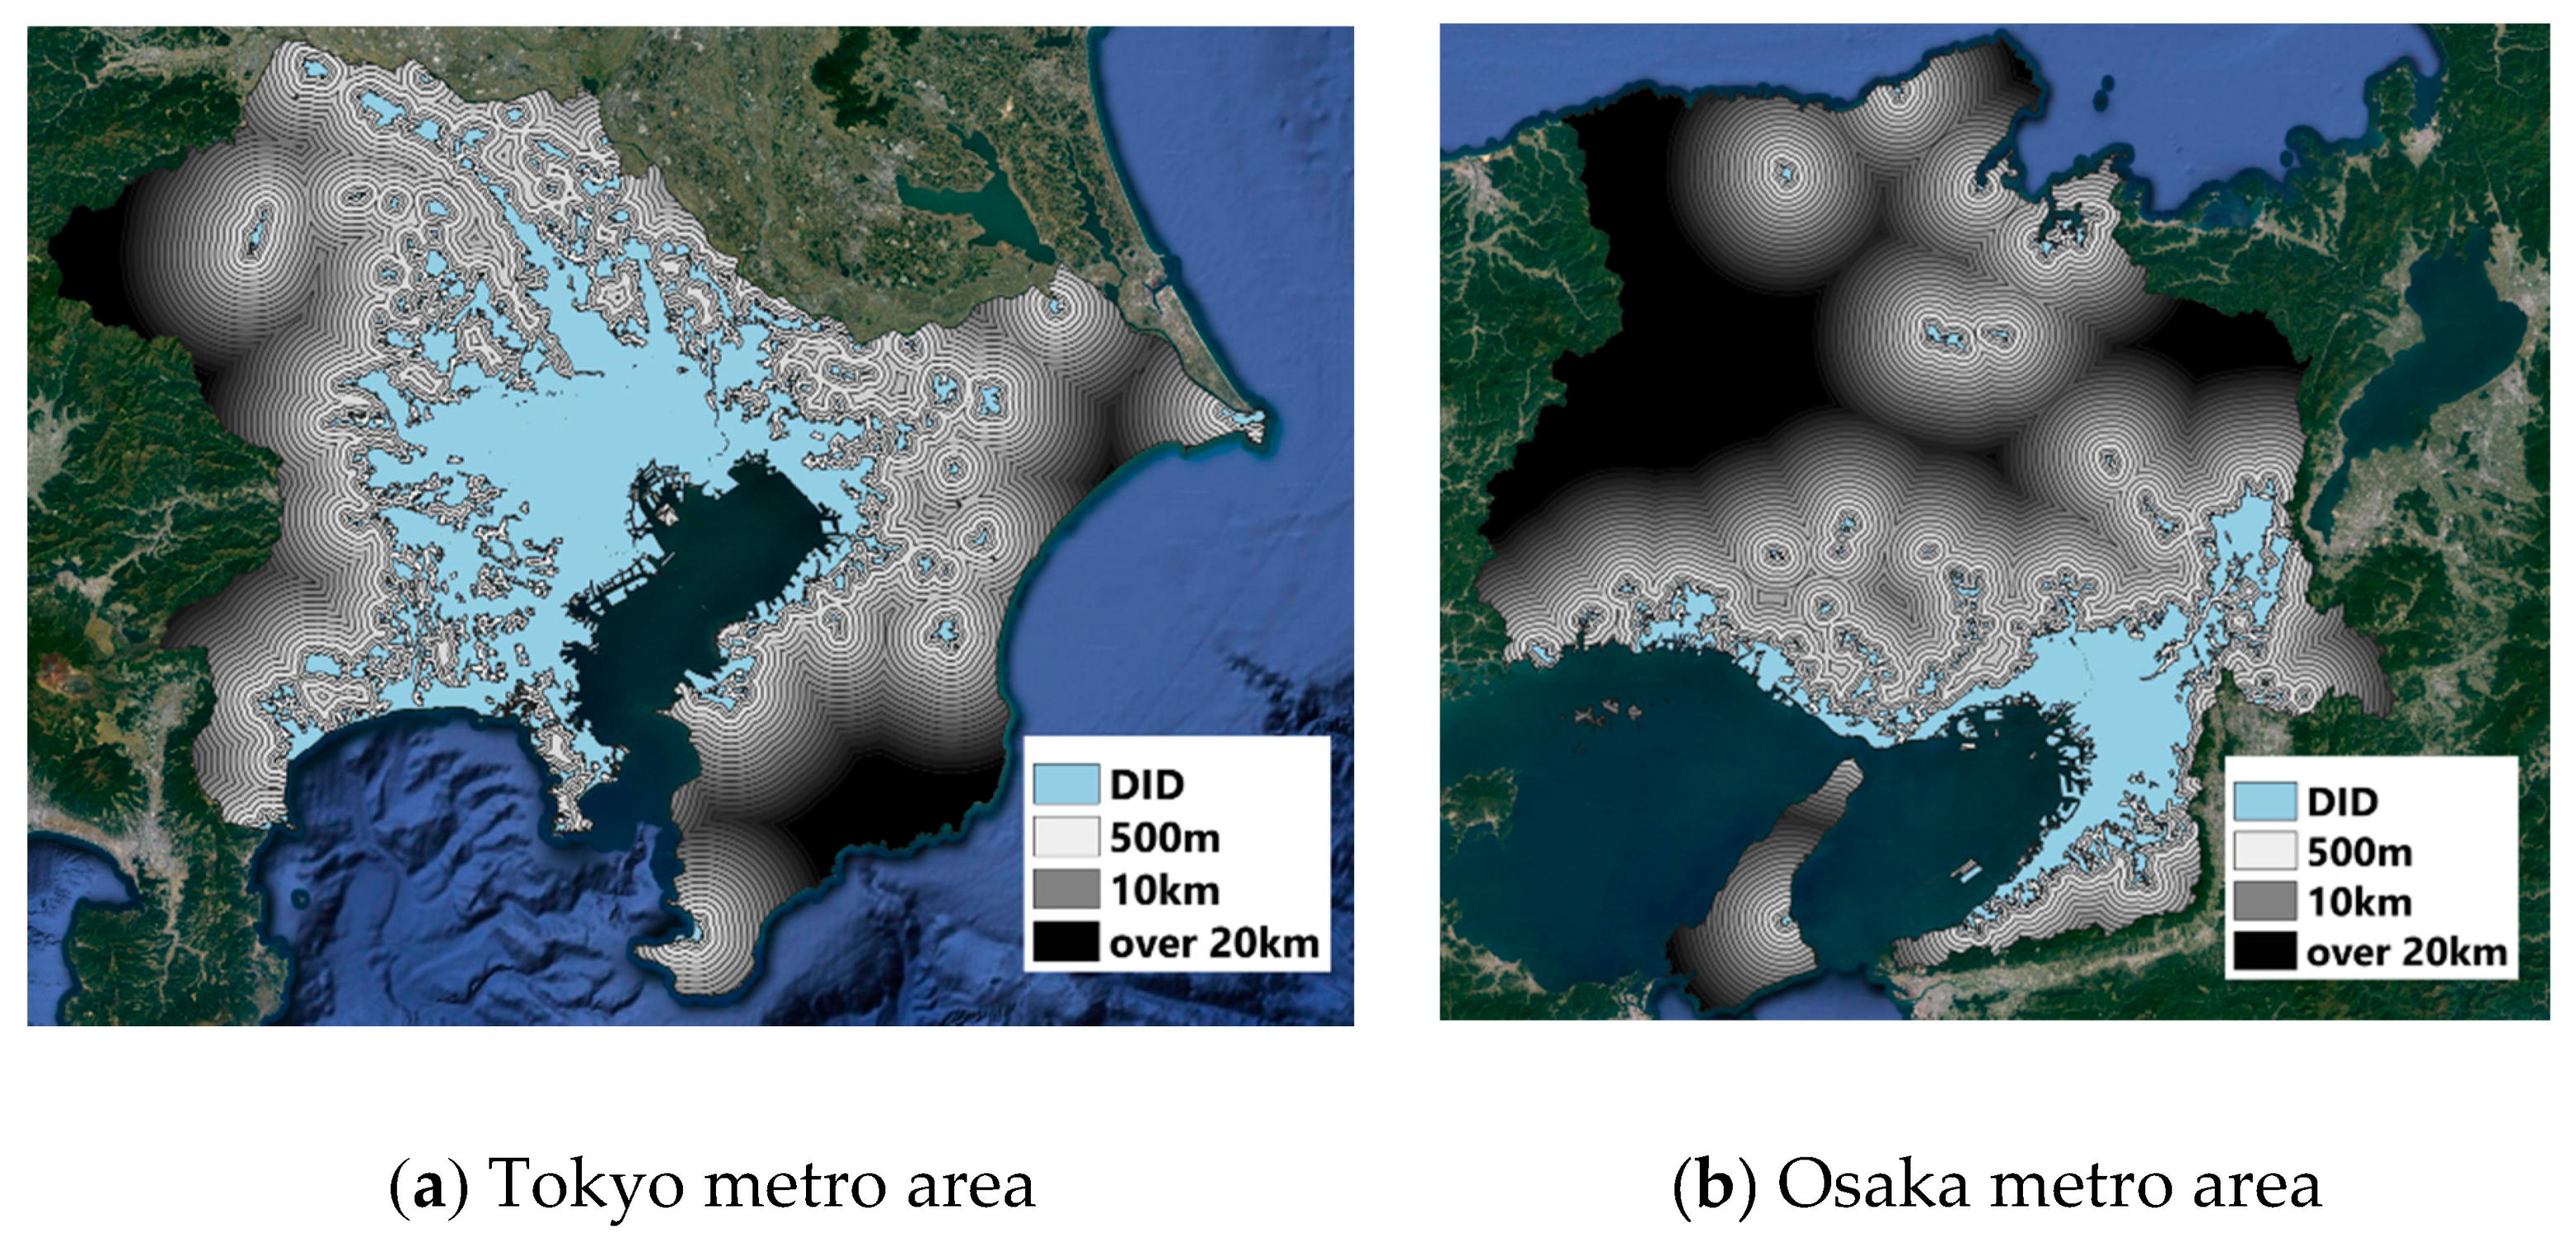
Using the database, we calculated the distance from city for each farmland parcel. Then, the farmland parcels were stratified into 23 groups, by distance. In this study, a city boundary is defined as the boundary of DID. DID is one of the measures of urbanization in which population density exceeds 4000 persons per square kilometer and the total population including adjoining areas exceeds 5000 persons. The first stratified group was “farmland parcels within DID”, the second was “farmland parcels within 500 m from the DID fringe”, and the third was “farmland parcels within 500 m to 1 km from the DID fringe”. After that, the stratified boundary increases by 1 km from 2 km to 20 km. Hereafter, each stratified area is called a “buffer”, which can be defined as follows: “within DID buffer” or “0.5 km buffer”. As shown in Figure 2, most of the Tokyo metro area was within 20 km from DID; on the other hand, the Osaka metro area included remote parts that were far from DID. All farmlands beyond 20 km were aggregated because this study mainly focuses on PUA. Farmlands adjacent to the targeted areas were excluded; thus, the implication of this study may be limited.
On the whole, urban sprawl is measured by using population density or land-use pattern. For example, patchiness measures the number of land use types in an area [32]. The larger the patchiness, the more sprawled the area. Similarly, a low population density in urban areas indicates the progress of uncontrolled urban sprawling [33]. The primary problem of urban sprawl for farming, however, is that a farmland is inevitably enclosed by urban land use. Thus, this study proposed a new urban sprawl index for farmland parcels. The urban sprawl around a farmland is measured by the number of 100 m grids of urban land uses, such as land for building and transportation within a 200 m radius from the farmland. If this urban sprawl index is zero, the environment around a farmland is considered to be completely undeveloped. On the other hand, the higher the index numbers, the more intensive the development of a farmland environment. Apart from urban sprawl index, population and road density are also used to describe the locational conditions of a farmland.
3.2. Analytical Process
First, the spatial distribution of farmland parcels was analyzed. This process is important to show the quantity of a farmland which has potential multifunctionality in the studied areas. Second, the agricultural characteristics were described by the groups of distance from DID. Third, the effects of urbanization on the size of farmland parcels were estimated by using regression analysis. Although this process is not directly related to our hypotheses, it is an important step in understanding the relation between urbanization and PUA. Finally, the effects of urbanization on diversified farm activities were investigated. Since the data on diversified farm activities were aggregated by agricultural communities in the Census of Agriculture and Forestry in 2015, the sample of this analysis was also aggregated by agricultural communities, using the average urban sprawl index of each farmland parcel. The sample size of the Tokyo metro area was 7421 communities. After excluding communities with less than 5 farmers, 6372 communities were considered for the analysis. Similarly, 4965 samples were reduced to 4275 samples in the Osaka metro area.
In the regression analysis, the coefficient of an interaction term between distance from DID and urban sprawl index was used to estimate their synergistic effect on diversified farm activities. A negative and statistically significant coefficient of the interaction term means that the locational conditions, in which the community is a proxy for urban areas and farmland parcels are more sprawled by urban land use, will benefit farmers in diversifying their business. Dependent variables, such as the diversified farms rate and the number of farms diversifying into direct marketing, farm experience, agritourism, or environmentally friendly farming practices, were selected.
If the variables such as the diversified farms rate or environmentally friendly farms rate are truncated, the Ordinary Least Squares (OLS) model may not be suitable for the regression analysis. To avoid this problem, this study excluded the communities that had few farmers in advance (less than 5 farmers). As a result, the percentages of farms without any diversified activity or farms without any environmentally friendly practice were kept below 15% and 10%, respectively. Then, we presumed that the OLS model has less bias. On the other hand, Poisson regression should be applied to count data such as the number of farms in the regression analysis.
Furthermore, this study should consider the effects of endogeneity between the farmland size and urban sprawl. In fact, it is possible that the existence of large farmland may affect the urban sprawl. However, the effects of urban sprawl on the size of farmland would be more significant. This is because the urban sprawl causes various problems, such as development pressure, heavy tax, and worse farming conditions. Thus, this study presumes that the endogeneity problem causes little bias.
The independent variables are as follows. First, the population density per 500 m2 and the total road length per 1 km2 were related to the farmland parcels. Second, farmland types, rice paddy fields, or plowed fields, were stored in the farmland parcels. As variables implying farm size, the percentage of farms with sales exceeding 5,000,000 yen, or whose farmland size exceeds 2 ha, were used. The other variables included the percentage of farms that diversified their crops, vegetable farm rate, fruit farm rate, and flower farm rate. Then, the OLS regression model and Poisson model can be expressed as follows:
where denotes dependent variables (the size of farmland parcels, diversified farms rate, and environmentally friendly farms rate), denotes other count-data-dependent variables. is a matrix of independent variables, and is a matrix of parameters. , , and are parameters that should be estimated for the hypothesis validation. is a random error.
4. Result
4.1. Spatial Distribution of Farmland Parcels
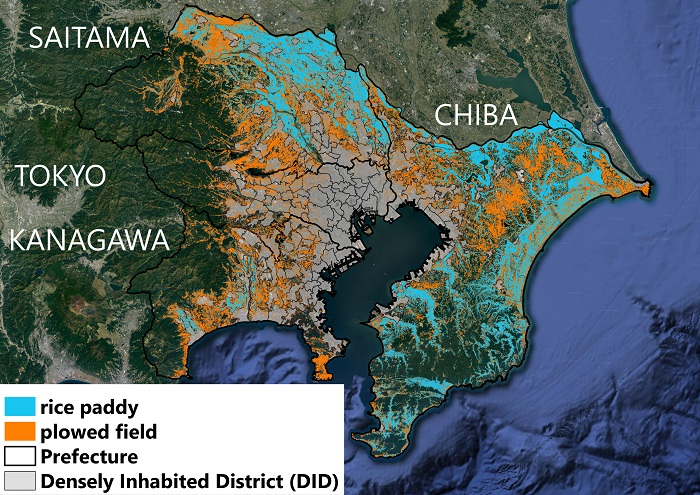
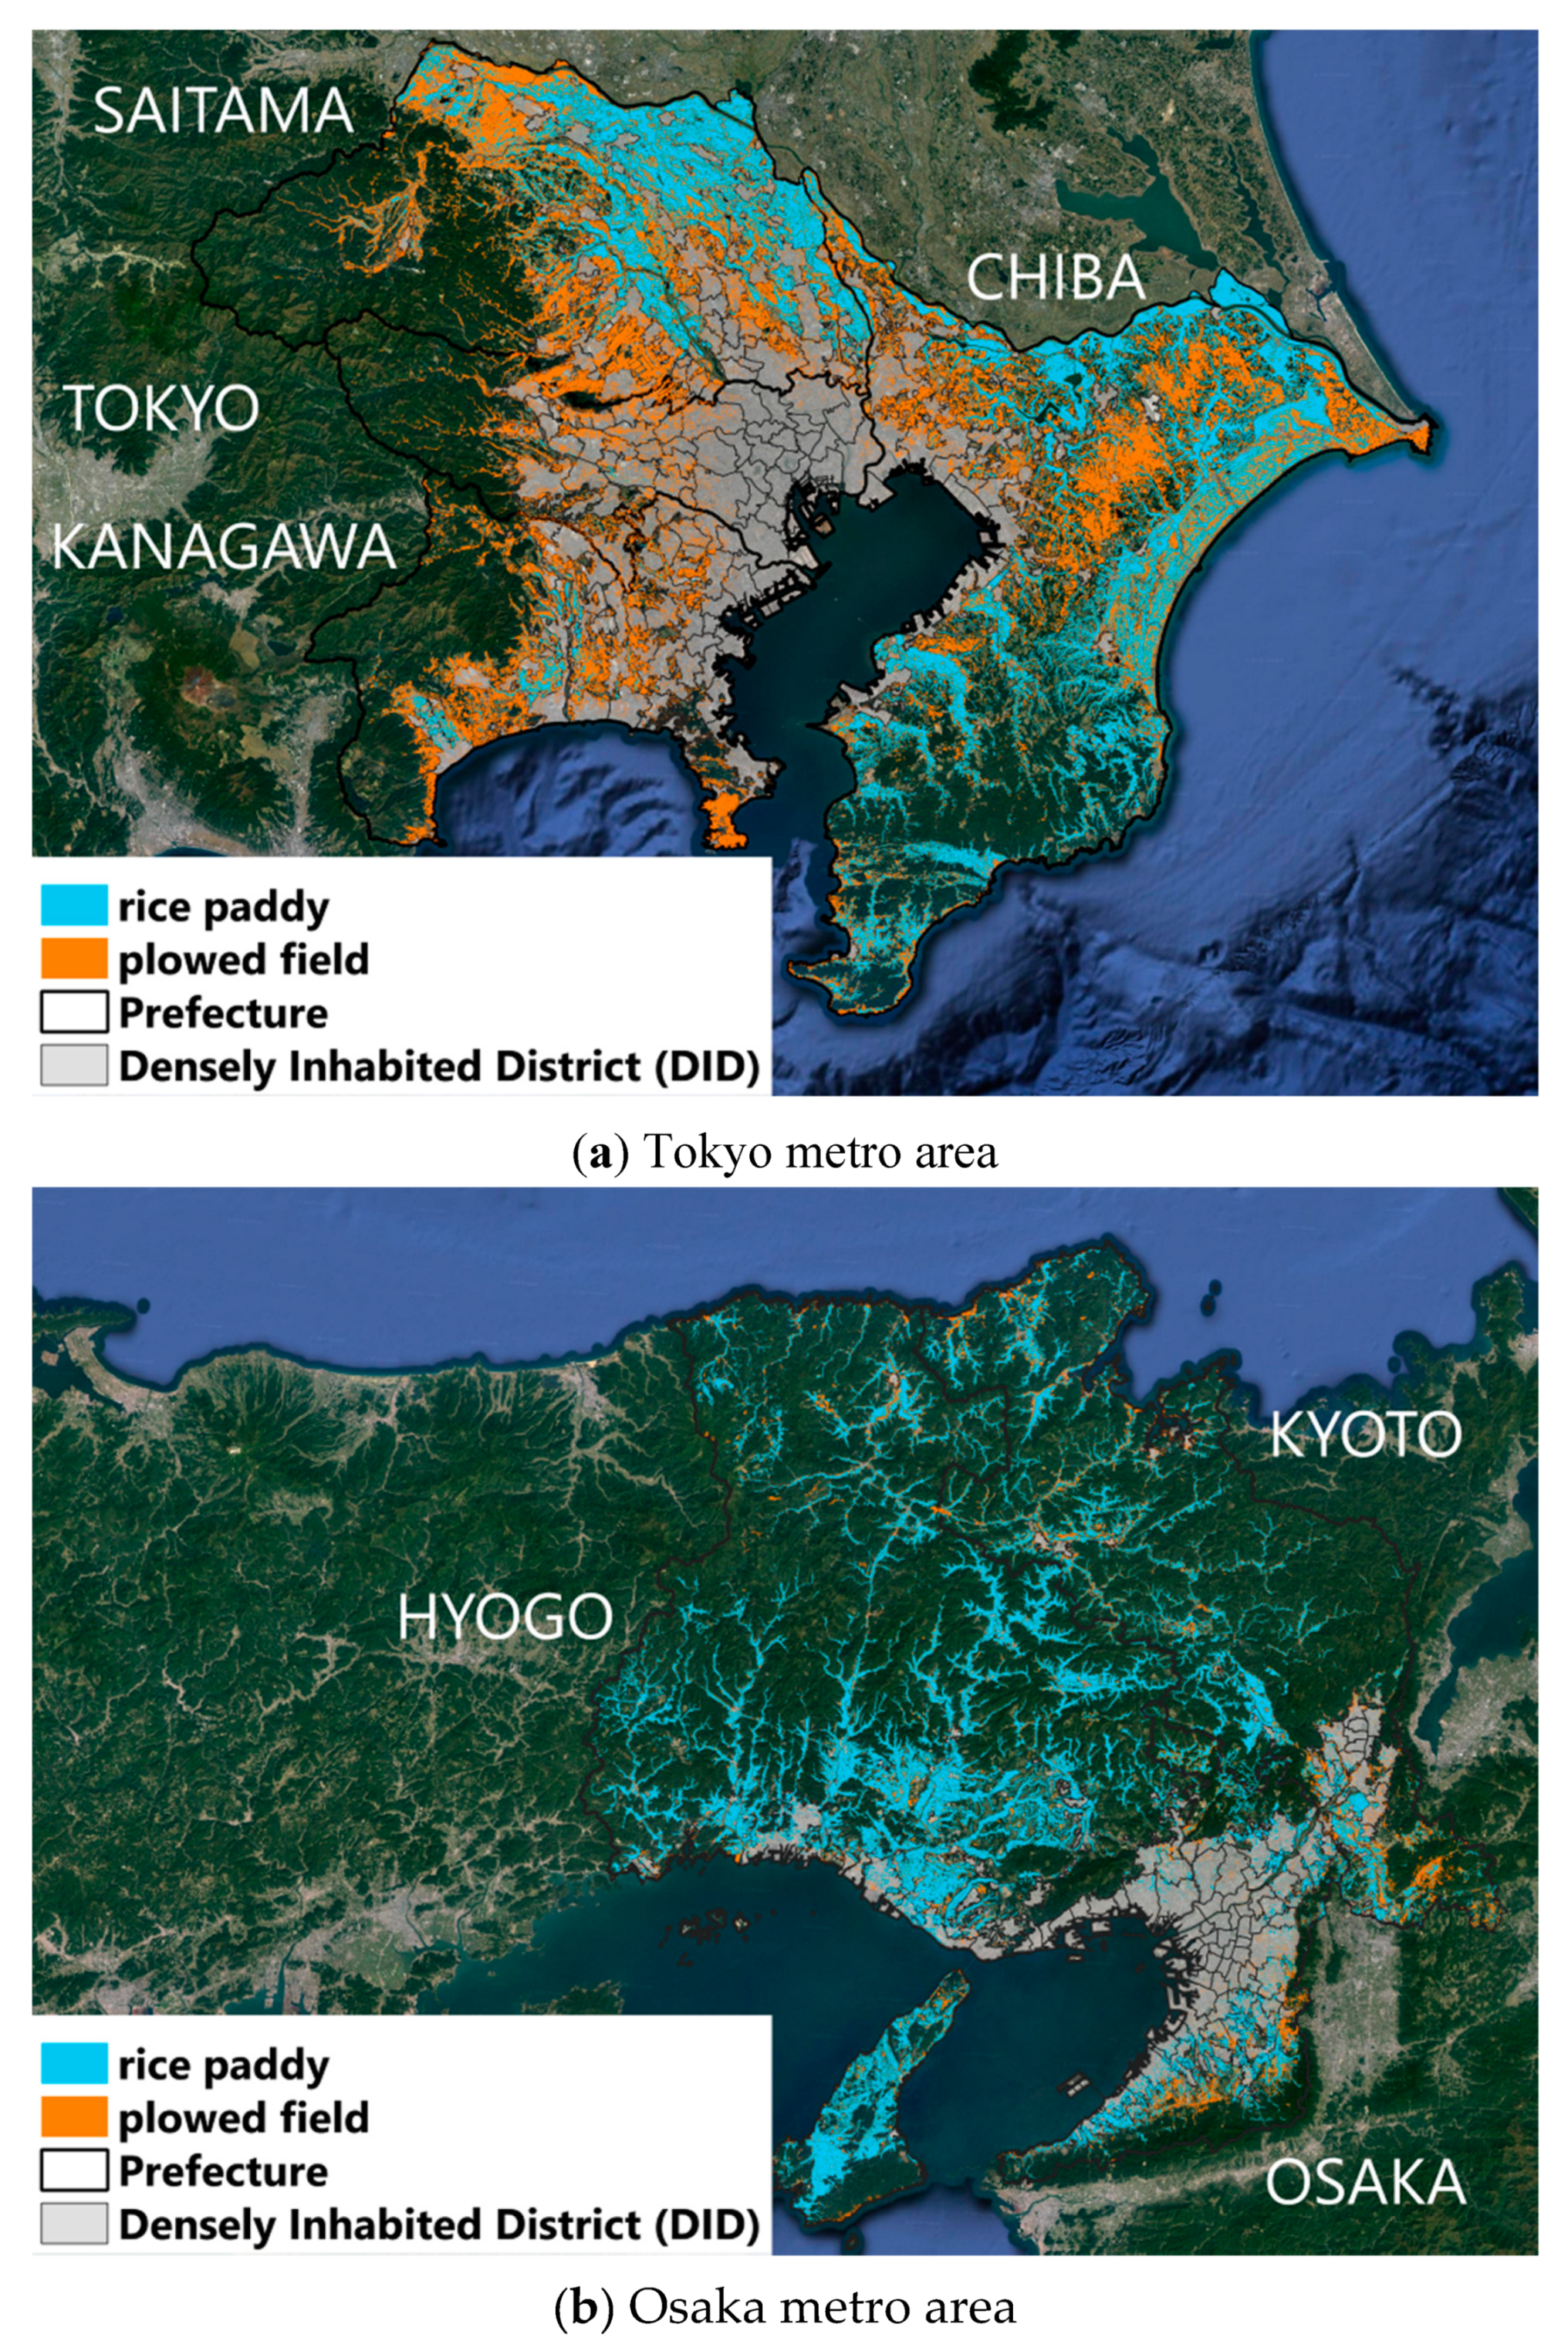
First, the general characteristics of PUA are described by investigating the distribution of farmland parcels. The land parcels of both rice paddy fields and plowed fields in the two studied areas are illustrated in Figure 3. Gray polygons are the DID areas. The DID areas are surrounded by farmland parcels. Within DID areas, some of the farmland parcels are scattered. As can be seen in Figure 3, in the Tokyo metro area, almost all of the plowed fields in Tokyo and Kanagawa are located near the DID. On the other hand, rice paddies are widely distributed in Chiba and Saitama. In the Osaka metro area, rice paddies outnumber the plowed fields. Although some of the plowed fields are located around the DID areas of Osaka and Kyoto, the Osaka metro area appears to be characterized by rice paddies.
Table 2 compares the total areas of farmland parcels with the results of another national survey. First, the total area in the Tokyo metro area is twice that of the Osaka metro area. Tokyo has the smallest number of farmlands; however, the plowed fields in Tokyo outnumber the plowed fields of Osaka. Only Tokyo and Kanagawa have more plowed fields than rice paddies. Consequently, in the Tokyo metro area, the proportion of plowed fields to rice paddies is approximately 50%; on the other hand, the proportion in the Osaka metro area is under 20%. Second, when compared with the national sample survey of farmlands, the areas of farmland parcels in the Tokyo metro area exceeded 5% in this study. The areas of rice paddies in the Osaka metro area, however, are less than the results of the national survey. This difference can probably be accounted for by the survey methodologies. The farmland parcels are generally visually observed from satellite images; on the other hand, the national survey used a random sampling for estimation. Thus, it should be noted that the accuracy of these two surveys is not necessarily perfect.
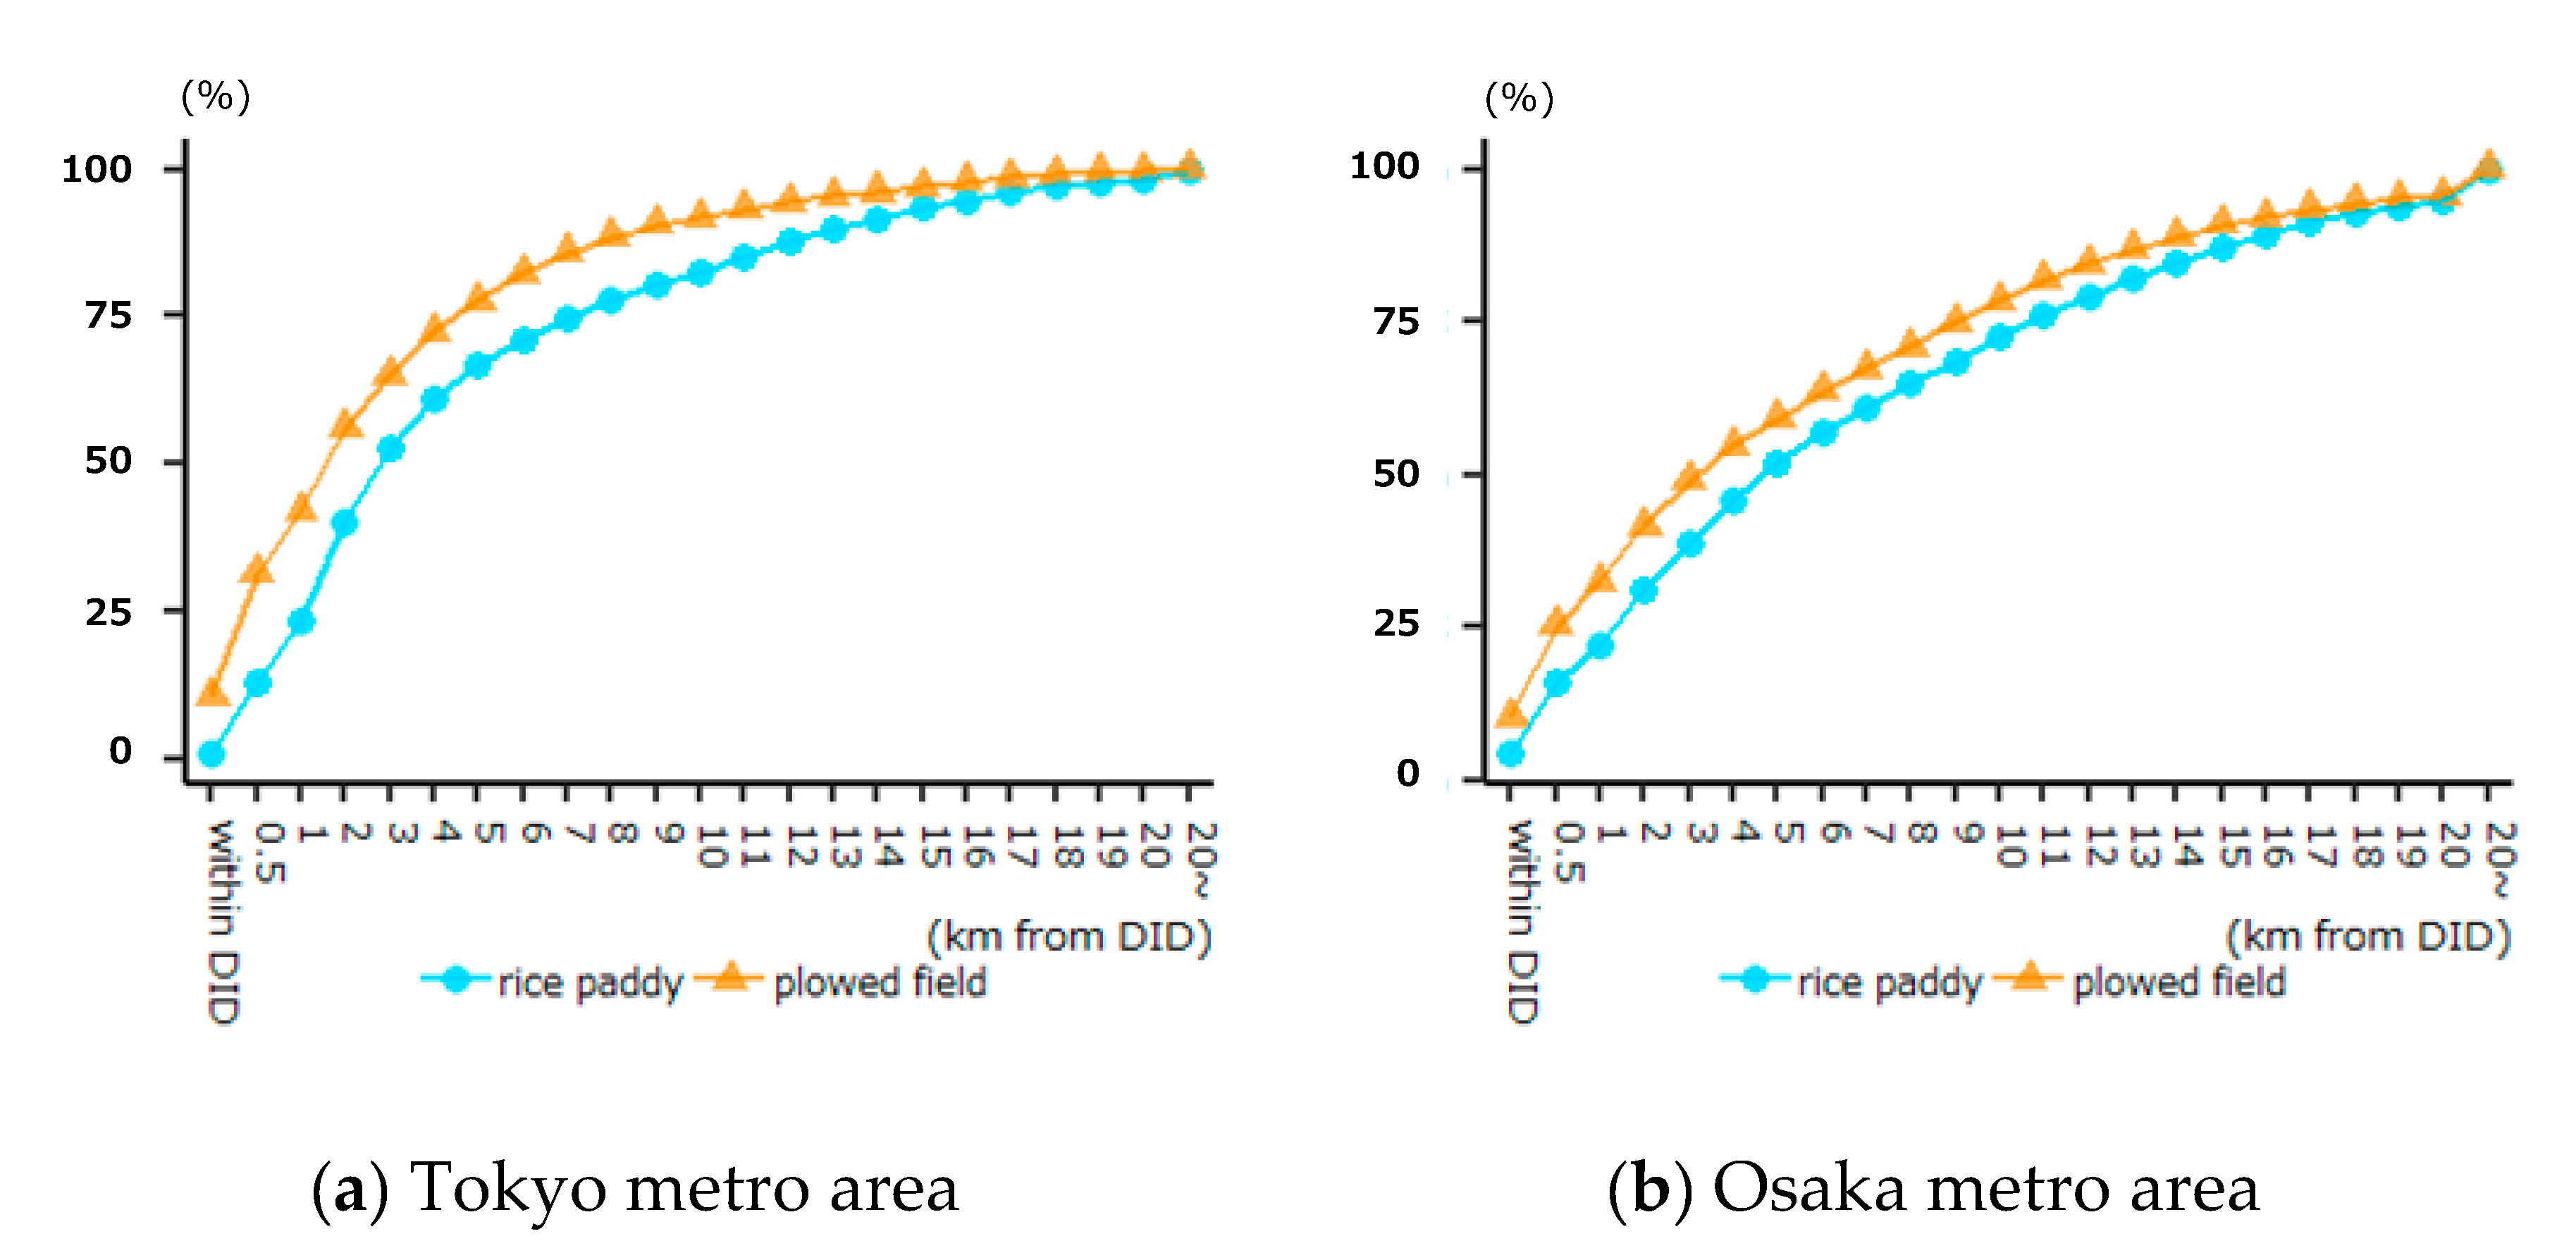
As seen in Figure 4, there are a number of plowed fields within the DID in the Tokyo metro area. Moreover, the total area of plowed fields is the largest in the 0.5 km buffer. Beyond 1 km from the DID, the rice paddies outnumber the plowed fields in every buffer. In contrast, both rice paddies and plowed fields have the largest areas in the 0.5 km buffer in the Osaka metro area. Beyond this point, the number of rice paddies considerably exceed plowed fields. Therefore, in peri-urban areas, a large number of farmlands seem to exist. Figure 5 shows the cumulative percentage of total farmland areas. In the Tokyo metro area, more than 50% of plowed fields and rice paddies are located within 2 and 3 km from DID, respectively. Similarly, in the Osaka metro area, more than 50% of plowed fields and rice paddies are located within 3 and 4 km from DID, respectively. Although the plowed fields are unevenly distributed in peri-urban settings, the rice paddies are also a part of the PUA.
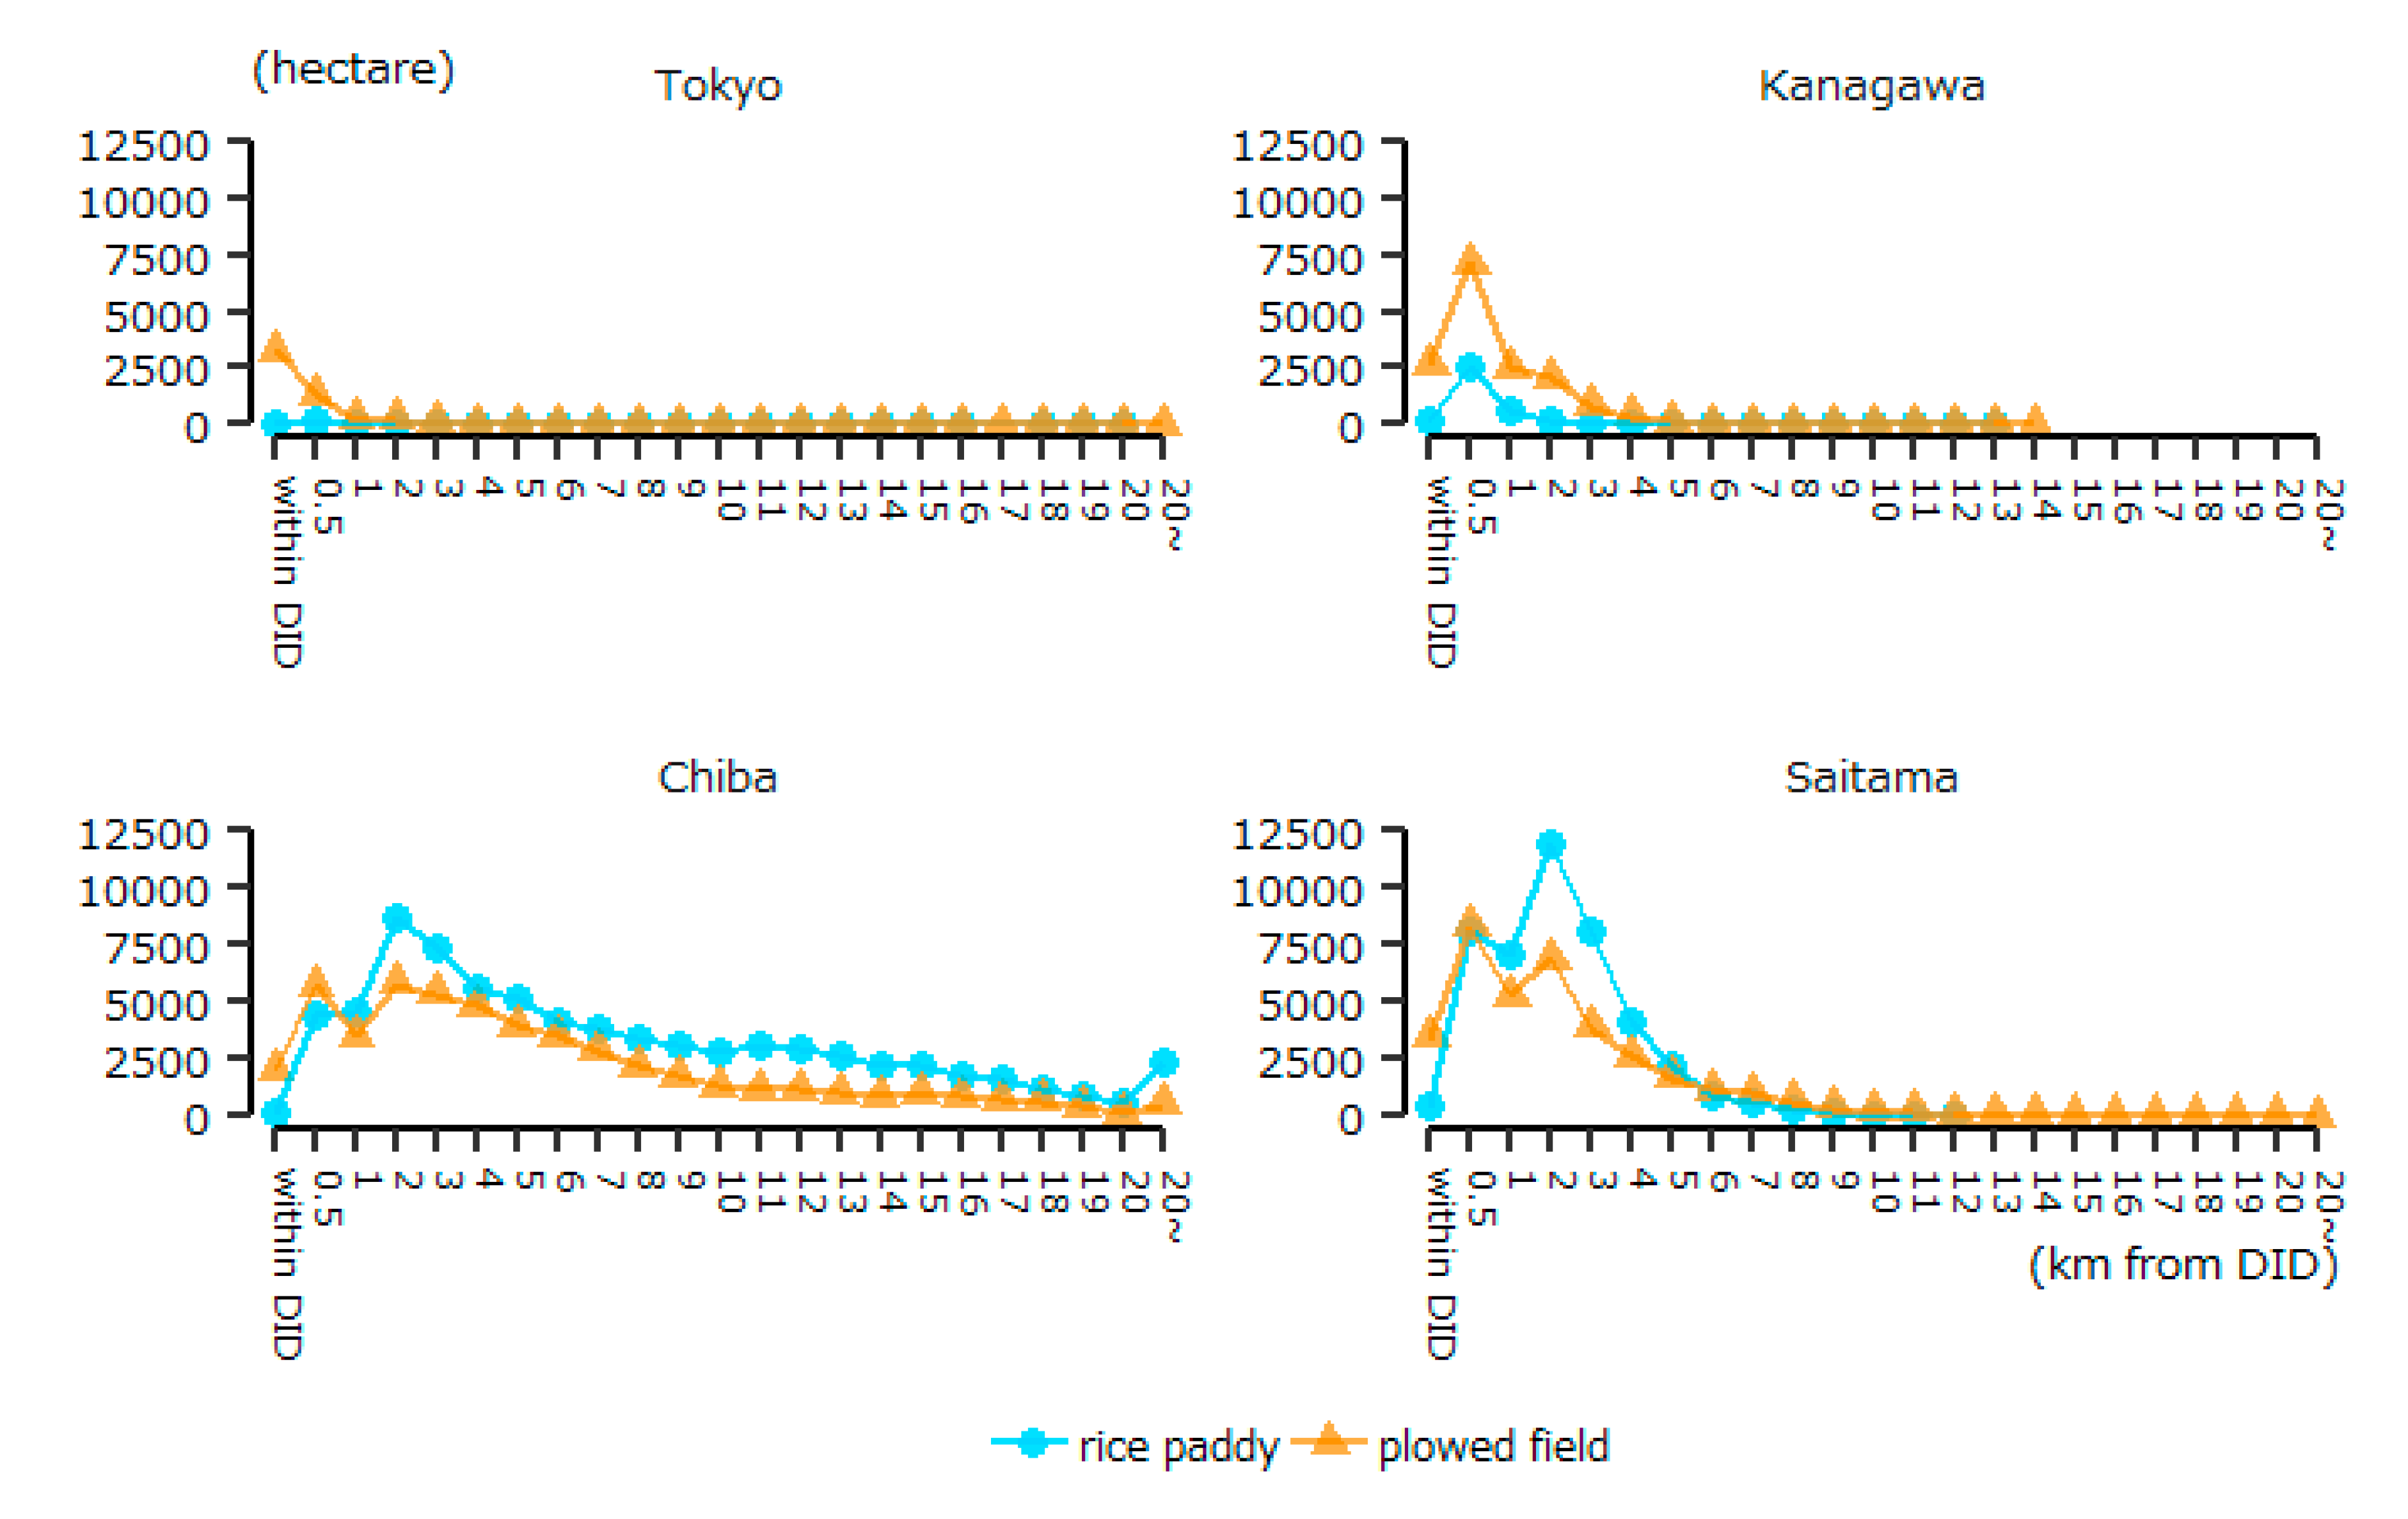
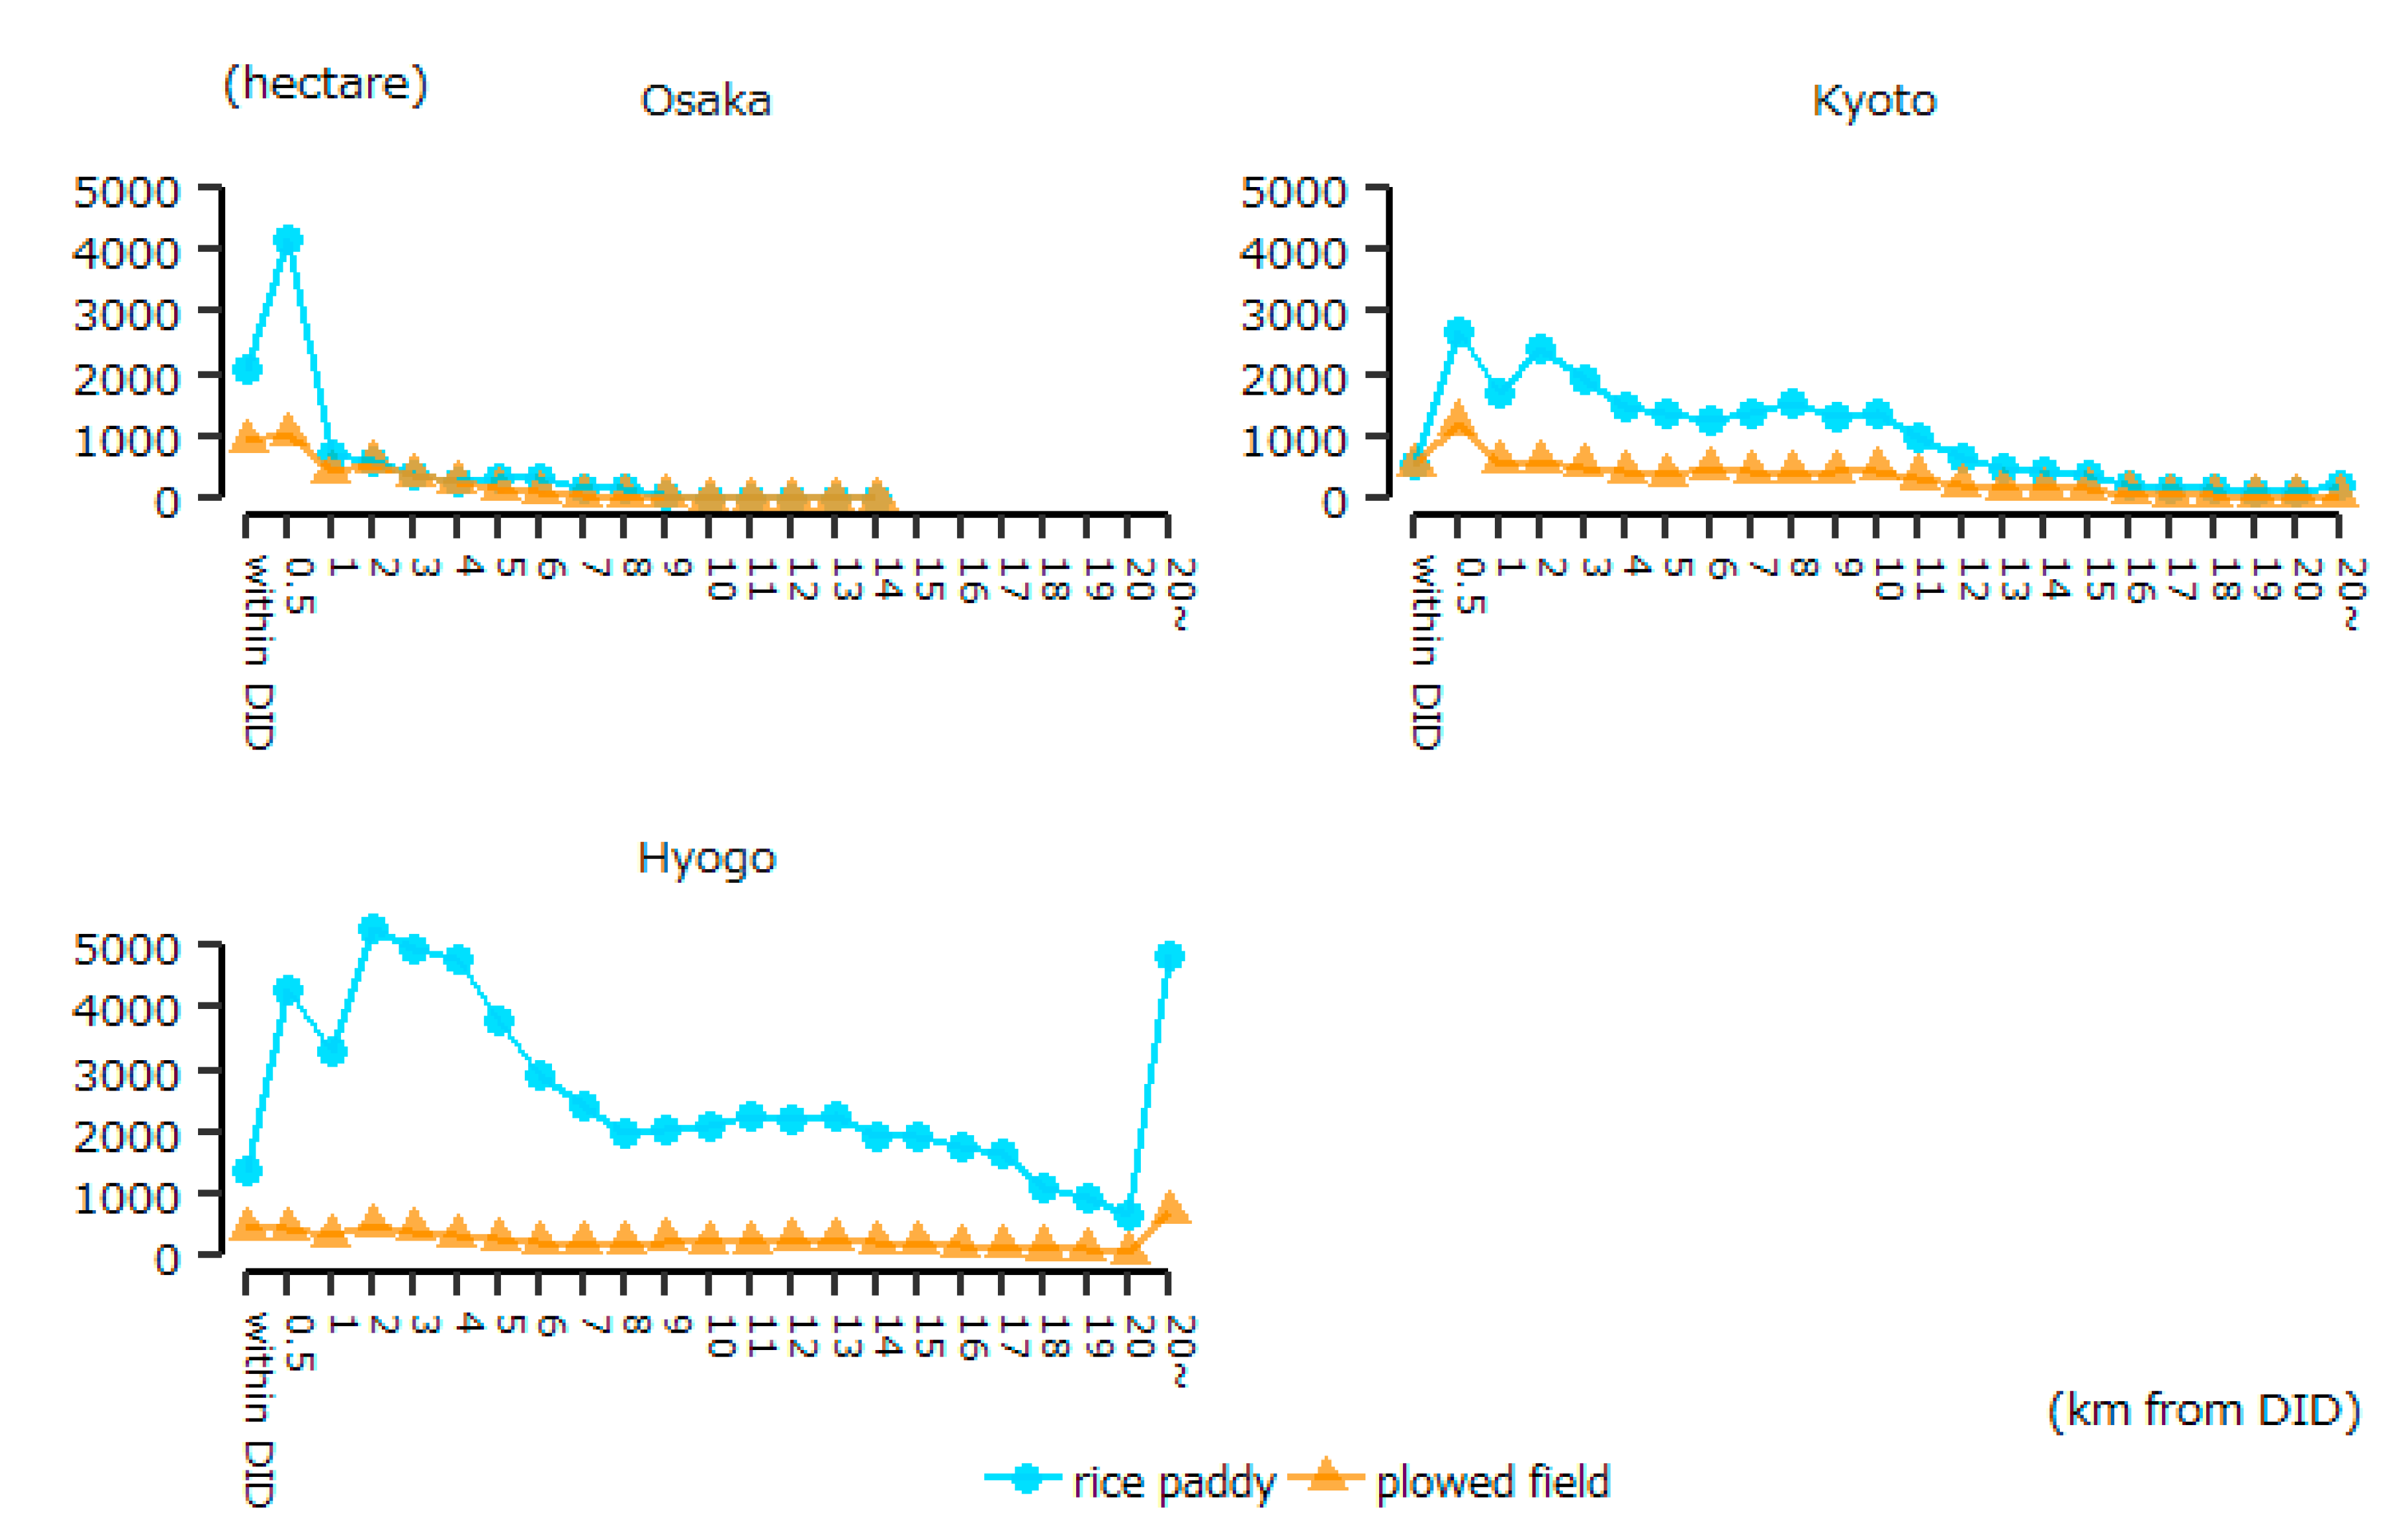
The number of farmlands in each prefecture is shown in Figure 6. First, in the Tokyo metro area, most of the farmlands within the 0.5 km buffer are plowed fields in every prefecture. Beyond the 1 km buffer, rice paddies outnumber plowed fields in Chiba and Saitama. Second, in the Osaka metro area, the number of rice paddies exceeds the number of plowed fields in both peri-urban areas and more rural areas in every prefecture. A few plowed fields, however, exist unevenly around the urban areas. Consequently, the targeted areas can be grouped into four types: Tokyo and Kanagawa specialize in plowed fields (group 1), Chiba and Saitama have a large number of plowed fields and rice paddies (group 2), Osaka and Kyoto have both plowed fields and rice fields around peri-urban areas (Group 3), and Hyogo has a large number of rice fields in every buffer (Group 4). This indicates that the distribution of farmlands in peri-urban areas is completely different for each prefecture.
4.2. Urbanization and Farming
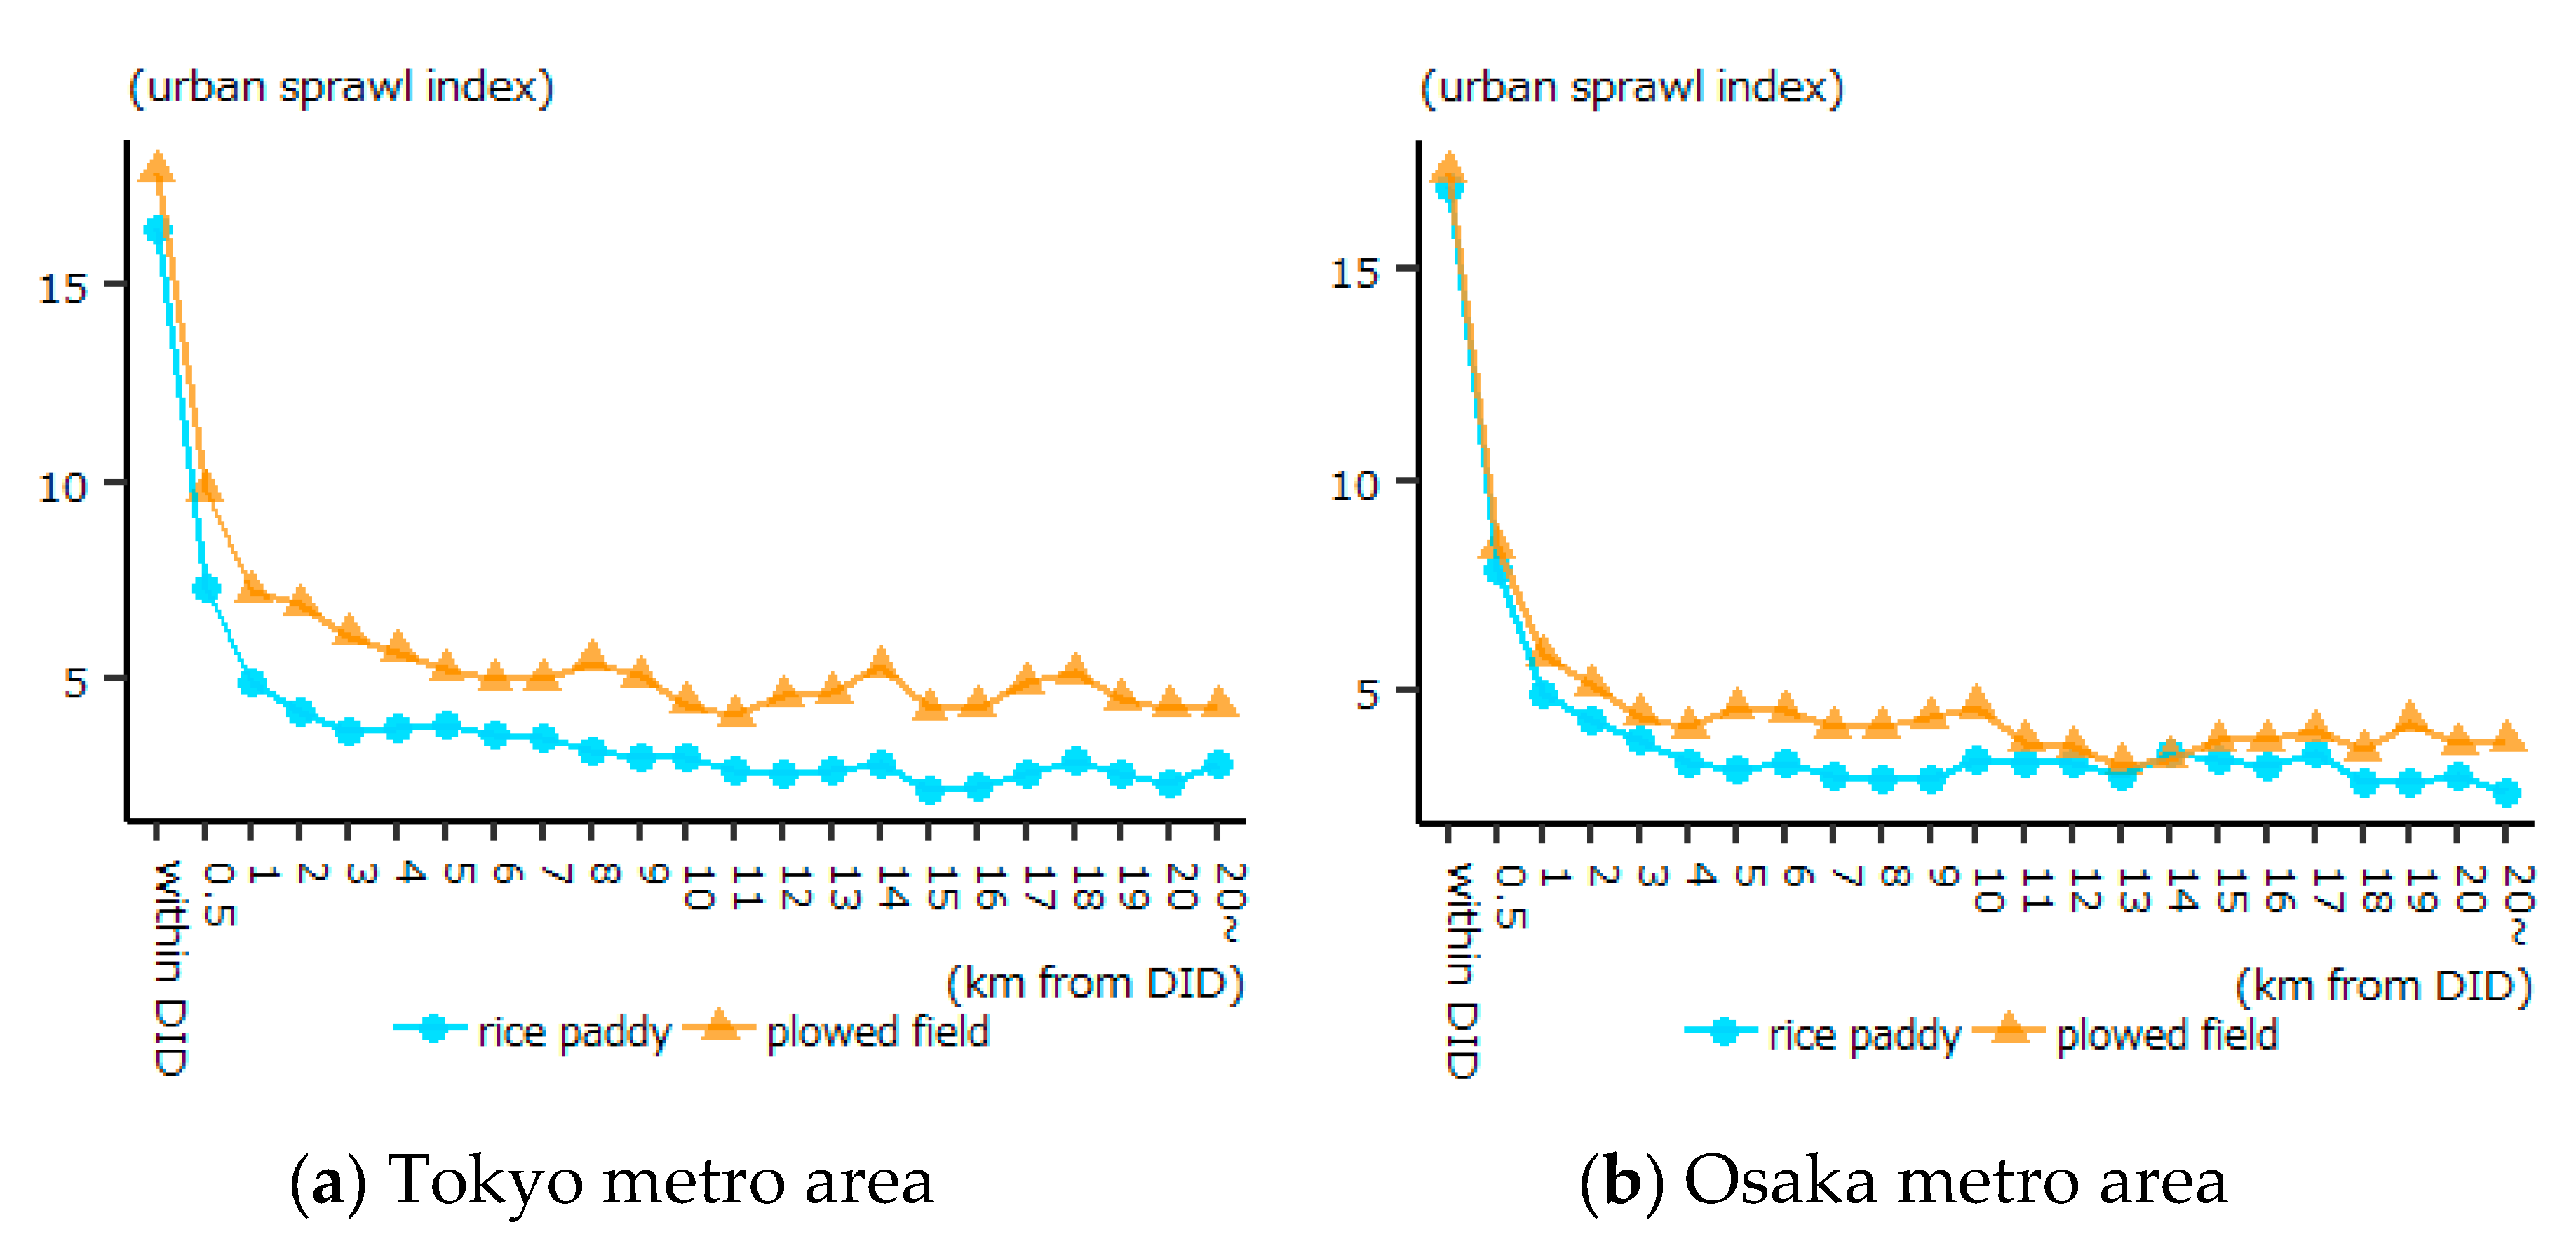
Figure 7 shows the average sprawl index based on the distance from DID. A farmland within DID is highly sprawled, and a farmland within the 0.5 km buffer is also surrounded by urban land uses. Beyond 1 km from DID, the plowed fields in the Tokyo metro area are more intensively sprawled than the rice paddies. In comparison, the farmlands in the Osaka metro area are less sprawled in suburban and rural areas. In summary, the plowed fields in the Tokyo metro area are located in a more highly sprawled area. Thus, this can be a PUA characteristic of the Tokyo metro area.
The average areas of farmland parcels based on the distance from DID are shown in Figure 8. First, the areas of rice paddies are larger than the areas of plowed fields in every buffer. Second, the size of farmland parcels in the Tokyo metro area tends to be larger than those in the Osaka metro area. However, with regard to the areas within DID in the Tokyo metro area, farmland parcels are slightly smaller than those beyond DID. Thus, the farming environment in peri-urban areas improves with an increasing distance from DID. On the other hand, the difference in average farmland size by the distance from DID in the Osaka metro area is negligible.
Finally, the average ratio of the number of diversified farms to total farms (hereafter, the diversified farms rate) is illustrated in Figure 9. The most important point is that the diversified farms rate increases with decreasing distance from DID, especially in the Tokyo metro area. The diversified farms rate is the highest within DID in the Tokyo metro area. On the other hand, the rate in areas far away from DID in the Osaka metro area tends to be slightly higher than that in the Tokyo metro area. Accordingly, while the PUA in the Tokyo metro area has the highest number of diversified farms between targeted areas, the rural areas in the Osaka metro area also has diversified farms.
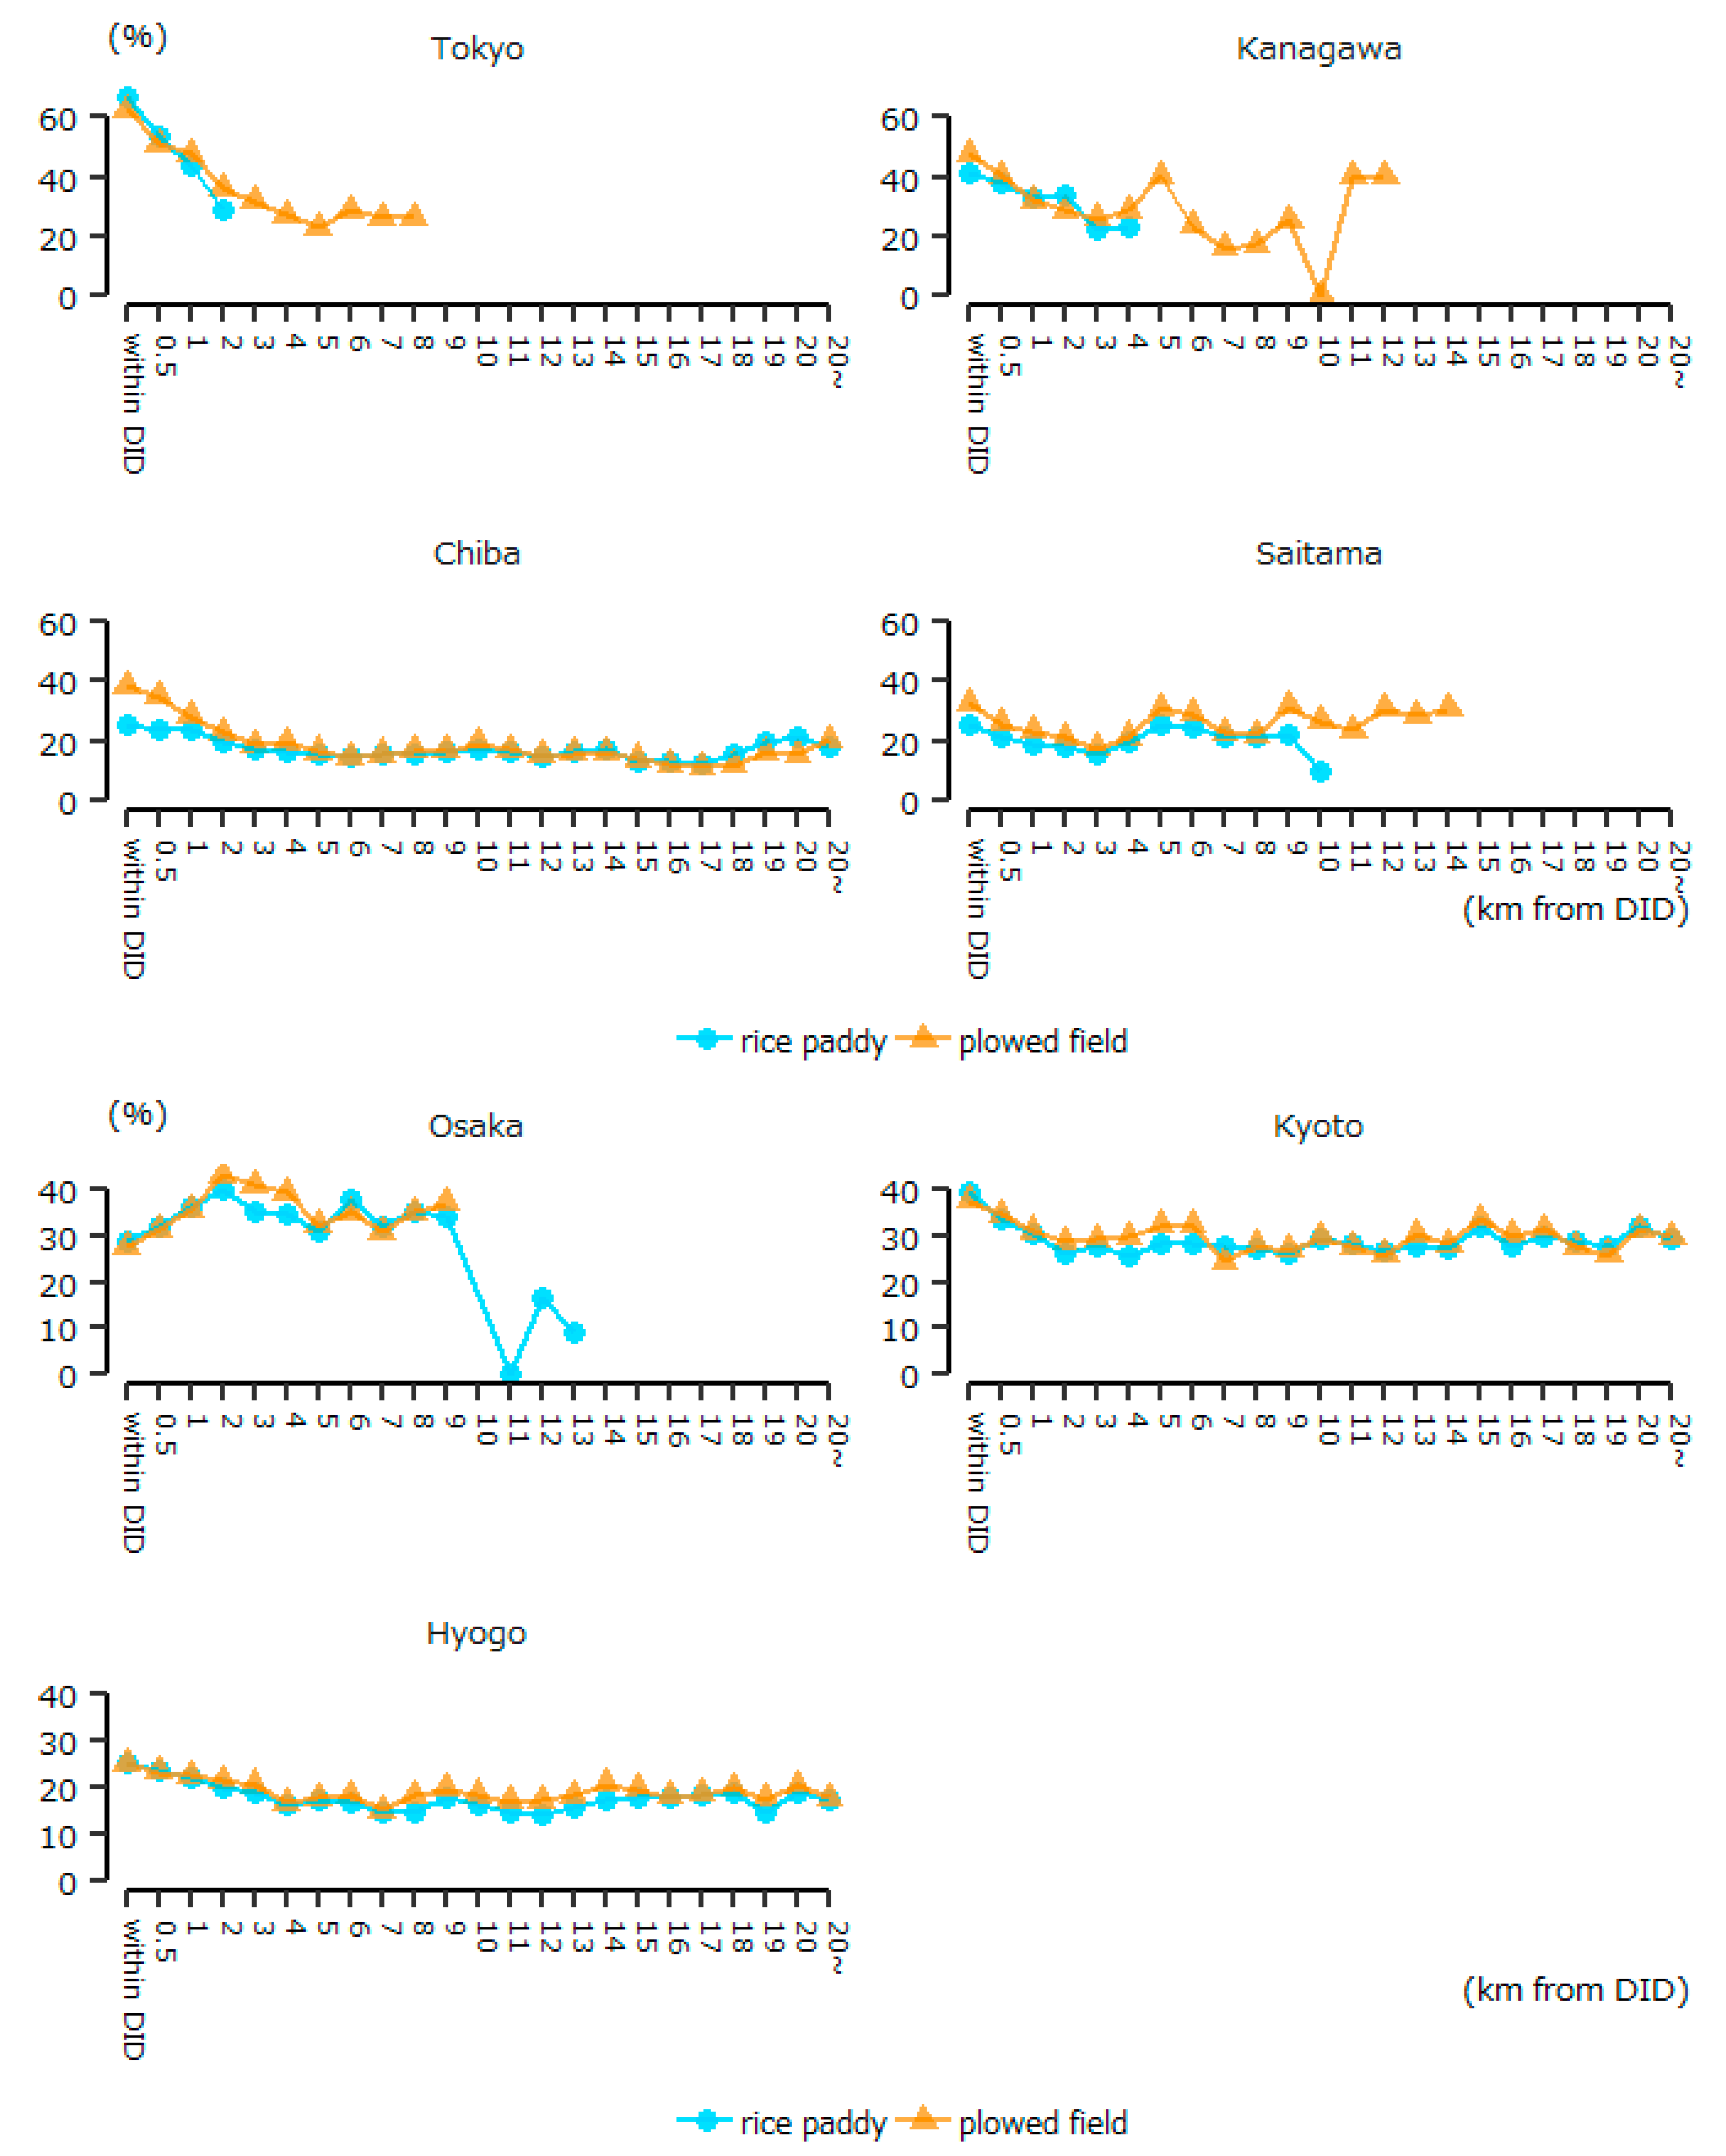
With regard to the diversified farms rate by each prefecture in Figure 10, the rate within 1 km from DID in Tokyo is more than 40%. While the diversified farms rate within 0.5 km from DID in Kanagawa is also around 40%, the rate of plowed fields in Chiba and Saitama is slightly lower than 40%. The tendencies of Kyoto and Hyogo are similar to those of Chiba and Saitama. On the contrary, with an increasing distance from DID, the rate in Osaka increases in peri-urban areas.
4.3. Effects of Urbanization on Farmland Parcels
In this section, the effects of urbanization on PUA are investigated by means of a regression analysis. First, the determinants of the size of the farmland parcels were analyzed. Table 3 shows the descriptive statistics of variables used in the analysis. As can be seen, the average farmland area in the Tokyo metro area, which is the dependent variable, is larger than that in the Osaka metro area. The sprawl index is also higher in the Tokyo metro area. The average distance buffer of each farmland parcel from DID is lower in the Tokyo metro area, and the densities of population and roads are also higher in this area. More than half of the farmland parcels in the Tokyo metro area are plowed fields. Thus, the numbers of vegetable, fruit, and flower farmers in the Tokyo metro area are all higher than in the Osaka metro area. The ratio of farmers with more than five million yen sales in a year to the total number of farmers (hereafter, high sales rate) is also twice as high as that in the Osaka metro area. However, the ratio of agricultural diversified farms evenly selling various produces, such as rice, vegetables, fruits, or livestock (hereafter, the agricultural diversification rate), is less than 10%, and is equal for each targeted area.
The results of the regression are shown in Table 4. Models 1, 2, and 3 use all samples. Compared with Model 3, Models 1 and 2 indicate that the inclusion of the interaction terms of sprawl index and distance had little effect on the estimation result. According to Model 3, the coefficients of sprawl index and distance from DID are negative and statistically significant. On the other hand, the interaction term is significantly positive. These results indicate that proximity to urban areas generally does not alleviate the negative effect of urban sprawl on farmland sizes.
However, according to the results in Models 4 and 5, the interaction effects of urban index and distance from DID are opposite in each area. As shown in Figure 11, the areas of farmland parcels decrease with an increase in the sprawl index in both regions. In the Tokyo metro area, a highly sprawled farmland within DID (distance = 0 km) is slightly larger than that in the 15 km buffer (distance = 15 km). On the other hand, the difference between distance = 0 km and distance = 15 km reduced with increasing sprawl index in the Osaka metro area. However, the farmland sizes within DID are much larger than those in the 15 km buffer. These results imply that proximity to urban areas does not necessarily worsen the farming environment, and they also indicate that urban sprawl generally has a negative effect on farming conditions. On the contrary, a relaxation effect of proximity to DID on the negative effect of urban sprawl is detected in the Tokyo metro area in this analysis.
Other important results of this analysis are shown below. First, the average size of rice paddies is over 300 m2 larger than that of plowed fields. Second, the agricultural communities with higher sales had larger farmlands. From another point of view, although the effects of agricultural characteristics are controlled, urbanization still affects the farming environment.
Consequently, urban sprawl is an essential factor for farmland protection. The advantage of proximity to DID is that even intensively sprawled farmlands can be maintained, especially in the Tokyo metro area. This can be attributed to the diversified activities in peri-urban farms.
4.4. Effects of Urbanization on Farm Diversification Activities
In this section, the effects of urbanization on farm diversification activities are investigated. Table 5 shows the descriptive statistics of the agricultural communities. The average diversified farms rate is around 25% in the two targeted regions. The average environmentally friendly farms rate is slightly larger than the diversified farms rate. The average number of farms that diversified into direct marketing is more than three; on the other hand, less than one farm on an average diversified into farming experience or tourism. Environmentally friendly activities are also practiced by a number of farms. The highest sales rate is 15.38% in the Tokyo metro area, exceeding the rate in the Osaka metro area. The large farm rate has the same tendency as the high sales rate.
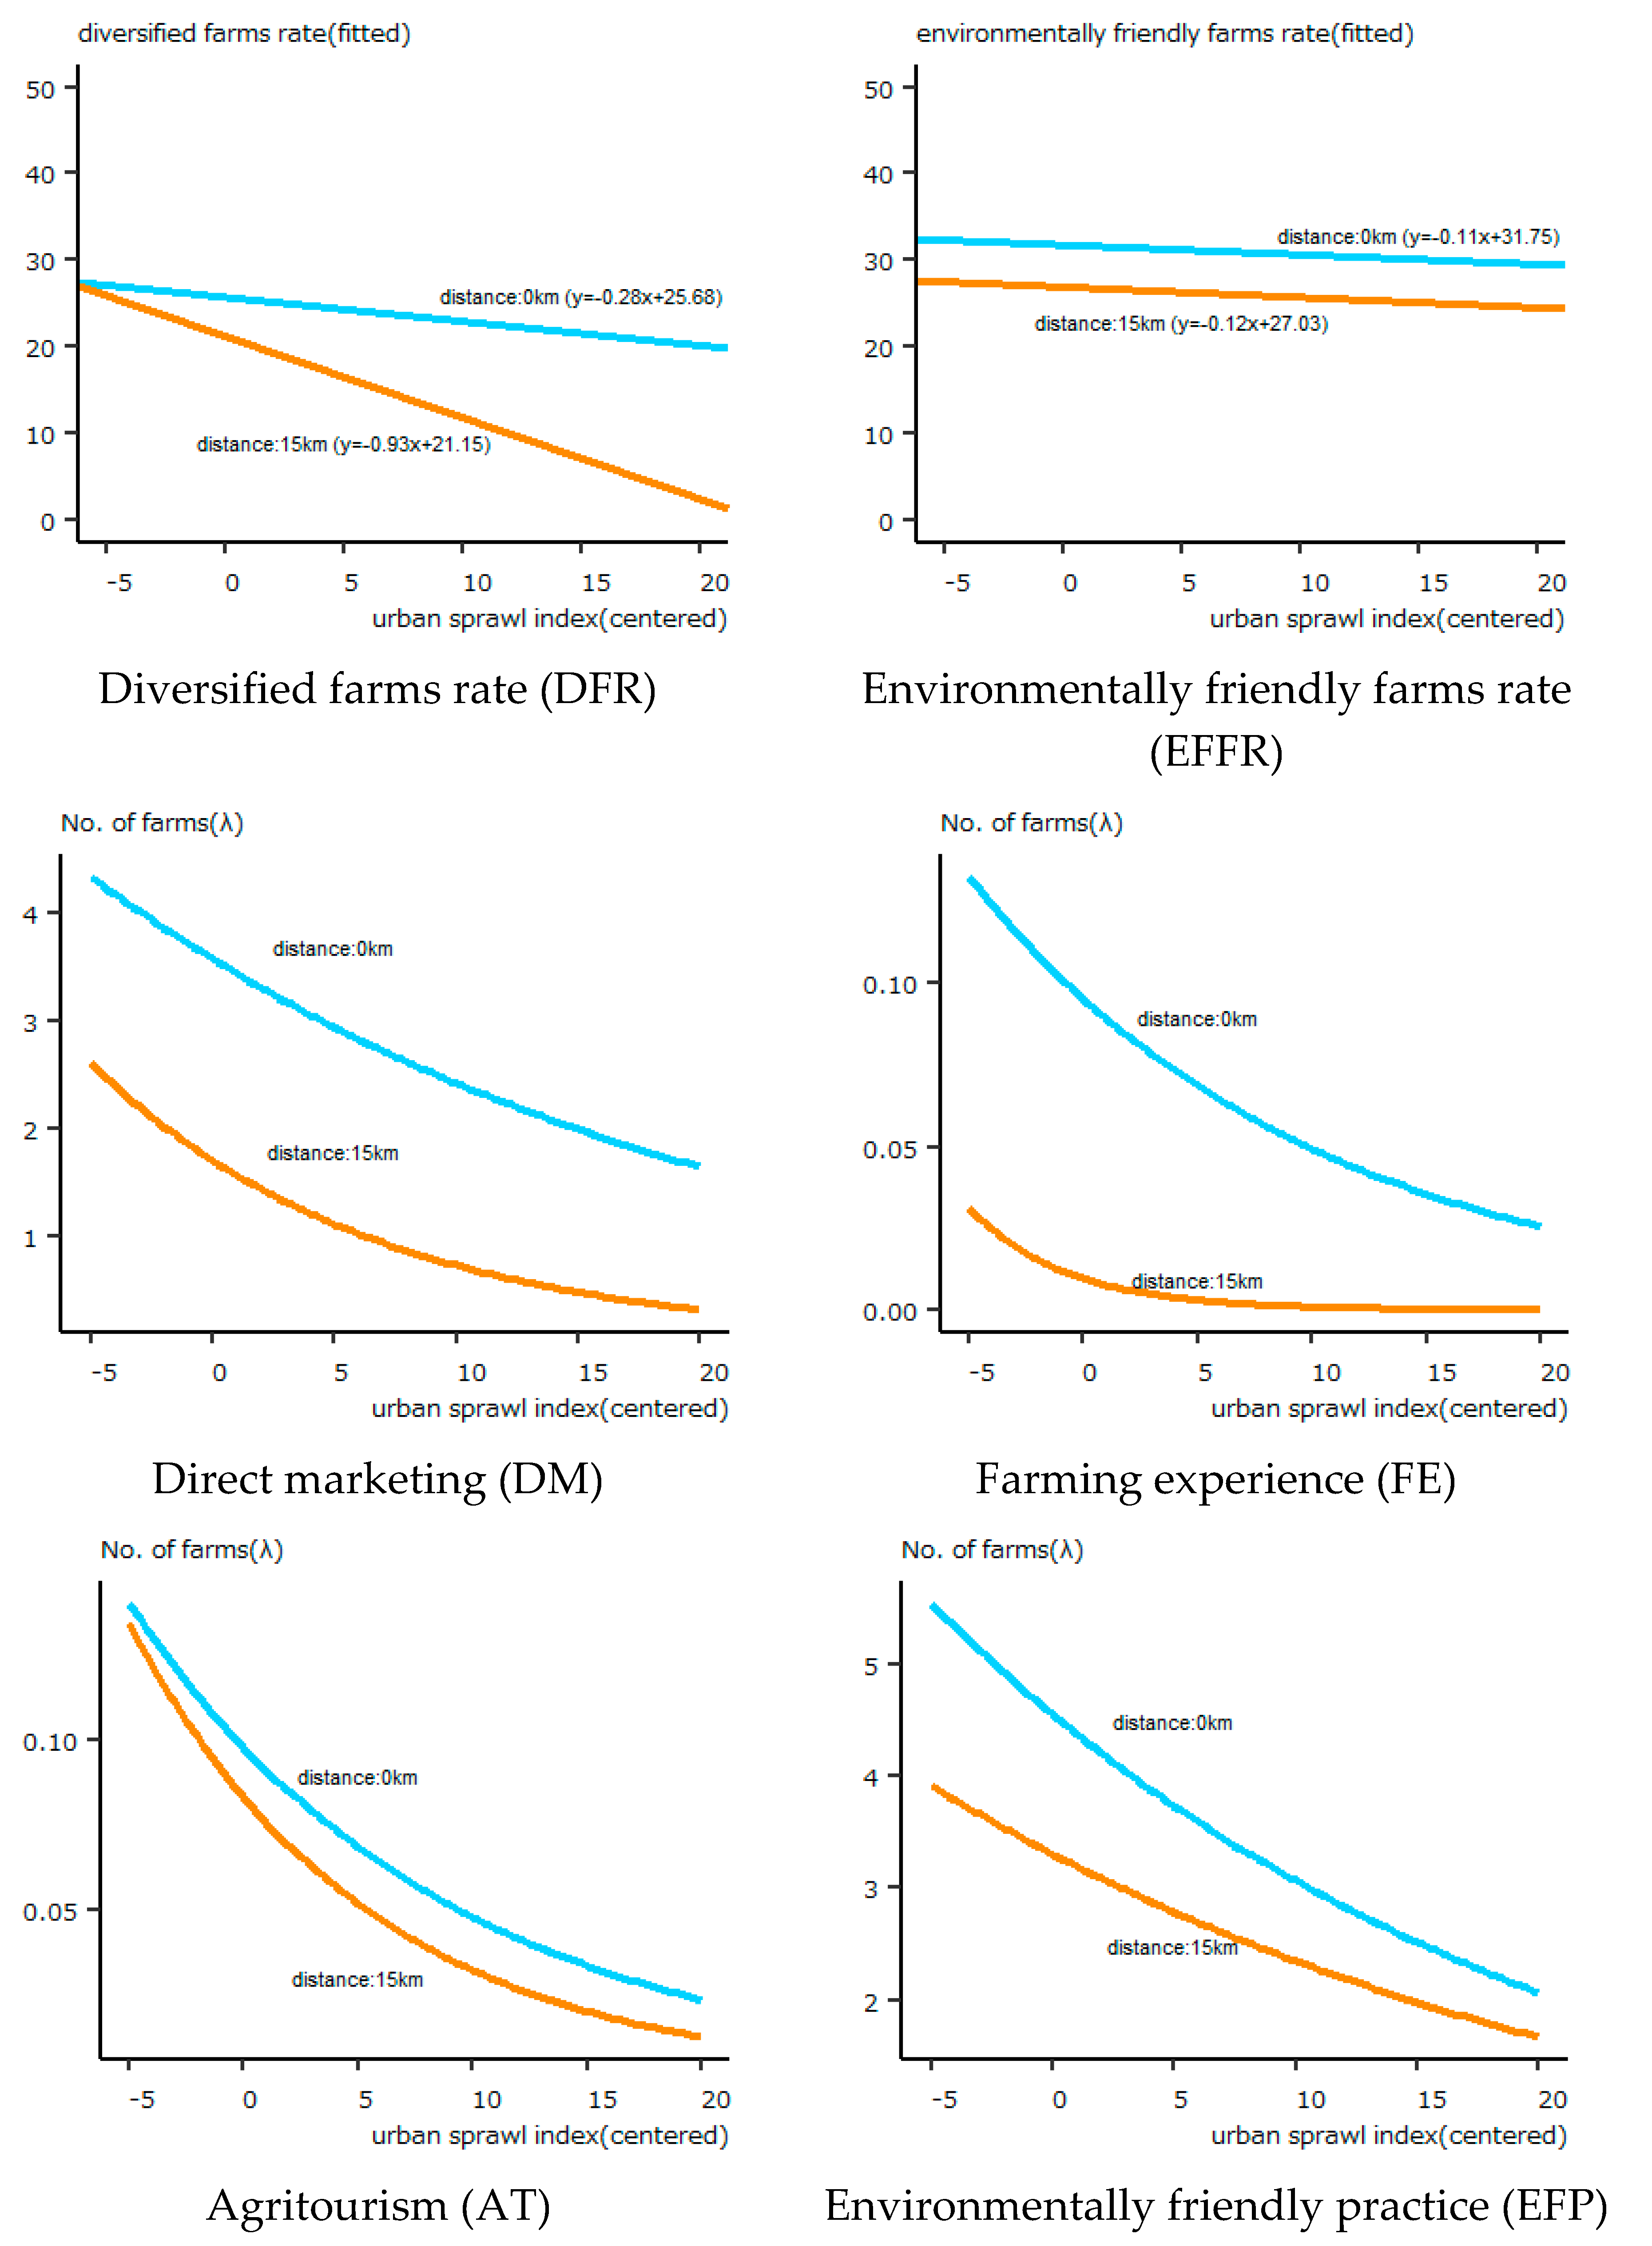
Table 6 and Table 7 show the regression analyses of the Tokyo and Osaka metro areas, respectively. First, as can be seen in Table 6, all the coefficients of sprawl index, other than that of the environmentally friendly farms rate, are significantly negative for all dependent variables. Thus, the urban sprawl in itself restrains the farm diversification activities. This result proved the hypothesis (2) correct. The coefficients of distance from DID are also significantly negative. This means that, with a decreasing distance from DID, farms more actively diversify their businesses. Thus, Hypothesis (1) was also verified. The interaction term of sprawl index and distance have negative effects on diversified farms rate, direct marketing, and experience. These results suggested that Hypothesis (3) was partly correct in the Tokyo metro area. Figure 12 shows the simulated relationship between sprawl index and distance. In agricultural communities within the DID (distance = 0 km), the sprawl index did not significantly affect diversified farms rate. On the other hand, for the agricultural communities far away from DID (distance = 15 km), the sprawl index decreases diversification activities. In terms of the environmentally friendly farms rate, the sprawl index has a negligible effect in any location.
The number of farms that diversified into direct marketing and farming experience is also affected by urban sprawl mediated by the distance from DID. However, according to Figure 12, the main negative effect of sprawl index is not completely mitigated by the proximity to urban areas. These results indicate that the number of farm diversification activities increase more in urban areas, where farmland is not intensively sprawled. It should be noted that, in highly sprawled urban areas, the multifunctional nature of PUA may increase the probability of diversified farm activities, thereby raising the diversified farms rate of each agricultural community.
As shown in Table 7, the diversified farms rate is negatively affected by urban sprawl and distance from DID in the Osaka metro area. The coefficients of their interaction terms are also negative. For the Osaka metro area, Hypotheses 1, 2, and 3 were also proved to be correct. This suggests that the effects of urbanization are fundamentally the same in each targeted area. According to the simulation analysis in Figure 13, the diversified farms rate in an agricultural community within DID (distance = 0 km) is almost constant at any level of urban sprawl. Compared to the result in the Tokyo metro area, the downward slope of the function of diversified farms rate (distance = 15 km) is less steep in the Osaka metro area. This indicates that even farms away from urban areas tend to diversify in the Osaka metro area. On the contrary, in terms of the number of farms to be diversified, the interaction effects of urban sprawl and distance from DID are not negative. Figure 13 shows that the agricultural communities not sprawled by urban land use have more farms actively diversifying their businesses. Moreover, in terms of environmentally friendly practices, farms distant from urban areas tend to practice manure management and reduce pesticides and chemical fertilizers at any level of urban sprawl. Compared to the Tokyo metro area, the environmentally friendly farms rate in the Osaka metro area is higher in more distant agricultural communities.
5. Discussion
The results of this study are summarized as follows: Farmland distribution by the distance from urban areas demonstrated that the characteristics of PUA were different for each area. Accordingly, the boundary and the type of PUA should be flexibly decided, depending on the environment in each region or city. On the other hand, the hypotheses of this study were applied to each area. First, proximity to urban areas encouraged farms to diversify their businesses into direct marketing, farming experience, agritourism, and environmentally friendly practices.
Second, urban sprawl aggravated the farming environment by reducing farmlands and farmers’ creative activities. Consequently, preventing urban sprawl in peri-urban areas is a fundamental strategy for policymakers to maintain the number of farmlands and the multifunctionality of PUA. Even though peri-urban agriculture has the high potential to supply food [9], the urban sprawl definitely worsens its production conditions.
Third, the synergistic effect of urban sprawl and proximity to urban areas was partly proved. Although there was no tendency of the diversified farms rate in the agricultural communities adjacent to urban areas increasing with increasing urban sprawl, the negative effect of urban sprawl in peri-urban areas was relatively small. In summary, some potential factors mitigate the aggravating effects on farming environment. In other words, a unique multifunctional nature may be inherent in a highly sprawled PUA. For example, densely populated areas in a city will provide an opportunity for farmers to directly interact with urban population and gather information useful for novel business models. These results prove the advantage of PUA multifunctionality proposed in previous studies [1,2]. The fact that urban sprawl may decrease the number of diversified farms implies that the negative effects of urban sprawl have already resulted in the exclusion of a considerable number of farms from PUA. Since the survivors of urbanization may have entrepreneurial attributes, a high rate of diversified farms in intensively sprawled areas can be maintained.
Another contribution of this study is in its demonstrating the relation between PUA and environmental sustainability. In the Tokyo metro area, peri-urban farmers were more interested in environmentally friendly practices. Even in the Osaka metro area, peri-urban farmers in less-urban-sprawled areas tended to adopt these practices more than rural farmers. For one, an urban population is more concerned with environmental protection or food safety; consequently, farmers may strategically make their farming practices more environmentally sustainable for an increased demand from the urban population. This customer orientation is peculiar to farmers who experienced a change in identity through social interaction [34]. Second, interactions with the urban population may lead to the farmers being interested in environmental problems related to agriculture. This view of social interaction is essential for strong multifunctionality [2]. Empirically, the social sustainability of peri-urban agriculture, such as food security or social interaction within urban communities or physical and mental health through farming, has been emphasized in urban areas. However, the integration of socially and environmentally sustainable activities should become the fundamental strategy for peri-urban farmers in the future. The results of this study also suggest that a policy to prevent urban sprawl is needed to sustain the farms that are socially and environmentally active.
6. Conclusions
The first objective of this study was to reveal the spatial characteristics of farmland parcels and farm management in peri-urban areas in Japan, using the latest agricultural land parcel GIS database. It was shown that more than half of the farmlands in the targeted areas are located within 4 km of DID. The importance of these PUAs was ascertained. The second objective was to analyze the effects of urbanization on PUA, especially on farm diversification activities and environmentally friendly farming practices. Consequently, while proximity to urban areas positively affected farm diversification activities, urban sprawl had a negative effect. The mediating effects of urban proximity, however, mitigated the negative effects of urban sprawl in the targeted areas. This shows the existence of potential opportunities for farmers in highly urbanized environments. From the perspective of SDGs, these results imply that the planned urban growth without urban sprawl makes peri-urban agriculture more diversified; in turn, diversified farm activities contribute to the social and environmental sustainability of urban areas.
One of the advantages of this study was to show that the large GIS dataset can be applied for the research on peri-urban agriculture. This methodology promotes the understanding of the spatial characteristics of each area that have not been clearly demonstrated before. Another advantage was to reveal the conditions of the social and environmental sustainability of peri-urban agriculture. The fact that the environmentally friendly practice is more popular in urban settings than in rural areas is a novel finding.
The mechanisms by which an urban environment benefits farmers should be identified. To that end, a more detailed investigation will be needed. The most important problem is the integration of farmland parcel data and individual farm management data. This data integration will enable us to investigate the mechanism of strategic decision-making for farmers who make use of the PUA multifunctionality. Moreover, the effect of urbanization on the sustainability of urban farming can also be analyzed. Another challenging problem is a comparative study of different countries. The historical process of urban development and the characteristics of PUA in Asian countries may be different from those in European countries. Even so, the common conditions for agriculture to contribute to urban resilience can be revealed with a comparative study. These efforts will make the characteristics of PUA multifunctionality clearer.
Funding
This work was supported by the Japan Society for the Promotion of Science (Grant number 19092455).
Acknowledgments
This work was supported by the Japan Society for the Promotion of Science (Grant number 19092455).
Conflicts of Interest
The authors declare no conflict of interest. The sponsors had no role in the design, execution, interpretation, or writing of the study.
References
- Zasada, I. Multifunctional peri-urban agriculture—A review of societal demands and the provision of goods and services by farming. Land Use Policy 2011, 28, 639–648. [Google Scholar] [CrossRef]
- Wilson, G.A. From ‘weak’ to ‘strong’multifunctionality: Conceptualising farm-level multifunctional transitional pathways. J. Rural Stud. 2008, 24, 367–383. [Google Scholar] [CrossRef]
- Lovell, S.T. Multifunctional urban agriculture for sustainable land use planning in the United States. Sustainability 2010, 2, 2499–2522. [Google Scholar] [CrossRef] [Green Version]
- Yokohari, M.; Amati, M.; Bolthouse, J.; Kurita, H. Restoring urban fringe landscapes through urban agriculture: The Japanese experience. Disp. Plan. Rev. 2010, 46, 51–59. [Google Scholar] [CrossRef]
- Kurita, H.; Yokohari, M.; Bolthouse, J. The potential of intra-regional supply and demand of agricultural products in an urban fringe area: A case study of the Kanto Plain, Japan. Geogr. Tidsskr. J. Geogr. 2009, 109, 147–159. [Google Scholar] [CrossRef]
- Yokohari, M.; Takeuchi, K.; Watanabe, T.; Yokota, S. Beyond greenbelts and zoning: A new planning concept for the environment of Asian mega-cities. In Urban Ecology; Springer: Berlin/Heidelberg, Germany, 2008; pp. 783–796. [Google Scholar]
- Kiminami, L.; Kiminami, A.; Furuzawa, S. Impacts of multi-functionality of urban agriculture on the CCs in Japan. Asia Pac. J. Reg. Sci. 2018, 2, 507–527. [Google Scholar] [CrossRef]
- Kiminami, L.; Furuzawa, S.; Kiminami, A. Impacts of multi-functionality of urban agriculture on the creative classes in global mega city: Focusing on Shanghai in China. Asia Pac. J. Reg. Sci. 2019, 3, 487–515. [Google Scholar] [CrossRef]
- Sioen, G.B.; Terada, T.; Sekiyama, M.; Yokohari, M. Resilience with mixed agricultural and urban land uses in Tokyo, Japan. Sustainability 2018, 10, 435. [Google Scholar] [CrossRef] [Green Version]
- Hoornweg, D.; Munro-Faure, P. Urban Agriculture for Sustainable Poverty Alleviation and Food Security; Food and Agriculture Organization of the United Nations (FAO): Rome, Italy, 2008. [Google Scholar]
- Pölling, B.; Mergenthaler, M.; Lorleberg, W. Professional urban agriculture and its characteristic business models in Metropolis Ruhr, Germany. Land Use Policy 2016, 58, 366–379. [Google Scholar] [CrossRef]
- Ilbery, B.W. Farm diversification as an adjustment strategy on the urban fringe of the West Midlands. J. Rural Stud. 1991, 7, 207–218. [Google Scholar] [CrossRef]
- Pölling, B.; Mergenthaler, M. The location matters: Determinants for “deepening” and “broadening” diversification strategies in Ruhr Metropolis’ Urban Farming. Sustainability 2017, 9, 1168. [Google Scholar] [CrossRef] [Green Version]
- Gullino, P.; Battisti, L.; Larcher, F. Linking multifunctionality and sustainability for valuing peri-urban farming: A case study in the Turin Metropolitan Area (Italy). Sustainability 2018, 10, 1625. [Google Scholar] [CrossRef] [Green Version]
- Sinclair, R. Von Thünen and urban sprawl. Ann. Assoc. Am. Geogr. 1967, 57, 72–87. [Google Scholar] [CrossRef]
- Boncinelli, F.; Bartolini, F.; Casini, L. Structural factors of labour allocation for farm diversification activities. Land Use Policy 2018, 71, 204–212. [Google Scholar] [CrossRef]
- Lange, A.; Piorr, A.; Siebert, R.; Zasada, I. Spatial differentiation of farm diversification: How rural attractiveness and vicinity to cities determine farm households’ response to the CAP. Land Use Policy 2013, 31, 136–144. [Google Scholar] [CrossRef]
- Meraner, M.; Heijman, W.; Kuhlman, T.; Finger, R. Determinants of farm diversification in the Netherlands. Land Use Policy 2015, 42, 767–780. [Google Scholar] [CrossRef]
- Kiryluk-Dryjska, E.; Więkeckowska, B. Territorial Clusters of Farmers’ Interest in Diversification in Poland: Geospatial Location and Characteristics. Sustainability 2020, 12, 5276. [Google Scholar] [CrossRef]
- Delbecq, B.A.; Kuethe, T.H.; Borchers, A.M. Identifying the extent of the urban fringe and its impact on agricultural land values. Land Econ. 2014, 90, 587–600. [Google Scholar] [CrossRef]
- Chen, Y.-H.; Lee, C.-L.; Chen, G.-R.; Wang, C.-H.; Chen, Y.-H. Factors Causing Farmland Price-Value Distortion and Their Implications for Peri-Urban Growth Management. Sustainability 2018, 10, 2701. [Google Scholar] [CrossRef] [Green Version]
- Uematsu, H.; Khanal, A.R.; Mishra, A.K. The impact of natural amenity on farmland values: A quantile regression approach. Land Use Policy 2013, 33, 151–160. [Google Scholar] [CrossRef]
- Livanis, G.; Moss, C.B.; Breneman, V.E.; Nehring, R.F. Urban sprawl and farmland prices. Am. J. Agric. Econ. 2006, 88, 915–929. [Google Scholar] [CrossRef]
- Cavailhès, J.; Wavresky, P. Urban influences on periurban farmland prices. Eur. Rev. Agric. Econ. 2003, 30, 333–357. [Google Scholar] [CrossRef]
- Yoshida, S.; Yagi, H.; Kiminami, A. Determinants of Farm Diversification in Peri-Urban Agriculture: Spatial Econometric Analysis with Municipality-Level Data from the Kanto Region. Stud. Reg. Sci. 2019, 49, 17–31. [Google Scholar] [CrossRef]
- Bartolini, F.; Andreoli, M.; Brunori, G. Explaining determinants of the on-farm diversification: Empirical evidence from Tuscany region. BioBased Appl. Econ. 2014, 3, 137–157. [Google Scholar]
- Jaeger, J.A.G.; Bertiller, R.; Schwick, C.; Kienast, F. Suitability criteria for measures of urban sprawl. Ecol. Indic. 2010, 10, 397–406. [Google Scholar] [CrossRef]
- Ermer, K.; Mohrmann, R.; Sukopp, H. Stadt und Umwelt. In Umweltschutz–Grundlagen und Praxis; Buchwald, K., Engelhardt, W., Eds.; Economica Verlag: Bonn, Germany, 1994; Volume 125. [Google Scholar]
- Sharp, J.S.; Smith, M.B. Social capital and farming at the rural--urban interface: The importance of nonfarmer and farmer relations. Agric. Syst. 2003, 76, 913–927. [Google Scholar] [CrossRef]
- Bryant, C.R.; Johnston, T.R.R. Agriculture in the City’s Countryside; Belhaven Press: London, UK, 1992. [Google Scholar]
- Yoshida, S.; Yagi, H.; Kiminami, A.; Garrod, G. Farm Diversification and Sustainability of Multifunctional Peri-Urban Agriculture: Entrepreneurial Attributes of Advanced Diversification in Japan. Sustainability 2019, 11, 2887. [Google Scholar] [CrossRef] [Green Version]
- Sudhira, H.S.; Ramachandra, T.V.; Jagadish, K.S. Urban sprawl: Metrics, dynamics and modelling using GIS. Int. J. Appl. Earth Obs. Geoinf. 2004, 5, 29–39. [Google Scholar] [CrossRef]
- Brueckner, J.K.; Largey, A.G. Social interaction and urban sprawl. J. Urban Econ. 2008, 64, 18–34. [Google Scholar] [CrossRef] [Green Version]
- Brandth, B.; Haugen, M.S. Farm diversification into tourism—Implications for social identity? J. Rural Stud. 2011, 27, 35–44. [Google Scholar] [CrossRef] [Green Version]
Figure 1.
Farmland parcels (HUDE polygon).

Figure 2.
Stratified buffers by distance from DID. (a) includes Tokyo, Kanagawa, Chiba and Saitama. (b) includes Osaka, Kyoto and Hyogo.
Figure 2.
Stratified buffers by distance from DID. (a) includes Tokyo, Kanagawa, Chiba and Saitama. (b) includes Osaka, Kyoto and Hyogo.

Figure 3.
Distribution maps of farmland parcels. (a) shows Tokyo metro area and (b) shows Osaka metro area. Sources: National Land Information of Ministry of Land, Infrastructure, Transport, and Tourism of Japan. Ministry of Agriculture, Forestry, and Fisheries.
Figure 3.
Distribution maps of farmland parcels. (a) shows Tokyo metro area and (b) shows Osaka metro area. Sources: National Land Information of Ministry of Land, Infrastructure, Transport, and Tourism of Japan. Ministry of Agriculture, Forestry, and Fisheries.

Figure 4.
Total areas by distance from DID. (a) shows the case of Tokyo metro area and (b) shows the case of Osaka metro area.
Figure 4.
Total areas by distance from DID. (a) shows the case of Tokyo metro area and (b) shows the case of Osaka metro area.

Figure 5.
Cumulative percentage of total areas by distance from DID. (a) shows the case of Tokyo metro area and (b) shows the case of Osaka metro area.
Figure 5.
Cumulative percentage of total areas by distance from DID. (a) shows the case of Tokyo metro area and (b) shows the case of Osaka metro area.

Figure 6.
Total areas of each prefecture by distance from DID.


Figure 7.
Average urban sprawl index by distance from DID. (a) shows the case of Tokyo metro area and (b) shows the case of Osaka metro area.
Figure 7.
Average urban sprawl index by distance from DID. (a) shows the case of Tokyo metro area and (b) shows the case of Osaka metro area.

Figure 8.
Average plot sizes by distance from DID. (a) shows the case of Tokyo metro area and (b) shows the case of Osaka metro area.
Figure 8.
Average plot sizes by distance from DID. (a) shows the case of Tokyo metro area and (b) shows the case of Osaka metro area.

Figure 9.
Average diversified farms rate by distance from DID. (a) shows the case of Tokyo metro area and (b) shows the case of Osaka metro area. Note: The average diversified farms rate is calculated by relating the rate per agricultural community unit to farmland parcels by using GIS software.
Figure 9.
Average diversified farms rate by distance from DID. (a) shows the case of Tokyo metro area and (b) shows the case of Osaka metro area. Note: The average diversified farms rate is calculated by relating the rate per agricultural community unit to farmland parcels by using GIS software.

Figure 10.
Average diversified farms rate of each prefecture by distance from DID. Note: The average diversified farms rate is calculated by relating the rate per agricultural community unit to farmland parcels, using GIS software.
Figure 10.
Average diversified farms rate of each prefecture by distance from DID. Note: The average diversified farms rate is calculated by relating the rate per agricultural community unit to farmland parcels, using GIS software.

Figure 11.
Average plot sizes by distance from DID. (a,b) demonstrate the results of Tokyo metro area and Osaka metro area, respectively. Black dots denote the average area of the farmland parcels by sprawl index. Except for distance and sprawl index, the average values of all of the variables were substituted in the estimated equation.

Figure 12.
Simulation of regression analysis in the Tokyo metro area. Note: Except for distance and sprawl index, the average values of all variables were substituted in the estimated equation.
Figure 12.
Simulation of regression analysis in the Tokyo metro area. Note: Except for distance and sprawl index, the average values of all variables were substituted in the estimated equation.

Figure 13.
Simulation of regression analysis in the Osaka metro area. Note: Except for distance and sprawl index, the average values of all variables were substituted in the estimated equation.
Figure 13.
Simulation of regression analysis in the Osaka metro area. Note: Except for distance and sprawl index, the average values of all variables were substituted in the estimated equation.


Table 1.
Characteristics of each prefecture.
| Tokyo Metro Area | Osaka Metro Area | ||||||
|---|---|---|---|---|---|---|---|
| Tokyo | Kanagawa | Chiba | Saitama | Osaka | Kyoto | Hyogo | |
| Area (km2) | 1783 | 2411 | 5155 | 3796 | 1908 | 4620 | 8422 |
| population | 13,159,000 | 9,048,000 | 6,216,000 | 7,195,000 | 8,865,000 | 2,636,000 | 5,588,000 |
| population density (person/km2) | 5998 | 3745 | 1205 | 1895 | 4654 | 572 | 665 |
| % of DID area | 59.67 | 39.07 | 12.49 | 18.23 | 47.24 | 5.70 | 6.93 |
| total agricultural production (billion yen) (% of horticulture) | 27 (86%) | 84 (73%) | 470 (48%) | 198 (61%) | 36 (70%) | 74 (41%) | 163 (30%) |
Source: National Land Information of Ministry of Land, Infrastructure, Transport, and Tourism of Japan, Ministry of Agriculture, Forestry, and Fisheries. Notes: Horticulture includes vegetable, fruit, and flower production. DID = densely inhabited district.
Table 2.
Comparisons of total agricultural land areas between databases.
| Region | Prefecture | Farmland Parcels (ha) | National Survey (ha) | Excess Area Rate (%) | ||||||
|---|---|---|---|---|---|---|---|---|---|---|
| Rice Paddy | Plowed Field | Total Area | Rice Paddy | Plowed Field | Total Area | Rice Paddy | Plowed Field | Total Area | ||
| (1) | (2) | (3) | (4) | (5) | (6) | (1)/(4) *100 | (2)/(5) *100 | (3)/(6) *100 | ||
| Tokyo metro area | Tokyo | 279 | 5585 | 5864 | 249 | 5378 | 5627 | 112 | 104 | 104 |
| Kanagawa | 3782 | 16,358 | 20,139 | 3671 | 15,110 | 18,781 | 103 | 108 | 107 | |
| Chiba | 75,399 | 52,237 | 127,637 | 73,533 | 51,033 | 124,566 | 103 | 102 | 102 | |
| Saitama | 44,300 | 36,034 | 80,334 | 41,306 | 33,231 | 74,537 | 107 | 108 | 108 | |
| Total | 123,760 | 110,214 | 233,974 | 118,759 | 104,752 | 223,511 | 104 | 105 | 105 | |
| Osaka metro area | Osaka | 9430 | 4054 | 13,484 | 8880 | 3814 | 12,694 | 106 | 106 | 106 |
| Kyoto | 23,107 | 7880 | 30,987 | 23,280 | 6671 | 29,951 | 99 | 118 | 103 | |
| Hyogo | 60,853 | 6314 | 67,167 | 67,225 | 6256 | 73,481 | 91 | 101 | 91 | |
| Total | 93,390 | 18,248 | 111,638 | 99,385 | 16,741 | 116,126 | 94 | 109 | 96 | |
Source: Ministry of Agriculture, Forestry, and Fisheries.
Table 3.
Descriptive statistics of farmland parcels.
| Independent Variables | Unit | Full Sample N = 2,960,523 | Tokyo Metro Area N = 1,724,153 | Osaka Metro Area N = 1,236,370 | |||
|---|---|---|---|---|---|---|---|
| Mean | SD | Mean | SD | Mean | SD | ||
| area | m2 | 1054.41 | 1147.90 | 1244.44 | 1279.56 | 789.42 | 866.84 |
| urban sprawl index | ☐ | 6.01 | 5.54 | 6.77 | 5.81 | 4.95 | 4.95 |
| distance | km | 4.91 | 5.07 | 3.77 | 4.37 | 6.50 | 5.52 |
| population | persons/500 m grid | 315.63 | 596.43 | 369.72 | 658.28 | 240.20 | 487.59 |
| road | m/1 km grid | 6749.20 | 5798.11 | 7677.55 | 6112.20 | 5454.58 | 5052.06 |
| plowed field | dummy | 0.44 | 0.50 | 0.56 | 0.50 | 0.27 | 0.45 |
| high sales rate | % | 12.35 | 17.26 | 16.24 | 19.31 | 6.93 | 11.93 |
| agricultural diversification rate | % | 4.66 | 7.48 | 4.78 | 7.58 | 4.48 | 7.34 |
| vegetable farmer rate | % | 19.76 | 26.17 | 25.00 | 28.29 | 12.46 | 20.79 |
| fruit farmer rate | % | 4.81 | 13.63 | 6.13 | 15.04 | 2.95 | 11.09 |
| flower farmer rate | % | 3.36 | 9.93 | 4.44 | 10.92 | 1.86 | 8.11 |
Sources: National Land Information of Ministry of Land, Infrastructure, Transport, and Tourism of Japan. Ministry of Agriculture, Forestry, and Fisheries. Note: The “distance” was calculated according to the classification of farmland parcel location (0 km buffer = 0, 0.5 km buffer = 0.5, 1 km buffer = 1, …, 19 km buffer = 19, and 20 km buffer = 20). Farmland parcels more than 20 km away from DID were excluded in the analysis. This is because this analysis aimed to investigate the relation between farmland and urbanization in peri-urban areas.
Table 4.
Effects of urban sprawl and distance from DID on farmland parcels.
| Independent Variables | Unit | Full Sample N = 2,960,523 | Tokyo Metro Area N = 1,724,153 | Osaka Metro Area N = 1,236,370 | ||
|---|---|---|---|---|---|---|
| Model 1 | Model 2 | Model 3 | Model 4 | Model 5 | ||
| intercept | ☐ | 1050.52 *** | 1016.00 *** | 1017.00 *** | 1311.00 *** | 813.08 *** |
| urban sprawl index | ☐ | −33.61 *** | −35.17 *** | −34.87 *** | −42.49 *** | −28.96 *** |
| distance | km | −21.27 *** | −19.82 *** | −19.16 *** | −2.27 *** | −12.08 *** |
| urban sprawl index*distance | ☐ | ☐ | ☐ | 0.32 *** | −0.45 *** | 0.54 *** |
| population | 1000 persons/500 m grid | ☐ | −30.46 *** | −24.41 *** | 53.04 *** | −14.79 *** |
| road | km/1 km grid | ☐ | 7.08 *** | 7.13 *** | −3.72 *** | 17.67 *** |
| plowed field | dummy | −318.75 *** | −316.90 *** | −316.70 *** | −360.40 *** | −444.70 *** |
| high sales rate | % | 13.74 *** | 13.82 *** | 13.80 *** | 11.75 *** | 5.05 *** |
| agricultural diversification rate | % | −1.82 *** | −1.90 *** | −1.89 *** | 0.50 *** | −0.65 *** |
| vegetable farmer rate | % | −0.50 *** | −0.71 *** | −0.70 *** | −0.94 *** | −1.66 *** |
| fruit farmer rate | % | 0.41 *** | 0.37 *** | 0.38 *** | −1.35 *** | 2.69 *** |
| flower farmer rate | % | −2.76 *** | −2.97 *** | −2.96 *** | −4.97 *** | −4.64 *** |
| R square | ☐ | 0.08 | 0.08 | 0.08 | 0.10 | 0.09 |
Note: * p < 0.1; ** p < 0.05; *** p < 0.01. Ordinary least squares (OLS) estimation used robust standard errors (HC3). “Sprawl index” and “distance” were centered to apply the interaction term; thus, the mean value of each variable was 0.
Table 5.
Descriptive statistics of agricultural communities.
| Abbreviation | Unit | Tokyo Metro Area | Osaka Metro Area | ||||
|---|---|---|---|---|---|---|---|
| Mean | SD | Mean | SD | ||||
| diversified farms rate | DFR | % | 25.08 | 21.47 | 23.29 | 18.46 | |
| environmentally friendly farms rate | EFFR | % | 30.63 | 20.81 | 29.80 | 20.34 | |
| direct marketing | DM | persons | 3.57 | 5.92 | 3.30 | 3.35 | |
| breakdown | farmers gate | FG | persons | 1.34 | 3.89 | 0.59 | 1.22 |
| farmers market | FM | persons | 1.39 | 2.29 | 1.18 | 1.78 | |
| farming experience | FE | persons | 0.11 | 0.43 | 0.08 | 0.34 | |
| agritourism | AT | persons | 0.15 | 0.63 | 0.07 | 0.43 | |
| environmentally friendly practice | EFP | persons | 4.67 | 5.90 | 4.62 | 4.48 | |
| breakdown | manure management | MM | persons | 2.48 | 3.53 | 2.54 | 2.87 |
| pesticides | PS | persons | 3.65 | 4.78 | 3.48 | 3.51 | |
| chemical fertilizer | CF | persons | 2.31 | 3.98 | 2.22 | 3.04 | |
| high sales rate | HSR | % | 15.38 | 19.19 | 6.34 | 11.37 | |
| large farm rate | LFR | % | 16.80 | 18.14 | 6.90 | 9.74 | |
| plowed field | PF | dummy | 0.59 | 0.30 | 0.29 | 0.21 | |
| agricultural diversification rate | ADR | % | 4.47 | 7.74 | 4.37 | 7.42 | |
| vegetable farmer rate | VFR | % | 25.12 | 29.12 | 13.00 | 21.88 | |
| fruit farmer rate | FFR | % | 6.61 | 16.24 | 3.07 | 12.07 | |
| flower farmer rate | FLFR | % | 4.32 | 11.11 | 1.74 | 7.92 | |
Source: Ministry of Agriculture, Forestry, and Fisheries. Note: Diversified farms included farms with enterprises such as food processing, direct marketing, farming experience, agritourism, farm-inn, restaurant, export, and others. This study showed the number of farms with direct marketing, farming experience, and agritourism, which are thought to be deeply related to urbanization.
Table 6.
Effects of urban sprawl and distance from DID on urban agricultural activities in the Tokyo metro area.
Table 6.
Effects of urban sprawl and distance from DID on urban agricultural activities in the Tokyo metro area.
| Variables | DFR | EFFR | No. Farmers | ||||||||
|---|---|---|---|---|---|---|---|---|---|---|---|
| DM | Breakdown | FE | AT | EFP | Breakdown | ||||||
| FG | FM | MM | PS | CF | |||||||
| intercept | 11.116 *** | 17.821 *** | 0.502 *** | −1.389 *** | −0.639 *** | −4.408 *** | −3.666 *** | 0.747 *** | −0.688 *** | 0.615 *** | 0.062 ** |
| urban sprawl index | −0.433 *** | −0.112 | −0.050 *** | −0.037 *** | −0.056 *** | −0.106 *** | −0.078 *** | −0.038 *** | −0.047 *** | −0.033 *** | −0.034 *** |
| distance | −0.302 *** | −0.315 *** | −0.049 *** | −0.078 *** | −0.039 *** | −0.152 *** | −0.011 | −0.021 *** | −0.009 *** | −0.023 *** | −0.015 *** |
| Urban sprawl index*distance | −0.044 *** | 0.000 | −0.003 *** | −0.003 ** | −0.003 *** | −0.011 * | −0.002 | 0.000 | −0.001 | 0.001 | 0.000 |
| population | 7.299 *** | 2.265 *** | 0.174 *** | 0.151 *** | −0.009 | 0.274 *** | 0.254 *** | 0.121 *** | 0.145 *** | 0.130 *** | 0.152 *** |
| road | 0.597 *** | 0.278 *** | 0.028 *** | 0.051 *** | 0.012 *** | 0.044 *** | 0.018 ** | 0.017 *** | 0.024 *** | 0.019 *** | 0.014 *** |
| HSR | −0.063 *** | 0.110 *** | 0.000 | 0.006 *** | −0.003 *** | −0.004 * | 0.005 ** | 0.005 *** | 0.009 *** | 0.004 *** | 0.007 *** |
| LFR | −0.068 *** | 0.097 *** | −0.002 *** | 0.000 | −0.001 | 0.001 | −0.006 ** | 0.007 *** | 0.008 *** | 0.006 *** | 0.008 *** |
| PF | −0.647 | −4.521 *** | −0.103 ** | 0.074 | 0.334 *** | 1.052 *** | 0.755 *** | −0.146 *** | 0.295 *** | −0.306 *** | −0.254 *** |
| ADR | 0.401 *** | 0.137 *** | 0.015 *** | 0.014 *** | 0.023 *** | 0.019 *** | 0.022 *** | 0.008 *** | 0.014 *** | 0.007 *** | 0.007 *** |
| VFR | 0.105 *** | 0.254 *** | 0.007 *** | 0.010 *** | 0.012 *** | 0.009 *** | 0.010 *** | 0.010 *** | 0.014 *** | 0.010 *** | 0.011 *** |
| FFR | 0.409 *** | 0.242 *** | 0.015 *** | 0.025 *** | 0.011 *** | 0.012 *** | 0.029 *** | 0.011 *** | 0.012 *** | 0.012 *** | 0.013 *** |
| FLFR | 0.057 ** | 0.022 | 0.007 *** | 0.01 *** | 0.013 *** | 0.011 *** | 0.014 *** | 0.006 *** | 0.010 *** | 0.004 *** | 0.004 *** |
| R square | 0.3875 | 0.2472 | ☐ | ☐ | ☐ | ☐ | ☐ | ☐ | ☐ | ☐ | ☐ |
| Akaike’s Information Criterion (AIC) | ☐ | 37,453 | 21,344 | 22,625 | 3998 | 5313 | 40,302 | 27,925 | 35,891 | 29,276 | |
Note: * p < 0.1; ** p < 0.05; *** p < 0.01. The OLS was applied only to “diversified farms rate” and “environmentally friendly farms rate”, and Poisson regression was applied to other dependent variables. The coefficients of Poisson regression should be recalculated by an exponential function, to indicate the incident rate for every unit increase in each independent variable.
Table 7.
Effects of urban sprawl and distance from DID on urban agricultural activities in the Osaka metro area.
Table 7.
Effects of urban sprawl and distance from DID on urban agricultural activities in the Osaka metro area.
| Variables | DFR | EFFR | Number of Farmers | ||||||||
|---|---|---|---|---|---|---|---|---|---|---|---|
| DM | Breakdown | FE | AT | EFP | Breakdown | ||||||
| FG | FM | MM | PS | CF | |||||||
| intercept | 16.100 *** | 23.070 *** | 0.935 *** | −1.224 *** | −0.324 *** | −3.563 *** | −3.747 *** | 1.359 *** | 0.490 *** | 1.046 *** | 0.663 *** |
| urban sprawl index | −0.154 | −0.160 *** | −0.038 *** | −0.048 *** | −0.049 *** | −0.167 *** | −0.079 *** | −0.037 *** | −0.050 *** | −0.033 *** | −0.034 *** |
| distance | −0.451 *** | 0.252 *** | −0.031 *** | −0.022 *** | −0.03 *** | −0.140 *** | −0.047 *** | 0.001 | 0.011 *** | −0.010 *** | −0.011 *** |
| urban sprawl index*distance | −0.028 * | 0.020 | 0.001 ** | 0.003 ** | −0.001 | −0.008 | −0.001 | 0.004 *** | 0.003 *** | 0.004 *** | 0.004 *** |
| population | 2.021 * | 2.373 * | −0.008 | 0.306 *** | −0.134 ** | 0.263 * | −0.334 | 0.004 | 0.023 | 0.052 | −0.018 |
| road | −0.082 | 0.041 | 0.015 *** | 0.025 *** | 0.004 | 0.045 *** | 0.055 *** | 0.018 *** | 0.016 *** | 0.017 *** | 0.018 *** |
| HSR | −0.083 ** | 0.185 *** | −0.001 | 0.000 | −0.001 | 0.006 | 0.005 | 0.008 *** | 0.010 *** | 0.008 *** | 0.009 *** |
| LFR | 0.123 *** | 0.216 *** | 0.001 | 0.009 *** | 0.003 * | 0.003 | 0.027 *** | 0.004 *** | 0.003 ** | 0.005 *** | 0.008 *** |
| PF | 9.239 *** | −0.224 | 0.034 | 0.092 | 0.175 ** | −0.125 | −0.345 | −0.464 *** | −0.640 *** | −0.241 *** | −0.118 ** |
| ADR | 0.490 *** | 0.204 *** | 0.018 *** | 0.02 *** | 0.032 *** | 0.019 *** | 0.024 *** | 0.004 *** | 0.008 *** | 0.006 *** | 0.005 *** |
| VFR | 0.047 *** | 0.159 *** | 0.002 *** | 0.006 *** | 0.010 *** | 0.009 *** | 0.006 * | 0.007 *** | 0.014 *** | 0.004 *** | 0.005 *** |
| FFR | 0.292 *** | 0.194 *** | 0.009 *** | 0.024 *** | 0.014 *** | 0.008 ** | 0.039 *** | 0.007 *** | 0.007 *** | 0.006 *** | 0.005 *** |
| FLFR | 0.012 | −0.129 *** | 0.000 | −0.001 | 0.01 *** | 0.016 *** | 0.014 ** | −0.003 *** | −0.002 | −0.005 *** | −0.005 *** |
| R square | 0.1398 | 0.1000 | ☐ | ☐ | ☐ | ☐ | ☐ | ☐ | ☐ | ☐ | ☐ |
| AIC | ☐ | 22,420 | 9033.6 | 13,539 | 2413 | 2072.6 | 26,403 | 19,236 | 23,132 | 20,313 | |
Note: * p < 0.1; ** p < 0.05; *** p < 0.01. The OLS was applied only to “diversified farms rate” and “environmentally friendly farms rate”, and the Poisson regression was applied to other dependent variables. The coefficients of Poisson regression should be recalculated by an exponential function, to indicate the incident rate for every unit increase in each independent variable.
© 2020 by the author. Licensee MDPI, Basel, Switzerland. This article is an open access article distributed under the terms and conditions of the Creative Commons Attribution (CC BY) license (http://creativecommons.org/licenses/by/4.0/).
Share and Cite
MDPI and ACS Style
Yoshida, S. Effects of Urbanization on Farmland Size and Diversified Farm Activities in Japan: An Analysis Based on the Land Parcel Database. Land 2020, 9, 315. https://0-doi-org.brum.beds.ac.uk/10.3390/land9090315
AMA Style
Yoshida S. Effects of Urbanization on Farmland Size and Diversified Farm Activities in Japan: An Analysis Based on the Land Parcel Database. Land. 2020; 9(9):315. https://0-doi-org.brum.beds.ac.uk/10.3390/land9090315
Chicago/Turabian StyleYoshida, Shingo. 2020. "Effects of Urbanization on Farmland Size and Diversified Farm Activities in Japan: An Analysis Based on the Land Parcel Database" Land 9, no. 9: 315. https://0-doi-org.brum.beds.ac.uk/10.3390/land9090315
Note that from the first issue of 2016, this journal uses article numbers instead of page numbers. See further details here.