The Contributions of Crosslinguistic Influence and Individual Differences to Nonnative Speech Perception


1
Department of Linguistics, Boston University, Boston, MA 02215, USA
2
Department of Korean Language and Literature, Pukyong National University, Busan 48513, Korea
*
Author to whom correspondence should be addressed.
Languages 2020, 5(4), 49; https://0-doi-org.brum.beds.ac.uk/10.3390/languages5040049
Submission received: 1 September 2020
/
Revised: 29 October 2020
/
Accepted: 29 October 2020
/
Published: 31 October 2020
(This article belongs to the Special Issue Exploring Cross-linguistic Effects and Phonetic Interactions in the Context of Bilingualism)
Abstract
:Perception of a nonnative language (L2) is known to be affected by crosslinguistic transfer from a listener’s native language (L1), but the relative importance of L1 transfer vis-a-vis individual learner differences remains unclear. This study explored the hypothesis that the nature of L1 transfer changes as learners gain experience with the L2, such that individual differences are more influential at earlier stages of learning and L1 transfer is more influential at later stages of learning. To test this hypothesis, novice L2 learners of Korean from diverse L1 backgrounds were examined in a pretest-posttest design with respect to their perceptual acquisition of novel L2 consonant contrasts (the three-way Korean laryngeal contrast among lenis, fortis, and aspirated plosives) and vowel contrasts (/o/-/ʌ/, /u/-/ɨ/). Whereas pretest performance showed little evidence of L1 effects, posttest performance showed significant L1 transfer. Furthermore, pretest performance did not predict posttest performance. These findings support the view that L1 knowledge influences L2 perception dynamically, according to the amount of L2 knowledge available to learners at that time. That is, both individual differences and L1 knowledge play a role in L2 perception, but to different degrees over the course of L2 development.
1. Introduction
Whereas infants are described as “citizens of the world” (Werker and Tees 1984) when it comes to perceiving the sounds of a nonnative language (L2), adults are known to be comparatively poor at L2 speech perception. This disparity follows from a process of perceptual specialization for the native language (L1), which begins well before the end of the first year of life and results in an apparent decline in perception of L2 sound contrasts (Kuhl et al. 1992; Polka and Werker 1994; Werker and Pegg 1992). Although the characterization of this process varies throughout the literature, in recent years researchers have converged upon the view that specialization for the L1 does not involve loss of perceptual ability per se, but rather shifts in attention, which may be attributed to lexical and/or phonemic development (Werker 1994, 1995; Werker and Curtin 2005) or to the impetus for perceptual routines to be automatic and robust to adverse conditions (Strange 2011).
Under the view that mature L1 speakers maintain access to the perceptual and cognitive abilities undergirding L1 phonological development (e.g., Flege 1995), it becomes relevant to ask how, in L2 learning, these underlying abilities interact with the consequences of L1 specialization, especially in light of individual variation in these abilities. That is, how are the processes and outcomes of L2 acquisition affected by language-specific properties of a learner’s L1 vs. the personally-specific abilities of the learner? The effect of the L1 has been discussed extensively in terms of transfer or crosslinguistic influence (CLI) of aspects of L1 knowledge and/or experience (Major 2008; Odlin 1989) and plays a central role in theories of L2 speech learning (see Section 1.1). However, the effect of the learner (i.e., individual differences among speakers who may share the same L1; Dörnyei 2006), long a focus of research in the interdisciplinary field of second language acquisition (SLA), has only recently begun to be considered systematically in the study of L2 perceptual learning (see Section 1.2).
The study reported in this article is an attempt to explore the interaction of L1 transfer and individual differences in L2 perceptual learning of Korean phonological contrasts. In what follows, we review the literature on transfer and individual differences in L2 learning, describe the target Korean contrasts (the three-way laryngeal contrast among lenis, fortis, and aspirated voiceless stops and two vowel contrasts between rounded and unrounded back vowels), and motivate a Transfer Ramp-up Hypothesis predicting a delayed onset of L1 transfer effects in L2 perceptual development.
1.1. Crosslinguistic Influence in Speech Learning
That L2 speech learning may be influenced by previously acquired linguistic knowledge is well-established in the field of L2 speech and in SLA more broadly. Major theories of nonnative speech perception, such as the Perceptual Assimilation Model (PAM; Best 1994, 1995) and its extension to L2 learners, PAM-L2 (Best and Tyler 2007), the Native Language Magnet theory (NLM; Kuhl and Iverson 1995; Kuhl et al. 1992, 2008), the Speech Learning Model (SLM; Flege 1995), and the Automatic Selective Perception framework (ASP; Strange 2011), all incorporate a role for a listener’s L1, although they vary in terms of how L1 influence is conceptualized. For example, NLM emphasizes the role of developing L1 category prototypes, whereas PAM(-L2) focuses on the ways in which L2 contrasts may be perceptually assimilated to L1 contrasts, which have consequences for both discrimination and identification of L2 sounds (e.g., Tyler et al. 2014).
Despite their differences, these theories of nonnative speech perception are similar in providing an account for ostensibly negative effects of L1 development in perception of an L2. Although L1 experience is not always a handicap in L2 perception (Bohn and Best 2012; Chang 2016, 2018), it often appears that listeners with an already-developed L1 are at a disadvantage compared to listeners who are less far along in L1 development. For example, English-speaking adults were found to discriminate contrasts of Thompson Salish poorly compared to English-learning infants (Werker and Tees 1984). Such disparities have been interpreted in terms of a decline in sensitivity to nonnative contrasts during L1 development (e.g., Kuhl et al. 1992; Werker and Pegg 1992). It remains unclear, however, whether the disadvantage for adult listeners in L2 perception has to do with reduced phonetic sensitivity or “negative transfer” of L1 structures such as phonological categories (or both).
Indeed, a fundamental component of many theories of L2 speech is the misleading influence of L1 categories. For example, the SLM posits that the most difficult L2 sounds to acquire accurately in the long term are not “new” sounds, but rather “similar” sounds, which resemble the sounds of the L1. This is because a “similar” sound, unlike a “new” sound, gets perceptually linked with an L1 sound, which inhibits the formation of a distinct representation for the L2 sound. According to the SLM, L1 influence (in the form of crosslinguistic perceptual linkage) takes place at the level of the position-specific allophone, but there is reason to believe that the phoneme, rather than the allophone, may be the structure most liable to exert L1 influence. In particular, some findings suggest that access to L1 allophones, which are typically below the level of speaker consciousness, may depend on factors such as the level of acquisition and the type of orthography (Bergier 2014; Eckman et al. 2001; Vokic 2010).
Besides formalizing the influence of L1 categories, theories such as the SLM also posit that “mechanisms and processes used in learning the L1 sound system… remain intact over the life span, and can be applied to L2 learning” (Flege 1995, p. 239), suggesting that the basic perceptual abilities supporting L1 acquisition are maintained in adulthood. This view is consistent with findings showing little effect of L1 specialization in certain perceptual tasks with nonnative speech. For instance, although [s] and [ʃ] are phonemic in English and allophonic in Dutch, L1 Dutch adults were just as good as L1 English adults at discriminating the two sounds in English nonce items; however, L1 Dutch adults also rated the sounds as more similar than did L1 English adults (Johnson and Babel 2010). This type of result is at odds with the view that adult listeners necessarily have reduced sensitivity to L2 contrasts, and further suggests that any effect of the L1 sound system is closely related to task type (in particular, the levels of processing tapped by the task; cf. Díaz et al. 2012).
If adults are capable of perceiving nonnative contrasts, this still leaves the question of why they tend to perform worse than infants in L2 perception. Strange’s (2011) ASP framework addresses this question with the construct of selective perception routines (SPRs). According to ASP, L1 acquisition involves developing SPRs specialized for the target L1. These SPRs are selective in the sense that they target only those acoustic cues that are relevant for distinguishing L1 phonemes, which allows L1 perception to become automatic and robust in adverse conditions. Crucially, a language-universal mode of perception never disappears, but high task demands may block access to this mode, encouraging instead a default to L1 SPRs. In ASP, then, what distinguishes adult and infant listeners is not reduced sensitivity, but shifted attention. As in L1 acquisition, ASP posits that L2 learning involves developing SPRs that weight and direct attention to cues in a manner specialized for the target L2. This implies that L2 learning generally leads to a (positive) change in L2 perception, which has indeed been found (e.g., Kilman et al. 2014; Levy and Strange 2008; cf. Holliday 2016).
Insofar as better L2 perception reflects less L1 transfer, the finding of higher L2 perceptual accuracy in more advanced learners supports the view that L1 transfer decreases over the course of L2 learning. This view is at the heart of a different theory of L2 phonological development, the Ontogeny Phylogeny Model (OPM; Major 2001). OPM differs from other theories of L2 speech in addressing the time course of all three factors that play a role in general SLA theories: L1, L2, and universal components (cf. Universal Grammar; White 2003). The central claim is that, within a learner’s developing L2 system, L1 components decrease over time, while L2 components increase; meanwhile, universal components show an inverse U-shaped pattern, first increasing and then decreasing. This theory also formalizes aspects of intra-speaker variation by describing the influence of style/register, crosslinguistic similarity, and markedness. However, inter-speaker variation is not addressed in this model (or in the others discussed above), and is the subject of a different literature.
1.2. Individual Differences in Speech Learning
Interest in individual differences (IDs) has existed for decades, going back to the 1970s when SLA researchers started examining the predictive power of various personally-specific properties of the learner (for reviews, see Dörnyei 2006; Dörnyei and Skehan 2003). These include (foreign) language (learning) aptitude, general intelligence or cognitive ability (for a recent review, see Bowles et al. 2016), personality (e.g., Dewaele and Furnham 2000; Verhoeven and Vermeer 2002), and musicality (e.g., Milovanov et al. 2008, 2010), all of which are understood to be complex constructs consisting of several subconstructs (e.g., Robinson 2001). For example, language aptitude may consist of variables such as phonemic coding ability, grammatical sensitivity, inductive learning ability, and rote learning ability. Based on Carroll (1981), Skehan (1989, 1991, 1998, 2002) attempted to explain three abilities (namely, auditory, linguistic, and memory-based), while others (e.g., Jilka et al. 2008) have conceptualized of IDs in terms of a “talent” dimension.
In regard to L2 perception specifically, IDs may reflect a construct that has been called phonetic sensitivity in the L2 speech literature (e.g., Kwon 2013; Munro 2008). Note that it is phonetic, as opposed to psychoacoustic, sensitivity that is of interest here due to the neurolinguistic evidence of a “speech-specific origin of individual variability in L2 phonetic mastery” (Díaz et al. 2008, p. 16083). According to Piske (2008), phonetic sensitivity can be distinguished from phonetic or phonological awareness in not necessarily referring to a conscious level of speech processing, and we use this term in a similar sense, to refer generally to sensitivity to properties of the speech signal that may serve to cue a linguistic contrast (regardless of whether or not the contrast exists in the listener’s L1). Under the view that the ability to perceive nonnative contrasts does not go away during L1 development, but may be masked by attentional shifts associated with L1 specialization, it becomes relevant to ask whether IDs in L2 perceptual learning can be traced to variation in learners’ (remaining) phonetic sensitivity to nonnative contrasts. That is, might the degree of (non)commitment to perceptual cues relevant for the L1 constitute an “aptitude” for L2 perceptual learning? If not, then what does?
These questions have begun to be explored in a number of studies examining IDs in L2 perception and/or production. For example, research on L1 English speakers trained on Mandarin tonal contrasts found that IDs in learning outcomes were related to learners’ pre-training inclination to attend to the most informative cue for Mandarin tones (i.e., pitch direction) as well as to the interaction between their basic pitch perception abilities and the type of training they underwent (Chandrasekaran et al. 2010; Perrachione et al. 2011). Effects of preexisting variation in cue weighting, which can be arbitrary (i.e., not determined by cue informativeness; Idemaru et al. 2012), were also observed in L1 Spanish learners of Dutch and L1 Korean learners of English (Wanrooij et al. 2013; Schertz et al. 2016); however, IDs in L2 perception were not predicted by learners’ cue use in L2 production (Schertz et al. 2015). Other studies have linked IDs to variation in compactness and location of L1 categories (Kartushina and Frauenfelder 2013, 2014), self-perception of one’s own L2 speech (Baker and Trofimovich 2006), formation and structure of L2 representations (Golestani and Zatorre 2009; Hattori and Iverson 2009), L2 mispronunciation detection (Hanulíková et al. 2012), L2 working memory (Darcy et al. 2015), and different neural correlates (Raizada et al. 2010; Sebastián-Gallés et al. 2012; for a recent review, see Myers 2014).
Some of the work on IDs has focused on the specific target language in the present study—Korean. As reported for learners of other L2s, learners of Korean were found to evince wide variation in L2 perception, both in discrimination of L2 contrasts prior to extensive L2 exposure as well as in identification of L2 categories following weeks of L2 learning; however, pre-learning performance (i.e., phonetic sensitivity to the target L2 contrasts) showed no, or only a weak, correlation with post-learning performance (Jung and Kwon 2010; Kwon 2013). Notably, these results were found with learners representing two or more L1 backgrounds, including typologically diverse and genetically unrelated language families (e.g., Austronesian, Finno-Ugric, Indo-European, Sino-Tibetan). The majority of the data on Korean L2 speech, however, comes from studies focusing on L1 speakers of English and/or Mandarin (e.g., Chang 2010, 2012; Holliday 2014, 2015; Schmidt 2007). These studies show, on the one hand, many dominant patterns of response in perceptual tasks such as crosslinguistic classification (e.g., L1 Mandarin learners tended to classify Korean lenis and aspirated stops as the same Mandarin category) yet, on the other hand, substantial IDs, especially in production (e.g., L1 English learners produced Korean stop contrasts in eight different ways). In the present study, we investigate the interaction of IDs with L1 transfer, focusing on Korean as the target L2. Next, we consider the specific target contrasts, each of which may pose difficulty for L2 learners.
1.3. Korean Phonological Contrasts
1.3.1. Stop Laryngeal Contrasts in Korean
Korean is known for a typologically rare laryngeal contrast among three series of voiceless stops: lenis, fortis, and aspirated. This three-way laryngeal contrast occurs at four places of articulation in all (bilabial, denti-alveolar, and velar stops, as well as alveolo-palatal affricates) and has been described in terms of several different acoustic dimensions, including voice onset time (VOT), closure duration, and properties of the following vowel such as onset fundamental frequency (f0), voice quality, vowel duration, intensity buildup, and formant trajectories (Cho et al. 2002; Kagaya 1974; Park 2002a, 2002b; for a recent review, see Chang 2013).
The most widely-studied acoustic cues to the stop laryngeal contrasts in utterance-initial position are VOT and f0. Traditionally, fortis, lenis, and aspirated stops are described as showing, respectively, very short, medium-lag, and very long VOTs, as well as high, low, and very high onset f0 values. However, studies have noted a recent diachronic shift in the phonetic implementation of the three laryngeal categories, which is especially evident in Seoul Korean and in female speakers (Kang 2014; Oh 2011; Silva 2006a, 2006b). In particular, the VOT of lenis stops has lengthened while that of aspirated stops has shortened, leading to highly overlapping VOT distributions; these developments have resulted in an increased role of f0 in realizing the lenis-aspirated contrast. Nevertheless, it is clear from other varieties of Korean as well as data from relatively careful speech that no two of the laryngeal categories have fully merged in VOT, such that there is still something resembling a tripartite VOT contrast in Korean. For example, VOTs of the female model talker in the Korean textbook used by participants in the current study (see Section 2.2) were distinct among the three stop series, as shown in Table 1 (see also the data on native Korean teachers in Chang 2010, 2012).
Thus, regardless of the degree to which lenis and aspirated stops overlap in VOT for individual speakers, it is reasonable to posit that the role of VOT in distinguishing three laryngeal categories in Korean may place a higher burden on this cue in Korean than in languages with a two-way laryngeal contrast (e.g., voiced-voiceless), by far the most common type of spoken language (Maddieson 1984). L2 learners of Korean, likely to have been exposed only to a two-way VOT opposition in their L1, may therefore experience difficulty in acquiring Korean stop laryngeal contrasts, making this set of contrasts useful to examine in a study of L2 perceptual learning.
1.3.2. Vowel Contrasts in Korean
The vowel inventory of modern Korean as spoken in South Korea contains, for most speakers alive today, the monophthongs /i ɛ a u ɨ o ʌ/. A former length contrast has largely disappeared, leaving only short vowels in contemporary varieties (Kim-Renaud 2012). Older descriptions of Korean (e.g., Lee 1993; Sohn 1999; Yang 1992) also include the vowels /e y ø/; however, these vowels are no longer present in the inventory as distinct monophthongs for most speakers. The front rounded vowels have developed into diphthongs (i.e., /ɥi/, /wɛ/; see, e.g., Kim-Renaud 2012), while the former contrast between /e/ and /ɛ/ has merged to one mid front vowel phoneme (Ko 2009; Eychenne and Jang 2015, 2018). Thus, apart from several diphthongs (/ɥi wɛ wa wʌ jɛ ja ju jo jʌ ɨi/), modern Korean has a vowel space consisting of seven basic vowel qualities (Chang 2012; Yoon and Kang 2014).
Of interest in the current study are two vowel contrasts that depart from the typologically most common five-vowel inventory of /i e a o u/ (Maddieson 1984)—that between the high back (i.e., non-front) vowels /u/ and /ɨ/ and that between the mid back vowels /o/ and /ʌ/. These contrasts can be described in terms of a difference in phonological labiality or roundedness, as only the former vowel in each pair alternates with labial stops in certain “p-irregular” verbal paradigms and is prohibited from occurring with the rounded on-glide /w/ in diphthongs (Kim-Renaud 1974, 2012; Sohn 1999). Phonetically, however, the two contrasts are realized differently. Whereas /u/ and /ɨ/ differ primarily in terms of the second formant (F2) and less so in terms of the first (F1) or third formant (F3), /o/ and /ʌ/ show substantial differences in both F1 and F2 (Table 2; cf. similar data in Chang 2012; Yang 1992; Yoon and Kang 2014; Yoon and Kim 2015).
In short, the two Korean contrasts /u/-/ɨ/ and /o/-/ʌ/, as relatively marked vowel contrasts, may pose a challenge for L2 learners, who may or may not have been exposed to similar contrasts in their L1. Both are therefore examined as target contrasts in the current study.
1.4. The Present Study
Given the scarcity of L2 speech research examining the roles of the L1 and IDs in tandem, we conducted a study of L2 perceptual learning of Korean with two goals: (1) examining how L1 transfer and IDs in phonetic sensitivity interact during L2 development, and (2) contributing empirical data on L2 acquisition of Korean, still an underinvestigated L2 despite its increasing popularity as a foreign language worldwide (Byon 2008; Byon and Pyun 2012; Gordon 2015).
With regard to the interaction of transfer with IDs, we hypothesized that L1 transfer in L2 perception would, over time, show an inverse U-shaped pattern instead of a more simple decline. Because the crucial difference between this hypothesis and previous models of L2 learning is in its description of the initial portion of L2 development as showing an increase (as opposed to decrease) in L1 transfer, we call this the Transfer Ramp-up Hypothesis. Note that this hypothesis does not differ from previous models (e.g., OPM; see Section 1.1) in predicting a decline in L1 transfer. Rather, the claim is that the timing of this decline—and, by implication, of L1 transfer effects to begin with—incorporates a delay. That is, the influence of the L1 takes time to “ramp up”, peaking at an intermediate, if still early, point in L2 development (see Figure 1).1 Weak L1 influence at L2 onset thus allows certain non-L1 factors, such as IDs in phonetic sensitivity, to play a greater role earlier (i.e., in the pre-ramp-up stage) than later in L2 development.
Since the Transfer Ramp-up Hypothesis contradicts several models of L2 learning in positing that L1 transfer does not peak at L2 onset, it is worth explaining the motivation for this hypothesis in more detail. In short, this view follows from two principles alluded to above. The first is that language users maintain access to the perceptual resources that supported acquisition of their L1; the second is that the nature of L2 perception changes with L2 experience. Together, these principles set the stage for L2 perception ab initio, at which point nothing is yet known about the L2, to involve postponing L1 transfer in favor of a language-universal mode of perception. However, the development of a phonological framework for the L2 during L2 learning eventually provides a linguistic basis for mapping L2 speech to the L1, thus encouraging transfer at later stages of learning.
Following from the Transfer Ramp-up Hypothesis, two predictions were tested in the present study. In regard to ab initio perception of the L2, it was predicted that there would be no significant effect of learners’ L1 background in a perceptual task not requiring knowledge of L2 phonological categories (P1). That is, performance in such a task was expected to reflect primarily IDs in phonetic sensitivity; therefore, taking ID dimensions as intrinsic properties of the learner, we expected to find a wide range in performance for learners of all L1 backgrounds, and little to no predictive value of linguistically relevant dimensions of a learner’s L1. On the other hand, in regard to L2 perception after L2 learning, it was predicted that there would be a significant effect of L1 background, at least in a perceptual task drawing upon knowledge of L2 categories (P2).
Although these predictions were general, and thus applied both to stop and to vowel perception, the linguistically relevant dimensions of a learner’s L1 were different for stops and vowels. In the case of stops, the centrality of VOT in distinguishing Korean stop laryngeal categories led us to focus on the number and type of VOT oppositions as the linguistically relevant dimension of the L1. In particular, given that Korean laryngeal categories are all characterized by positive VOTs, we predicted that L1s with VOT oppositions on the positive side of the VOT space (e.g., short- vs. long-lag) would lead to the most beneficial transfer. In the case of vowels, we focused on the occurrence of the target L2 contrasts as the linguistically relevant dimension of the L1 (as a proxy for helpful acoustic oppositions in the back portion of the vowel space), predicting that L1s with one or both of the target contrasts would result in more beneficial transfer than L1s containing neither contrast.
Because this is one of the first studies to examine L2 perceptual learning of Korean by learners from multiple L1 backgrounds, we endeavored to broaden the empirical contribution, as well as the generalizability of the results, by adopting an inclusive approach to the research. As such, we admitted into the study all learners who were eligible rather than targeting a few specific L1 backgrounds. The resulting diversity of L1 backgrounds, some of which are represented by only one participant, naturally presents a challenge for examining the effects of L1 background; we address this by using a group-based analysis, as described in the next section.
2. Methods
The study received ethical approval from the Institutional Review Board (Pukyong National University) under approval code 1041386-202008-HR-47-02. To determine the number of participants to recruit for the study, we carried out a power analysis anticipating multiple regression models with up to eight coefficients apart from the intercept (accounting for group and category predictors consisting of up to three levels, along with interaction coefficients) and assuming 80% power, an alpha level of 0.05, and a model r2 of 0.24 (based on exploratory modeling of pilot data). Using pwr.f2.test() in the pwr package (Champely 2018) in R (R Development Core Team 2020), we determined the target number of participants to be approximately 56, so we recruited participants until we reached a final sample of at least 56 participants.
2.1. Participants and Groups
A total of 59 adult L2 learners of Korean participated in the study, with two excluded from analysis due to failure to complete the study or outlier performance (i.e., lower than 10% accuracy) in the posttest portion (see Section 2.4.2). The 57 participants in the final analysis (43 female; Mage = 21.5 yr, SD 4.5) came from 10 L1 backgrounds: North American and British English (n = 22), Mandarin Chinese (n = 14), Finnish (n = 5), Swedish (n = 5), Slovenian (n = 3), Castilian Spanish (n = 2), European French (n = 2), European Portuguese (n = 2), Malay (n = 1), and Turkish (n = 1). They were sorted into groups according to crucial features of their L1 hypothesized to influence perception of the target L2 contrasts—namely, type of VOT contrast and type of vowel inventory.
For the stop study, learners were assigned to one of three groups based on the VOT opposition in their L1 stops: lead-short (e.g., [b]-[p]), short-long (e.g., [p]-[ph]), or lead-long (e.g., [b]-[ph]). The lead-short group included the L1 speakers of Finnish, French, Malay, Portuguese, Slovenian, and Spanish; the short-long group, English and Mandarin; and the lead-long group, Swedish and Turkish. Using the VOT ranges in Keating (1984), the group classifications were made on the basis of published descriptions of the respective L1s, which suggest that the L1s in the lead-short, short-long, and lead-long groups contrast, respectively, lead (i.e., negative) vs. short-lag VOT (Cruz-Ferreira 1995; Fougeron and Smith 1993; Herrity 2000; Martínez-Celdrán et al. 2003; Shahidi and Aman 2011; Suomi et al. 2008), short- vs. long-lag VOT (Duanmu 2007; Labov et al. 2006; Ladefoged 1999; Roach 2004), and lead vs. long-lag VOT (Helgason and Ringen 2008; Öğüt et al. 2006). Background data on the groups are summarized in Table 3. The groups did not differ significantly in age [|t|s < 1.7, ps > 0.05].
For the vowel study, learners were assigned to one of two groups based on whether their L1 contained none or some of the target vowel contrasts—namely, /u/-/ɨ/ and /o/-/ʌ/. The no-contrast group included the L1 speakers of Finnish, Mandarin, Spanish, and Swedish; the some-contrast group, English, French, Malay, Portuguese, Slovenian, and Turkish. As in the stop study, these group classifications were made on the basis of published descriptions of the respective L1s, which suggest that the L1s in the no-contrast group contain neither contrast (Bradlow 1995; Eklund and Traunmüller 1997; Iivonen and Harnud 2005; Lee and Zee 2003) whereas the L1s in the some-contrast group contain oppositions resembling one or both of the contrasts (Clynes and Deterding 2011; Escudero et al. 2009; Hillenbrand et al. 1995; Jurgec 2005; Kiliç et al. 2004; Strange et al. 2007). Because we relied on published descriptions and there is variation in the transcription conventions used for different languages, we took a somewhat liberal approach to looking for a given contrast; for example, for /u/-/ɨ/, we looked not only for /ɨ/ but also for /ɯ/. Table 4 summarizes the background data on the two groups in the vowel study, which did not differ significantly in age [t(55) = 1.239, p > 0.05].
Participants in all L1 groups tended to have considerable experience with additional languages, such that the majority had been exposed to a type of VOT contrast and/or vowel inventory different from that in their L1. All participants who were not L1 English speakers were also proficient in English (to a level sufficient for college coursework), and most (82%) reported knowledge of one or more other languages (e.g., Cantonese, German, Italian, Japanese, Polish, Russian, Serbo-Croatian, Tagalog, Thai). Given this self-reported multilingualism, we examined whether there were disparities in “diversifying” types of additional language (Ln) exposure across groups—which could potentially result in one group having an inherent advantage in either study—by coding participants in terms of the number of their Lns (including English) that would have provided exposure to a type of VOT contrast (or vowel inventory) different from that in their L1. Between-group comparisons on this dimension revealed no significant difference between the no-contrast and some-contrast groups in the vowel study [t(55) = 1.210, p > 0.05]; however, in the stop study, the short-long group reported significantly fewer “diversifying” Lns than the other two groups [|t|s > 3.1, ps < 0.01], while the lead-short and lead-long groups did not differ from each other in this respect [t(19) = 0.156, p > 0.05]. The disadvantage of the short-long group in terms of Ln exposure—largely due to the fact that, unlike the lead-short and lead-long groups, participants in this group did not have English to count as a “diversifying” Ln—was not, in fact, reflected in systematically lower L2 Korean performance (cf. Section 4); therefore, we assume that Ln exposure, at least operationalized in terms of number of Lns, did not have a detectable impact on the relative patterning of groups on L2 Korean.
2.2. L2 Learning Context
Participants were recruited in 2013–2014 from an international summer program at a university in Seoul, where they were enrolled in an elementary Korean course as well as other courses. The Korean course lasted five weeks and consisted of three hours of instruction per day for 3–4 days a week (18 total class meetings), amounting to a total of 54 contact hours. Consistent (≥90%) attendance was required to pass the course, and every participant received at least a passing grade, meaning that all received a similarly large amount of classroom instruction in the L2. Participants’ non-language courses were conducted in English. Furthermore, students in the program resided in a campus dormitory and, besides contact with Korean students in extracurricular activities, communicated with other students primarily in English. Therefore, in spite of their residence in an L2 environment, participants were not generally immersed in the L2 outside of the classroom.
Although the participants came from different Korean classes split among a team of five instructors (average class size < 15), each class used the same syllabus and teaching materials and followed the same instructional format with English as the main language of instruction. Additionally, the allotment of classroom time to content was uniform across classes, with the first 10 hours allotted to orthographic and phonemic familiarization (i.e., reading and writing of the Korean alphabet). Thus, by the end of the first week of classes, students had mostly finished the portion of the course focused on spelling and pronunciation. Nevertheless, the posttest experiment was not conducted until five weeks later (i.e., at the end of the course) so that participants would be maximally comfortable with using Korean graphemes to provide their responses in this experiment.
2.3. Materials
Stimuli in both the pretest and posttest experiments were designed to test perception of the same Korean phonological contrasts tested in Jung and Kwon (2010): the three-way stop laryngeal contrast and two vowel contrasts, /u/-/ɨ/ and /o/-/ʌ/. Thus, the stimuli included all nine stops (lenis /p t k/, fortis /p* t* k*/, aspirated /ph th kh/), which were put before /a/, and four lone vowels (/u ɨ o ʌ/).
The stimuli were prepared as follows. First, they were produced by a female native Korean speaker in a standard formal register within the carrier sentence /__-ka is*ɨpnita/ “There is (a) __”. For example, for /k/, the target syllable was /ka/, and this was uttered in the sentence /ka-ka is*ɨpnita/. The set of 13 sentences (9 target stops + 4 target vowels) was arranged in a random order and recorded three times. The recordings were made at 22.1 kHz and 16 bps, in a soundproof booth using a CSL 4500 recording device and a Shure SM48 dynamic mic.
After the sentences were recorded, they were edited in Praat (Boersma and Weenink 2013) to isolate the target syllables. Each syllable was cut out from its carrier sentence and saved in a separate file. All tokens were then inspected auditorily, and one token of each syllable was chosen for the perception stimuli (usually the second token, unless this token sounded unnatural). The resulting 13 stimuli were then randomized and submitted for perceptual evaluation to five native Korean-speaking judges to confirm their quality. The judges were asked to listen to and identify the stimuli (by transcribing them in Korean orthography), as well as rate their confidence in each identification judgment (on a 1–5 scale, 1 being “least confident” and 5 being “very confident”). The rate of correct identification was 100% and the mean confidence rating was 4.9, suggesting that the stimuli were highly intelligible, as well as comprehensible, and thus suitable for use in this study.
2.4. Procedure
Both the pretest and posttest experiments were carried out in a quiet classroom equipped similarly to the rooms for participants’ Korean classes. Participants were tested in a group, using the classroom’s audio speakers (which were mounted all around the room) and paper answer sheets. Test materials for the pretest and posttest are publicly accessible via the Open Science Framework (OSF) at https://osf.io/rkxdh/.
2.4.1. Pretest: Oddball Discrimination
The pretest experiment was conducted before the beginning of participants’ Korean course and was meant to investigate the degree to which these ab initio learners could already perceive the target sounds. Because at this point in time participants had no knowledge of Korean, an identification task was eschewed in favor of a relatively difficult discrimination task (namely, oddball discrimination) with reduced stimulus variability (i.e., only one token of each target syllable) to prevent the task from being overly difficult. Prior to beginning the experiment, participants were told that the sounds they were going to hear were Korean speech sounds (so as to preclude a nonlinguistic mode of auditory perception), and they then completed a short practice session consisting of three trials with stimuli different from the test stimuli to familiarize them with the task.
Each trial of the oddball discrimination task presented a three-item sequence of auditory stimuli to the participant, who had to indicate which (if any) of the three items was different from the other two (i.e., the oddball). For example, one trial presented the sequence /ka/-/k*a/-/k*a/, and the correct answer on this trial was /ka/ (= item #1). The items in a test sequence were separated by an inter-item interval of 700 ms, and each sequence was played twice before participants had to respond. Participants responded by circling the number on their answer sheet corresponding to the serial position of the oddball or, alternatively, one of two other options: “all same” (if no item was different from the other two) and “all different” (if every item was unique). The inter-trial interval was 5 s. Trials were ordered randomly but blocked by contrast type, such that all trials testing laryngeal contrasts were presented before trials testing vowel contrasts. For each of the nine laryngeal contrasts and two vowel contrasts, two test sequences were included (e.g., /p*a/-/pha/-/p*a/ and /pha/-/pha/-/p*a/ for the /p*/-/ph/ contrast), with the position of the oddball distributed across the three possibilities in a ratio of 1:2:2.5. Each test sequence was iterated twice, for a total of 44 trials (11 target contrasts × 2 test sequences × 2 repetitions).
To check that the pretest was in fact reliable, we calculated split-half reliability by randomly dividing the dataset from the pretest into two subsets according to contrast type (i.e., each subset containing half of the items, randomly selected, for each of the five contrast types: lenis vs. fortis, lenis vs. aspirated, fortis vs. aspirated, /o/ vs. /ʌ/, /u/ vs. /ɨ/). This calculation suggested that the pretest had good reliability (Cronbach’s α = 0.82).
2.4.2. Posttest: Forced-Choice Identification
The posttest experiment was conducted at the end of the Korean course and was meant to examine participants’ (relative) degree of success in perceptually acquiring the target Korean sounds. By this point, participants had spent a considerable amount of time learning Korean, including the alphabet, so it was assumed they were familiar enough with its phonological categories and alphabet to perform an orthographic labeling task. Therefore, in contrast to the pretest, the posttest experiment used the identification paradigm to provide a measure more closely reflecting the task of real-world speech perception. Consequently, it should be noted that absolute accuracy levels in the pretest and posttest cannot be directly compared to each other; however, such a comparison is not needed to address our research questions, which concern relative levels of performance across L1 backgrounds rather than absolute accuracy. Prior to beginning this experiment, participants were once again told that they were going to hear Korean speech sounds, and then they completed a short practice session consisting of three trials using stimuli different from the test stimuli to familiarize them with the task.
The identification task was a ten-alternative forced-choice (10AFC) task for trials testing stops and a six-alternative forced-choice (6AFC) task for trials testing vowels. The response options for stop trials were /pa p*a pha ta t*a tha ka k*a kha/ and the distractor option “other”. The response options for vowel trials were /u ɨ o ʌ/ and the distractor options /a e/. On each trial, one auditory stimulus consisting of a target syllable in isolation was played twice before participants had to respond. Participants responded by circling the option on their answer sheet (written in Korean orthography) that matched what they had just heard. The inter-trial interval was 5 s. As in the pretest, trials were ordered randomly but blocked by contrast type, such that all trials testing stops were presented before the trials testing vowels. For each of the 13 target syllables, there were three repetitions (of the same token), for a total of 39 trials.
To check that the posttest was reliable, we again calculated split-half reliability by randomly dividing the dataset from the posttest into two subsets according to category type (i.e., each subset containing half of the items, randomly selected, for each of five category types: lenis stops, fortis stops, aspirated stops, mid vowels, high vowels). This calculation suggested that, like the pretest, the posttest also had good reliability (Cronbach’s α = 0.82).
2.5. Statistical Analysis
In both the stop study and the vowel study, the likelihood of an accurate response in the pretest and posttest experiments was analyzed using mixed-effects logistic regression. To maximize the stability and generalizability of the final models, a two-stage modeling process was used, consisting of initial exploration of potential predictors (in models with lone fixed effects) followed by incremental model building, with model comparisons conducted via likelihood-ratio tests. This process resulted in four final models, one for the pretest and posttest in each of the two studies. All data from the pretest and posttest are publicly accessible via the OSF at https://osf.io/wgcen/.
In the first stage of modeling, we examined a series of models built with single fixed-effect predictors to get a sense of the informativeness of each fixed effect on its own. The random-effects structure in all models comprised intercepts by Participant and Stimulus, except in case there was only one stimulus per L2 category (i.e., in the model of posttest vowel identification).2 The fixed effects explored in pretest models were the participant’s L1 group (Group; treatment-coded with reference level “lead-short” in the stop study and “no contrast” in the vowel study) and the contrast tested on that trial (Contrast; treatment-coded with reference level “lenis-fortis” in the stop study and “/u/-/ɨ/” in the vowel study). The fixed effects explored in posttest models were Group (coded as above), the category tested on that trial (Category; treatment-coded with reference level “lenis” in the stop study and “/u/” in the vowel study), and the participant’s overall accuracy in the pretest (PretestAcc; centered and standardized).
In the second stage of modeling, we built a full model on each dataset (e.g., pretest trials in the stop study) with a view toward providing a strong test of the presence of a Group effect. Starting from a base model containing the random-effects structure from above, all potential fixed predictors besides Group were examined first (in decreasing order of informativeness, as indicated by AIC values in the single-predictor models from the first stage of modeling), including all possible interaction terms. Once these predictors were tested and all those which failed to significantly improve the model were removed, the Group term was added to see if it significantly improved the model. Thus, for each dataset, the model improvement (or lack thereof) resulting from the addition of the Group term is interpreted as evidence of the presence/absence of an effect of L1 background.
3. Results
3.1. Individual Differences at Pretest
To check whether IDs were confounded with L1 background (leading to unbalanced levels of IDs across the various L1-based groups), we first examined the range and distribution of variation in pretest performance (i.e., global discrimination accuracy) within each L1 group. Recall that there were three groups in the stop study and two groups in the vowel study; therefore, there were three between-group comparisons to be made in the stop study and one in the vowel study.
As shown in Figure 2, there was some variation across groups in the shape of the distribution in pretest accuracies (e.g., in the stop study, a longer lower tail in the lead-short group vs. a shorter lower tail in the short-long group); however, paired comparisons via Welch-corrected two-sample t-tests provided little evidence of a systematic disparity in the degree of IDs between any two groups. For the groups in the stop study, the range in pretest accuracy was 22–97%, 50–100%, and 47–89%, respectively, for the lead-short, short-long, and lead-long groups. None of the between-group differences were significant [|t|s < 2.026, ps > 0.05]. As for the groups in the vowel study, the range in pretest accuracy was 47–97% and 22–100%, respectively, for the no-contrast and some-contrast groups. Here, too, the between-group difference was not significant [t(54.7) = −0.502, p > 0.05]. Given these results, we conclude that IDs in phonetic sensitivity did not simply reflect participants’ diverse L1 backgrounds. In fact, there were substantial, and not significantly different, levels of individual variation in all of the L1 groups discussed below.
3.2. Study 1: Stop Perception
Analysis of pretest performance in the stop study revealed considerable variation in discrimination accuracy across the different L2 laryngeal contrasts, but no systematic effect of the learner’s L1 group. As shown in Figure 3, accuracy was well above chance level (=20%) in all cases, but tended to be lower on the lenis-fortis contrast (Macc = 58%) than on the other two contrasts (fortis-aspirated: Macc = 85%; lenis-aspirated: Macc = 81%). This was reflected in the modeling results, which revealed a significant effect of Contrast [χ2(2) = 13.769, p < 0.01] but no effect of Group [χ2(2) = 5.604, p > 0.05]. The final model (shown in Table 5) confirmed that, compared to the lenis-fortis contrast (represented in the intercept), the fortis-aspirated and lenis-aspirated contrasts were both significantly more likely to be discriminated accurately [βs > 1.476, ps < 0.001].
Analysis of posttest performance in the stop study revealed both variation in identification accuracy across the different L2 laryngeal categories as well as an advantage of the short-long group—and, to a lesser extent, the lead-short group—over the lead-long group. As shown in Figure 4, with the exception of the lead-long group on fortis stops, accuracy was well above chance level (i.e., 10%); nevertheless, accuracy tended to be lower on fortis stops (Macc = 51%) than on the lenis (Macc = 68%) or aspirated stops (Macc = 62%), especially for the lead-short and lead-long groups. These patterns were reflected in the modeling results, which showed no effect of PretestAcc [χ2(1) = 0.834, p > 0.05] but a significant effect of Category [χ2(2) = 13.770, p < 0.01], of Group [χ2(2) = 8.564, p < 0.05], and of the Category × Group interaction [χ2(4) = 36.291, p < 0.001].
The nature of the interaction between Category and Group can be seen in the final model of posttest accuracy (Table 6). Relative to accuracy on lenis stops, the lead-short group was significantly less likely to be accurate on fortis stops [β = −1.394, p < 0.001] but not aspirated stops [β = 0.163, p > 0.05], and the lead-long group showed a similar pattern, reflected in non-significant interaction coefficients. The short-long group, however, showed a different pattern, with a much smaller decrease in accuracy on fortis stops vis-a-vis lenis stops and a slight decrease in accuracy on aspirated stops (contrasting with the slight increase observed in the other two groups); these differences were reflected in a significant positive interaction coefficient for fortis stops [β = 0.860, p < 0.05] and a significant negative interaction coefficient for aspirated stops [β = −0.810, p < 0.05].
In addition to analyzing accuracy, we also inspected the pattern of errors in the posttest to check whether they involved laryngeal category, place (of articulation), or both. As shown in Figure 5 (see also Figure A1, Figure A2 and Figure A3 in Appendix A), errors for every stimulus mostly involved laryngeal category only. The two exceptions were /pha/ and /ta/, which each elicited a high proportion of errors involving place. Crucially, however, errors involving laryngeal category only were by far the most common error type, both overall (83%) and across groups (77–88%).
Although our modeling results suggested that pretest performance was not a predictor of posttest stop perception, we further examined the relationship between the two through Pearson’s correlations to provide additional evidence of the (non)predictiveness of pretest performance. These analyses revealed no significant correlations between pretest and posttest accuracy on stops, overall [r(55) = 0.13, p > 0.05] or within any individual group: lead-short [r(13) = 0.10, p > 0.05], short-long [r(34) = −0.18, p > 0.05], or lead-long [r(4) = 0.64, p > 0.05] (see Figure 6). In short, results of the stop study produced some evidence of L1 transfer, but crucially only following extensive L2 exposure; moreover, there was no evidence of a link between preexisting phonetic sensitivity (as measured in the pretest) and L2 stop perception following L2 learning (as measured in the posttest).
3.3. Study 2: Vowel Perception
Analysis of pretest performance in the vowel study revealed ceiling-level discrimination accuracy for both L2 vowel contrasts and across both L1 groups. As shown in Figure 7, accuracy was well above chance in all cases and did not differ between the /u/-/ɨ/ and /o/-/ʌ/ contrasts (Macc = 93% for both). Modeling results showed no effect of Contrast [χ2(1) = 0, p > 0.05] or of Group [χ2(1) = 0.040, p > 0.05], so the final model [N = 456, log-likelihood = −83.5] contained no fixed predictors. Consistent with the high accuracies in Figure 6, the intercept in this model indicated that L2 vowel contrasts were, overall, discriminated with significantly better than 50-50 odds [β = 6.983, z = 4.456, p < 0.001].
Compared to pretest performance, there was more variation in posttest performance, but accuracies were generally high, especially relative to stop identification rates. There were some differences among vowels, with /ɨ/ showing the highest accuracies and /ʌ/ the lowest. Crucially, there was also a group difference: the some-contrast group outperformed the no-contrast group, both overall (no contrast: Macc = 74%; some-contrast: Macc = 88%) and on every vowel category, as shown in Figure 8. Thus, modeling results showed a significant effect of Category [χ2(3) = 52.729, p < 0.001] and of Group [χ2(1) = 4.233, p < 0.05] though no effect of the Category × Group interaction [χ2(3) = 0.955, p > 0.05]. Additionally, as in the stop study, there was no effect of PretestAcc [χ2(1) = 0.395, p > 0.05]. The final model (Table 7) indicated that, compared to /u/, /ɨ/ was significantly more likely to be identified accurately [β = 2.090, p < 0.001] while /ʌ/ was significantly less likely to be identified accurately [β = −0.768, p < 0.05]; furthermore, the some-contrast group was significantly more likely to be accurate than the no-contrast group [β = 1.210, p < 0.05].
As in the study of stop perception, here too we inspected the pattern of errors in the posttest to see which vowels were most confusable with each other. As shown in Figure 9 (see also Figure A4 and Figure A5 in Appendix A), /u/ was most often confused with /o/, /ɨ/ with /u/ (although there were very few errors on /ɨ/ overall), /o/ with /ʌ/, and /ʌ/ with /a/. Relatively few errors involved confusion with the vowel /ɨ/ or /e/. In short, vowel identification errors tended to involve confusion with a vowel sharing a specification for roundedness/labiality and/or height, which was unsurprising; however, predominant vowel confusions were not symmetrical (e.g., /o/ was most often misidentified as /ʌ/ but /ʌ/ was not most often misidentified as /o/).
As in the stop study, we further examined the relationship between pretest performance and posttest vowel perception via Pearson’s correlations. In line with the modeling results as well as the lack of correlations seen in the stop study, these analyses revealed no significant correlations between pretest performance and posttest accuracy on vowels, overall [r(55) = 0.09, p > 0.05] or within either individual group: no-contrast [r(24) = 0.16, p > 0.05] or some-contrast [r(29) = −0.002, p > 0.05] (see Figure 10). In short, results of the vowel study were consistent with those of the stop study: again, we found evidence of L1 transfer only in the posttest and no evidence of a link between preexisting phonetic sensitivity and L2 vowel perception after L2 learning.
4. Discussion
In summary, evidence of L1 transfer was not found in L2 perception of Korean ab initio, but was found after a prolonged period of L2 learning. Results of the pretest showed, as expected, substantial individual differences (IDs) in learners’ preexisting phonetic sensitivity to the target stop and vowel contrasts, but no systematic effect of the crucial L1 features hypothesized to affect L2 perception of these contrasts. In contrast, results of the posttest showed a significant effect of these L1 features, both for stops and for vowels, but no effect of phonetic sensitivity as reflected in pretest performance. These findings thus provide support for the first part of the Transfer Ramp-up Hypothesis: rather than peaking at L2 onset, L1 influence takes time to set in during L2 perceptual development (at which point the relative role of IDs in phonetic sensitivity may become smaller).
Although these findings converge with the results of previous studies on L2 Korean (Jung and Kwon 2010; Kwon 2013), they also diverge from the literature supporting the Perceptual Assimilation Model (PAM; Best 1994, 1995), much of which also examined naive listeners of an L2 yet found patterns of ostensible L1 influence in discrimination of L2 contrasts. In our view, the disparity between the current results and PAM-framed results is likely due to different formulations of the dependent measure. That is, whereas studies testing PAM have generally examined L2/nonnative perception by individual contrast (because PAM makes different predictions for different types of L2 contrasts), the present study, which was not focused on testing PAM, evaluated L2 perception mainly in terms of an overall likelihood of accuracy. In fact, when the (pretest) discrimination results are separated out by contrast, there is some indication of a possible L1 effect for certain contrasts (e.g., the short-long group showing the greatest advantage over the lead-short group on the Korean fortis vs. aspirated contrast; see Figure 3), even if not for others (e.g., the no-contrast group showing similar, ceiling-level performance as the some-contrast group on both Korean vowel contrasts; see Figure 7).
Thus, while we interpret the current findings as support for the Transfer Ramp-up Hypothesis, we are also careful to point out that our observation of a low degree of L1 transfer at L2 onset (vis-a-vis later points in L2 development) does not mean that there is no L1 influence at L2 onset. It is not possible to draw such a conclusion on the basis of the evidence in this study, and the Transfer Ramp-up Hypothesis, moreover, does not make this extreme claim. The core claim is rather that there is an increase in L1 transfer during the early part of L2 development. Because this does not entail the total absence of L1 effects at L2 onset, it stands to reason that the L1 may indeed have a detectable effect on the ab initio perception of specific L2 contrasts (e.g., “Single Category” contrasts that assimilate to the same L1 sound; Best 1994), which may amount to an L1 effect that is weak or undetectable overall when multiple L2 contrasts are considered together. The locus of the difference between the present study and previous theoretical frameworks, therefore, is in the observed trajectory of L1 transfer. In particular, our findings contradict the view—made explicit in the Ontogeny Phylogeny Model (OPM) and left implicit in other frameworks such as PAM(-L2)—that L1 influence is at its height at the start of L2 development and only decreases from that point.
Apart from the implications for theories of L1 transfer, the current findings also have implications for views of IDs in L2 acquisition. In particular, they make two contributions to our understanding of IDs in L2 perceptual development. First, given that no effect of L1 background was found in the pretest despite ample variation among learners, the pretest results provide evidence that the magnitude of IDs in phonetic sensitivity to L2 contrasts—at least, to the target L2 Korean contrasts examined in this study—can be relatively large compared to the magnitude of L1 effects. These results thus argue in favor of making the analysis of IDs central to studies of L2 perception (as is becoming increasingly common in the L2 speech literature; see Section 2.2) because IDs may actually prove to be a more powerful predictor of L2 perceptual behavior (at certain points in L2 development) than the more extensively examined factor of L1 background. Second, together with the pretest results, the posttest results provide evidence that the effect of IDs changes over the course of L2 development. Crucially, IDs in phonetic sensitivity were found not to predict L2 perceptual accuracy after L2 learning, which supports a view of L2 perception, at any given point during L2 development, as the outcome of a dynamic interaction between L1 transfer and IDs.
In light of these theoretical implications, it would be remiss of us not to mention the limitations of the present study, which motivate a number of different directions for future research. First, as alluded to in Section 2.4, the composition of the participant sample, influenced in large part by worldwide trends in who elects to study Korean as an L2, was unevenly distributed in terms of L1 backgrounds, necessitating an approach that grouped L1s together rather than analyzing them separately. Although adequate for addressing research questions related to broadly formulated phonological features of an L1, this approach does not lend itself to a nuanced examination of features that may be more language-specific (e.g., palatalization in Russian; pharyngealization in Arabic). It would, therefore, provide additional insight to replicate this type of study with a larger sample in which all L1 backgrounds are robustly represented, allowing for analyses that focus on specific L1s.
Second, as mentioned in Section 2.4.2, the study was designed to use different task paradigms (discrimination and identification) for the pretest and posttest, considering both ecological validity and appropriateness for different stages of L2 learning. Although both paradigms are widely used to measure perceptual ability, and the measures from these paradigms have been shown to be highly correlated with each other at the same point in time (e.g., Pearson’s r > 0.6 for L2 discrimination and identification of Mandarin tones; Bowles et al. 2016), the fact remains that discrimination performance and identification performance cannot be directly compared to each other, which prevents us from being able to draw conclusions about participants’ L2 perceptual development that are truly longitudinal. Thus, it would be useful in future research to collect longitudinal data from the exact same task, which, with some design modifications, could be made appropriate for learners at different stages of L2 development (e.g., use of iconic images for response options in ab initio L2 identification; see Bowles et al. 2016).
Third, this study included observations of two time points in L2 development, whereas at least three are needed to fully demonstrate the inverse U-shaped pattern of L1 transfer postulated in the Transfer Ramp-up Hypothesis (Figure 1). That is, we have only assumed the part of the pattern in which L1 transfer declines at later points in L2 development on the basis of prior findings in the literature (see Section 1.1), since it was not possible to observe a third, later time point in the case of the current participants (who did not necessarily continue learning Korean after the end of their Korean language course). In future work, it would therefore be helpful to track learners further into their trajectory of L2 learning (e.g., in a year-long course of L2 instruction) so as to provide direct evidence of the hypothesized post-ramp-up decline in L1 transfer.
5. Conclusions
In closing, we would like to highlight one of the chief challenges of designing developmental perceptual research such as the present study, and outline a possible approach to addressing this challenge in future research. In our view, truly longitudinal perceptual data (i.e., data from the same individual completing the same perceptual task, including the same auditory stimuli, at different points in time) may not be the ideal data for investigating perceptual change over time, because it is not only development, but also extraneous factors such as familiarity with (or memory of) the test stimuli, that may lead to listeners performing differently in the same task across two points in time. The challenge for future research, therefore, is to identify and control for such extraneous factors appropriately. In the case of test stimuli, for example, one way of addressing the issue of familiarity/memory would be to use similarly constructed, but non-identical, stimulus sets at different time points, normed in advance to be equivalently difficult. Studies designed “pseudo-longitudinally” in this manner would be better able to show change that could be confidently interpreted as reflecting development.
Despite the challenges of incorporating a longitudinal design in developmental perceptual research, however, the need for longitudinal studies in working toward a theory of L2 perceptual learning that incorporates a role for both L1 transfer and individual differences cannot be overemphasized. Given that cross-sectional studies, by their very nature, are ill-equipped to examine the temporal dynamicity of individual difference effects, longitudinal studies, including both the laboratory training approach as well as the classroom learning approach taken in the present study, are uniquely positioned to shed new light on the roles, and interaction, of language-specific and personally-specific variables in L2 perceptual development.
Author Contributions
Conceptualization, C.B.C. and S.K.; Data curation, C.B.C.; Formal analysis, C.B.C.; Funding acquisition, S.K.; Investigation, S.K.; Methodology, C.B.C. and S.K.; Project administration, S.K.; Resources, S.K.; Supervision, S.K.; Validation, C.B.C. and S.K.; Visualization, C.B.C.; Writing—original draft, C.B.C.; Writing—review & editing, C.B.C. and S.K. All authors have read and agreed to the published version of the manuscript.
Funding
This research was funded by Pukyong National University, grant number C-D-2016-0831.
Acknowledgments
The authors gratefully acknowledge Peter Jurgec’s expert advice on Slovenian phonetics and phonology and helpful comments and feedback from two anonymous reviewers.
Conflicts of Interest
The authors declare no conflict of interest. The funding sponsors had no role in the design of the study; in the collection, analyses, or interpretation of data; in the writing of the manuscript, or in the decision to publish the results.
Appendix A
Figure A1.
Confusion matrix of errors by the lead-short group in the posttest for stop items (vertical = stimuli, horizontal = responses). Each cell shows the percent of all errors on the given stimulus represented by the given response (rows may not add to 100% due to rounding); the most common error type for each stimulus is bolded. The total number of errors for each stimulus (across all participants in the group) is shown in parentheses.

Figure A2.
Confusion matrix of errors by the short-long group in the posttest for stop items (vertical = stimuli, horizontal = responses). Each cell shows the percent of all errors on the given stimulus represented by the given response (rows may not add to 100% due to rounding); the most common error type for each stimulus is bolded. The total number of errors for each stimulus (across all participants in the group) is shown in parentheses.

Figure A3.
Confusion matrix of errors by the lead-long group in the posttest for stop items (vertical = stimuli, horizontal = responses). Each cell shows the percent of all errors on the given stimulus represented by the given response (rows may not add to 100% due to rounding); the most common error type for each stimulus is bolded. The total number of errors for each stimulus (across all participants in the group) is shown in parentheses.

Figure A4.
Confusion matrix of errors by the no-contrast group in the posttest for vowel items (vertical = stimuli, horizontal = responses). Each cell shows the percent of all errors on the given stimulus represented by the given response (rows may not add to 100% due to rounding); the most common error type for each stimulus is bolded. The total number of errors for each stimulus (across all participants in the group) is shown in parentheses.

Figure A5.
Confusion matrix of errors by the some-contrast group in the posttest for vowel items (vertical = stimuli, horizontal = responses). Each cell shows the percent of all errors on the given stimulus represented by the given response (rows may not add to 100% due to rounding); the most common error type for each stimulus is bolded. The total number of errors for each stimulus (across all participants in the group) is shown in parentheses.

References
- Baker, Wendy, and Pavel Trofimovich. 2006. Perceptual paths to accurate production of L2 vowels: The role of individual differences. International Review of Applied Linguistics in Language Teaching 44: 231–50. [Google Scholar] [CrossRef]
- Bergier, Marcin. 2014. The influence of explicit phonetic instruction and production training practice on awareness raising in the realization of stop consonant clusters by advanced Polish learners of English. In Awareness in Action: The Role of Consciousness in Language Acquisition. Edited by Andrzej Łyda and Konrad Szcześniak. Heidelberg: Springer, pp. 103–20. [Google Scholar] [CrossRef]
- Best, Catherine T. 1994. The emergence of native-language phonological influences in infants: A perceptual assimilation model. In The Development of Speech Perception: The Transition from Speech Sounds to Spoken Words. Edited by Judith C. Goodman and Howard C. Nusbaum. Cambridge: MIT Press, pp. 167–224. [Google Scholar]
- Best, Catherine T. 1995. A direct realist view of cross-language speech perception. In Speech Perception and Linguistic Experience: Issues in Cross-Language Research. Edited by Winifred Strange. Baltimore: York Press, pp. 171–204. [Google Scholar]
- Best, Catherine T., and Michael D. Tyler. 2007. Nonnative and second-language speech perception: Commonalities and complementarities. In Language Experience in Second Language Speech Learning: In Honor of James Emil Flege. Edited by Ocke-Schwen Bohn and Murray J. Munro. Amsterdam: John Benjamins Publishing, pp. 13–34. [Google Scholar] [CrossRef]
- Boersma, Paul, and David Weenink. 2013. Praat: Doing Phonetics by Computer. Version 5.3.48. Available online: http://www.praat.org (accessed on 1 May 2013).
- Bohn, Ocke-Schwen, and Catherine T. Best. 2012. Native-language phonetic and phonological influences on perception of American English approximants by Danish and German listeners. Journal of Phonetics 40: 109–28. [Google Scholar] [CrossRef] [Green Version]
- Bowles, Anita R., Charles B. Chang, and Valerie P. Karuzis. 2016. Pitch ability as an aptitude for tone learning. Language Learning 66: 774–808. [Google Scholar] [CrossRef] [Green Version]
- Bradlow, Ann R. 1995. A comparative acoustic study of English and Spanish vowels. Journal of the Acoustical Society of America 97: 1916–24. [Google Scholar] [CrossRef] [PubMed] [Green Version]
- Byon, Andrew Sangpil. 2008. Korean as a foreign language in the USA: The instructional settings. Language, Culture and Curriculum 21: 244–55. [Google Scholar] [CrossRef]
- Byon, Andrew Sangpil, and Danielle Ooyoung Pyun, eds. 2012. Teaching and Learning Korean as a Foreign Language: A Collection of Empirical Studies. Columbus: Ohio State University Press. [Google Scholar]
- Carroll, John B. 1981. Twenty-five years of research on foreign language aptitude. In Individual Differences and Universals in Language Learning Aptitude. Edited by Karl C. Diller. Rowley: Newbury House, pp. 83–118. [Google Scholar]
- Champely, Stephane. 2018. Pwr: Basic Functions for Power Analysis [R package]. Version 1.2-2. Available online: http://cran.r-project.org/web/packages/pwr/index.html (accessed on 1 April 2018).
- Chandrasekaran, Bharath, Padma D. Sampath, and Patrick C. M. Wong. 2010. Individual variability in cue-weighting and lexical tone learning. Journal of the Acoustical Society of America 128: 456–65. [Google Scholar] [CrossRef] [PubMed] [Green Version]
- Chang, Charles B. 2010. The implementation of laryngeal contrast in Korean as a Second Language. Harvard Studies in Korean Linguistics 13: 91–104. [Google Scholar]
- Chang, Charles B. 2012. Rapid and multifaceted effects of second-language learning on first-language speech production. Journal of Phonetics 40: 249–68. [Google Scholar] [CrossRef]
- Chang, Charles B. 2013. The production and perception of coronal fricatives in Seoul Korean: The case for a fourth laryngeal category. Korean Linguistics 15: 7–49. [Google Scholar] [CrossRef] [Green Version]
- Chang, Charles B. 2016. Bilingual perceptual benefits of experience with a heritage language. Bilingualism: Language and Cognition 19: 791–809. [Google Scholar] [CrossRef] [Green Version]
- Chang, Charles B. 2018. Perceptual attention as the locus of transfer to nonnative speech perception. Journal of Phonetics 68: 85–102. [Google Scholar] [CrossRef]
- Cho, Taehong, Sun-Ah Jun, and Peter Ladefoged. 2002. Acoustic and aerodynamic correlates of Korean stops and fricatives. Journal of Phonetics 30: 193–228. [Google Scholar] [CrossRef] [Green Version]
- Clynes, Adrian, and David Deterding. 2011. Standard Malay (Brunei). Journal of the International Phonetic Association 41: 259–68. [Google Scholar] [CrossRef] [Green Version]
- Cruz-Ferreira, Madalena. 1995. European Portuguese. Journal of the International Phonetic Association 25: 90–94. [Google Scholar] [CrossRef]
- Darcy, Isabelle, Hanyong Park, and Chung-Lin Yang. 2015. Individual differences in L2 acquisition of English phonology: The relation between cognitive abilities and phonological processing. Learning and Individual Differences 40: 63–72. [Google Scholar] [CrossRef]
- Dewaele, Jean-Marc, and Adrian Furnham. 2000. Personality and speech production: A pilot study of second language learners. Personality and Individual Differences 28: 355–65. [Google Scholar] [CrossRef]
- Díaz, Begoña, Cristina Baus, Carles Escera, Albert Costa, and Núria Sebastián-Gallés. 2008. Brain potentials to native phoneme discrimination reveal the origin of individual differences in learning the sounds of a second language. Proceedings of the National Academy of Sciences of the United States of America 105: 16083–88. [Google Scholar] [CrossRef] [Green Version]
- Díaz, Begoña, Holger Mitterer, Mirjam Broersma, and Núria Sebastián-Gallés. 2012. Individual differences in late bilinguals’ L2 phonological processes: From acoustic-phonetic analysis to lexical access. Learning and Individual Differences 22: 680–89. [Google Scholar] [CrossRef] [Green Version]
- Dörnyei, Zoltán, and Peter Skehan. 2003. Individual differences in second language learning. In The Handbook of Second Language Acquisition. Edited by Catherine J. Doughty and Michael H. Long. Malden: Blackwell Publishing, pp. 589–630. [Google Scholar] [CrossRef]
- Dörnyei, Zoltán. 2006. Individual differences in second language acquisition. AILA Review 19: 42–68. [Google Scholar] [CrossRef]
- Duanmu, San. 2007. The Phonology of Standard Chinese, 2nd ed. Oxford: Oxford University Press. [Google Scholar]
- Eckman, Fred R., Abdulla Elreyes, and Gregory K. Iverson. 2001. Allophonic splits in L2 phonology: The question of learnability. International Journal of English Studies 1: 21–51. [Google Scholar]
- Eklund, Ingegerd, and Hartmut Traunmüller. 1997. Comparative study of male and female whispered and phonated versions of the long vowels of Swedish. Phonetica 54: 1–21. [Google Scholar] [CrossRef] [Green Version]
- Escudero, Paola, Paul Boersma, Andréia Schurt Rauber, and Ricardo A. H. Bion. 2009. A cross-dialect acoustic description of vowels: Brazilian and European Portuguese. Journal of the Acoustical Society of America 126: 1379–93. [Google Scholar] [CrossRef] [PubMed] [Green Version]
- Eychenne, Julien, and Tae-Yeoub Jang. 2015. On the merger of Korean mid front vowels: Phonetic and phonological evidence. Malsoriwa Eumseong Gwahak [Phonetics and Speech Sciences] 7: 119–29. [Google Scholar] [CrossRef] [Green Version]
- Eychenne, Julien, and Tae-Yeoub Jang. 2018. On the role of contrastivity in the development of the /e∼ɛ/ merger in Korean. Journal of East Asian Linguistics 27: 111–39. [Google Scholar] [CrossRef]
- Flege, James Emil. 1995. Second language speech learning: Theory, findings, and problems. In Speech Perception and Linguistic Experience: Issues in Cross-Language Research. Edited by Winifred Strange. Baltimore: York Press, pp. 233–72. [Google Scholar]
- Fougeron, Cécile, and Caroline L. Smith. 1993. French. Journal of the International Phonetic Association 23: 73–76. [Google Scholar] [CrossRef]
- Golestani, Narly, and Robert J. Zatorre. 2009. Individual differences in the acquisition of second language phonology. Brain and Language 109: 55–67. [Google Scholar] [CrossRef] [Green Version]
- Gordon, Larry. 2015. Korean-Language Classes Are Growing in Popularity at U.S. Colleges. Los Angeles Times. April 1. Available online: https://lat.ms/1GjgEjG (accessed on 1 August 2018).
- Hanulíková, Adriana, Dan Dediu, Zhou Fang, Jana Bašnaková, and Falk Huettig. 2012. Individual differences in the acquisition of a complex L2 phonology: A training study. Language Learning 62: 79–109. [Google Scholar] [CrossRef] [Green Version]
- Hattori, Kota, and Paul Iverson. 2009. English /r/-/l/ category assimilation by Japanese adults: Individual differences and the link to identification accuracy. Journal of the Acoustical Society of America 125: 469–79. [Google Scholar] [CrossRef]
- Helgason, Pétur, and Catherine Ringen. 2008. Voicing and aspiration in Swedish stops. Journal of Phonetics 36: 607–28. [Google Scholar] [CrossRef]
- Herrity, Peter. 2000. Slovene: A Comprehensive Grammar. London: Routledge. [Google Scholar]
- Hillenbrand, James, Laura A. Getty, Michael J. Clark, and Kimberlee Wheeler. 1995. Acoustic characteristics of American English vowels. Journal of the Acoustical Society of America 97: 3099–111. [Google Scholar] [CrossRef] [Green Version]
- Holliday, Jeffrey J. 2014. The perceptual assimilation of Korean obstruents by native Mandarin listeners. Journal of the Acoustical Society of America 135: 1585–95. [Google Scholar] [CrossRef]
- Holliday, Jeffrey J. 2015. A longitudinal study of the second language acquisition of a three-way stop contrast. Journal of Phonetics 50: 1–14. [Google Scholar] [CrossRef]
- Holliday, Jeffrey J. 2016. Second language experience can hinder the discrimination of nonnative phonological contrasts. Phonetica 73: 33–51. [Google Scholar] [CrossRef] [PubMed]
- Idemaru, Kaori, Lori L. Holt, and Howard Seltman. 2012. Individual differences in cue weights are stable across time: The case of Japanese stop lengths. Journal of the Acoustical Society of America 132: 3950–64. [Google Scholar] [CrossRef] [Green Version]
- Iivonen, Antti, and Huhe Harnud. 2005. Acoustical comparison of the monophthong systems in Finnish, Mongolian and Udmurt. Journal of the International Phonetic Association 35: 59–71. [Google Scholar] [CrossRef]
- Jilka, Matthias, Volha Anufryk, Henrike Baumotte, Natalie Lewandowska, Giuseppina Rota, and Susanne Reiterer. 2008. Assessing individual talent in second language production and perception. In New Sounds 2007: Proceedings of the 5th International Symposium on the Acquisition of Second Language Speech. Edited by Andréia Schurt Rauber, Michael Alan Watkins and Barbara O. Baptista. Florianópolis: Federal University of Santa Catarina, pp. 243–58. [Google Scholar]
- Johnson, Keith, and Molly Babel. 2010. On the perceptual basis of distinctive features: Evidence from the perception of fricatives by Dutch and English speakers. Journal of Phonetics 38: 127–36. [Google Scholar] [CrossRef]
- Jung, Miji, and Sungmi Kwon. 2010. A study on the phonetic discrimination and acquisition ability of Korean language learners. Malsoriwa Eumseong Gwahak [Phonetics and Speech Sciences] 2: 23–32. [Google Scholar]
- Jurgec, Peter. 2005. Formant frequencies of standard Slovene vowels. Govor 22: 127–44. [Google Scholar]
- Kagaya, Ryohei. 1974. A fiberscopic and acoustic study of the Korean stops, affricates and fricatives. Journal of Phonetics 2: 161–80. [Google Scholar] [CrossRef]
- Kang, Yoonjung. 2014. Voice Onset Time merger and development of tonal contrast in Seoul Korean stops: A corpus study. Journal of Phonetics 45: 76–90. [Google Scholar] [CrossRef]
- Kartushina, Natalia, and Ulrich Hans Frauenfelder. 2013. On the role of L1 speech production in L2 perception: Evidence from Spanish learners of French. In Proceedings of the 14th Annual Conference of the International Speech Communication Association (INTERSPEECH-2013), Lyon, France, 25–29 August 2013. Edited by Frédéric Bimbot, Christophe Cerisara, Cécile Fougeron, Guillaume Gravier, Lori Lamel, François Pellegrino and Pascal Perrier. BAIXAS: ISCA Archive, pp. 2118–22. [Google Scholar]
- Kartushina, Natalia, and Ulrich Hans Frauenfelder. 2014. On the effects of L2 perception and of individual differences in L1 production on L2 pronunciation. Frontiers in Psychology 5: 1246. [Google Scholar] [CrossRef] [PubMed] [Green Version]
- Keating, Patricia A. 1984. Phonetic and phonological representation of stop consonant voicing. Language 60: 286–319. [Google Scholar] [CrossRef]
- Kiliç, Mehmet Akif, Fatih Öğüt, Gürsel Dursun, Erdoğan Okur, Ilhami Yildirim, and Raşit Midilli. 2004. The effect of vowels on voice perturbation measures. Journal of Voice 18: 318–24. [Google Scholar] [CrossRef] [PubMed]
- Kilman, Lisa, Adriana Zekveld, Mathias Hällgren, and Jerker Rönnberg. 2014. The influence of non-native language proficiency on speech perception performance. Frontiers in Psychology 5: 651. [Google Scholar] [CrossRef] [Green Version]
- Kim-Renaud, Young-Key. 1974. Korean Consonantal Phonology. Ph.D. dissertation, University of Hawai’i, Honolulu, HI, USA. [Google Scholar]
- Kim-Renaud, Young-Key. 2012. Modern Korean. In The Languages of Japan and Korea. Edited by Nicolas Tranter. Abingdon: Routledge, pp. 123–67. [Google Scholar] [CrossRef]
- Ko, Insung. 2009. The merger of ey /e/ and ay /ɛ/ of Seoul Korean. Eoneo Jeongbo [Language Information] 10: 73–89. [Google Scholar]
- Kuhl, Patricia K., and Paul Iverson. 1995. Linguistic experience and the “perceptual magnet effect”. In Speech Perception and Linguistic Experience: Issues in Cross-Language Research. Edited by Winifred Strange. Baltimore: York Press, pp. 121–54. [Google Scholar]
- Kuhl, Patricia K., Barbara T. Conboy, Sharon Coffey-Corina, Denise Padden, Maritza Rivera-Gaxiola, and Tobey Nelson. 2008. Phonetic learning as a pathway to language: New data and native language magnet theory expanded (NLM-e). Philosophical Transactions of the Royal Society B 363: 979–1000. [Google Scholar] [CrossRef] [Green Version]
- Kuhl, Patricia K., Karen A. Williams, Francisco Lacerda, Kenneth N. Stevens, and Björn Lindblom. 1992. Linguistic experience alters phonetic perception in infants by 6 months of age. Science 255: 606–8. [Google Scholar] [CrossRef]
- Kwon, Sungmi. 2013. A study on the phonetic sensitivity in the acquisition of non-native language speech sound. Saegugeo Gyoyuk [Korean Education] 97: 209–32. [Google Scholar] [CrossRef]
- Labov, William, Sharon Ash, and Charles Boberg. 2006. The Atlas of North American English: Phonetics, Phonology and Sound Change. Berlin: Mouton de Gruyter. [Google Scholar] [CrossRef]
- Ladefoged, Peter. 1999. American English. In Handbook of the International Phonetic Association. Edited by the International Phonetic Association. Cambridge: Cambridge University Press, pp. 41–44. [Google Scholar]
- Lee, Hyun Bok. 1993. Korean. Journal of the International Phonetic Association 23: 28–31. [Google Scholar] [CrossRef]
- Lee, Wai-Sum, and Eric Zee. 2003. Standard Chinese (Beijing). Journal of the International Phonetic Association 33: 109–12. [Google Scholar] [CrossRef] [Green Version]
- Levy, Erika S., and Winifred Strange. 2008. Perception of French vowels by American English adults with and without French language experience. Journal of Phonetics 36: 141–57. [Google Scholar] [CrossRef]
- Maddieson, Ian. 1984. Patterns of Sounds. Cambridge: Cambridge University Press. [Google Scholar]
- Major, Roy C. 2001. Foreign Accent: The Ontogeny and Phylogeny of Second Language Phonology. Mahwah: Lawrence Erlbaum Associates. [Google Scholar]
- Major, Roy C. 2008. Transfer in second language phonology: A review. In Phonology and Second Language Acquisition. Edited by Jette G. Hansen Edwards and Mary L. Zampini. Amsterdam: John Benjamins Publishing, pp. 63–94. [Google Scholar] [CrossRef]
- Martínez-Celdrán, Eugenio, Ana Ma Fernández-Planas, and Josefina Carrera-Sabaté. 2003. Castilian Spanish. Journal of the International Phonetic Association 33: 255–59. [Google Scholar] [CrossRef] [Green Version]
- Milovanov, Riia, Minna Huotilainen, Vesa Välimäki, Paulo A. A. Esquef, and Mari Tervaniemi. 2008. Musical aptitude and second language pronunciation skills in school-aged children: Neural and behavioral evidence. Brain Research 1194: 81–89. [Google Scholar] [CrossRef] [PubMed]
- Milovanov, Riia, Päivi Pietilä, Mari Tervaniemi, and Paulo A. A. Esquef. 2010. Foreign language pronunciation skills and musical aptitude: A study of Finnish adults with higher education. Learning and Individual Differences 20: 56–60. [Google Scholar] [CrossRef]
- Munro, Miles. 2008. CVC syllables for investigating the phonetic sensitivity of Mandarin and English speakers. Behavior Research Methods 40: 147–53. [Google Scholar] [CrossRef] [Green Version]
- Myers, Emily B. 2014. Emergence of category-level sensitivities in non-native speech sound learning. Frontiers in Neuroscience 8: 238. [Google Scholar] [CrossRef] [Green Version]
- Odlin, Terence. 1989. Language Transfer: Cross-Linguistic Influence in Language Learning. Cambridge: Cambridge University Press. [Google Scholar]
- Öğüt, Fatih, Mehmet Akif Kiliç, Erkan Zeki Engin, and Raşit Midilli. 2006. Voice onset times for Turkish stop consonants. Speech Communication 48: 1094–99. [Google Scholar] [CrossRef]
- Oh, Eunjin. 2011. Effects of speaker gender on voice onset time in Korean stops. Journal of Phonetics 39: 59–67. [Google Scholar] [CrossRef]
- Park, Hansang. 2002a. The time courses of F1 and F2 as a descriptor of phonation types. Eoneohak [Linguistics] 33: 87–108. [Google Scholar]
- Park, Hansang. 2002b. Temporal and Spectral Characteristics of Korean Phonation Types. Ph.D. dissertation, University of Texas at Austin, Austin, TX, USA. [Google Scholar]
- Perrachione, Tyler K., Jiyeon Lee, Louisa Y. Y. Ha, and Patrick C. M. Wong. 2011. Learning a novel phonological contrast depends on interactions between individual differences and training paradigm design. Journal of the Acoustical Society of America 130: 461–72. [Google Scholar] [CrossRef] [PubMed] [Green Version]
- Piske, Thorsten. 2008. Phonetic awareness, phonetic sensitivity and the second language learner. In Encyclopedia of Language and Education, 2nd ed. Edited by Jasone Cenoz and Nancy H. Hornberger. Boston: Springer, vol. 6 (Knowledge about Language). pp. 155–66. [Google Scholar] [CrossRef]
- Polka, Linda, and Janet F. Werker. 1994. Developmental changes in perception of nonnative vowel contrasts. Journal of Experimental Psychology: Human Perception and Performance 20: 421–35. [Google Scholar] [CrossRef] [PubMed]
- R Development Core Team. 2020. R: A Language and Environment for Statistical Computing. Version 4.0.2. Available online: http://www.r-project.org (accessed on 22 June 2020).
- Raizada, Rajeev D. S., Feng-Ming Tsao, Huei-Mei Liu, and Patricia K. Kuhl. 2010. Quantifying the adequacy of neural representations for a cross-language phonetic discrimination task: Prediction of individual differences. Cerebral Cortex 20: 1–12. [Google Scholar] [CrossRef] [Green Version]
- Roach, Peter. 2004. British English: Received Pronunciation. Journal of the International Phonetic Association 34: 239–45. [Google Scholar] [CrossRef] [Green Version]
- Robinson, Peter. 2001. Individual differences, cognitive abilities, aptitude complexes and learning conditions in second language acquisition. Second Language Research 17: 368–92. [Google Scholar] [CrossRef]
- Schertz, Jessamyn, Taehong Cho, Andrew Lotto, and Natasha Warner. 2015. Individual differences in phonetic cue use in production and perception of a non-native sound contrast. Journal of Phonetics 52: 183–204. [Google Scholar] [CrossRef] [Green Version]
- Schertz, Jessamyn, Taehong Cho, Andrew J. Lotto, and Natasha Warner. 2016. Individual differences in perceptual adaptability of foreign sound categories. Attention, Perception, and Psychophysics 78: 355–67. [Google Scholar] [CrossRef]
- Schmidt, Anna Marie. 2007. Cross-language consonant identification: English and Korean. In Language Experience in Second Language Speech Learning: In Honor of James Emil Flege. Edited by Ocke-Schwen Bohn and Murray J. Munro. Amsterdam: John Benjamins Publishing, pp. 185–200. [Google Scholar] [CrossRef]
- Sebastián-Gallés, Núria, Carles Soriano-Mas, Cristina Baus, Begoña Díaz, Volker Ressel, Christophe Pallier, Albert Costa, and Jesús Pujol. 2012. Neuroanatomical markers of individual differences in native and non-native vowel perception. Journal of Neurolinguistics 25: 150–62. [Google Scholar] [CrossRef]
- Seoul National University Language Education Institute. 2010. Active Korean 1. Seoul: Munjin Media. [Google Scholar]
- Shahidi, A. H., and Rahim Aman. 2011. An acoustical study of English plosives in word initial position produced by Malays. 3L: The Southeast Asian Journal of English Language Studies 17: 23–33. [Google Scholar]
- Silva, David J. 2006a. Acoustic evidence for the emergence of tonal contrast in contemporary Korean. Phonology 23: 287–308. [Google Scholar] [CrossRef] [Green Version]
- Silva, David J. 2006b. Variation in voice onset time for Korean stops: A case for recent sound change. Korean Linguistics 13: 1–16. [Google Scholar] [CrossRef] [Green Version]
- Skehan, Peter. 1989. Individual Differences in Second-Language Learning. London: Edward Arnold. [Google Scholar]
- Skehan, Peter. 1991. Individual differences in second language learning. Studies in Second Language Acquisition 13: 275–98. [Google Scholar] [CrossRef] [Green Version]
- Skehan, Peter. 1998. A Cognitive Approach to Language Learning. Oxford: Oxford University Press. [Google Scholar]
- Skehan, Peter. 2002. Theorizing and updating aptitude. In Individual Differences and Instructed Language Learning. Edited by Peter Robinson. Amsterdam: John Benjamins Publishing, pp. 69–93. [Google Scholar] [CrossRef]
- Sohn, Ho-Min. 1999. The Korean Language. Cambridge: Cambridge University Press. [Google Scholar]
- Strange, Winifred, Andrea Weber, Erika S. Levy, Valeriy Shafiro, Miwako Hisagi, and Kanae Nishi. 2007. Acoustic variability within and across German, French and American English vowels: Phonetic context effects. Journal of the Acoustical Society of America 122: 1111–29. [Google Scholar] [CrossRef] [PubMed] [Green Version]
- Strange, Winifred. 2011. Automatic selective perception (ASP) of first and second language speech: A working model. Journal of Phonetics 39: 456–66. [Google Scholar] [CrossRef]
- Suomi, Kari, Juhani Toivanen, and Riikka Ylitalo. 2008. Finnish Sound Structure: Phonetics, Phonology, Phonotactics and Prosody. Oulu: Oulu University Press. [Google Scholar]
- Tyler, Michael D., Catherine T. Best, Alice Faber, and Andrea G. Levitt. 2014. Perceptual assimilation and discrimination of non-native vowel contrasts. Phonetica 71: 4–21. [Google Scholar] [CrossRef]
- Verhoeven, Ludo, and Anne Vermeer. 2002. Communicative competence and personality dimensions in first and second language learners. Applied Psycholinguistics 23: 361–474. [Google Scholar] [CrossRef]
- Vokic, Gabriela. 2010. L1 allophones in L2 speech production: The case of English learners of Spanish. Hispania 93: 430–52. [Google Scholar]
- Wanrooij, Karin, Paola Escudero, and Maartje E. J. Raijmakers. 2013. What do listeners learn from exposure to a vowel distribution? An analysis of listening strategies in distributional learning. Journal of Phonetics 41: 307–19. [Google Scholar] [CrossRef]
- Werker, Janet F. 1994. Cross-language speech perception: Development change does not involve loss. In The Development of Speech Perception: The Transition from Speech Sounds to Spoken Words. Edited by Judith C. Goodman and Howard C. Nusbaum. Cambridge: MIT Press, pp. 93–120. [Google Scholar]
- Werker, Janet F. 1995. Age-related changes in cross-language speech perception: Standing at the crossroads. In Speech Perception and Linguistic Experience: Issues in Cross-Language Research. Edited by Winifred Strange. Baltimore: York Press, pp. 155–70. [Google Scholar]
- Werker, Janet F., and Judith E. Pegg. 1992. Infant speech perception and phonological acquisition. In Phonological Development: Models, Research, Implications. Edited by Charles A. Ferguson, Lise Menn and Carol Stoel-Gammon. Timonium: York Press, pp. 285–311. [Google Scholar]
- Werker, Janet F., and Richard C. Tees. 1984. Cross-language speech perception: Evidence for perceptual reorganization during the first year of life. Infant Behavior and Development 7: 49–63. [Google Scholar] [CrossRef]
- Werker, Janet F., and Suzanne Curtin. 2005. PRIMIR: A developmental framework of infant speech processing. Language Learning and Development 1: 197–234. [Google Scholar] [CrossRef]
- White, Lydia. 2003. Second Language Acquisition and Universal Grammar. Cambridge: Cambridge University Press. [Google Scholar]
- Yang, Byunggon. 1992. An acoustical study of Korean monophthongs produced by male and female speakers. Journal of the Acoustical Society of America 91: 2280–83. [Google Scholar] [CrossRef] [PubMed] [Green Version]
- Yoon, Kyuchul, and Soonok Kim. 2015. A comparative study on the male and female vowel formants of the Korean Corpus of Spontaneous Speech. Malsoriwa Eumseong Gwahak [Phonetics and Speech Sciences] 7: 131–38. [Google Scholar] [CrossRef] [Green Version]
- Yoon, Tae-Jin, and Yoonjung Kang. 2014. Monophthong analysis on a large-scale speech corpus of read-style Korean. Malsoriwa Eumseong Gwahak [Phonetics and Speech Sciences] 6: 139–45. [Google Scholar] [CrossRef] [Green Version]
| 1 | To be more specific, the timescale for the ramp-up is hypothesized to correspond to how long it takes to develop phonological knowledge of the target L2, which is likely to differ depending on the L2 as well as the L1 background of the learner (i.e., the particular pattern of phonological alignment between the L1 and L2). However, in general, we believe that the timescale of the ramp-up to high L1 transfer will be short—less than the five-week interval of L2 learning we observed (see Section 2.2)—because, especially in an instructed L2 context, the phonological system of the L2 (at least, the basic phonological inventory) is one of the first aspects of the language to be acquired, supported by learning the orthographic system in the case of alphabetic orthographies. This is why in Figure 1 the ramp-up is represented as a steep, as opposed to a shallow, incline. |
| 2 | A more complex random-effects structure including random slopes was not used in either stage of modelling because models with such a random-effects structure failed to converge or, alternatively, showed signs of overparameterization and/or less stable fit. |
Figure 1.
Schematic of the Transfer Ramp-up Hypothesis, showing L1 transfer over time in L2 development. The dotted part of the curve indicates the pre-ramp-up stage and ramp-up to maximal L1 transfer; the solid part, the post-ramp-up stage of declining L1 transfer.
Figure 1.
Schematic of the Transfer Ramp-up Hypothesis, showing L1 transfer over time in L2 development. The dotted part of the curve indicates the pre-ramp-up stage and ramp-up to maximal L1 transfer; the solid part, the post-ramp-up stage of declining L1 transfer.

Figure 2.
Violin plots showing the probability density of pretest discrimination accuracies (standardized) in each L1 group in (a) the stop study and (b) the vowel study. Superimposed points (jittered along the x-axis) represent individual participants.
Figure 2.
Violin plots showing the probability density of pretest discrimination accuracies (standardized) in each L1 group in (a) the stop study and (b) the vowel study. Superimposed points (jittered along the x-axis) represent individual participants.

Figure 3.
Pretest performance in the stop study (accuracy in oddball discrimination), by L2 laryngeal contrast and L1 group (i.e., VOT type). Error bars indicate SE of the mean over participants; the dotted line marks chance-level performance (20%).
Figure 3.
Pretest performance in the stop study (accuracy in oddball discrimination), by L2 laryngeal contrast and L1 group (i.e., VOT type). Error bars indicate SE of the mean over participants; the dotted line marks chance-level performance (20%).

Figure 4.
Posttest performance in the stop study (accuracy in 10AFC identification), by L2 laryngeal category and L1 group (i.e., VOT type). Error bars indicate SE of the mean over participants; the dotted line marks chance-level performance (10%).
Figure 4.
Posttest performance in the stop study (accuracy in 10AFC identification), by L2 laryngeal category and L1 group (i.e., VOT type). Error bars indicate SE of the mean over participants; the dotted line marks chance-level performance (10%).

Figure 5.
Confusion matrix of errors in the posttest for stop items (vertical = stimuli, horizontal = responses). Each cell shows the percentage of all errors on the given stimulus represented by the given response (rows may not add to 100% due to rounding); the most common error type for each stimulus is bolded. The total number of errors for each stimulus (across all groups) is shown in parentheses.

Figure 6.
Individual posttest accuracy in the stop study by pretest performance, with regression lines (a) over all L1 groups together, and (b) over each L1 group separately. Points are jittered; the shaded areas indicate the 95% confidence interval around the regression line.
Figure 6.
Individual posttest accuracy in the stop study by pretest performance, with regression lines (a) over all L1 groups together, and (b) over each L1 group separately. Points are jittered; the shaded areas indicate the 95% confidence interval around the regression line.

Figure 7.
Pretest performance in the vowel study (accuracy in oddball discrimination), by L2 vowel contrast and L1 group (i.e., vowel inventory type). Error bars indicate SE of the mean over participants; the dotted line marks chance-level performance (20%).
Figure 7.
Pretest performance in the vowel study (accuracy in oddball discrimination), by L2 vowel contrast and L1 group (i.e., vowel inventory type). Error bars indicate SE of the mean over participants; the dotted line marks chance-level performance (20%).

Figure 8.
Posttest performance in the vowel study (accuracy in 6AFC identification), by L2 vowel category and L1 group (i.e., vowel inventory type). Error bars indicate SE of the mean over participants; the dotted line marks chance-level performance (17%).
Figure 8.
Posttest performance in the vowel study (accuracy in 6AFC identification), by L2 vowel category and L1 group (i.e., vowel inventory type). Error bars indicate SE of the mean over participants; the dotted line marks chance-level performance (17%).

Figure 9.
Confusion matrix of errors in the posttest for vowel items (vertical = stimuli, horizontal = responses). Each cell shows the percent of all errors on the given stimulus represented by the given response (rows may not add to 100% due to rounding); the most common error type for each stimulus is bolded. The total number of errors for each stimulus (across all groups) is shown in parentheses.

Figure 10.
Individual posttest accuracy in the vowel study by pretest performance, with regression lines (a) over all L1 groups together, and (b) over each L1 group separately. Points are jittered; the shaded areas indicate the 95% confidence interval around the regression line.
Figure 10.
Individual posttest accuracy in the vowel study by pretest performance, with regression lines (a) over all L1 groups together, and (b) over each L1 group separately. Points are jittered; the shaded areas indicate the 95% confidence interval around the regression line.


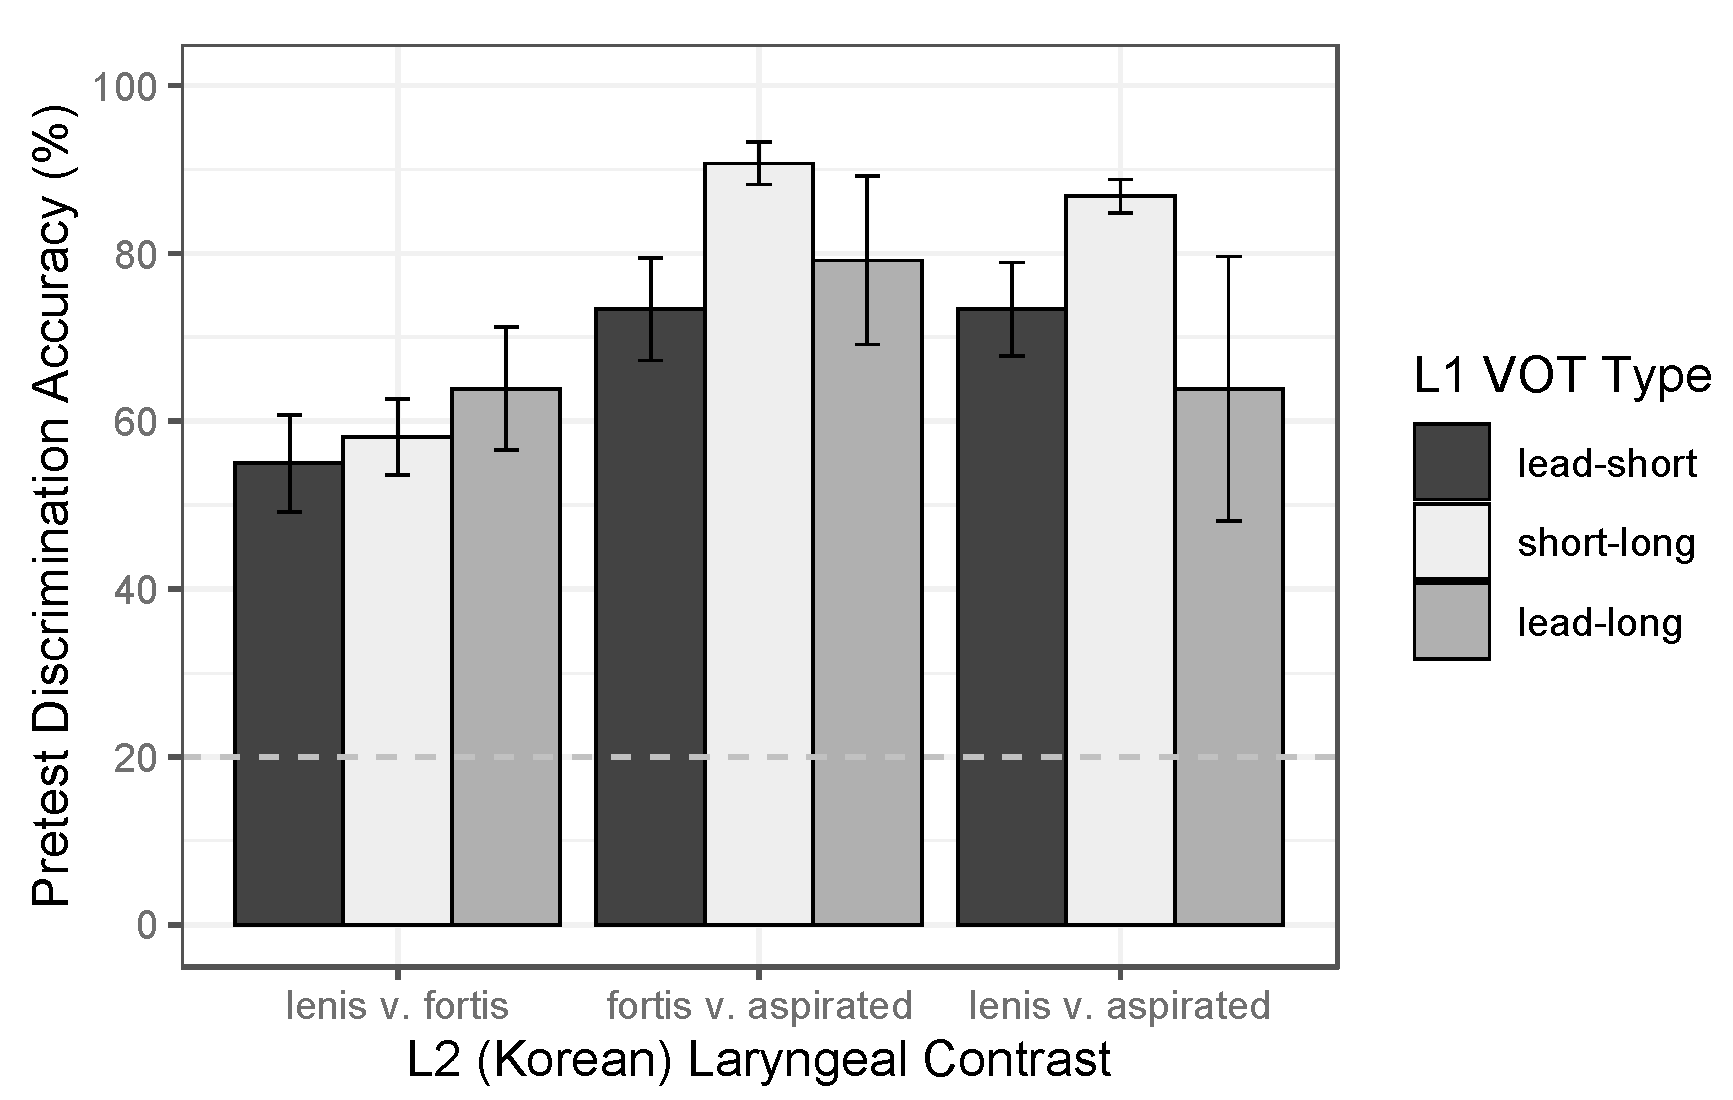
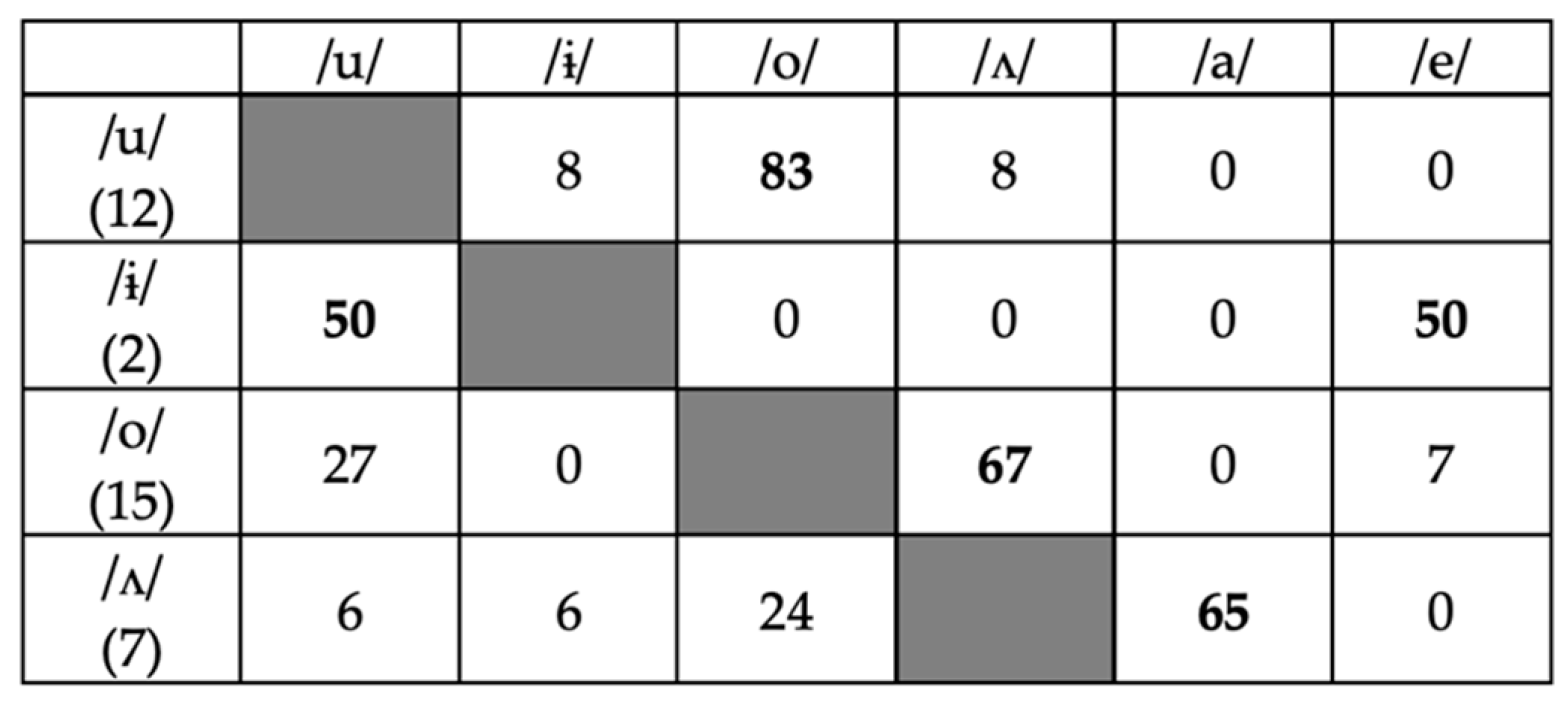
Table 1.
VOT (in ms) of Korean stops as produced by the female model talker in participants’ Korean textbook (Seoul National University Language Education Institute 2010). All measures represent VOT of stops in utterance-initial position before the low vowel /a/.
Table 1.
VOT (in ms) of Korean stops as produced by the female model talker in participants’ Korean textbook (Seoul National University Language Education Institute 2010). All measures represent VOT of stops in utterance-initial position before the low vowel /a/.
| Place of Articulation | Fortis | Lenis | Aspirated |
|---|---|---|---|
| bilabial | 10 | 27 | 92 |
| denti-alveolar | 11 | 34 | 94 |
| velar | 18 | 45 | 122 |
Table 2.
The first three formants (F1, F2, F3) in the target Korean vowels as produced by the female model talker in participants’ Korean textbook (Seoul National University Language Education Institute 2010). All measures are in Hz for vowels produced in isolation.
Table 2.
The first three formants (F1, F2, F3) in the target Korean vowels as produced by the female model talker in participants’ Korean textbook (Seoul National University Language Education Institute 2010). All measures are in Hz for vowels produced in isolation.
| Vowel | F1 | F2 | F3 |
|---|---|---|---|
| /u/ | 367 | 800 | 3149 |
| /ɨ/ | 376 | 1628 | 3056 |
| /o/ | 390 | 821 | 3302 |
| /ʌ/ | 761 | 1113 | 3545 |
Table 3.
Background information on participant groups in the stop study.
| Group (L1 VOT Type) | n | Mage (yr) | L1s Represented |
|---|---|---|---|
| lead-short | 15 (9f, 6m) | 23.5 | Finnish, French, Malay, Portuguese, Slovenian, Spanish |
| short-long | 36 (29f, 7m) | 20.6 | English, Mandarin |
| lead-long | 6 (4f, 2m) | 21.8 | Swedish, Turkish |
Table 4.
Background information on participant groups in the vowel study.
| Group (L1 Inventory Type) | n | Mage (yr) | L1s Represented |
|---|---|---|---|
| no contrast | 26 (21f, 5m) | 22.3 | Finnish, Mandarin, Spanish, Swedish |
| some contrast | 31 (21f, 10m) | 20.8 | English, French, Malay, Portuguese, Slovenian, Turkish |
Table 5.
Fixed-effect coefficients in the final model of pretest stop discrimination [N = 2052, log-likelihood = −958.7]. Significance code: *** p < 0.001.
Table 5.
Fixed-effect coefficients in the final model of pretest stop discrimination [N = 2052, log-likelihood = −958.7]. Significance code: *** p < 0.001.
| Predictor | β | SE | z | p | |
|---|---|---|---|---|---|
| (Intercept) | 0.421 | 0.321 | 1.309 | 0.191 | |
| Contrast: fortis-aspirated | 1.730 | 0.416 | 4.162 | <0.001 | *** |
| Contrast: lenis-aspirated | 1.477 | 0.414 | 3.565 | <0.001 | *** |
Table 6.
Fixed-effect coefficients in the final model of posttest stop identification [N = 1539, log likelihood = −885.7]. Significance codes: * p < 0.05, *** p < 0.001.
Table 6.
Fixed-effect coefficients in the final model of posttest stop identification [N = 1539, log likelihood = −885.7]. Significance codes: * p < 0.05, *** p < 0.001.
| Predictor | β | SE | z | p | |
|---|---|---|---|---|---|
| (Intercept) | 0.630 | 0.346 | 1.822 | 0.069 | |
| Category: fortis | −1.394 | 0.288 | −4.847 | <0.001 | *** |
| Category: aspirated | 0.163 | 0.287 | 0.568 | 0.570 | |
| Group: short-long | 0.617 | 0.414 | 1.492 | 0.136 | |
| Group: lead-long | −0.792 | 0.642 | −1.234 | 0.217 | |
| Category: fortis × Group: short-long | 0.860 | 0.340 | 2.530 | 0.011 | * |
| Category: aspirated × Group: short-long | −0.810 | 0.339 | −2.388 | 0.017 | * |
| Category: fortis × Group: lead-long | −0.310 | 0.583 | −0.532 | 0.594 | |
| Category: aspirated × Group: lead-long | 0.223 | 0.522 | 0.428 | 0.669 |
Table 7.
Fixed-effect coefficients in the final model of posttest vowel identification [N = 684, log-likelihood = −248.0]. Significance codes: * p < 0.05, *** p < 0.001.
Table 7.
Fixed-effect coefficients in the final model of posttest vowel identification [N = 684, log-likelihood = −248.0]. Significance codes: * p < 0.05, *** p < 0.001.
| Predictor | β | SE | z | p | |
|---|---|---|---|---|---|
| (Intercept) | 1.611 | 0.474 | 3.395 | <0.001 | *** |
| Category: /ɨ/ | 2.090 | 0.482 | 4.336 | <0.001 | *** |
| Category: /o/ | −0.276 | 0.333 | −0.829 | 0.407 | |
| Category: /ʌ/ | −0.768 | 0.326 | −2.356 | 0.018 | * |
| Group: some-contrast | 1.210 | 0.579 | 2.091 | 0.037 | * |
Publisher’s Note: MDPI stays neutral with regard to jurisdictional claims in published maps and institutional affiliations. |
© 2020 by the authors. Licensee MDPI, Basel, Switzerland. This article is an open access article distributed under the terms and conditions of the Creative Commons Attribution (CC BY) license (http://creativecommons.org/licenses/by/4.0/).
Share and Cite
MDPI and ACS Style
Chang, C.B.; Kwon, S. The Contributions of Crosslinguistic Influence and Individual Differences to Nonnative Speech Perception. Languages 2020, 5, 49. https://0-doi-org.brum.beds.ac.uk/10.3390/languages5040049
AMA Style
Chang CB, Kwon S. The Contributions of Crosslinguistic Influence and Individual Differences to Nonnative Speech Perception. Languages. 2020; 5(4):49. https://0-doi-org.brum.beds.ac.uk/10.3390/languages5040049
Chicago/Turabian StyleChang, Charles B., and Sungmi Kwon. 2020. "The Contributions of Crosslinguistic Influence and Individual Differences to Nonnative Speech Perception" Languages 5, no. 4: 49. https://0-doi-org.brum.beds.ac.uk/10.3390/languages5040049