
Chronological Incongruences between Mitochondrial and Nuclear Phylogenies of Aedes Mosquitoes


1
Research and Innovation Centre, Fondazione Edmund Mach, 38010 San Michele all Adige (TN), Italy
2
Department of Cellular, Computational and Integrative Biology—CIBIO, University of Trento, 38123 Povo (TN), Italy
3
Center Agriculture Food Environment—C3A, University of Trento, 38010 San Michele all Adige (TN), Italy
*
Author to whom correspondence should be addressed.
Life 2021, 11(3), 181; https://0-doi-org.brum.beds.ac.uk/10.3390/life11030181
Submission received: 15 January 2021
/
Revised: 12 February 2021
/
Accepted: 22 February 2021
/
Published: 25 February 2021
(This article belongs to the Special Issue Molecular Phylogenetics and Mitochondrial Evolution)
Abstract
:One-third of all mosquitoes belong to the Aedini, a tribe comprising common vectors of viral zoonoses such as Aedes aegypti and Aedes albopictus. To improve our understanding of their evolution, we present an updated multigene estimate of Aedini phylogeny and divergence, focusing on the disentanglement between nuclear and mitochondrial phylogenetic signals. We first show that there are some phylogenetic discrepancies between nuclear and mitochondrial markers which may be caused by wrong taxa assignment in samples collections or by some stochastic effect due to small gene samples. We indeed show that the concatenated dataset is model and framework dependent, indicating a general paucity of signal. Our Bayesian calibrated divergence estimates point toward a mosquito radiation in the mid-Jurassic and an Aedes radiation from the mid-Cretaceous on. We observe, however a strong chronological incongruence between mitochondrial and nuclear data, the latter providing divergence times within the Aedini significantly younger than the former. We show that this incongruence is consistent over different datasets and taxon sampling and that may be explained by either peculiar evolutionary event such as different levels of saturation in certain lineages or a past history of hybridization throughout the genus. Overall, our updated picture of Aedini phylogeny, reveal a strong nuclear-mitochondrial incongruence which may be of help in setting the research agenda for future phylogenomic studies of Aedini mosquitoes.
1. Introduction
Mosquitoes (Culicidae) are one of the most successful Diptera radiation. They include more than 3600 species classified in two subfamilies and 44 genera and 145 subgenera [1,2,3]. Because they vector a variety of disease, mosquitoes are still the largest indirect cause of mortality among humans than any other group of organisms. Approximately one-third of mosquito species belong to the tribe Aedini, including 1261 species classified in 10 genera [3]. Aedini species are globally distributed and are vectors of many zoonosis of human and animals including filarial nematodes [4] and many arboviruses such as Chikungunya, Dengue, Zika, Yellow Fever, West Nile [5,6,7]. Aedini species include some of the most invasive and medically relevant mosquitoes: Aedes aegypti and Aedes albopictus [8,9,10,11,12]. Aedes aegypti has mainly spread outside its original African range, although it does not seem capable of settling stable populations in continental climates, such as the European one. Aedes albopictus, originally from South East Asia, is instead now reported from every continent and has quickly settled in Europe, China, and other temperate zones [7,13]. Genome resources exist for only these two species of Aedes [14,15,16], while whole genome data for other invasive Aedes is still lacking. These include Aedes japonicus and Aedes koreicus, which are quickly invading and establishing, respectively, in central Europe [17] and North Italy [18,19] showing competence for the transmission of many arboviruses such as West Nile virus and Zika virus [8,19,20].
Knowledge of the reciprocal affinities of these and other invasive Aedes species and the timing of their evolution is important for various reasons. First, a robust phylogeny is essential to polarize key behavioral and ecological traits, as recently shown by Soghigian et al. [21]. In particular, a phylogeny can identify the sister-species of invasive Aedes of health concern. The sister-species shares a common ancestor with the species of interest (is the closest related in the phylogenetic tree) and is very useful for correctly polarizing evolutionary novelties, such as new genes in phylogenomics and transcriptomics studies [22,23]. Second, phylogenies may help to define taxonomy and classification. A recent classification [1] has raised the number of genera from 10 to 79; the genera, however, have been later reduced to 10 [3]. Molecular investigations of Aedini relationships can help to clarify these taxonomical issues. Third, dated phylogenies help to characterize the paleo-ecological scenario in which mosquito radiations happen, thus providing evidence with clues about their pre-adaptations as it has been shown, for example, in Drosophila [24,25]. Molecular studies have addressed Aedini evolution by studying their phylogeny using both mitochondrial and nuclear markers. While relationships within the Aedini group has been studied in detail using a multimarker approach [21], the origin of the family and their reciprocal affinity with other Culicinae are not well studied, or have not been addressed because datasets were centered only on Aedini [21]. Furthermore, the stability of clades within the Aedini has never been addressed by comparing different statistical frameworks (e.g., maximum likelihood versus Bayesian), or by employing a different model of replacement (e.g., homogeneous versus heterogeneous [26]).
One key aspect so far neglected in Aedini phylogenetic studies is the direct comparison of the phylogenetic signal from the DNA of the two cellular compartments: nuclear (nDNA) and mitochondrial (mtDNA). It has been shown that the nDNA and mtDNA may carry different phylogenetic signal and produce conflicting phylogenies, in some cases, because of hybridization events affecting mtDNA [27]. MtDNA substitution rate is typically faster compared to nuclear one; this can lead toward homoplasy caused by site saturation, which in turns may affect the topology and may underestimate the correct inference of substitution rates [27].
Little in general is known about how mtDNA and nDNA conflict for what concern estimation of divergence times. In some case, chronological signal can be consistent between nuclear and mitochondrial genes, as in fish [28] and amphibians [29], with discrepancy just in the shallow time part of the tree. In Drosophila, the two types of markers recover similar divergences with mtDNA supporting slightly younger estimates than nDNA [24]. In butterflies, the chronological conflict between nDNA and mtDNA is more marked, although it seems to be restricted to a few species experiencing hybridization [30]. In the above cases, the confidence interval of the divergence estimates using the two type of markers largely overlap. Therefore, the conflict is not statistically significant. The molecular clocks of mtDNA and nDNA have never been systematically compared in Aedini.
A systematic comparison of chronological signal in mosquitoes has never been undertaken. An effort to date the Aedini mosquito using nDNA data in a Bayesian framework [31] recovered the origin of Aedini at 157 (Credibility Intervals, CI: 187–124) millions of years ago (MYA) and a Culicidae radiation at 216 (229–192) MYA. A recent effort using a multigene (nDNA + mtDNA) strategy in a maximum likelihood framework [20] recovered an Aedini origin at circa 125 MYA. In the latter, the diversification of A. albopictus from its sister species A. flavopictus is circa 25 MYA, while A. albopictus and A. aegypti common ancestor was set at approximately 55 MYA, a time compatible estimate, but quite distant from that based on whole genomes 71 (44–107) MYA [14]. A recent divergence estimate of Culicinae using complete mtDNA [32] recovered the origin of Aedini at 130 (CI: 101–168) MYA and an A. albopictus-A. aegypti split at circa 67 (CI: 55–94) MYA. There are, therefore, certain discrepancies in available literature for what concerns the timing of Aedini radiation.
This work aims at providing an updated picture of Aedini phylogeny and divergence, by disentangling the phylogenetic signal in available genetic markers. We used four nuclear and four mitochondrial genes in a Bayesian framework to study the evolutionary history of the Aedini, their relationship with other Culicinae, and the timing of their origin and diversification. Our results revealed previously under looked incongruences between nuclear and mitochondrial data, for what concerns both their rate of evolution and their posterior divergence estimates. This has an important implication for our understanding of Aedini evolution and more generally for the long-lasting issue of incongruences between mitochondrial and nuclear data in inferring species phylogeny and divergences.
2. Materials and Methods
2.1. Genes and Taxa Selection
In our study, we employed four mitochondrial coded genes: Cytochrome c oxidase I (COI), Cytochrome c oxidase II (COII), NADH dehydrogenase subunit 4 (NAD4) and 16S, and four nuclear-coded genes: Enolase, Arginine Kinase, 18S, and 28S. We choose these genes after various rounds of literature and blast searches because they were the most evenly distributed through the Aedini tribe and the outgroup. Similarly to other recent Aedes phylogenetic studies [21], the current availability of genes in the database did not allow us to sample more genes. The number of annotated genes in Genebank for Aedes and other mosquitoes species is low, in general no more than 5 or 6 markers per species; many species are characterized by many variants of the same marker for example COI. Annotated genome and transcriptome data was present only for the model organisms Aedes albopictus and Aedes aegypti. We had to exclude from our gene list the genes encoding for white, hunchback, and Carbomoylphosphate synthase (CAD) because poorly sampled within the Culicidae family. We did not employ Internal Transcribed Spacer (ITS) because of poor and ambiguous alignment between Aedini and its outgroups. Since we were interested in studying the origin of Aedini, poor alignment of Aedini ITS sequence with those of the outgroups could have affected the correct inference of their phylogeny. We sampled genes from the same specimen whenever it was possible; in most cases we concatenate genes from different specimens of the same species. This is the common procedure when concatenating genes for inter-specific phylogenetic studies [21,26]. We followed the nomenclature as in [3,33]. For more clarity, in some of our phylogenetic trees, we displayed in brackets the proposed subgenera. Each chosen gene for all the available Aedini taxa was downloaded from GenBank. To reduce missing data and promote a direct comparison between nuclear and mitochondrial data, we selected a species only if at least two genes represented it in each of the two types of markers (nuclear and mitochondrial). Moreover, we excluded species that seemed to be ambiguously labelled. The final dataset finally was represented by 34 evenly phylogenetically distributed Aedini, plus 10 outgroups sampled from other Culicinae, Anopheline, and other Diptera samples (see Table S1 for the species list). The outgroup sequences were essential to root the Aedini phylogeny and to generate nodes for calibrating the molecular clock. For each of the eight markers, we filtered out ambiguous sequence. We used a fast bootstrap RaxML (see details below) to preliminarily check if sequences were clustering within their expected group (e.g., sequences for Aedini to form a monophyletic Aedini group). Sequence clustering to a different group considered unreliable and was excluded from downstream analysis.
2.2. Alignments and Phylogenetic Analyses
We aligned each of the eight genes independently. We aligned protein-coding genes using MAFFT through TranslatorX [34], and non-coding genes using MAFFT directly [35]. Finally, the genes were concatenated using FASconCAT [36] and manually edited to detect a few misaligned sites. We generated three aligned datasets: nuclear, mitochondrial, and concatenated. The nuclear dataset (nDNA) is composed of the concatenation of Enolase, Arginine Kinase, 18S, and 28S; it is 3270 nucleotides (nt) in length. The mitochondrial dataset (mtDNA) is composed of the concatenation of COI, COII, NAD4, and 16S; it is 4224 nt in length. The third dataset (concatenated) is the concatenation of nDNA and mtDNA and is 7494 nt in length. To further study Aedini relationships, we generated a fifth dataset based on the original 6298 nt alignment of [21], increasing site occupancy by using Gblocks at default parameters. The final dataset (named Soghigian) was composed of 71 sequences and 3815 nt with 8% of missing data. Although there is some overlap of genes between concatenated and Soghigian datasets, they substantially differ because of the presence of 4 genes (COII, NAD4, and 16S present in concatenated, while ITS is absent from concatenated) and mostly because of a very different taxon sampling. The concatenated dataset contains various outgroup to the Aedini because the aim was to set the origin of Aedini. Phylogenetic analyses were performed mainly at the nucleotide level using both maximum likelihood (ML) and Bayesian statistical frameworks, using, respectively, RAxML [37] and PhyloBayes [38] or BEAST (see below). The RAxML analyses were performed on all datasets using the General Time Reversible (GTR) replacement model plus four discrete rate categories of gamma (G) and employing 100 bootstrap replicates. PhyloBayes analyses were performed using the same model and repeated using the heterogeneous CAT (plus G) replacement model.
2.3. Divergence Estimates
BEAST v2.5 was used to reconstruct phylogenies and to estimate divergence times [39]. We use BEAUti to set the analyses using the following prior information to calibrate the clock. We employed a root prior based on the fruit fly-mosquito split using a normal distribution with mean 260 MYA and a 95% prior distribution to be between 296 and 238 MYA, as indicated by [40]. We employed three minimum calibration points for the diversification of Anophelinae, Culicinae, and Culicidae, using, respectively, 34 MYA, 34 MYA, and 99 MYA, according to the three oldest fossils known for each of these groups [41,42]. These calibrations were used for the mtDNA, nDNA, and concatenated datasets. We run BEAST using a different set of (model) priors and choose the most fitting combination of priors using the Harmonic mean, the Akaike Information Criterion (AICm), the stepping stone (SS), and the Path sampling (PS); for the latter, we used the Path sampler package and set the analysis at 50% burn-in with 40 steps of 500,000 chain length. All other chains were run for 100,000,000 generations until Beast log files indicated proper convergences of all posteriors and the likelihood using tracer1.7 [43]. Divergence estimates in PhyloBayes [38] where done using the same calibration priors described above, a CAT plus Gamma replacement model and a LogNormal relaxed clock.
3. Results
3.1. Conflicts between Nuclear and Mitochondrial Phylogenies
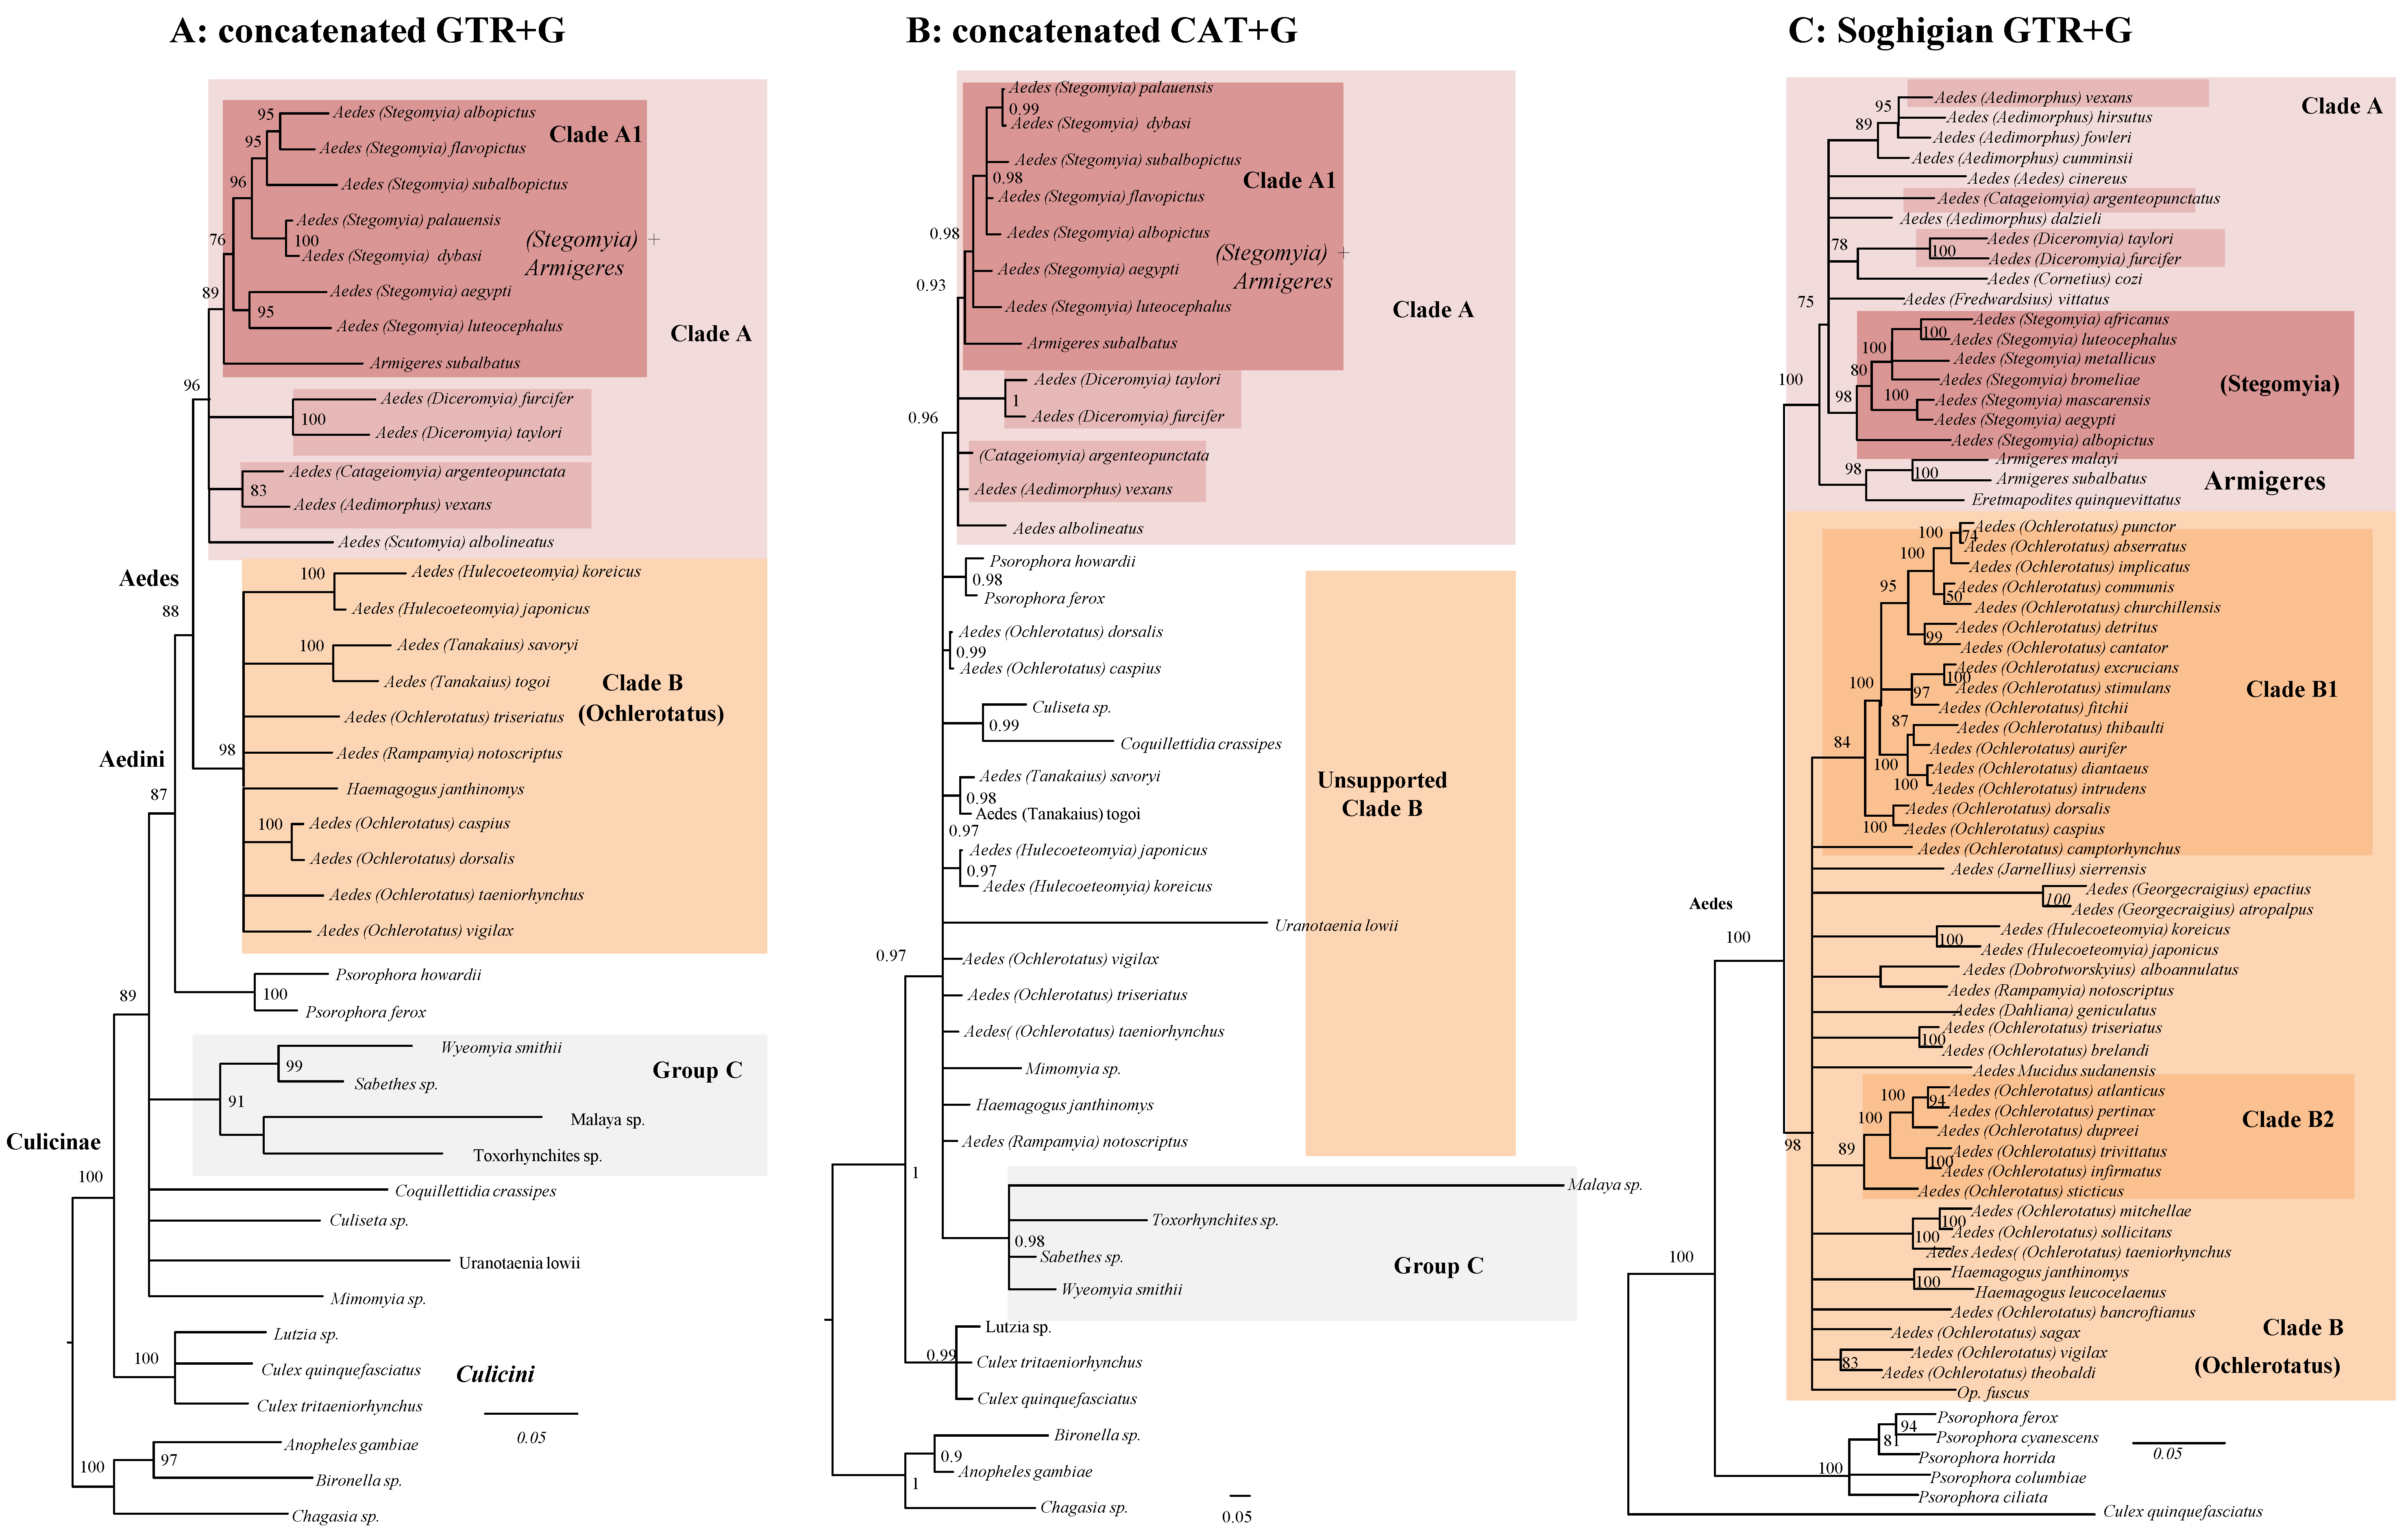
Bayesian inference of the eight concatenated genes dataset under a homogeneous replacement model (GTR, Figure 1A) reveals a generally well-supported tree with the Aedes genus divided into two distinct clades as in [21]: Clade A (in pink, Posterior Probability (PP): 1.00) comprises various species including A. albopictus and A. aegypti; Clade B (in orange, PP: 1.00) comprises various species often regarded as Ochlerotatus plus others referred to as Aedes such as A. koreicus. Species of the Psorophora genus are the sister of Clade A + Clade B (PP: 1.00). Within Clade A we observed two groups (dark pink), one consisting of species attributed to Stegomya + Armigeres (clade A1, PP: 1:00), the second containing four genera (Aedimorphus, Catageiomyia, Diceromyia, and Scutomyia; PP: 0.92). The mutual relationship of no-Aedini Culicinae is instead unresolved (PP: 0.48); four genera (Sabethes, Wyeomyia, Malaya, and Toxorhynchites) form however a robustly supported (PP: 1.00) group, which we have provisionally named Group C.
Our concatenated analysis of Figure 1A recovers, at least for most nodes, a robust topology. One of the aims of our study was, however, to disentangle the phylogenetic signal for the Aedini by exploring its consistency over different data types and methodological treatments. We, therefore, analyzed the nDNA and mtDNA datasets separately (respectively, Figure 1B,C), and reveal various instances of mitochondrial-nuclear incongruence. Overall, both trees are less resolved than the concatenated tree (for example, they both do not support Group C nor Group A2), pointing toward the utility of concatenating genes. The nuclear tree is, however, markedly more resolved (it has overall higher supports at nodes) than the mitochondrial one. It does support, for example, the monophyly of Aedes and both Groups A and B (all with PP > 0.9), while mtDNA dataset does not support them. These differences may be explained by less phylogenetic signal in the mtDNA dataset. This is, however, not related to fewer nucleotide positions as the mtDNA alignment is larger than the nDNA one (4224 nt vs. 3270 nt). We identify some interesting cases of well-supported incongruences between the nDNA and the mtDNA trees involving A. albolineatus, A. subalbopictus, and Toxorhynchites sp (depicted by arrows in Figure 1B,C). There are various topological incongruences, for example for the position of A. subalbopictus, the two Psorophora and Uranotaenia lowii, but their affinities did not receive high PP in at least one of the two trees, therefore they are not considered statistically significant.
3.2. A Conservative Picture of Aedini and Other Culicinae Phylogeny
To explore in more detail the phylogenetic signal behind our Bayesian trees of Figure 1, we further performed phylogenetic analyses employing different statistical frameworks, different model of replacement, and type of datasets (Figure 2). In panel A we depict the result of a Maximum Likelihood (ML) analysis of the concatenated dataset. In panel B is the same dataset analyzed in a Bayesian framework using an among-site heterogeneous CAT model more suitable for ancient radiations and saturated datasets [44].
In panel C is the ML analysis of a dataset (named Soghigian) centered on Aedini and derived from [21]. To provide a conservative picture of Aedini phylogeny, we have collapsed a node if its bootstrap support (BS) from the Maximum Likelihood (ML) analysis was lower than 75% and if its posterior probability (PP) from Bayesian analysis was lower than 0.9. We found a consistent signal (compare Figure 1A with Figure 2A,B) for a group of Sabethes, Wyeomyia, and Malaya (Sabethini tribe), plus Toxorhynchites (Toxorhynchitini tribe) which we have provisionally named Group C. This group is monophyletic using both homogeneous and heterogeneous models of evolution, but its internal relationships, as well as its relative affinity with other Aedini, is inconsistent over different analyses and in general not significantly supported. This group is not consistent with a previous multigene phylogeny, which supports Toxorhynchites as closely related to Mymoyia than to the Sabethini [31]. Although highly supported in all our concatenated analyses, we advocate caution in considering the validity of Group C, as our analyses may have been biased by an unfortunate combination of reduced taxon and gene sampling; indeed, in most analyses, Toxorhynchites is the sister taxa of Mymoyia, therefore disrupting the monophyly of Sabethini. Our investigations are instead congruent with previous studies [20] in supporting Group A, and to a lesser extent Group A1 (Stegomya + Armigeres). Group B is instead supported only by the homogeneous GTR model of evolution. Site heterogeneous models of replacement such as CAT have been repeatedly shown as being capable of reducing systematic errors [45]; we cannot, therefore, exclude that the signal responsible for Group B is artefactual and we advocate care in considering it as monophyletic. From a systematic point of view, our phylogenies support the classical 10 genera classification of Aedini [2,20]. Overall, while some nodes are robustly supported in all analyses of Figure 2 (for example, Group A), other nodes are poorly supported or are supported only in one analysis.
3.3. Divergence Estimates of the Aedini
To define which evolutionary models better describe the radiation of mosquito in our concatenated dataset, we contrasted the strict clock versus the log-normal relaxed clock models, the coalescent versus the speciation model, and the HKY versus the GTR replacement model (Table 1). A relaxed clock is favoured over the strict clock. Furthermore, under the relaxed clock, the coefficient of variation rate was approximately 0.4 for the mitochondrial data and roughly 1 for the nuclear, further indicating that an uncorrelated clock hypothesis suits better our datasets than a strict clock. This is because if a log-normal clock has a coefficient of variation close to 0, it could be considered clock-like, so comparable with a strict clock [46]. Demographic speciation models are more supported than Coalescent model, but the stepping stone and path sampling could not discriminate between a Yule and a Birth Death model; we chose the Yule model because it was favoured by the AICm, which penalizes based on the number of free parameters. The two models provided nevertheless with similar results (Table 1). Therefore, we used a combination of GTR+G, relaxed log-normal, and Yule models for our clock analyses.
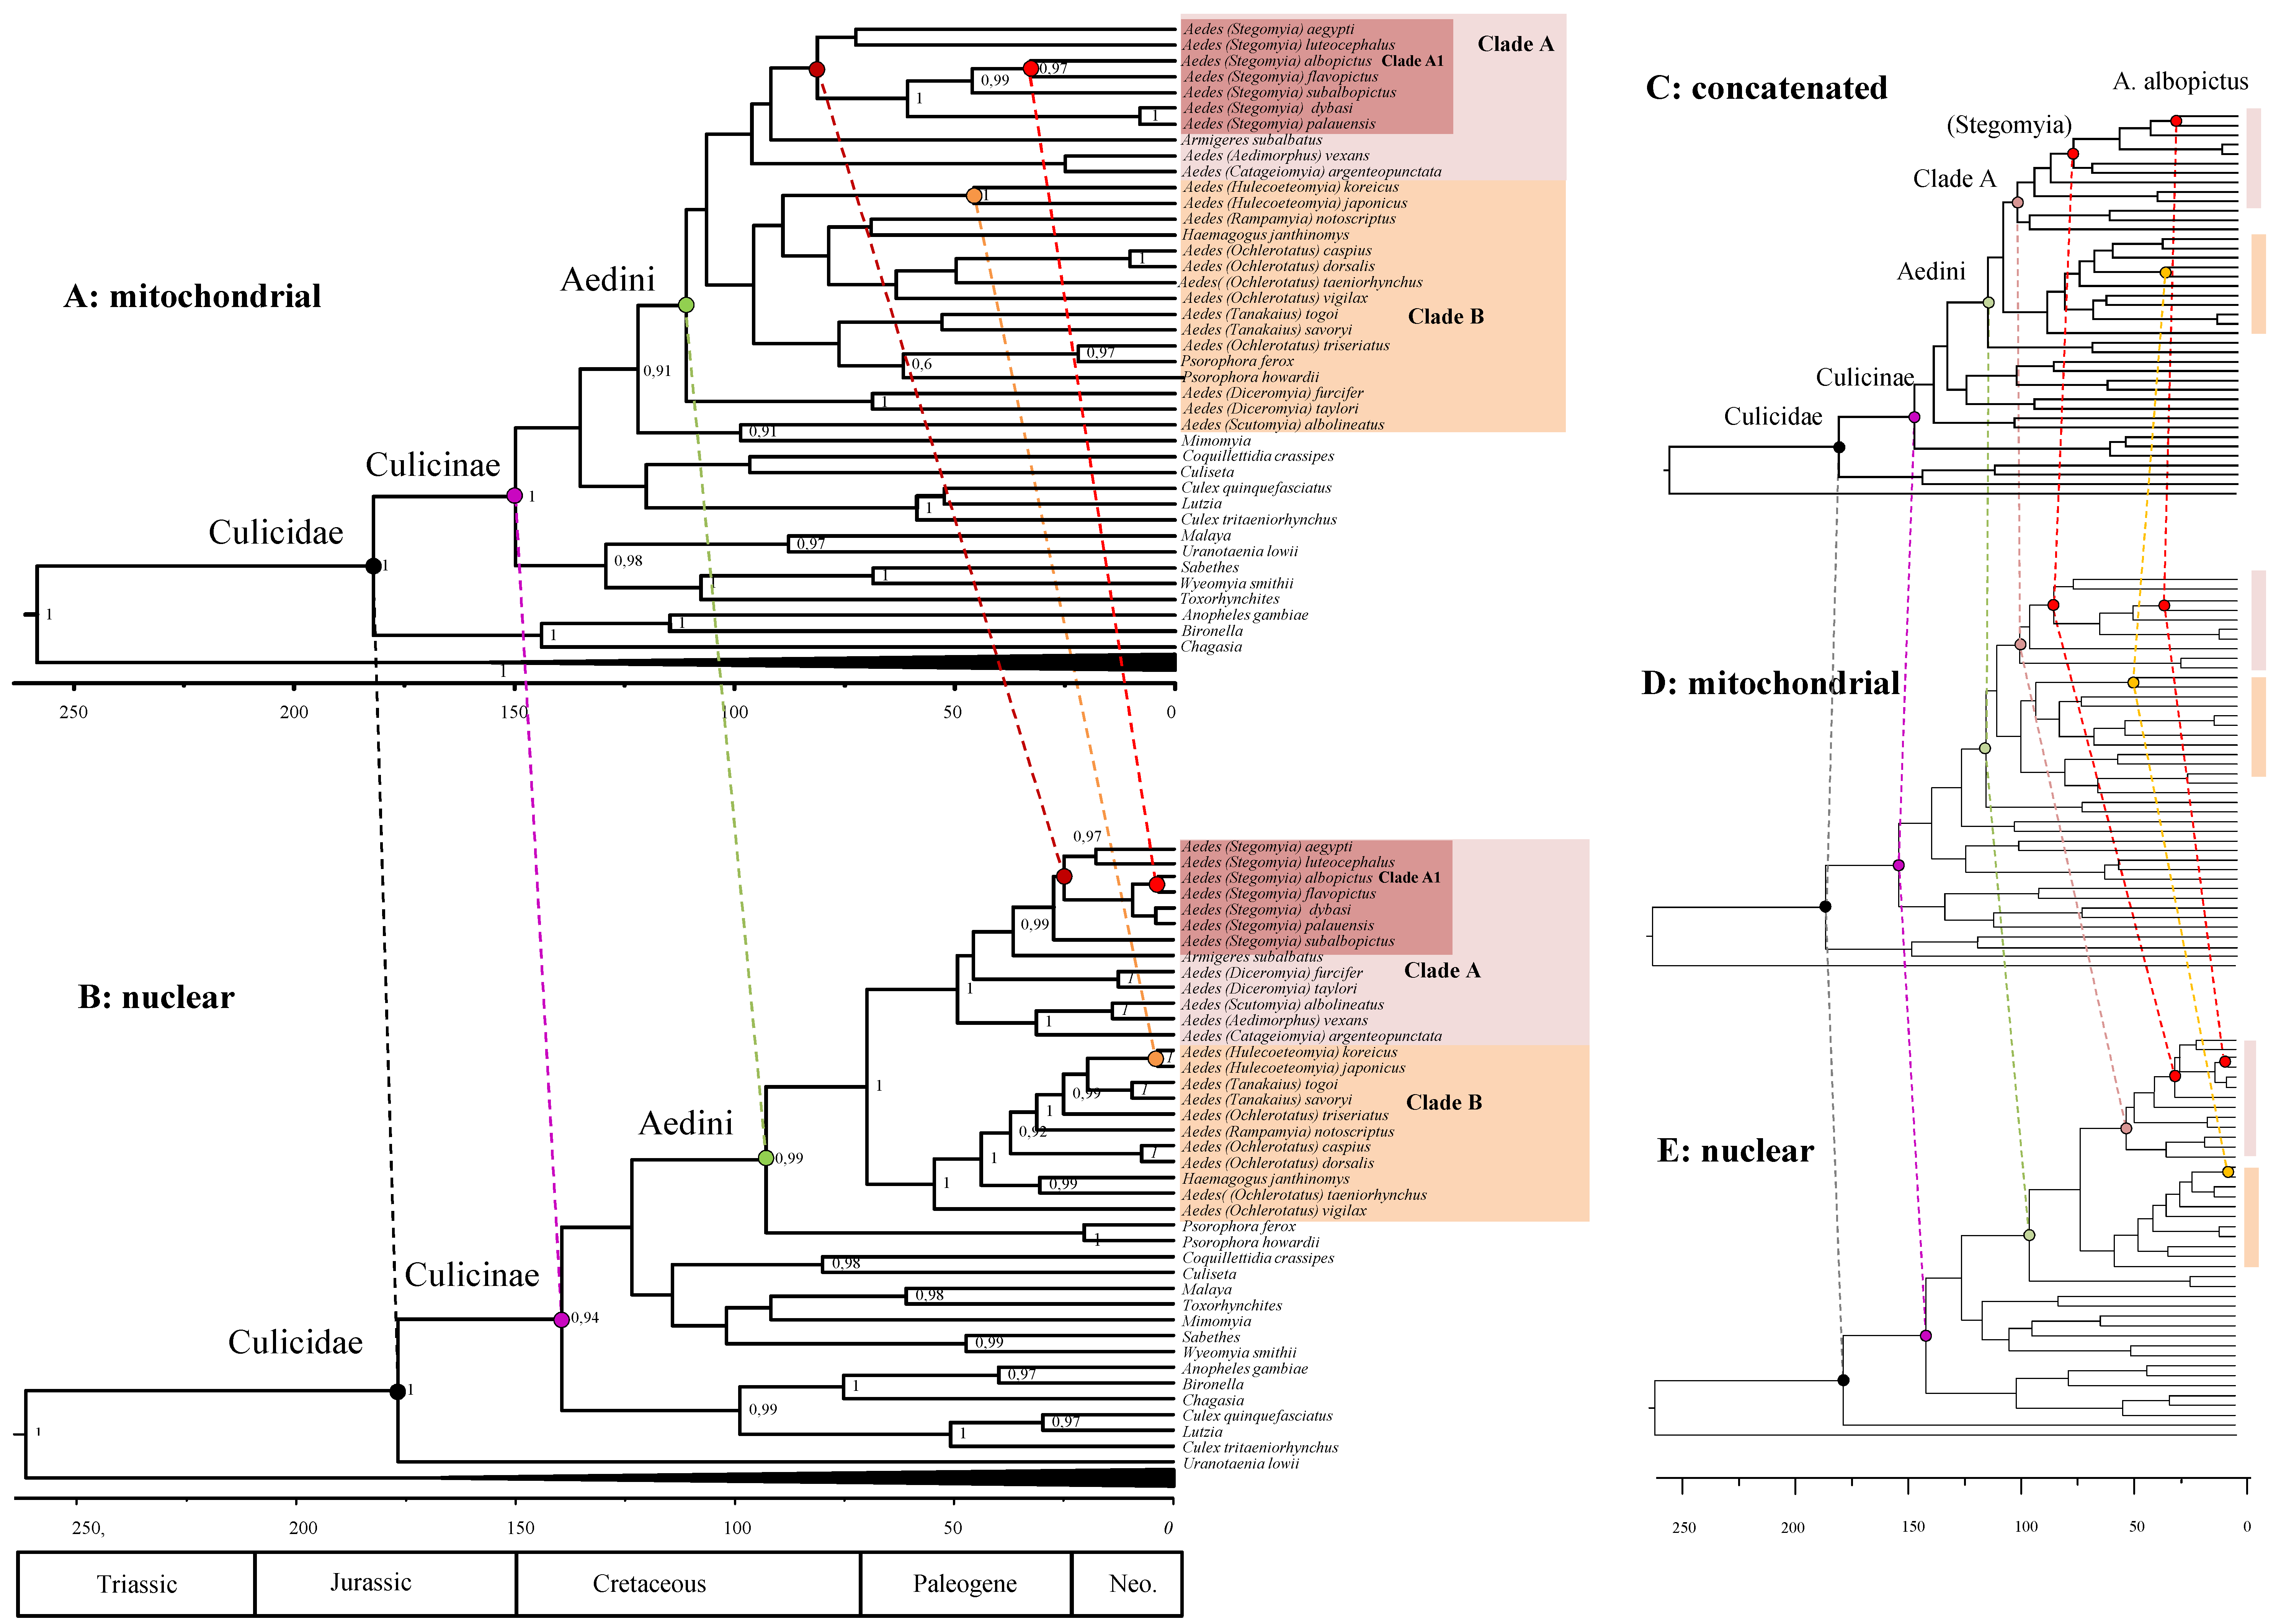
Our analysis of the concatenated dataset using the most fitting models, allows us to obtain a picture of Aedini evolutionary history, which we have contrasted with the appearance of some major vertebrate lineages and flowering plants in Figure 3. According to our posterior estimates, the mosquito family (Culicidae) diversified in its two subfamilies—Culicinae and Anophelinae—approximately 180 MYA (95% High Posterior Densities, HPD 137–228 MYA) in the lower Jurassic. The earliest fossil of a Chaoboridae, the Culicidae sister group, is 187 MYA [42]. This would suggest a very rapid diversification of Culicomorpha. Our estimates tend to match the proposed origin of angiosperm [47]; however their evolutionary history is not clear yet, and the origin of angiosperm could be older than expected [48]. Culicinae diversified in two clades (Culicini and the clade leading to Aedini) between the end of the Jurassic and the early Cretaceous, at 146 (108–182) MYA, while the Aedini tribe diversify at 113 (83–143) MYA with the split of Aedes from Psorophora genus. Within Aedini, Clade A, and Clade B originated circa 106 (77–133) MYA. Within Clade A, the subgenus Stegomya (which includes model organisms A. albopictus and A. aegypti) originated 84 (58–109) MYA, concomitantly with the diversification of Clade B (which include the subgenus Ochlerotatus) at 86 (61–111) MYA in the late Cretaceous. To test for the effect of outgroup on our dated phylogenies, we repeated the analysis of our concatenated alignment, excluding Brachycera outgroup. This additional analysis shows that the calibration point drives our divergence estimates at the root. The median height is younger without outgroups, although the two analyses are compatible for what concerns their (overlapping) 95% HPD (Table 2). The rooted tree provided more precise estimates. The 95% HPD is smaller in the root-calibrated phylogeny then in the unrooted one. Overall, our date estimates tend to be slightly younger than the ones provided previously [14,21,31] for what concern the origin of Culicinae, but slightly older for what concern the origin of Aedini (see Table 2).
3.4. Chronological Incongruences between Nuclear and Mitochondrial Data
Clock analysis using separately nuclear and mitochondrial genes (Figure 4) revealed unexpected strong incongruences. The estimates for the origin of the main mosquito clades (deep nodes of the phylogeny) are similar using the two datasets and reinforce our findings using the concatenated data of Figure 3. For example, Culicinae originated in the early Jurassic and Aedini in the Cretaceous both in the mtDNA and nDNA. However, there is a strong discrepancy for what concerns the diversifications within the Aedini lineages. For example, Group A diversified during the Cretaceous using mitochondrial (and also concatenated) data, but is much younger (Paleogene) using nuclear data (Table 2 for details). Even more discrepant is the origin of Aedes species: A. aegypti and A. albopictus split ranges from 81 (61–101) MYA using mitochondrial data, to 30 (15–45) MYA, using nuclear data; the split between A. albopictus and A. flavopictus is 32 (20–47) MYA using mitochondrial data and just 4 (0.5–11) MYA using nuclear data. Worryingly, those estimates do not overlap at their confidence interval. From a statistical point of view, this indicates that the two datasets reject each other. Overall, the estimates from the concatenated dataset are more similar to those of the mtDNA dataset then the nDNA dataset (Figure 4C–E).
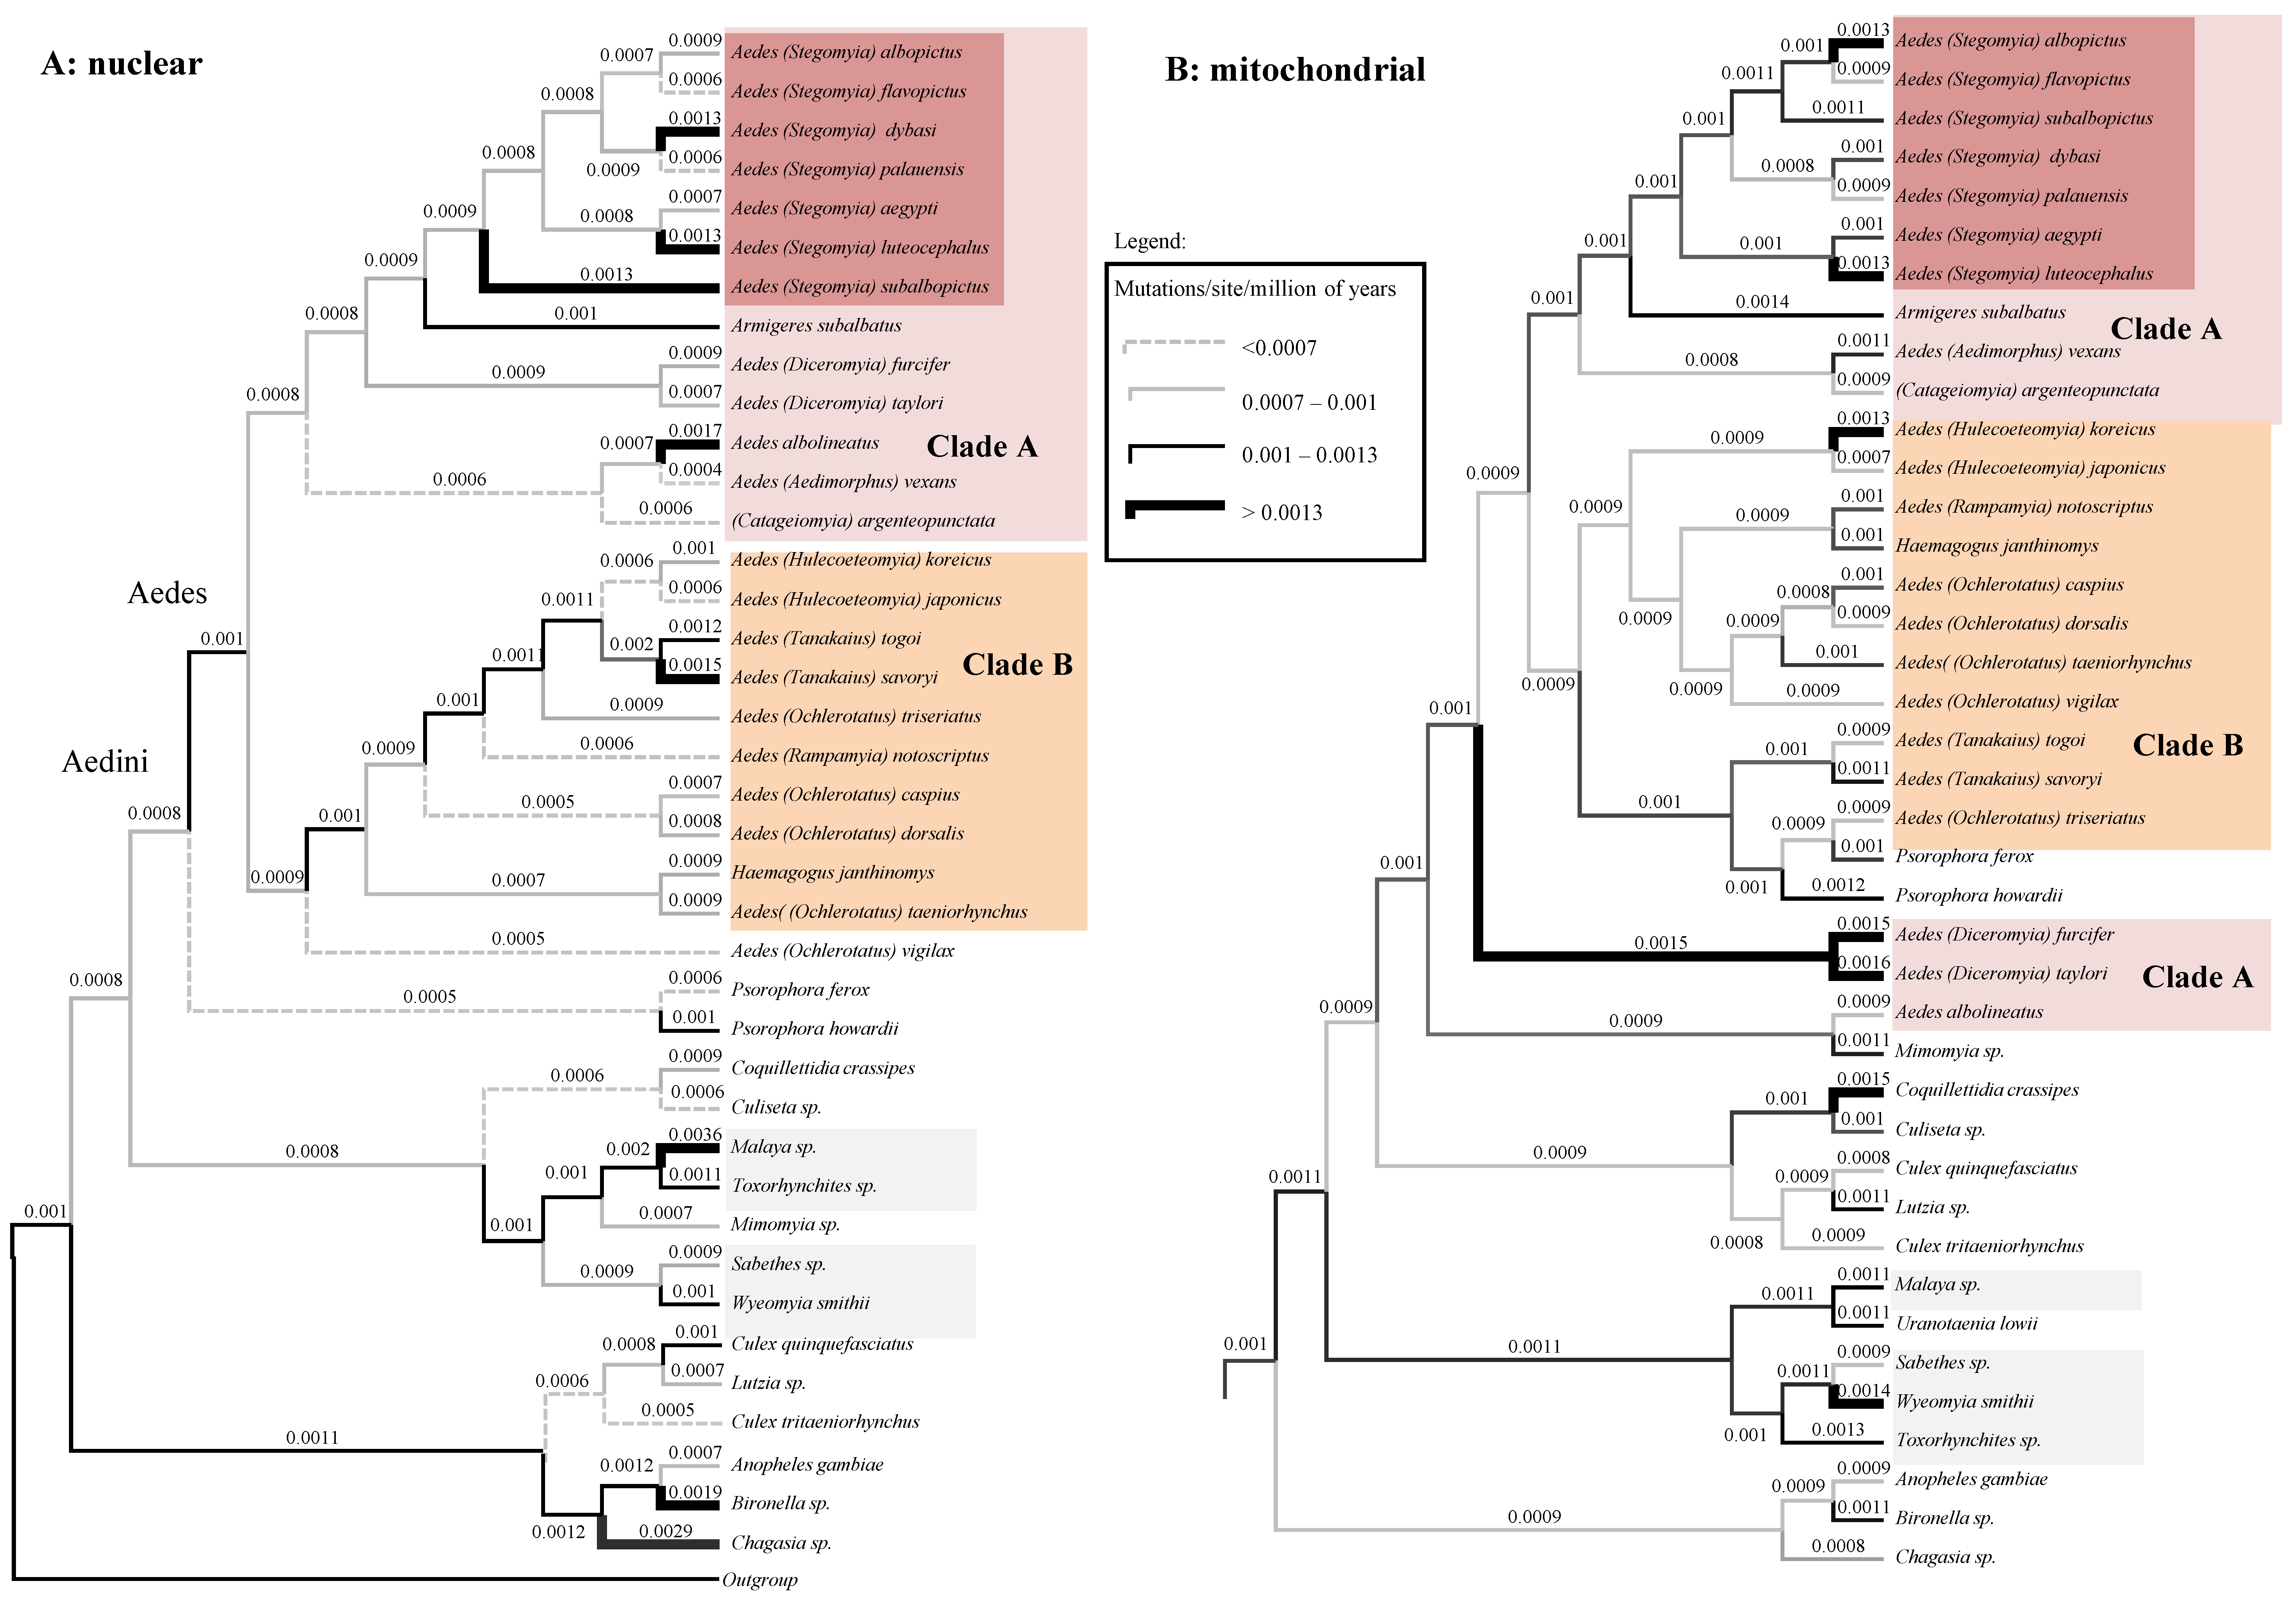
We further inspected the posterior rates of both the nDNA and the mtDNA trees (Figure 5A,B, respectively; tree topologies are similar to those of Figure 1B,C). Additionally, in the case of rates there are various discrepancies between the two datasets: A. furcifer and A. taylori are, for example, fast-evolving according to mtDNA, but slow evolving using nDNA. These high rates are likely responsible for the dubious position of these two species in the mtDNA tree of Figure 5B. Our clock analyses returned mean posterior evolutionary rate (calculated over the whole tree) of 1.01 × 10⁻³ (sd = 1.12 × 10⁻⁴) mutation per site per millions of years (msm) for the mtDNA and of 9.93 × 10⁻⁴ msm (sd = 1.8 × 10⁻⁴) for the nDNA.
3.5. Mitochondrial-Nuclear Chronological Incongruences Are Consistent over Different Analytical Condition
We tested the robustness of the chronological incongruence observed between mitochondrial and nuclear data (Figure 4) by verifying if the results are biased by the taxon sampling and the number of gaps in our alignments. We first repeated the clock analyses using a reduced version of our dataset. We excluded three species (Chagasia, Uranotenia, Aedes albolineatus) which had an extremely different branching position in the phylogeny of the nDNA and mtDNA analysis. Results are very similar compared to when using the full dataset for what concerns both the divergence estimates (Figure S5) and the average mutation rate at branches (Figure S6). This indicates that the chronological discrepancy is not due to the presence of rough taxa in the dataset. We then tested if the pattern we observe is due to a particular taxon and site sampling by repeating the analyses using a different dataset. We inferred divergence estimates using separately the nuclear and mitochondrial partitions of the Soghigian alignment, derived from [21] and previously used for Figure 1C. This dataset is characterized by a different taxon representation compared to our dataset (it is centred on Aedes and contains few outgroups) and by a higher site representation (contains a lower amount of missing data, see methods for details). Results (Figure S7) provide a similar picture to when using our nDNA and mtDNA. Divergences closer to the root are similar, but those within Aedes, including the diversification of Clade A and Clade B are very different. This indicates that the chronological discrepancy is not due to peculiar taxon or gene sampling nor is affected by the amount of missing data in the datasets.
Because of its higher mutation rate, MtDNA is, in general, more prone to saturation than the nuclear genome [49]. Accordingly, we would expect to underestimate the number of observed mutations in mtDNA dataset compared to the nDNA one with the consequences that nodes using mtDNA dataset should appear younger than they are. We observe, however, exactly the opposite. Saturation and heterogeneity of the replacement pattern may have nevertheless played a certain role in overestimating the mitochondrial age in our mitochondrial phylogeny. We therefore tested our datasets for saturation by inferring divergences under the CAT model, a mixture model known to be less sensitive to systematic error in the presence of site-specific saturations [45]. The CAT trees are indeed slightly different than those obtained using homogeneous models of replacement (Figure S8). The divergences become more similar between the two datasets, but the nDNA dataset consistently return younger age for recent nodes compared to the mtDNA dataset. We conclude that site heterogeneity is only partially responsible for the mitochondrial–nuclear chronological discrepancy.
4. Discussion
Our phylogeny of Aedini using a concatenated dataset of eight mtDNA and nDNA markers (Figure 1A) recovers, at least for most nodes, a robustly supported tree topology. Our comparison of mtDNA and nDNA datasets revealed however some unexpected highly supported phylogenetic discrepancies (Figure 1B,C). We suggest three explanations for these incongruences. The first is wrong taxonomic assignment during field collection. Accordingly, one or more genes for some species may come from another (similar and mistaken for) species creating conflicting phylogenetic signal and wrong tree topology. Another, in our opinion less likely, explanation involves complex evolutionary events, such as past hybridization between species, which have resulted in different inheritance patterns for either the mtDNA or some regions of the nDNA. The final explanation is the stochasticity embedded in small (four genes) datasets, such as the ones we have used. The stochasticity in the mtDNA tree may have been exacerbated by systematic errors related to the fast-evolving nature of the mtDNA [49,50] and to evident high level of apomorphies, as revealed by the longer terminal branches in the mtDNA tree compared with the nDNA one. The different phylogenetic signal, however, does not seem to relate to the amount of missing data as the mitochondrial alignment is more complete than the nuclear one (38% of missing data in mtDNA vs. 45% in nDNA). Whatever the source of the topological discrepancies between datasets, our result point toward the limitation of a PCR-scaled approach for Aedini phylogeny and point toward future studies based on whole mtDNA and genome-scaled nDNA dataset. Indeed, undetected stochastic and systematic type of errors may also affect the concatenated dataset, as we have shown that the phylogenetic signal is unstable at many nodes when employing different replacement models and statistical frameworks (Figure 2B and Figure S4). In particular, the poor support using heterogeneous models may be due to the ability of this model to detect saturated or fast-evolving sites [45]. Under this scenario, the highly supported Clade B when using homogeneous GTR model (Figure 1A and Figure 2A) may be the result of a systematic error. The various phylogenetic incongruences we observe using different replacement models (Figure 2A,B) reinforce what we have found when comparing nuclear and mitochondrial data. They alert us of possible systematic and stochastic errors. We advocate to adopt a cautious, conservative way in interpreting our (but also other available [21,31]) trees of the Aedini based on few genetic makers, as seemingly high supports (as in our Figure 1A) are not consistent over data type (Figure 1B,C and Figure 2C), method of inference (Figure 2A) or replacement model (Figure 2B). In perspective, our data indicate that the phylogeny of Aedini should be resolved with confidence only using a genome-scaled nuclear and a complete mtDNA dataset as done in other dipteran studies [24].
Our divergence estimates using both the concatenated and the mtDNA and nDNA datasets (Figure 3 and Figure 4) are concordant in indicating that mosquito radiated from the mid-Jurassic on and that Aedini radiation started in the mid-Cretaceous, quite concomitant with the origin and the earliest diversifications of mammals first, and later birds during the Cretaceous. We cautiously speculate that there may have been a general history of co-radiation (the available data do not provide enough evidence to advocate co-evolution) between the Aedini and warm-blooded vertebrates. In support of this hypothesis, the Aedini group has a specific preference for mammals and birds [51]. The fact that a relaxed clock better fits our Aedini concatenated dataset is not surprising considering that a large variety of ecologically characterizes mosquitoes and demographic habits [21], which can be responsible for different generation times and therefore different branch rates [24]. The mean posterior rate for the mtDNA dataset is 1.01 × 10⁻³ msm, higher than the 9.93 × 10⁻⁴ msm estimated for the nuclear genes. The higher mutation rate of mitochondrial genes is expected as the mtDNA is well known to evolve faster than the nuclear genome in animals [52]. Our mean mtDNA rate estimates are, however, circa one order of magnitude smaller than the mitochondrial COI rate of coleopterans (1.17 × 10⁻² msm) inferred by Papadopoulou et al. [53]. This can be explained by different timespan between the latter and our dataset. Indeed, shallow phylogenetic studies consistently provide with faster evolutionary rate than deep phylogenies [54,55]. Our nuclear rate estimates are in line instead with those inferred over long phylogenetic distances using Ecdysozoa nuclear data (mean 1.01 × 10⁻³ msm, [56], but lower than those based on mitochondrial Drosophila data (7.9 × 10⁻³) [24]; this indicates that mosquitoes may have been characterized during their radiation by an overall smaller number of generations per year compared to Drosophila. We found that the nDNA data of most lineages within Clade A evolves faster than in the lineages of Clade B; this patter is less marked, but conserved in the mtDNA data (Figure 5). A possible explanation for this pattern is that species of Clade A have in general more generation per year than those of Clade B. The two important invasive Aedes species, A. albopictus, and A. koreicus are characterized by markedly higher replacement rate if compared with their respective sister species, A. flavopictus and A. japonicus; this pattern can be observed for both mitochondrial and nuclear data. Assuming that the instantaneous mutation rate is conserved within the genus, this result suggests that A. albopictus and A. koreicus are characterized by a higher number of generations per years compared to other closely related Aedes, a hypothesis which may at least partially explain their high invasive potential.
Our analyses revealed a consistent chronological incongruence between the phylogenetic signal of nuclear and mitochondrial genes. mtDNA provides divergence times within Aedini significantly older than nDNA. Previous clock studies in insects have shown poor [24] to moderate [30,57] incongruence between nuclear and mitochondrial data. In these analyses mitochondrial and nuclear estimates, although different, were overlapping for what concerns their 95% HPD. In our phylogenies, the 95% HPD do not overlap, indicating a statistically significant incongruence. We have shown that these incongruences do not depend on rough taxa (compare Figure 4 and Figure S5), nor on-site occupancy and gene sampling (compare with Figure S7), although there is a mitigation of the discrepancies when using a heterogeneous model of replacement (compare with Figure S8). We conclude that the mtDNA–nDNA chronological incongruence in Aedini data does not depend on analytical conditions, although the correct interpretation of saturation in both datasets, particularly the mtDNA one may play a certain role. Based on our results, we cannot exclude that there may have been a long history of multiple hybridization events within Aedes species which have affected the mitochondrial genome differently than the nuclear one. Indeed, complex phylogenetic signal due to multiple hybridization events has been recently shown in the Anopheles mosquitos [58,59]. The observed discrepancies prevent from drawing a conclusion on the actual timing of diversification of model organisms such as A. albopictus whose mean split from sister species A. flavopictus may dramatically range from 32 MYA using mitochondrial to just 4 MYA using nuclear data. On the light of these results, we advocate that future research should concentrate on determining the biological (or methodological) reason of this discrepancy by comparing timetrees from whole mtDNA genomes with those from genome-scaled sampling of nuclear genes.
In conclusion, we have provided here a detailed analysis of the phylogenetic and chronological signal in currently available nuclear and mitochondrial genes of the Aedini. Overall, our data point toward the limitation of a multigene PCR-scaled approach for Aedini phylogeny and indicate that future research should be based on genome scaled data. Probably our most interesting finding is the strong chronological incongruence between the nuclear and the mitochondrial data. We could exclude various possible misleading factors such as taxa assignment, missing data, and saturation (Figures S5–S7), but could not ultimately test a stochastic effect related to using only eight genes. This is because at present there is not enough data in databases to build a taxon-rich genome-scaled dataset centred on Aedini. The incongruences we have identified do not currently allow defining the exact timing of evolution of important model organisms, such as A. aegypti and A. albopictus [60]. We advocate that these chronological incongruences should be investigated in future by comparing whole mitogenomes with genome-scaled nuclear data as we have done for example, in Drosophila [30].
Supplementary Materials
The following are available online at https://0-www-mdpi-com.brum.beds.ac.uk/2075-1729/11/3/181/s1.
Author Contributions
O.R.-S. designed the study. N.Z. and O.R.-S. performed phylogenetic and molecular clock analyses, O.R.-S., N.Z. and A.R. interpreted the results, O.R.-S. and N.Z. wrote the article. All authors have read and agreed to the published version of the manuscript.
Funding
This research received no external funding.
Institutional Review Board Statement
Not applicable.
Informed Consent Statement
Not applicable.
Data Availability Statement
All data generated for this study are included in this article and its supplementary information file.
Conflicts of Interest
The authors declare no conflict of interest.
References
- Reinert, J.F.; Harbach, R.E.; Kitching, I.J. Phylogeny and Classification of Aedini (Diptera: Culicidae), Based on Morphological Characters of All Life Stages. Zool. J. Linn. Soc. 2004, 142, 289–368. [Google Scholar] [CrossRef] [Green Version]
- Pombi, M.; Montarsi, F. Mosquitoes (Culicidae). In Reference Module in Biomedical Sciences; Elsevier: Amsterdam, The Netherlands, 2020. [Google Scholar]
- Wilkerson, R.C.; Linton, Y.M.; Fonseca, D.M.; Schultz, T.R.; Price, D.C.; Strickman, D.A. Making Mosquito Taxonomy Useful: A Stable Classification of Tribe Aedini That Balances Utility with Current Knowledge of Evolutionary Relationships. PLoS ONE 2015, 10, e0133602. [Google Scholar] [CrossRef] [PubMed]
- Taylor, M.J.; Hoerauf, A.; Bockarie, M. Lymphatic Filariasis and Onchocerciasis. Lancet 2010, 376, 1175–1185. [Google Scholar] [CrossRef]
- Pfeffer, M.; Dobler, G. Emergence of Zoonotic Arboviruses by Animal Trade and Migration. Parasites Vectors 2010, 3, 1–15. [Google Scholar] [CrossRef] [PubMed] [Green Version]
- Silverj, A.; Rota-Stabelli, O. On the correct interpretation of similarity index in codon usage studies: Comparison with four other metrics and implications for Zika and West Nile virus. Virus Res. 2020, 286, 198097. [Google Scholar] [CrossRef]
- Kraemer, M.U.G.; Sinka, M.E.; Duda, K.A.; Mylne, A.Q.N.; Shearer, F.M.; Barker, C.M.; Moore, C.G.; Carvalho, R.G.; Coelho, G.E.; Van Bortel, W.; et al. The Global Distribution of the Arbovirus Vectors Aedes Aegypti and Ae. Albopictus. eLife 2015, 4, e08347. [Google Scholar] [CrossRef]
- Medlock, J.M.; Hansford, K.M.; Schaffner, F.; Versteirt, V.; Hendrickx, G.; Zeller, H.; Van Bortel, W. A Review of the Invasive Mosquitoes in Europe: Ecology, Public Health Risks, and Control Options. Vector-Borne Zoonotic Dis. 2012, 12, 435–447. [Google Scholar] [CrossRef] [Green Version]
- Cameron, E.C.; Wilkerson, R.C.; Mogi, M.; Miyagi, I.; Toma, T.; Kim, H.C.; Fonseca, D.M. Molecular Phylogenetics of Aedes Japonicus, a Disease Vector That Recently Invaded Western Europe, North America, and the Hawaiian Islands. J. Med. Entomol. 2010, 47, 527–535. [Google Scholar] [CrossRef] [PubMed]
- Medlock, J.M.; Hansford, K.M.; Versteirt, V.; Cull, B.; Kampen, H.; Fontenille, D.; Hendrickx, G.; Zeller, H.; Van Bortel, W.; Schaffner, F. An Entomological Review of Invasive Mosquitoes in Europe. Bull. Entomol. Res. 2015, 105, 637–663. [Google Scholar] [CrossRef] [PubMed]
- Grard, G.; Moureau, G.; Charrel, R.N.; Holmes, E.C.; Gould, E.A.; de Lamballerie, X. Genomics and Evolution of Aedes-Borne Flaviviruses. J. Gen. Virol. 2010, 91, 87–94. [Google Scholar] [CrossRef] [PubMed]
- Schaffner, F.; Chouin, S.; Guilloteau, J. First Record of Ochlerotatus (Finlaya) Japonicus Japonicus (Theobald, 1901) in Metropolitan France. J. Am. Mosq. Control Assoc. 2003, 19, 1–5. [Google Scholar] [PubMed]
- Faria, N.R.; Quick, J.; Claro, I.M.; Thézé, J.; De Jesus, J.G.; Giovanetti, M.; Kraemer, M.U.G.; Hill, S.C.; Black, A.; Da Costa, A.C.; et al. Establishment and Cryptic Transmission of Zika Virus in Brazil and the Americas. Nature 2017, 546, 406–410. [Google Scholar] [CrossRef] [PubMed]
- Chen, X.-G.; Jiang, X.; Gu, J.; Xu, M.; Wu, Y.; Deng, Y.; Zhang, C.; Bonizzoni, M.; Dermauw, W.; Vontas, J.; et al. Genome Sequence of the Asian Tiger Mosquito, Aedes Albopictus, Reveals Insights into Its Biology, Genetics, and Evolution. Proc. Natl. Acad. Sci. USA 2015, 112, e5907–e5915. [Google Scholar] [CrossRef] [PubMed] [Green Version]
- Matthews, B.J.; Dudchenko, O.; Kingan, S.B.; Koren, S.; Antoshechkin, I.; Crawford, J.E.; Glassford, W.J.; Herre, M.; Redmond, S.N.; Rose, N.H.; et al. Improved Reference Genome of Aedes Aegypti Informs Arbovirus Vector Control. Nature 2018, 563, 501–507. [Google Scholar] [CrossRef] [PubMed]
- Dritsou, V.; Topalis, P.; Windbichler, N.; Simoni, A.; Hall, A.; Lawson, D.; Hinsley, M.; Hughes, D.; Napolioni, V.; Crucianelli, F.; et al. A Draft Genome Sequence of an Invasive Mosquito: An Italian Aedes Albopictus. Pathog. Glob. Health 2015, 109, 207–220. [Google Scholar] [CrossRef] [PubMed] [Green Version]
- Seidel, B.; Montarsi, F.; Huemer, H.P.; Indra, A.; Capelli, G.; Allerberger, F.; Nowotny, N. First Record of the Asian Bush Mosquito, Aedes Japonicus Japonicus, in Italy: Invasion from an Established Austrian Population. Parasites Vectors 2016, 9, 284. [Google Scholar] [CrossRef] [Green Version]
- Montarsi, F.; Drago, A.; Martini, S.; Calzolari, M.; De Filippo, F.; Bianchi, A.; Mazzucato, M.; Ciocchetta, S.; Arnoldi, D.; Baldacchino, F.; et al. Current Distribution of the Invasive Mosquito Species, Aedes Koreicus [Hulecoeteomyia Koreica] in Northern Italy. Parasites Vectors 2015, 8, 1–5. [Google Scholar] [CrossRef] [Green Version]
- Capelli, G.; Drago, A.; Martini, S.; Montarsi, F.; Soppelsa, M.; Delai, N.; Ravagnan, S.; Mazzon, L.; Schaffner, F.; Mathis, A.; et al. First Report in Italy of the Exotic Mosquito Species Aedes (Finlaya) Koreicus, a Potential Vector of Arboviruses and Filariae. Parasites Vectors 2011, 4, 188. [Google Scholar] [CrossRef] [Green Version]
- Huber, K.; Jansen, S.; Leggewie, M.; Badusche, M.; Schmidt-Chanasit, J.; Becker, N.; Tannich, E.; Becker, S.C. Aedes Japonicus Japonicus (Diptera: Culicidae) from Germany Have Vector Competence for Japan Encephalitis Virus but Are Refractory to Infection with West Nile Virus. Parasitol. Res. 2014, 113, 3195–3199. [Google Scholar] [CrossRef]
- Soghigian, J.; Andreadis, T.G.; Livdahl, T.P. From Ground Pools to Treeholes: Convergent Evolution of Habitat and Phenotype in Aedes Mosquitoes. BMC Evol. Biol. 2017, 17, 262. [Google Scholar] [CrossRef]
- Ramasamy, S.; Ometto, L.; Crava, C.M.; Revadi, S.; Kaur, R.; Horner, D.S.; Pisani, D.; Dekker, T.; Anfora, G.; Rota-Stabelli, O. The Evolution of Olfactory Gene Families in Drosophila and the Genomic Basis of Chemical-Ecological Adaptation in Drosophila Suzukii. Genome Biol. Evol. 2016, 8, 2297–2311. [Google Scholar] [CrossRef] [Green Version]
- Crava, C.M.; Brütting, C.; Baldwin, I.T. Transcriptome Profiling Reveals Differential Gene Expression of Detoxification Enzymes in a Hemimetabolous Tobacco Pest after Feeding on Jasmonate-Silenced Nicotiana Attenuata Plants. BMC Genom. 2016, 17, 1005. [Google Scholar] [CrossRef] [Green Version]
- Ometto, L.; Cestaro, A.; Ramasamy, S.; Grassi, A.; Revadi, S.; Siozios, S.; Moretto, M.; Fontana, P.; Varotto, C.; Pisani, D.; et al. Linking Genomics and Ecology to Investigate the Complex Evolution of an Invasive Drosophila Pest. Genome Biol. Evol. 2013, 5, 745–757. [Google Scholar] [CrossRef] [Green Version]
- Rota-Stabelli, O.; Ometto, L.; Tait, G.; Ghirotto, S.; Kaur, R.; Drago, F.; González, J.; Walton, V.M.; Anfora, G.; Rossi-Stacconi, M.V. Distinct Genotypes and Phenotypes in European and American Strains of Drosophila Suzukii: Implications for Biology and Management of an Invasive Organism. J. Pest Sci. 2020, 93, 77–89. [Google Scholar] [CrossRef]
- Feuda, R.; Dohrmann, M.; Pett, W.; Philippe, H.; Rota-Stabelli, O.; Lartillot, N.; Wörheide, G.; Pisani, D. Improved Modeling of Compositional Heterogeneity Supports Sponges as Sister to All Other Animals. Curr. Biol. 2017, 27, 3864–3870.e4. [Google Scholar] [CrossRef] [Green Version]
- Hirano, T.; Saito, T.; Tsunamoto, Y.; Koseki, J.; Ye, B.; Do, V.T.; Miura, O.; Suyama, Y.; Chiba, S. Enigmatic Incongruence between MtDNA and NDNA Revealed by Multi-Locus Phylogenomic Analyses in Freshwater Snails. Sci. Rep. 2019, 9, 6223. [Google Scholar] [CrossRef]
- Near, T.J.; Eytan, R.I.; Dornburg, A.; Kuhn, K.L.; Moore, J.A.; Davis, M.P.; Wainwright, P.C.; Friedman, M.; Smith, W.L. Resolution of Ray-Finned Fish Phylogeny and Timing of Diversification. Proc. Natl. Acad. Sci. USA 2012, 109, 13698–13703. [Google Scholar] [CrossRef] [PubMed] [Green Version]
- Zheng, Y.; Peng, R.; Kuro-O, M.; Zeng, X. Exploring Patterns and Extent of Bias in Estimating Divergence Time from Mitochondrial DNA Sequence Data in a Particular Lineage: A Case Study of Salamanders (Order Caudata). Mol. Biol. Evol. 2011, 28, 2521–2535. [Google Scholar] [CrossRef]
- Wahlberg, N.; Weingartner, E.; Warren, A.D.; Nylin, S. Timing Major Conflict between Mitochondrial and Nuclear Genes in Species Relationships of Polygonia Butterflies (Nymphalidae: Nymphalini). BMC Evol. Biol. 2009, 9, 92. [Google Scholar] [CrossRef] [PubMed] [Green Version]
- Reidenbach, K.R.; Cook, S.; Bertone, M.A.; Harbach, R.E.; Wiegmann, B.M.; Besansky, N.J. Phylogenetic Analysis and Temporal Diversification of Mosquitoes (Diptera: Culicidae) Based on Nuclear Genes and Morphology. BMC Evol. Biol. 2009, 9, 298. [Google Scholar] [CrossRef] [PubMed] [Green Version]
- Da Silva, A.F.; Machado, L.C.; de Paula, M.B.; da Silva Pessoa Vieira, C.J.; de Morais Bronzoni, R.V.; de Melo Santos, M.A.V.; Wallau, G.L. Culicidae Evolutionary History Focusing on the Culicinae Subfamily Based on Mitochondrial Phylogenomics. Sci. Rep. 2020, 10, 18823. [Google Scholar] [CrossRef]
- Reisen, W.K. Update on Journal Policy of Aedine Mosquito Genera and Subgenera. J. Med. Entomol. 2016, 53, 249. [Google Scholar] [CrossRef] [PubMed]
- Abascal, F.; Zardoya, R.; Telford, M.J. TranslatorX: Multiple Alignment of Nucleotide Sequences Guided by Amino Acid Translations. Nucleic Acids Res. 2010, 38, 1–31. [Google Scholar] [CrossRef] [Green Version]
- Katoh, K.; Rozewicki, J.; Yamada, K.D. MAFFT Online Service: Multiple Sequence Alignment, Interactive Sequence Choice and Visualization. Brief. Bioinform. 2018, 20, 1160–1166. [Google Scholar] [CrossRef] [PubMed] [Green Version]
- Kück, P.; Meusemann, K. FASconCAT: Convenient Handling of Data Matrices. Mol. Phylogenet. Evol. 2010, 56, 1115–1118. [Google Scholar] [CrossRef] [PubMed]
- Stamatakis, A. RAxML Version 8: A Tool for Phylogenetic Analysis and Post-Analysis of Large Phylogenies. Bioinformatics 2014, 30, 1312–1313. [Google Scholar] [CrossRef] [PubMed]
- Lartillot, N.; Lepage, T.; Blanquart, S. PhyloBayes 3: A Bayesian Software Package for Phylogenetic Reconstruction and Molecular Dating. Bioinformatics 2009, 25, 2286–2288. [Google Scholar] [CrossRef] [PubMed] [Green Version]
- Bouckaert, R.; Vaughan, T.G.; Barido-Sottani, J.; Duchêne, S.; Fourment, M.; Gavryushkina, A.; Heled, J.; Jones, G.; Kühnert, D.; De Maio, N.; et al. BEAST 2.5: An Advanced Software Platform for Bayesian Evolutionary Analysis. PLoS Comput. Biol. 2019, 15, 1–28. [Google Scholar] [CrossRef] [Green Version]
- Benton, M.J.; Donoghue, P.C.J. Paleontological Evidence to Date the Tree of Life. Mol. Biol. Evol. 2007, 24, 26–53. [Google Scholar] [CrossRef]
- Misof, B.; Liu, S.; Meusemann, K.; Peters, R.S.; Donath, A.; Mayer, C.; Frandsen, P.B.; Ware, J.; Flouri, T.; Beutel, R.G.; et al. Phylogenomics Resolves the Timing and Pattern of Insect Evolution. Science 2014, 346, 763–767. [Google Scholar] [CrossRef] [PubMed]
- Borkent, A.; Grimaldi, D.A. The Earliest Fossil Mosquito (Diptera: Culicidae), in Mid-Cretaceous Burmese Amber. Ann. Entomol. Soc. Am. 2004, 97, 882–888. [Google Scholar] [CrossRef]
- Bouckaert, R.; Heled, J.; Kühnert, D.; Vaughan, T.; Wu, C.H.; Xie, D.; Suchard, M.A.; Rambaut, A.; Drummond, A.J. BEAST 2: A Software Platform for Bayesian Evolutionary Analysis. PLoS Comput. Biol. 2014, 10, 1–6. [Google Scholar] [CrossRef] [PubMed] [Green Version]
- Lartillot, N.; Philippe, H. A Bayesian Mixture Model for Across-Site Heterogeneities in the Amino-Acid Replacement Process. Mol. Biol. Evol. 2004, 21, 1095–1109. [Google Scholar] [CrossRef] [PubMed]
- Rota-Stabelli, O.; Daley, A.C.; Pisani, D. Molecular Timetrees Reveal a Cambrian Colonization of Land and a New Scenario for Ecdysozoan Evolution. Curr. Biol. 2013, 23, 392–398. [Google Scholar] [CrossRef] [PubMed] [Green Version]
- Drummond, A.J.; Ho, S.Y.W.; Phillips, M.J.; Rambaut, A. Relaxed Phylogenetics and Dating with Confidence. PLoS Biol. 2006, 4, 699–710. [Google Scholar] [CrossRef]
- Richards, S.; Murali, S.C. Best Practices in Insect Genome Sequencing: What Works and What Doesn’t. Curr. Opin. Insect Sci. 2015, 7, 1–7. [Google Scholar] [CrossRef] [PubMed] [Green Version]
- Van der Kooi, C.J.; Ollerton, J. The Origins of Flowering Plants and Pollinators. Science 2020, 368, 1306–1308. [Google Scholar] [CrossRef]
- Rota-Stabelli, O.; Telford, M.J. A Multi Criterion Approach for the Selection of Optimal Outgroups in Phylogeny: Recovering Some Support for Mandibulata over Myriochelata Using Mitogenomics. Mol. Phylogenet. Evol. 2008, 48, 103–111. [Google Scholar] [CrossRef] [PubMed]
- Bernt, M.; Braband, A.; Middendorf, M.; Misof, B.; Rota-Stabelli, O.; Stadler, P.F. Bioinformatics Methods for the Comparative Analysis of Metazoan Mitochondrial Genome Sequences. Mol. Phylogenet. Evol. 2013, 69, 320–327. [Google Scholar] [CrossRef] [Green Version]
- Reeves, L.E.; Holderman, C.J.; Blosser, E.M.; Gillett-Kaufman, J.L.; Kawahara, A.Y.; Kaufman, P.E.; Burkett-Cadena, N.D. Identification of Uranotaenia Sapphirina as a Specialist of Annelids Broadens Known Mosquito Host Use Patterns. Commun. Biol. 2018, 1, 1–8. [Google Scholar] [CrossRef] [Green Version]
- Rota-Stabelli, O.; Kayal, E.; Gleeson, D.; Daub, J.; Boore, J.L.; Telford, M.J.; Pisani, D.; Blaxter, M.; Lavrov, D.V. Ecdysozoan Mitogenomics: Evidence for a Common Origin of the Legged Invertebrates, the Panarthropoda. Genome Biol. Evol. 2010, 2, 425–440. [Google Scholar] [CrossRef] [PubMed] [Green Version]
- Papadopoulou, A.; Anastasiou, I.; Vogler, A.P. Revisiting the Insect Mitochondrial Molecular Clock: The Mid-Aegean Trench Calibration. Mol. Biol. Evol. 2010, 27, 1659–1672. [Google Scholar] [CrossRef] [Green Version]
- Ho, S.Y.W.; Lanfear, R.; Bromham, L.; Phillips, M.J.; Soubrier, J.; Rodrigo, A.G.; Cooper, A. Time-Dependent Rates of Molecular Evolution. Mol. Ecol. 2011, 20, 3087–3101. [Google Scholar] [CrossRef] [PubMed]
- Ho, S.Y.W.; Lo, N. The Insect Molecular Clock. Aust. J. Entomol. 2013, 52, 101–105. [Google Scholar] [CrossRef]
- Guidetti, R.; McInnes, S.J.; Cesari, M.; Rebecchi, L.; Rota-Stabelli, O. Evolutionary Scenarios for the Origin of an Antarctic Tardigrade Species Based on Molecular Clock Analyses and Biogeographic Data. Contrib. Zool. 2017, 86, 97–110. [Google Scholar] [CrossRef] [Green Version]
- Andújar, C.; Serrano, J.; Gámez-Zurita, J. Winding up the Molecular Clock in the Genus Carabus (Coleoptera: Carabidae): Assessment of Methodological Decisions on Rate and Node Age Estimation. BMC Evol. Biol. 2012, 12, 40. [Google Scholar] [CrossRef] [PubMed] [Green Version]
- Thawornwattana, Y.; Dalquen, D.; Yang, Z. Coalescent Analysis of Phylogenomic Data Confidently Resolves the Species Relationships in the Anopheles Gambiae Species Complex. Mol. Biol. Evol. 2018, 35, 2512–2527. [Google Scholar] [CrossRef]
- Foster, P.G.; de Oliveira, T.M.P.; Bergo, E.S.; Conn, J.E.; Sant’Ana, D.C.; Nagaki, S.S.; Nihei, S.; Lamas, C.E.; González, C.; Moreira, C.C.; et al. Phylogeny of Anophelinae Using Mitochondrial Protein Coding Genes. R. Soc. Open Sci. 2017, 4, 170758. [Google Scholar] [CrossRef] [Green Version]
- Palatini, U.; Masri, R.A.; Cosme, L.V.; Koren, S.; Thibaud-Nissen, F.; Biedler, J.K.; Krsticevic, F.; Johnston, J.S.; Halbach, R.; Crawford, J.E.; et al. Improved Reference Genome of the Arboviral Vector Aedes Albopictus. Genome Biol. 2020, 21, 215. [Google Scholar] [CrossRef] [PubMed]
Figure 1.
Topological incongruence between mitochondrial and nuclear data. (A): Bayesian consensus tree of concatenated dataset. (B): Bayesian consensus tree of nuclear (nDNA) dataset. (C): Bayesian consensus tree of mitochondrial (mtDNA) dataset. All analyses have been performed using a GTR+G model in PhyloBayes. Numbers at nodes are posterior probabilities (PP). Groups identified using the concatenated dataset have been colored. Arrows indicate highly supported incongruences between the nDNA and mtDNA datasets. The corresponding Maximum Likelihood trees are in Supplementary Figure S1.

Figure 2.
A conservative picture of Culicinae phylogeny using different models and datasets. To highlight lack of phylogenetic signal, all nodes below PP 0.90 and BS 75 have been collapsed. (A): Maximum likelihood tree of the concatenated dataset using the GTR+G model in RaXml. (B): Bayesian consensus tree of the concatenated dataset under the CAT+G model using PhyloBayes. (C): Maximum likelihood tree of a modified [21] dataset under the GTR+G model using RaXml. The number at nodes are bootstrap supports (BS) in panels A and C, and posterior probabilities (PP) in panel B. The backbone of the tree and the monophyly of Clade B (orange) are strongly supported using GTR, but not using CAT. Many relationships within Clade B are poorly supported in all analyses. Full trees with all nods and supports are in Supplementary Figures S2–S4.

Figure 3.
A Bayesian estimates of Aedini divergence. Posterior consensus tree from the analysis of the concatenated dataset. The two shaded distributions highlight the distribution of the 95% HPD for the origin of the Culicinae (b node) and the split of the Aedini (e node): for precise estimates and the 95% HPD see Table 2. Supports at nodes are posterior probabilities higher than 0.95. Time is in millions of years before the present.

Figure 4.
Chronological incongruence between mitochondrial and nuclear data. Note that while posterior estimates are similar for ancient nodes, there are strong incongruences for recent nodes. (A): posterior consensus tree from the analysis of the mtDNA dataset. (B): posterior consensus tree from the analysis of the nDNA dataset. (C–E): The concatenated, the mitochondrial, and the nuclear trees simplified for comparison. Supports at nodes are posterior probabilities higher than 0.95. Time is in millions of years before the present.

Figure 5.
High degree of rate heterogeneity between nuclear and mitochondrial data. (A): the nDNA Bayesian phylogeny with mean posterior rates plotted on branches. (B): the Bayesian mtDNA phylogeny with mean posterior rates plotted on branches. Note that there are local accelerations of rate (bold lines) in certain taxa only in one of the two data types.


Table 1.
Model tested with divergence estimates for two nodes.
| Clock Model | Substitution Model | Tree Prior | logLikelihood | AICm | Harmonic Mean | PS/SS | Culicidae | Aedini |
|---|---|---|---|---|---|---|---|---|
| Strict | GTR | Yule | 54,908.6 | 109,892.3 | −54,926.7 | 4 | 156 (114–204) | 90 (75–104) |
| Relaxed (LogN) | HKY | Yule | 54,624.8 | 109,467.9 | −54,666.3 | 5 | 166 (119–215) | 96 (68–125) |
| GTR | Yule | 54,362.7 | 109,108.1 | −54,424.3 | 1 | 180 (137–228) | 113 (83–143) | |
| Birth Death | 54,363.6 | 109,115 | −54,414.9 | 1 | 180 (135–227) | 112 (82–142) | ||
| Coalescent Constant | 54,370.2 | 109,208.7 | −54,415.7 | 3 | 173 (123–225) | 100 (66–132) |
Table 2.
Divergence estimates of selected nodes from Figure 3 and other analyses. For each node, we provide the mean and the 95% high posterior density. On the right column, we provide estimates from previous studies.
Table 2.
Divergence estimates of selected nodes from Figure 3 and other analyses. For each node, we provide the mean and the 95% high posterior density. On the right column, we provide estimates from previous studies.
| Node | Taxonomic Level | Concatenated Dataset Figure 3 | No Outgroup (Concatenated) | Nuclear Data Figure 4A | Mitochondrial Data Figure 4B | Others: Reidenbach09; Soghigian17 *; Da Silva 20 #; Chen 15 ^ |
|---|---|---|---|---|---|---|
| a | Diptera | 257 (223–294) | 261 (225–296) | 258 (224–293) | 260 (239–295) ^ | |
| b | Culicidae split (Culicinae origin) | 180 (137–228) | 100 (50–185) | 178 (113–245) | 182 (143–223) | 216 (229–192) 182 # 218 (181–260) ^ |
| c | Culicinae split | 146 (108–182) | 92 (41–139) | 139 (92–194) | 150(118–184) | 204 (226–172) 130 # 179 (148–217) ^ |
| d | 137 (103–173) | 86 (38–127) | 123 (79–171) | 135 (104–164) | ||
| e | Aedini split (Aedes origin) | 113 (83–143) | 64 (34–122) | 92 (55–137) | 111 (95–150) | 123 (155–90) 125 * 102 # |
| f | Aedes split (Clades A-B split) | 105 (77–133) | 57 (28–110) | 69 (42–103) | 107 (85–133) | 92 (123–61) 102 * |
| g | Clade A split | 99 (72–126) | 51 (24–100) | 49 (29–76) | 96 (73–118) | |
| h | 83 (59–109) | 50 (22–93) | 36 (20–57) | 92 (71–116) | ||
| i | Stegomya (A. aegypti–A. albopictus) split | 73 (50–96) | 36 (14–70) | 27 (15–45) | 81 (61–102) | 55 * 67 # 71 (44–107) ^ |
| j | A. albopictus–A. flavopictus split | 28 (14–43) | 36 (14–70) | 3.7 (0.1–11.2) | 33 (20–46) | 25 * |
| l | A. koreicus–A. japonicas split | 32 (15–51) | 14 (3–31) | 3.6 (0.2–10.9) | 46 (24–71) | 20 * |
Publisher’s Note: MDPI stays neutral with regard to jurisdictional claims in published maps and institutional affiliations. |
© 2021 by the authors. Licensee MDPI, Basel, Switzerland. This article is an open access article distributed under the terms and conditions of the Creative Commons Attribution (CC BY) license (http://creativecommons.org/licenses/by/4.0/).
Share and Cite
MDPI and ACS Style
Zadra, N.; Rizzoli, A.; Rota-Stabelli, O. Chronological Incongruences between Mitochondrial and Nuclear Phylogenies of Aedes Mosquitoes. Life 2021, 11, 181. https://0-doi-org.brum.beds.ac.uk/10.3390/life11030181
AMA Style
Zadra N, Rizzoli A, Rota-Stabelli O. Chronological Incongruences between Mitochondrial and Nuclear Phylogenies of Aedes Mosquitoes. Life. 2021; 11(3):181. https://0-doi-org.brum.beds.ac.uk/10.3390/life11030181
Chicago/Turabian StyleZadra, Nicola, Annapaola Rizzoli, and Omar Rota-Stabelli. 2021. "Chronological Incongruences between Mitochondrial and Nuclear Phylogenies of Aedes Mosquitoes" Life 11, no. 3: 181. https://0-doi-org.brum.beds.ac.uk/10.3390/life11030181
Note that from the first issue of 2016, this journal uses article numbers instead of page numbers. See further details here.