Pandemic Supply Chain Research: A Structured Literature Review and Bibliometric Network Analysis


Coggin College of Business, University of North Florida, Jacksonville, FL 32224, USA
*
Author to whom correspondence should be addressed.
Logistics 2021, 5(1), 7; https://0-doi-org.brum.beds.ac.uk/10.3390/logistics5010007
Submission received: 1 December 2020
/
Revised: 11 January 2021
/
Accepted: 12 January 2021
/
Published: 29 January 2021
(This article belongs to the Section Humanitarian and Healthcare Logistics)
Abstract
:In early 2020, COVID-19 infected people throughout the world and brought world commerce to a standstill. Many believe that governments and global businesses were not as prepared as they should have been. While academics have occasionally predicted the economic problems that could result from pandemics, until 2020, there had been scant research that addresses supply chain management issues during pandemics. Eighty-four percent of all pandemic supply chain research was published in the first ten months of 2020. Since the world now finds itself operating supply chains in response to the pandemic, this literature needs to be summarized and articulated for understanding and future research. This literature review addresses that need by summarizing the research which has been generated since 1997, focusing primarily on the bulk of the research that has been published since the COVID-19 pandemic began. Research tools are used to summarize the literature citations, and the articles are coded according to some important variables to further delineate their details. This research also includes a bibliometric co-citation analysis, which clusters the pandemic supply chain literature by author, journal, and article. The findings are that pre-COVID-19 research on pandemic supply chains was primarily about influenza and the healthcare supply chain, whereas post-COVID-19 research provides more analysis of the food supply chain and uses a wider variety of research methods, including simulation, modeling, and empirical methods.
1. Introduction
The impacts of COVID-19 on supply chains gained a strong initial interest by scholars. By April 2020, only 2–4 months after most countries recognized states of emergency, a Scopus database search using the term “coronavirus” yielded over twelve thousand items [1]. Until the 2020 pandemic, there were some occasional articles predicting supply chain problems resulting from a pandemic, but these had not sparked the necessary level of research activity. Today, despite the surge in research on this topic in 2020, there are knowledge gaps in how to address supply chain issues in times of widespread disruption, such as from pandemics [2,3]. It is important that research be conducted now while the world’s supply chains are reacting to the pandemic changes. Much can be learned during the reaction period of the COVID-19 pandemic, and this knowledge needs to be captured. Therefore, the purpose of this study is to examine the following: How does academic research address supply chain concerns during pandemics?
Pandemics are special cases of supply chain risk management, different than typical supply chain disruptions [4], that are characterized by long-term disruption, a ripple effect of disruption propagation, and extreme uncertainty [5]. Disease threats have diverse levels of severity and probability. The threats are magnified by rapid population growth in areas with weak healthcare, urbanization, globalization, climate change, civil conflict, and the changing nature of the pathogens and their transmission [2].
This research makes an important early assessment of pandemic supply chain research. This literature review uses a structured process to classify articles along conceptual and methodological dimensions. A structured literature review is a method for studying a corpus of scholarly literature, to develop insights, critical reflections, future research paths, and research questions [6] (p. 767). Performing a systematic literature review on pandemic supply chain research is important to get an early analysis of scholarship on the COVID-19 pandemic. Massaro, M., 2016 provided a methodology that was followed for this structured literature review to generate a collection of knowledge useful for guiding future research on supply chains during pandemic disruptions.
The results and discussion are provided in two sections, including a systematic literature review (Section 3) and a bibliometric network analysis (Section 4). The systematic literature review provides citation and metadata information (3.1) and information after the articles were read and coded (3.2) to provide additional information such as methodology, research areas, supply chain sector, virus type, supply chain focus, subject, and methodologies used for pandemic supply chain research. In the next major section, we provide a bibliometric network analysis which provides graphical maps of co-citation analysis. This bibliometric analysis is conducted along three lines, including journals (4.1), authors (542), and articles (4.3). The article concludes with suggestions for future research.
2. Data and Methodology
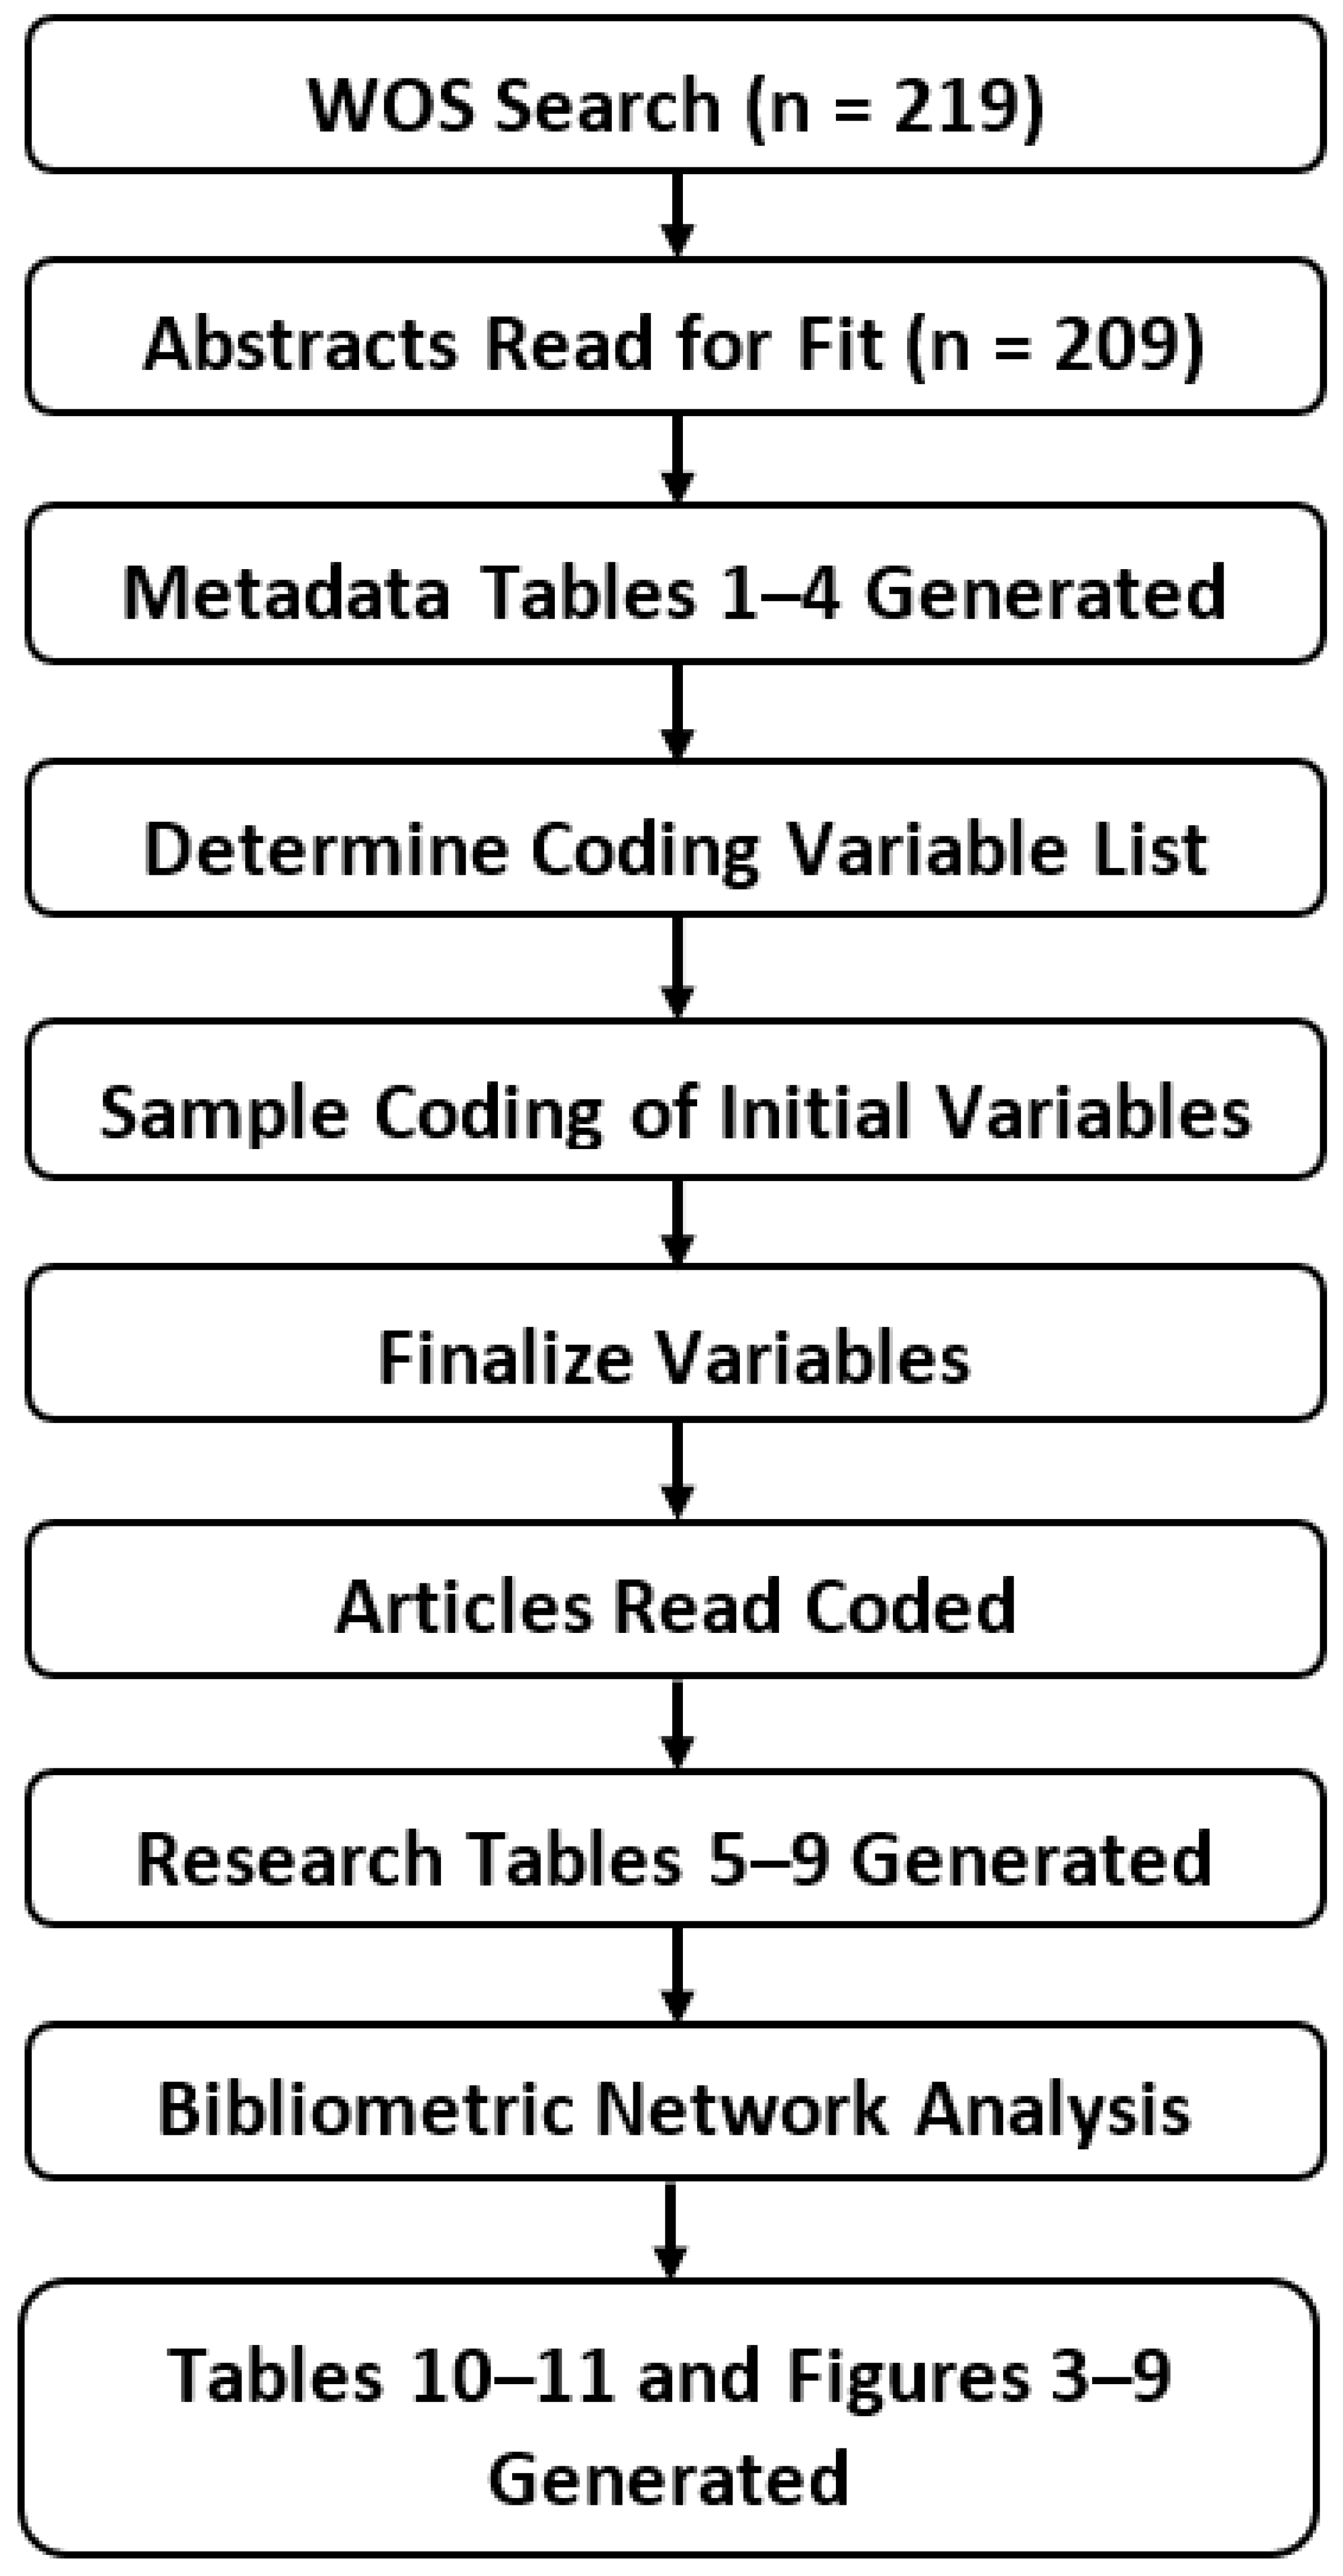
The data for this research were accessed using the Web of Science database on October 11, 2020, for the years 1975–2020, using the search words “pandemic” and “supply chain” occurring in the title, abstract, or keywords. This search yielded 219 academic articles with the first article appearing in 1997. The abstracts of these articles were read; ten were unrelated to pandemic supply chain research and thus omitted from the study. Some of the omitted articles were on foodborne illnesses, such as salmonella, which can be a widespread disease but does not fit the “uncontrolled” nature of pandemics. Other articles concerned obesity, which has been referred to as a pandemic. One omitted article announced winners of a pandemic-related research award without adding additional scholarly material. After this data cleaning, 209 articles remained. Descriptive information on the group of 209 articles is given in Table 1, Table 2, Table 3 and Table 4, including the most highly cited articles and analysis by category, year, and research areas. This information was collected using two Web of Science tools, including the Clarivate Analytic Report and Clarivate Citation Report.
Next, some initial coding variables were established. This was conducted by reading the abstracts of the selected articles, noting primary topics, methods, and theories, and then selecting variables to effectively capture the relevant content. A sample of 30 articles was coded to see if the variable values were suitable. Following this exercise, several of the initial variables were changed. For example, the value “Energy” was removed from the possible supply chain sectors because there was only one article that matched this value. For the same reason, the code “analytical” was removed from the possible methodologies. The final values for each of the variables consisted of the following:
Supply Chain Sector: Food/Agriculture, Healthcare, and Other;
Virus Type: Coronavirus, HIV, Influenza, and Other;
Supply Chain Focus: Collaboration, Labor, Other, and Supply/Inventory;
Subject: Technology, Global Trade, Psychological, Sociological, Sustainability, Quality, Safety, and Retail;
Methodology: Conceptual, Empirical, Experiment, Literature Review, Model, and Simulation.
Our systematic literature review methodology considers two explicit processes.
- A comparison of differences, in the form of meta-analysis through the tables, analyzed in healthcare [7].
- An examination of the evolving nature in the “supply chain” concept [8], which affects the ontological behavior, so inferences could be made using bibliometric analysis.
The articles were then read and coded according to these final values. Table 5, Table 6, Table 7, Table 8 and Table 9 summarize the results of the coded research. For a summary of this research process, please see the flowchart in Figure 1.
Table 4 This co-citation network analysis was conducted with VOSviewer software to graphically identify the knowledge structure and determine the impacts the various journals, authors, and articles have on pandemic supply chain research. This analysis helps to describe patterns of similarities and differences between the literature [9,10].
3. Systematic Literature Review
This section is divided into two parts. The first part tabulates results based on citations and metadata that come from the Web of Science database. The second part provides results after the articles are coded by the research team according to relevant variables, such methodology and supply chain sector.
3.1. Citation and Metadata Results
The most cited articles that reference both supply chain and pandemics are listed in Table 1, including the year, authors, and journal. Among the journals that have published pandemic supply chain research, thirteen are medical journals and seven are business journals. Approximately thirty percent of the journal outlets are business-related, indicating that pandemics have a strong impact on businesses and the economy.
To gauge the quality level of these journals, index rankings for each journal from the Web of Science and SCOPUS are provided in Table 1. Scopus citation counts are generally higher.
Research on the supply chain during pandemics falls into twenty-five different Web of Science categories. The most common categories are listed in Table 2. These categories represented display a wide range of fields of study, including medicine, operations, economics, management, agriculture, environmental science, computer science, engineering, pharmacology, geography, and policy. It is interesting to note that the research in all these various academic disciplines references the supply chain, a testament to the criticality and universality of pandemic supply chain research.
Table 3 shows the count of research articles by year and the overwhelming amount of research that has been conducted on this topic in 2020, including ~84% of all research on this topic. There are also six articles on this topic from 2019 for what has typically been a 0–2 article per year subject since 1997. Since the coronavirus was still mostly isolated in China during 2019, it is interesting to look at what research was included in this pre-pandemic spike. Petrova et al. [30] (p.1) mentioned an uptick in recent pandemics (Ebola, Zika, MERS, influenza, etc.) and underlined the need for a more nimble, coordinated response that addresses a multitude of issues ranging from transportation, access, facilities, equipment, and communication to provider training Bloom and Cadarette [2] (p. 2) also stated “the global health system as currently constituted… has been called into question by recent outbreaks of Ebola, Zika, dengue, Middle East respiratory syndrome, severe acute respiratory syndrome, and influenza and by the looming threat of rising antimicrobial resistance.” Therefore, we can surmise that there was a timely increase in scholarly interest in pandemic preparation in 2019, and the problems seen from the pandemic may not have been entirely unforeseen.
There was also a small spike of research in 2014 that included concerns such as those exhibited by 2019 researchers. Ekici et al. [26] (p. 11) opened their food supply chain modeling paper with the following statement: “Based on the recent incidents of H5N1, H1N1, and influenza pandemics in history (1918, 1957, and 1968) experts believe that a future influenza pandemic is inevitable and likely imminent.” Simchi-Levi et al. [17] mentioned the differences between typical risk management and rare, widespread disruptions such as pandemics, making a point that many companies are ill-prepared.
The pandemic supply chain research articles are summarized by research area in Table 4. The research areas of these articles are like the Web of Science categories which were identified in Table 2. This is expected, however, because journals mostly publish articles in research areas that are in concert with their focus, but perhaps not always. The top five research areas are as follows: business economics, public environmental occupational health, engineering, environmental sciences ecology, and science technology, among other topics. For comparison, the top five WOS categories from Table 2 are as follows: public environmental occupational health, management, economics, environmental sciences, and immunology.
3.2. Article Coding Results
This section provides the results of the articles after they were read and coded according to their content. The data are mostly presented in tabular form. Some comments are provided to help articulate what the tables are showing.
The pandemic supply chain research is counted by methodology in Table 5. Even though the pandemic literature and supply chain literature has been prevalent, the two subjects together did not generate much interest by academic researchers until 2020. This is supported by the fact that no dedicated literature reviews were conducted on pandemic supply chains until the year 2020. Then in 2020, there were thirteen in the first half of the year.
There have been thirteen literature reviews found by this structured literature review that were related to pandemic supply chain research. A comprehensive literature review on the supply chain amid the COVID-19 pandemic was conducted by Queiroz et al. [3]. This review showed that the most studied topic was optimization and resource allocation and distribution, and it culminates in a framework for supply chain management during pandemics that is organized around six perspectives: adaptation, digitization, preparedness, recovery, the ripple effect, and sustainability. This study includes a tabular summary of key research articles, including purpose, methodological approach, and implications; it can be used by researchers to easily canvas the literature for applicable studies for their own research. Yuen et al. [31] concentrated on one of the important and anecdotal root causes of supply chain problems during a pandemic—that of panic buying. They aimed to identify and synthesize the psychological causes of panic buying, and their systematic review finds that panic buying is influenced by perception of the threat of the health crisis and product scarcity, fear of the unknown, coping behavior, and social psychological factors. In another notable bibliometric review, Haghani et al. [1] canvassed the literature on COVID-19 to identify the safety-related aspects in academic studies. They found that most safety-related research topics are as follows: patient transport safety, occupational safety of healthcare professionals, bio-safety of laboratories and factories, social safety, food safety, and mental/psychological and domestic safety. They noted that supply chain safety is a potentially significant problem that has received only limited research. However, their dimensions, including patient transport, occupational safety in factories, and food safety, are also all components of logistics and supply chain management.
Supply chain risks are different for rare and high-impact events such as pandemics; consequently, they are difficult to quantify with traditional models [17]. It is maybe for that reason that simulations have been popular in 2020 model-based research. They can be easily tailored to simulate different system states. In fact, Ivanov and Dolgui [29] proposed a digital twin for managing disruption risks. This model can be designed to parallel the real-time events being seen in society. Using such a tool, potential decisions can be played out in the simulation prior to actual implementation. Furthermore, digital twins can potentially enhance research on strategies and contingency plans. There have been seventeen articles using models and a simulation methodology.
Some of the additional modeling and simulation articles are also briefly summarized. Contingency plans, or business continuity management, is the focus of Schatter et al. [32]. Their simulation helps companies deal with different levels of information and develop optimum resource allocations. The simulation is based on a 29-store retailer in Berlin. The simulation modeled different levels of staff members (e.g., cashiers, shelf stockers, and customer service representatives). Li et al. [33] simulated two vaccine distribution strategies with the goal of reducing the rate of infection. Using population data from Georgia, they found that allocating the vaccine inventory by population percentage is not as effective as allocating it by population and the amount of remaining inventory, that is, distributing to census tracts that have already administered already allocated vaccines. Therefore, it is better to distribute limited-supply vaccines considering the region’s ability to distribute vaccines and not just the amount of people in a region. One ten-year-old study provides many answers for supply chain management for widespread influenza. Lin et al. [34] developed a simulation of the medical material delivery system with the goal of minimizing the response time. They displayed various scenarios to determine the optimum inventory policy and thus evaluate the stockpiles of an inventory. Guan et al. [35] used a simulation to analyze the supply chain effects of alternate lockdown strategies. They sought to minimize supply chain losses, finding that losses are more sensitive to lockdown duration than lockdown strictness. They also found that when the virus is contained longer, the supply chain impacts are less. Overall, earlier, stricter, and shorter lockdowns can minimize supply chain-related losses. Ivanov [5] proposed a supply chain simulation designed to predict short- and long-term impacts of epidemics. A range of sensitivity experiments shows that the timing of closing and opening of facilities might be a major factor that determines the outbreak impact on the supply chain. Note this is consistent with research by Guan et al. [35]. Other key variables include lead time, speed of pandemic propagation, and the duration of disruptions both upstream and downstream of the target company.
There has been some experimental research on pandemics and supply chains. Stramer et al. [36] presented an assessment of the prevalence of seasonal and 2009 H1N1 influenza viremia (via RNA testing) in blood donor populations by evaluating actual blood samples. They found that seasonal influenza does not appear to pose a significant contamination threat to the blood supply. In another experiment, Zinckgraf et al. [37] tested a vaccine and found it could be used to provide at least some protection of H5N1 as a relief to another supply-limited vaccine. Another study examined the disrupted distribution of regular insulin supply to patients due to lockdown restrictions of the pandemic [38]. Another experiment in New Zealand focused on local production of antigens to supply testing needs since COVID-19 disrupted sources from their suppliers. [39]; additionally, much experimental research concentrated primarily on medical-related research questions. For example, the risk of COVID-19 transmission along the wildlife supply chain in human consumption of bats and rodents was confirmed in specific Asian markets [40]. COVID-19 home testing samples were found to be less invasive than traditional blood and nasal testing, and their distribution is flexible. Liao et al. [41] revealed predictors among COVID-19-confirmed patients with other diseases, such as hypertension, chronic kidney disease, and obesity [42].
Table 6 includes research articles counted by the supply chain sector. Thus far, only two supply chains warranted their own category: food/agriculture and healthcare; the other research that identified a specific supply chain sector was diverse and little commonality was found. The healthcare sector has received the most attention from pandemic supply chain researchers, being the only sector that has received research each year since 1997. This is likely due to the need for medical supplies and personal protective equipment (PPE) for medical workers treating the disease during pandemics. Researchers widely believe that mortality will be reduced by protecting the medical supply and PPE supply chains [28]. The second most studied sector during the initial phases of the pandemic in 2020 was the food supply chain. These supply chains were hit harder by COVID-19 than any other disruption seen in recent decades [43,44]. It has affected food deliveries in terms of agriculture, food supplies (e.g., aluminum for cans), and animal production [45]. Hundreds of thousands of restaurant workers have been laid off [46] and food packaging has needed to change from meeting commercial guidelines to meeting direct-to-consumer packaging and labeling.
All remaining research is classified as “Other.” This group of studies includes three types. The first type of study includes those that focused on a supply chain other than the coded sectors of Food/Agriculture and Healthcare. Examples include energy, garments, and manufacturing in general. However, in all instances, the low number of occurrences did not warrant a separate coding category. The second type of studies in the “Other” category includes those that focused on more than one supply chain sector and did not fit cleanly in only one sector. The third type, which was also the most common, was studies that discussed the supply chain generally.
The pandemic supply chain articles are categorized by virus type in Table 7. There are four possible values for this table, including influenza, HIV, coronavirus, and others. If the article did not specify a certain type of disease, or if it focused on one of the diseases other than coronavirus, HIV, or influenza, it was coded as “Other.” It is interesting to note that coronavirus has seen more research in the first half of 2020 than influenza, HIV, and all other pandemic supply chain research since 1997. While not as voluminous as coronavirus research, influenza research has been relatively ongoing during each year of the study [3].
Different diseases are popular research subjects at different periods of time. Siche [32] reminds us that the Spanish flu, Asian flu, Hong Kong flu, HIV/AIDS, SARS, Ebola, and swine flu have each greatly impacted the economy. Queiroz et al. [3] observed in their literature review that influenza has been the most visible disease outbreak in recent history.
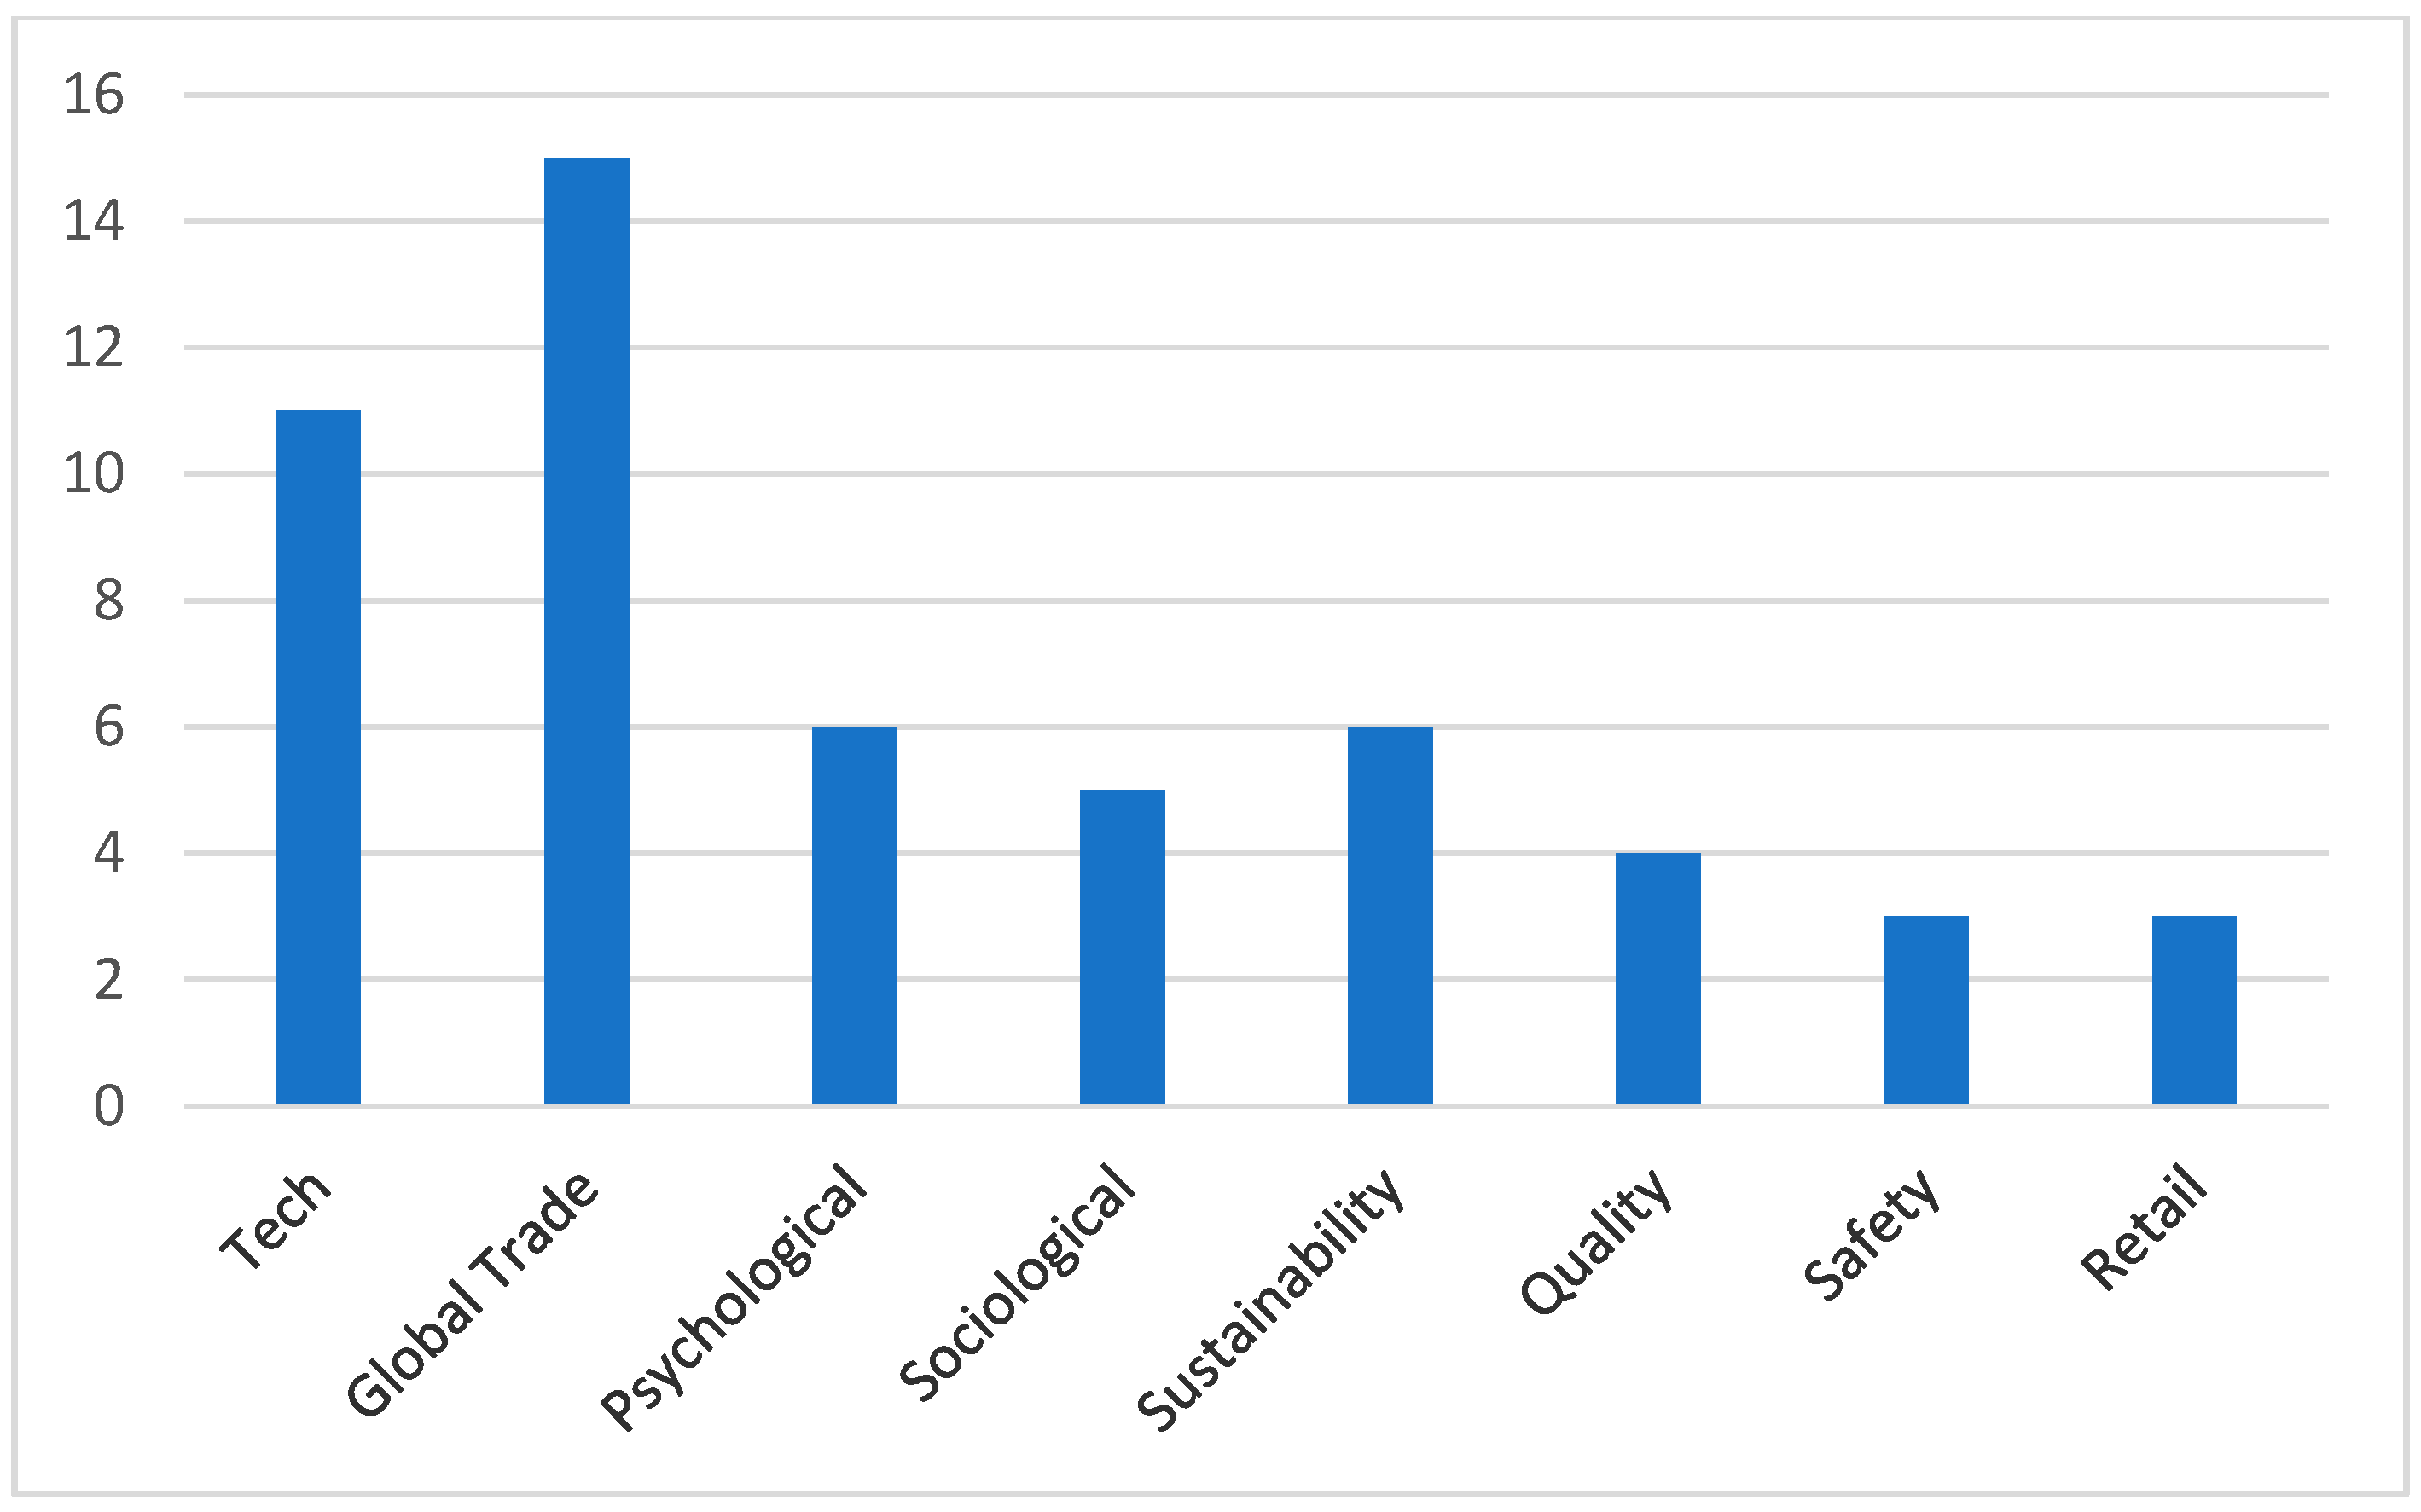
Research articles are categorized by subject in Table 9. The subjects observed include technology, global trade, psychology, sociology, sustainability, quality, safety, and retail. Global trade and technology are the most popular subjects. Since the majority of pandemic supply chain research was published in 2020, Figure 2 provides a histogram of the research subjects where academics are focusing in 2020. Much like the full sample analysis, the most discussed subject was the importance of global trade during the pandemic and the secondary subject was technology. Further analysis of the technology articles reveals they are a combination of (1) technology to help keep the supply chain operational during a pandemic, (2) medical technology, and (3) tools that allow supply chain workers to operate remotely.
Figure 2 also shows that pandemic supply chain research published post-COVID-19 is more diverse compared to the research published pre-COVID-19. Table 1, Table 2, Table 3, Table 4, Table 5, Table 6, Table 7, Table 8 and Table 9 can be summarized to say that the majority of pre-2020 research was on the virus type of influenza, was focused on the healthcare supply chain sector, and only addressed supply chain topics at a cursory level.
4. Bibliometric Network Analysis
Pandemic supply chain research studies are developing and accelerating knowledge at a rapid pace. Bibliometric network analysis provides a structure to understand the research as it is being conducted and expanded and can shape frameworks of current and future intellectual relationships. This is especially important given the recent surge in pandemic supply chain research. Previous studies have shown that network analysis is a good tool to denote relational data from a vast number of articles [47] and helps to describe patterns of similarities and differences between the literature [10,48]. The cluster analysis method identifies statistical inferences through sampling distribution and recognizes the estimated values that are positive and statistically significant in data analysis [9].
This bibliometric network analysis uses the database file that was extracted from the WOS on 11 October 2020, which included 209 articles and 4663 citations, and which was specified in Section 2. A network model was constructed and analyzed using VOSviewer software which determines the similarities between articles [49]. This cluster analysis tool describes and establishes boundaries of knowledge, links between edges of studies, and areas of opportunity for future research.
The analysis process involves using a threshold setting for reflecting similarities accurately. A low threshold usually adds more networks and links as there is a higher chance that more indicators meet the lowest parameter given. On the contrary, a high threshold provides fewer results because there are fewer that meet the criteria [10,50]. Van Eck and Waltman [49,51] suggested the clustering resolution to be adjusted so the network map contains a stable set of clusters that make sense to a knowledge domain specialist. Following that guidance, the optimum settings were determined through trial and error and were optimally set between 80 and 95.
In the next three subsections, this research constructs and analyzes the bibliometric information by journal, author, and article.
4.1. Journal Network Analysis
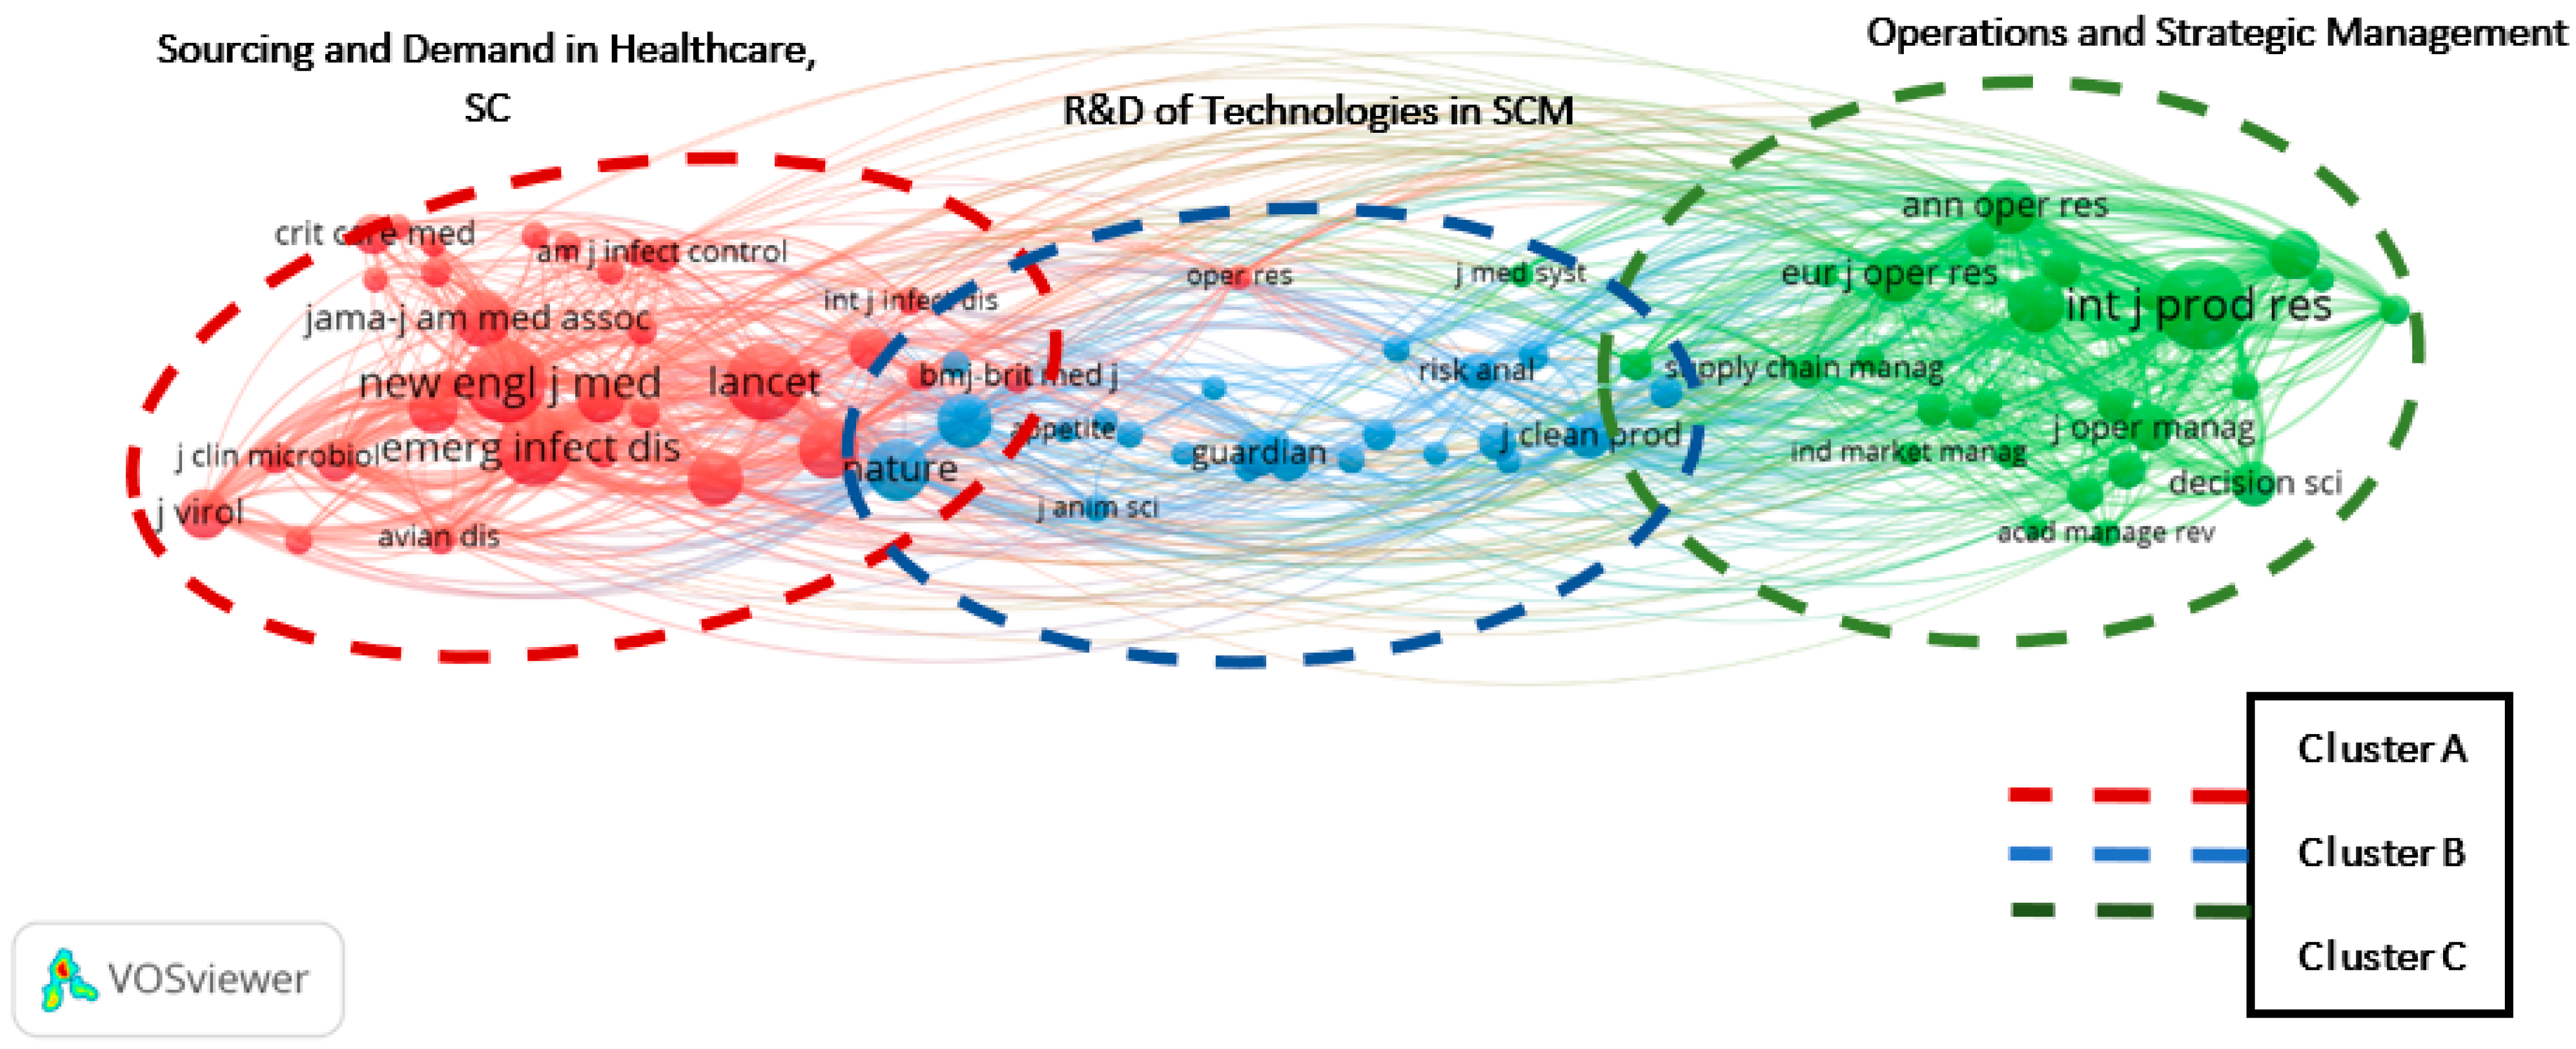
A co-citation network analysis was conducted to graphically identify the knowledge structure and determine the impacts the various journals have on pandemic supply chain research. The analysis of 209 articles and 4663 total citations found that 85 journals meet the threshold with ≤12 co-citations.
It is interesting to see in Figure 3 that the data reveal substantial differences between the three dominant clusters. Figure 3 also displays the node size, which reflects the relative proportion of the journal frequency on the co-cited items. The proximity between journals determines the frequency at which those journals co-cited each other.
The journal results provide evidence of three clusters, including the following:
- Cluster A: This cluster represents journals that publish articles related to sourcing and demand in the healthcare supply chain. This cluster includes 33 out of 85 journals and accounts for 1103 co-citation references that represent an outcome index of ~45% of the grand total. The main journals represented in this cluster are Emerging Infectious Diseases, Science, and Lancet.
- Cluster B: This cluster represents research and development of technologies in the supply chain. It includes 24 out of 85 journals that have the lowest in both link strength and co-citation count, ~14% and ~22%, respectively. The main journals represented in this cluster are Nature, PLOS one, and the Journal of Cleaner Production.
- Cluster C: This cluster represents journals publishing operations and strategic management. It includes 28 out of 85 journals that represent the largest link strength with an 36,445 index value, ~51% of the grand total. The main journals represented in this cluster are the International Journal of Production Research, Annals of Operations Research and European Journal of Operations Research.
Table 10 shows details of the link strengths. The link strength determines the full relationship of an item with other items. As the significant similarity of attributes increases, so does the link strength. The five journals per cluster represent ≥16%, ≤8%, and ≤27%, respectively, of the literature.
Next, a weighted link strength analysis was performed of the top five journals per cluster and their interactions are shown in Table 10. The five journals per cluster represent ≥46%, ≤54%, and ≤55%, respectively, of the clusters’ weight. Total link strength accounts for ~51% of the cluster. A weighted calculation considers only the varying degrees of importance in the cluster, determining the relative importance of each data point and therefore its proportional weight as part of the cluster. Two averages have different weightings, and they require a segmented analysis to determine dependence or interaction. Simpson’s paradox explains that a set of numbers cannot necessarily be statically immutable; therefore, there is a possibility that statistical inferences can change. Associations among two group variables are qualitatively different if they are compared individually and as a part of the unit. Therefore, better conclusions can be made through cluster analysis with an overall proportional analysis. A fair comparison implies determining the proportion based on the total sample of study; therefore, the grand total analysis provides such a dimension measure [52].
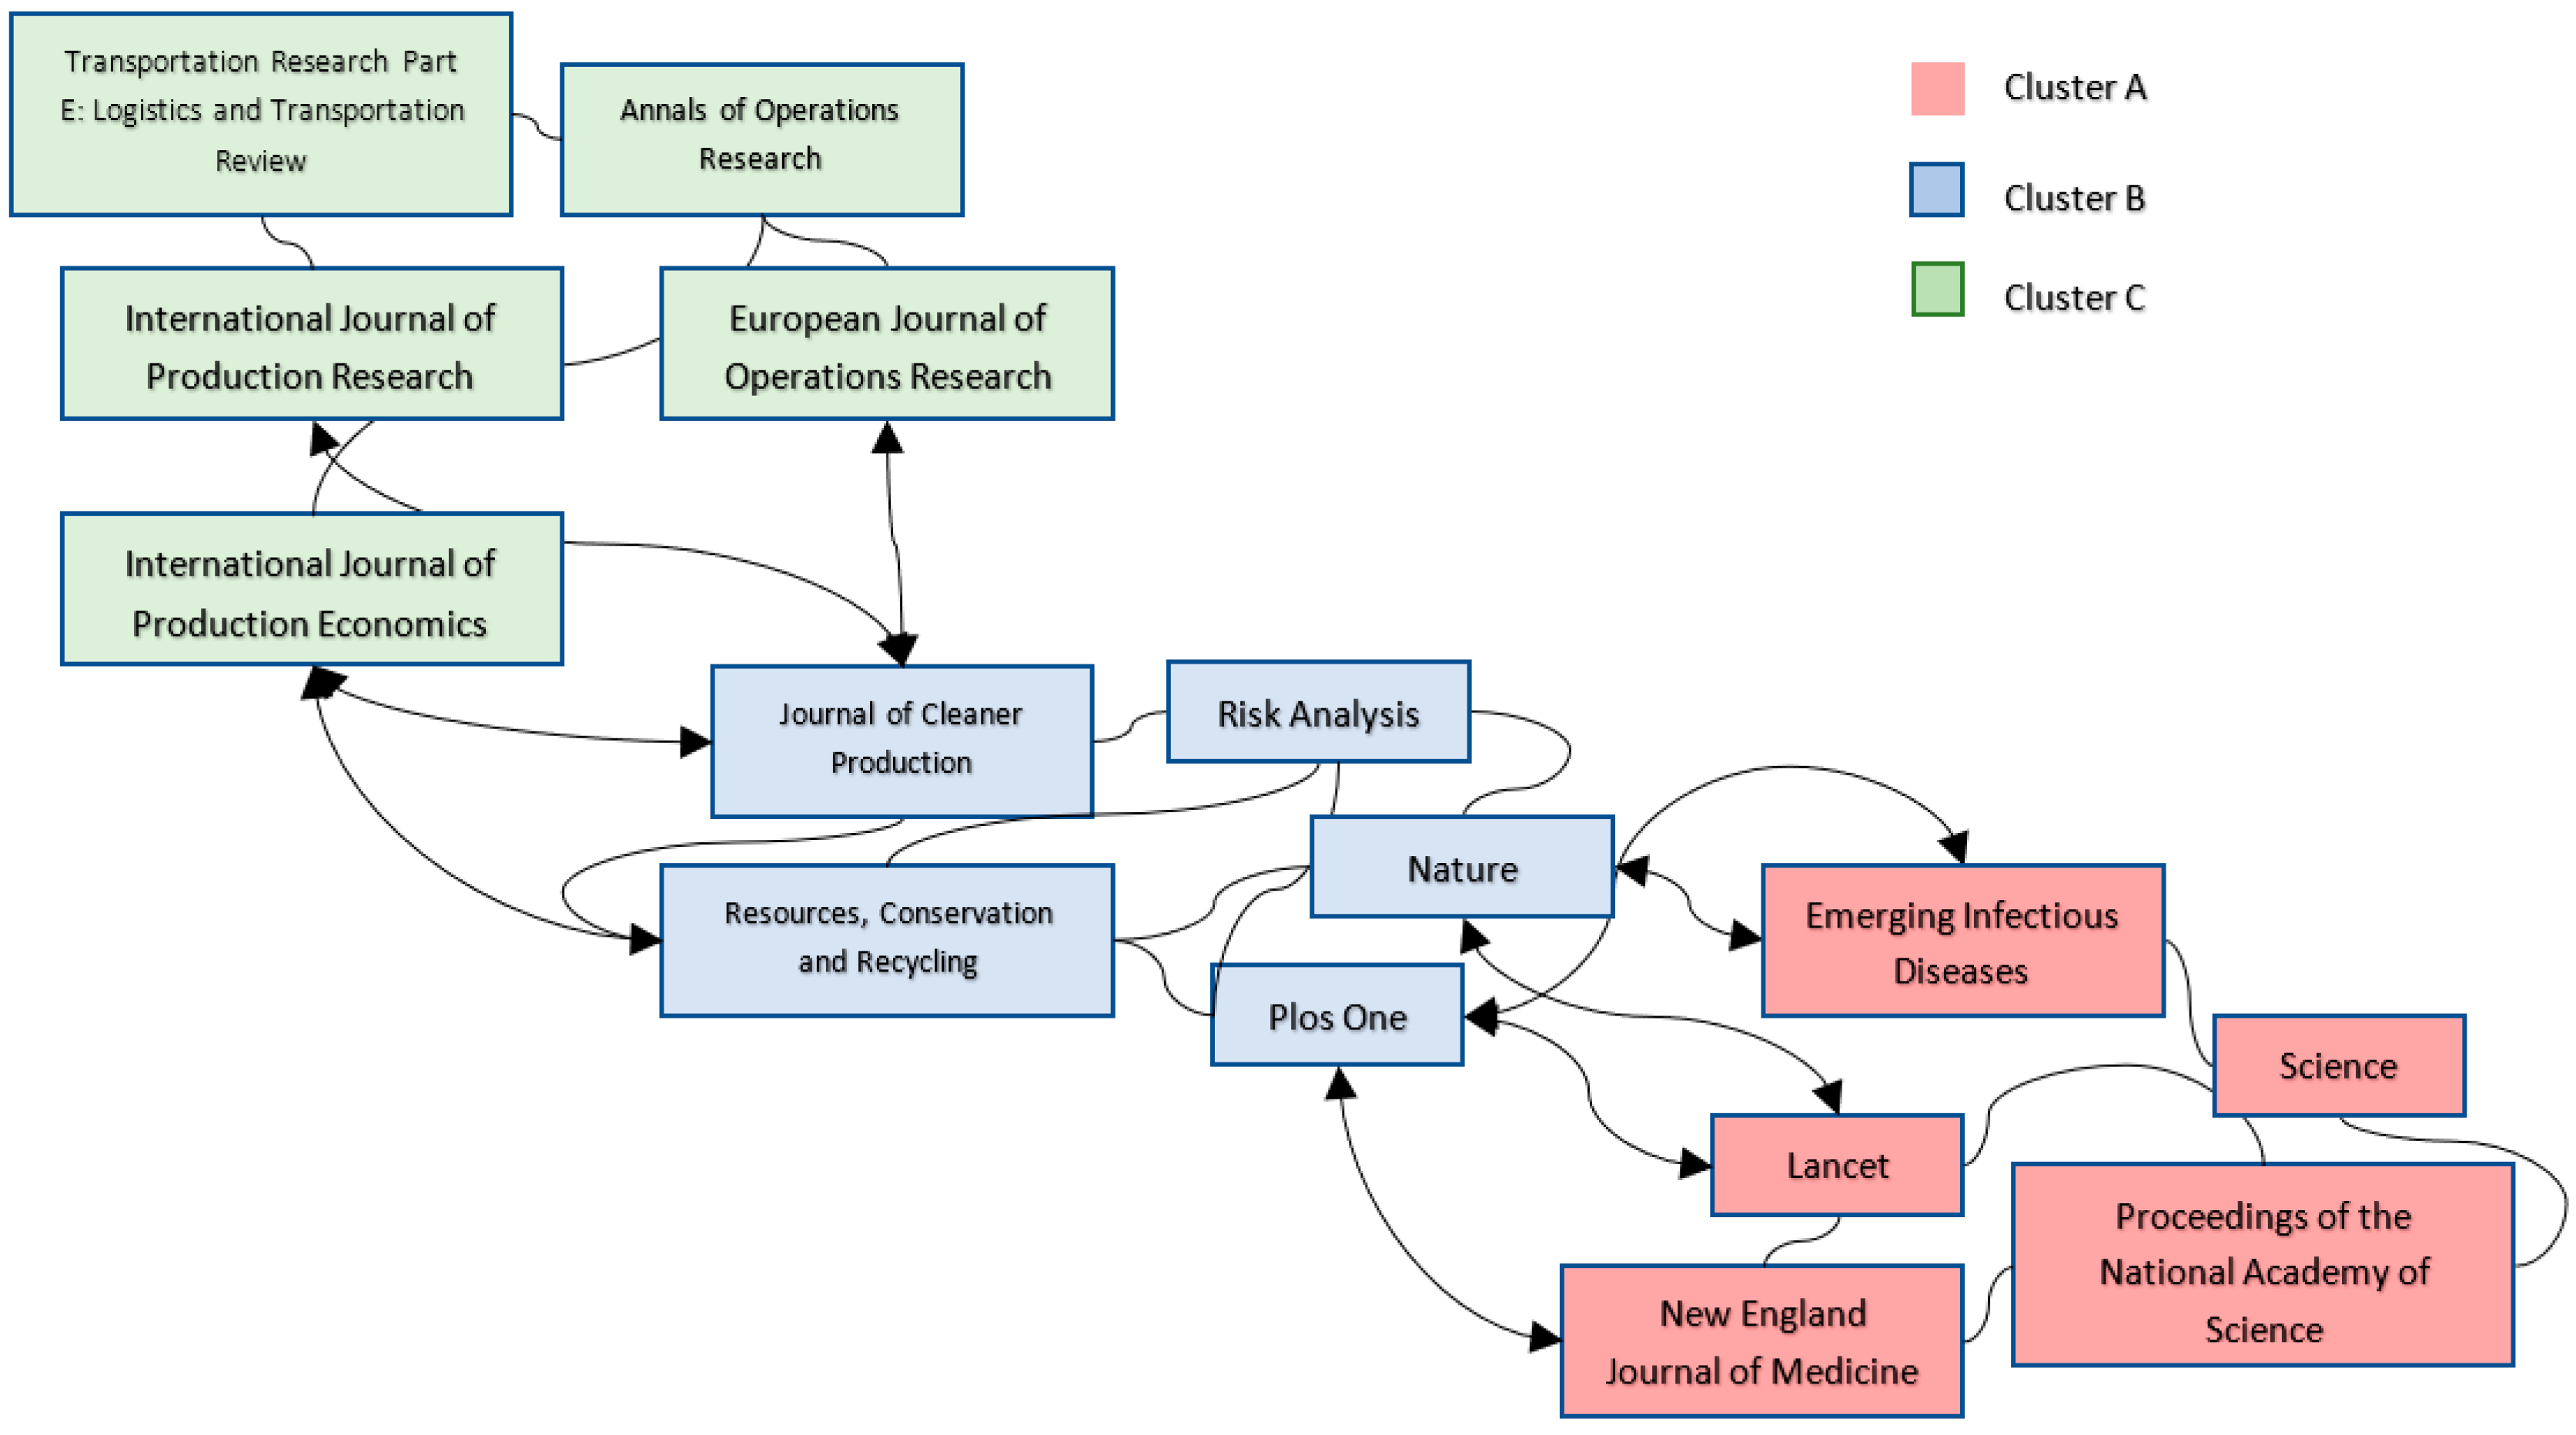
A tree diagram in Figure 4 shows the hierarchical clustering and predominant connectivity between the top five journals in each cluster. An important finding was that the cluster with higher co-citation strength, Cluster A, is not necessarily higher in link strength—that belongs to Cluster C. This led us to research the articles that were in the intersections of the clusters. The identification of this research provides evidence of how topics and knowledge are correlated.
4.2. Author Network Analysis
In this next section, we provide the results of a bibliometric network analysis based on the authors and their citations. This analysis is especially useful because collaborative research is one of the known direct approaches to frame knowledge. Innovations and models are not built in isolation. Scientific collaboration facilitates complex issues solving and evolving research paths [53]. The next analysis seeks to identify highly influential “pandemic and supply chain” research authors and their strengths based on authors’ and co-authorships’ systematic approaches. The network links change rapidly in 2020. The distance between authors in the graph represents research similarity.
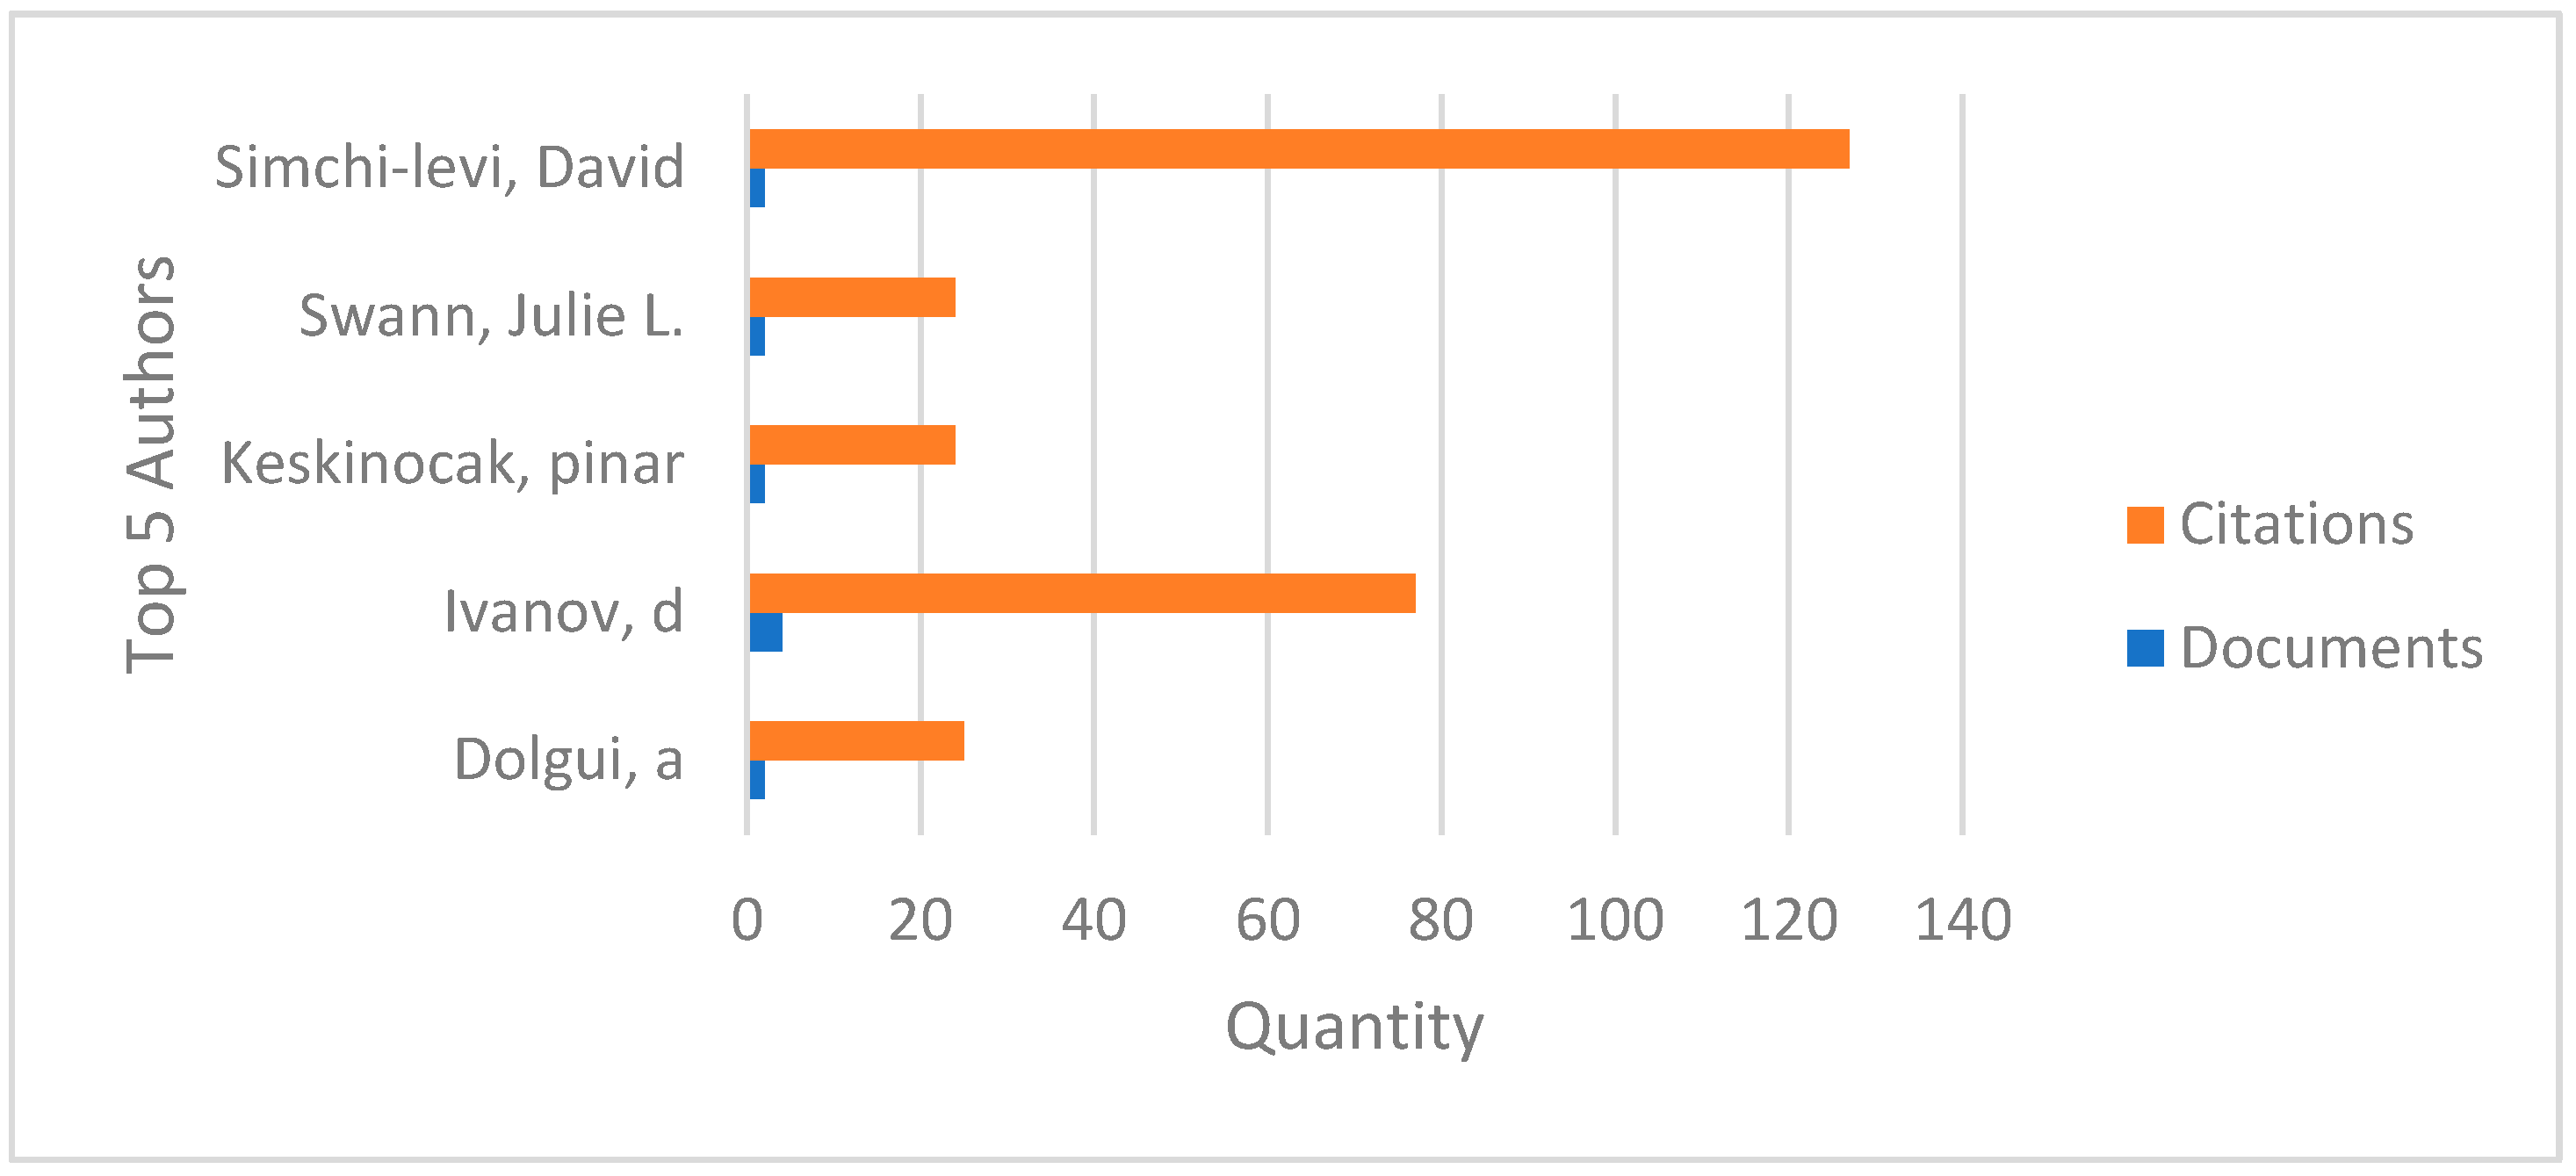
Figure 5 displays the primary authors who are shaping current research. The analysis found that of 915 authors cited, five meet the threshold of having at least >13 co-citations and >2 documents. Knowledge networks diverge based on alternate scientific endeavors. The top five authors and a suggested description of each author’s research are:
- Dolgui, A, transportation, network, and operations research;
- Ivanov, D, operations research;
- Keskinocak, P, healthcare supply chain;
- Simchi-Levi, D, supply chain management and manufacturing;
- Swann, J., inventory mapping and food distribution.
A bar chart helps to visualize how the authors’ clusters were divided into smaller classes and to identify the proportional relationship of each part on the total. See Figure 6.
4.3. Article Network Analysis
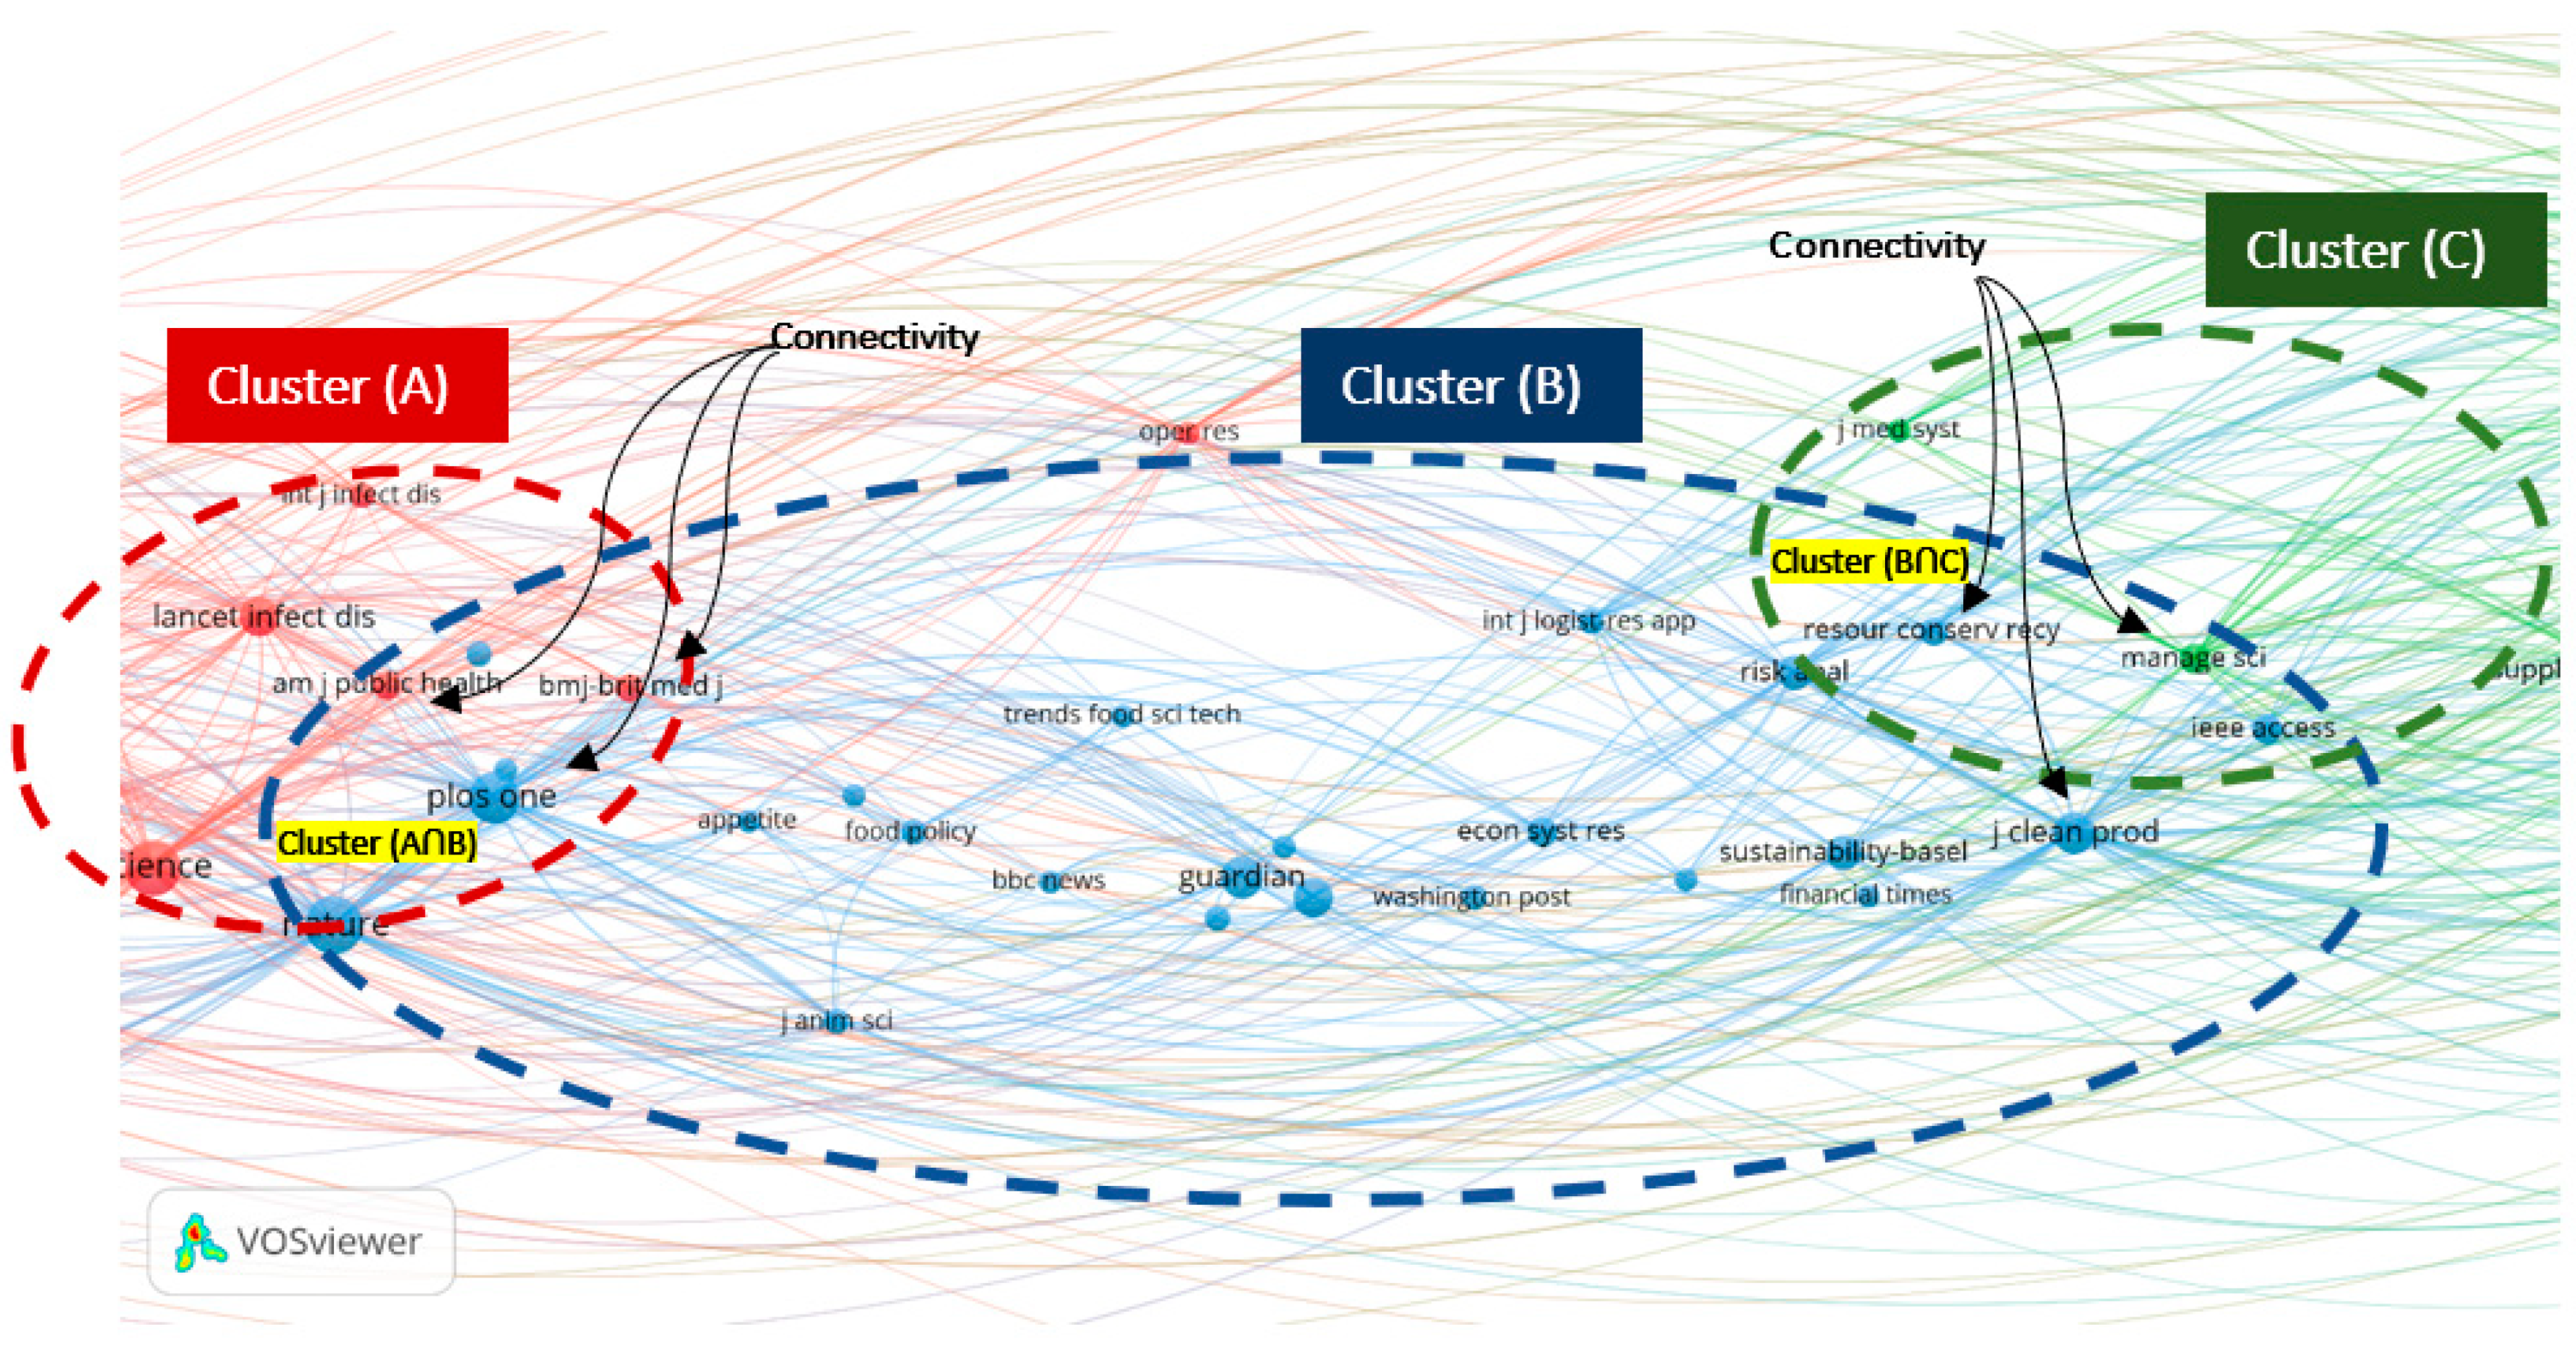
This third bibliometric network analysis focuses on the most influential articles on pandemic supply chain research. (Figure 7)
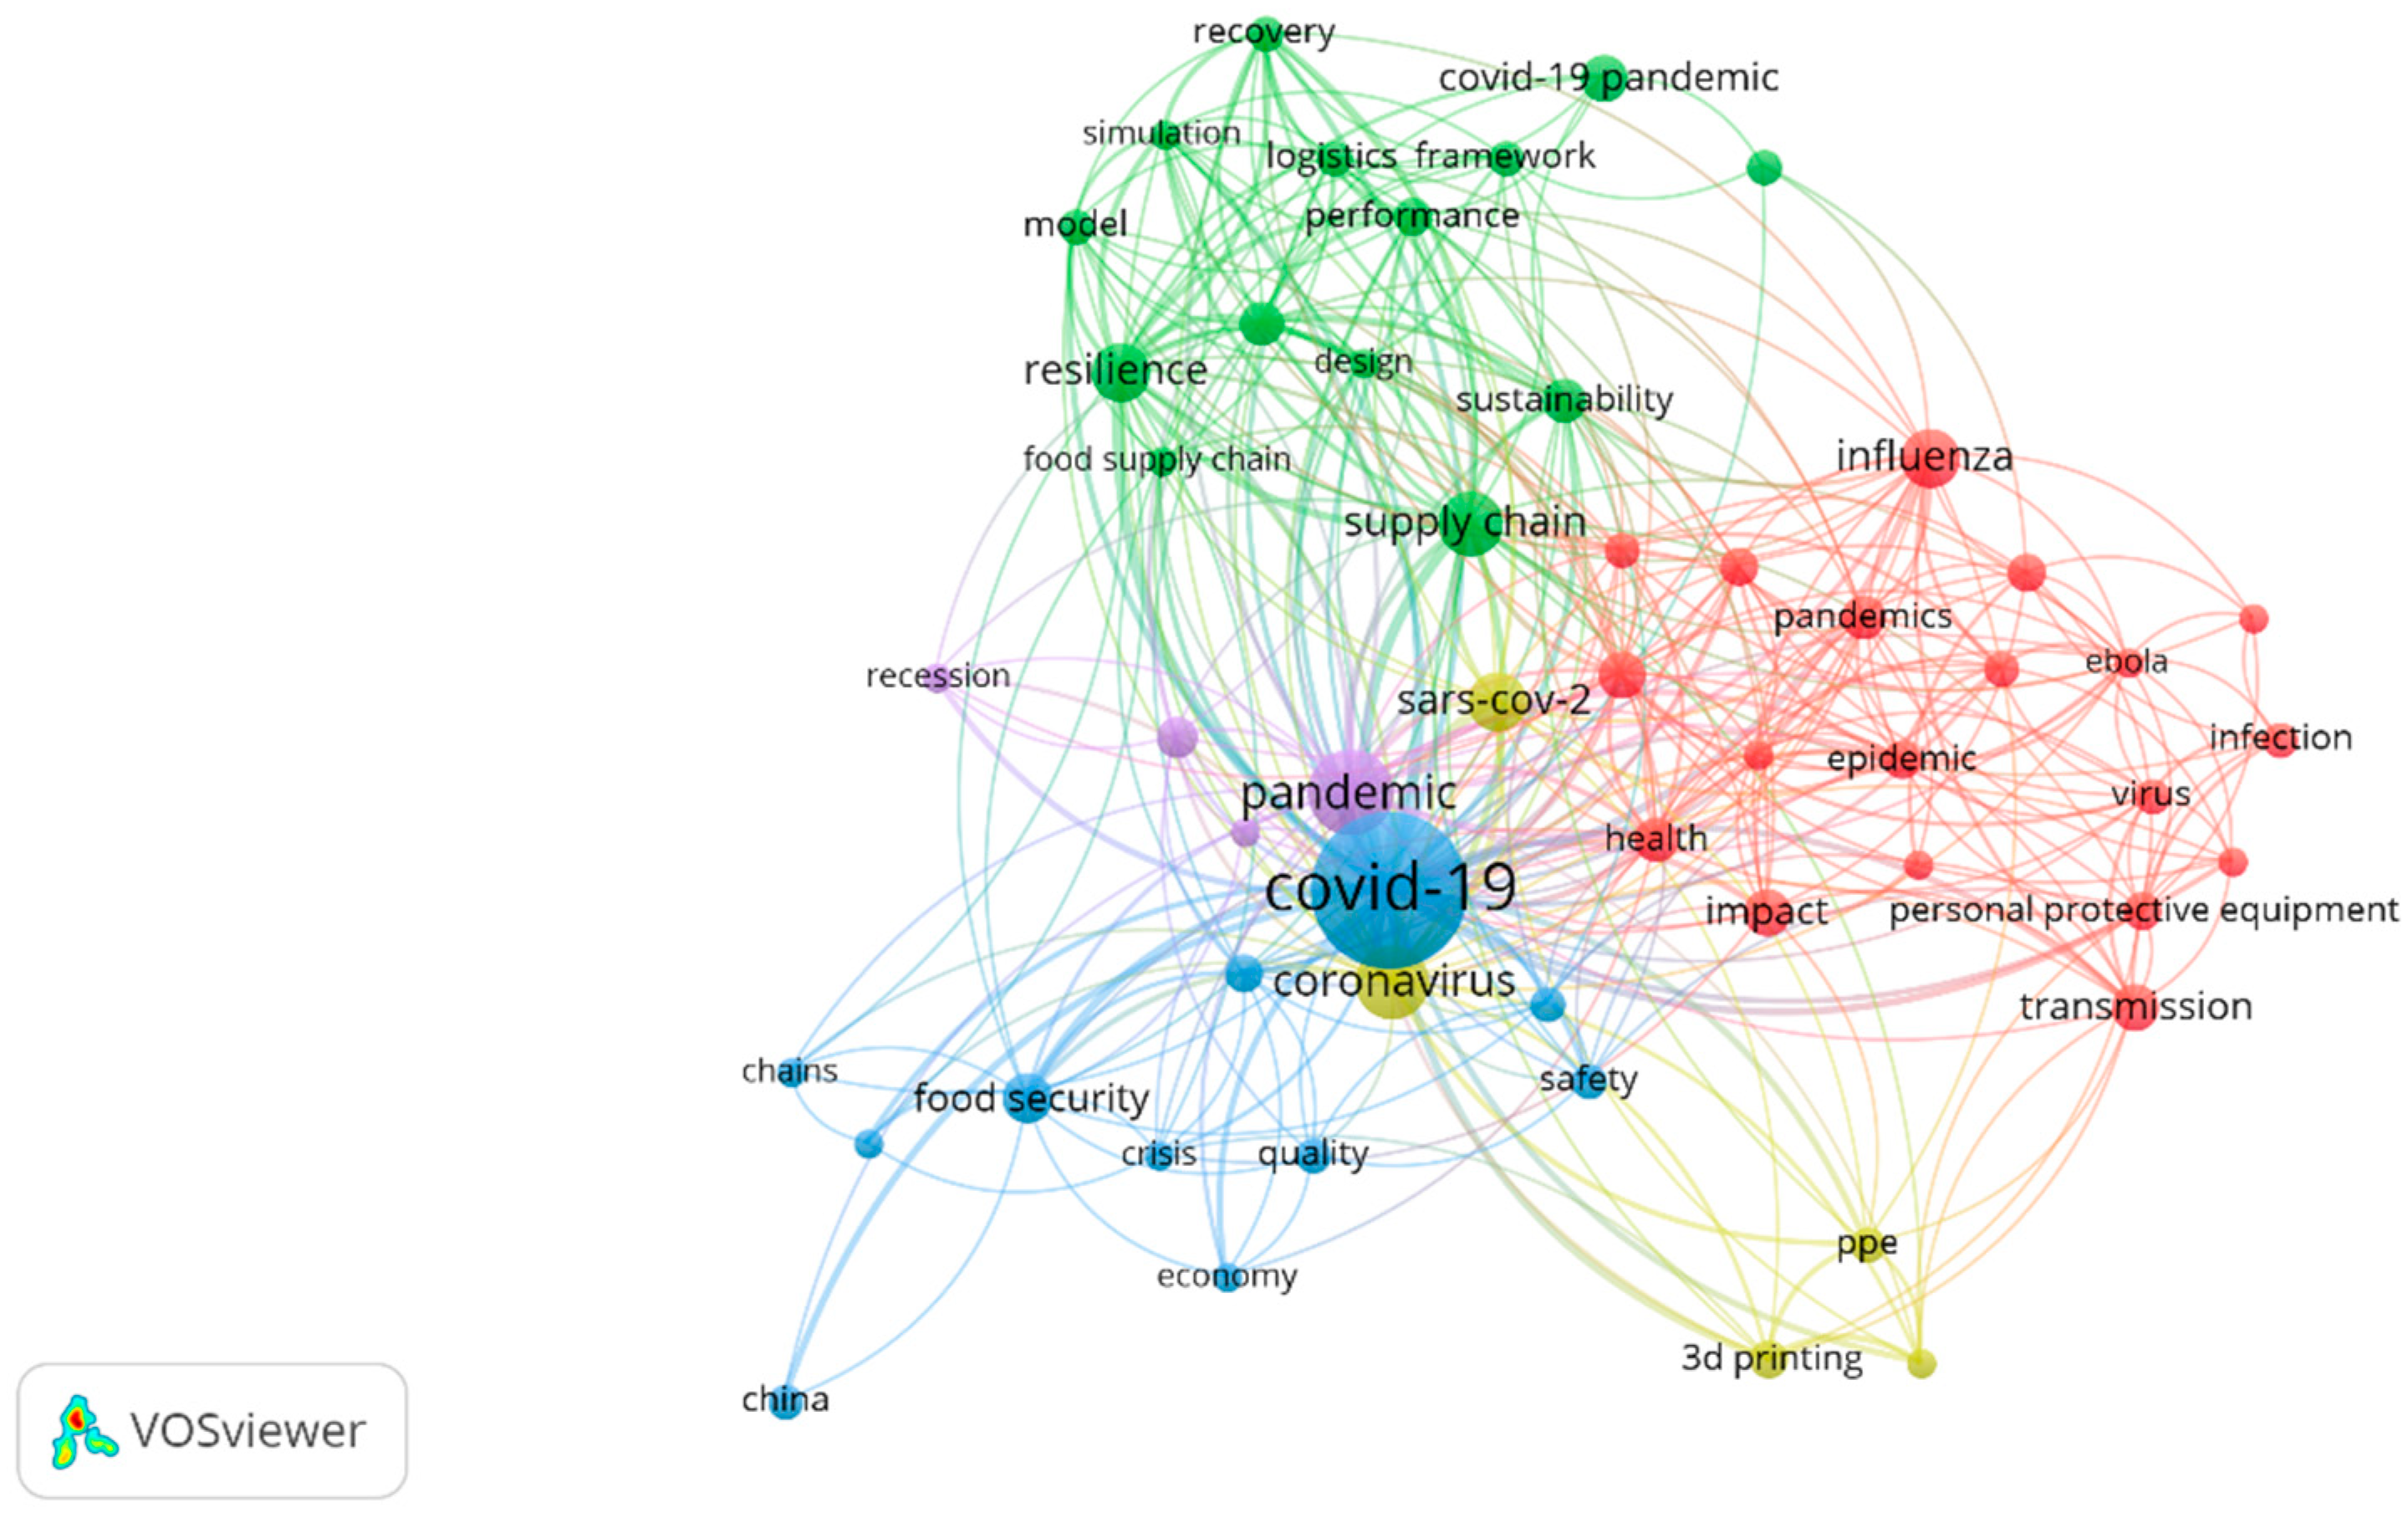
Next, this research provides an analysis of articles by showing the occurrence of keywords. Citations of article keywords provide significant opportunities to map current research, measure objectivity, and evaluate future paths [54]. The significant keywords that surfaced during this research are integration, simulation, planning, development, and sustainability. The evaluation of the data is shown in (Figure 8). Keyword analysis showed 1134 keywords with ≥4 occurrences; 91 meet the threshold. In other words, 91 articles had ≥4 occurrences of the same keyword. A mapping through keywords provides visibility on indicators of current research. [55]. This experiment was employed to identify co-occurrences of articles’ keywords.
An important goal associated with network analysis is to identify connecting and overlapping research [56,57]. In cluster analysis, overlapping indicates that the same articles have relevance to two clusters; for example, see the intersections (A∩B) and (B∩C) [56]. The main articles found in the intersection of (A∩B) and in the intersection of (B∩C) are shown in Table 11.
The clusters are depicted by color in Figure 8. The cluster strength and main topics of the articles which meet the threshold are shown in Table 12.
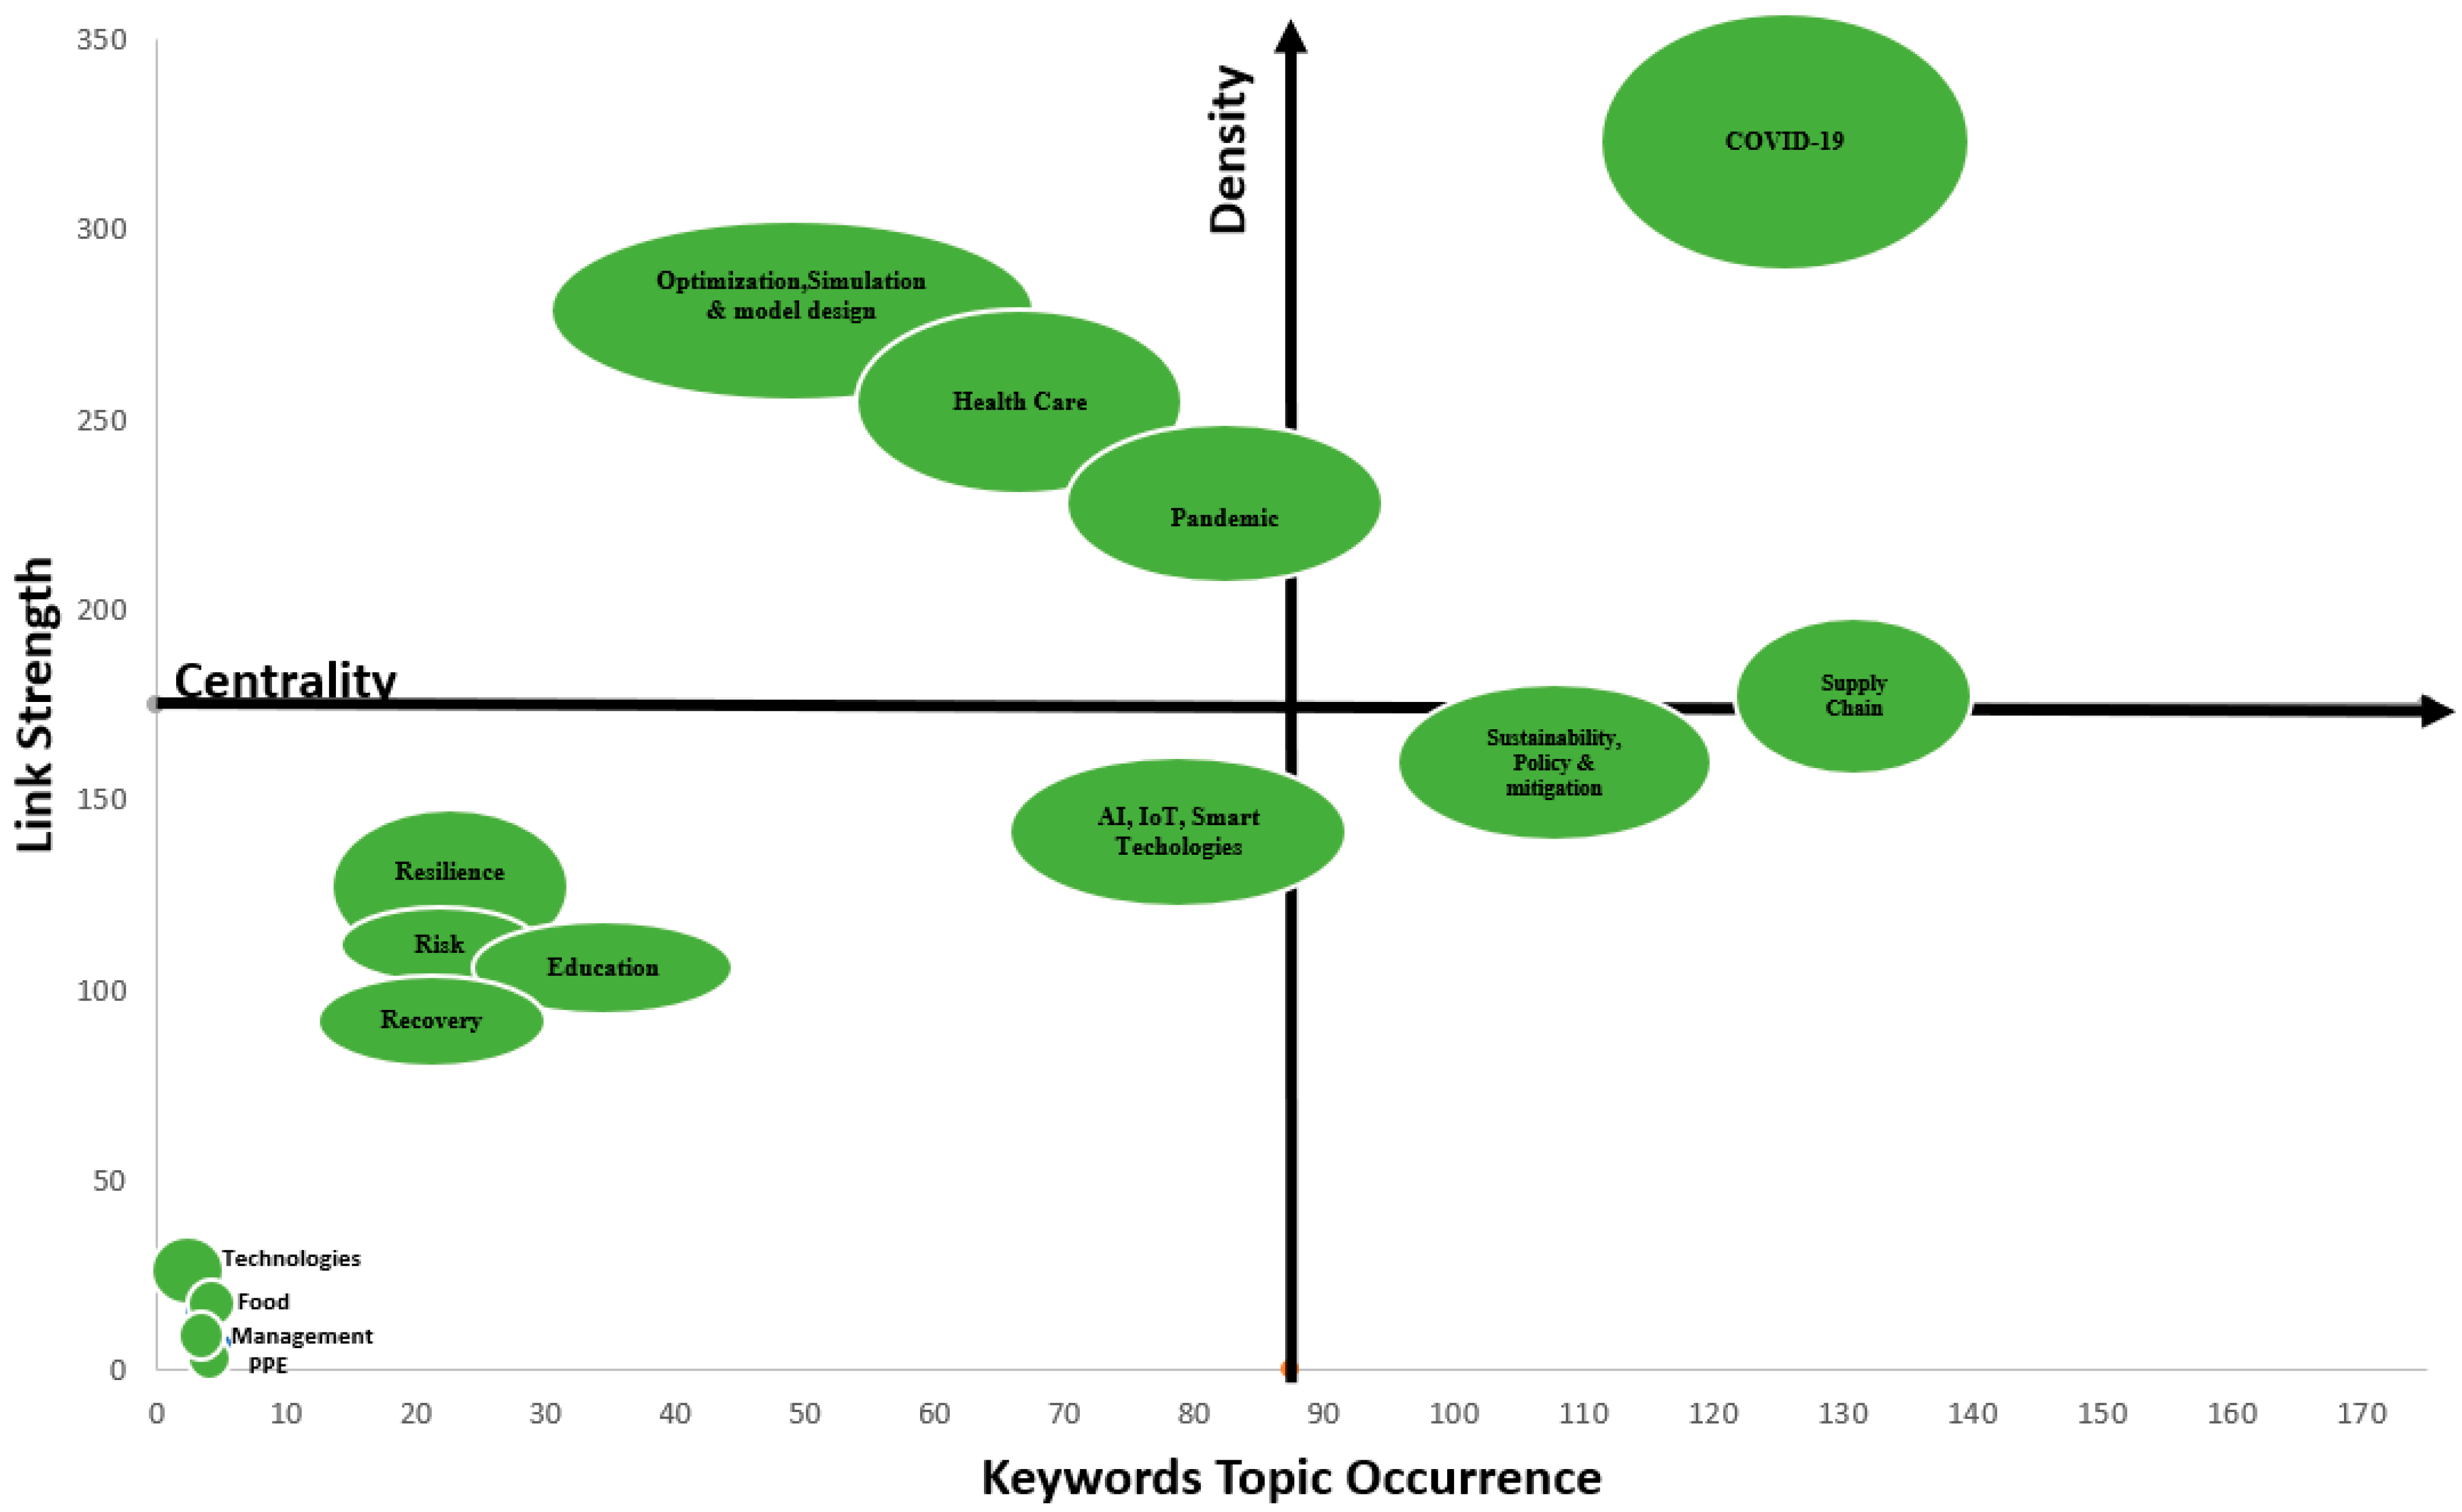
The fundamental keywords of the articles were divided and graphed in a quadrant, see Figure 9. The link strength and keyword occurrence were categorized based on the “centrality” and “density” of the keyword. Centrality is based on each article’s approximation to the center of the cluster. Density is proportional to the number of keyword occurrences. [50]
The research article keywords are represented as ovals in Figure 9. The oval size is proportional to the number of papers referencing such topics
Quadrant I (medium keyword topic occurrence and high density);
Quadrant II (high keyword topic occurrence and high density);
Quadrant III (low keyword topic occurrence and low density);
Quadrant IV (high keyword topic occurrence and medium density).
5. Conclusions and Future Research
Two general reactions have been made by companies and governments during pandemics, those of either contracting or expanding relationships. First, in the face of a pandemic, managers and policy leaders can contract, seeking to limit the exposure of their supply chains. Governments and companies might feel too dependent on foreign supply and wish to lessen the risks of globalization on their food supply chains [43]. When reacting in this way, globalization is potentially being reduced while entities reduce their vulnerability, and this could worsen employment and poverty in developing countries [58]. Alternatively, leaders can seek to expand the collaboration and network connections of their supply chains. New ways to collaborate among entities may grow [59]. Kerr [43] suggested that governments may need to fortify institutions that govern trade. Either reaction seems plausible. Academics should explore the effectiveness of expanding or contracting relationships during a pandemic. The proper strategy may depend on the strength of resources or the capabilities of each country or company. What is the effectiveness of the alternate strategies to the onslaught of a pandemic: embracing supply chain collaboration across international borders or limiting company relationships to within its own borders?
Academics should explore the concept of the “ripple effect.” Examining the literature reveals several studies that describe the complications of ripple effects in the supply chain [3,5,60]. Santos, J 2014 (p. 1057) indicated “there is currently no integrated modeling framework that is capable of disaggregating the ripple effects of workforce disruptions across interdependent infrastructure systems, regions, and recovery time scales”. The ripple effect in the supply chain is defined as resulting from disruption propagation from the initial disruption point to the supply, production, and distribution networks [5] (p. 2083). Orsi and Santos [61] discussed the probabilistic modeling of disruptions and independent ripple effects. That research discusses ripple effects during pandemics. The ripple effect would lend favor to arguments that stress the importance of an integrated, collaborative global supply chain or vertical supply chains without crossing international borders.
Next, much of the initial literature on pandemic supply chains in 2020 has focused on the possibilities of 3D printing [62,63]. The frequency of 3D printing research may signal a topic of high importance or merely low-hanging fruit. Research needs to continue to explore 3D printing for meeting the requirements of consumers during a widespread disruption.
It has been noted that supply chain activity during pandemics is different from typical disruptions. This can be seen by anecdotes and is supported in supply chain research [4,17]. This offers new opportunities to apply existing theoretical lenses and possibly the application of theoretical lenses that have not yet been applied to supply chain management.
Finally, it is widely believed that governments around the world were not as prepared for the COVID-19 crisis as they could have been [63]. Scholars have considered an upcoming pandemic and its ramifications, stressing the need for all levels of government to be prepared [26,64]. Perhaps now our vivid experience can motivate research which can facilitate improvements in world preparedness.
Author Contributions
Conceptualization, D.S.; Data curation, L.S.; Formal analysis, D.S.; Investigation, D.S. and L.S.; Methodology, L.S.; Software, L.S.; Visualization, D.S.; Writing—original draft, D.S.; Writing—review & editing, D.S. All authors have read and agreed to the published version of the manuscript.
Funding
This research received no external funding.
Institutional Review Board Statement
Not applicable.
Informed Consent Statement
Not applicable.
Data Availability Statement
Restrictions apply to the availability of these data. Data was obtained from Web of Science and are available with the permission of Web of Science.
Conflicts of Interest
The authors declare no conflict of interest.
References
- Haghani, M.; Bliemer, M.C.; Goerlandt, F.; Li, J. The scientific literature on Coronaviruses, COVID-19 and its associated safety-related research dimensions: A scientometric analysis and scoping review. Saf. Sci. 2020, 129, 104806. [Google Scholar] [CrossRef] [PubMed]
- Bloom, D.E.; Cadarette, D. Infectious disease threats in the twenty-first century: Strengthening the global response. Front. Immunol. 2019, 10, 549. [Google Scholar] [CrossRef] [PubMed] [Green Version]
- Queiroz, M.M.; Ivanov, D.; Dolgui, A.; Wamba, S.F. Impacts of epidemic outbreaks on supply chains: Mapping a research agenda amid the COVID-19 pandemic through a structured literature review. Ann. Oper. Res. 2020, 1–38. [Google Scholar] [CrossRef] [PubMed]
- Craighead, C.W.; Ketchen, J.D.J.; Darby, J.L. Pandemics and supply chain management research: Toward a theoretical toolbox *. Decis. Sci. 2020, 51, 838–866. [Google Scholar] [CrossRef]
- Ivanov, D. Simulation-based ripple effect modelling in the supply chain. Int. J. Prod. Res. 2017, 55, 2083–2101. [Google Scholar] [CrossRef]
- Massaro, M.; Dumay, J.; Guthrie, J. On the shoulders of giants: Undertaking a structured literature review in accounting. Account. Audit. Account. J. 2016, 29, 767–801. [Google Scholar] [CrossRef]
- Umscheid, C.A. A primer on performing systematic reviews and meta-analyses. Clin. Infect. Dis. 2013, 57, 725–734. [Google Scholar] [CrossRef] [Green Version]
- Durach, C.F.; Kembro, J.; Wieland, A. A new paradigm for systematic literature reviews in supply chain management. J. Supply Chain Manag. 2017, 53, 67–85. [Google Scholar] [CrossRef]
- Albright, S.; Winston, W.; Albright, S. Business Analytics; Cengage Learning: Boston, MA, USA, 2016. [Google Scholar]
- Van Eck, N.J.; Waltman, L. VOS: A new method for visualizing similarities between objects. In German-Japanese Interchange of Data Analysis Results; Springer Science and Business Media LLC: Berlin, Germany, 2007; pp. 299–306. [Google Scholar]
- Tauxe, R.V. Emerging foodborne pathogens. Int. J. Food Microbiol. 2002, 78, 31–41. [Google Scholar] [CrossRef]
- Loeb, M.; Dafoe, N.; Mahony, J.; John, M.; Sarabia, A.; Glavin, V.; Webby, R.; Smieja, M.; Earn, D.J.D.; Chong, S.; et al. Surgical mask vs. N95 respirator for preventing influenza among health care workers: A randomized trial. JAMA 2009, 302, 1865–1871. [Google Scholar] [CrossRef] [Green Version]
- Chick, S.E.; Mamani, H.; Simchi-Levi, D. Supply chain coordination and influenza vaccination. Oper. Res. 2008, 56, 1493–1506. [Google Scholar] [CrossRef] [Green Version]
- Webster, R.G. Influenza virus: Transmission between species and relevance to emergence of the next human pandemic. In Viral Zoonoses and Food of Animal Origin; Springer Science and Business Media LLC: Vienna, Austria, 1997; Volume 13, pp. 105–113. [Google Scholar]
- Rosa, S.G.V.; Santos, W.C. Clinical trials on drug repositioning for COVID-19 treatment. Rev. Panam. Salud Pública 2019, 44, 1–13. [Google Scholar] [CrossRef] [PubMed]
- Ivanov, D. Predicting the impacts of epidemic outbreaks on global supply chains: A simulation-based analysis on the coronavirus outbreak (COVID-19/SARS-CoV-2) case. Transp. Res. Part E Logist. Transp. Rev. 2020, 136, 101922. [Google Scholar] [CrossRef] [PubMed]
- Simchi-Levi, D.; Schmidt, W.; Wei, Y. From superstorms to factory fires: Managing unpredictable supply chain disruptions. Harv. Bus. Rev. 2014, 92, 96–101. [Google Scholar]
- Dasaklis, T.K.; Pappis, C.P.; Rachaniotis, N.P. Epidemics control and logistics operations: A review. Int. J. Prod. Econ. 2012, 139, 393–410. [Google Scholar] [CrossRef]
- Hayden, F.G. Respiratory viral threats. Curr. Opin. Infect. Dis. 2006, 19, 169–178. [Google Scholar] [CrossRef]
- Morales, C.A.; Porwollik, S.; Frye, J.G.; Kinde, H.; McClelland, M.; Guard-Petter, J. Correlation of phenotype with the genotype of egg-contaminating salmonella enterica serovar enteritidis. Appl. Environ. Microbiol. 2005, 71, 4388–4399. [Google Scholar] [CrossRef] [Green Version]
- Hibbeln, J.; Nieminen, L.R.G.; Lands, W.E.M. Increasing homicide rates and linoleic acid consumption among five western countries, 1961–2000. Lipids 2004, 39, 1207–1213. [Google Scholar] [CrossRef]
- Ugarte, S.; Arancibia, F.; Soto, R. Influenza A pandemics: Clinical and organizational aspects: The experience in Chile. Crit. Care Med. 2010, 38, e133–e137. [Google Scholar] [CrossRef] [Green Version]
- Aschemann-Witzel, J. Consumer perception and trends about health and sustainability: Trade-offs and synergies of two pivotal issues. Curr. Opin. Food Sci. 2015, 3, 6–10. [Google Scholar] [CrossRef]
- Jamieson, D.; Kellerman, S.E. The 90 90 90 strategy to end the HIV Pandemic by 2030: Can the supply chain handle it? J. Int. AIDS Soc. 2016, 19, 20917. [Google Scholar] [CrossRef] [PubMed]
- Kalra, S.P. Disruption in the leptin-NPY link underlies the pandemic of diabetes and metabolic syndrome: New therapeutic approaches. Nutrition 2008, 24, 820–826. [Google Scholar] [CrossRef] [PubMed] [Green Version]
- Ekici, A.; Keskinocak, P.; Swann, J. Modeling influenza pandemic and planning food distribution. Manuf. Serv. Oper. Manag. 2014, 16, 11–27. [Google Scholar] [CrossRef]
- Khalili, J.S.; Zhu, H.; Mak, N.S.A.; Yan, Y.; Zhu, Y. Novel coronavirus treatment with ribavirin: Groundwork for an evaluation concerning COVID-19. J. Med. Virol. 2020, 92, 740–746. [Google Scholar] [CrossRef] [PubMed] [Green Version]
- Rowan, N.J.; Laffey, J.G. Challenges and solutions for addressing critical shortage of supply chain for personal and protective equipment (PPE) arising from Coronavirus disease (COVID19) pandemic—Case study from the Republic of Ireland. Sci. Total Environ. 2020, 725, 138532. [Google Scholar] [CrossRef] [PubMed]
- Ivanov, D.; Dolgui, A. A digital supply chain twin for managing the disruption risks and resilience in the era of Industry 4.0. Prod. Plan. Control. 2020, 1–14. [Google Scholar] [CrossRef]
- Petrova, E.V.; Avadhanula, V.; Michel, S.; Gincoo, K.E.; Piedra, P.A.; Anandasabapathy, S. Remote laboratory management: Lab. J. Vis. Exp. 2019, 146, e59188. [Google Scholar] [CrossRef] [Green Version]
- Yuen, K.F.; Wang, X.; Ma, F.; Li, K.X. The psychological causes of panic buying following a health crisis. Int. J. Environ. Res. Public Health 2020, 17, 3513. [Google Scholar] [CrossRef]
- Schätter, F.; Hansen, O.; Wiens, M.; Schultmann, F. A decision support methodology for a disaster-caused business continuity management. Decis. Support. Syst. 2019, 118, 10–20. [Google Scholar] [CrossRef]
- Li, Z.; Swann, J.L.; Keskinocak, P. Value of inventory information in allocating a limited supply of influenza vaccine during a pandemic. PLoS ONE 2018, 13, e0206293. [Google Scholar] [CrossRef] [Green Version]
- Lin, C.; Lin, C.-M.; Yen, D.C.; Wu, W.-h. The integrated information architecture: A pilot study approach to leveraging logistics management with regard to influenza preparedness. J. Med. Syst. 2012, 36, 187–200. [Google Scholar] [CrossRef] [PubMed]
- Guan, D.; Wang, D.; Hallegatte, S.; Davis, S.J.; Huo, J.; Li, S.; Bai, Y.; Lei, T.; Xue, Q.; Coffman, D.; et al. Global supply-chain effects of COVID-19 control measures. Nat. Hum. Behav. 2020, 4, 577–587. [Google Scholar] [CrossRef] [PubMed]
- Stramer, S.L.; Collins, C.; Nugent, T.; Wang, X.; Fuschino, M.; Heitman, J.W.; Law, J.; Krysztof, D.E.; Kiely, N.; Todd, D.; et al. Sensitive detection assays for influenza RNA do not reveal viremia in US blood donors. J. Infect. Dis. 2012, 205, 886–894. [Google Scholar] [CrossRef]
- Zinckgraf, J.W.; Sposato, M.; Zielinski, V.; Powell, D.; Treanor, J.J.; von Hofe, E. Identification of HLA class II H5N1 hemagglutinin epitopes following subvirion influenza A (H5N1) vaccination. Vaccine 2009, 27, 5393–5401. [Google Scholar] [CrossRef] [PubMed]
- Jethwani, P.; Saboo, B.; Jethwani, L.; Kesavadev, J.; Kalra, S.; Sahay, R.; Agarwal, S.; Hasnani, D. Management of children and adolescents having type 1 diabetes during COVID-19 pandemic in India: Challenges and solutions. Int. J. Diabetes Dev. Ctries. 2020, 40, 1–5. [Google Scholar] [CrossRef]
- McGregor, R.; Whitcombe, A.; Sheen, C.; Dickson, J.; Day, C.; Carlton, L.; Sharma, P.; Lott, J.; Koch, B.; Bennett, J. Collaborative networks enable the rapid establishment of serological assays for SARS-CoV-2 during nationwide lockdown in New Zealand. PeerJ 2020, 8, e9863. [Google Scholar] [CrossRef]
- Huong, N.; Nga, N.; Long, N.; Luu, B.; Latinne, A.; Pruvot, M.; Phuong, N.; Quang, L.; Hung, V.; Lan, N.; et al. Coronavirus testing indicates transmission risk increases along wildlife supply chains for human consumption in Vietnam, 2013–2014. PLoS ONE 2020, 15, e0237129. [Google Scholar] [CrossRef]
- Liao, W.; Hsu, M.; Shen, C.; Hung, K.; Cheng, C. Home sample self-collection for COVID-19 patients. Adv. Biosyst. 2020, 4, 2000150. [Google Scholar]
- Gregoriano, C.; Koch, D.; Haubitz, S.; Conen, A.; Fux, C.; Mueller, B.; Bernasconi, L.; Hammerer-Lercher, A.; Oberle, M.; Burgermeister, S.; et al. Characteristics, predictors and outcomes among 99 patients hospitalised with COVID-19 in a tertiary care centre in Switzerland: An observational analysis. Swiss Med. Wkly. 2020. [Google Scholar] [CrossRef]
- Kerr, W.A. The COVID-19 pandemic and agriculture—Short and long run implications for international trade relations. Can. J. Agric. Econ./Rev. Can. d’Agroeconomie 2020, 68, 225–229. [Google Scholar]
- Siche, R. What is the impact of COVID-19 disease on agriculture? Sci. Agropecu. 2020, 11, 3–6. [Google Scholar] [CrossRef] [Green Version]
- Seleiman, M.F.; Selim, S.; Alhammad, B.A.; Alharbi, B.M.; Juliatti, F.C. Will novel coronavirus (Covid-19) pandemic impact agriculture, food security and animal sectors? Biosci. J. 2020, 36. [Google Scholar] [CrossRef]
- Larue, B. Labour issues and COVID-19. Can. J. Agric. Econ./Rev. Can. d’Agroeconomie 2020, 68, 231–237. [Google Scholar]
- Brandes, U.; Erlebach, T. Network Anlysis: Methodological Foundations; Springer: Berlin, Germany, 2005. [Google Scholar]
- Everitt, B.; Landau, S.; Leese, M.; Stahl, D. Cluster Analysis, 5th ed.; John Wiley & Sons, Ltd: West Sussex, UK, 2011. [Google Scholar]
- Van Eck, N.J.; Waltman, L. Software survey: VOSviewer, a computer program for bibliometric mapping. Science 2009, 84, 523–538. [Google Scholar] [CrossRef] [Green Version]
- Blondel, V.D.; Guillaume, J.-L.; Lambiotte, R.; Lefebvre, E. Fast unfolding of communities in large networks. J. Stat. Mech. Theory Exp. 2008, 2008, P10008. [Google Scholar] [CrossRef] [Green Version]
- Van Eck, N.J.; Waltman, L.; Dekker, R.; Van Der Berg, J. A comparison of two techniques for bibliometric map-ping: Multidimensional scaling and VOS. J. Am. Soc. Inf. Sci. Technol. 2010, 61, 2405–2416. [Google Scholar] [CrossRef] [Green Version]
- Blyth, C. On Simpson’s Paradox and the Sure-Thing Principle. J. Am. Stat. Assoc. 1972, 67, 364–366. [Google Scholar] [CrossRef]
- Sonnenwald, D.H. Scientific collaboration. Annu. Rev. Inf. Sci. Technol. 2007, 41, 643–681. [Google Scholar] [CrossRef]
- Garfield, E. Is citation analysis a legitimate evaluation tool? Science 1979, 1, 359–375. [Google Scholar] [CrossRef]
- Besselaar, P.V.D.; Heimeriks, G. Mapping research topics using word-reference co-occurrences: A method and an exploratory case study. Science 2006, 68, 377–393. [Google Scholar] [CrossRef]
- Adam, A.; Blockeel, H. Dealing with overlapping clustering: A constraint-based approach to algorithm selection. MetaSel@ PKDD/ECML 2015, 1, 43–54. [Google Scholar]
- Mayrose, I.; Freilich, S. The interplay between scientific overlap and cooperation and the resulting gain in co-authorship Interactions. PLoS ONE 2015, 10, e0137856. [Google Scholar] [CrossRef] [PubMed] [Green Version]
- Yaya, S.; Otu, A.; Labonté, R. Globalisation in the time of COVID-19: Repositioning Africa to meet the immediate and remote challenges. Glob. Health 2020, 16, 1–7. [Google Scholar] [CrossRef]
- Dey, S.; Cheng, Q.; Tan, J. All for one and one for all: Why a pandemic preparedness league of nations? Health Policy Technol. 2020, 9, 179–184. [Google Scholar] [CrossRef] [PubMed]
- Santos, J.; Herrera, L.C.; Yu, K.D.S.; Pagsuyoin, S.A.T.; Tan, R.R. State of the art in risk analysis of workforce criticality influencing disaster preparedness for interdependent systems. Risk Anal. 2014, 34, 1056–1068. [Google Scholar] [CrossRef]
- Orsi, M.J.; Santos, J. Probabilistic modeling of workforce-based disruptions and input-output analysis of interdependent ripple effects. Econ. Syst. Res. 2010, 22, 3–18. [Google Scholar] [CrossRef]
- Hsiao, W.-K.; Lorber, B.; Paudel, A. Can 3D printing of oral drugs help fight the current COVID-19 pandemic (and similar crisis in the future)? Expert Opin. Drug Deliv. 2020, 17, 899–902. [Google Scholar] [CrossRef]
- Larrañeta, E.; Dominguez-Robles, J.; Lamprou, D.A. Additive manufacturing can assist in the fight against COVID-19 and other pandemics and impact on the global supply chain. 3D Print. Addit. Manuf. 2020, 7, 100–103. [Google Scholar] [CrossRef]
- Tosh, P.K.; Feldman, H.; Christian, M.D.; Devereaux, A.V.; Kissoon, N.; Dichter, J.R. Business and continuity of operations: Care of the critically ill and injured during pandemics and disasters: CHEST consensus statement. Chest 2014, 146, e103S–e117S. [Google Scholar] [CrossRef] [Green Version]
Figure 1.
Flow Chart of the Research Process.

Figure 2.
2020 Research Subjects and Article Quantity.

Figure 3.
Journal Network Analysis. Statistical Inference through Clustering Analysis (by Journal, Co-Citation and Link Strength).
Figure 3.
Journal Network Analysis. Statistical Inference through Clustering Analysis (by Journal, Co-Citation and Link Strength).

Figure 4.
Hierarchical Clustering Tree Representation of Top Journals.

Figure 5.
Network Author Analysis.

Figure 6.
Stacked Author Network analysis.

Figure 7.
Article Connectivity and Overlapping Analysis.

Figure 8.
Article Network Through Clustering Analysis (source: VOSviewer).

Figure 9.
Articles’ Keyword Network Centrality and Density Analysis.


Table 1.
Highly Cited Pandemic Supply Chain Research.
| YEAR | AUTHORS | JOURNAL | CITATIONS | WOS “JOURNAL IMPACT” INDEX | SCOPUS “CITESCORE” INDEX |
|---|---|---|---|---|---|
| 2002 | [11] Tauxe, RV | INTERNATIONAL JOURNAL OF FOOD MICROBIOLOGY | 239 | 4.2 | 7.4 |
| 2009 | [12] Loeb, M., et al. | JAMA-JOURNAL OF THE AMERICAN MEDICAL ASSOCIATION | 234 | 45.5 | 26.3 |
| 2008 | [13] Chick, S. et al. | OPERATIONS RESEARCH | 79 | 2.4 | 4.9 |
| 1997 | [14] Webster, R | ARCHIVES OF VIROLOGY | 69 | 2.2 | 4.2 |
| 2020 | [15] Rosa and Santos | REVISTA PANAMERICANA DE SALUD PUBLICA-PAN AMERICAN JOURNAL OF PUBLIC HEALTH | 52 | 0.7 | 1.8 |
| 2020 | [16] Ivanov, D | TRANSPORTATION RESEARCH PART E-LOGISTICS AND TRANSPORTATION REVIEW | 51 | 4.7 | 8.1 |
| 2014 | [17] Simchi-Levi, D. et al., | HARVARD BUSINESS REVIEW | 48 | 5.7 | 1.9 |
| 2012 | [18] Dasaklis, T. et al. | INTERNATIONAL JOURNAL OF PRODUCTION ECONOMICS | 46 | 5.1 | 10.5 |
| 2019 | [2] Bloom and Cadarette | FRONTIERS IN IMMUNOLOGY | 45 | 5.1 | 5.4 |
| 2006 | [19] Hayden, F | CURRENT OPINION IN INFECTIOUS DISEASES | 45 | 4.6 | 7.1 |
| 2005 | [20] Morales, CA. et al. | APPLIED AND ENVIRONMENTAL MICROBIOLOGY | 43 | 4.0 | 7.1 |
| 2004 | [21] Hibbeln, Jr. et al. | LIPIDS | 43 | 1.9 | 4.2 |
| 2010 | [22] Ugarte, S. et al. | CRITICAL CARE MEDICINE | 40 | 7.4 | 10.6 |
| 2015 | [23] Aschemann-Witzel, J. | CURRENT OPINION IN FOOD SCIENCE | 32 | 4.6 | 7.6 |
| 2016 | [24] Jamieson and Kellerman | JOURNAL OF THE INTERNATIONAL AIDS SOCIETY | 30 | 5.6 | 7.1 |
| 2008 | [25] Kalra, Satya P. | NUTRITION | 27 | 3.6 | 6.1 |
| 2014 | [26] Ekici, A. et al. | M&SOM-MANUFACTURING & SERVICE OPERATIONS MANAGEMENT | 26 | 4.3 | 5.7 |
| 2020 | [27] Khalili, Jahan S. et al. | JOURNAL OF MEDICAL VIROLOGY | 24 | 2.0 | 4.0 |
| 2020 | [28] Rowan, Neil J. et al. | SCIENCE OF THE TOTAL ENVIRONMENT | 23 | 6.6 | 8.6 |
| 2020 | [29] Dolgui, Alexandre et al. | PRODUCTION PLANNING & CONTROL | 22 | 3.6 | 6.9 |
Table 2.
Research Articles by Category.
| CATEGORY | RECORD COUNT | PERCENTAGE |
|---|---|---|
| PUBLIC ENVIRONMENTAL OCCUPATIONAL HEALTH | 24 | 11.5% |
| MANAGEMENT | 22 | 10.5% |
| ECONOMICS | 15 | 7.2% |
| ENVIRONMENTAL SCIENCES | 15 | 7.2% |
| IMMUNOLOGY | 15 | 7.2% |
| OPERATIONS RESEARCH MANAGEMENT SCIENCE | 14 | 6.7% |
| MULTIDISCIPLINARY SCIENCES | 13 | 6.2% |
| AGRICULTURAL ECONOMICS POLICY | 11 | 5.3% |
| FOOD SCIENCE TECHNOLOGY | 11 | 5.3% |
| MEDICINE GENERAL INTERNAL | 10 | 4.8% |
| ENVIRONMENTAL STUDIES | 9 | 4.3% |
| BUSINESS | 8 | 3.8% |
| HEALTH POLICY SERVICES | 8 | 3.8% |
| INFECTIOUS DISEASES | 8 | 3.8% |
| MICROBIOLOGY | 7 | 3.3% |
| COMPUTER SCIENCE INFORMATION SYSTEMS | 6 | 2.9% |
| MEDICINE RESEARCH EXPERIMENTAL | 6 | 2.9% |
| VIROLOGY | 6 | 2.9% |
| GREEN SUSTAINABLE SCIENCE TECHNOLOGY | 1 | 0.5% |
| GRAND TOTAL | 209 | 100% |
Table 3.
Research Articles by Year.
| RESEARCH AREA | RECORD COUNT | PERCENTAGE |
|---|---|---|
| BUSINESS ECONOMICS | 30 | 14.4% |
| PUBLIC ENVIRONMENTAL OCCUPATIONAL HEALTH | 23 | 11.0% |
| ENGINEERING | 20 | 9.6% |
| ENVIRONMENTAL SCIENCES ECOLOGY | 19 | 9.1% |
| SCIENCE TECHNOLOGY OTHER TOPICS | 18 | 8.6% |
| IMMUNOLOGY | 15 | 7.2% |
| GENERAL INTERNAL MEDICINE | 14 | 6.7% |
| OPERATIONS RESEARCH MANAGEMENT SCIENCE | 14 | 6.7% |
| AGRICULTURE | 12 | 5.7% |
| HEALTH CARE SCIENCES SERVICES | 11 | 5.3% |
| FOOD SCIENCE TECHNOLOGY | 10 | 4.8% |
| TRANSPORTATION | 3 | 1.4% |
| INFECTIOUS DISEASES | 2 | 1.0% |
| MATERIALS SCIENCE | 2 | 1.0% |
| MICROBIOLOGY | 2 | 1.0% |
| COMPUTER SCIENCE | 2 | 1.0% |
| RESEARCH EXPERIMENTAL MEDICINE | 2 | 1.0% |
| VIROLOGY | 2 | 1.0% |
| PHARMACOLOGY PHARMACY | 2 | 1.0% |
| SOCIAL SCIENCES OTHER TOPICS | 1 | 0.5% |
| BIOTECHNOLOGY APPLIED MICROBIOLOGY | 1 | 0.5% |
| PSYCHOLOGY | 1 | 0.5% |
| TELECOMMUNICATIONS | 1 | 0.5% |
| GEOGRAPHY | 1 | 0.5% |
| GOVERNMENT LAW | 1 | 0.5% |
| GRAND TOTAL | 209 | 100% |
Table 4.
Research Articles by Research Area.
| RESEARCH AREA | RECORD COUNT | PERCENTAGE |
|---|---|---|
| BUSINESS ECONOMICS | 30 | 14.4% |
| PUBLIC ENVIRONMENTAL OCCUPATIONAL HEALTH | 23 | 11.0% |
| ENGINEERING | 20 | 9.6% |
| ENVIRONMENTAL SCIENCES ECOLOGY | 19 | 9.1% |
| SCIENCE TECHNOLOGY OTHER TOPICS | 18 | 8.6% |
| IMMUNOLOGY | 15 | 7.2% |
| GENERAL INTERNAL MEDICINE | 14 | 6.7% |
| OPERATIONS RESEARCH MANAGEMENT SCIENCE | 14 | 6.7% |
| AGRICULTURE | 12 | 5.7% |
| HEALTH CARE SCIENCES SERVICES | 11 | 5.3% |
| FOOD SCIENCE TECHNOLOGY | 10 | 4.8% |
| TRANSPORTATION | 3 | 1.4% |
| INFECTIOUS DISEASES | 2 | 1.0% |
| MATERIALS SCIENCE | 2 | 1.0% |
| MICROBIOLOGY | 2 | 1.0% |
| COMPUTER SCIENCE | 2 | 1.0% |
| RESEARCH EXPERIMENTAL MEDICINE | 2 | 1.0% |
| VIROLOGY | 2 | 1.0% |
| PHARMACOLOGY PHARMACY | 2 | 1.0% |
| SOCIAL SCIENCES OTHER TOPICS | 1 | 0.5% |
| BIOTECHNOLOGY APPLIED MICROBIOLOGY | 1 | 0.5% |
| PSYCHOLOGY | 1 | 0.5% |
| TELECOMMUNICATIONS | 1 | 0.5% |
| GEOGRAPHY | 1 | 0.5% |
| GOVERNMENT LAW | 1 | 0.5% |
| GRAND TOTAL | 209 | 100% |
Table 5.
Research Articles by Methodology.
| PUBLICATION YEAR | CONCEPTUAL | EMPIRICAL | EXPERIMENT | LITERATURE REVIEW | MODEL | SIMULATION | GRAND TOTAL |
|---|---|---|---|---|---|---|---|
| 1997 | 1 | 1 | |||||
| 2006 | 1 | 1 | |||||
| 2007 | 1 | 1 | |||||
| 2008 | 2 | 1 | 3 | ||||
| 2009 | 1 | 1 | 2 | ||||
| 2010 | 3 | 3 | |||||
| 2011 | 1 | 1 | |||||
| 2012 | 1 | 1 | 1 | 3 | |||
| 2013 | 1 | 1 | |||||
| 2014 | 1 | 1 | 3 | 5 | |||
| 2015 | 1 | 1 | 2 | ||||
| 2016 | 2 | 2 | |||||
| 2017 | 1 | 1 | |||||
| 2018 | 1 | 1 | 1 | 3 | |||
| 2019 | 4 | 1 | 5 | ||||
| 2020 | 84 | 52 | 9 | 13 | 12 | 5 | 175 |
| GRAND TOTAL | 105 | 53 | 13 | 13 | 17 | 8 | 209 |
Table 6.
Research Articles by Supply Chain Sector.
| PUBLICATION YEAR | FOOD/AGRICULTURE | HEALTHCARE | OTHER | GRAND TOTAL |
|---|---|---|---|---|
| 1997 | 1 | 1 | ||
| 2006 | 1 | 1 | ||
| 2007 | 1 | 1 | ||
| 2008 | 3 | 3 | ||
| 2009 | 2 | 2 | ||
| 2010 | 1 | 1 | 1 | 3 |
| 2011 | 1 | 1 | ||
| 2012 | 2 | 1 | 3 | |
| 2013 | 1 | 1 | ||
| 2014 | 2 | 3 | 5 | |
| 2015 | 2 | 2 | ||
| 2016 | 2 | 2 | ||
| 2017 | 1 | 1 | ||
| 2018 | 2 | 1 | 3 | |
| 2019 | 4 | 1 | 5 | |
| 2020 | 41 | 74 | 60 | 175 |
| GRAND TOTAL | 42 | 100 | 67 | 209 |
Table 7.
Research Articles by Virus Type.
| PUBLICATION YEAR | CORONAVIRUS | HIV | INFLUENZA | OTHER | GRAND TOTAL |
|---|---|---|---|---|---|
| 1997 | 1 | 1 | |||
| 2006 | 1 | 1 | |||
| 2007 | 1 | 1 | |||
| 2008 | 3 | 3 | |||
| 2009 | 2 | 2 | |||
| 2010 | 2 | 1 | 3 | ||
| 2011 | 1 | 1 | |||
| 2012 | 2 | 1 | 3 | ||
| 2013 | 1 | 1 | |||
| 2014 | 2 | 3 | 5 | ||
| 2015 | 1 | 1 | 2 | ||
| 2016 | 1 | 1 | 2 | ||
| 2017 | 1 | 1 | |||
| 2018 | 3 | 3 | |||
| 2019 | 1 | 4 | 5 | ||
| 2020 | 161 | 1 | 2 | 11 | 175 |
| GRAND TOTAL | 162 | 3 | 19 | 25 | 209 |
Table 8.
Research Articles by Supply Chain Focus.
| PUBLICATION YEAR | COLLABORATION | LABOR | SUPPLY/INVENTORY | OTHER | GRAND TOTAL |
|---|---|---|---|---|---|
| 1997 | 1 | 1 | |||
| 2006 | 1 | 1 | |||
| 2007 | 1 | 1 | |||
| 2008 | 3 | 3 | |||
| 2009 | 2 | 2 | |||
| 2010 | 3 | 3 | |||
| 2011 | 1 | 1 | |||
| 2012 | 3 | 3 | |||
| 2013 | 1 | 1 | |||
| 2014 | 1 | 4 | 5 | ||
| 2015 | 2 | 2 | |||
| 2016 | 2 | 2 | |||
| 2017 | 1 | 1 | |||
| 2018 | 1 | 2 | 3 | ||
| 2019 | 1 | 2 | 2 | 5 | |
| 2020 | 45 | 6 | 71 | 53 | 175 |
| GRAND TOTAL | 46 | 7 | 79 | 77 | 209 |
Table 9.
Research Articles by Subject.
| PUBLICATION YEAR | TECHNOLOGY | GLOBAL TRADE | PSYCHOLOGY | SOCIOLOGY | SUSTAINABILITY | QUALITY | SAFETY | RETAIL | GRAND TOTAL |
|---|---|---|---|---|---|---|---|---|---|
| 1997 | 1 | 1 | |||||||
| 2006 | 1 | 1 | |||||||
| 2007 | 1 | 1 | |||||||
| 2008 | 1 | 1 | 2 | ||||||
| 2009 | 1 | 1 | 2 | ||||||
| 2010 | 2 | 1 | 3 | ||||||
| 2011 | 1 | 1 | |||||||
| 2012 | 1 | 1 | 1 | 3 | |||||
| 2013 | 1 | 1 | |||||||
| 2014 | 1 | 2 | 2 | 5 | |||||
| 2015 | 1 | 1 | 2 | ||||||
| 2016 | 1 | 1 | 2 | ||||||
| 2017 | 1 | 1 | |||||||
| 2018 | 1 | 1 | 1 | 3 | |||||
| 2019 | 1 | 1 | 1 | 1 | 1 | 1 | 6 | ||
| 2020 | 27 | 39 | 11 | 6 | 14 | 32 | 42 | 4 | 175 |
| GRAND TOTAL | 30 | 50 | 13 | 7 | 22 | 37 | 45 | 5 | 209 |
Table 10.
Cluster Analysis Link Strength.
| TOP 5 JOURNALS BY CLUSTER | CLUSTER | JOURNAL WEIGHTED AS [%} OF GRAND TOTAL LINK STRENGTH | {%} OF GRAND TOTAL LINK-STRENGTH | JOURNAL WEIGHTED LINK STRENGTH BY CLUSTER | TOTAL LINK-STRENGTH BY CLUSTER |
|---|---|---|---|---|---|
| Emerging Infectious Diseases | A | 4.81% | ~16% | 13.61% | ~46% |
| Science | 2.65% | 7.49% | |||
| Proceedings of the National Academy of Sciences | 2.39% | 6.77% | |||
| Lancet | 2.99% | 8.47% | |||
| New England Journal of Medicine | 3.41% | 9.63% | |||
| Resources, Conservation and Recycling | B | 0.75% | ~8% | 5.26% | ~54% |
| Risk Analysis | 1.11% | 7.77% | |||
| Nature | 2.53% | 17.70% | |||
| Plos One | 1.48% | 10.34% | |||
| Journal of Cleaner Production | 1.87% | 13.05% | |||
| International Journal of Production Research | C | 10.27% | ~27% | 20.40% | ~53% |
| International Journal of Production Economics | 4.26% | 8.46 | |||
| Annals of Operations Research | 4.98% | 9.90% | |||
| European Journal of Operations Research | 3.83% | 7.61% | |||
| Transportation Research Part E: Logistics and Transportation Review | 3.58% | 7.11% | |||
| TOTAL ACCOUNT LINK STRENGTH | 51% |
Table 11.
Intersection Articles Analysis.
| INTERSECTIONS | JOURNALS | DESCRIPTION |
|---|---|---|
| A∩B | International Journal of Environmental Research and Public Health | Examine 3D printing and pay-digitalization in smart hospitals and Inventory Information model in the supply of vaccines |
| PLOS One | ||
| Nature | ||
| B∩C | Resources, Conservation and Recycling | Provide a model optimization for vehicle routing factory, robotic automation in food distribution, and evaluation of waste flow stocks; finally, the input-output optimization modeling framework in operating business |
| IEEE Access | ||
| Journal of Cleaner Production |
Table 12.
Main Topics with Major Link Strength and with ≥4 Occurrences.
| CLUSTER STRENGTH | MAIN TOPICS |
|---|---|
| 35 | Covid-19, supply chain |
| 23 | pandemic, influenza, health, disease |
| 16 | Research, development & new technologies |
| 10 | Resilience, sustainability |
| 7 | food, management, PPE |
Publisher’s Note: MDPI stays neutral with regard to jurisdictional claims in published maps and institutional affiliations. |
© 2021 by the authors. Licensee MDPI, Basel, Switzerland. This article is an open access article distributed under the terms and conditions of the Creative Commons Attribution (CC BY) license (http://creativecommons.org/licenses/by/4.0/).
Share and Cite
MDPI and ACS Style
Swanson, D.; Santamaria, L. Pandemic Supply Chain Research: A Structured Literature Review and Bibliometric Network Analysis. Logistics 2021, 5, 7. https://0-doi-org.brum.beds.ac.uk/10.3390/logistics5010007
AMA Style
Swanson D, Santamaria L. Pandemic Supply Chain Research: A Structured Literature Review and Bibliometric Network Analysis. Logistics. 2021; 5(1):7. https://0-doi-org.brum.beds.ac.uk/10.3390/logistics5010007
Chicago/Turabian StyleSwanson, David, and Luis Santamaria. 2021. "Pandemic Supply Chain Research: A Structured Literature Review and Bibliometric Network Analysis" Logistics 5, no. 1: 7. https://0-doi-org.brum.beds.ac.uk/10.3390/logistics5010007