
Measuring the Environmental Maturity of the Supply Chain Finance: A Big Data-Based Multi-Criteria Perspective


Department of Industrial Engineering, Faculty of Engineering, King Abdulaziz University, Jeddah 21589, Saudi Arabia
Logistics 2021, 5(2), 22; https://0-doi-org.brum.beds.ac.uk/10.3390/logistics5020022
Submission received: 10 February 2021
/
Revised: 19 March 2021
/
Accepted: 25 March 2021
/
Published: 13 April 2021
(This article belongs to the Special Issue Optimal Supply Chain Design and Operations from an Environmental Sustainability Perspective)
Abstract
:This paper presents a strategic roadmap to handle the issue of resource allocation among the green supply chain management (GSCM) practices. This complex issue for supply chain stakeholders highlights the need for the application of supply chain finance (SCF). This paper proposes the five Vs of big data (value, volume, velocity, variety, and veracity) as a platform for determining the role of GSCM practices in improving SCF implementation. The fuzzy analytic network process (ANP) was employed to prioritize the five Vs by their roles in SCF. The fuzzy technique for order preference by similarity to ideal solution (TOPSIS) was then applied to evaluate GSCM practices on the basis of the five Vs. In addition, interpretive structural modeling (ISM) was used to visualize the optimum implementation of the GSCM practices. The outcome is a hybrid self-assessment model that measures the environmental maturity of SCF by the coherent application of three multicriteria decision-making techniques. The development of the Basic Readiness Index (BRI), Relative Readiness Index (RRI), and Strategic Matrix Tool (SMT) creates the potential for further improvements through the integration of the RRI scores and ISM results. This hybrid model presents a practical tool for decision-makers.
1. Introduction
In industrial economics, “Everything is worth what its purchaser will pay for it” (Publilius Syrus, 1st Century B.C., cited in [1]). Unfortunately, this is not reflected in current green supply chain management (GSCM) practices. Indeed, the cost of GSCM implementation is greater than the expected return [2,3]. The main reason for this is the cost of changing practices, including those surrounding human resources [3], and adopting new green systems [4]. Consequently, it is not surprising that financial barriers represent one of the main obstacles to GSCM implementation [2,3,5,6].
It must be noted that the costs of being green are associated with not only environmental elements but also organizational functions [7]. Hervani et al. [5] explained this viewpoint through their equation-based definition of GSCM: GSCM = [Green Purchasing (GP)] + [Green Manufacturing (GM)/Materials Management (MM)] + [Green Distribution (GD)/Marketing] + [Reverse Logistics].
Specifically, linking environmental-related strategic purchasing activities to supply chain management (SCM) practices facilitates GSCM implementation [8]. This, in turn, creates new dimensions for sophisticated networks of buyers and sellers in various industries [5,9]. This complex situation for supply chain stakeholders highlights the need for the implementation of supply chain finance (SCF), a solution developed by academicians and practitioners.
SCF has been defined as a facilitator of the physical and information flows of the financial products and services provided by financial institutions [10]. It is the ability to optimize supply chains to enable financial infrastructures and cash flows [11]. Wuttke et al. [12] defined SCF as cash flow optimization with respect to planning, management, and control to improve material flows. Other studies have offered similar definitions [13,14,15,16,17,18]. These studies suggest that financial, physical, technological, human, and organizational resource flows are key to SCF. Thus, the definitions are centered around the concept of the “flow” (i.e., flow of information, materials, and other resources) along the supply chain. This indicates the need for a focus on the five Vs of big data: value, volume, velocity, variety, and veracity. Moreover, recent industrial economics studies have also emphasized the importance of big data as a vital dimension in such a dynamic era [19,20,21,22,23,24].
Touboulic et al. [25] emphasized that the current SC practices are still influenced by the idea that the developing countries represent a collection of suppliers to the well-established firms in the developed countries; accordingly, SCM is in need of being restructured. Indeed, for SCM, restructuring the relationships among the different stakeholders is an issue that has attracted much attention, and consequently, the field of Operations Management (OM) represents an appropriate field for decision-making (DM) and/or multicriteria decision-making (MCDM) applications [26]. For example, the variety of the variables and constraints corresponding to the vehicle routing problem (VRP) results in formulation of different algorithms in order to optimize various logistics problems [27]. Likewise, in order to decrease the environmental impacts created by the transportation fleets during transfer of goods among different logistics centers, the queuing theory has been employed [28]. Tundys and Wiśniewski [29] investigated various tools and techniques for measuring the performance of GSCM and they clearly stated that future research attempts should focus on developing “friendly” managerial tools in order to assess GSCM practices. Such interactions among environmental aspects and SCM issues create an appropriate environment in which MCDM tools, such as TOPSIS, are utilized in order to solve GSCM issues [30]. Fuzzy TOPSIS and ELECTRE have recently been applied in order to handle the issue of selecting green suppliers considering green practices [31].
On top of this, with the increasing number of the recently published GSCM research works that highlight the significance of the issue of “resources” in GSCM practices [32,33], and with consideration of the fact that promising technologies such as blockchain, Internet of Things (IoT), Artificial Intelligence (AI), and data analytics represent the most advanced platforms and/or the state-of-the-art technical facilitators for the data exchanging processes among the SCF stakeholders [34], in which the flow of big data within the interactive environment represents a cornerstone for formulating a trusted and reliable platform [35], this paper proposes a strategic roadmap to handle the issue of resource allocation among the GSCM practices. Hence, the corresponding complex hypothesis herein imposes a potential for different strategic configurations to be executed as a result of dealing with different sets of resources needed to be utilized by each GSCM practice. Consequently, three research questions can be formulated:
Research Question 1 (RQ1): How do the five Vs of big data interact with each other to improve SCF practices?
Research Question 2 (RQ2): To what extent are GSCM practice-related data accurate, valuable, big, plentiful, and fast in terms of improving the data flow to facilitate the SCF implementation?
Research Question 3 (RQ3): How do we achieve optimal resource mobilization for GSCM practices considering their different contributions to the SCF implementation?
This paper used the five Vs of big data as a platform for testing the role of GSCM practices in improving SCF implementation. Considering the fact that MCDM methods facilitate the formulation of different strategies and the creation of evaluation processes, especially in logistics [36], three MCDM methods were employed. The fuzzy analytic network process (ANP) was employed to prioritize the five Vs by their contributions to SCF. The fuzzy technique for order preference by similarity to ideal solution (TOPSIS) was used to evaluate GSCM practices on the basis of these criteria. To improve the implementation of SCF, this study also provides a roadmap for the visualization of the optimum resource mobilization of GSCM practices through interpretive structural modeling (ISM). The rest of the paper is organized as follows: Section 2 introduces the eight GSCM practices extracted from the literature. Some recent MCDM relevant applications are also presented at the end of Section 2. The employed methods and contexts of their application are presented in Section 3. Section 4 provides the results of the proposed model. The implications, contributions, and directions for future studies are presented in Section 5. Finally, Section 6 presents the conclusion for this paper. A list of acronyms and their descriptions are presented in Table 1.
2. Background
Several research studies have identified GSCM practices. For example, Zhu et al. [37] listed 21 GSCM practices related to five main factors. Kannan et al. [38] condensed this list into 17 GSCM practices, which can be grouped into eight vital practices. This section presents the most widely accepted GSCM practices (i.e., published papers within the literature). All aspects of the supporting literature are summarized and presented in Table 2.
2.1. Top Management Commitment
Top management commitment (TOPM) is a crucial driver for greening SCM. Top and senior management commitment is required to implement environmental management systems that are in harmony with other green practices and facilitate the monitoring of the organization’s environmental progress [39]. Management commitment also enhances internal cross-functional collaborations among operational units. This may include empowering employees [40], implementing effective reward systems, providing training, and promoting teamwork [41]. Therefore, management commitment is important in environmental initiatives [37,42]. For example, managers must be committed to applying GSCM to purchasing, such as the reuse and recycling potential of purchased products and materials [43,44,45,46,47,48]. Indeed, studies have emphasized the importance of top management support to the success of organizational initiatives, including those related to GSCM [37].
2.2. Organizational Interaction Maturity
Organizational theory has undergirded the exploration and elucidation of GSCM [49]. According to resource-based theory, organizational infrastructure consists of a combination of resources and capabilities that create a competitive advantage [50]. The effective utilization of these resources leads to the successful implementation of competitive strategies, including those related to the environment [37,51]. Therefore, organizational learning enhances the implementation of sophisticated systems, such as GSCM [37,52,53,54,55,56].
2.3. Quality Management
Quality management (QUAL) is the key to organizational performance. It also plays a significant role in organizational environmental practices [57,58,59], which lead to better GSCM practices [60,61,62]. Jabbour et al. [62] investigated the role of QUAL, environmental management maturity (EMM), and other GSCM practices in green performance. Their study of 95 Brazilian companies found that it is essential to organizational EMM, which can improve green performance, especially in purchasing. Other studies have also emphasized the significance of QUAL in improving GSCM practices [63,64,65,66,67].
2.4. Environmental Management
Waste and costs can be efficiently minimized, and better environmental performance can be achieved when leading companies practice GSCM [68]. Thus, ISO 14001 plays a significant role in enhancing GSCM. In a study on the effects of ISO 14001 certification in Japanese facilities, Arimura et al. [69] concluded that these standards encouraged GSCM practices. Other studies have drawn similar conclusions [70,71,72,73].
2.5. Customer Relationship Management
One of the main elements of supply chain operations is stakeholder collaboration in the development of environmental goals [61,63,74]. Thus, customer pressure plays a significant role in GSCM [75,76,77]. Thun and Müller [76] found that GSCM practices in German manufacturing were driven by customer pressure; consequently, good customer relationships were considered as a competitive advantage. Currently, the application of green requirements to the supply chain constitutes a competitiveness criterion for evaluating firm performance [77]. Several studies have concluded that customer relationship management is key to the implementation of GSCM practices [65,67,78,79,80].
2.6. Green Human Resource Management
Human resource management (HRM) practices encourage the creation of green organizations [81]. Cantor et al. [82] developed a model to investigate the relationship between organizational environmental initiatives and HRM practices. The key features of green training related to green human resource management (GHRM) and GSCM practices in Brazilian organizations have been investigated [56]. Jabbour and de Sousa Jabbour [83] observed that GHRM and GSCM play a significant role in creating a sustainable workplace environment; however, further research is needed. Therefore, an assimilation framework for GHRM–GSCM interactions was proposed. Muduli et al. [84] used ISM to investigate the relationships among GCSM-related behaviors. To address these complex organizational environmental challenges, GHRM must be considered because of its contribution to employee environmental authorizations [85], a green organizational culture [86,87], and the enhancement of environmental groups [85,88].
2.7. Supplier Selection
Supplier environmental partnerships promote green purchasing, which improves suppliers’ ecological performances [8]. Supplier environmental partnerships have been categorized as three main types of activities: supplier education, supplier support, and joint ventures [48]. Thus, the consideration of green criteria in supplier selection (SUPP) has been investigated [38,45,89,90,91,92]. Studies have also focused on green supplier selection [93,94,95,96,97,98].
2.8. Smart Process and Design
Smart process and design (SP&D) considers product eco-design and reverse logistics. Eco-design refers to the consideration of stakeholder needs in the environmental elements of product design and development [99,100,101], including sustainable packaging [102]. Reverse logistics describes the production activities related to the three “REs” of raw materials: reduction, reuse, and recycling [99,103,104]. SP&D covers a wide range of successful GSCM practices, such as purchasing equipment that produces clean products, selling obsolete stock, selling waste materials, and reducing energy consumption [38].
2.9. MCDM Applications in GSCM
In this regard, several MCDM studies have addressed GSCM. Although many studies noticed that the lack of MCDM applications is still considered as a research gap, specifically in the field of reverse logistics [105], Vieira et al. [106] concluded that several MCDM methods have the potential to investigate several issues related to GSCM such as the prioritizing of the reverse logistics barriers. Kechagias et al. [107] aimed at creating a process reference model and have developed an analytic hierarchy process (AHP)-based Preference Ranking Organization Method for Enrichment Evaluations (PROMETHEE) model to propose a systemic methodology for selecting the best Business Process Modeling (BPM) tools. They concluded that the proposed model is capable of contributing to improvement of sustainability in the context of SCM. Büyüközkan and Çifçi [108] highlighted the importance of the environmental dimension in achieving financial success. Accordingly, they developed a fuzzy-based ANP model to evaluate GSCM practices in an evolved Turkish company. Büyüközkan and Çifçi [91] emphasized the relationship between environmental performance and internal and external factors. Thus, they developed an MCDM model that employed fuzzy ANP and TOPSIS to optimize supplier selection. Wang and Chan [109] developed a fuzzy TOPSIS model to increase practitioners’ and decision-makers’ understanding of the resources that are needed as a consequence of the greening of SCM practices. A fuzzy TOPSIS model was developed to enable a Brazilian company to optimize electronics supplier selection [38]. ISM has been employed as a research method in many fields, including GSCM [110,111,112,113]. For example, Mathiyazhagan et al. [111] used sophisticated ISM to examine 26 barriers to GSCM in Indian automobile component manufacturing. Further technical explanations of the procedures for performing fuzzy ANP, fuzzy TOPSIS, and ISM are presented in succeeding sections of the paper.
3. Methods and Applications
Three MCDM methods were employed: fuzzy ANP, fuzzy TOPSIS, and ISM. The employment of these methods can be justified by looking at the three research questions separately and collectively. RQ1 aims to investigate the interactions among the “five Vs. of big data” to improve SCF practices. Such interactions imply the existence of “dependency” and “feedback” relationships among the “five Vs”. The ANP, in particular, is a best fit tool that can discover, handle, and quantify such relationships [114,115]. This point has also been discussed and validated in many ANP-based research works [116,117,118]. RQ2 aims to evaluate eight different GSCM practices with respect to the five criteria (i.e., the five Vs). This is a typical MCDM problem that is can be resolved by TOPSIS and, academically, TOPSIS represents the most commonly acceptable MCDM tool to handle such an issue, particularly, in the fields of SCM and the environment [119]. Note that both ANP and TOPSIS were carried out with the aid of the fuzzy set theory because the fuzzy-based ANP and TOPSIS reduce the effect of subjectivity [120,121]. Regarding RQ3, optimal resource mobilization cannot be attained unless the eight GSCM practices receive the entitled priority in terms of which practice should be implemented before the other one. Such a special configuration of a decision-making situation requires a tool that can handle the complexity amongst the investigated practices [106]. Hence, in this regard, ISM was found to be a better application because it has been widely validated as an effective decision-making method and, specifically, as a tool to handle the complexity issue [122]. Collectively, the sequence the three techniques are applied in creates a hybrid self-assessment model to measure the environmental maturity of the SCF (Figure 1).
3.1. Fuzzy Analytic Network Process
The ANP is the generalized form of the analytic hierarchy process (AHP), a well-known MCDM technique [115]. Consequently, the AHP and fuzzy AHP can be considered special ANP and fuzzy ANP cases. Accordingly, the fuzzy ANP has been used as an extension of the traditional fuzzy AHP applications [123,124]. In AHP and fuzzy AHP, groups of elements are organized in a hierarchal structure. The application of the ANP and fuzzy ANP facilitates the formulation of more complex relationships through sets of clusters (network-based structure). These ideas have been explored in several studies [125,126,127].
In the ANP, a numerical scale is used to make sets of judgments, and in the fuzzy ANP, a linguistic scale is used. The MCDM literature provides several approaches to the implementation of the fuzzy AHP and ANP [128,129,130,131,132,133,134,135,136]. However, most of these approaches are complex. Hence, Chang’s extent analysis has been considered the most accepted method because of its simplicity [124,137,138]. The present study employed Chang’s extent analysis, which has been applied in previous studies [138,139].
To implement Chang’s extent analysis, let symbolize the object set such that and symbolizes the goal set such that This application of Chang’s extent analysis implies that the objects are considered independently in a sequential approach. In addition, for each independent object (i.e., ), the analysis is executed for each goal, . Accordingly, numbers of extent analyses are executed as follows:
where symbolizes the triangular fuzzy numbers. symbolizes the membership function of the triangular fuzzy number. According to Erensal et al. [137], Chang’s extent analysis can be illustrated in four steps:
Step 1: For each object , the fuzzy synthetic extent can be expressed as:
As expressed in Equation (2), symbolizes the extended multiplication of two fuzzy numbers. To perform , extent analysis values are executed such that:
From Equation (2), can be obtained by performing the fuzzy addition operation of as shown in Equation (4):
The inverse of the vector can then be obtained:
where , , > 0. After that, the can eventually be obtained such that:
Step 2: The opportunity that [can be expressed as:
Figure 2 illustrates all the cases of . For example, in the case of > > , point z represents the value that matches the highest intersection point of (which is point ). Both values, and , are required to compare .
Step 3: The chance of the occurrence of a convex fuzzy number greater than convex fuzzy numbers can be expressed as follows:
Step 4: The last step is to find the weight vector for such that:
3.2. Fuzzy TOPSIS
The fuzzy TOPSIS was developed by Chen [140] to address the issue of uncertainty in MCDM problems. With the fuzzy TOPSIS, decision-makers, use linguistic terms to rate the criteria and alternatives. Accordingly, represents the weight of the criterion assigned by the such that Correspondingly, represents the weight of the alternative with respect to assigned by the, such that Several studies [38,141] have summarized the fuzzy TOPSIS as follows:
- Aggregating the weights of the criteria and alternatives collected from decision-makers, as shown in Equations (10) and (11):
- Constructing the fuzzy decision matrix of the criteria () and the alternatives (), as shown in Equations (12) and (13):
- Normalizing the matrix () by calculating (). The normalized matrix () can be expressed as indicated in Equations (14)–(16):
- Computing the weighted normalized decision matrix () by multiplying each by the corresponding , as shown in Equations (17) and (18):
- Identifying the fuzzy positive ideal solution (FPIS, ) and the fuzzy negative ideal solution (FNIS, ), as shown below:where = (1, 1, 1) and = (0, 0, 0)
- Computing the distances and from and for each , respectively, as shown in Equations (21)–(23):where the distances between two triangular fuzzy numbers are calculated according to the vertex method shown below:
- Finding the closeness coefficient using Equation (24):
- Ranking the corresponding alternatives according to the value of .
Accordingly, the closest alternative to the FPIS is considered the best alternative.
3.3. Interpretive Structural Modeling
Several studies have discussed the mathematical foundation of ISM [142,143,144]. The philosophical background was presented by Warfield [145]. ISM is a mathematical technique to simplify the multifaceted relationships of any group of elements to develop a meaningful model for decision-makers [146]. It illustrates and explains the relationships among groups of entities, such as factors, elements, practices, barriers, and initiatives [111,146,147,148,149,150]. On the basis of applications in the literature [147,150,151], the steps in ISM are as follows:
- Identifying the practices, such as factors, initiatives, barriers, or elements, to be examined.
- Describing the contextual relationships among the sets of practices through four symbols:
- V: if implementing practice Ä leads to the successful implementation of practice Ë.
- A: if implementing practice Ë leads to the successful implementation of practice Ä.
- X: if both practice Ä and practice Ë lead to successful reciprocal implementation.
- O: if there is no relationship between practice Ä and practice Ë.
- Forming the structural self-interaction matrix (SSIM) as a result of the pair-wise contextual relationships among the examined practices.
- Extracting the reachability matrix from the SSIM, which is converted into an initial reachability matrix in accordance with the following replacement rules:
- If the (α, β) entry is V, then the (α, β) entry in the reachability matrix becomes 1, and the (β, α) entry becomes 0.
- If the (α, β) entry is A, then the (α, β) entry in the reachability matrix becomes 0, and the (β, α) entry becomes 1.
- If the (α, β) entry is X, then the (α, β) entry in the reachability matrix becomes 1, and the (β, α) entry also becomes 1.
- If the (α, β) entry is O, then the (α, β) entry in the reachability matrix becomes 0, and the (β, α) entry also becomes 0.
- The initial reachability matrix then has to be tested for transitivity to ensure that if practice Ä leads to the implementation of practice Ë, and practice Ë leads to the implementation of practice Ü, then practice Ä leads to practice Ü. The resulting matrix is referred to as the final reachability matrix.
- Based on the final reachability matrix, the set of practices can be classified into four categories: driving, linkage, dependent, and autonomous.
- Based on the final reachability matrix, the set of practices can also be hierarchized. The final diagraph can then be developed in accordance with the identified levels.
3.4. The Application of Fuzzy ANP
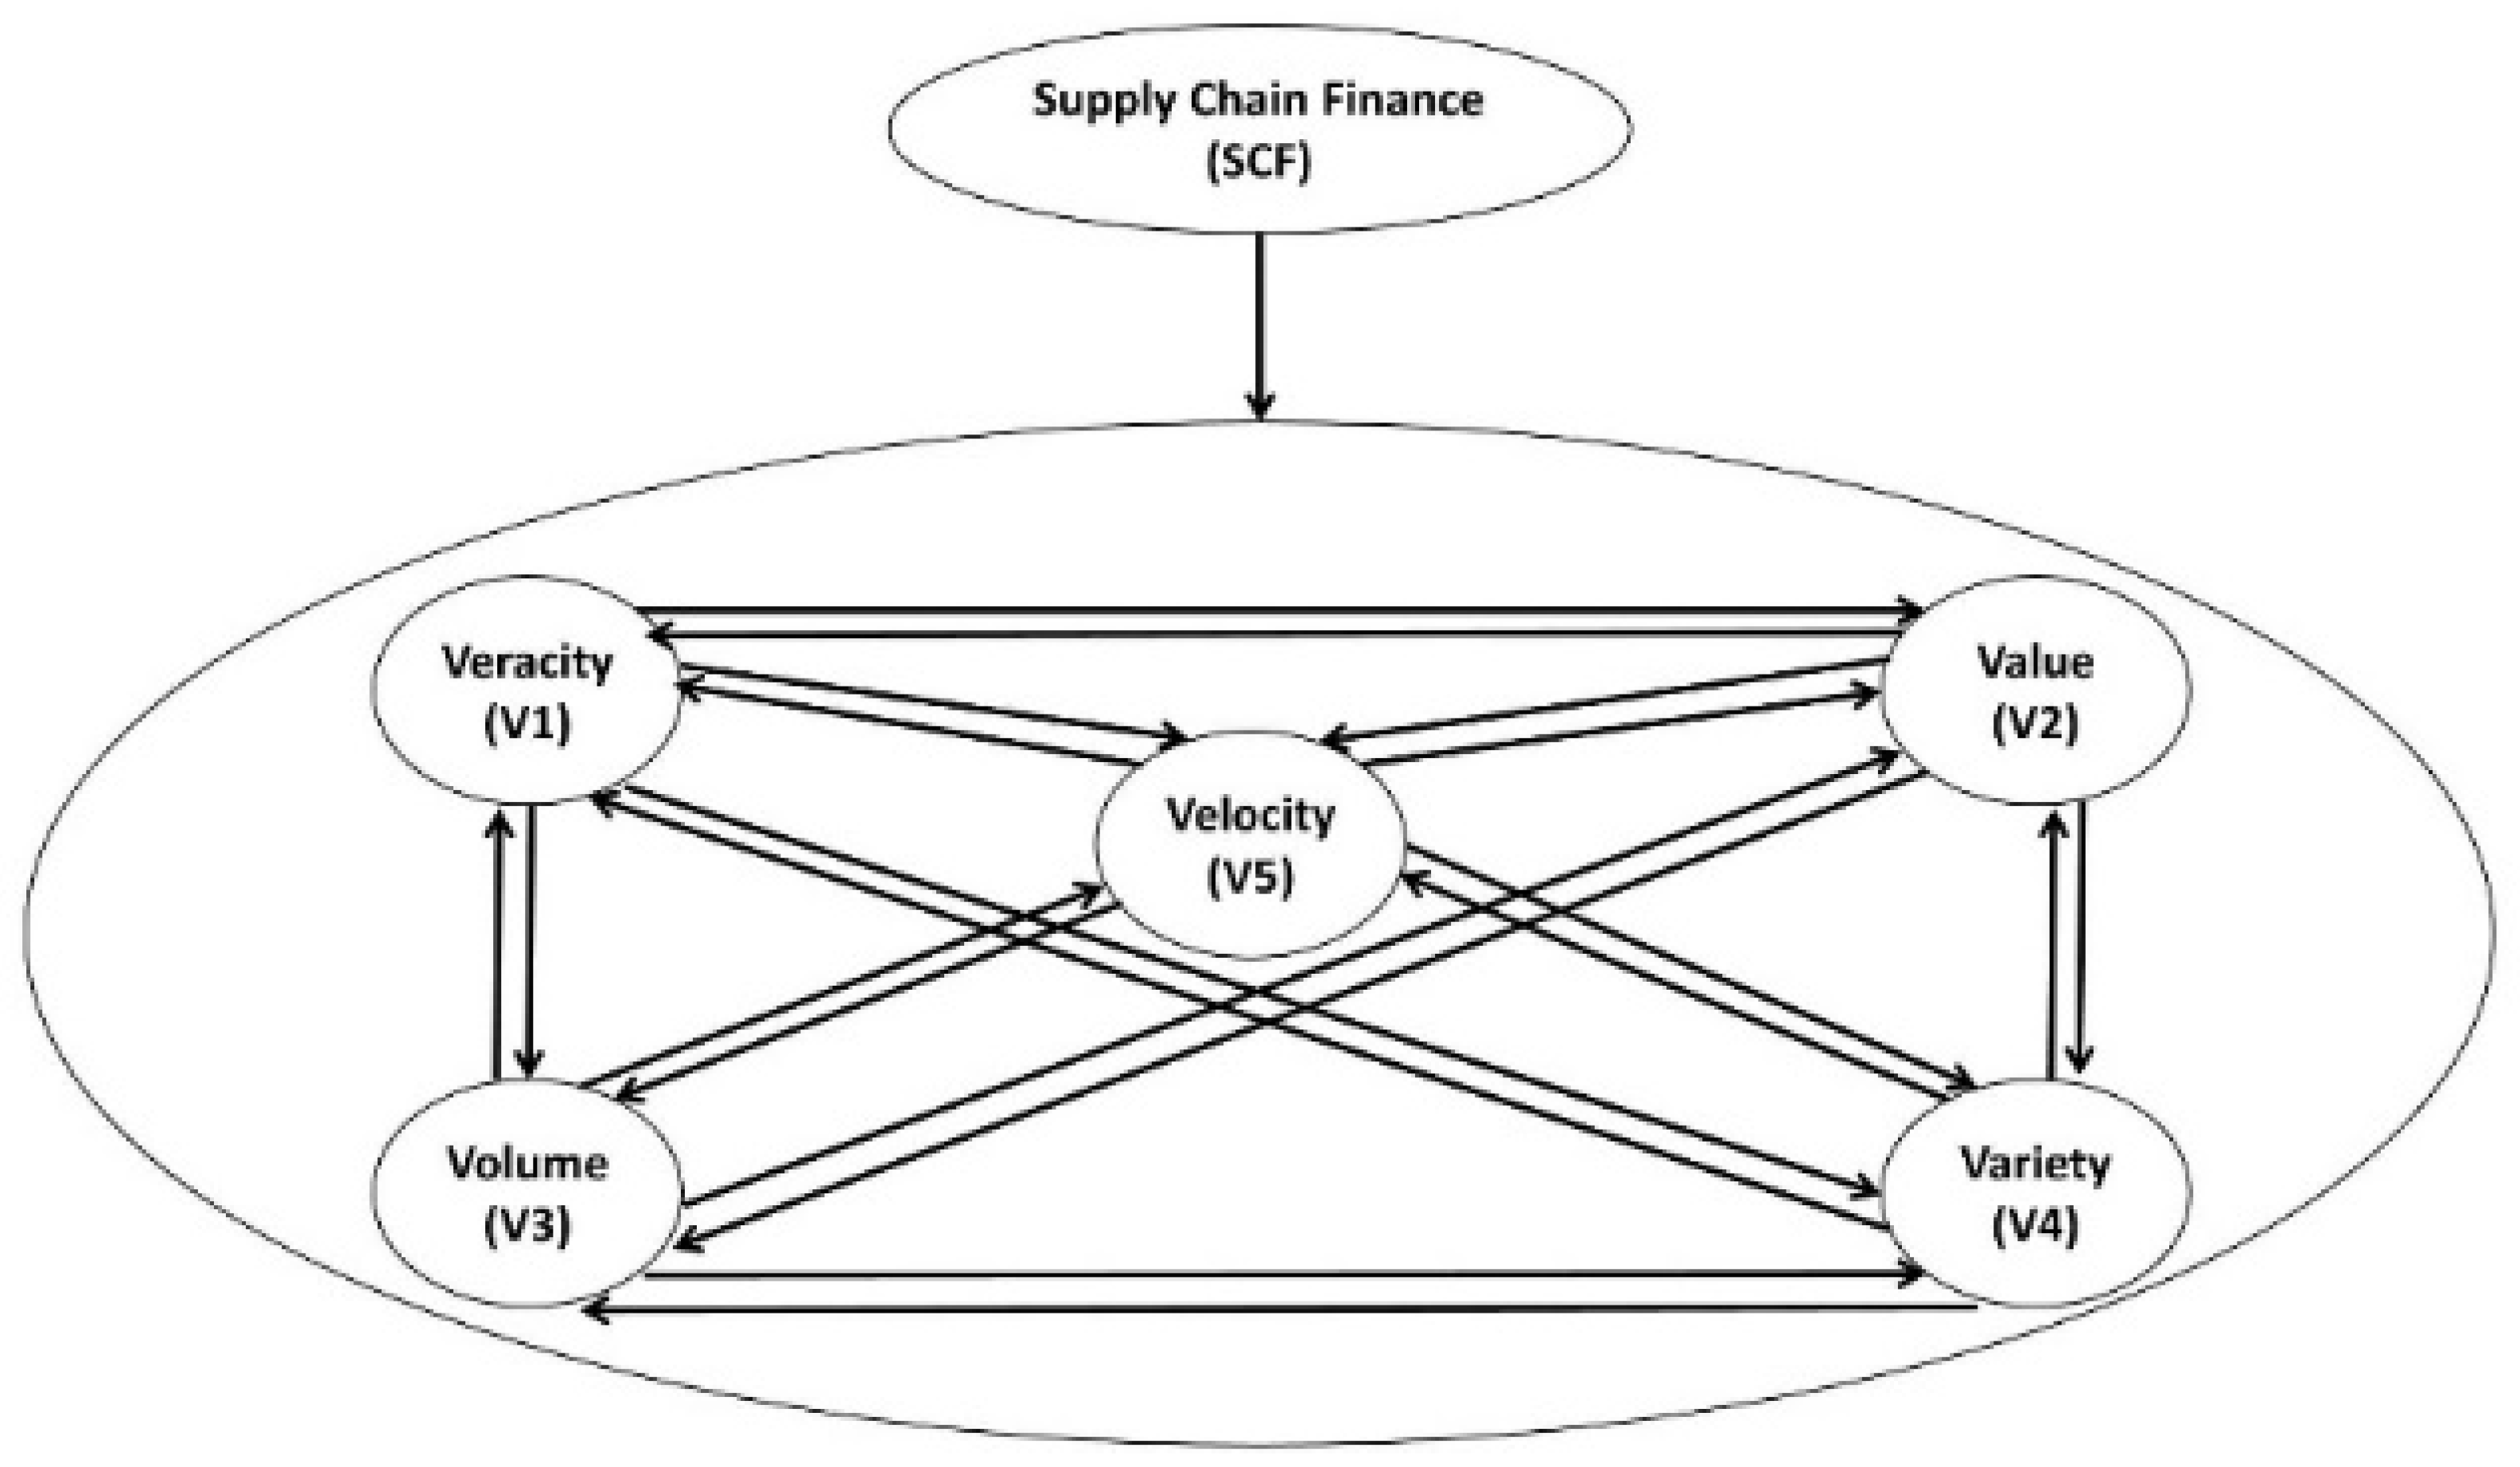
Outer- and inner-dependence relationships were considered in the proposed fuzzy ANP model. As shown in Figure 3, the arrow from the SCF cluster to the big data cluster indicates the outer-dependence relationship in that all five Vs were weighted by their contributions to SCF practices. The arrows that connect the five Vs inside their cluster represent the inner-dependence relationships among the five Vs.
For the application of the fuzzy ANP model, the opinions of experts from one of the international leading food and retail holding companies were solicited. Accordingly, a group of experts in the field of SCM, including the supply and demand director, were selected. For this study, all selected experts were well-educated, holding critical managerial positions, and capable of dealing with various SCM issues concerning different contexts. To conduct fuzzy ANP and fuzzy TOPSIS, two different questionnaires were presented to the experts within several sequence sets of meetings until the consensus was reached. For fuzzy ANP, experts’ views on the significance of each “V” in improving the implementation of SCF were sought. For example, they were asked about the importance of data velocity vs. data value in the improvement of SCF practices. All the Vs were compared on the fuzzy ANP linguistic scale (Table 3).
It is worth mentioning herein that, according to Yin [152], the outcome of any case study can be validated analytically (i.e., analytical generalization) either by replication logic, in the case of having multiple case studies, or by theory development, as conducted in the current single case study (i.e., decision-making theory). Hence, Yin emphasized that the focus should be on the case study as an “opportunity to shed empirical light on some theoretical concepts or principles … that is, analytic genaralization” regardless of the number of cases. This is completely different from the traditional statistical validation of most quantitative research works. Further details regarding case study validation using the approach of analytical generalization can be found in [152]. Additionally, most of the ANP-based case studies have been validated and generalized analytically, not statistically, with small sample sizes [118,153].
3.5. The Application of Fuzzy TOPSIS
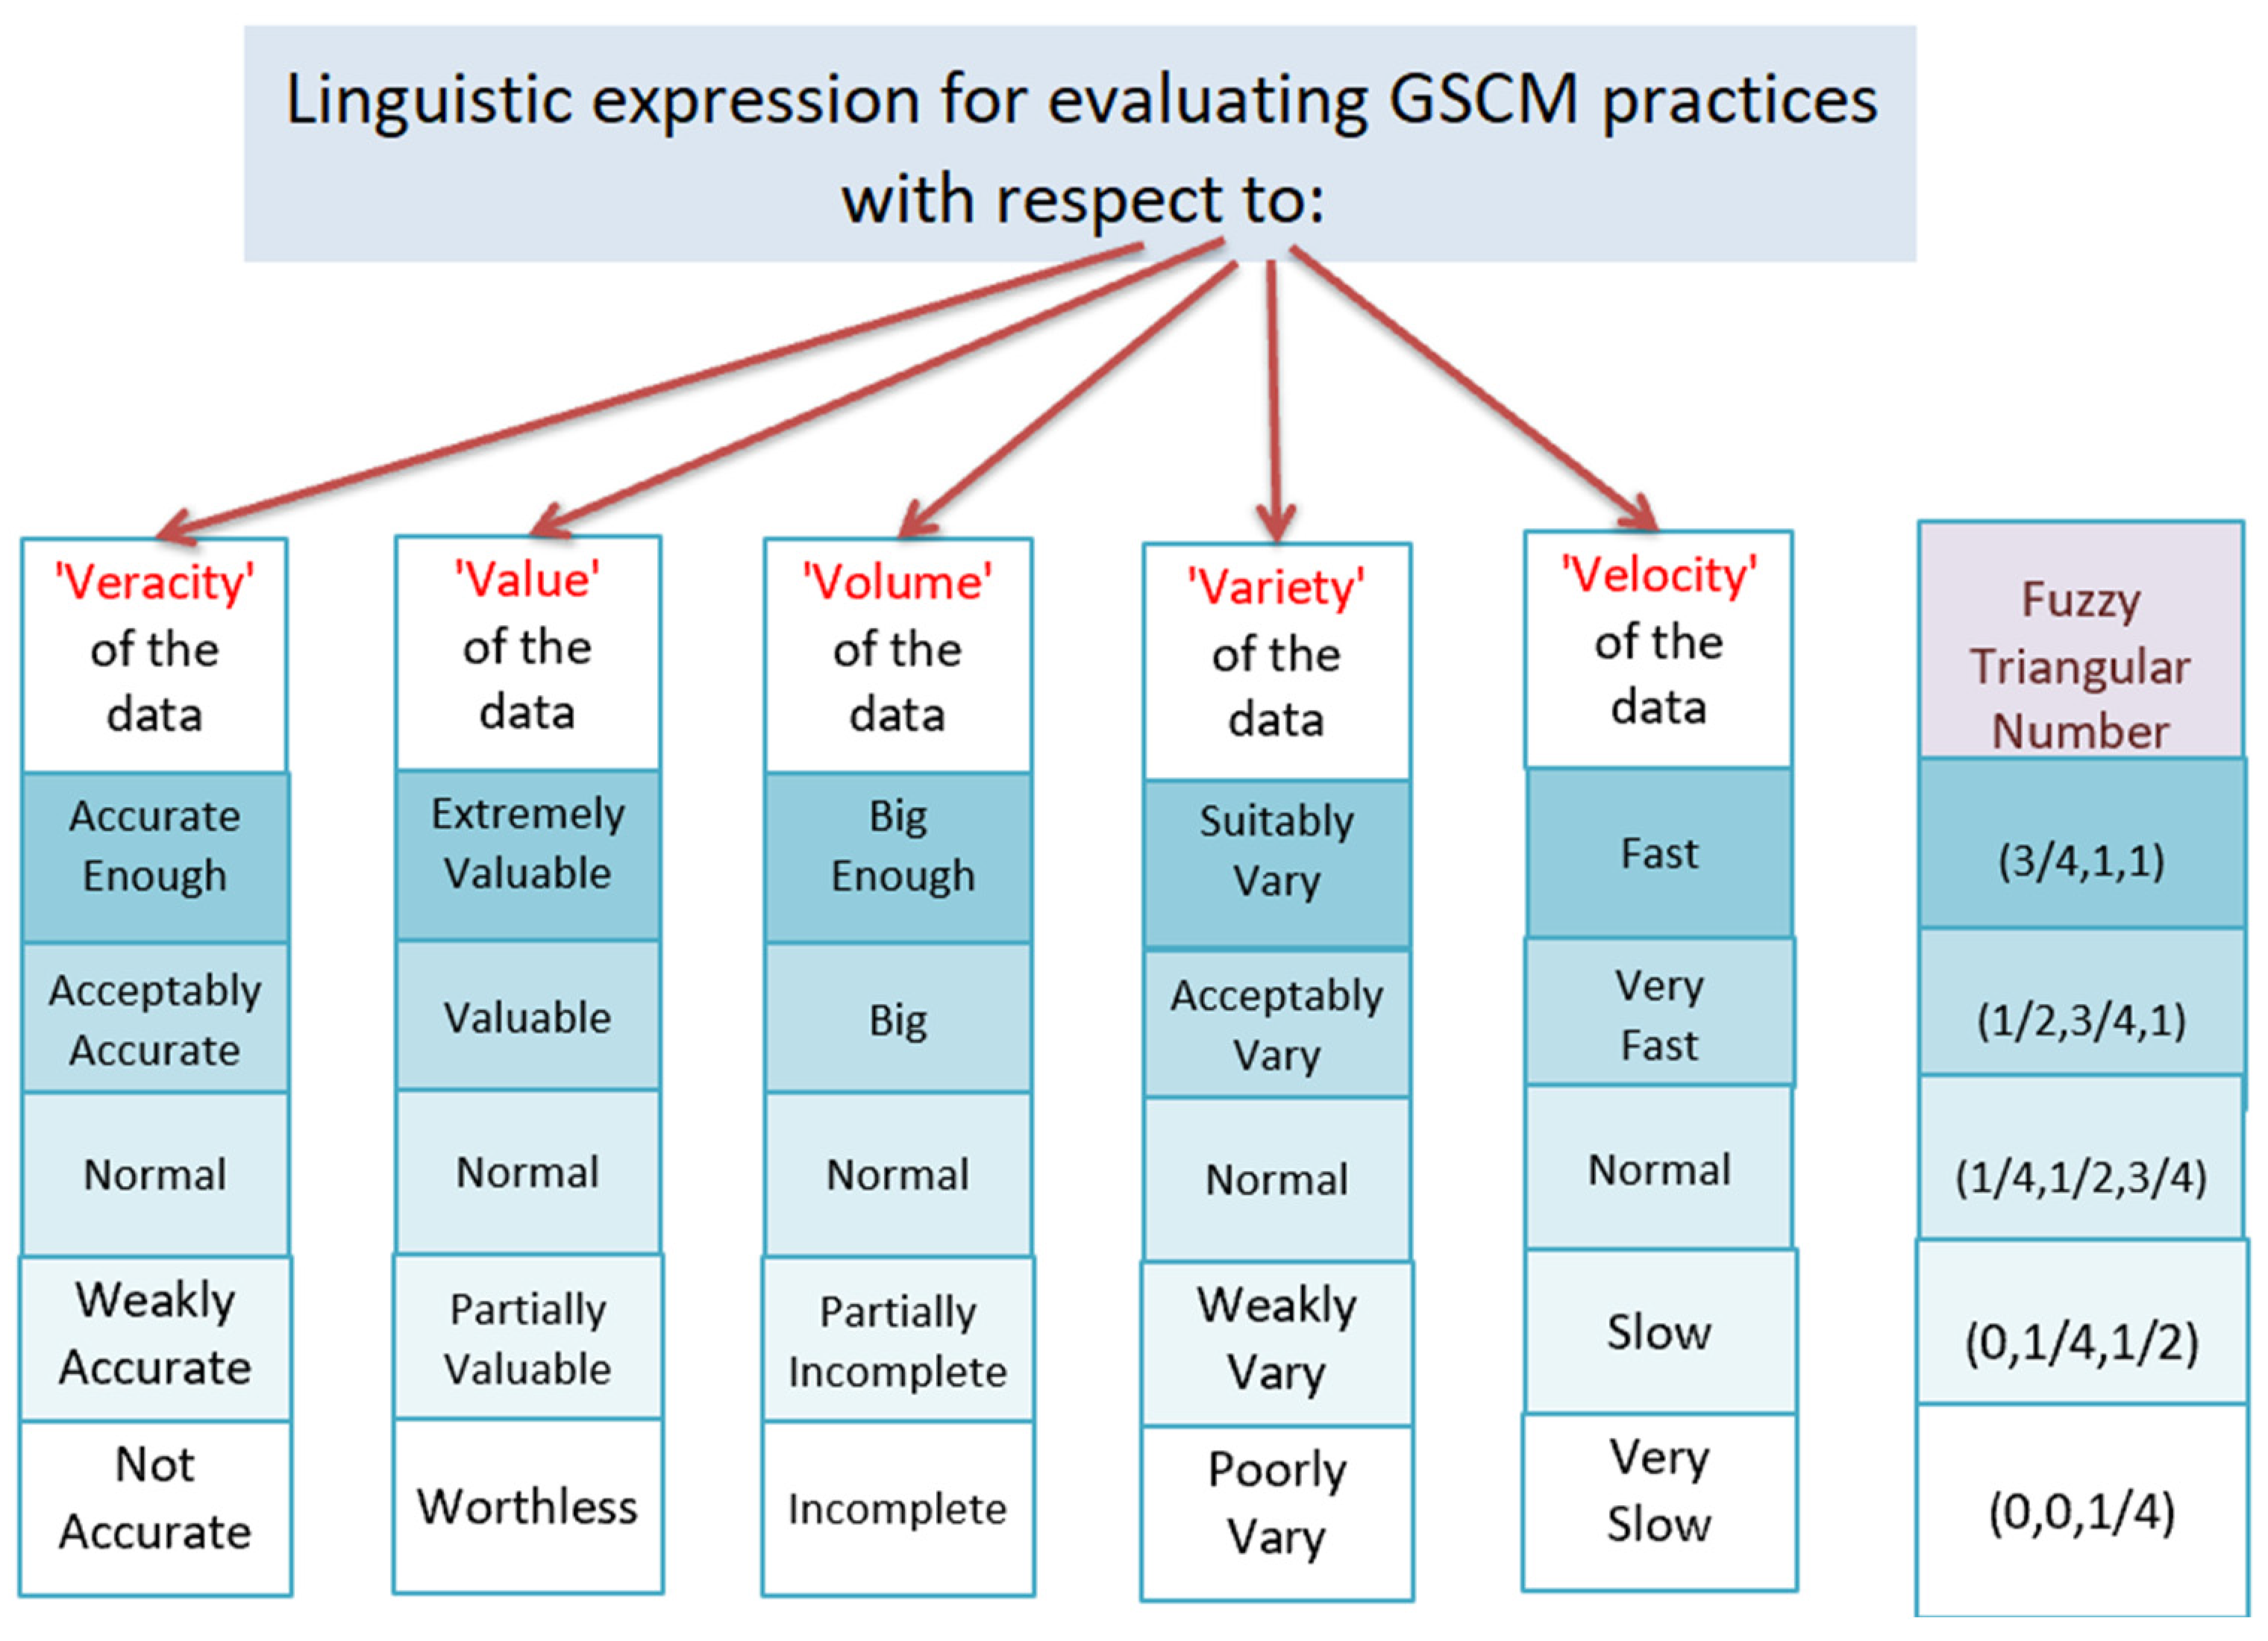
The extracted weights generated by the fuzzy ANP were considered in the development of the fuzzy TOPSIS model. The five Vs facilitated the rating of GSCM practices on the basis of their contributions to SCF practices. Experts used the fuzzy TOPSIS scale to evaluate each GSCM practice on each criterion (Figure 4). For example, the following question was posed to the experts: to what extent are the QUAL-related data as a GSCM practice “big” enough to improve the data flows to facilitate the SCF implementation? As indicated in Figure 4, the corresponding linguistic rates for answering the question were “big enough”, “big”, “normal”, “partially incomplete”, and “incomplete.” All GSCM practices can be rated on the corresponding linguistic fuzzy TOPSIS scale (Figure 4).
3.6. The Application of ISM
The ISM approach was employed to prioritize the GSCM practices by their reciprocal influence. Specifically, ISM was performed to identify the GSCM practices that should be implemented first regardless of their importance, criticality, or readiness scores. ISM achieved two significant outcomes:
- classification of GCSM practices into four categories: independent (drivers or driving practices), linkage, dependent, and autonomous practices;
- identification of the influence of each GSCM practice.
Further explanations of the proposed indices (i.e., the integration of the fuzzy TOPSIS and ISM outcomes) and key results are presented in the next section.
4. Results
4.1. Inner- and Outer-Dependence of the Five Vs of Big Data
Table 4 illustrates the contribution of each V in terms of facilitating SCF implementation. The inner-dependence relationships among the Vs, the outer-dependence linkage with SCF, and the overall significance weights that resulted from the application of the fuzzy ANP were considered. Regarding the inner-dependence relationships among the five Vs, Table 4 indicates that three (veracity, variety, and volume) of the four criteria contributed equally (31%) to the valuableness of the SCF data. However, data velocity was considered the least significant criterion (6%). Similarly, with respect to the veracity of the SCF data, all the criteria exhibited the same significance level (31%). The exception was velocity, which was considered to be relatively unimportant (6%). The velocity of the SCF data was found to be dependent mainly on the variety (40%) and volume (40%). Data veracity and value had the same low contribution level (10% on each criterion). Similarly, with respect to the volume of the data, data veracity and value were considered less important (10% on each criterion) while data velocity (40%) and variety (40%) were considered to be relatively important. Moreover, it can also be seen that the variety of the SCF data was dependent mainly on the veracity (53%) and velocity (43%). Data value and volume were considered insignificant (2% on each criterion). With respect to the outer-dependence linkage with SCF, data veracity and value were scored similarly (44%). Velocity, variety, and volume were scored as 3%, 4%, and 5%, respectively. The overall scores for the significance weighting of data veracity, value, velocity, variety, and volume were 30%, 29%, 7%, 17%, and 17%, respectively.
4.2. Fuzzy TOPSIS Results
4.2.1. Overall Rankings
Table 5 presents the final results for the fuzzy TOPSIS model. It can be observed that the highest score was recorded for SP&D (0.145). This indicates that it is the most mature GSCM practice for improving the implementation of SCF. The scores for the remaining GSCM practices were 0.131, 0.104, 0.101, 0.098, 0.081, 0.072, and 0.064 for QUAL, SUPP, CUTS, organizational interaction maturity (ORGM), environmental management (ENVI), TOP, and GHRM, respectively.
4.2.2. Basic Readiness and Relative Readiness Indices
All GSCM practices were rearranged by their final fuzzy TOPSIS scores (Table 6) with additional interpretations. Thus, two indices were developed: the Basic Readiness Index (BRI) and the Relative Readiness Index (RRI). The BRI measures the actual readiness of each GSCM practice to facilitate the SCF implementation by normalizing the final fuzzy TOPSIS scores (CCi). With the BRI, the final fuzzy TOPSIS score (CCi) for each GSCM practice is divided by the sum of the scores for all the GSCM practices (Table 6). The SP&D score on the BRI was 18.2% ([0.145/0.796] × 100 = 18.2%). This represented the highest normalized fuzzy TOPSIS score and, therefore, the highest BRI. GHRM had the lowest BRI score (8.0%). The results indicate that the GSCM practices were generally not ready for SCF implementation because the BRI scores were between 8.0% and 18.2%. However, this is different from the interpretation through the RRI. The RRI measures the relative readiness of each GSCM practice to facilitate SCF implementation by benchmarking the final fuzzy TOPSIS scores (CCi). With the RRI, the final fuzzy TOPSIS score (CCi) for each GSCM practice is divided by the highest score (Table 6). For example, the RRI score of 69.4% ([0.101/0.145] × 100 = 69.4%) for customer relationship management (CUST) represents the benchmarked fuzzy TOPSIS score because it reflects the relative readiness of CUST compared with the best practice (SP&D). Accordingly, the RRI score for SP&D was 100% ([0.145/0.145] × 100 = 100%), thereby indicating that SP&D was the best practice (compared to all other practices). Consequently, GHRM had the lowest RRI score (44.1%). The outcomes of the integration of the RRI scores and ISM results are discussed in the next sections.
4.3. ISM Results
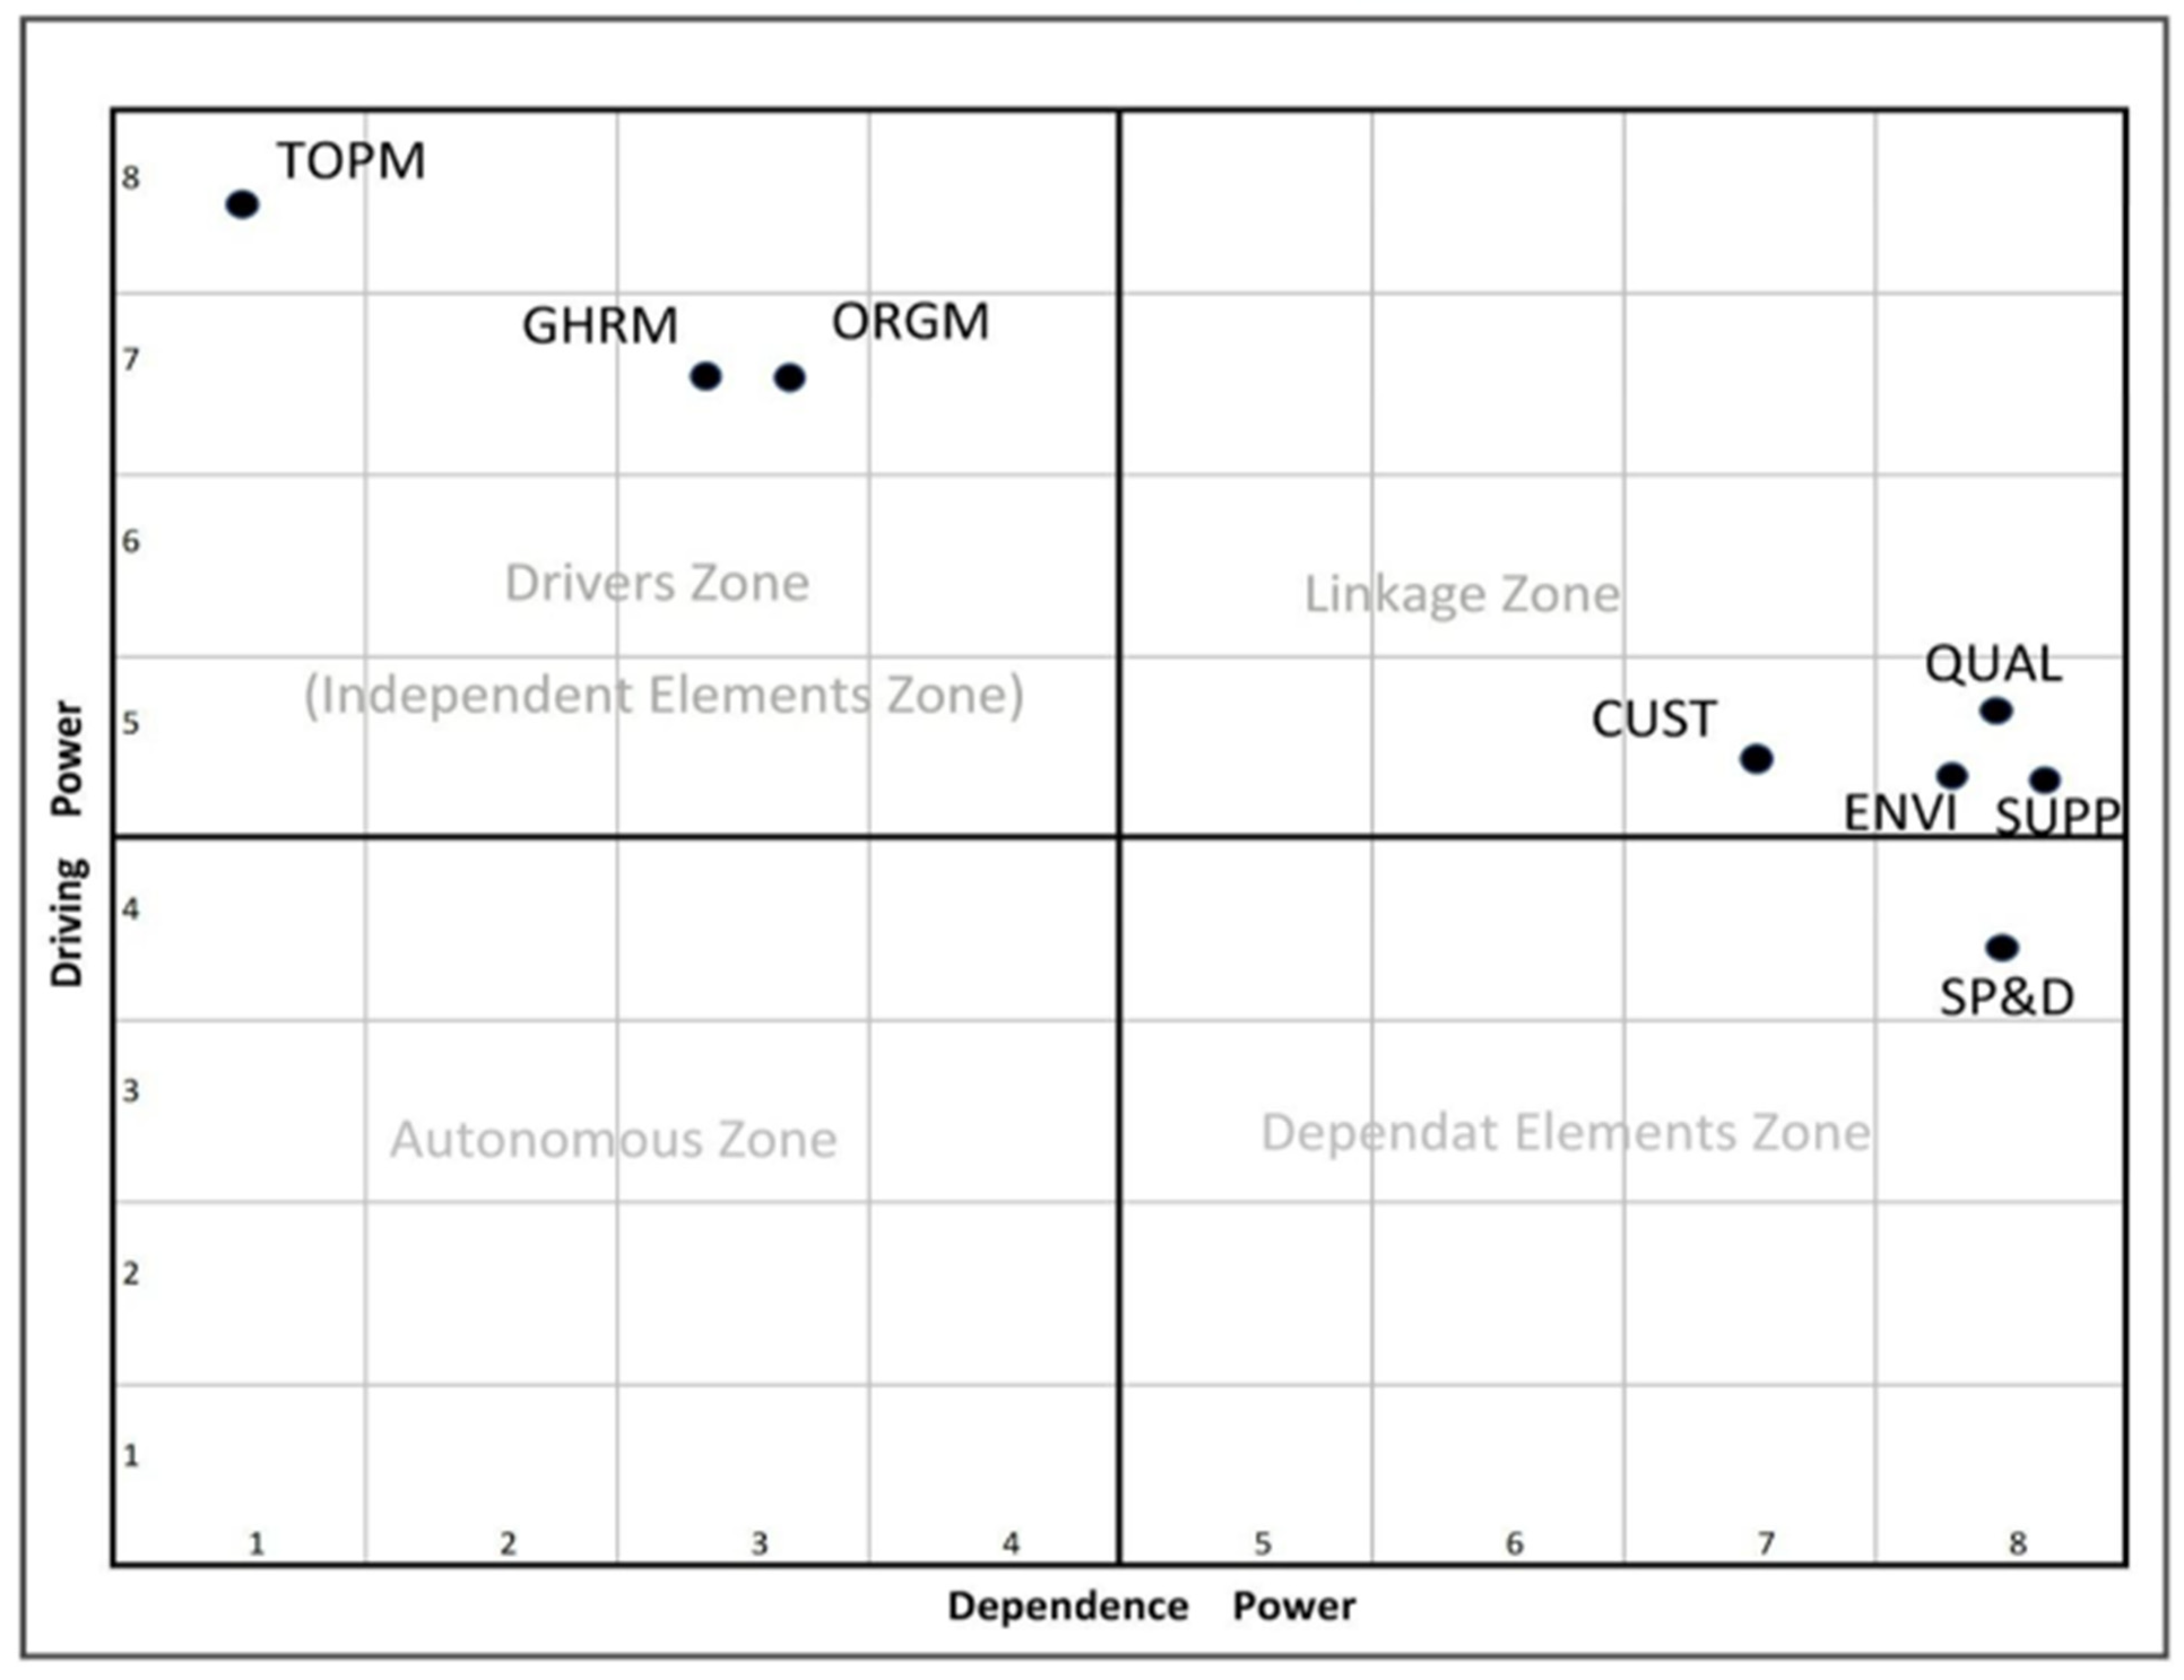
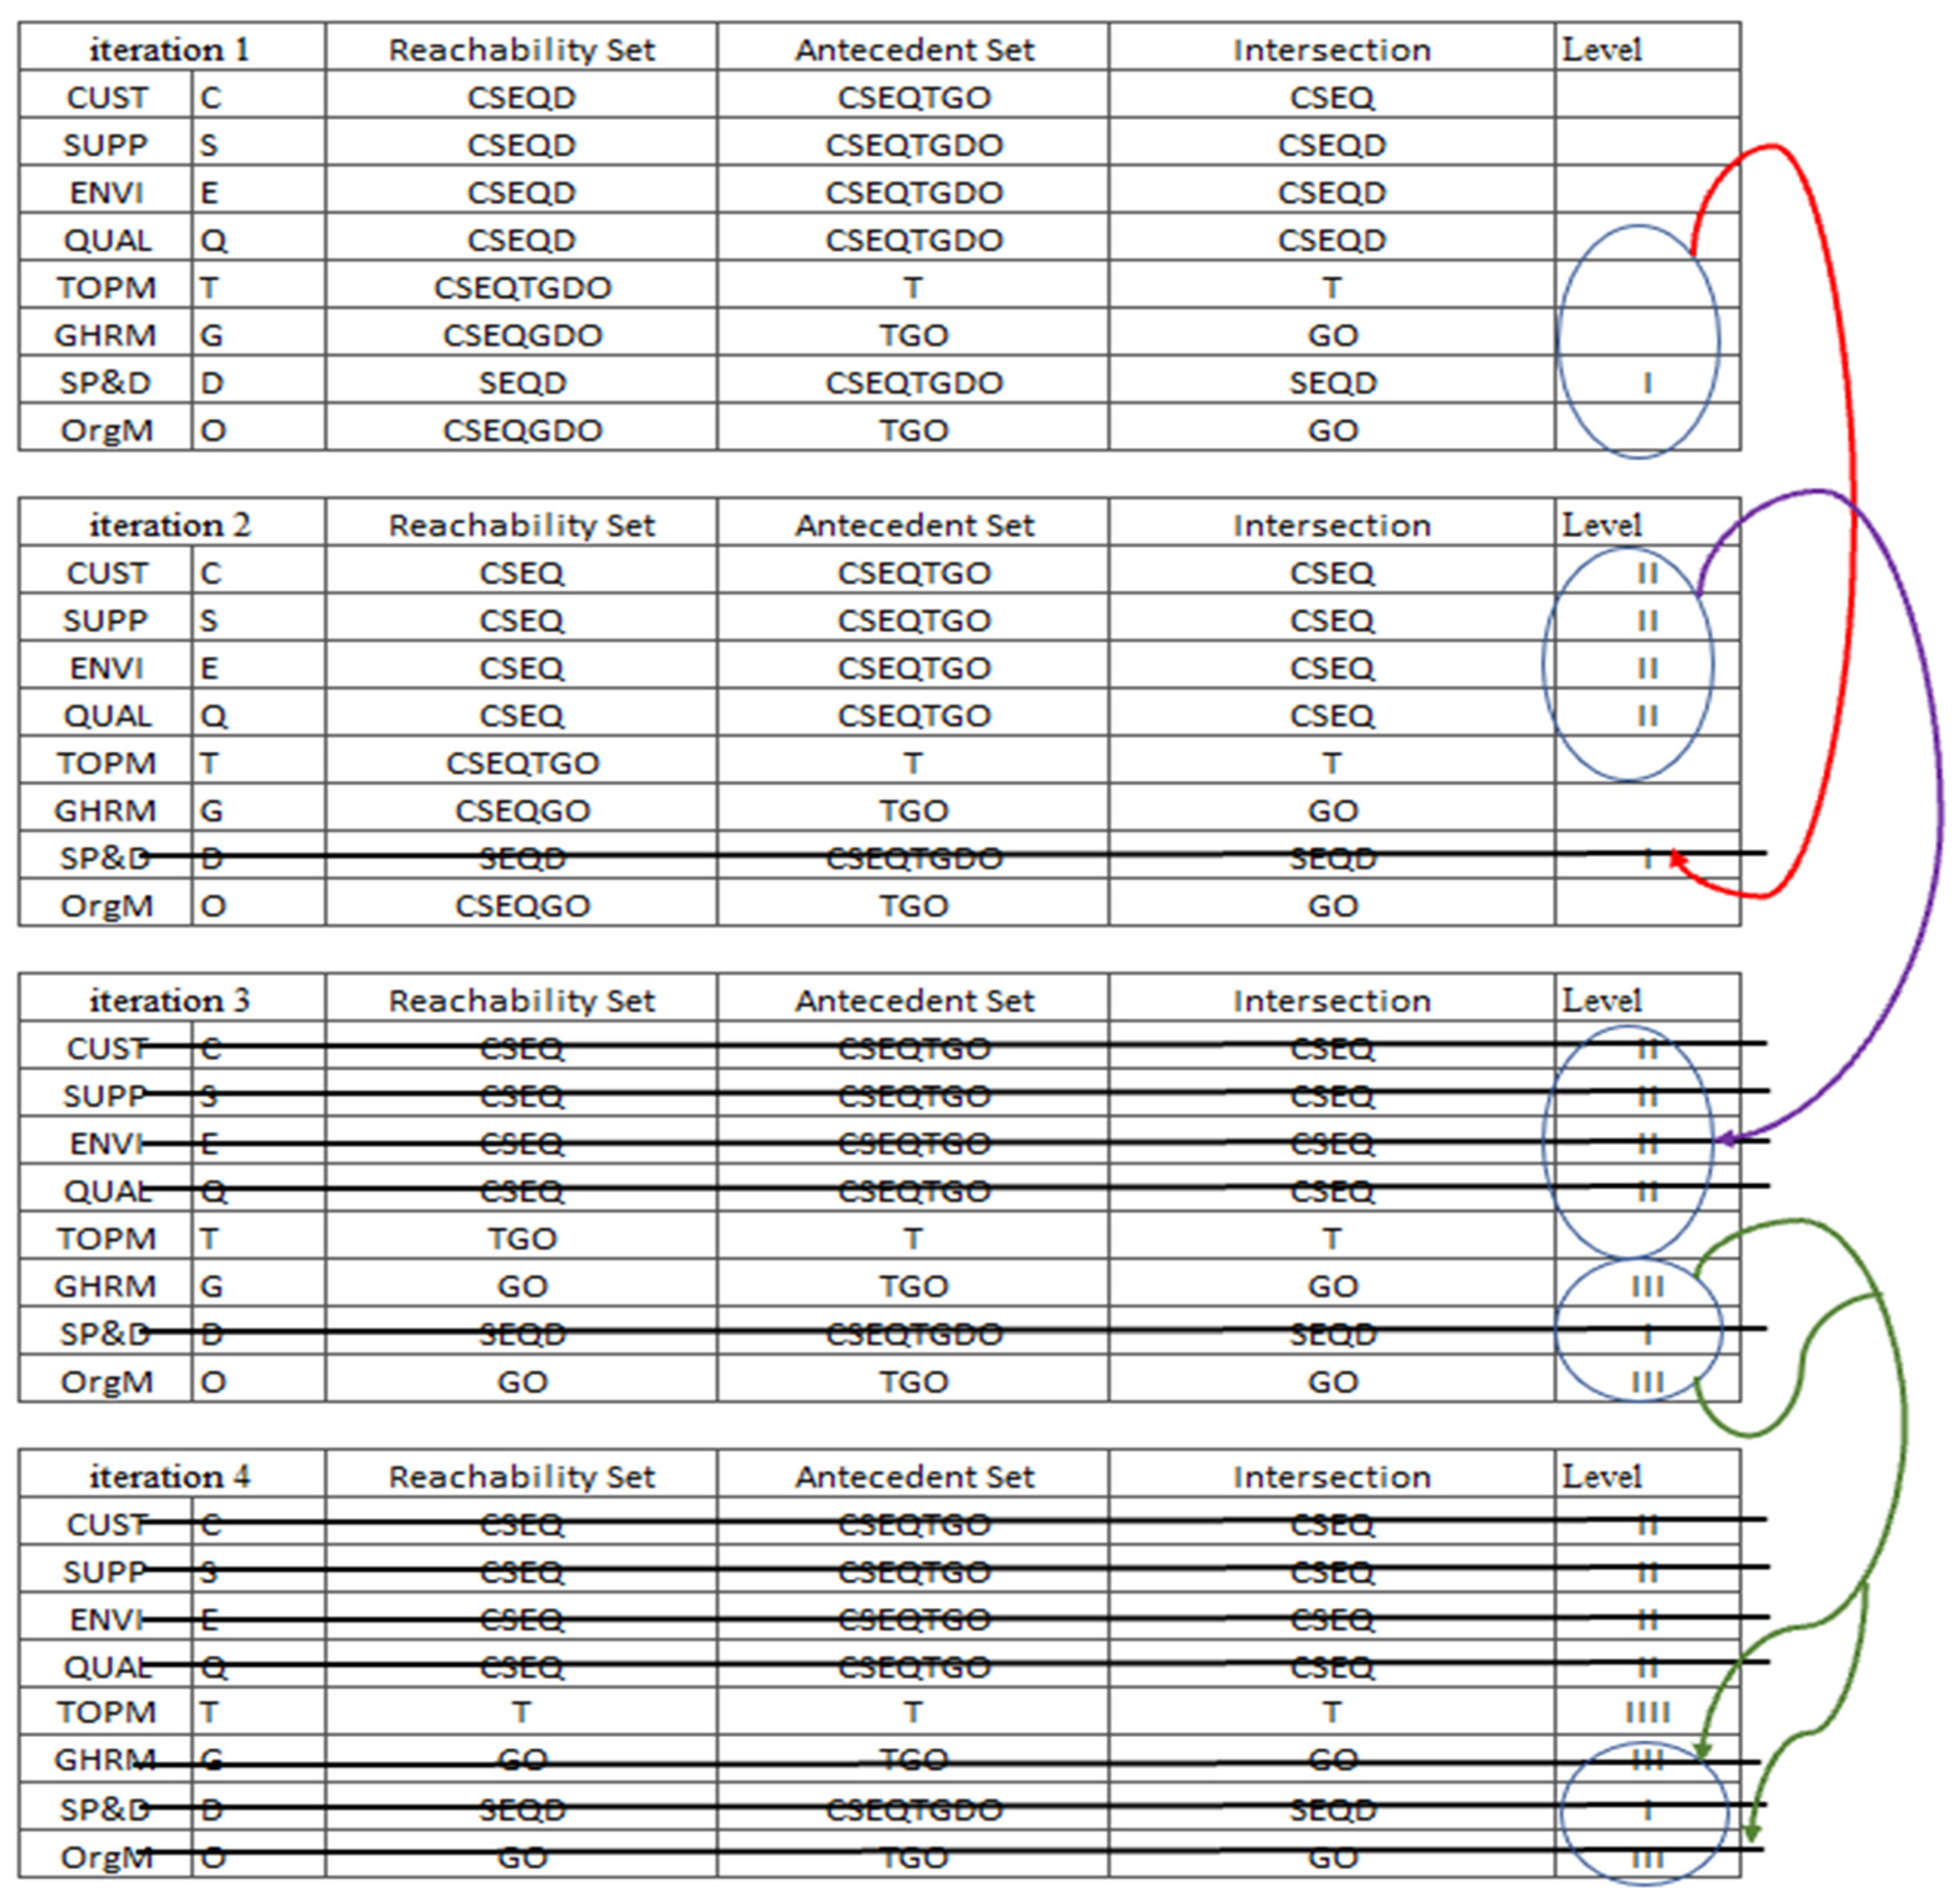
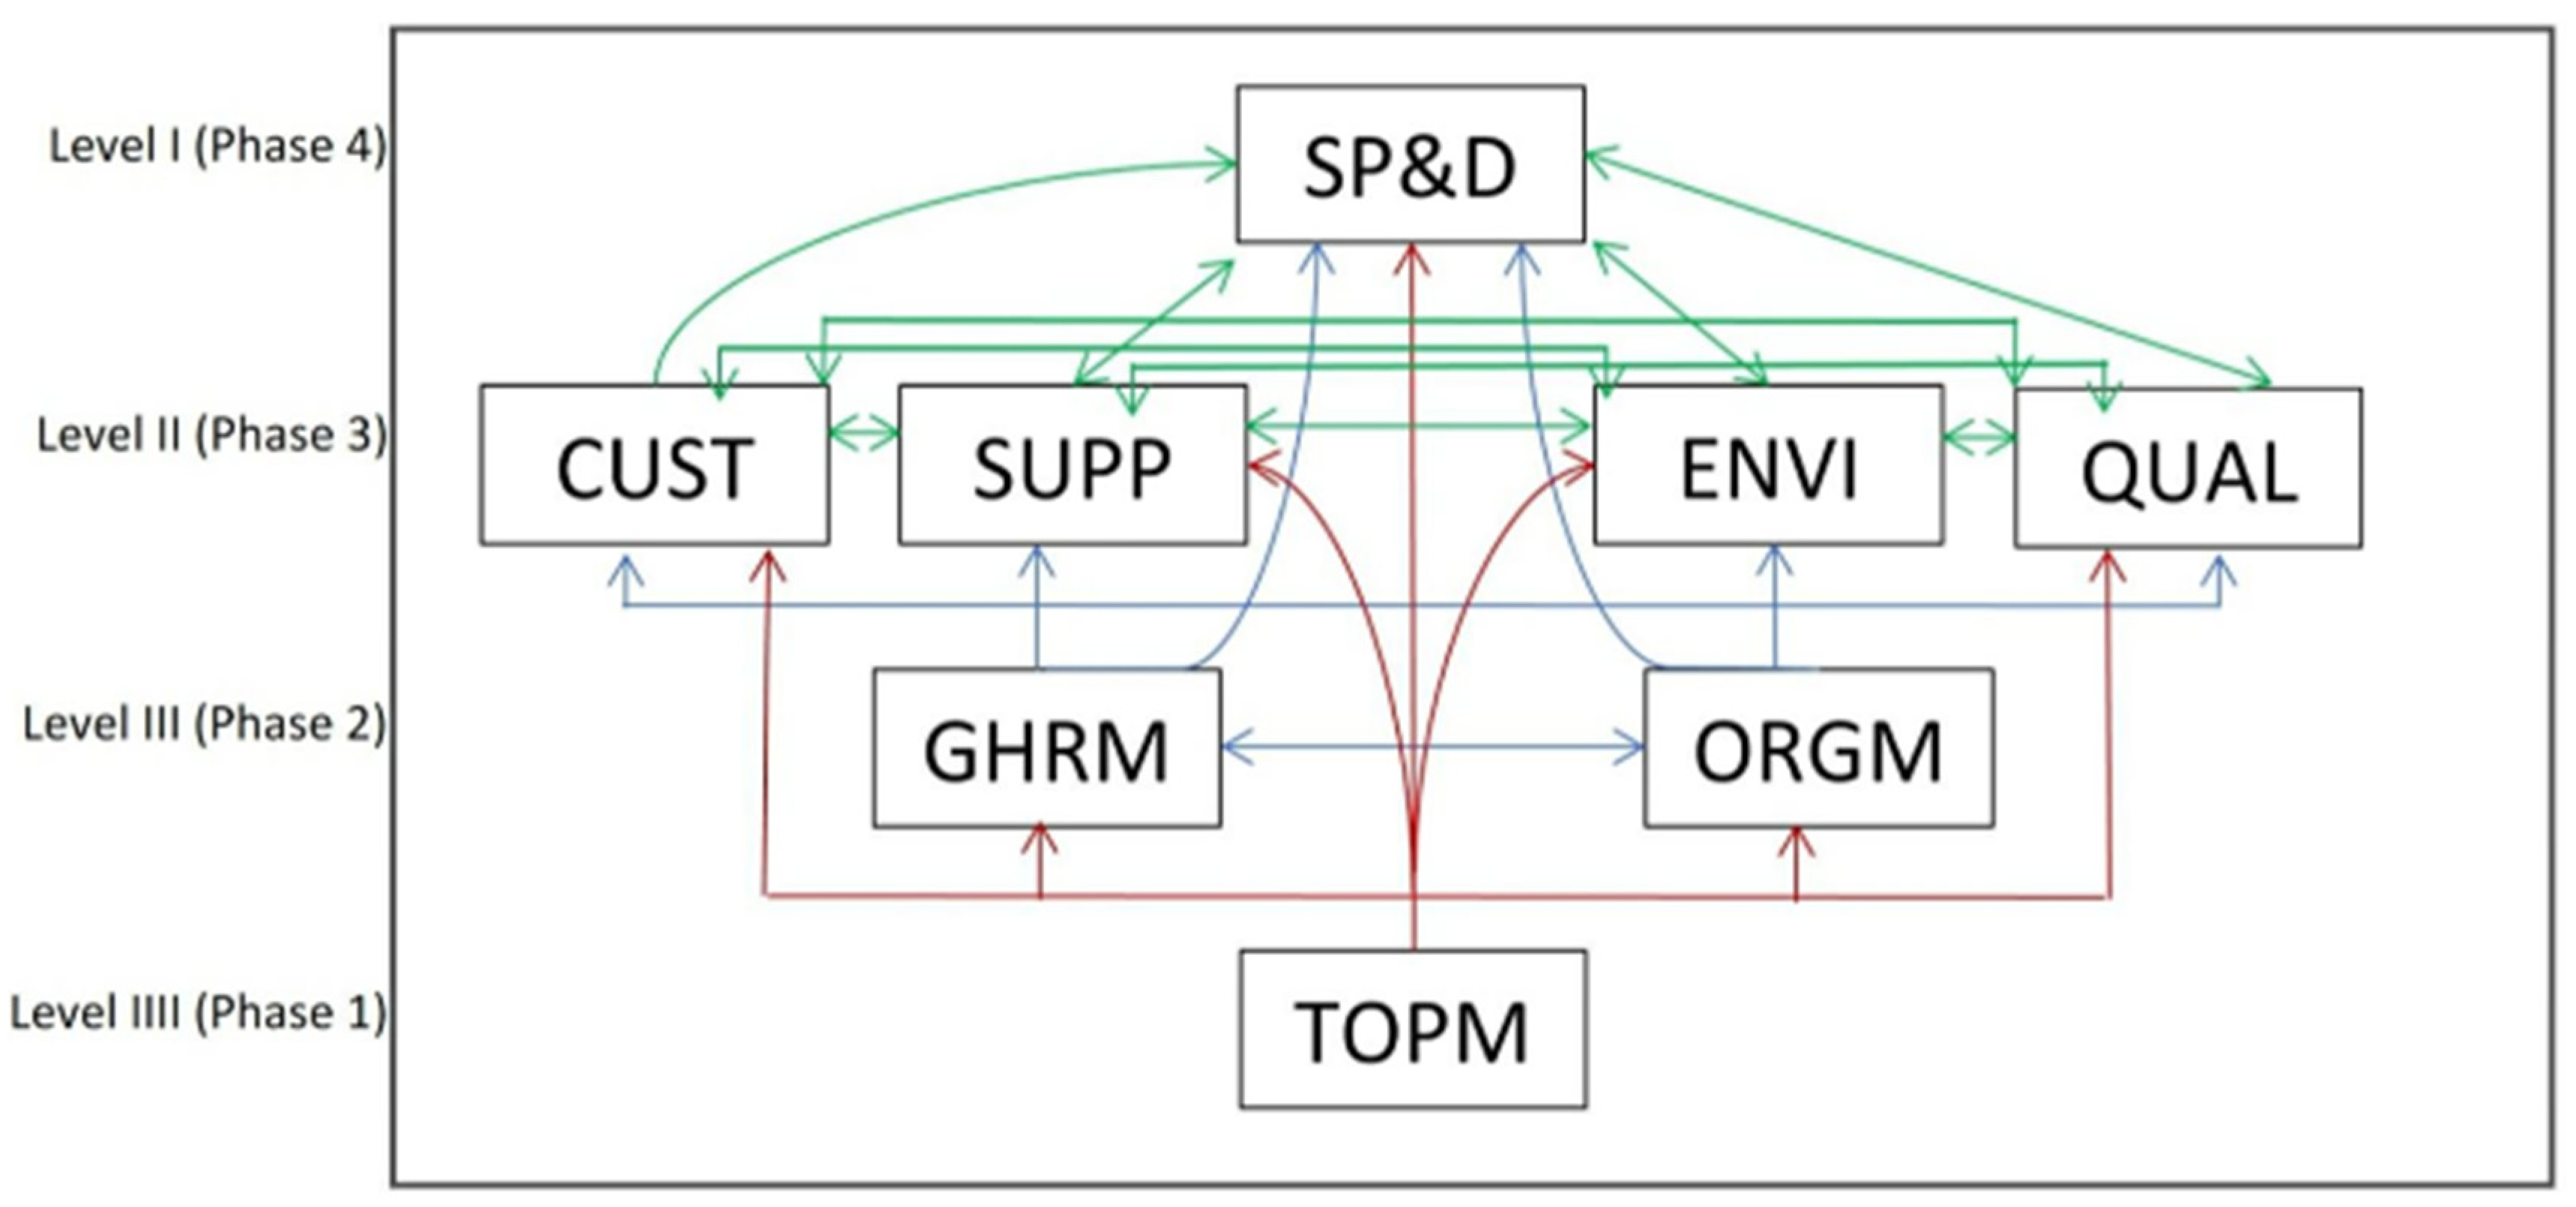
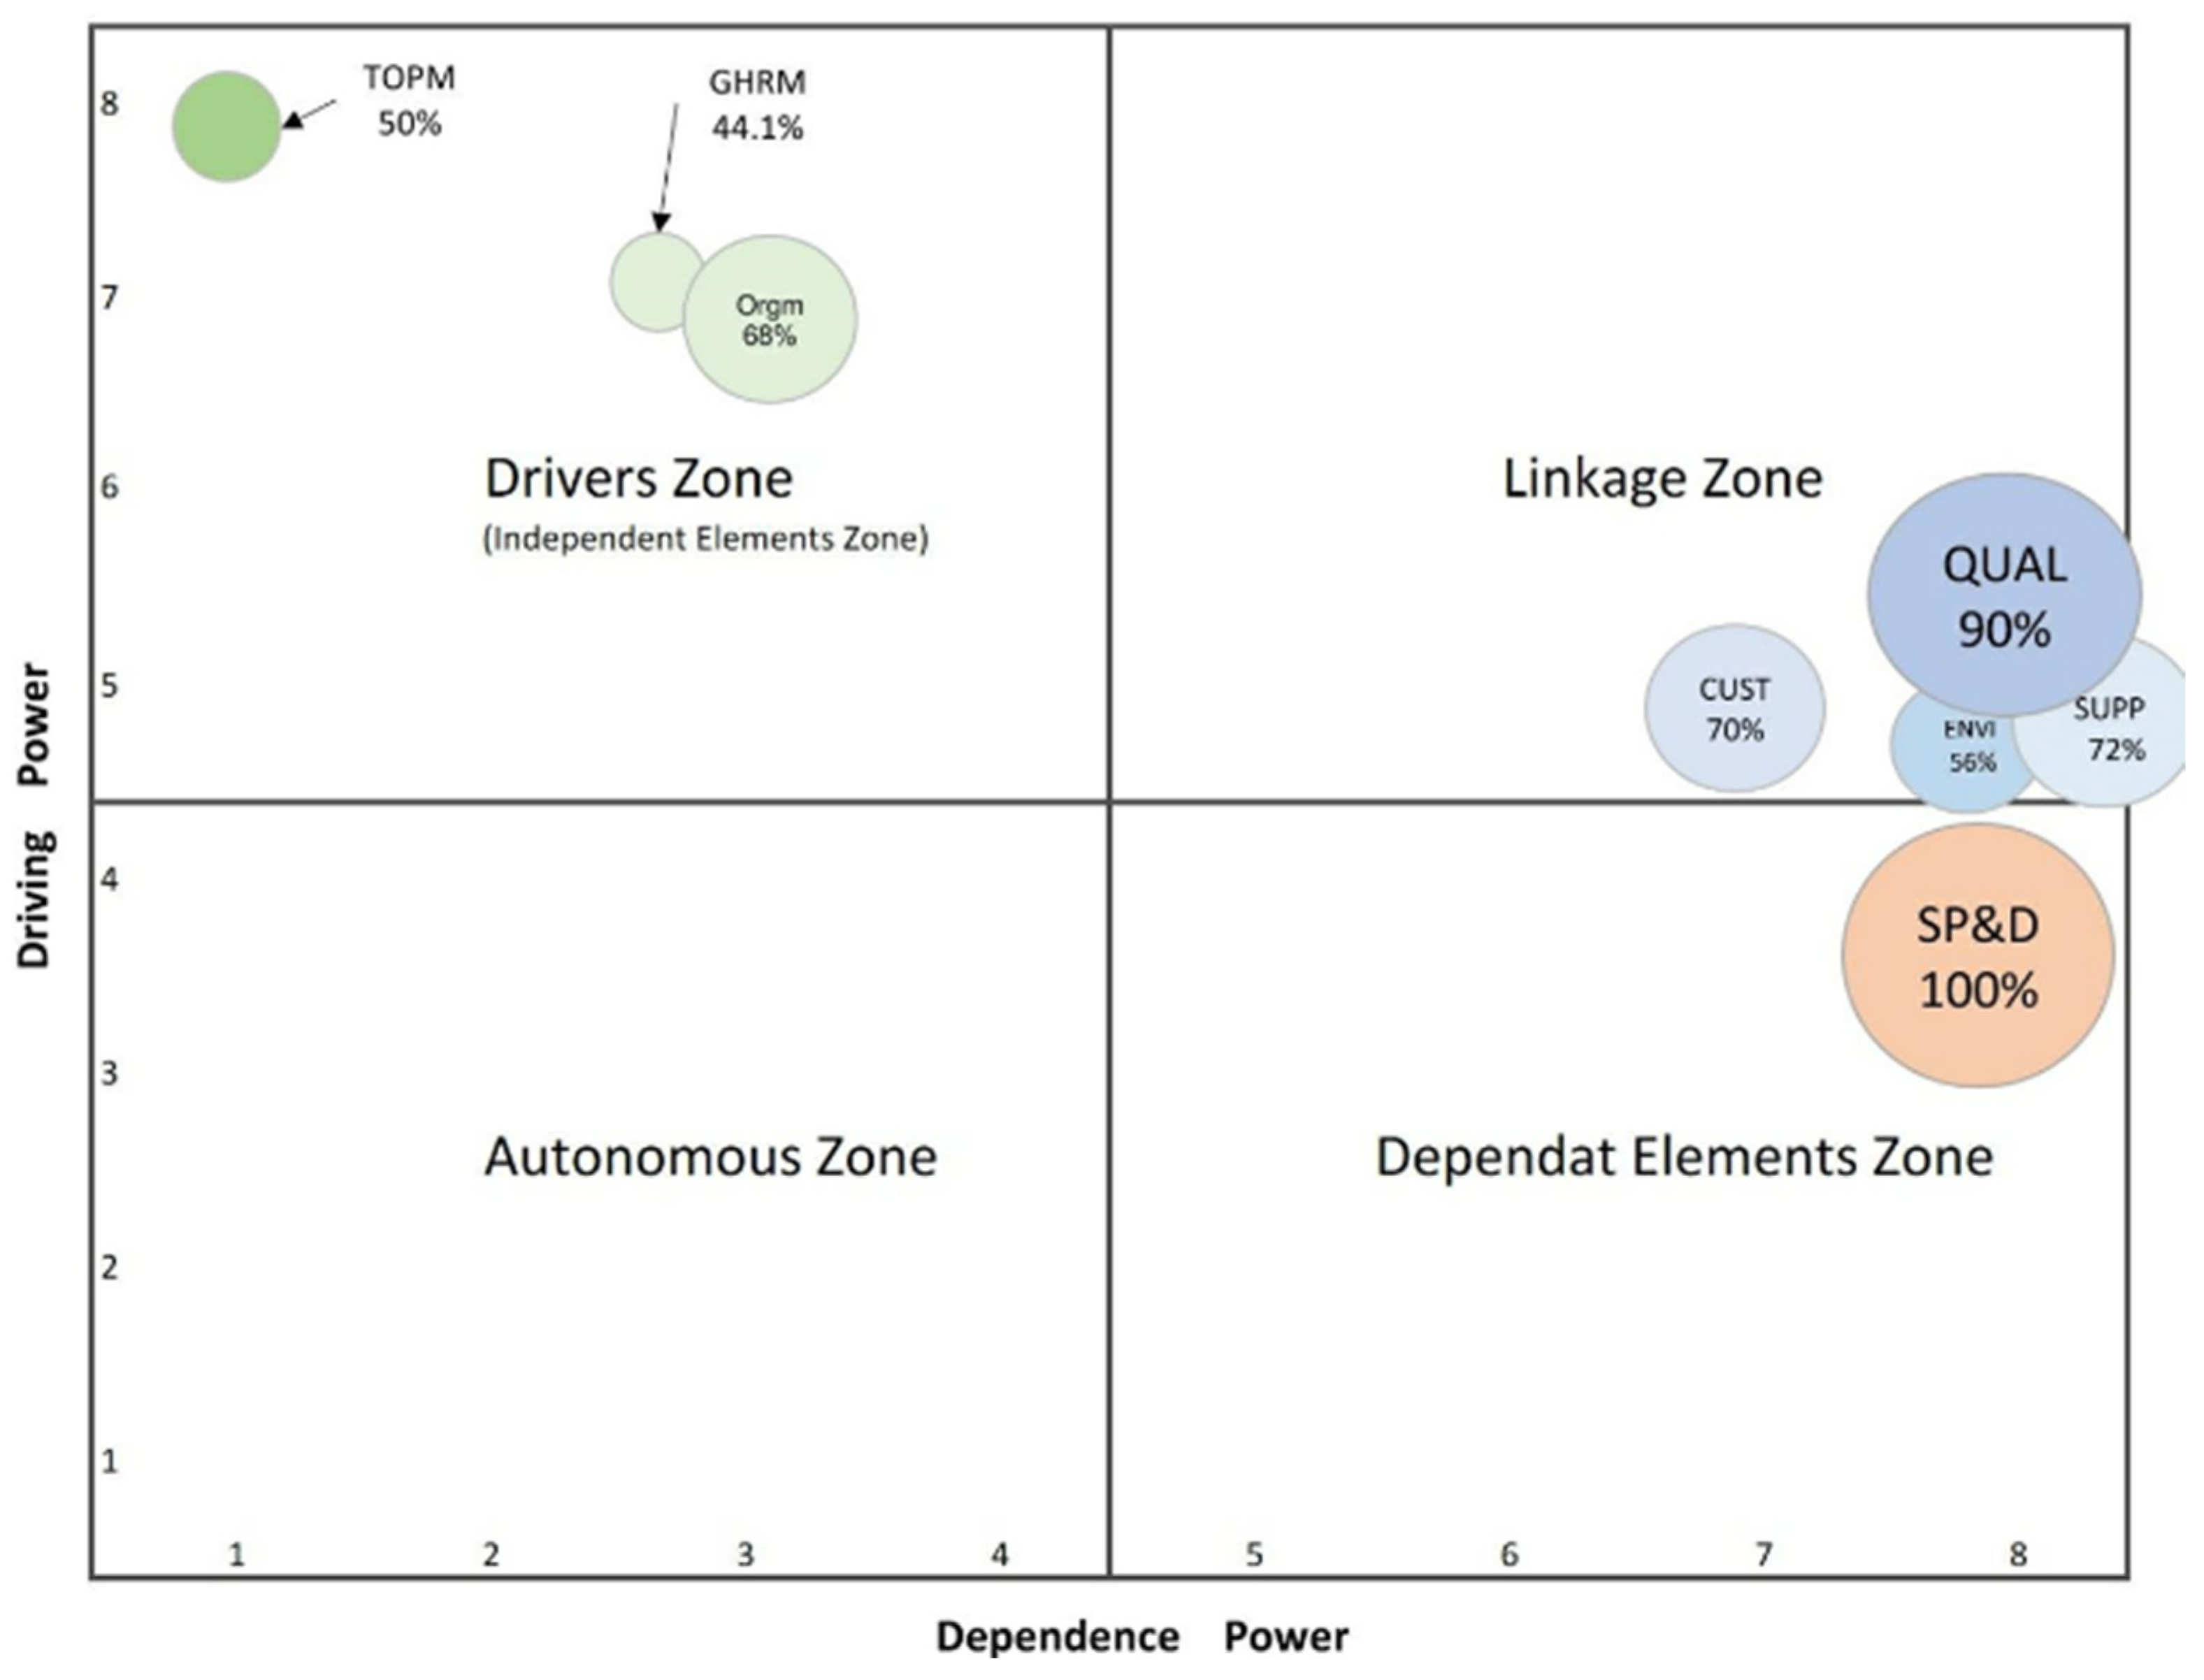
Table 7 shows the computed driving power and dependence power for each GSCM practice. It shows that SUPP, ENV, and QUAL had the same driving power (5) and a similar dependence power (8). CUST also had a similar driving power (5) but slightly different dependence power (7). Likewise, GHRM and ORGM had similar driving power (7) and similar dependence power (3). The TOPM scores indicate the highest driving power (8) and the lowest dependence power (1). In contrast, the SP&D scores indicate the lowest driving power (4) and the highest dependence power (8). On the basis of the computed driving power and dependence power, the GSCM practices were placed into three categories: driver (independent element zone), linkage, and dependent element zones (Figure 5). TOPM, GHRM, and ORGM are located in the driver zone and SP&D is considered an a dependent practice. CUST, SUPP, ENVI, and QUAL are considered linkage practices because they have relatively high driving and dependence power. The final ISM is the result of four sophisticated iterations (Figure 6). Figure 7 illustrates the final ISM in which TOPM represents the basis for the efficient implementation of the other GSCM elements. In other words, the successful application of the GSCM-related efforts and resources are dependent on TOPM assurances and implementation. In contrast, SP&D is considered to result from the implementation of the other GSCM practices. Thus, the effort and resources needed for the implementation of SP&D cannot be technically justified. The application of the same logic and argument to all GSCM practices to improve the SCF environment (Figure 7) represents an effective initial GSCM implementation roadmap that considers the prioritized levels corresponding to each set of practices.
5. Implications, Contributions, and Directions for Future Studies
Synergized outcomes can be extracted when ISM results are interpreted by RRI scores or vice versa. In Figure 8, which is an adjustment of Figure 5, the size of the bubble is a reflection of the corresponding RRI score for each GSCM practice. It indicates that the drivers (independent practices) are less ready for facilitating SCF implementation than the linkage practices or the sole dependent practice—i.e., SP&D. For example, TOPM was considered as a driver. The corresponding RRI score was very low (50%). This indicates that TOPM lacked sufficient readiness or maturity to enhance SCF. Nevertheless, it was assumed to be the most ready practice because of the corresponding results for its driving power (8—i.e., high), dependence power (1—i.e., low), and phase or priority level (Phase 1). In contrast, SP&D was considered a dependent practice. The corresponding RRI score was the highest (100%). This indicates that SP&D was the readiest practice. However, this was counter to its corresponding driving power (4), which was the lowest; dependence power (8), which was the highest (i.e., = 8); and phase or priority level, which was the lowest (Phase 4).
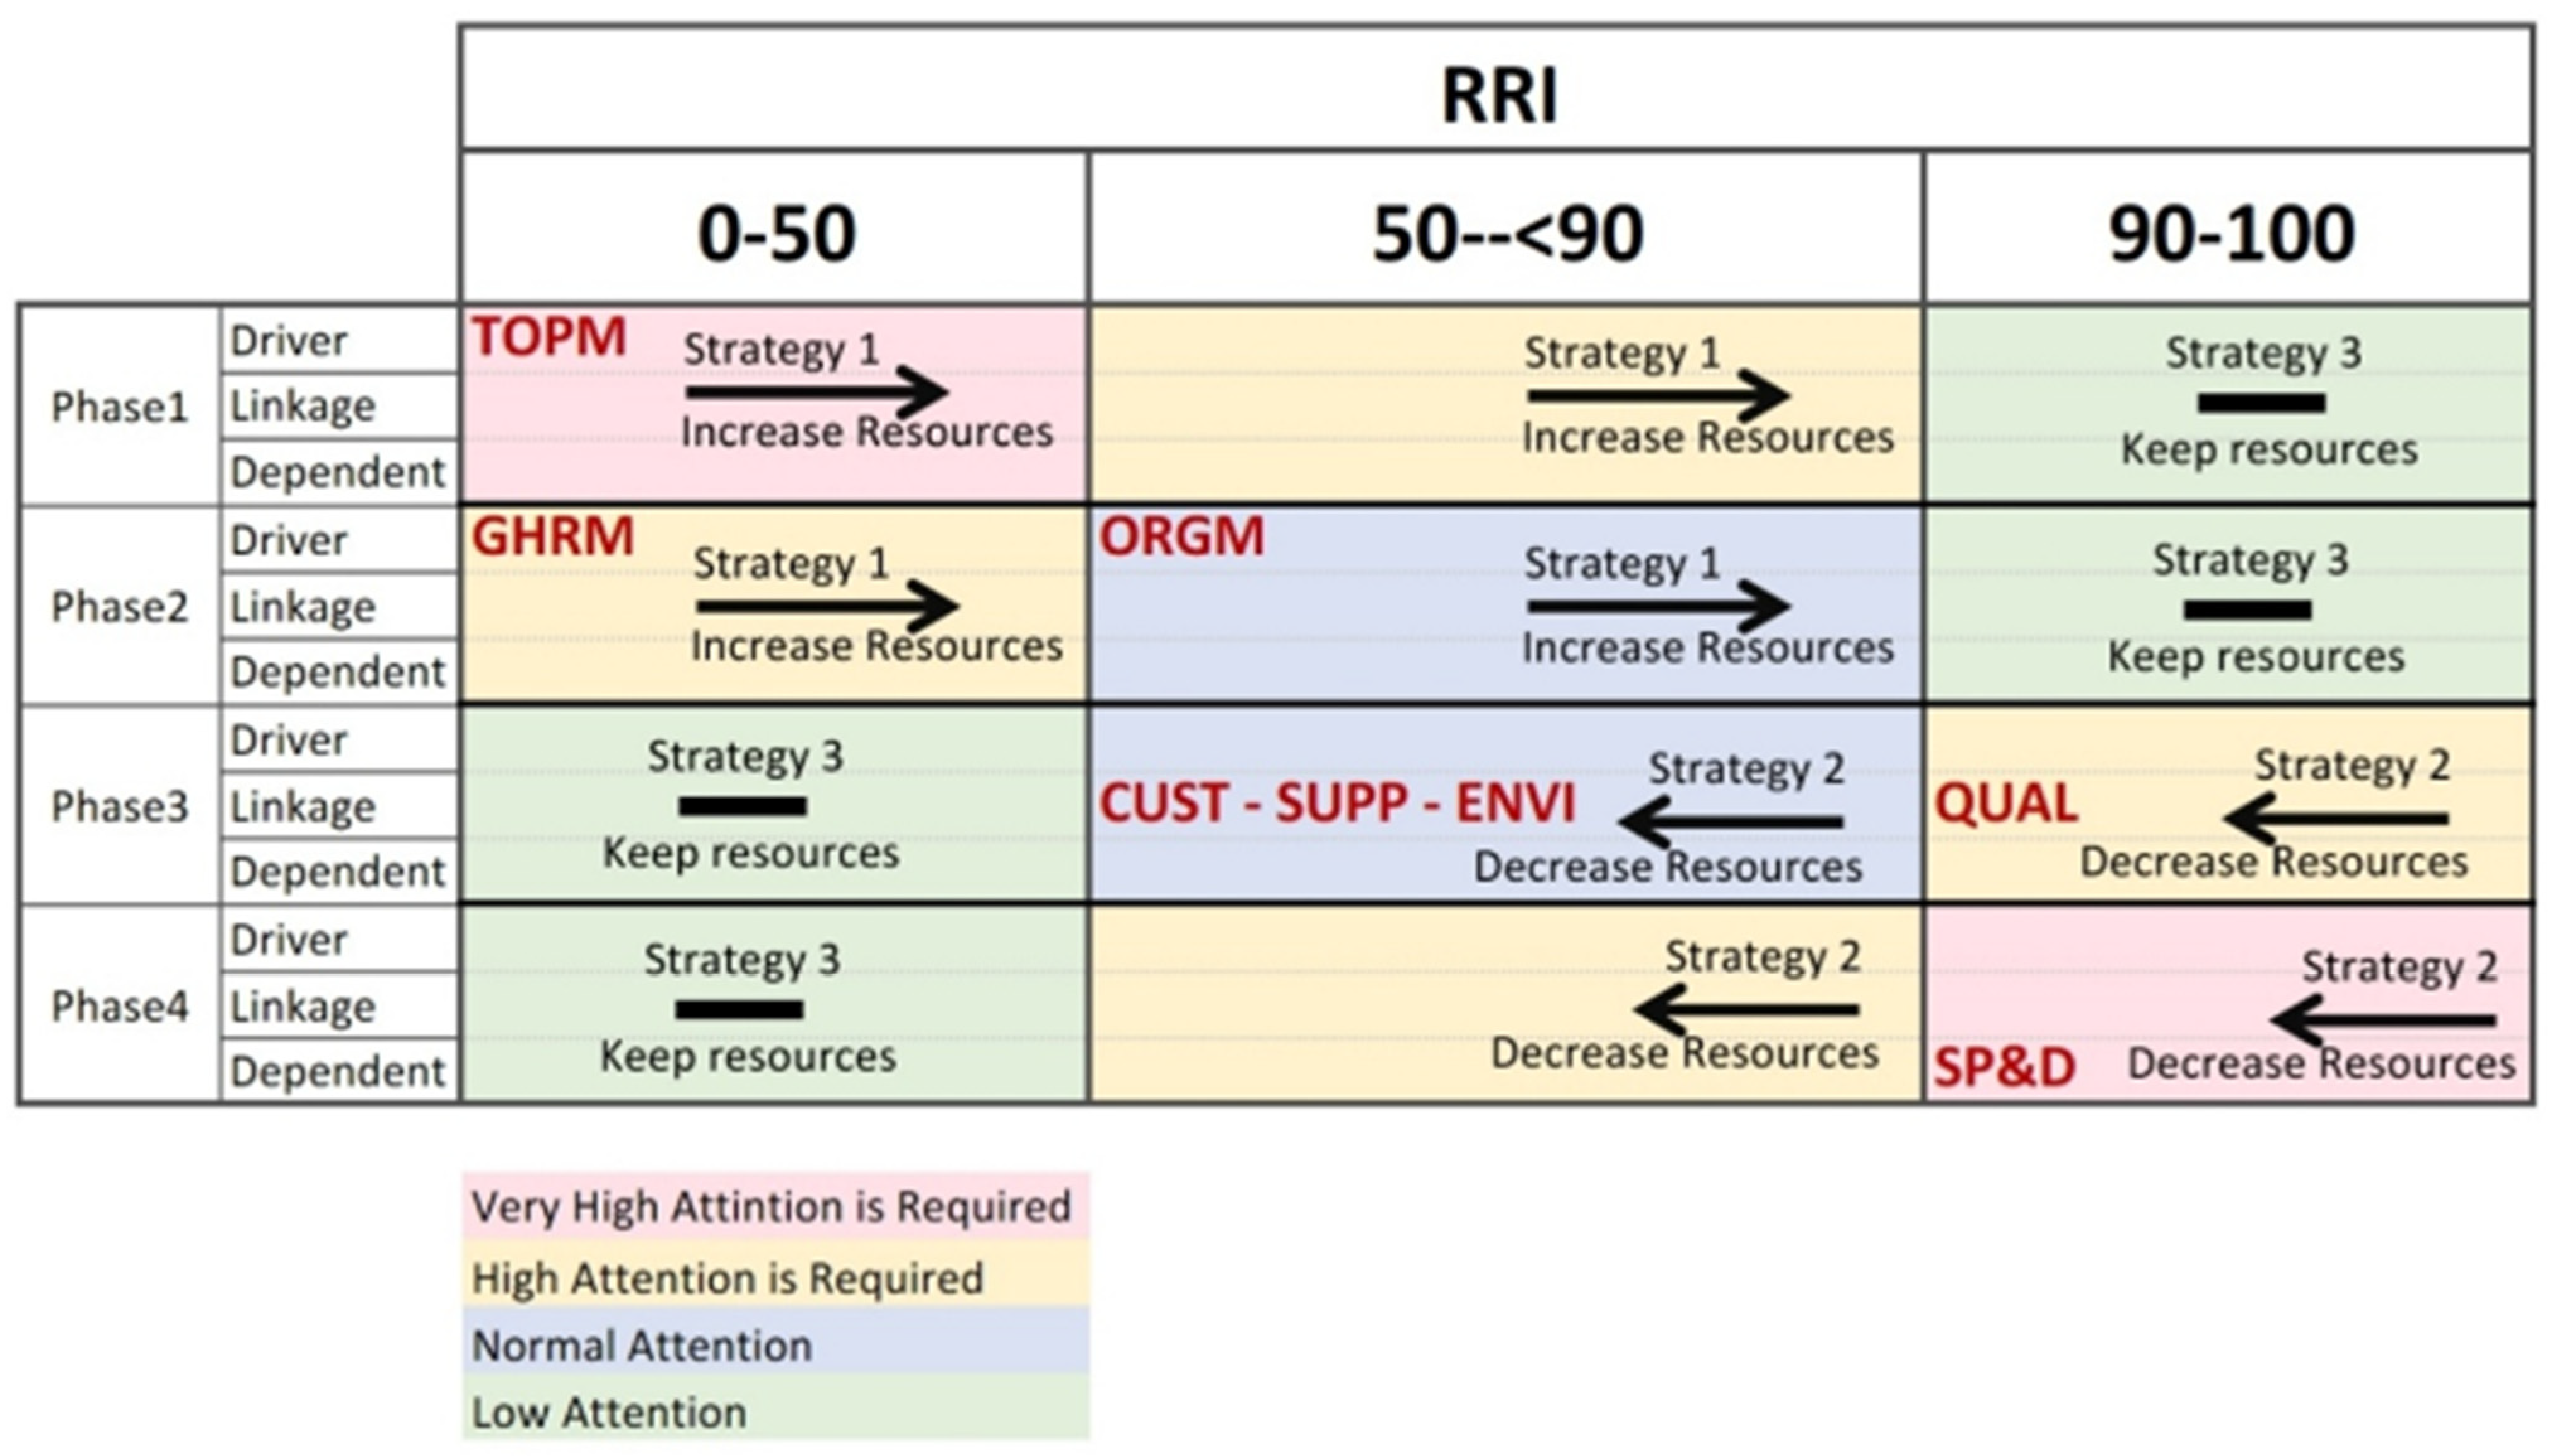
To overcome this issue, the present study developed a strategic matrix tool (SMT), which is important for the reorganization and remobilization of the available resources. In Figure 9, the prioritized phases are listed vertically by the corresponding GSCM practice categories (zones). This also illustrates the horizontal classification of the RRI scores into three categories: 1, RRI score ≤ 50%; 2, RRI score ≥ 50% up to 90%; and 3, RRI score = 90% up to 100%. Therefore, three strategies were developed. The first (Strategy 1) refers to the process of increasing the allocated resources for each GSCM practice located in any square labeled “very high”, “high”, or “normal” attention in Phases 1 and 2 (Figure 9). The second (Strategy 2) refers to the decrease in the allocated resources for each GSCM practice located in any square labeled “very high”, “high”, or “normal” attention in Phases 3 or 4. The third (Strategy 3) is the maintenance of the same level of resources for each GSCM practice located in any square labeled “low” attention in Phases 1, 2, 3, or 4. The strategies for each practice are assigned on the basis of their location in the SMT (Figure 9).
This study contributes to the context of MCDM and its applications in GSCM from different angles. From a technical point of view, in order to evaluate the eight GSCM practices, fuzzy TOPSIS was conducted innovatively by using the relevant linguistic expression corresponding to to each V of big data (i.e., each criterion), as shown in Figure 4, which is a relatively more appropriate and accurate application compared to several traditional applications of fuzzy TOPSIS. Additionally, the study succeeded in visualizing the resources throughout a developed version of the ISM’s final structure as shown in Figure 8. Such an innovative representation facilitates the resource allocation adjustment process to ensure better utilization of resources by each GSCM practice. Specifically, note that the size of the bubble is a reflection of the dedicated resources for each GSCM practice, which is a developed and unique form of ISM results representation.
Such technical contributions lead the talk to the practical/managerial contributions of the developed model. With such innovative tools proposed herein (i.e., BRI, RRI, and SMT), decision-makers can precisely allocate the required resources for the “demanding” GSCM practices with respect to the appropriate phase (i.e., timing). This can be performed by reducing the amount of resources dedicated to the GSCM practices in which resources are overutilized (i.e., saturated practices). Such strategic managerial actions can be executed with the aid of the three proposed strategies, as illustrated in the proposed SMT (Figure 9). By following such an approach, practitioners can allocate more resources confidently to the independent GSCM practices (drivers) such as TOPM, GHRM, and ORGM because the current dedicated resources for these practices are below their requirements as “drivers”. Similarly, resources can be deducted confidently from the dependent GSCM practices such as QUAL, SP&D, ENVI, CUST, and SUPP. Such MCDM-driven practical/managerial approaches for resource allocation and/or strategy creation are applicable in many fields including sustainability [154,155,156,157].
In this study, opinion-based measures for big data were employed when carrying out fuzzy ANP and fuzzy TOPSIS. However, the employment of a data-driven approach would provide more accurate interpretations. To illustrate this, instead of using linguistic terms in measuring the GSCM practices with respect to the five Vs (Figure 4), the volume of data, for example, can be measured in Terabytes (TB) or even Petabytes (PB), the velocity of the data can also be measured, for example, in TB per second (TB/s), and so. Another direction for future research can be investigated within the context of resource utilization. Specifically, the required resources for each GSCM practice can be cascaded into a further levels of details such as the types of resources to be utilized (human, technical, organizational, physical, or financial), as discussed and illustrated in [118].
6. Conclusions
This study proposes a hybrid self-assessment model to measure the maturity of SCF considering the environmental dimension by the coherent application of three MCDM techniques: fuzzy ANP, fuzzy TOPSIS, and ISM. The five Vs of big data were found to provide a template for assessing of GSCM practices. The fuzzy ANP illustrates the quantification of the five Vs by considering their inner- and outer-dependence. The fuzzy TOPSIS measures the contribution of each GSCM practice to supply chain financial performance. Moreover, rather than extracting the final GSCM practice scores, as is typical of traditional fuzzy TOPSIS applications, the study developed two indices: the BRI and RRI. The BRI scores indicated that the GSCM practices in the investigated company were not mature enough to improve the implementation of SCF. However, the proposed RRI index facilitated the benchmarking of GSCM practices to create the initial improvement guidelines. Consequently, the application of ISM creates a roadmap for the improvement of each practice through the categorization by driver, linkage, and dependent practices. ISM also allows for additional interpretations through the computation of the driving and dependence power for each practice and the identification of the corresponding level for each set of practices. In sum, the proposed SMT creates the potential for further improvements through the integration of the RRI scores and ISM results. Hence, the proposed hybrid model offers a practical tool for decision-makers.
Funding
This research received no external funding.
Institutional Review Board Statement
Not applicable.
Informed Consent Statement
Not applicable.
Acknowledgments
The author would like to acknowledge the group of experts who willingly participated in this study, and without whom the completion of this research study would not be possible.
Conflicts of Interest
The authors declare no conflict of interest.
References
- Anderson, J.C.; Narus, J.A. Business marketing: Understand what customers value. Harv. Bus. Rev. 1998, 76, 53–67. [Google Scholar]
- AlKhidir, T.; Zailani, S. Going green in supply chain towards environmental sustainability. Glob. J. Environ. Res. 2009, 3, 246–251. [Google Scholar]
- Govindan, K.; Kaliyan, M.; Kannan, D.; Haq, A.N. Barriers analysis for green supply chain management implementation in Indian industries using analytic hierarchy process. Int. J. Prod. Econ. 2014, 147, 555–568. [Google Scholar] [CrossRef]
- Mudgal, R.K.; Shankar, R.; Talib, P.; Raj, T. Modelling the barriers of green supply chain practices: An Indian perspective. Int. J. Logist. Syst. Manag. 2010, 7, 81–107. [Google Scholar] [CrossRef]
- Hervani, A.A.; Helms, M.M.; Sarkis, J. Performance measurement for green supply chain management. Benchmarking Int. J. 2005, 12, 330–353. [Google Scholar] [CrossRef] [Green Version]
- Ravi, V.; Shankar, R. Analysis of interactions among the barriers of reverse logistics. Technol. Forecast. Soc. Chang. 2005, 72, 1011–1029. [Google Scholar] [CrossRef]
- Chen, L. Sustainability and Company Performance: EVIDENCE from the Manufacturing Industry; Linköping University Electronic Press: Linköping, Sweden, 2015; Volume 1698, ISBN 9176859673. [Google Scholar]
- Bowen, F.E.; Cousins, P.D.; Lamming, R.C.; Farukt, A.C. The role of supply management capabilities in green supply. Prod. Oper. Manag. 2001, 10, 174–189. [Google Scholar] [CrossRef]
- Azar, A.; Zarakani, M.; Mirhosseini, S.S.; Masouleh, M.H. The mediation role of social capital in relationship between buyer-supplier relationship with green supply chain collaboration. Int. J. Logist. Syst. Manag. 2018, 29, 82–101. [Google Scholar] [CrossRef]
- Camerinelli, E. Supply chain finance. J. Paym. Strateg. Syst. 2009, 3, 114–128. [Google Scholar]
- Gomm, M.L. Supply chain finance: Applying finance theory to supply chain management to enhance finance in supply chains. Int. J. Logist. Res. Appl. 2010, 13, 133–142. [Google Scholar] [CrossRef]
- Wuttke, D.A.; Blome, C.; Henke, M. Focusing the financial flow of supply chains: An empirical investigation of financial supply chain management. Int. J. Prod. Econ. 2013, 145, 773–789. [Google Scholar] [CrossRef]
- Hofmann, E. Supply Chain Finance: Some Conceptual Insights. Beiträge Zu Beschaffung Und Logistik; Springer: Berlin/Heidelberg, Germany, 2005; pp. 203–214. [Google Scholar]
- Pfohl, H.-C.; Gomm, M. Supply chain finance: Optimizing financial flows in supply chains. Logist. Res. 2009, 1, 149–161. [Google Scholar] [CrossRef]
- Chen, X.; Hu, C. The value of supply chain finance. Supply Chain Manag. Appl. Simul. 2011, 111–132. [Google Scholar] [CrossRef] [Green Version]
- Grosse-Ruyken, P.T.; Wagner, S.M.; Jönke, R. What is the right cash conversion cycle for your supply chain? Int. J. Serv. Oper. Manag. 2011, 10, 13–29. [Google Scholar]
- More, D.; Basu, P. Challenges of supply chain finance. Bus. Process. Manag. J. 2013, 19, 624–647. [Google Scholar] [CrossRef]
- Gelsomino, L.M.; Mangiaracina, R.; Perego, A.; Tumino, A. Supply chain finance: A literature review. Int. J. Phys. Distrib. Logist. Manag. 2016, 46. [Google Scholar] [CrossRef]
- Opresnik, D.; Taisch, M. The value of big data in servitization. Int. J. Prod. Econ. 2015, 165, 174–184. [Google Scholar] [CrossRef]
- Addo-Tenkorang, R.; Helo, P.T. Big data applications in operations/supply-chain management: A literature review. Comput. Ind. Eng. 2016, 101, 528–543. [Google Scholar] [CrossRef]
- Sheng, J.; Amankwah-Amoah, J.; Wang, X. A multidisciplinary perspective of big data in management research. Int. J. Prod. Econ. 2017, 191, 97–112. [Google Scholar] [CrossRef]
- Brinch, M. Understanding the value of big data in supply chain management and its business processes. Int. J. Oper. Prod. Manag. 2018, 38, 1589–1614. [Google Scholar] [CrossRef] [Green Version]
- Kuo, Y.-H.; Kusiak, A. From data to big data in production research: The past and future trends. Int. J. Prod. Res. 2019, 57, 4828–4853. [Google Scholar] [CrossRef] [Green Version]
- Tiwari, S.; Wee, H.-M.; Daryanto, Y. Big data analytics in supply chain management between 2010 and 2016: Insights to industries. Comput. Ind. Eng. 2018, 115, 319–330. [Google Scholar] [CrossRef]
- Touboulic, A.; McCarthy, L.; Matthews, L. Re-imagining supply chain challenges through critical engaged research. J. Supply Chain Manag. 2020, 56, 36–51. [Google Scholar] [CrossRef]
- Lis, A.; Sudolska, A.; Tomanek, M. Mapping Research on Sustainable Supply-Chain Management. Sustainability 2020, 12, 3987. [Google Scholar] [CrossRef]
- Konstantakopoulos, G.D.; Gayialis, S.P.; Kechagias, E.P. Vehicle routing problem and related algorithms for logistics distribution: A literature review and classification. Oper. Res. 2020, 1–30. [Google Scholar] [CrossRef]
- Mohtashami, Z.; Aghsami, A.; Jolai, F. A green closed loop supply chain design using queuing system for reducing environmental impact and energy consumption. J. Clean. Prod. 2020, 242, 118452. [Google Scholar] [CrossRef]
- Tundys, B.; Wiśniewski, T. The Selected Method and Tools for Performance Measurement in the Green Supply Chain—Survey Analysis in Poland. Sustainability 2018, 10, 549. [Google Scholar] [CrossRef] [Green Version]
- Zulqarnain, R.M.; Xin, X.L.; Siddique, I.; Khan, W.A.; Yousif, M.A. TOPSIS Method Based on Correlation Coefficient under Pythagorean Fuzzy Soft Environment and Its Application towards Green Supply Chain Management. Sustainability 2021, 13, 1642. [Google Scholar] [CrossRef]
- Qu, G.; Zhang, Z.; Qu, W.; Xu, Z. Green Supplier Selection Based on Green Practices Evaluated Using Fuzzy Approaches of TOPSIS and ELECTRE with a Case Study in a Chinese Internet Company. Int. J. Environ. Res. Public Health 2020, 17, 3268. [Google Scholar] [CrossRef] [PubMed]
- Susanty, A.; Sari, D.P.; Rinawati, D.I.; Setiawan, L. The role of internal and external drivers for successful implementation of GSCM practices. J. Manuf. Technol. Manag. 2019, 30, 391–420. [Google Scholar] [CrossRef]
- Liu, S.; Eweje, G.; He, Q.; Lin, Z. Turning motivation into action: A strategic orientation model for green supply chain management. Bus. Strategy Environ. 2020, 29, 2908–2918. [Google Scholar] [CrossRef]
- Lahkani, M.J.; Wang, S.; Urbański, M.; Egorova, M. Sustainable B2B E-commerce and blockchain-based supply chain finance. Sustainability 2020, 12, 3968. [Google Scholar] [CrossRef]
- Chen, J.; Cai, T.; He, W.; Chen, L.; Zhao, G.; Zou, W.; Guo, L. A blockchain-driven supply chain finance application for auto retail industry. Entropy 2020, 22, 95. [Google Scholar] [CrossRef] [Green Version]
- Stević, Ž.; Brković, N. A novel integrated FUCOM-MARCOS model for evaluation of human resources in a transport company. Logistics 2020, 4, 4. [Google Scholar] [CrossRef] [Green Version]
- Zhu, Q.; Sarkis, J.; Cordeiro, J.J.; Lai, K.-H. Firm-level correlates of emergent green supply chain management practices in the Chinese context. Omega 2008, 36, 577–591. [Google Scholar] [CrossRef]
- Kannan, D.; de Sousa Jabbour, A.B.L.; Jabbour, C.J.C. Selecting green suppliers based on GSCM practices: Using fuzzy TOPSIS applied to a Brazilian electronics company. Eur. J. Oper. Res. 2014, 233, 432–447. [Google Scholar] [CrossRef]
- Rice, S. Commitment to excellence: Practical approaches to environmental leadership. Environ. Qual. Manag. 2003, 12, 9. [Google Scholar] [CrossRef]
- Daily, B.F.; Bishop, J.W. TQM workforce factors and employee involvement: The pivotal role of teamwork. J. Manag. Issues 2003, 15, 393–412. [Google Scholar]
- Pun, K.F.; Chin, K.S.; Gill, R. Determinants of employee involvement practices in manufacturing enterprises. Total Qual. Manag. 2001, 12, 95–109. [Google Scholar] [CrossRef]
- Daily, B.F.; Huang, S.-C. Achieving sustainability through attention to human resource factors in environmental management. Int. J. Oper. Prod. Manag. 2001, 21, 1539–1552. [Google Scholar] [CrossRef]
- Carter, C.R.; Carter, J.R. Interorganizational determinants of environmental purchasing: Initial evidence from the consumer products industries. Decis. Sci. 1998, 29, 659–684. [Google Scholar] [CrossRef]
- Lambert, D.M.; Cooper, M.C. Issues in supply chain management. Ind. Mark. Manag. 2000, 29, 65–83. [Google Scholar] [CrossRef]
- Min, H.; Galle, W.P. Green purchasing practices of US firms. Int. J. Oper. Prod. Manag. 2001, 21, 1222–1238. [Google Scholar] [CrossRef]
- Zsidisin, G.A.; Siferd, S.P. Environmental purchasing: A framework for theory development. Eur. J. Purch. Supply Manag. 2001, 7, 61–73. [Google Scholar] [CrossRef]
- Hamner, B. Effects of green purchasing strategies on supplier behaviour. In Greening the Supply Chain; Springer: Berlin/Heidelberg, Germany, 2006; pp. 25–37. [Google Scholar]
- Eltayeb, T.K.; Zailani, S.; Ramayah, T. Green supply chain initiatives among certified companies in Malaysia and environmental sustainability: Investigating the outcomes. Resour. Conserv. Recycl. 2011, 55, 495–506. [Google Scholar] [CrossRef]
- Sarkis, J.; Zhu, Q.; Lai, K. An organizational theoretic review of green supply chain management literature. Int. J. Prod. Econ. 2011, 130, 1–15. [Google Scholar] [CrossRef]
- Barney, J.B. Is the resource-based “view” a useful perspective for strategic management research? Yes. Acad. Manag. Rev. 2001, 26, 41–56. [Google Scholar]
- Russo, M.V.; Fouts, P.A. A resource-based perspective on corporate environmental performance and profitability. Acad. Manag. J. 1997, 40, 534–559. [Google Scholar]
- Hart, S.L. A natural-resource-based view of the firm. Acad. Manag. Rev. 1995, 20, 986–1014. [Google Scholar] [CrossRef] [Green Version]
- Christmann, P. Effects of “best practices” of environmental management on cost advantage: The role of complementary assets. Acad. Manag. J. 2000, 43, 663–680. [Google Scholar]
- Cao, Z.; Huo, B.; Li, Y.; Zhao, X. The impact of organizational culture on supply chain integration: A contingency and configuration approach. Supply Chain Manag. Int. J. 2015, 20, 24–41. [Google Scholar] [CrossRef]
- Gosling, J.; Jia, F.; Gong, Y.; Brown, S. The role of supply chain leadership in the learning of sustainable practice: Toward an integrated framework. J. Clean. Prod. 2016, 137, 1458–1469. [Google Scholar] [CrossRef] [Green Version]
- Teixeira, A.A.; Jabbour, C.J.C.; de Sousa Jabbour, A.B.L.; Latan, H.; De Oliveira, J.H.C. Green training and green supply chain management: Evidence from Brazilian firms. J. Clean. Prod. 2016, 116, 170–176. [Google Scholar] [CrossRef]
- Pereira-Moliner, J.; Claver-Cortés, E.; Molina-Azorín, J.F.; Tarí, J.J. Quality management, environmental management and firm performance: Direct and mediating effects in the hotel industry. J. Clean. Prod. 2012, 37, 82–92. [Google Scholar] [CrossRef]
- Llach, J.; Perramon, J.; del Mar Alonso-Almeida, M.; Bagur-Femenías, L. Joint impact of quality and environmental practices on firm performance in small service businesses: An empirical study of restaurants. J. Clean. Prod. 2013, 44, 96–104. [Google Scholar] [CrossRef]
- Zhu, Q.; Cordeiro, J.; Sarkis, J. Institutional pressures, dynamic capabilities and environmental management systems: Investigating the ISO 9000–Environmental management system implementation linkage. J. Environ. Manag. 2013, 114, 232–242. [Google Scholar] [CrossRef] [PubMed]
- De Giovanni, P.; Vinzi, V.E. Covariance versus component-based estimations of performance in green supply chain management. Int. J. Prod. Econ. 2012, 135, 907–916. [Google Scholar] [CrossRef]
- Green, K.W.; Zelbst, P.J.; Bhadauria, V.S.; Meacham, J. Do environmental collaboration and monitoring enhance organizational performance? Ind. Manag. Data Syst. 2012, 112, 186–205. [Google Scholar] [CrossRef]
- De Sousa Jabbour, A.B.L.; Jabbour, C.J.C.; Latan, H.; Teixeira, A.A.; de Oliveira, J.H.C. Quality management, environmental management maturity, green supply chain practices and green performance of Brazilian companies with ISO 14001 certification: Direct and indirect effects. Transp. Res. Part E Logist. Transp. Rev. 2014, 67, 39–51. [Google Scholar] [CrossRef]
- Green, K.W.; Zelbst, P.J.; Meacham, J.; Bhadauria, V.S. Green supply chain management practices: Impact on performance. Supply Chain Manag. Int. J. 2012, 17, 290–305. [Google Scholar] [CrossRef]
- Bag, S.; Anand, N. Modeling green supply chain management framework using ISM and MICMAC analysis. Afr. J. Bus. Manag. 2014, 8, 1053–1065. [Google Scholar]
- Dubey, R.; Bag, S.; Ali, S.S. Green supply chain practices and its impact on organisational performance: An insight from Indian rubber industry. Int. J. Logist. Syst. Manag. 2014, 19, 20–42. [Google Scholar] [CrossRef]
- Dubey, R.; Gunasekaran, A.; Ali, S.S. Exploring the relationship between leadership, operational practices, institutional pressures and environmental performance: A framework for green supply chain. Int. J. Prod. Econ. 2015, 160, 120–132. [Google Scholar] [CrossRef]
- Dubey, R.; Gunasekaran, A.; Papadopoulos, T.; Childe, S.J. Green supply chain management enablers: Mixed methods research. Sustain. Prod. Consum. 2015, 4, 72–88. [Google Scholar] [CrossRef] [Green Version]
- Rao, P.; Holt, D. Do green supply chains lead to competitiveness and economic performance? Int. J. Oper. Prod. Manag. 2005, 25, 898–916. [Google Scholar] [CrossRef]
- Arimura, T.H.; Darnall, N.; Katayama, H. Is ISO 14001 a gateway to more advanced voluntary action? The case of green supply chain management. J. Environ. Econ. Manag. 2011, 61, 170–182. [Google Scholar] [CrossRef]
- Darnall, N.; Jolley, G.J.; Handfield, R. Environmental management systems and green supply chain management: Complements for sustainability? Bus. Strategy Environ. 2008, 17, 30–45. [Google Scholar] [CrossRef]
- Nawrocka, D. Inter-organizational use of EMSs in supply chain management: Some experiences from Poland and Sweden. Corp. Soc. Responsib. Environ. Manag. 2008, 15, 260–269. [Google Scholar] [CrossRef]
- Nawrocka, D.; Brorson, T.; Lindhqvist, T. ISO 14001 in environmental supply chain practices. J. Clean. Prod. 2009, 17, 1435–1443. [Google Scholar] [CrossRef]
- Ochieng, O.S.; Awino, Z.B.; Njihia, M.J.; Iraki, W.N. Green supply chain management practices and performance of ISO 14001 certified manufacturing firms in East Africa. DBA Afr. Manag. Rev. 2016, 6, 103–128. [Google Scholar]
- Brockhaus, S.; Kersten, W.; Knemeyer, A.M. Where do we go from here? Progressing sustainability implementation efforts across supply chains. J. Bus. Logist. 2013, 34, 167–182. [Google Scholar] [CrossRef]
- Mota, B.; Gomes, M.I.; Carvalho, A.; Barbosa-Povoa, A.P. Towards supply chain sustainability: Economic, environmental and social design and planning. J. Clean. Prod. 2015, 105, 14–27. [Google Scholar] [CrossRef]
- Thun, J.; Müller, A. An empirical analysis of green supply chain management in the German automotive industry. Bus. Strategy Environ. 2010, 19, 119–132. [Google Scholar] [CrossRef]
- Laari, S.; Töyli, J.; Solakivi, T.; Ojala, L. Firm performance and customer-driven green supply chain management. J. Clean. Prod. 2016, 112, 1960–1970. [Google Scholar] [CrossRef]
- Lee, S.; Klassen, R.D. Drivers and enablers that foster environmental management capabilities in small-and medium-sized suppliers in supply chains. Prod. Oper. Manag. 2008, 17, 573–586. [Google Scholar] [CrossRef]
- Baines, T.; Brown, S.; Benedettini, O.; Ball, P. Examining green production and its role within the competitive strategy of manufacturers. J. Ind. Eng. Manag. 2012, 5, 53–87. [Google Scholar] [CrossRef] [Green Version]
- Jayaram, J.; Avittathur, B. Green supply chains: A perspective from an emerging economy. Int. J. Prod. Econ. 2015, 164, 234–244. [Google Scholar] [CrossRef]
- Aragón-Correa, J.A.; Martín-Tapia, I.; Hurtado-Torres, N.E. Proactive environmental strategies and employee inclusion: The positive effects of information sharing and promoting collaboration and the influence of uncertainty. Organ. Environ. 2013, 26, 139–161. [Google Scholar] [CrossRef]
- Cantor, D.E.; Morrow, P.C.; Montabon, F. Engagement in environmental behaviors among supply chain management employees: An organizational support theoretical perspective. J. Supply Chain Manag. 2012, 48, 33–51. [Google Scholar] [CrossRef]
- Jabbour, C.J.C.; de Sousa Jabbour, A.B.L. Green human resource management and green supply chain management: Linking two emerging agendas. J. Clean. Prod. 2016, 112, 1824–1833. [Google Scholar] [CrossRef] [Green Version]
- Muduli, K.; Govindan, K.; Barve, A.; Kannan, D.; Geng, Y. Role of behavioural factors in green supply chain management implementation in Indian mining industries. Resour. Conserv. Recycl. 2013, 76, 50–60. [Google Scholar] [CrossRef]
- Daily, B.F.; Bishop, J.W.; Massoud, J.A. The role of training and empowerment in environmental performance. Int. J. Oper. Prod. Manag. 2012, 32, 631–647. [Google Scholar] [CrossRef]
- Jabbour, C.J.C.; Santos, F.C.A. Relationships between human resource dimensions and environmental management in companies: Proposal of a model. J. Clean. Prod. 2008, 16, 51–58. [Google Scholar] [CrossRef]
- Gupta, S.; Kumar, V. Sustainability as corporate culture of a brand for superior performance. J. World Bus. 2013, 48, 311–320. [Google Scholar] [CrossRef] [Green Version]
- Jabbour, C.J.C.; Santos, F.C.A.; Fonseca, S.A.; Nagano, M.S. Green teams: Understanding their roles in the environmental management of companies located in Brazil. J. Clean. Prod. 2013, 46, 58–66. [Google Scholar] [CrossRef]
- Jabbour, A.B.L.S.; Jabbour, C.J.C. Are supplier selection criteria going green? Case studies of companies in Brazil. Ind. Manag. Data Syst. 2009, 109, 477–495. [Google Scholar] [CrossRef]
- Lee, A.H.I.; Kang, H.-Y.; Hsu, C.-F.; Hung, H.-C. A green supplier selection model for high-tech industry. Expert Syst. Appl. 2009, 36, 7917–7927. [Google Scholar] [CrossRef]
- Büyüközkan, G.; Çifçi, G. A novel hybrid MCDM approach based on fuzzy DEMATEL, fuzzy ANP and fuzzy TOPSIS to evaluate green suppliers. Expert Syst. Appl. 2012, 39, 3000–3011. [Google Scholar] [CrossRef]
- Tseng, M.-L.; Chiu, A.S.F. Evaluating firm’s green supply chain management in linguistic preferences. J. Clean. Prod. 2013, 40, 22–31. [Google Scholar] [CrossRef]
- Awasthi, A.; Kannan, G. Green supplier development program selection using NGT and VIKOR under fuzzy environment. Comput. Ind. Eng. 2016, 91, 100–108. [Google Scholar] [CrossRef]
- Fallahpour, A.; Olugu, E.U.; Musa, S.N.; Khezrimotlagh, D.; Wong, K.Y. An integrated model for green supplier selection under fuzzy environment: Application of data envelopment analysis and genetic programming approach. Neural Comput. Appl. 2016, 27, 707–725. [Google Scholar] [CrossRef]
- Bakeshlou, E.A.; Khamseh, A.A.; Asl, M.A.G.; Sadeghi, J.; Abbaszadeh, M. Evaluating a green supplier selection problem using a hybrid MODM algorithm. J. Intell. Manuf. 2017, 28, 913–927. [Google Scholar] [CrossRef]
- Qin, J.; Liu, X.; Pedrycz, W. An extended TODIM multi-criteria group decision making method for green supplier selection in interval type-2 fuzzy environment. Eur. J. Oper. Res. 2017, 258, 626–638. [Google Scholar] [CrossRef]
- Yazdani, M.; Chatterjee, P.; Zavadskas, E.K.; Zolfani, S.H. Integrated QFD-MCDM framework for green supplier selection. J. Clean. Prod. 2017, 142, 3728–3740. [Google Scholar] [CrossRef]
- Banaeian, N.; Mobli, H.; Fahimnia, B.; Nielsen, I.E.; Omid, M. Green supplier selection using fuzzy group decision making methods: A case study from the agri-food industry. Comput. Oper. Res. 2018, 89, 337–347. [Google Scholar] [CrossRef]
- Lin, R.-J.; Tan, K.-H.; Geng, Y. Market demand, green product innovation, and firm performance: Evidence from Vietnam motorcycle industry. J. Clean. Prod. 2013, 40, 101–107. [Google Scholar] [CrossRef]
- Wong, C.W.Y.; Lai, K.; Shang, K.; Lu, C. Uncovering the value of green advertising for environmental management practices. Bus. Strategy Environ. 2014, 23, 117–130. [Google Scholar] [CrossRef]
- Chan, H.K.; Yee, R.W.Y.; Dai, J.; Lim, M.K. The moderating effect of environmental dynamism on green product innovation and performance. Int. J. Prod. Econ. 2016, 181, 384–391. [Google Scholar] [CrossRef]
- Pires, A.; Martinho, G.; Ribeiro, R.; Mota, M.; Teixeira, L. Extended producer responsibility: A differential fee model for promoting sustainable packaging. J. Clean. Prod. 2015, 108, 343–353. [Google Scholar] [CrossRef]
- Abdullah, N.A.H.N.; Yaakub, S. Reverse logistics: Pressure for adoption and the impact on firm’s performance. Int. J. Bus. Soc. 2014, 15, 151. [Google Scholar]
- Huang, X.; Tan, B.L.; Ding, X. An exploratory survey of green supply chain management in Chinese manufacturing small and medium-sized enterprises. J. Manuf. Technol. Manag. 2015, 26, 80–103. [Google Scholar] [CrossRef]
- Rezaei, J. A systematic review of multi-criteria decision-making applications in reverse logistics. Transp. Res. Procedia 2015, 10, 766–776. [Google Scholar] [CrossRef] [Green Version]
- Vieira, B.O.; Guarnieri, P.; Nofal, R.; Nofal, B. Multi-Criteria Methods Applied in the Studies of Barriers Identified in the Implementation of Reverse Logistics of E-Waste: A Research Agenda. Logistics 2020, 4, 11. [Google Scholar] [CrossRef]
- Kechagias, E.P.; Gayialis, S.P.; Konstantakopoulos, G.D.; Papadopoulos, G.A. An application of a multi-criteria approach for the development of a process reference model for supply chain operations. Sustainability 2020, 12, 5791. [Google Scholar] [CrossRef]
- Büyüközkan, G.; Çifçi, G. Evaluation of the green supply chain management practices: A fuzzy ANP approach. Prod. Plan. Control 2012, 23, 405–418. [Google Scholar] [CrossRef]
- Wang, X.; Chan, H.K. A hierarchical fuzzy TOPSIS approach to assess improvement areas when implementing green supply chain initiatives. Int. J. Prod. Res. 2013, 51, 3117–3130. [Google Scholar] [CrossRef]
- Rehman, M.A.A.; Shrivastava, R.L. An innovative approach to evaluate green supply chain management (GSCM) drivers by using interpretive structural modeling (ISM). Int. J. Innov. Technol. Manag. 2011, 8, 315–336. [Google Scholar] [CrossRef]
- Mathiyazhagan, K.; Govindan, K.; NoorulHaq, A.; Geng, Y. An ISM approach for the barrier analysis in implementing green supply chain management. J. Clean. Prod. 2013, 47, 283–297. [Google Scholar] [CrossRef]
- Jayant, A.; Azhar, M. Analysis of the barriers for implementing green supply chain management (GSCM) practices: An interpretive structural modeling (ISM) approach. Procedia Eng. 2014, 97, 2157–2166. [Google Scholar] [CrossRef] [Green Version]
- Dev, N.K.; Shankar, R. Green supply chain: An ISM-based roadmap to boundaries of environmental sustainability. In Systems Thinking Approach for Social Problems; Springer: Berlin/Heidelberg, Germany, 2015; pp. 1–12. [Google Scholar]
- Görener, A. Comparing AHP and ANP: An application of strategic decisions making in a manufacturing company. Int. J. Bus. Soc. Sci. 2012, 3, 194–208. [Google Scholar]
- Saaty, T.L. The modern science of multicriteria decision making and its practical applications: The AHP/ANP approach. Oper. Res. 2013, 61, 1101–1118. [Google Scholar] [CrossRef]
- Ayağ, Z.; Özdemir, R.G. An intelligent approach to ERP software selection through fuzzy ANP. Int. J. Prod. Res. 2007, 45, 2169–2194. [Google Scholar] [CrossRef]
- Carlucci, D. Evaluating and selecting key performance indicators: An ANP-based model. Meas. Bus. Excel. 2010, 14, 66–76. [Google Scholar] [CrossRef]
- Alidrisi, H.; Mohamed, S. Resource allocation for strategic quality management: A goal programming approach. Int. J. Qual. Reliab. Manag. 2012, 29, 265–283. [Google Scholar] [CrossRef] [Green Version]
- Palczewski, K.; Sałabun, W. The fuzzy TOPSIS applications in the last decade. Procedia Comput. Sci. 2019, 159, 2294–2303. [Google Scholar] [CrossRef]
- Önüt, S.; Kara, S.S.; Işik, E. Long term supplier selection using a combined fuzzy MCDM approach: A case study for a telecommunication company. Expert Syst. Appl. 2009, 36, 3887–3895. [Google Scholar] [CrossRef]
- Li, J.; Fang, H.; Song, W. Sustainable supplier selection based on SSCM practices: A rough cloud TOPSIS approach. J. Clean. Prod. 2019, 222, 606–621. [Google Scholar] [CrossRef]
- Alidrisi, H. Development of a study plan for industrial engineering program using Interpretive Structural Modeling technique. Int. J. Eng. Educ. 2015, 31, 1410–1418. [Google Scholar]
- Partani, T.; Marashi, S.V.; Alishahi, M.H. Using fuzzy analytic network process (FANP) in a swot analysis. Glob. J. Comput. Sci. Technol. 2013, 13, 17–32. [Google Scholar]
- Bhattacharya, A.; Mohapatra, P.; Kumar, V.; Dey, P.K.; Brady, M.; Tiwari, M.K.; Nudurupati, S.S. Green supply chain performance measurement using fuzzy ANP-based balanced scorecard: A collaborative decision-making approach. Prod. Plan. Control 2014, 25, 698–714. [Google Scholar] [CrossRef] [Green Version]
- Ayağ, Z.; Özdemir, R.G. An intelligent approach to machine tool selection through fuzzy analytic network process. J. Intell. Manuf. 2011, 22, 163–177. [Google Scholar] [CrossRef] [Green Version]
- Yang, J.L.; Tzeng, G.-H. An integrated MCDM technique combined with DEMATEL for a novel cluster-weighted with ANP method. Expert Syst. Appl. 2011, 38, 1417–1424. [Google Scholar] [CrossRef]
- Yazgan, H.R. Selection of dispatching rules with fuzzy ANP approach. Int. J. Adv. Manuf. Technol. 2011, 52, 651–667. [Google Scholar] [CrossRef]
- Saaty, T.L. Exploring the interface between hierarchies, multiple objectives and fuzzy sets. Fuzzy Sets Syst. 1978, 1, 57–68. [Google Scholar] [CrossRef]
- Van Laarhoven, P.J.M.; Pedrycz, W. A fuzzy extension of Saaty’s priority theory. Fuzzy Sets Syst. 1983, 11, 229–241. [Google Scholar] [CrossRef]
- Chang, D.-Y. Extent analysis and synthetic decision. Optim. Tech. Appl. 1992, 1, 352–355. [Google Scholar]
- Chang, D.-Y. Applications of the extent analysis method on fuzzy AHP. Eur. J. Oper. Res. 1996, 95, 649–655. [Google Scholar] [CrossRef]
- Buckley, J.J. Fuzzy hierarchical analysis. Fuzzy Sets Syst. 1985, 17, 233–247. [Google Scholar] [CrossRef]
- Hsieh, T.-Y.; Lu, S.-T.; Tzeng, G.-H. Fuzzy MCDM approach for planning and design tenders selection in public office buildings. Int. J. Proj. Manag. 2004, 22, 573–584. [Google Scholar] [CrossRef]
- Gu, X.; Zhu, Q. Fuzzy multi-attribute decision-making method based on eigenvector of fuzzy attribute evaluation space. Decis. Support Syst. 2006, 41, 400–410. [Google Scholar] [CrossRef]
- Wang, L.; Chu, J.; Wu, J. Selection of optimum maintenance strategies based on a fuzzy analytic hierarchy process. Int. J. Prod. Econ. 2007, 107, 151–163. [Google Scholar] [CrossRef]
- Zeng, J.; An, M.; Smith, N.J. Application of a fuzzy based decision making methodology to construction project risk assessment. Int. J. Proj. Manag. 2007, 25, 589–600. [Google Scholar] [CrossRef]
- Erensal, Y.C.; Öncan, T.; Demircan, M.L. Determining key capabilities in technology management using fuzzy analytic hierarchy process: A case study of Turkey. Inf. Sci. 2006, 176, 2755–2770. [Google Scholar] [CrossRef]
- Heo, E.; Kim, J.; Boo, K.-J. Analysis of the assessment factors for renewable energy dissemination program evaluation using fuzzy AHP. Renew. Sustain. Energy Rev. 2010, 14, 2214–2220. [Google Scholar] [CrossRef]
- Chan, F.T.S.; Kumar, N.; Tiwari, M.K.; Lau, H.C.W.; Choy, K. Global supplier selection: A fuzzy-AHP approach. Int. J. Prod. Res. 2008, 46, 3825–3857. [Google Scholar] [CrossRef]
- Chen, C.-T. Extensions of the TOPSIS for group decision-making under fuzzy environment. Fuzzy Sets Syst. 2000, 114, 1–9. [Google Scholar] [CrossRef]
- Junior, F.R.L.; Osiro, L.; Carpinetti, L.C.R. A comparison between Fuzzy AHP and Fuzzy TOPSIS methods to supplier selection. Appl. Soft Comput. 2014, 21, 194–209. [Google Scholar] [CrossRef]
- Harary, F.; Norman, R.Z.; Cartwright, D. Structural Models: An Introduction to the Theory of Directed Graphs; Wiley: Hoboken, NJ, USA, 1965. [Google Scholar]
- Waller, R.J. Contextual relations and mathematical relations in interpretive structural modeling. IEEE Trans. Syst. Man Cybern. 1980, 10, 143–145. [Google Scholar]
- Ohuchi, A.; Kurihara, M.; Kaji, I. Implication theory and algorithm for reachability matrix model. IEEE Trans. Syst. Man. Cybern. 1986, 16, 610–616. [Google Scholar] [CrossRef]
- Warfield, J.N. An Assault on Complexity; Battelle, Office of Corporate Communications: Columbus, OH, USA, 1973. [Google Scholar]
- Kanungo, S.; Bhatnagar, V. Beyond generic models for information system quality: The use of interpretive structural modeling (ISM). Syst. Res. Behav. Sci. 2002, 19, 531–549. [Google Scholar] [CrossRef]
- Mandal, A.; Deshmukh, S. Vendor Selection Using Interpretive Structural Modelling (ISM). Int. J. Oper. Prod. Manag. 1994, 14, 52–59. [Google Scholar] [CrossRef]
- Jharkharia, S.; Shankar, R. IT enablement of supply chains: Modeling the enablers. Int. J. Prod. Perform. Manag. 2004, 53, 700–712. [Google Scholar] [CrossRef]
- Thakkar, J.; Deshmukh, S.G.; Gupta, A.D.; Shankar, R. Development of a balanced scorecard: An integrated approach of Interpretive Structural Modeling (ISM) and Analytic Network Process (ANP). Int. J. Product. Perform. Manag. 2006, 56, 25–59. [Google Scholar] [CrossRef]
- Singh, M.D.; Kant, R. Knowledge management barriers: An interpretive structural modeling approach. Int. J. Manag. Sci. Eng. Manag. 2008, 3, 141–150. [Google Scholar] [CrossRef]
- Kannan, G.; Haq, A.N.; Sasikumar, P.; Arunachalam, S. Analysis and selection of green suppliers using interpretative structural modelling and analytic hierarchy process. Int. J. Manag. Decis. Mak. 2008, 9, 163–182. [Google Scholar] [CrossRef]
- Yin, R.K. Case Study Research and Applications: Design and Methods, 6th ed.; SAGE Publications: Thousand Oaks, CA, USA, 2017. [Google Scholar]
- Darko, A.; Chan, A.P.C.; Ameyaw, E.E.; Owusu, E.K.; Pärn, E.; Edwards, D.J. Review of application of analytic hierarchy process (AHP) in construction. Int. J. Constr. Manag. 2019, 19, 436–452. [Google Scholar] [CrossRef]
- Bertoni, M. Multi-Criteria Decision Making for Sustainability and Value Assessment in Early PSS Design. Sustainability 2019, 11, 1952. [Google Scholar] [CrossRef] [Green Version]
- Chunhua, F.; Shi, H.; Guozhen, B. A group decision making method for sustainable design using intuitionistic fuzzy preference relations in the conceptual design stage. J. Clean. Prod. 2020, 243, 118640. [Google Scholar] [CrossRef]
- De Almeida Santos, D.; Luiz Gonçalves Quelhas, O.; Francisco Simões Gomes, C.; Perez Zotes, L.; Luiz Braga França, S.; de Souza, G.V.P.; de Araújo, R.A.; da Silva Carvalho Santos, S. Proposal for a Maturity Model in Sustainability in the Supply Chain. Sustainability 2020, 12, 9655. [Google Scholar] [CrossRef]
- Kravchenko, M.; Pigosso, D.C.A.; McAloone, T.C. A Trade-Off Navigation Framework as a Decision Support for Conflicting Sustainability Indicators within Circular Economy Implementation in the Manufacturing Industry. Sustainability 2021, 13, 314. [Google Scholar] [CrossRef]
Figure 1.
The perception of the proposed hybrid self-assessment model.

Figure 2.
All possible cases of

Figure 3.
Conceptual fuzzy analytic network process model for supply chain finance and the 5 Vs of big data.
Figure 3.
Conceptual fuzzy analytic network process model for supply chain finance and the 5 Vs of big data.

Figure 4.
Fuzzy TOPSIS linguistic scale.

Figure 5.
Location of green supply chain management (GSCM) practices in four zones.

Figure 6.
Identification of GSCM practice levels through four sophisticated iterations of interpretive structural modeling (ISM).
Figure 6.
Identification of GSCM practice levels through four sophisticated iterations of interpretive structural modeling (ISM).

Figure 7.
Final diagraph of ISM.

Figure 8.
Integration of Relative Readiness Index scores and categorized GSCM practices.

Figure 9.
Proposed strategic matrix tool.


Table 1.
List of acronyms and their descriptions.
| Acronym | Descriptions | |
|---|---|---|
| AHP | Analytic Hierarchy Process | |
| AI | Artificial Intelligence | |
| ANP | Analytic Network Process | |
| BPM | Business Process Modeling | |
| BRI | Basic Readiness Index | |
| CUST | Customer Relationship Management | |
| DM | Decision Making | |
| ELECTRE | Elimination Et Choice Translating Reality | |
| EMM | Environmental Management Maturity | |
| ENVI | Environmental Management | |
| GD | Green Distribution | |
| GHRM | Green Human Resource Management | |
| GM | Green Manufacturing | |
| GP | Green Purchasing | |
| GSCM | Green Supply Chain Management | |
| HRM | Human resource management | |
| IoT | Internet of Things | |
| ISM | Interpretive Structural Modeling | |
| ISO 14001 | The International Standard that Specifies Requirements for an Effective Environmental Management System | |
| MCDM | Multicriteria Decision-Making | |
| MM | Materials Management | |
| OM | Operations Management | |
| ORGM | Organizational Interaction Maturity | |
| PROMETHEE | Preference Ranking Organization Method for Enrichment Evaluations | |
| QUAL | Quality Management | |
| RQ | Research Question | |
| RRI | Relative Readiness Index | |
| SCF | Supply Chain Finance | |
| SCM | Supply Chain Management | |
| SMT | Strategic Matrix Tool | |
| SP&D | Smart Process and Design | |
| SUPP | Supplier Selection | |
| TOPM | Top Management Commitment | |
| TOPSIS | Technique For Order Preference By Similarity To Ideal Solution | |
| VRP | Vehicle Routing Problem | |
| 5Vs | Five Vs of big data (value, volume, velocity, variety, and veracity) | |
Table 2.
Summarization of the supporting literature.
| Research Gap/Aspect | Supporting Literature |
|---|---|
| Top Management Commitment (TOPM) | [37,39,40,41,42,43,44,45,46,47,48] |
| Organizational Interaction Maturity (ORGM) | [37,49,50,51,52,53,54,55,56] |
| Quality Management (QUAL) | [57,58,59,60,61,62,63,64,65,66,67] |
| Environmental Management (ENVI) | [68,69,70,71,72,73] |
| Customer Relationship Management (CUST) | [61,63,65,67,74,75,76,77,78,79,80] |
| Green Human Resource Management (GHRM) | [56,81,82,83,84,85,86,87,88] |
| Supplier Selection (SUPP) | [8,38,45,48,89,90,91,92,93,94,95,96,97,98] |
| Smart Process and Design (SP&D) | [38,99,100,101,102,103,104] |
| MCDM Applications in GSCM | [38,91,105,106,107,108,109,110,111,112,113] |
| Justifications for the Selected Methods | [106,114,115,116,117,118,119,120,121,122] |
Table 3.
Fuzzy analytic network process (ANP) linguistic scale.
| Outer-Dependence | Inner-Dependence | Fuzzy Triangular Number | The Inverse of the Fuzzy Triangular Number | ||||
|---|---|---|---|---|---|---|---|
| Linguistic Expressions for Comparisons among 5Vs of Bigdata with Respect to “SCF” | Linguistic Expressions for Comparisons Among 5Vs of Bigdata | ||||||
| Similar | (1, | 1, | 1) | (1, | 1, | 1) | |
| Moderately Important | (1, | 3, | 5) | (1/5, | 1/3, | 1) | |
| Important | (3, | 5, | 7) | (1/7, | 1/5, | 1/3) | |
| Very Important | (5, | 7, | 9) | (1/9, | 1/7, | 1/5) | |
| Extremely Important | (7, | 9, | 11) | (1/11, | 1/9, | 1/7) | |
Table 4.
Fuzzy analytic network process results.
| Inner-Dependence | Outer-Dependence | Overall | |||||
|---|---|---|---|---|---|---|---|
| Veracity | Value | Velocity | Variety | Volume | SCF | ||
| Veracity | __ | 0.31 | 0.10 | 0.53 | 0.10 | 0.44 | 0.30 |
| Value | 0.31 | __ | 0.10 | 0.02 | 0.10 | 0.44 | 0.29 |
| Velocity | 0.06 | 0.06 | __ | 0.43 | 0.40 | 0.03 | 0.07 |
| Variety | 0.31 | 0.31 | 0.40 | __ | 0.40 | 0.04 | 0.17 |
| Volume | 0.31 | 0.31 | 0.40 | 0.02 | __ | 0.05 | 0.17 |
Table 5.
Fuzzy technique for order preference by similarity to ideal solution results.
| GSCM Practices | d+ | d− | Fuzzy TOPSIS Score (CCi) | Rank |
|---|---|---|---|---|
| CUST | 4.534 | 0.507 | 0.101 | 4 |
| SUPP | 4.507 | 0.526 | 0.104 | 3 |
| ENVI | 4.626 | 0.406 | 0.081 | 6 |
| QUAL | 4.385 | 0.659 | 0.131 | 2 |
| TOPM | 4.695 | 0.366 | 0.072 | 7 |
| GHRM | 4.728 | 0.323 | 0.064 | 8 |
| SP&D | 4.307 | 0.730 | 0.145 | 1 |
| ORGM | 4.540 | 0.495 | 0.098 | 5 |
Table 6.
Proposed green supply chain management practice indices: basic readiness and relative readiness.
Table 6.
Proposed green supply chain management practice indices: basic readiness and relative readiness.
| Ranking | GSCM Practices | TOPSIS Score | Basic Readiness Index (BRI) | Relative Readiness Index (RRI) |
|---|---|---|---|---|
| 1 | SP&D | 0.145 | 18.2% | 100% |
| 2 | QUAL | 0.131 | 16.4% | 90.1% |
| 3 | SUPP | 0.104 | 13.1% | 72.0% |
| 4 | CUST | 0.101 | 12.6% | 69.4% |
| 5 | ORGM | 0.098 | 12.3% | 67.8% |
| 6 | ENVI | 0.081 | 10.1% | 55.6% |
| 7 | TOPM | 0.072 | 9.1% | 49.8% |
| 8 | GHRM | 0.064 | 8.0% | 44.1% |
| SUM = 0.796 |
Table 7.
Computed driving power and dependence power for each green supply chain management practice.
Table 7.
Computed driving power and dependence power for each green supply chain management practice.
| CUST | SUP | ENV | QUAL | TOPMC | GHRM | SP&D | ORGM | Driving Power | ||
|---|---|---|---|---|---|---|---|---|---|---|
| CUST | 1 | 1 | 1 | 1 | 0 | 0 | 1 | 0 | 5 | |
| SUP | 1 | 1 | 1 | 1 | 0 | 0 | 1 | 0 | 5 | |
| ENV | 1 | 1 | 1 | 1 | 0 | 0 | 1 | 0 | 5 | |
| QUAL | 1 | 1 | 1 | 1 | 0 | 0 | 1 | 0 | 5 | |
| TOPMC | 1 | 1 | 1 | 1 | 1 | 1 | 1 | 1 | 8 | |
| GHRM | 1 | 1 | 1 | 1 | 0 | 1 | 1 | 1 | 7 | |
| SP&D | 0 | 1 | 1 | 1 | 0 | 0 | 1 | 0 | 4 | |
| ORGM | 1 | 1 | 1 | 1 | 0 | 1 | 1 | 1 | 7 | |
| Dependence Power | 7 | 8 | 8 | 8 | 1 | 3 | 8 | 3 |
Publisher’s Note: MDPI stays neutral with regard to jurisdictional claims in published maps and institutional affiliations. |
© 2021 by the author. Licensee MDPI, Basel, Switzerland. This article is an open access article distributed under the terms and conditions of the Creative Commons Attribution (CC BY) license (https://creativecommons.org/licenses/by/4.0/).
Share and Cite
MDPI and ACS Style
Alidrisi, H. Measuring the Environmental Maturity of the Supply Chain Finance: A Big Data-Based Multi-Criteria Perspective. Logistics 2021, 5, 22. https://0-doi-org.brum.beds.ac.uk/10.3390/logistics5020022
AMA Style
Alidrisi H. Measuring the Environmental Maturity of the Supply Chain Finance: A Big Data-Based Multi-Criteria Perspective. Logistics. 2021; 5(2):22. https://0-doi-org.brum.beds.ac.uk/10.3390/logistics5020022
Chicago/Turabian StyleAlidrisi, Hisham. 2021. "Measuring the Environmental Maturity of the Supply Chain Finance: A Big Data-Based Multi-Criteria Perspective" Logistics 5, no. 2: 22. https://0-doi-org.brum.beds.ac.uk/10.3390/logistics5020022